
Moving People - Bus Industry Confederation
133
Moving People Australian Bus and Coach Industry: a snapshot BUS INDUSTRY CONFEDERATION PO Box 6171, KINGSTON ACT 2604 Tel: +61 2 6247 5990 Fax: +61 2 6273 1035 Email: [email protected] Web: www.movingpeople.com.au
-
Upload
khangminh22 -
Category
Documents
-
view
2 -
download
0
Transcript of Moving People - Bus Industry Confederation

Moving People
MOVING PEOPLE
> A
ustralian Bus and C
oach Industry: a snapshot
ISBN: 978-0-6485585-1-4
Copyright 2021 Bus Industry Confederation Inc.
First Published September 2021.
This work is copyright. Apart from any use as permitted under the Copyright Act 1968, no part may be reproduced by any process without prior written permission from the Bus Industry Confederation. Requests and enquiries concerning reproduction and rights should be addressed to the BIC National Secretariat, PO Box 6171, KINGSTON ACT 2604.
Email: [email protected].
Australian Bus and Coach Industry: a snapshot
BUS INDUSTRY CONFEDERATIONPO Box 6171, KINGSTON ACT 2604
Tel: +61 2 6247 5990Fax: +61 2 6273 1035
Email: [email protected]: www.movingpeople.com.au

11Moving People > Australian Bus and Coach Industry: a snapshot
MOVING PEOPLE Australian Bus and Coach Industry:
a snapshot
BUSW
A

22 Moving People > Australian Bus and Coach Industry: a snapshot
ForewordIn June 2018, the Bus Industry Confederation (BIC) commissioned the Institute of Transport and Logistics Studies to research, collate and report on various data and statistics relating to the bus and coach industry in Australia. The research component of this report was completed in June 2019 with the BIC taking it further to include analysis of data from the latest motor vehicle survey (2018) and census (2019) conducted by the Australian Bureau of Statistics and industry surveys (2020) undertaken by the BIC.
The information included in this report is based on data and information sources available during the period 2016 to 2020. Where there is information and data gaps in some sections of this report, the conclusions are reliably based on anecdotal advice and industry assumptions. The BIC believes the information provided in this report not only provides an accurate picture of the Australian bus and coach industry in 2020 but also serves as a guide as to where future information and data collection improvements are required.

33Moving People > Australian Bus and Coach Industry: a snapshot
AcknowledgementsThe Bus Industry Confederation wishes to acknowledge the below individuals for their valued contribution in the research, data analysis, writing and editing of this industry report.
Bus Industry Confederation
> Michael Apps, Executive Director
> Madonna Woodhead, National Operations & Marketing Manager
> Luke Hardy, National Technical Manager
Institute of Transport and Logistics Studies, The Business School, The University of Sydney
> Professor David A Hensher, Founding Director ITLS
> Dr Yale Z Wong, Honorary Associate

44 Moving People > Australian Bus and Coach Industry: a snapshot
M
OVING PEOPLE
THEPEOPLE

Executive Overview of the bus and coach industryThis report provides a 2020 update to its predecessor Fact Sheet: Passenger Transport Activity in Australia, last released in 2003 and prior to that in 1999. This report compiles the latest statistics on the bus and coach industry in Australia including its contribution to:
• the passenger transport task
• the changing fleet profile
• government expenditure in each state and territory
• current and emerging industry issues
• the social and environmental contribution to the Australian economy.
The task of the bus and coach industryBuses and coaches represent the most important mode of public transport. Every day, far more Australians are transported by bus and coach on the nation’s road network than are moved by rail, even in our largest capital cities. Buses provide an alternative travel choice to the car for people’s daily commute and other travel purposes which in turn addresses the challenges of congestion and its economic impacts in our urban and regional centres. Buses also provide a vital lifeline for individuals and communities, promoting social inclusion and access to education, healthcare, employment and social opportunities.
Based on various industry surveys undertaken by the Bus Industry Confederation (BIC) in 2018 and 2020, the bus and coach industry in Australia directly employs more than 85,000 people in a range of jobs including drivers, mechanics, engineers, skilled production workers and transport professionals in various specialised fields such as planning and service delivery.
The bus and coach industry is predominantly based around the provision of school bus and public transport (route) services that are provided under state and territory government contractual arrangements. These contracted services are primarily provided by privately owned bus and coach businesses, with a small percentage of bus fleets being government owned and operated. The industry also provides contracted government services such as special school transport for children with disabilities and coach services to support the rail network. The bus industry is also becoming involved in other emerging markets such as aged care, health and para-transit.
The bus and coach industry also provide services, in what might be termed, the ‘deregulated’ market providing charter, tourism, long distance, mining, correctional services, airline and airport services and specialised services that support other industries. The last few years has seen a period of transition and disruption of traditional transport service provision generally, such as Uber. The bus and coach industry has not been isolated from this disruption and has been active in exploring new areas of transport service connectivity and delivery with a range of vehicle types, modes and providers.
This report touches upon these service delivery issues as does the BIC’s policy paper series of publications (listed in Appendix 1).
The broader transport policy issues related to the bus and coach industry are reviewed in this report, highlighting the changing and increasing role of the federal government in cities – their functionality and sustainability, regional development and connectivity, the importance of transport and how we move people as a nation. There can be no doubt as to the increasing and important role for the federal government in public transport with bus service provision forming a critical part of the solutions to the challenges for growing Australian cities, regional centres and remote areas. The BIC has produced a comprehensive series of policy discussion papers (listed in Appendix 1) which provide a more detailed investigation into these issues and the role of the bus and coach industry in working with all levels of government to deliver positive transport and mobility outcomes for Australia.
The Australian bus and coach manufacturing and supply sectorThe manufacturing, supplies and services sector of the bus and coach industry is an important contributor to the Australian economy. It is also an important contributor to a heavy vehicle automotive manufacturing labour skill set that goes beyond just building buses and coaches. It continues to meet the many challenges of a global vehicle market place that remains competitive in the Australian market, including some small export opportunities.
The BIC estimates that in the manufacturing of the completed bus, $5 billion is contributed to the Australian economy each year and close to $1.5 billion in supplies and services to keep the bus operational and delivering services. The 2019 and 2020 industry reported deliveries of buses and coaches were 1,449 and 1,226 respectively. The economic impact of Covid-19 on the manufacturing sector was most evident in the delivery of long distance coaches seeing a down-turn of 74% from 2019. Route bus deliveries were also down by 20% whilst Charter and School bus deliveries remained consistent throughout 2020. The BIC estimates that the manufacturing sector employs more than 10,000 people in Australia including a strong network of Australian and global component manufacturers (eg. public transport seats) and suppliers that support the build of a bus (eg. air conditioning units) most of whom have setup businesses in Australia.
Over the past 15 years greater competition has appeared in the Australian bus and coach market place with fully built vehicles mainly from Asia, Europe and South America being imported. In 2020, 88.9% of public transport passenger route service buses and 59.6% of school buses are manufactured in Australia, the majority built by Australian body manufacturers on a European or Asian chassis; the remainder being fully imported buses and coaches primarily from Asia, with some from Europe and South America.
The Australian bus and coach manufacturing market has in some ways been protected by Australian Design Rules (ADR) and unique state-based vehicle standards. These “best practice” requirements, combined with the Australian markets practice of early adoption of new safety technologies, have resulted in Australian manufactured and compliant imported
55Moving People > Australian Bus and Coach Industry: a snapshot

66 Moving People > Australian Bus and Coach Industry: a snapshot
buses and coaches being among the safest in the world. This has not stopped, it must be noted, competition from international markets.
The market is also protected by its size in terms of total sales and deliveries in a global sense which requires re-engineering of international factory requirements to meet the vehicle Australian safety and regulatory requirements of ADR.
The bus and coach manufacturing sector can also be seasonal in nature with sales and deliveries sometimes significantly reliant on the public transport and school bus procurement of state and territory governments. The procurement process can often be based on short term sharp increases in demand for bus passenger services caused by increases in fuel and living costs; the long term impact of congestion in an ever increasing urban Australia; electoral cycle priorities; regulated vehicle replacement programs; average age of fleet and maximum age regulations; and the rise and fall of the Australian dollar.
These are just a few of the factors in the external environment that make the task of bus manufacturing challenging when planning for the needs of the market. The statistics supplied in this report are reflective of market procurement trends.
Future mobility and emerging marketsAustrade (2019) summarises the future of the transport and mobility sector from ownership to usership, transportation to mobility and internal combustion to electric propulsion. As a generalisation this is probably correct though issues of ownership and usership will take some time as this “disruption” will involve complex business models, different types of ownership developed across and between modes and mobility choices offered that will require much greater partnership and collaboration between transport fleet and vehicle owners, mobility technology owners and government authorities.
Austrade has identified three key sectors for future transport and mobility:
• Intelligent Transport Systems (ITS)
• Connected Automated Vehicles (CAV’s)
• Mobility as a Service (MaaS).
These transportation and personal mobility policy issues are addressed in Sections 10 and 11 of this report and in the BIC’s comprehensive policy discussion papers (listed in Appendix 1).
The future transport market was valued a $212.5 million in 2016 and is expected to grow to more than $16.6 Billion in revenue by 2025 (Frost and Sullivan, 2017).
Australian governments, with the urging of organisations such as the BIC, have been encouraged to take a nationally consistent approach to regulatory reform and the safety of automated vehicle technologies. There also needs to be a hands on approach by governments to ownership and the operations of mobility services including open access and the sharing of data so that these technologies can be assessed and delivered in an efficient and timely manner.
In 2018 the federal government established the Office of Future Transport Technology to prepare Australia for the imminent arrival of autonomous vehicles and other transport innovations. The transformation of transport mobility will need to be inventive to address the challenges of Australia’s growing and ageing population; the challenges of congestion on the economy and future land use; the planning and development of our growing cities and regions with innovative and better connected public transit networks, systems and personal mobility choices. This has been a priority focus of the Australian bus and coach industry and of the BIC in 2020 and will continue to be over the next 30 years.
About the Bus Industry Confederation The Bus Industry Confederation (BIC) is the national peak body, representing the interests of bus and coach operators, manufacturers and parts and service suppliers in the industry. The BIC represents the interests of its members (listed in Appendix 4) to governments and the community on a range of issues including technical, vehicle and parts-based issues to the broader challenge of meeting the growing passenger transport task and providing Australian travellers with a genuine alternative to the private car. The BIC and its members are dedicated to the moving people task and the promotion of safe, efficient and effective bus and coach transport in Australia.
The BIC was established as an incorporated Association in 1994 with the secretariat being formed in April 2002 in Canberra. A list of councillors who have served the BIC since 1994 to 2020 are included in Appendix 3.
In 2014, the BIC established and became the National member of the Bus Australia Network which also includes state association members: BusNSW, BusVic, BusSA, BusWA, TasBus and QBIC.
Policy Direction of the BIC and present-day industry issuesAt the beginning of each calendar year, the BIC undertakes a review of its 3-year strategic work program to provide a ‘working paper’ for the year that details the present-day issues and policy work to be undertaken. This working paper is presented as part of ‘BIC on the road’ meetings with federal, state and territory Ministers and senior officials involved in the transport, infrastructure, planning, cities/regions and tourism portfolios.
The 2020 BIC working paper is provided in Appendix 2 as a useful present-day reference document relating to:
• BIC Research Program 2020-2022
• BIC/Roads Australia Workshop with Infrastructure Australia on Future Mobility
• fleet and infrastructure innovation
• future mobility design
• energy transition to low/zero emissions
77Moving People > Australian Bus and Coach Industry: a snapshot
• review of:
- National Heavy Vehicle Law
- Australian Design Rules
- Road Vehicle Standards
- Performance Based Standards
- Accessible Transport Standards
• national framework for bus service procurement and contracts
• controlled access bus network
• road user charging
• industrial relations agenda
• travel to learn agenda
• long distance, charter, express and tourism agenda.
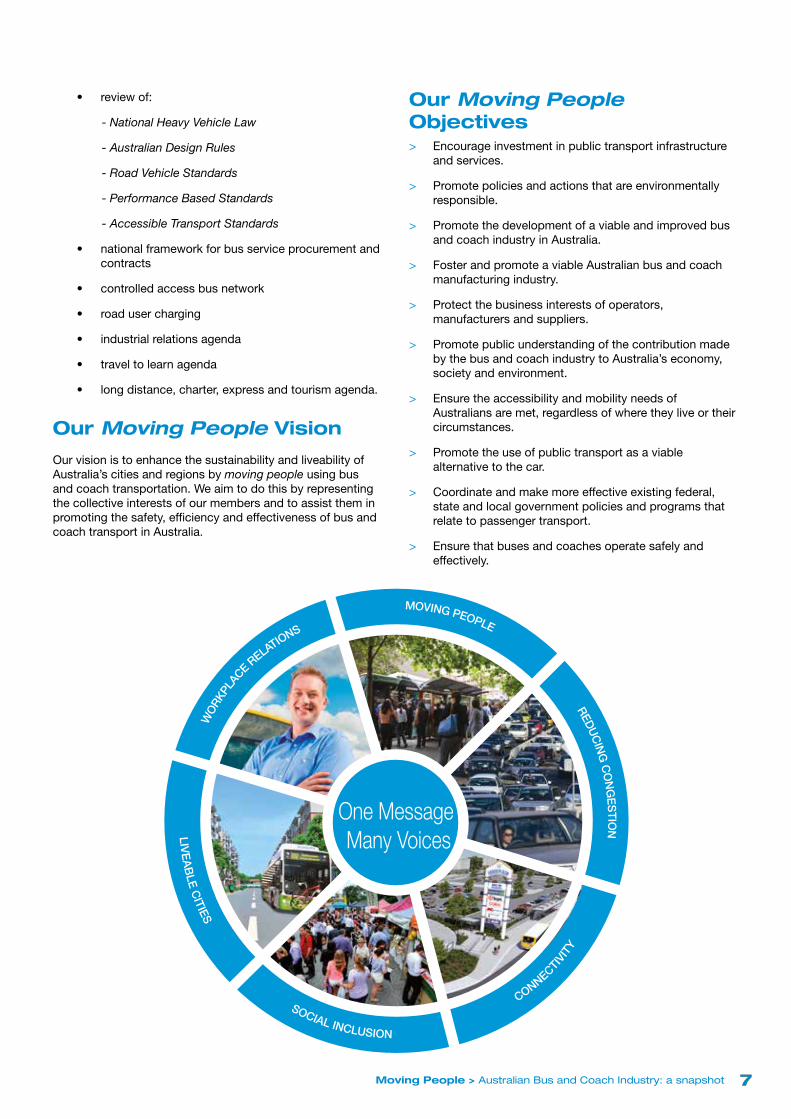
Our Moving People Vision
Our vision is to enhance the sustainability and liveability of Australia’s cities and regions by moving people using bus and coach transportation. We aim to do this by representing the collective interests of our members and to assist them in promoting the safety, efficiency and effectiveness of bus and coach transport in Australia.
Our Moving People Objectives
> Encourage investment in public transport infrastructure and services.
> Promote policies and actions that are environmentally responsible.
> Promote the development of a viable and improved bus and coach industry in Australia.
> Foster and promote a viable Australian bus and coach manufacturing industry.
> Protect the business interests of operators, manufacturers and suppliers.
> Promote public understanding of the contribution made by the bus and coach industry to Australia’s economy, society and environment.
> Ensure the accessibility and mobility needs of Australians are met, regardless of where they live or their circumstances.
> Promote the use of public transport as a viable alternative to the car.
> Coordinate and make more effective existing federal, state and local government policies and programs that relate to passenger transport.
> Ensure that buses and coaches operate safely and effectively.
WO
RKPL
ACE RELATIONS
MOVING PEOPLE REDU
CIN
G C
ON
GE
STIO
N
LIVE
AB
LE C
ITIES SOCIAL INCLUSION
CONNECTI
VITY
One Message Many Voices

88 Moving People > Australian Bus and Coach Industry: a snapshot
Bus Manufacturing
Fleet on the
road
Bus Operations
The Bus Passenger
Long Distance and Tourism Sector
Industry Areas of Policy and Program Focus
99Moving People > Australian Bus and Coach Industry: a snapshot
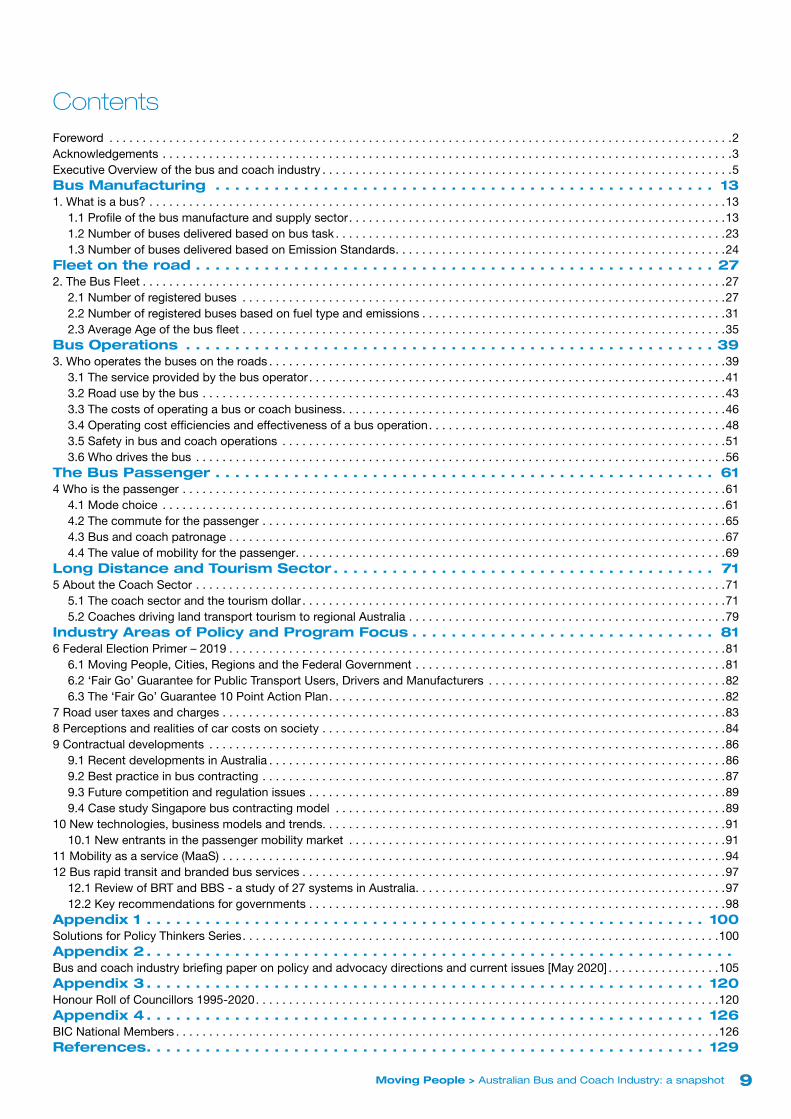
ContentsForeword . . . . . . . . . . . . . . . . . . . . . . . . . . . . . . . . . . . . . . . . . . . . . . . . . . . . . . . . . . . . . . . . . . . . . . . . . . . . . . . . . . . . . . . . . . . . . .2Acknowledgements . . . . . . . . . . . . . . . . . . . . . . . . . . . . . . . . . . . . . . . . . . . . . . . . . . . . . . . . . . . . . . . . . . . . . . . . . . . . . . . . . . . . . .3Executive Overview of the bus and coach industry . . . . . . . . . . . . . . . . . . . . . . . . . . . . . . . . . . . . . . . . . . . . . . . . . . . . . . . . . . . . . .5Bus Manufacturing . . . . . . . . . . . . . . . . . . . . . . . . . . . . . . . . . . . . . . . . . . . . . . . . . . . 131. What is a bus? . . . . . . . . . . . . . . . . . . . . . . . . . . . . . . . . . . . . . . . . . . . . . . . . . . . . . . . . . . . . . . . . . . . . . . . . . . . . . . . . . . . . . . .13
1.1 Profile of the bus manufacture and supply sector. . . . . . . . . . . . . . . . . . . . . . . . . . . . . . . . . . . . . . . . . . . . . . . . . . . . . . . . .131.2 Number of buses delivered based on bus task . . . . . . . . . . . . . . . . . . . . . . . . . . . . . . . . . . . . . . . . . . . . . . . . . . . . . . . . . . .231.3 Number of buses delivered based on Emission Standards. . . . . . . . . . . . . . . . . . . . . . . . . . . . . . . . . . . . . . . . . . . . . . . . . .24
Fleet on the road . . . . . . . . . . . . . . . . . . . . . . . . . . . . . . . . . . . . . . . . . . . . . . . . . . . . . 272. The Bus Fleet . . . . . . . . . . . . . . . . . . . . . . . . . . . . . . . . . . . . . . . . . . . . . . . . . . . . . . . . . . . . . . . . . . . . . . . . . . . . . . . . . . . . . . . .27
2.1 Number of registered buses . . . . . . . . . . . . . . . . . . . . . . . . . . . . . . . . . . . . . . . . . . . . . . . . . . . . . . . . . . . . . . . . . . . . . . . . .272.2 Number of registered buses based on fuel type and emissions . . . . . . . . . . . . . . . . . . . . . . . . . . . . . . . . . . . . . . . . . . . . . .312.3 Average Age of the bus fleet . . . . . . . . . . . . . . . . . . . . . . . . . . . . . . . . . . . . . . . . . . . . . . . . . . . . . . . . . . . . . . . . . . . . . . . . .35
Bus Operations . . . . . . . . . . . . . . . . . . . . . . . . . . . . . . . . . . . . . . . . . . . . . . . . . . . . . . 393. Who operates the buses on the roads . . . . . . . . . . . . . . . . . . . . . . . . . . . . . . . . . . . . . . . . . . . . . . . . . . . . . . . . . . . . . . . . . . . . .39
3.1 The service provided by the bus operator . . . . . . . . . . . . . . . . . . . . . . . . . . . . . . . . . . . . . . . . . . . . . . . . . . . . . . . . . . . . . . .413.2 Road use by the bus . . . . . . . . . . . . . . . . . . . . . . . . . . . . . . . . . . . . . . . . . . . . . . . . . . . . . . . . . . . . . . . . . . . . . . . . . . . . . . .433.3 The costs of operating a bus or coach business. . . . . . . . . . . . . . . . . . . . . . . . . . . . . . . . . . . . . . . . . . . . . . . . . . . . . . . . . .463.4 Operating cost efficiencies and effectiveness of a bus operation. . . . . . . . . . . . . . . . . . . . . . . . . . . . . . . . . . . . . . . . . . . . .483.5 Safety in bus and coach operations . . . . . . . . . . . . . . . . . . . . . . . . . . . . . . . . . . . . . . . . . . . . . . . . . . . . . . . . . . . . . . . . . . .513.6 Who drives the bus . . . . . . . . . . . . . . . . . . . . . . . . . . . . . . . . . . . . . . . . . . . . . . . . . . . . . . . . . . . . . . . . . . . . . . . . . . . . . . . .56
The Bus Passenger . . . . . . . . . . . . . . . . . . . . . . . . . . . . . . . . . . . . . . . . . . . . . . . . . . . 614 Who is the passenger . . . . . . . . . . . . . . . . . . . . . . . . . . . . . . . . . . . . . . . . . . . . . . . . . . . . . . . . . . . . . . . . . . . . . . . . . . . . . . . . . .61
4.1 Mode choice . . . . . . . . . . . . . . . . . . . . . . . . . . . . . . . . . . . . . . . . . . . . . . . . . . . . . . . . . . . . . . . . . . . . . . . . . . . . . . . . . . . . .614.2 The commute for the passenger . . . . . . . . . . . . . . . . . . . . . . . . . . . . . . . . . . . . . . . . . . . . . . . . . . . . . . . . . . . . . . . . . . . . . .654.3 Bus and coach patronage . . . . . . . . . . . . . . . . . . . . . . . . . . . . . . . . . . . . . . . . . . . . . . . . . . . . . . . . . . . . . . . . . . . . . . . . . . .674.4 The value of mobility for the passenger. . . . . . . . . . . . . . . . . . . . . . . . . . . . . . . . . . . . . . . . . . . . . . . . . . . . . . . . . . . . . . . . .69
Long Distance and Tourism Sector . . . . . . . . . . . . . . . . . . . . . . . . . . . . . . . . . . . . . . . 715 About the Coach Sector . . . . . . . . . . . . . . . . . . . . . . . . . . . . . . . . . . . . . . . . . . . . . . . . . . . . . . . . . . . . . . . . . . . . . . . . . . . . . . . .71
5.1 The coach sector and the tourism dollar . . . . . . . . . . . . . . . . . . . . . . . . . . . . . . . . . . . . . . . . . . . . . . . . . . . . . . . . . . . . . . . .715.2 Coaches driving land transport tourism to regional Australia . . . . . . . . . . . . . . . . . . . . . . . . . . . . . . . . . . . . . . . . . . . . . . . .79
Industry Areas of Policy and Program Focus . . . . . . . . . . . . . . . . . . . . . . . . . . . . . . . 816 Federal Election Primer – 2019 . . . . . . . . . . . . . . . . . . . . . . . . . . . . . . . . . . . . . . . . . . . . . . . . . . . . . . . . . . . . . . . . . . . . . . . . . . .81
6.1 Moving People, Cities, Regions and the Federal Government . . . . . . . . . . . . . . . . . . . . . . . . . . . . . . . . . . . . . . . . . . . . . . .816.2 ‘Fair Go’ Guarantee for Public Transport Users, Drivers and Manufacturers . . . . . . . . . . . . . . . . . . . . . . . . . . . . . . . . . . . .826.3 The ‘Fair Go’ Guarantee 10 Point Action Plan. . . . . . . . . . . . . . . . . . . . . . . . . . . . . . . . . . . . . . . . . . . . . . . . . . . . . . . . . . . .82
7 Road user taxes and charges . . . . . . . . . . . . . . . . . . . . . . . . . . . . . . . . . . . . . . . . . . . . . . . . . . . . . . . . . . . . . . . . . . . . . . . . . . . .838 Perceptions and realities of car costs on society . . . . . . . . . . . . . . . . . . . . . . . . . . . . . . . . . . . . . . . . . . . . . . . . . . . . . . . . . . . . .849 Contractual developments . . . . . . . . . . . . . . . . . . . . . . . . . . . . . . . . . . . . . . . . . . . . . . . . . . . . . . . . . . . . . . . . . . . . . . . . . . . . . .86
9.1 Recent developments in Australia . . . . . . . . . . . . . . . . . . . . . . . . . . . . . . . . . . . . . . . . . . . . . . . . . . . . . . . . . . . . . . . . . . . . .869.2 Best practice in bus contracting . . . . . . . . . . . . . . . . . . . . . . . . . . . . . . . . . . . . . . . . . . . . . . . . . . . . . . . . . . . . . . . . . . . . . .879.3 Future competition and regulation issues . . . . . . . . . . . . . . . . . . . . . . . . . . . . . . . . . . . . . . . . . . . . . . . . . . . . . . . . . . . . . . .899.4 Case study Singapore bus contracting model . . . . . . . . . . . . . . . . . . . . . . . . . . . . . . . . . . . . . . . . . . . . . . . . . . . . . . . . . . .89
10 New technologies, business models and trends. . . . . . . . . . . . . . . . . . . . . . . . . . . . . . . . . . . . . . . . . . . . . . . . . . . . . . . . . . . . .9110.1 New entrants in the passenger mobility market . . . . . . . . . . . . . . . . . . . . . . . . . . . . . . . . . . . . . . . . . . . . . . . . . . . . . . . . .91
11 Mobility as a service (MaaS) . . . . . . . . . . . . . . . . . . . . . . . . . . . . . . . . . . . . . . . . . . . . . . . . . . . . . . . . . . . . . . . . . . . . . . . . . . . .9412 Bus rapid transit and branded bus services . . . . . . . . . . . . . . . . . . . . . . . . . . . . . . . . . . . . . . . . . . . . . . . . . . . . . . . . . . . . . . . .97
12.1 Review of BRT and BBS - a study of 27 systems in Australia. . . . . . . . . . . . . . . . . . . . . . . . . . . . . . . . . . . . . . . . . . . . . . .9712.2 Key recommendations for governments . . . . . . . . . . . . . . . . . . . . . . . . . . . . . . . . . . . . . . . . . . . . . . . . . . . . . . . . . . . . . . .98
Appendix 1 . . . . . . . . . . . . . . . . . . . . . . . . . . . . . . . . . . . . . . . . . . . . . . . . . . . . . . . . . 100Solutions for Policy Thinkers Series. . . . . . . . . . . . . . . . . . . . . . . . . . . . . . . . . . . . . . . . . . . . . . . . . . . . . . . . . . . . . . . . . . . . . . . .100Appendix 2 . . . . . . . . . . . . . . . . . . . . . . . . . . . . . . . . . . . . . . . . . . . . . . . . . . . . . . . . . . . . Bus and coach industry briefing paper on policy and advocacy directions and current issues [May 2020] . . . . . . . . . . . . . . . . .105Appendix 3 . . . . . . . . . . . . . . . . . . . . . . . . . . . . . . . . . . . . . . . . . . . . . . . . . . . . . . . . . 120Honour Roll of Councillors 1995-2020. . . . . . . . . . . . . . . . . . . . . . . . . . . . . . . . . . . . . . . . . . . . . . . . . . . . . . . . . . . . . . . . . . . . . .120Appendix 4 . . . . . . . . . . . . . . . . . . . . . . . . . . . . . . . . . . . . . . . . . . . . . . . . . . . . . . . . . 126BIC National Members . . . . . . . . . . . . . . . . . . . . . . . . . . . . . . . . . . . . . . . . . . . . . . . . . . . . . . . . . . . . . . . . . . . . . . . . . . . . . . . . . .126References . . . . . . . . . . . . . . . . . . . . . . . . . . . . . . . . . . . . . . . . . . . . . . . . . . . . . . . . . 129

1010 Moving People > Australian Bus and Coach Industry: a snapshot
FiguresFigure 1.1: Total bus and coach deliveries January 2008 to December 2019 . . . . . . . . . . . . . . . . . . . . . . . . . . . . . . . . . . . . . . . . .14Figure 1.2: Market share of chassis . . . . . . . . . . . . . . . . . . . . . . . . . . . . . . . . . . . . . . . . . . . . . . . . . . . . . . . . . . . . . . . . . . . . . . . .15Figure 1.3: Chassis manufacturer market share by year . . . . . . . . . . . . . . . . . . . . . . . . . . . . . . . . . . . . . . . . . . . . . . . . . . . . . . . . .15Figure 1.4: Chassis market share for top 5 manufacturers by state/territory. . . . . . . . . . . . . . . . . . . . . . . . . . . . . . . . . . . . . . . . . .16Figure 1.5: Market share of body manufacturers . . . . . . . . . . . . . . . . . . . . . . . . . . . . . . . . . . . . . . . . . . . . . . . . . . . . . . . . . . . . . . .17Figure 1.6: Body manufacturer market share by year . . . . . . . . . . . . . . . . . . . . . . . . . . . . . . . . . . . . . . . . . . . . . . . . . . . . . . . . . . .18Figure 1.7: Body market share for top 5 manufacturers by state/territory. . . . . . . . . . . . . . . . . . . . . . . . . . . . . . . . . . . . . . . . . . . .18Figure 1.8: Top ten air conditioning manufacturers by total sales . . . . . . . . . . . . . . . . . . . . . . . . . . . . . . . . . . . . . . . . . . . . . . . . . .20Figure 1.9: Top ten seating manufacturers by total sales . . . . . . . . . . . . . . . . . . . . . . . . . . . . . . . . . . . . . . . . . . . . . . . . . . . . . . . .20Figure 1.10: Chinese chassis manufacturers market share . . . . . . . . . . . . . . . . . . . . . . . . . . . . . . . . . . . . . . . . . . . . . . . . . . . . . .22Figure 1.11: Chinese body manufacturers market share . . . . . . . . . . . . . . . . . . . . . . . . . . . . . . . . . . . . . . . . . . . . . . . . . . . . . . . .22Figure 1.12: Deliveries and their applications . . . . . . . . . . . . . . . . . . . . . . . . . . . . . . . . . . . . . . . . . . . . . . . . . . . . . . . . . . . . . . . . .23Figure 1.13: Deliveries by emissions standards . . . . . . . . . . . . . . . . . . . . . . . . . . . . . . . . . . . . . . . . . . . . . . . . . . . . . . . . . . . . . . .24Figure 1.14: Deliveries by emissions standards by state/territory . . . . . . . . . . . . . . . . . . . . . . . . . . . . . . . . . . . . . . . . . . . . . . . . . .25Figure 2.1: Registered buses ABS 2019 – small, medium and large . . . . . . . . . . . . . . . . . . . . . . . . . . . . . . . . . . . . . . . . . . . . . . .28Figure 2.2: ‘Commercial-use’ registered buses – under and over 12 tonne . . . . . . . . . . . . . . . . . . . . . . . . . . . . . . . . . . . . . . . . . .28Figure 2.3: Number of registered ‘commercial-use’ buses by state/territory. . . . . . . . . . . . . . . . . . . . . . . . . . . . . . . . . . . . . . . . . .30Figure 2.4: Percentage of buses on register by state/territory. . . . . . . . . . . . . . . . . . . . . . . . . . . . . . . . . . . . . . . . . . . . . . . . . . . . .30Figure 2.6: Emissions in the transport sector by mode . . . . . . . . . . . . . . . . . . . . . . . . . . . . . . . . . . . . . . . . . . . . . . . . . . . . . . . . . .32Figure 2.7: Carbon dioxide emissions per passenger kilometre by private car and public transport modes (ITLS
estimate from 2009-10 BITRE data) . . . . . . . . . . . . . . . . . . . . . . . . . . . . . . . . . . . . . . . . . . . . . . . . . . . . . . . . . . . . . . . .33Figure 2.8 Comparison of modal emission totals for Australian bus use and rail transport, in gigagrams of full fuel cycle CO2 equivalent for 2015 Mulley et al., 2017—includes urban and non-urban bus . . . . . . . . . . . . . . . . . . . . . . . . . . . . . . . . . . . . . . . . .34Figure 2.9: Buses on register by age . . . . . . . . . . . . . . . . . . . . . . . . . . . . . . . . . . . . . . . . . . . . . . . . . . . . . . . . . . . . . . . . . . . . . . . .35Figure 2.10: Buses on register by age and state/territory of registration. . . . . . . . . . . . . . . . . . . . . . . . . . . . . . . . . . . . . . . . . . . . .36Figure 2.11: Average age of bus/coach fleet by state/territory . . . . . . . . . . . . . . . . . . . . . . . . . . . . . . . . . . . . . . . . . . . . . . . . . . . .37Figure 3.1: Average kilometres travelled bus/coach in a 12 month period by service type (30 June 2018) . . . . . . . . . . . . . . . . . .42Figure 3.2: Total bus/coach kilometres travelled in a 12 month period by service type (30 June 2018) . . . . . . . . . . . . . . . . . . . . .42Figure 3.3: Total kilometres travelled in a 12 month period by service and vehicle type (30 June 2018) . . . . . . . . . . . . . . . . . . . .43Figure 3.4: Total kilometres travelled by road vehicle type in a 12 month period (end June 2018) . . . . . . . . . . . . . . . . . . . . . . . . .44Figure 3.5: Total bus/coach kilometres travelled in a 12 month period by area of operation (end June 2018) . . . . . . . . . . . . . . . .44Figure 3.6: Average bus/coach kms in a 12 month period by area of operation (end June 2018) . . . . . . . . . . . . . . . . . . . . . . . . .45Figure 3.7: Gross and net cost per service kilometre compared across Australia . . . . . . . . . . . . . . . . . . . . . . . . . . . . . . . . . . . . .49Figure 3.8: Heavy vehicle fatalities grouped by vehicle type, against total number of road fatalities 2008-2017 . . . . . . . . . . . . . .52Figure 3.9: Fatalities with bus involvement, segmented by road user type (1989-2019) . . . . . . . . . . . . . . . . . . . . . . . . . . . . . . . . .52Figure 3.10: Fatalities with bus involvement, segmented by speed environment (1989-2019) . . . . . . . . . . . . . . . . . . . . . . . . . . . .53Figure 3.11: Fatalities with bus involvement, segmented by age and gender (1989-2019). . . . . . . . . . . . . . . . . . . . . . . . . . . . . . .53Figure 3.12: Number of bus and coach drivers historical trend and projection 2007-2022. . . . . . . . . . . . . . . . . . . . . . . . . . . . . . .57Figure 3.13: Bus and coach drivers employed by state/territory 2017 . . . . . . . . . . . . . . . . . . . . . . . . . . . . . . . . . . . . . . . . . . . . . .57Figure 3.14: Bus and coach drivers employed by age profile 2017. . . . . . . . . . . . . . . . . . . . . . . . . . . . . . . . . . . . . . . . . . . . . . . . .58Figure 3.15: Bus and coach drivers employed by education level 2016 . . . . . . . . . . . . . . . . . . . . . . . . . . . . . . . . . . . . . . . . . . . . .58Figure 4.1: National mode share by passenger kilometres, of a total 433.1 billion passenger kilometres travelled in 2015-2016 62Figure 4.2: Historical trend of bus/coach contribution to the national land passenger transport task, overlayed on national
passenger kilometres travelled on land modes 1974-2016 . . . . . . . . . . . . . . . . . . . . . . . . . . . . . . . . . . . . . . . . . . . . . .62Figure 4.3: Capital city mode share by passenger kilometres, out of a total 197.26 billion passenger kilometres travelled
in 2014-2015 . . . . . . . . . . . . . . . . . . . . . . . . . . . . . . . . . . . . . . . . . . . . . . . . . . . . . . . . . . . . . . . . . . . . . . . . . . . . . . . . .63Figure 4.4: Historical trend of bus/coach contribution to the capital city passenger transport task, overlayed on capital city
passenger kilometres travelled 1976-2015 . . . . . . . . . . . . . . . . . . . . . . . . . . . . . . . . . . . . . . . . . . . . . . . . . . . . . . . . . .64Figure 4.5: Historical trend of bus/coach passenger kilometres by capital city 1976-2015 . . . . . . . . . . . . . . . . . . . . . . . . . . . . . .64Figure 4.6: Journey-to-work by mode (2016), out of a total working population of 8.92 million . . . . . . . . . . . . . . . . . . . . . . . . . . .66Figure 4.7: Historical trend of public transport and public transport plus other method in the journey-to-work mode share
1986-2016 . . . . . . . . . . . . . . . . . . . . . . . . . . . . . . . . . . . . . . . . . . . . . . . . . . . . . . . . . . . . . . . . . . . . . . . . . . . . . . . . . . .66Figure 4.8: Passenger boardings by government operator in 2016-2017 . . . . . . . . . . . . . . . . . . . . . . . . . . . . . . . . . . . . . . . . . . .67Figure 5.1: Top 10 countries from which visitors hailed by number of visitors and expenditure in the year ending March 2018 . .73Figure 5.2: Visitors and expenditure by state/territory . . . . . . . . . . . . . . . . . . . . . . . . . . . . . . . . . . . . . . . . . . . . . . . . . . . . . . . . . . .73Figure 5.3: Total number of nights spent and the average length of each stay for those who travelled on each particular mode 74Figure 5.4: International visitor nights spent by mode and state/territory of travel . . . . . . . . . . . . . . . . . . . . . . . . . . . . . . . . . . . . .74Figure 5.5: International visitor nights spent by mode and travel purpose . . . . . . . . . . . . . . . . . . . . . . . . . . . . . . . . . . . . . . . . . . .75

1111Moving People > Australian Bus and Coach Industry: a snapshot
Figure 5.6: International visitor nights spent by mode and life cycle . . . . . . . . . . . . . . . . . . . . . . . . . . . . . . . . . . . . . . . . . . . . . . . .75Figure 5.7: Mode share of domestic visitors as measured by total nights stayed. . . . . . . . . . . . . . . . . . . . . . . . . . . . . . . . . . . . . .76Figure 5.8: Domestic visitor nights spent by mode and state/territory of travel . . . . . . . . . . . . . . . . . . . . . . . . . . . . . . . . . . . . . . .77Figure 5.9: Domestic visitor nights spent by mode and travel purpose. . . . . . . . . . . . . . . . . . . . . . . . . . . . . . . . . . . . . . . . . . . . . .77Figure 5.10: Domestic visitor nights spent by mode and life cycle . . . . . . . . . . . . . . . . . . . . . . . . . . . . . . . . . . . . . . . . . . . . . . . . .78Figure 8.1: Perceived and actual costs of private car and public transport (ITLS estimate from 2009-10 BITRE
data/ABS/RACV) . . . . . . . . . . . . . . . . . . . . . . . . . . . . . . . . . . . . . . . . . . . . . . . . . . . . . . . . . . . . . . . . . . . . . . . . . . . . . .85Figure 9.1: The original STO (strategic/tactical/operational) framework from van de Velde (1997: 6),
which has grown to become a Thredbo centrepiece. . . . . . . . . . . . . . . . . . . . . . . . . . . . . . . . . . . . . . . . . . . . . . . . . . .88Figure 10.1: Shared mobility providers in Australia—the vast majority of which have entered over the past three years . . . . . . .92Figure 11.1: ITLS proposed framework for the MaaS ecosystem, comprising the new function for a mobility broker
aggregating different suppliers and delivering integrated service to demanders . . . . . . . . . . . . . . . . . . . . . . . . . . . . .95Figure 11.2: Individually tailored mobility packages tested in our ITLS research (Ho et al., 2018). . . . . . . . . . . . . . . . . . . . . . . . .95
Tables
Table 1.1: Top ten chassis plus body combinations and sales . . . . . . . . . . . . . . . . . . . . . . . . . . . . . . . . . . . . . . . . . . . . . . . . . . . .19Table 2.1: Registered ‘commercial-use’ buses as at 31 January 2019 . . . . . . . . . . . . . . . . . . . . . . . . . . . . . . . . . . . . . . . . . . . . . .29Table 2.2: Bus and coach fuel consumption by fuel type . . . . . . . . . . . . . . . . . . . . . . . . . . . . . . . . . . . . . . . . . . . . . . . . . . . . . . . .31Table 2.3: Average and maximum age requirements for buses by state/territory and service type . . . . . . . . . . . . . . . . . . . . . . . .37Table 3.1: Estimate of bus operators by state/territory and service type . . . . . . . . . . . . . . . . . . . . . . . . . . . . . . . . . . . . . . . . . . . .39Table 3.3: Typical capacities and capital costs by mode and vehicle type based on mid-2014 prices . . . . . . . . . . . . . . . . . . . . .47Table 3.4: Operating costs of each mode by category, based on mid-2014 prices . . . . . . . . . . . . . . . . . . . . . . . . . . . . . . . . . . . .48Table 3.5: The concepts of efficiency and effectiveness as it relates to bus and coach operations . . . . . . . . . . . . . . . . . . . . . . . .48Table 3.6: Productivity comparison by passenger kilometre intensity for 2016-17 (ITLS estimate from BITRE/ABS data). . . . . . .50Table 3.7: Productivity comparison by state/territory by passenger trip intensity for 2016-17
(ITLS estimate from BITRE/ABS and state/territory-provided data). . . . . . . . . . . . . . . . . . . . . . . . . . . . . . . . . . . . . . . .50Table 3.8: Key statistics on the bus and coach driving profession . . . . . . . . . . . . . . . . . . . . . . . . . . . . . . . . . . . . . . . . . . . . . . . . .56Table 4.1: Total passengers carried by the bus and coach industry in each state/territory
(data collated by ITLS correspondence with state/territory authorities and associations) . . . . . . . . . . . . . . . . . . . . . . .68Table 4.2: Dimensions and definitions of social exclusion . . . . . . . . . . . . . . . . . . . . . . . . . . . . . . . . . . . . . . . . . . . . . . . . . . . . . . .69Table 5.1 Key strategic areas for coach travel to disperse tourists to regional Australia. . . . . . . . . . . . . . . . . . . . . . . . . . . . . . . . .79Table 6.1: ‘Turn Up and Go’ Minimum Service Levels . . . . . . . . . . . . . . . . . . . . . . . . . . . . . . . . . . . . . . . . . . . . . . . . . . . . . . . . . . .82Table 7.1: Registration charges for heavy vehicles 2018–19 and 2019–20 . . . . . . . . . . . . . . . . . . . . . . . . . . . . . . . . . . . . . . . . . . .83Table 7.2: Heavy vehicle charge national total estimate for 2016-17 (from BITRE) . . . . . . . . . . . . . . . . . . . . . . . . . . . . . . . . . . . . .83Table 8.1: Estimate of corrective fuel excise (tax) for Australian passenger cars—2015 price estimate . . . . . . . . . . . . . . . . . . . .85Table 9.1: Organising the tactical environment, adapted from Stanley and Longva (2010: 82) . . . . . . . . . . . . . . . . . . . . . . . . . . . .88Table 9.2: Various cost/revenue sharing contractual arrangements, adapted from Stanley and van de Velde (2008: 24) . . . . . . .88Table 9.3: Singapore bus contracting rounds and winners . . . . . . . . . . . . . . . . . . . . . . . . . . . . . . . . . . . . . . . . . . . . . . . . . . . . . . .90Table 9.4: Remaining contract rounds and offerings . . . . . . . . . . . . . . . . . . . . . . . . . . . . . . . . . . . . . . . . . . . . . . . . . . . . . . . . . . . .90Table 10.1: On demand trials in NSW (as at mid-2018) . . . . . . . . . . . . . . . . . . . . . . . . . . . . . . . . . . . . . . . . . . . . . . . . . . . . . . . . . .93

1212 Moving People > Australian Bus and Coach Industry: a snapshot
M
OVING PEOPLE
THEMANUFACTURERS
& SUPPLIERS

1313Moving People > Australian Bus and Coach Industry: a snapshot
Bus Manufacturing 1. What is a bus? The Australian Bureau of Statistics (ABS) defines a bus [or coach], based on the current definition (1989) under Australian Design Rules (ADR) as a motor vehicle constructed for the carriage of passengers, with 9 or more seats, including the driver’s seat. When not specified, the term ‘bus’ in this report applies to a bus or a coach type motor vehicle.
The bus and coach industry defines the construct of a bus as:
• a buggy type chassis (2, 3 or 4 axle) and associated mechanical components (engine, steering, axle, etc.) and the body (panels, floors, seating, etc.)
• a composite bus (also called monocoque) which does not have a traditional buggy chassis, is a composite of all mechanical and body components as an integral unit.
The bus and coach industry generally defines the size of a bus as:
• large – a bus that has a GVM of 10 tonne or more, a body length of 12.5 to 18 metres with a seat capacity (including driver) of 26 or more
• medium – a (midi) bus that has a GVM of less than 10 tonne, a body length of 8 to 10 metres with a seat capacity (including driver) of 16 to 25
• small – a (mini) bus that has a GVM of less than 4.5 tonne, a body length of less than 8 metres with a seat capacity (including driver) of 9 to 15.
Buses can also vary in style based on its primary area of operations (urban or regional) and/or primary duties (route, school, charter, long distance) and can be:
• single deck or double deck
• articulated or rigid
• high floor or low floor accessible.
1 .1 Profile of the bus manufacture and supply sectorThe data presented in this Section is compiled from bus data published by Australasian Bus and Coach (ABC), an industry magazine that publishes monthly delivery data supplied by chassis manufacturers. Data from quarterly survey information provided by BIC Members has also been used to assist in differentiating buggy-type chassis buses and monocoque (composite) constructs.
Most Australian buses are of a body-on-frame construct method usually with separate chassis and body manufacturers. Splitting body and chassis construction allows businesses to specialise in different fields and also offers customers greater choice in chassis/body combinations. The majority of buses are built in Australia on a European chassis (and increasingly Asian chassis). In recent years, there has been a growth in monocoque buses, manufactured locally and abroad.
In a recent BIC analysis of available ABC delivery data (ie. all large bus types delivered to a bus operator) from Jan 2017 to Feb 2020, 36.3% were fully imported buses and 63.7% were built locally on either imported chassis or as a monocoque.
In this 3-year period, the market can be further broken down.
City type public transport/route buses:
• 11.1% – fully imported
• 88.9 % – locally built (on either imported chassis or as a monocoque).
School Buses:
• 40.4 % – fully imported
• 59.6% – locally built (on either imported chassis or as a monocoque).
The Australian bus market has seen significant change over the past decade from 100% Australian manufactured, with the school bus market most effected through imports from Asia.
Based on various industry surveys undertaken by the BIC in 2010, 2018 and 2020, the BIC estimates that:
• $5 billion is contributed to the Australian economy each year in the manufacture of buses
• there can be up to 40 manufacturing and parts supply companies (local and abroad) that contribute to the final assembly of a single bus
• the sector employs more than 10,000 Australians
• close to $1.5 billion is contributed to the Australian economy each year in supplies and services to keep the buses operational and in service.

1414 Moving People > Australian Bus and Coach Industry: a snapshot
Number of buses supplied in Australia
A total of 17,969 buses were delivered into the Australian marketplace for the calendar years 2008 to 2019.
The 2019 and 2020 industry reported deliveries of buses and coaches were 1,449 and 1,226 respectively. The economic impact of Covid-19 on the manufacturing sector was most evident in the delivery of long distance coaches seeing a down-turn of 74% from 2019. Route bus deliveries were also down by 20% whilst Charter and School bus deliveries remained consistent throughout 2020.
Reported bus deliveries average around 1,500 per year but the annual total deliveries vary based on a number of external factors including:
• government procurement of buses for route and school services
• increases in demand for bus passenger services caused by increases in fuel and living costs
• the long term impact of congestion in an ever increasing urban Australia
• electoral cycle priorities
• regulated vehicle replacement programs
• average age of fleet and maximum age regulations
• rise and fall of the Australian dollar.
Figure 1.1 highlights the annual variation in total deliveries recorded which can significantly impact on the capacity of some businesses to deal with the peaks and troughs.
Figure 1.1: Total bus and coach deliveries January 2008 to December 2019
16901843 1903
14781580
14811398 1369
1223 12061349
1449
200
400
600
800
1,000
1,200
1,400
1,600
1,800
2,000
2008 2009 2010 2011 2012 2013 2014 2015 2016 2017 2018 2019
Bus deliveries by year (2008-2019)
Source: Australasian Bus and Coach (January 2008 to December 2019)
1515Moving People > Australian Bus and Coach Industry: a snapshot
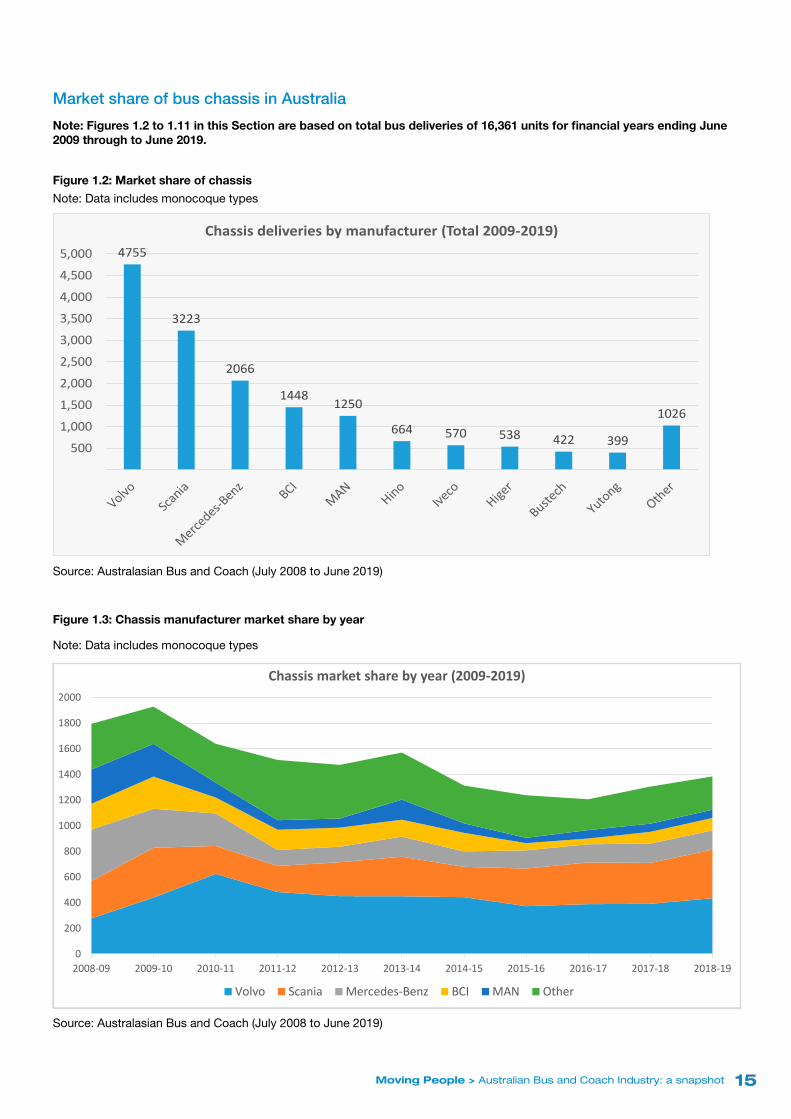
Market share of bus chassis in Australia
Note: Figures 1.2 to 1.11 in this Section are based on total bus deliveries of 16,361 units for financial years ending June 2009 through to June 2019.
Figure 1.2: Market share of chassis
Note: Data includes monocoque types
4755
3223
2066
1448 1250
664 570 538 422 399
1026
5001,0001,5002,0002,5003,0003,5004,0004,5005,000
Chassis deliveries by manufacturer (Total 2009-2019)
Source: Australasian Bus and Coach (July 2008 to June 2019)
Figure 1.3: Chassis manufacturer market share by year
Note: Data includes monocoque types
0
200
400
600
800
1000
1200
1400
1600
1800
2000
2008-09 2009-10 2010-11 2011-12 2012-13 2013-14 2014-15 2015-16 2016-17 2017-18 2018-19
Chassis market share by year (2009-2019)
Volvo Scania Mercedes-Benz BCI MAN Other
Source: Australasian Bus and Coach (July 2008 to June 2019)

1616 Moving People > Australian Bus and Coach Industry: a snapshot
Figure 1.4: Chassis market share for top 5 manufacturers by state/territory
Note: Data includes monocoque types
0%
10%
20%
30%
40%
50%
60%
70%
80%
90%
100%
NSW VIC QLD WA SA TAS ACT NT
Chassis market share by state (Total 2009-2019)
Volvo Scania Mercedes-Benz BCI MAN Other
Source: Australasian Bus and Coach (July 2008 to June 2019)

1717Moving People > Australian Bus and Coach Industry: a snapshot
Market share of bus body in Australia
The bus body market sees greater market diversity compared with the chassis market in terms of the number of bodybuilders active, but also more concentrated market share amongst the largest players.
Based on total deliveries for the financial years 2009 to 2019, the top ten manufacturers accounted for 84.4%
of all bodies delivered (Figure 1.5). The top five body manufacturers accounted for 72.0% of deliveries in 2008-09 and 61.7% in the 2018-2019 financial year (Figure 1.6). Similar to the chassis market share, the market share of each body manufacturer varies significantly between states and territories (Figure 1.7).
Figure 1.5: Market share of body manufacturers
Note: Data includes monocoque types
4999
2417
1508 1403
676 673 532 431 418 399
2480
500
1,000
1,500
2,000
2,500
3,000
3,500
4,000
4,500
5,000Body deliveries by manufacturer (Total 2009-2019)
Source: Australasian Bus and Coach (July 2008 to June 2019) Note (*) UBC/Chiron are no longer partnered

1818 Moving People > Australian Bus and Coach Industry: a snapshot
Figure 1.6: Body manufacturer market share by year
Note: Data includes monocoque types
200400600800
1,0001,2001,4001,6001,8002,000
Body market share by year (2009-2019)
Volgren Custom BCI Bustech Higer Other
Source: Australasian Bus and Coach (July 2008 to June 2019)
Figure 1.7: Body market share for top 5 manufacturers by state/territory
Note: Data includes monocoque types
0%
10%
20%
30%
40%
50%
60%
70%
80%
90%
100%
NSW VIC QLD WA SA TAS ACT NT
Body market share by state (Total 2009-2019)
Volgren Custom BCI Bustech Higer Other
Source: Australasian Bus and Coach (July 2008 to June 2019)

1919Moving People > Australian Bus and Coach Industry: a snapshot
Table 1.1 outlines the top ten chassis plus body combinations ordered by total deliveries for the financial years 2009 to 2019.There is a wide variety of combinations but also heavy concentration in terms of the market share for the most popular combinations. A number of monocoque buses also appeared in the top ten.
Table 1.1: Top ten chassis plus body combinations and sales
Chassis Body Deliveries
Volvo Volgren 3,140
BCI BCI 1,441
Scania Custom 896
Scania Volgren 809
Mercedes-Benz Volgren 653
Volvo Custom 552
Higer Higer 538
Bustech Bustech 422
Volvo Bustech 359
Mercedes-Benz Custom 353
Source: Australasian Bus and Coach (July 2008 to June 2019)
Market share of other suppliers
Air conditioning and seating constitute important inputs into the bus manufacturing supply chain. Whilst some chassis and body manufacturers also make air conditioning and seating components, most of these products are made by specialty third party manufacturers or importers.
Figures 1.8 and 1.9 provide an analysis of the market shares for the financial years 2009 to 2019.
There are a number of other major suppliers (and industries) supported by the bus manufacturing sector. As noted at the start of this Section, the BIC estimates up to 40 companies can be involved in the final assembled bus supplying various components and services.
Parts and Services
• Engine
• Transmission
• Suspension
• Axles
• Dynamic safety systems
• Wheels and tyres
• Steel materials and manufactured structure
• Sheet metal fabrication
• Fibreglass and plastic panel components
• Electrical harnesses
• Flooring materials
• Glazing
• Bonding materials
• Multiplexing systems
• Seating
• Door and associated controls & safety systems
• Fire suppressions systems
• 2-way radio
• Decals
• Reverse camera
• Insulation
• Various electrical components
• Lighting
• Textiles/coverings
• Windscreen blinds
• Destination sign
On-board monitoring devices
• Driver assistance systems
• CCTV
• Vehicle telematic systems
• GPS and vehicle tracking systems
• Child safety systems

2020 Moving People > Australian Bus and Coach Industry: a snapshot
Figure 1.8: Top ten air conditioning manufacturers by total sales
6350
18731594
1085708 676 641 559 405 389
1657
1,000
2,000
3,000
4,000
5,000
6,000
7,000
ThermoKing
Coachair Denso Hispacold Carrier Cooltek Spheros Tracs Kingtec Yutong Other
Air conditioning manufacturers by sales (Total 2009-2019)
Source: Australasian Bus and Coach (July 2008 to June 2019)
Figure 1.9: Top ten seating manufacturers by total sales
6634
3423
1600
940 832
403 336 211 178 136
1244
1,000
2,000
3,000
4,000
5,000
6,000
7,000Seating manufacturers by market share (Total 2009-2019)
Source: Australasian Bus and Coach (July 2008 to June 2019)

2121Moving People > Australian Bus and Coach Industry: a snapshot
Market share case study of Chinese manufacturers (and electric buses)
Chinese companies are entering the international stage in the transportation and infrastructure sectors.
Chinese chassis manufacturers have become active in Australia over the past decade (Figure 1.10), although the total market share of Chinese bus and coach deliveries has remained steady since 2011-12. BCI is included in this analysis which although Australian-owned, moved its production to China in 2006. In the body manufacturing sector (Figure 1.11), market shares have been remarkably similar due to the high proportion of composite (monocoque) buses sold. A major exception is King Long which has been active since before 2008-09 and uses any chassis including MAN, Hino and Daewoo; only 55% of King Long bodied buses sold were of monocoque construction.
Other Chinese manufacturers are expected to expand their presence in Australia and include Ankai, Youngman, Zhongtong, BYD and CRRC. CRRC is the world’s largest rail manufacturer (formed after the merger of CNR and CSR) which has recently ventured into road transport through what is marketed as autonomous rail rapid transit (or trackless trams) which is essentially an optically-guided bus (other examples operate in Rouen, France and Castellón, Spain).1 Already in operation in Zhuzhou, China, this technology has recently attracted interest as a cost effective alternative to light rail investment. Shanghai Electric also produces magnetic guidance bus technology and has seen interest expressed to supply their products in Australia and New Zealand.
BYD is a major manufacturer of electric buses and in their production city of Shenzhen has an all-electric bus fleet 16,400 strong—greater than the rest of the world combined. Their success hinges on China’s New Energy Vehicle policy initiated in 2009 to prioritise the electrification of the road transport system, through establishing national mandates, subsidising manufacturers and nurturing policy competition amongst cities. These policies have helped propel the industry and allow the manufacturing sector to reap economies of scale, as well as propel China to become the home of 99% of the world’s electric buses. In March 2019, it was announced that local level subsidies would be abolished, and overall subsidies reduced by more than 50%. Chinese manufacturers are therefore likely to pursue international markets to offset lower domestic demand.
A major operator in Shenzhen is Shenzhen Bus Group,2 a joint venture between Hong Kong-based Transport International and the Shenzhen Municipality.3 In 2017, they submitted a bid in the Bukit Merah (tranche 4) round in Singapore (see Section 9.4) where electrification featured as a large part of their offering, showing Chinese bus operators’ interest in entering the international stage. Shenzhen Group is also at the forefront of exporting electric bus operation know-how to the world through their partnership with the International Association of Public Transport (UITP) Academy.
1 For more discussion, see https://theconversation.com/looking-past-the-hype-about-trackless-trams-107092
2 As of September 2018, the group is also the world’s largest pure electric taxi operator with a fleet of 4,700
3 Shenzhen has been designated a Special Economic Zone since 1980
There are a number of hybrid and electric bus trials underway in Australia. Vehicles in these trials tend to be dominated by Chinese manufacturers. Points of contention that arise include asset allocation issues (especially around capital and maintenance costs since electric buses tend to be more expensive to acquire but have lower ongoing costs), as well as the merits of hybrid fleets (which require two concurrent systems), opportunity charging and type of charging infrastructure (e.g., bus mounted pantographs versus inverted pantographs).
Overseas companies are also actively entering China in the urban passenger transport operations space. MTR Corporation (HK company) is operating in the Chinese mainland under build-operate-transfer and public-private partnerships arrangements in Beijing, Shenzhen and Hangzhou. RATP Dev Transdev Asia is active in Hong Kong, Macau, Jiangsu and Anhui provinces as well as Shenyang, and Shanghai Keolis (Shanghai Shentong Metro Group and Keolis joint-venture) in Shanghai. Regulatory and competition reforms in the future will further open up opportunities for foreign involvement.

2222 Moving People > Australian Bus and Coach Industry: a snapshot
Figure 1.10: Chinese chassis manufacturers market share
0%
5%
10%
15%
20%
25%
30%
35%
0
50
100
150
200
250
300
350
400
450Chinese chassis manufacturers market share (2009-2019)
BCI Bonluck Higer King Long Yutong Percentage Chinese
Source: Australasian Bus and Coach (July 2008 to June 2019)
Figure 1.11: Chinese body manufacturers market share
0%
5%
10%
15%
20%
25%
30%
35%
0
50
100
150
200
250
300
350
400
450
500Chinese body manufacturers market share (2009-2019)
BCI Bonluck Higer King Long Yutong Percentage Chinese
Source: Australasian Bus and Coach (July 2008 to June 2019)
2323Moving People > Australian Bus and Coach Industry: a snapshot
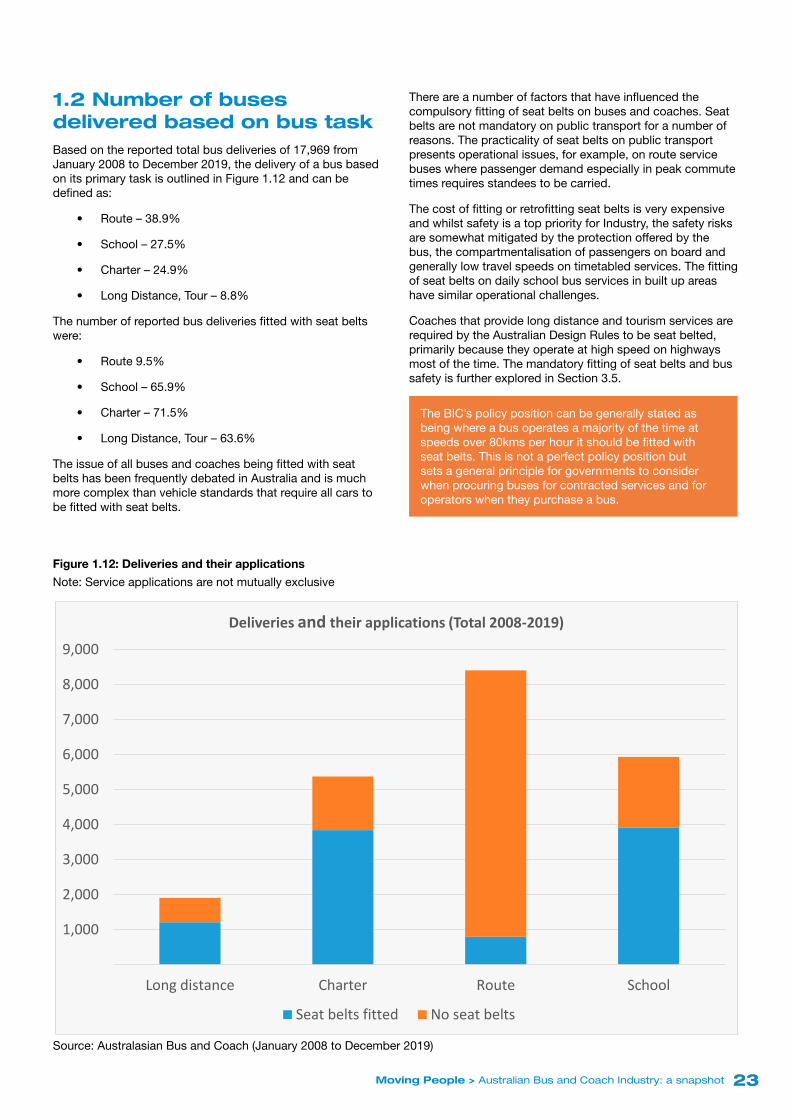
1 .2 Number of buses delivered based on bus taskBased on the reported total bus deliveries of 17,969 from January 2008 to December 2019, the delivery of a bus based on its primary task is outlined in Figure 1.12 and can be defined as:
• Route – 38.9%
• School – 27.5%
• Charter – 24.9%
• Long Distance, Tour – 8.8%
The number of reported bus deliveries fitted with seat belts were:
• Route 9.5%
• School – 65.9%
• Charter – 71.5%
• Long Distance, Tour – 63.6%
The issue of all buses and coaches being fitted with seat belts has been frequently debated in Australia and is much more complex than vehicle standards that require all cars to be fitted with seat belts.
There are a number of factors that have influenced the compulsory fitting of seat belts on buses and coaches. Seat belts are not mandatory on public transport for a number of reasons. The practicality of seat belts on public transport presents operational issues, for example, on route service buses where passenger demand especially in peak commute times requires standees to be carried.
The cost of fitting or retrofitting seat belts is very expensive and whilst safety is a top priority for Industry, the safety risks are somewhat mitigated by the protection offered by the bus, the compartmentalisation of passengers on board and generally low travel speeds on timetabled services. The fitting of seat belts on daily school bus services in built up areas have similar operational challenges.
Coaches that provide long distance and tourism services are required by the Australian Design Rules to be seat belted, primarily because they operate at high speed on highways most of the time. The mandatory fitting of seat belts and bus safety is further explored in Section 3.5.
The BIC’s policy position can be generally stated as being where a bus operates a majority of the time at speeds over 80kms per hour it should be fitted with seat belts. This is not a perfect policy position but sets a general principle for governments to consider when procuring buses for contracted services and for operators when they purchase a bus.
Figure 1.12: Deliveries and their applications
Note: Service applications are not mutually exclusive
1,000
2,000
3,000
4,000
5,000
6,000
7,000
8,000
9,000
Long distance Charter Route School
Deliveries and their applications (Total 2008-2019)
Seat belts fitted No seat belts
Source: Australasian Bus and Coach (January 2008 to December 2019)

2424 Moving People > Australian Bus and Coach Industry: a snapshot
1 .3 Number of buses delivered based on Emission StandardsAn important government-mandated consideration is the environmental performance of new buses and coaches. Buses and coaches are subject to standards based on the international harmonisation with European Union (EU) vehicle standards, with US and Japanese equivalent standards accepted. This applies to heavy vehicle emissions standards and are commonly recognised as Euro Emission Standards.
The Euro Emission Standards for heavy vehicles has been mandated for all new buses and coaches in chronological order as follows:
• Euro I (1992)
• Euro II (1998)
• Euro III (2000)
• Euro IV (2005)
• Euro V (2010)
• Euro VI – expected to be mandated in 2027, though Euro VI buses and coaches are already operating in Australia.
Newer vehicles are fitted with technologies such as particulate traps which have very low emission rates of (carcinogenic) fine particulate matter. Figure 1.13 shows the reported emissions standards of buses delivered over the past decade. In 2008-09, 59.8% of deliveries were of Euro IV standard. By 2012-13, Euro IV had all being phased out, comprising instead of EEV (37.0%) and Euro V (61.7%) deliveries; EEV (Enhanced environmentally friendly) refers to an emissions standard between the levels Euro IV and Euro V. In 2018-2019, Euro V comprised of 72.70% of deliveries and Euro VI, 20.02%. A small number of electric buses have also been delivered in the past 5 years.
23% of Australia’s bus fleet is over 17 years old (Figure 2.10) meaning they are meeting Euro III or less emission standards. Data on Australia’s ageing bus and coach fleet and its renewal is further discussed in Section 2.
Figure 1.13: Deliveries by emissions standards
200
400
600
800
1,000
1,200
1,400
1,600
1,800
2,000Deliveries by emissions standards (2009-2019)
Euro 3 Euro 4 EEV Euro 5 Euro 6
Source: Australasian Bus and Coach July 2018 to June 2019

2525Moving People > Australian Bus and Coach Industry: a snapshot
Figure 1.14: Deliveries by emissions standards by state/territory
500
1,000
1,500
2,000
2,500
3,000
3,500
4,000
4,500
5,000
NSW VIC QLD WA SA TAS ACT NT
Deliveries by emisssions standards by state/territory (Total 2009-2019)
Euro 3 Euro 4 EEV Euro 5 Euro 6
Source: Australasian Bus and Coach (July 2008 to June 2019)

2626 Moving People > Australian Bus and Coach Industry: a snapshot
M
OVING PEOPLE
THEFLEET

2727Moving People > Australian Bus and Coach Industry: a snapshot
Fleet on the road2. The Bus FleetThe Australian bus fleet (route/school) is old and of good quality. The reasons for this vary but in general it relates to state and territory government budgets for procurement of buses and the number and frequency of services provided for public transport (route) and school bus services, which make up the majority of the Australian fleet on the road. Coaches for example operating in the long distance and tourism market tend to be newer to provide superior levels of passenger comfort and attract customers and are a small percentage of the overall passenger task and fleet on the road.
Route and school bus services procured by or operated by state and territory governments have operated at service levels that result in very low vehicle kilometres travelled each year by a bus and therefore the vehicles full life cycle, if maintained to specification, can be up to 25 years. This has over many decades seen buses, as a generalisation, providing route and school services proceed through a service life cycle that begins with a new bus providing high patronage urban passenger services and ends with lower patronage services in regional and rural areas. Many vehicles over 15 years also act as replacement service vehicles and used for charter purposes. This approach has maximised the return on investment in the vehicle out to 25 years of age.
Some states and territories have average age of fleet and maximum age requirements as outlined in this Section of the report (see Table 2.3). The reality is, 23% of the Australian bus fleet is 17 years or older and operate with Euro III or less emission standards. More detail on this follows in Section 2.3. This reflects a large percentage of the fleet performing the passenger task in vehicles that have poor emission performance and offer very little in the way of modern comfort features for passengers compared with new buses. This is hardly conducive to attracting passengers to use public transport or school bus services or addressing greenhouse and other emissions from transport.
2 .1 Number of registered buses Fleet size and composition data in this Section is compiled from the ABS Motor Vehicle Census (2019) and the ABS Motor Vehicle Use Survey (2018). The census publication (2019) presents statistics relating to vehicles which were registered with a motor vehicle registration authority by the 31st January of each year. In 2019, the number of registered buses was 105,331 (Figure 2.1).
It is important to note that the ABS in undertaking motor vehicle surveys, uses the following definitions from Australian Design Rules (ADR):
• Omnibus – a passenger vehicle having more than 9 seating positions, including that of the driver; and
• C Class vehicle – a passenger vehicle equipped to seat no more than 12 adults (including driver) with a gross vehicle mass (GVM) of up to 4.5 tonne.
The ABS also categorises registered buses as:
• 2 axle with a GVM of less than 4.5 tonne
• 2 axle with a GVM of 4.5 to 12 tonne
• 2 axle with a GVM of over 12 tonne
• 3 axle with a GVM of over 12 tonne
• 3 axle articulated with a GVM of over 4.5 tonne.
In February 2020, the BIC undertook a significant analysis of the data from the ABS 2018 survey and 2019 census. Through this analysis, the BIC has been able to identify the number and types of buses being utilised by Industry to accurately reflect the current fleet on the road.
When extrapolating data from the ABS survey and census, the BIC has included registered ‘commercial-use’ buses, defined as a bus that:
• has a seat capacity (including the driver) of 12 seats or more (ie., not a C Class vehicle)
• is less than 26 years of age (eligibility criterion for government contracted services)
• is 4.5 GVM tonne and above.
The BIC analysis identifies 43,684 ‘commercial-use’ buses (Figure 2.2) operating in the bus and coach industry delivering public transport, school and other government contracted services, tour, charter, long distance and other commercial services.

2828 Moving People > Australian Bus and Coach Industry: a snapshot
Figure 2.1: Registered buses ABS 2019 – small, medium and large
59541
15189
30601
010000200003000040000500006000070000
Small Omnibus Medium Omnibus Large Omnibus
Num
ber o
f Bus
es
Small Bus: 9 to 15 seats including driverMeduim Bus: 16 to 25 including driverLarge Bus: 26 including driver and over
Registered buses - ABS Total - 105,331
Source: Australian Bureau of Statistics, 2019
Figure 2.2: ‘Commercial-use’ registered buses – under and over 12 tonne
Note: Based on BIC analysis of ABS 2019 not including small (mini) buses under 4.5 tonne GVM or buses 26 years of age or older.
NSW VIC QLD SA WA TAS NT ACT Total ByType
Medium Buses (under 12T GVM) 4640 3074 3818 1085 3463 578 586 148 17392Large Buses (over 12T GVM) 9042 5940 5043 1786 2911 684 427 459 26292
0
5000
10000
15000
20000
25000
30000
'Commercial-use' registered buses - total 43,684

2929Moving People > Australian Bus and Coach Industry: a snapshot
Market share of registered buses by state/territory
Close to three quarters (31,557) of the total number (43,684) of ‘commercial-use’ buses are registered in the eastern states NSW, Vic and Qld. Table 2.1 provides a break-down of these buses in 2019 by axle-type and GVM for all states/territories. 2 axle buses (41,004) accounted for the bulk of registered
buses on Australia’s road network. Of these 2 axle buses, 60% have a GVM of 12 tonne or more. The distribution of buses amongst states/territories in Australia is broadly proportional to the population split in the country (Figures 2.3 and 2.4). All states and territories (except NT) lie between 1.4 and 2.4 buses per 1,000 capita; the NT has 4 buses per 1,000 capita.
Table 2.1: Registered ‘commercial-use’ buses as at 31 January 2019
Note: Based on BIC analysis of ABS 2019 not including small (mini) buses under 4.5 tonne GVM or buses 26 years of age or older.
NSW VIC QLD SA WA TAS NT ACTTotal By
TypeBuses – 2 axle – over 4.5 to 12t GVM
4640 3074 3818 1085 3463 578 586 148 17392
Buses – 2 axle – over 12t GVM 8042 5483 4515 1500 2702 640 359 371 23612
Buses – 3 axle – over 12t GVM 747 418 463 113 104 18 68 47 1978
Buses/artic – 3 axle – over 4.5t GVM 253 39 65 173 105 26 0 41 702
Total 13682 9014 8861 2871 6374 1262 1013 607 43684
Less than 12t GVM 4640 3074 3818 1085 3463 578 586 148 17392
Over 12t GVM 9042 5940 5043 1786 2911 684 427 459 26292

3030 Moving People > Australian Bus and Coach Industry: a snapshot
Figure 2.3: Number of registered ‘commercial-use’ buses by state/territory
Note: Based on BIC analysis of ABS 2019 not including small (mini) buses under 4.5 tonne
13,682
9,014 8,861
2,871
6,374
1,262 1,013 6070
2,000
4,000
6,000
8,000
10,000
12,000
14,000
16,000
NSW VIC QLD SA WA TAS NT ACT
Registered 'commercial-use' buses less than 26 years of age
NSW has the largest fleet with approx. 4,500 more buses than either Qld and Vic.
Figure 2.4: Percentage of buses on register by state/territory
Note: Based on BIC analysis of ABS 2019 not including buses 26 years of age or more.
31%
21%20%
7%
15%
3% 2% 1%
Percentage of buses/coaches over 4.5 t on register by state/territory
NSW
VIC
QLD
SA
WA
TAS
NT
ACT

3131Moving People > Australian Bus and Coach Industry: a snapshot
2 .2 Number of registered buses based on fuel type and emissionsThe running of buses and coaches on Australia’s roads relies heavily on diesel with over 90% of the current fleet using that fuel (Table 2.2). The Other category in Table 2.2 (1.7%) includes natural gas buses which although originally hailed as an environmental alternative, suffered from reliability issues and higher maintenance costs. Hybrid and electric buses are also a new category which is quickly garnering interest around Australia.
Euro III emission standards were introduced in Australia for New Heavy Vehicles operating on diesel, LPG and compressed natural gas (CNG) in 2000 as part of Australian Design Rules (ADR) 80/00 (Emissions Control for heavy vehicles). There are at least 9,981 registered ‘commercial-use’ buses or coaches that are operating at Euro III or lower emissions standards. More commentary on emissions standards are provided as part of bus chassis deliveries in Section 1.3. 23% of Australia’s bus fleet is over 17 years old meaning they are meeting Euro III or less emission standards (Figure 2.10). Data on Australia’s ageing bus and coach fleet and its renewal is further discussed in Section 2.3.
Market share of fuel type and emissions compared across all transport
The average rate of fuel consumption varies widely between road transport modes (Figure 2.5). Across all sectors (excluding trucks), fuel consumption has reduced significantly. In the bus sector, fuel efficiency has improved
14% over the past decade to an average of 25.4 L/100km travelled for buses built after 2012. This figure varies between 18.4 L/100km for petrol buses, 25.7 L/100km for diesel buses and 24.6 L/100km for LPG/CNG/dual fuel/hybrid and other fuel types. For post-2000 vehicle models, diesel vehicles tend to be more fuel efficient than their petrol counterparts. It is worth noting that petrol efficiency is greater in the bus sector probably because the petrol fleet is geared towards smaller buses, whilst diesel powers full-size buses (including doubledeckers and articulated buses) and coaches.
In terms of greenhouse gas emissions, the transport sector contributes 97 million tonnes per annum of carbon dioxide equivalent (Figure 2.6). The majority (45%) of this is emitted by cars, followed by trucks (22%), light commercial vehicles (14%) then domestic aviation (9%). Buses emit just 2 million tons (or 2%) of enhanced greenhouse gases per annum. Railways emit double this amount at 4 million tonnes.
The emissions intensity of different passenger transport modes is considered in Figure 2.7. Public transport emits less than half that of private car by passenger kilometre transported, demonstrating the sustainable value of mode shifts. The bus figure presented is biased relatively downwards by long distance coaches, which have considerably better average efficiencies than most urban route buses. This is because coaches operate primarily in an economically deregulated market and they see higher passenger loadings per trip. City buses also face extra congestion and stop-start conditions which lead to substantially higher average fuel consumption rates than for non-urban use. The national rail level presented is biased upwards by the heavy use of lignite for electricity generation in Victoria. Across public transport modes, buses perform better on environmental emission terms than rail.
Table 2.2: Bus and coach fuel consumption by fuel type
Note: ABS (2019) data does not account for age of bus (a BIC analysis would normally exclude buses 26 years or older).
National heavy vehicle code Diesel Electric PetrolLPG/Dual
fuelOther
Buses – 2 axle – over 4.5 to 12t GVM 17629 3 494 40 5
Buses – 2 axle – over 12t GVM 22696 24 279 1683 13
Buses – 3 axle – over 12t GVM 2167 0 29 3 3
Buses – 4 axle – over 12t GVM 3 0 3 0 0
Buses/artic – 3 axle – over 4.5t GVM 727 0 8 34 767
Total 43222 27 813 1760 788
Source: Australian Bureau of Statistics (2019)

3232 Moving People > Australian Bus and Coach Industry: a snapshot
Figure 2.5: Road transport average rate of diesel fuel consumption (L/100km)
Note: ABS (2018) data includes all vehicles that have seated capacity of 9 or more including the driver.
0.0 10.0 20.0 30.0 40.0 50.0 60.0
Passenger vehicles
Light commercial vehicles
Rigid trucks
Articulated trucks
Non-freight carrying trucks
Buses
Passenger vehicles Light commercial vehicles Rigid trucks Articulated trucks Non-freight carrying trucks Buses2013 and after 11.4 12.1 28.3 55.4 17.3 25.72003 to 2012 11.3 12.5 28.9 55.5 27.9 29.92002 and earlier 14.8 12.1 28.9 52.7 25.3 35.0
Road transport average rate of diesel fuel consumption (L/100km)
2013 and after 2003 to 2012 2002 and earlier
Figure 2.6: Emissions in the transport sector by mode
0
5
10
15
20
25
30
35
40
45
50
Emissions by sector Mt CO2-e (2017)
Source: Department of the Environment and Energy, 2017

3333Moving People > Australian Bus and Coach Industry: a snapshot
Figure 2.7: Carbon dioxide emissions per passenger kilometre by private car and public transport modes (ITLS estimate from 2009-10 BITRE data)
0
50
100
150
200
250
Private car Public transport Bus/Tram Train
T-CO
2-e
Emissions per passenger kilometre by mode
Market share case study on bus versus rail emissions comparison
A popular conception is that urban passenger rail is more environmentally friendly than urban passenger bus. In Mulley et al. (2017), the full fuel cycle (and, where possible, vehicle cycle) for bus and rail is examined. The full fuel cycle refers to a complete accounting of emissions and energy use from primary feedstock extraction (such as crude oil production or coal mining) through to final energy use (including petroleum refining and distribution, or electricity generation and transmission). Energy use embodied in vehicle manufacture typically accounts for around 10% of the energy used for the operation of that vehicle over its average lifetime.
Figure 2.8 allocates the total fuel cycle emissions of each mode amongst its many core components. The higher component of upstream carbon emissions for rail as compared with in-vehicle for bus (both urban and non-urban) is evident.
Rail becomes far more competitive when comparing for a metropolitan scenario, which compares electric trains4 with urban bus (thereby removing the orange ‘areas’ from both graphs). Where generation sources are suitably renewable or low-carbon, electricity use will offer greenhouse gas abatement potential, but abatement is minimal in Australia where much of the country still relies heavily on coal-fired power stations. Substantial variations can even occur depending on whether base load or peak load generation is being drawn on (with the possibility of different power
4 Though some commuter trains in Adelaide remain diesel
stations coming on-line at different times to service varying demand levels). Comparative modal performance in real (passenger km) terms is also highly dependent on patronage levels. In summary, the research shows at a full fuel cycle that buses and rail are comparatively neutral and offer similar orders of average emissions abatement (per pkm) over car travel.

3434 Moving People > Australian Bus and Coach Industry: a snapshot
Figure 2.8 Comparison of modal emission totals for Australian bus use and rail transport, in gigagrams of full fuel cycle CO2 equivalent for 2015 Mulley et al., 2017—includes urban and non-urban bus
500
1,000
1,500
2,000
2,500
3,000
All Buses
All buses
Non-CO2 effects(direct andindirect)
Net upstreamCO2 (petroleumrefining,biodiesel andCNG supply)
In-vehicle CO2(estimated non-urban buscomponent)
In-vehicle CO2(estimatedurban buscomponent)
1,000
2,000
3,000
4,000
5,000
6,000
All Rail transport
All rail
Non-CO2 effects(direct andindirect)
Upstream CO2(electricitysupply)
Upstream CO2(petroleumrefining)
In-vehicle CO2(estimatedfreightlocomotives,diesel)
In-vehicle CO2(estimatedpassengerlocomotives,diesel)

3535Moving People > Australian Bus and Coach Industry: a snapshot
2 .3 Average Age of the bus fleetThe average age of Australia’s bus fleet is 10.9 years old with 29% of the fleet being 6 years old or less (Figure 2.9). 23% of the fleet remains 17 years old or more—in government contracted environments, these are usually dedicated to exclusive school and charter fleets. Figure 2.10 shows a detailed breakdown of average age in each state and territory. Figure 2.11 provides progressive average age of the bus fleet for each state and territory in 2012, 2016 and 2019.
Average age by state
Comparing between states and territories, most jurisdictions reflect the nationwide average split between buses and coaches of different ages (Figure 2.10). A particularly evident outlier is Tasmania where 40% of its fleet is 17 years or older. This will likely change with the injection of 100 new buses for Metro Tasmania awarded in 2017. Northern Territory reveals a significant new fleet injection with 37% built in the past 6 years, perhaps linked to privatisation and tendering in Darwin in 2014.
Figure 2.11 shows a comparison of average fleet age for all states and territories are below a 12-year average except Tasmania. ACT has the youngest (8.9 years) fleet age whilst Tasmania has the oldest (14.2 years). Figure 2.11 also shows that the major states (Qld, NSW, Vic) with three-quarters of Australia’s bus fleet, are on the approach to an average fleet age of 12 years.
Therefore a stipulated maximum bus age (for instance) of 25 years would have a large effect on the need for fleet replacement. Average and maximum fleet age requirements differ by state/territory as well as by service type (Table 2.3). There are hence opportunities to cascade vehicles used for type of service to another, with more relaxed vehicle age requirements. There are also links between the vehicle age specifications and the Disability Discrimination Act (DDA), which requires that 100% of general access buses be wheelchair accessible by 2022, with stipulated milestones along the way. Older vehicles do not meet easy access requirements and therefore weekend services are generally fully accessible since vehicle requirements are far lower and can be met with DDA-compliant fleet. As part of DDA compliance, bus stops also need to be upgraded and so in many jurisdictions this has offered itself as an opportunity to rationalise and optimise stop spacing and placement (including for trams).
Further, based on average in service conditions, bus engines require large-scale repairs after 10-12 years, after which time they continue to be useful for an extended period of time. Given the current regulation for fleet replacement, many buses which have entered retirement from contracted services in these circumstances (state of repair) are still used for charter work at less intensity. Bus operators undertaking charter work have also been shown to be more cost efficient (Hensher, 2015). Older fleets can also be used to serve a supplementary top up function in peak periods.
Figure 2.9: Buses on register by age
Note: Based on BIC analysis of ABS 2019 not including small (mini) buses under 4.5 tonne GVM or buses 26 years of age or older.
23%
18%
30%
29%
All Buses over 4.5 t GVM Age Profile 2019
17 to 26 years
12-16 years
7-11 years
0-6 years

3636 Moving People > Australian Bus and Coach Industry: a snapshot
Figure 2.10: Buses on register by age and state/territory of registration
Note: Based on BIC analysis of ABS 2019 not including small (mini) buses under 4.5 tonne GVM or buses 26 years of age or older.
3,622 2,3781,503
737990
499
18072
2,307 1,877
1,895
507
905
217
205
90
3,839 2,079 3,174966
2,087
355
251213
3,914 2,680 2,289 661
2,392
191
377 232
0%
10%
20%
30%
40%
50%
60%
70%
80%
90%
100%
NSW VIC QLD SA WA TAS NT ACT
Age of bus/coach fleet by state/territory (2019)
17 to 26 years 12-16 years 7-11 years 0-6 years
Reducing the Age of the Australian Bus and Coach Fleet and Why
The age of the Australian bus and coach fleet is a matter requiring a coordinated national approach between federal, state and territory governments as the BIC outlined in its 2019 Federal Election Primer (see Section 6.1).
The reality is, 23% of the Australian bus fleet is 17 years or older and operate with Euro III or less emission standards. This reflects a large percentage of the fleet performing the passenger task in vehicles that:
• have lower emission performance (that being buses with Euro III or less emission standards)
• offer very little in the way of modern safety and comfort features for passengers compared with new buses
• detract passenger attraction to use the ‘safest’ public transport or school bus services
• does not address greenhouse and other emissions from the bus fleet.
The average age of the public transport and school bus fleet should be 12 years with a maximum age of 25 years. It is important that the integrity of the bus frame at 20 years is assured by industry best-practice maintenance regimes.
Fleet utilisation and return on investment for governments is best delivered through high levels of service delivery and frequency. The expenditure or cost of investment in low emission buses to achieve an average fleet age of 12 years will also:
• lower bus emissions and improve bus safety
• improve passenger comfort
• increase patronage
• support growth of local manufacturing and heavy vehicle automotive manufacturing.
The benefits far outweigh the capital cost of new buses and should be a priority issue for the federal, state and territory governments to address.
Best-practice maintenance for bus frame integrity
1. Undertaking a detailed external inspection that assesses signs of underfloor frame cracking, flooring deterioration and external panel delamination and or visible signs of corrosion staining on exterior and interior panels/joints. If there are signs of such issues, then a suitably qualified person may require some panel removal to assess the frame.
2. An endorsed maintenance regime that conducts annual detailed bus body inspections and addresses issues on an ongoing basis.

3737Moving People > Australian Bus and Coach Industry: a snapshot
Figure 2.11: Average age of bus/coach fleet by state/territory
Note: Based on BIC analysis of ABS 2019 not including small (mini) buses under 4.5 tonne GVM or buses 26 years of age or older.
NSW VIC QLD SA WA TAS ACT NT2012 14.60 14.66 13.00 13.87 12.75 16.11 12.47 13.542016 12.55 12.35 11.37 12.31 10.65 15.07 10.28 10.802019 11.38 11.36 10.61 11.51 9.14 14.19 8.95 10.04
10
11
12
13
14
15
16
17Average age of bus/coach fleet by state/territory (2019)
2012 2016 2019
Table 2.3: Average and maximum age requirements for buses by state/territory and service type
State Service Type Average Age Maximum Age
New South Wales All 12 years 25 years
Victoria All None None5
Queensland Open/Regional/Local classifications None 25 years
South Australia All None 25 years
Western Australia All
Tasmania
General access route 12 years 20 years
School fare paying 20 years
School non-fare paying 25 years
School <25 seats 10 years
Northern Territory All
Australian Capital Territory All
5 None but buses generally replaced after 18.5 years

3838 Moving People > Australian Bus and Coach Industry: a snapshot
M
OVING PEOPLE
THEOPERATORS

3939Moving People > Australian Bus and Coach Industry: a snapshot
Bus Operations3. Who operates the buses on the roadsOver several decades, the bus and coach industry has consolidated, with a fundamental shift from generational family-based bus companies in our cities to national and multinational businesses, especially in metropolitan areas. With contract reform, many smaller players have shifted their focus to being sole providers of charter service, no longer continuing route work. In rural and regional Australia, however, family businesses still predominate. The NTC (2016) estimates that more than 3,000 bus companies are operating across Australia servicing towns and regions, tour and charter services and major cities, and most are small to medium sized businesses. This is consistent with the data presented in Table 3.1 which provides estimates on the number of accredited operators in each state and territory.
The largest operators (in terms of fleet size and number of depots) are concentrated amongst metropolitan Australia. Table 3.2 provides detail of all large operators with a fleet size near-to 200 or more. As an aggregate, this equates to more than 40% of all ‘commercial-use’ buses (43,684) on Australia’s roads. The top 10 in this group represent nearly 70% of the entire group of 22.
Table 3.2 indicates that the private sector of public bus transport is the predominant player in this group of large operators and indicates that government bus fleets make up a fraction (7.6%) of the total number of ‘commercial-use’ buses on our roads. In this group of large operators, there are 4 multinationals with 16.04% share of ‘commercial-use’ buses and 18.95% spread across several national private companies. Over the past decade, acquisitions by national and multinational companies are making them larger and further consolidating industry.
An analysis of registered coaches on Bus Australia Fleet Lists [February 2020] and Industry Surveys [February, April and October 2020] indicates the following major operators providing national coach and charter services: Greyhound Australia (243), Murrays Australia (196), AAT Kings (96). Airport operators include Carbridge (104), which specialises in transport between terminals and carparks and Skybus (107) which provides services between airport and city. There are a number of other large operators providing coach and charter services intra-region and inter-region including Nuline/Bayside (107) servicing Sydney, Melbourne, ACT and Northern Territory regions, Premier Transport Group (125 of its 597 Fleet) providing services spanning the Eastern seaboard from Eden to Cairns and Port Stephens Coaches (61) operating in Port Stephens, Newcastle and Sydney.
Table 3.1: Estimate of bus operators by state/territory and service type
(ITLS and the BIC correspondence with state/territory governments and members of the Bus Australia Network)
Number of operators
NSW VIC QLD WA SA TAS ACT NT
Metro/Outer 17 13 17 3 3 2 1 2
Rural/Regional 530 46 18 3 7 11 5
Coach/Charter 800 8 55
Contracted Coach6 21 6 569
School 547 380 512 821 46 134 4 7
ALL 1,894 460 553 1396 64 147 60 14
6 Examples include NSW TrainLink and V/Line

4040 Moving People > Australian Bus and Coach Industry: a snapshot
Table 3.2: Largest bus operators in Australia by fleet size (as at October 2020)
Operator Depots Fleet
Transit Systems Australia 33 2681
ComfortDelGro Corporation Australia 45 2461
Transdev Australasia 22 1,735
State Transit (NSW) 8 1,419
Transport for Brisbane 7 1223
Keolis Downer 24 975
Busways Group 18 923
Australian Transit Group 15 900
Kinetic Group 18 893
Ventura Bus Lines 12 893
Dyson Group 11 600
Premier Transport Group 13 597
Dineen Group 14 591
Transport Canberra 2 452
The Pulitano Group 6 419
Buslines Group 13 380
Christians Bus Company 8 325
The Donric Group 11 270
Greyhound Australia 10 243
Metro Tasmania 3 220
McHarrys Buslines 1 210
Murrays Australia 8 196
Source: Bus Industry Confederation, Industry Survey, October 2020

4141Moving People > Australian Bus and Coach Industry: a snapshot
3 .1 The service provided by the bus operatorServices provided by the bus operator is categorized into 4 groups of bus tasks:
• Route services
• School services
• Charter services
• Long Distance services.
The bus and coach industry in Australia is predominantly based around the provision of school bus and public transport (route) services that are provided under state and territory government contractual arrangements. These contracted services are primarily provided by privately owned international and domestic bus and coach businesses. Some services continue to be government owned. The industry also provides services in the special school transport, and emerging markets such as aged care and community transport and health and para-transit markets, that are government contracted or privately contracted. The bus and coach industry also provide services, in what might be termed, the ‘deregulated’ market providing charter, tourism, long distance, mining, correctional and other niche transport services that support other industries.
Recent times have seen a period of transition and disruption of traditional transport service provision such as Uber and other demand responsive personalised transport enablers. The bus and coach industry has not been isolated from this disruption and has been active in exploring new areas of transport service connectivity, as technology enablers themselves (or in partnership with technology companies and other transport service providers), delivering a range of vehicles, beyond the traditional bus service, including shared bikes and scooters for example.
These service delivery issues are further discussed in Sections 6 to 11 of this report and in a number of publications from the BIC Moving People – Solutions for Policy Thinkers series (see Appendix 1).
According to the ABS Survey of Motor Vehicle Use (2018), contracted route services represent the most intensely utilised vehicles, at 48,900 km per annum (Figure 3.1). This is followed by charter activity, where coach and contracted government bus operators utilise their vehicles outside of contract service arrangements. Dedicated school services follow, and as stated, are often the sole focus for many smaller operators, particularly in rural/regional Australia. In a metropolitan context, however, the same fleet is often mixed between route, school and charter work. Other services see the lowest fleet utilisation, and according to the ABS, includes trips free of charge as well as tours. Therefore, it includes a large amount of community transport activity and disparate activities (e.g., church outings). Under this definition, it would also include services such as Central Area Transit (CAT) in WA (specifically Perth, Freemantle and Joondalup), CityGlider in Brisbane CBD and Adelaide Free City Connector buses, which are all free of charge.
All of these services are fully subsidised free services by government, operating in central CBD areas of capital cities operating in peak business hours throughout the day and early evening with extremely good patronage levels; although this is hard to measure in some cases as no passenger data is collected through tap on and tap off requirements and is an area to better collect patronage data and understand the success of these regular non-timetabled CBD free services.
On a state-by-state absolute comparison (Figure 3.2), the ACT, SA, WA and NSW have the highest proportion of service kilometres (40-65%) dedicated to route services. The NT (9%), WA (16%) and Queensland (17%) show a comparatively low proportion of dedicated school services compared with the rest of the group average of 23%. The charter proportion is greatest in SA (34%) and Queensland (25%). The NT is overrepresented in the Other category showing 64% of its total kms travelled. Tasmania shows the least variance across all 4 categories (between 21% and 26%).
On a nationwide level, route services accounted for 35% of all vehicle kilometres travelled (Figure 3.3). This was followed by school (20%), then charter and other (both 18%) and tours (3%). The majority of vehicles for route, school and tour services are buses with 20 or more seats. The exceptions are charter and other category services, where smaller vehicles (fewer than 20 seats) dominate, which may suggest these categories being largely represented by community transport and the like.
Under the ABS 2018 survey, a high proportion (18%) is accounted in the Other category representing 419 million kilometres travelled per annum which indicates insufficiency in the present categorisation. Therefore, it would be useful for industry with state governments to look at obtaining better information by seeking the ABS to ask more pertinent questions as part of the Survey of Motor Vehicle Use.

4242 Moving People > Australian Bus and Coach Industry: a snapshot
Figure 3.1: Average kilometres travelled bus/coach in a 12 month period by service type (30 June 2018)
Note: Figures are based on ABS definition of a bus (see Section 2.1)
48,900
18,00023,600
14,200
0
10,000
20,000
30,000
40,000
50,000
60,000
Route service Dedicated school Charter service Other
Average kilometres travelled bus/coach by service type (2018-2019)
Source: Australian Bureau of Statistics, 2018
Figure 3.2: Total bus/coach kilometres travelled in a 12 month period by service type (30 June 2018)
Note: Figures are based on ABS definition of a bus (see Section 2.1)
258175
160
12560
15
22
22
149
122
95
4427
12
9
6
111
75141
26
44
13
2
13
111122 117
75
11
13
5
44
0%
10%
20%
30%
40%
50%
60%
70%
80%
90%
100%
NSW VIC QLD WA SA TAS ACT NT
Total kilometres travelled by service type for 12 month period (30 June 2018)
OtherCharterSchoolRoute
Source: Australian Bureau of Statistics, 2018

4343Moving People > Australian Bus and Coach Industry: a snapshot
Figure 3.3: Total kilometres travelled in a 12 month period by service and vehicle type (30 June 2018)
Note: Figures are based on ABS definition of a bus (see Section 2.1)
279 342
796
397
610
100
200
300
400
500
600
700
800
900
Route service School service Charter service Tour service Other
Mill
ions
Total kilometres travelled over a 12 month period by service and vehicle type (30 June 2018)
Buses with fewer than 20 seats Buses with 20 or more seats
Source: Australian Bureau of Statistics, 2018
3 .2 Road use by the busAustralia has around 1 million kms of roads, which because of the distances of the continent vary significantly in terms of quality. Some are federally supported whilst others are funded by state or local jurisdictions. Buses and coaches make up a small but important component of the total vehicle kilometres (vkm) travelled each year. Data in this Section is sourced from the ABS (2018) Survey of Motor Vehicle Use.
According to the ABS Survey, buses and coaches traversed 2.2 billion vkm or 0.9% of the total 255 billion km travelled by all vehicles in the 2017-2018 period. Figure 3.4, however provides an adjusted figure of 1.24 billion vkm (0.004% of total) to roughly account for the variable of 45% of ABS registered buses that can be accurately attributed as commercial-use buses. Passenger vehicles make up the overwhelming majority of road-use at 70.9% with light-commercial following at 20.54% and trucks at 7.14%. There is very little variance in the percentage spread of total vkms (2.49 billion) across all road vehicles for the 2015-2016 period.
The ABS survey (non-adjusted) for the 2017-2018, shows 50% of total vkms was undertaken in capital cities (Figure 3.5). The remaining 39% of intrastate travel was shared between other urban areas and other (rural/regional) areas and 12% of travel occurred interstate.
On an average per vehicle basis, capital city buses/coaches travel the most kilometres, delivering service around the clock (Figure 3.6). For many larger operators, a run may even cross multiple shifts (through hotseat scheduling), whereas in rural areas buses may only be active for as long as a driver’s shift. Interstate services travel the least kilometres on average (despite the far lengthier journey distances involved), hence indicating a greater proportion of time vehicles spend idle. The latest data from the ABS (2020) survey shows that the average annual kilometres travelled by a bus is 24,600.

4444 Moving People > Australian Bus and Coach Industry: a snapshot
Figure 3.4: Total kilometres travelled by road vehicle type in a 12 month period (end June 2018)
Note: ABS registered bus numbers have been adjusted to accurately reflect industry-defined registered commercial-use buses.
- 50.00 100.00 150.00 200.00
Passenger vehicles
Motor cycles
Light commercial vehicles
Rigid trucks
Articulated trucks
Buses
Billions
Total kilometres travelled by road vehicletype in a 12 month period (end June 2018)
Source: Australian Bureau of Statistics, 2018
Figure 3.5: Total bus/coach kilometres travelled in a 12 month period by area of operation (end June 2018)
Note: Figures are based on ABS definition of a bus (see Section 2.1)
56%
18%
23%
3%
Bus/coach kilometres travelled by area of operation in a 12 month period (end June 2018)
Capital city
Other urban areas
Other areas
Interstate
Source: Australian Bureau of Statistics, 2018

4545Moving People > Australian Bus and Coach Industry: a snapshot
Figure 3.6: Average bus/coach kms in a 12 month period by area of operation (end June 2018)
Note: Figures are based on ABS definition of a bus (see Section 2.1)
0
5,000
10,000
15,000
20,000
25,000
30,000
Capital city Other urban areas Other areas Intrastate Interstate
Average kilometres travelled bus/coach by area of operation in a 12 month period (end June 2018)
Source: Australian Bureau of Statistics, 2018

4646 Moving People > Australian Bus and Coach Industry: a snapshot
3 .3 The costs of operating a bus or coach businessRunning buses and coaches is a costly and low margin business. Whilst there is immense variability in capital and operating costs, ballpark figures have been estimated by the Transport and Infrastructure Council (ATAP, 2017). These are regularly used for transport planning purposes, including in project appraisal and cost benchmarking.
The capital cost of a bus
ATAP (2017) estimates the purchase price and equivalent annual capital cost for a number of modes and vehicle types (Table 3.3). The nominal capacity of each vehicle type is based on manufacturer’s specifications and the assumption of 4 standees per square-metre of usable floor area (in metropolitan operations). Crush capacity can be double this figure but on buses is typically lower (down to 2.5/m2) due to the narrow aisles. In some cities (e.g., Canberra), longitudinal seating is being trialled to enhance standing capacity (as typical in many Asian cities).
Mini-buses (8 metres long) and midi buses (10 m) represent poor value for money as compared with standard sized buses. These lighter duty buses also typically see a shorter economic life. This has implications for the growth of on demand public transport as a substitute for fixed route services (See Section 10.2). Longer rigid buses (14.5 m), often with a steerable tag axle to minimise the turning radius required, represents the better value for money than standard rigid (12.5 m) and articulated buses (18 m). However, double-decker buses (12.5 m) are most cost effective in terms of annual cost per passenger capacity. At the time of publication of this report, Sydney is phasing out its articulated fleet in favour of double-decker buses which will bring cost savings, although the impetus is to reduce the road space required per passenger transported in the CBD. Gas buses7 are costly to procure and run, but not as much as rail modes. The far higher cost per passenger capacity of light rail as compared with heavy rail (and bus) is worth noting and serves as a warning against the preference for light rail over bus, based on ideological reasoning (Hensher, 1999).
7 Usually CNG but also LNG; LPG is rare in heavy duty applications. Note that the gap between gas engines and diesel has narrowed in recent years in terms of tailpipe emissions.
A key and central factor in the cost of operating bus and passenger services is the largest cost, that being the labour, the driver.
The capital cost of a large bus is higher than that of a smaller bus and as such smaller buses have been primarily been selected to operate on demand and first and last mile services based on the assumption that a large bus carrying “air”, meaning only a few passengers are better replaced by a small bus. However, this seems to be proving a false assumption based on labour cost and increased operating technology development and operational costs; and in some cases no increase in passenger demand and in others patronage growth requiring large buses to meet demand.
Serious consideration is required in relation to the size of buses to operate ‘emerging’ on demand styled services that takes into account that larger buses (in not meeting patronage requirements in an on demand service operation) can be more easily re-allocated to peak services.
As outlined in th BIC Federal Election Primer 2019 (see Section 6), on demand service might be better dealt with by improving the frequency and span of hours of operation of traditional services with on demand off peak services primarily left to operators to negotiate with Government on how to best integrate these with the existing traditional bus service offering. See Table 6.1 on Turn Up and Go Minimum Service Levels.

4747Moving People > Australian Bus and Coach Industry: a snapshot
Table 3.3: Typical capacities and capital costs by mode and vehicle type based on mid-2014 prices
Mode or Vehicle type
Capacity (Seated plus standees)
Cost per vehicle or consist
Economic lifeEquivalent
annual capital costs8
Annual cost per passenger
capacity9
Bus (Diesel)
Mini 19 $140,000 10 $18,800 $990
Midi 48 $340,000 20 $33,100 $810
Rigid standard 65 $430,000 20 $41,800 $730
Rigid long 78 $500,000 20 $48,700 $720
Articulated 90 $650,000 20 $63,300 $810
Double decker 100 $680,000 20 $66,600 $710
Bus (Gas)
Rigid standard 65 $520,000 20 $51,500 $900
Light rail
Bi-articulated 218 $5,000,000 35 $389,100 $2,160
Heavy Rail
3-car EMU 550 $9,000,000 35 $705,400 $1,500
Source: Australian Transport Assessment and Planning Guidelines, 2017
8 Includes rehabilitation or mid-life refurbishment cost (not shown)—typically at 12 years for buses and 20 years for trains, costing 10-15% of new vehicle cost. Calculations based on 7% discount rate per annum.
9 Allows for spare vehicles, typically 10% of peak vehicle requirements.

4848 Moving People > Australian Bus and Coach Industry: a snapshot
Comparative operating costs of the bus vs other public transport modes
The operating costs of public transport represent the highest component of total costs of running the business. (ATAP, 2017) divides operating costs into five broad categories, including:
• On-vehicle crew costs—Direct costs for on-vehicle staff (drivers, guards, etc.), including wage costs and on-costs such as payroll tax and superannuation
• Vehicle (direct operating) costs—Covers vehicle fuel and power, vehicle maintenance (labour, parts, outside services) and tyres
• Infrastructure operations and maintenance costs—Relates to right-of-way infrastructure such as tracks, signalling, power supply and communications systems (not applicable for bus operations since roads are government-provided, even for bus rapid transit in Australia)
• Overhead (operating) costs—Includes operations overheads (scheduling, rostering, depot-staff), vehicle maintenance overheads (engineering services), head office costs (management) and general labour and non-labour overheads (computer systems, human resources, insurance)
• Profit margin—Represents the amount a commercial operator can be expected to receive to compensate for the risks of being in business. It is a legitimate opportunity cost included in economic appraisals.
Table 3.4 estimates the operating costs in each category for buses, light rail and heavy rail in Australia. Bus crewing costs are lowest but have the highest overheads proportionally as compared to light and heavy rail. The costs for different bus vehicle sizes (from mini to double-deck) do not vary except in the category of direct vehicle operating costs, where there are fuel savings. The crewing costs for rail are significantly higher than bus not only due to additional crew required, but also less flexibility in crew deployment (with less proportion of hours worked operating in service) as well as wage differentials. The profit margin has been suggested at 5% for bus as compared to 4% for rail. Another point of variability is on the ownership structure and contracting regime for the said transport operation. Australian experience since the 1990s have found 25-30% cost savings when government monopolies have been competitively tendered (Hensher and Wallis, 2005, Bray and Wallis, 2008, Wallis and Bray, 2014).
3 .4 Operating cost efficiencies and effectiveness of a bus operationThe two concepts of efficiency and effectiveness may be considered in this Section (Table 3.5). Efficiency (doing the things right) may be considered in costs per vehicle/service kilometre terms as intermediate outputs in the supply chain. Effectiveness (doing the right things) on the other hand, is a productivity measure which may be related to passenger kilometres/trips delivered per vehicle kilometre. The latter recognises that whilst minimising costs is important, the end objective of public transport is to move people (not just vehicles) for a given budget.
Table 3.4: Operating costs of each mode by category, based on mid-2014 prices
Cost category Units Bus (Diesel) Light rail Heavy rail
On-vehicle crew $ per train/bus-hour 44 87 320
Direct vehicle operating costs $ per train/bus-km 1.05 3.00 5.20
Infrastructure operations and maintenance
$ per annum per track-km N/A 100,000 170,000
Overhead costs % on other operating costs 25.0 17.5 15.0
Profit margin % on total operating costs 5.0 4.0 4.0
Source: Australian Transport Assessment and Planning Guidelines, 2017
Table 3.5: The concepts of efficiency and effectiveness as it relates to bus and coach operations
Inefficient Efficient
IneffectivePursuing the wrong goals (e.g., satisficing behaviour) for very high cost
Blind pursuit of cost minimisation at the expense of customer experience and network effectiveness
EffectiveAchieving the right goals (e.g., maximising patronage) but at high cost
Doing the right things right—maximising patronage and enhancing mobility cost effectively

4949Moving People > Australian Bus and Coach Industry: a snapshot
Cost efficiency of a bus operation
To measure the cost efficiency of bus operations, there is a need to identify the features of service provision that incur a disproportionate cost impact on an operating region, and are in effect the reality of operating in that specific jurisdiction of which the operator has no effective control over. It is therefore necessary to recognise and account for these differences in a process called normalisation (not to be confused with standardisation) to make valid comparisons. Herein lies the difference between the actual gross cost and normalised net cost of bus operations.
In the context of metropolitan and outer metropolitan bus operations in Australia, the main influences that are outside of the control of an operator are: (i) the speed on the road (the result often of traffic congestion, but also road alignments including traffic lights and level of bus priority), (ii) the amount of in-service kilometres you can get out of each bus each year (called bus utilisation, and influenced by depot location), which impacts on the amount of capital and hence capital cost, and (iii) the spread of service hours, which can be defined to describe the proportion of service hours on evenings and weekends when higher labour costs associated with penalty rates typically are incurred.
The average gross and net cost per in-service kilometre is compared for bus operators for Sydney (Metro and Outer Metropolitan), Brisbane, Perth and Adelaide (Figure 3.7). Government operators have been deliberately excluded from the sample, whose labour costs are generally 25-40% higher due to more rigid work practices, and the high number of staff-to-bus ratio (ATAP, 2017). In competitively tendered metropolitan Sydney, gross costs are high due to congestion but on a net cost basis the bus operators are more effective than in outer metropolitan Sydney, where bus contracts are negotiated. Net cost in Brisbane is significantly higher than gross cost, reflecting typically higher average speeds and higher bus utilisation, probably attributable to the bus priority afforded by its busway system. Bus services in Perth are the most expensive to procure based on this analysis. The average cost for metro/outer bus operators in Australia for 2017 was $4.58 per service kilometre.
These results indicate that costs are highly influenced by factors outside the control of the operator and therefore costs must be normalised to account for all these factors in any comparison between operators and cities. There exists also a great degree of variability between operators, consistent with international experience from developed economies showing that the operating cost per kilometre range can differ by up to a factor of two amongst different operators within a particular country (Stanley, 2018).
Figure 3.7: Gross and net cost per service kilometre compared across Australia
$0
$1
$2
$3
$4
$5
$6
$7
SMBSC Private OSMBSCPrivate
Brisbane Perth Adelaide AVERAGE
Cost per service kilometre by city (2017 estimate)
Gross cost Net cost
ITLS estimate for 2017 based on data collated 2010-2011, Hensher 2015p

5050 Moving People > Australian Bus and Coach Industry: a snapshot
Cost effectiveness of a bus operation
The effectiveness or productivity of the bus and coach industry can be assessed by comparing passengers carried and vehicle kilometres travelled. Table 3.6 shows that buses and coaches carried more passenger kilometres per vehicle kilometre (a measure of productivity) on a nationwide average than for capital city travel alone. This hints that the longer distances passengers travel on non-metropolitan services more than compensate for the higher passenger turnover on capital city services. Further, the vast majority of rural/regional services are also scheduled for school children (with no service at other times), making them more productive than metropolitan operations (where there is service around the clock, with the bus being full only in the peaks). Bus and coach productivity may also be evaluated by comparing performance on a passenger trip basis. Passenger boarding data from Table 4.1 (Section 4.3) may be compared with total vehicle kilometres travelled to obtain a trip-based productivity measure.
Table 3.7 disaggregates this productivity measure by state/territory and shows huge differences between jurisdictions. The caveat is that some states lack reliable school student travel information (which account for a large proportion of patronage), and further any charter or non-contracted activities are generally excluded from passenger counts, so any interpretation should be made with caution. What is important is not the absolute values in the productivity measure, but rather the relativity between states/territories, assuming similar proportions of charter and other non-categorised services in
each jurisdiction. NT is the worst performer due to the size of the territory, low density and dispersed nature of travel (being the least urbanised out of any state/territory). This is followed by Tasmania, which also suffers from unique geographic constraints. The ACT records the best productivity, although this is not a fair comparison since it is only capturing one metropolitan area (Canberra) with limited rural trips. The other large states all record relatively similar productivity levels or the effective allocation of vehicle kilometre resources (around 0.3-0.4 trips/VKT).
With more complete data and suitable capture of locational effects through normalisation, it is possible to combine efficiency and effectiveness metrics to measure the cost of productive bus and coach operations. This exists as the ultimate objective in “doing the right things right” (Table 3.5)—maximising patronage and enhancing mobility cost effectively. Such assessment lies beyond the scope of the present analysis.
Recommendation on data gaps and cost efficiency and effectiveness
The BIC recommends - for consideration of jurisdictions, bus operators, and ideally data and information technology companies – a national approach to collating this data, taking into account the idiosyncrasies of freqeuncy and coverage of bus operations in jurisdictions.
Table 3.6: Productivity comparison by passenger kilometre intensity for 2016-17 (ITLS estimate from BITRE/ABS data)
Passenger kilometres travelled (PKT)
Vehicle kilometres travelled (VKT)
Productivity measure (PKT/VKT)
National 21.61 billion 2.46 billion 8.78
Capital City 7.13 billion 1.33 billion 5.36
Table 3.7: Productivity comparison by state/territory by passenger trip intensity for 2016-17 (ITLS estimate from BITRE/ABS and state/territory-provided data).
Note (*) indicates that school trips were excluded from the patronage measure in these states
Patronage (Passenger trips)
Vehicle kilometres travelled (VKT)
Productivity measure (Trips/VKT)
NSW 281 million* 729 million 0.39
VIC 131 million* 506 million 0.26
QLD 164 million 558 million 0.29
WA 93 million 281 million 0.33
SA 58 million 130 million 0.45
TAS 10.0 million* 58 million 0.17
ACT 18.3 million 34 million 0.54
NT 6.4 million 69 million 0.09
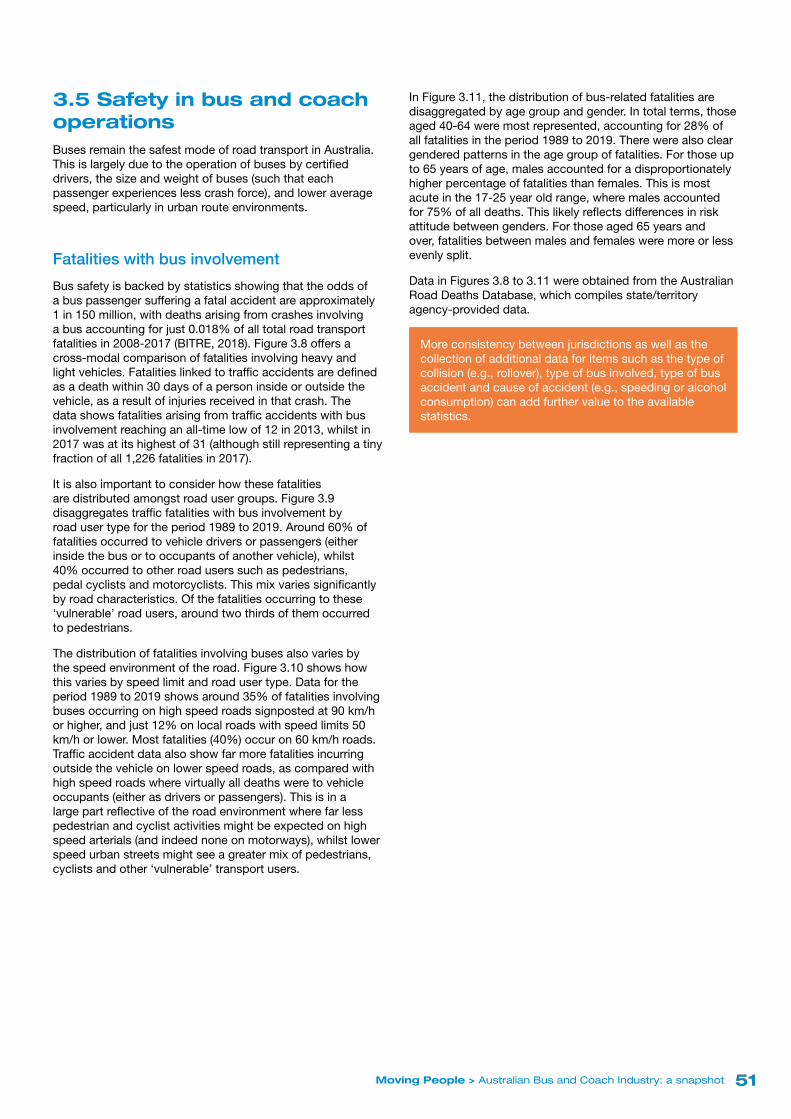
5151Moving People > Australian Bus and Coach Industry: a snapshot
3 .5 Safety in bus and coach operationsBuses remain the safest mode of road transport in Australia. This is largely due to the operation of buses by certified drivers, the size and weight of buses (such that each passenger experiences less crash force), and lower average speed, particularly in urban route environments.
Fatalities with bus involvement
Bus safety is backed by statistics showing that the odds of a bus passenger suffering a fatal accident are approximately 1 in 150 million, with deaths arising from crashes involving a bus accounting for just 0.018% of all total road transport fatalities in 2008-2017 (BITRE, 2018). Figure 3.8 offers a cross-modal comparison of fatalities involving heavy and light vehicles. Fatalities linked to traffic accidents are defined as a death within 30 days of a person inside or outside the vehicle, as a result of injuries received in that crash. The data shows fatalities arising from traffic accidents with bus involvement reaching an all-time low of 12 in 2013, whilst in 2017 was at its highest of 31 (although still representing a tiny fraction of all 1,226 fatalities in 2017).
It is also important to consider how these fatalities are distributed amongst road user groups. Figure 3.9 disaggregates traffic fatalities with bus involvement by road user type for the period 1989 to 2019. Around 60% of fatalities occurred to vehicle drivers or passengers (either inside the bus or to occupants of another vehicle), whilst 40% occurred to other road users such as pedestrians, pedal cyclists and motorcyclists. This mix varies significantly by road characteristics. Of the fatalities occurring to these ‘vulnerable’ road users, around two thirds of them occurred to pedestrians.
The distribution of fatalities involving buses also varies by the speed environment of the road. Figure 3.10 shows how this varies by speed limit and road user type. Data for the period 1989 to 2019 shows around 35% of fatalities involving buses occurring on high speed roads signposted at 90 km/h or higher, and just 12% on local roads with speed limits 50 km/h or lower. Most fatalities (40%) occur on 60 km/h roads. Traffic accident data also show far more fatalities incurring outside the vehicle on lower speed roads, as compared with high speed roads where virtually all deaths were to vehicle occupants (either as drivers or passengers). This is in a large part reflective of the road environment where far less pedestrian and cyclist activities might be expected on high speed arterials (and indeed none on motorways), whilst lower speed urban streets might see a greater mix of pedestrians, cyclists and other ‘vulnerable’ transport users.
In Figure 3.11, the distribution of bus-related fatalities are disaggregated by age group and gender. In total terms, those aged 40-64 were most represented, accounting for 28% of all fatalities in the period 1989 to 2019. There were also clear gendered patterns in the age group of fatalities. For those up to 65 years of age, males accounted for a disproportionately higher percentage of fatalities than females. This is most acute in the 17-25 year old range, where males accounted for 75% of all deaths. This likely reflects differences in risk attitude between genders. For those aged 65 years and over, fatalities between males and females were more or less evenly split.
Data in Figures 3.8 to 3.11 were obtained from the Australian Road Deaths Database, which compiles state/territory agency-provided data.
More consistency between jurisdictions as well as the collection of additional data for items such as the type of collision (e.g., rollover), type of bus involved, type of bus accident and cause of accident (e.g., speeding or alcohol consumption) can add further value to the available statistics.

5252 Moving People > Australian Bus and Coach Industry: a snapshot
Figure 3.8: Heavy vehicle fatalities grouped by vehicle type, against total number of road fatalities 2008-2017
0
200
400
600
800
1,000
1,200
1,400
1,600
0
20
40
60
80
100
120
140
160
2008 2009 2010 2011 2012 2013 2014 2015 2016 2017
Fatalities involving heavy vehicles (2008-17)
Articulated truck Heavy rigid truck Bus Total fatalities (right)
Source: BITRE, 2018
Figure 3.9: Fatalities with bus involvement, segmented by road user type (1989-2019)
26%
33%9%
5%
27%
Bus-involved fatalities by road user type (1989-2019)
Driver
Passenger
Motorcyclist
Pedal cyclist
Pedestrian
Source: BITRE, 2019

5353Moving People > Australian Bus and Coach Industry: a snapshot
Figure 3.10: Fatalities with bus involvement, segmented by speed environment (1989-2019)
050
100150200250300350400
10 20 30 40 50 60 70 75 80 90 100 110
Coun
t of t
atal
ities
Speed environment (km/h)
Bus-involved fatalities by speed environment and road user type (1989-2019)
Driver/Passenger Other road user
Source: BITRE, 2019
Figure 3.11: Fatalities with bus involvement, segmented by age and gender (1989-2019)
0
50
100
150
200
250
300
0-16 17-25 26-39 40-64 65-74 75+
Coun
t of f
atal
ities
Age group of fatality
Bus-involved fatalities by age and gender (1989-2019)
Male Female
Source: BITRE, 2019

5454 Moving People > Australian Bus and Coach Industry: a snapshot
Fire incidents involving buses
There exists a number of recurrent issues in bus safety beyond crude measures of traffic accidents and fatalities. Whilst there are no national statistics documenting bus fires, data from the bus insurance industry suggests at least 70 bus fires per year (more than one per week) in Australia in which a bus is either partially or totally destroyed. State level data are more forthcoming. The NSW Office of Transport Safety Investigations (OSTI, 2018) reported 101 incidents in 2018, consisting of 14 bus fires and 87 thermal incidents, and represent an increase of 12% from 2017. Most incidents originate from either the engine bay or the wheel well (linked to brakes). Interestingly, bus fires and thermal incidents are evenly distributed throughout the year (not just in hot summer months), and the majority involved buses between 5 to 11 years old (hence not the oldest nor newest fleet). Different makes of bus have all been involved and there were no particular trends in the chassis manufacturer identified. In most cases, the bus driver was made aware of the fire by passengers and other motorists. Given the increasing rate of bus fires over the past decade, jurisdictions such as NSW have now mandated the installation of engine bay fire suppression onboard all TfNSW-contracted buses.
In March 2019, the Bus Industry Confederation (BIC) published an Advisory on Bus Fire Evacuation Protocols. The Advisory was developed as part of a safety project funded by the federal government through the Heavy Vehicle Safety Initiative Funding Agreement, administered by the National Heavy Vehicle Regulator (NHVR). The lead entity in delivering this project was the BIC, overseen by a Working Committee and by representatives from the NHVR.
The objective of the Advisory is to assist bus and coach operators in the delivery of tangible improvements in heavy vehicle safety with the adoption of a bus fire evacuation
protocol including associated training packages that can be used to train bus drivers on how to reduce the risks associated with bus fires. The Advisory and associated templates and video training materials are available on the national bus and coach website movingpeople.com.au.
Seat belts on buses
The mandatory fitment of seat belts across all buses and coaches has seen strong debate. Whilst the value of seat belts in saving lives has been established for decades (Hodson-Walker, 1970), what is often neglected is the unique context of buses as compared with passenger vehicles and the on-costs and operational considerations associated with seat belt installation across the entire bus and coach fleet. Firstly, there are different needs between small and large buses. The high mass of large buses and compartmentalisation (in the case of coaches, for instance) protects passengers in the event of a collision. Compartmentalisation centres upon strong, closely spaced seats with energy-absorbing seat backs which serve as protective envelopes around passengers and prevent ejections, and are usually supplemented by improved body construction and stringent fuel system integrity requirements of the bus. Australian Design Rules (ADRs) on compartmentalisation and padded high back seat designs suggest that these vehicle design specifications can reduce fatalities by up to 20%.
The merits of mandatory seat belts on buses and coaches are always controversial in terms of their comparative benefit with respect to other forms of investment, such as education programs for the public or driver training. The costs of any rollout go beyond installation but on additional fleet required due to the loss of carrying capacity (especially as standees

5555Moving People > Australian Bus and Coach Industry: a snapshot
would likely be outlawed). Far more practical questions remain such as who will bear responsibility for ensuring that seat belts are worn. What onus will be placed on the bus/coach driver and how will this affect route operations? These questions are often neglected in the public policy debate amidst the raw emotions of a recent tragedy.
Seat belts as it pertains to school buses and especially in a rural and regional context is a particularly emotive issue. Whilst there are moves to mandate seat belts on rural school buses in some state jurisdictions (e.g., NSW), such initiative must be evidence-based and considered as part of a broad suite of policy measures. According to the Australian Road Deaths Database (BITRE 2020), there were 90 fatalities on buses carrying school-aged children (0-16 years) between January 1989 and August 2020. Of these 90 fatalities, 45 were pedestrian, motor cycle or pedal cycle related (ie. outside the bus). School bus safety awareness programs are therefore also important on general motorists as well as the school children themselves. Some jurisdictions such as NSW have mandated wigwag lights installed at the rear of school buses and a compulsory 40 km/h speed limit for any passing motorists (though how heavily this is enforced is questionable). These form part of a broader conversation in the education system and road rules beyond the bus and coach sector.
New safety technologies on buses
There is a broad general focus on speed and the role of speed limiters and engine retarders in controlling maximum speed. Traditionally, speed limiting devices are very crude and not able to prevent acceleration during downhill operations, but the latest systems can geofence and limit speed by the different legal limits of each road segment. The major question
remains in how these are defined, particularly in enforcing advisory speed limits around turns and gradients (which might vary by vehicle size), and how drivers might buy-in (or otherwise) to such a system limiting their autonomy. There exists a level of contention between warning level technologies and more interventionist approaches. Another example are lane departure warning systems versus lane keeping systems, where in the latter such devices might be problematic in crowded urban environments where lane sharing is generally necessary around corners (and sometimes even on straight stretches). The unintended risks of any technology such as driver alertness monitoring and autonomous emergency braking must always be considered carefully.
What is sometimes missing amidst new technologies are safety considerations in low speed environments around the manoeuvring characteristics of the bus and its impact on other road users. In tight urban environments, tail swing and left turns (mounting the kerb) are continuing risks especially to vulnerable road users such as pedestrians and cyclists. Whilst greater segregation between buses and other road users are one way to counteract such issues, there does not seem to be as great a focus on technologies on the side of manufacturers. Another less considered area is how the institutional regime might facilitate or hinder a safety culture. In Australia, work and rest requirements as stipulated by the National Heavy Vehicle Regulator (NHVR) mean that driving hours are considerably longer than (for instance) Europe and many developed Asian cities. Stanley (2018) argues that the accreditation requirements and excellent chain of responsibility provisions in Australia (ensuring that multiple parties incur the responsibility for any breach) means that safety is not necessarily compromised. The need for an independent safety auditor (e.g., Transport Safety Victoria) and investigative body (e.g., NSW’s Office of Transport Safety Investigations) are also highlighted as important determinants of safety.

5656 Moving People > Australian Bus and Coach Industry: a snapshot
3 .6 Who drives the busBus and coach drivers constitute the frontline staff of the industry and are their most valuable assets, being greater in scale than all other roles in the industry combined. The BIC estimates that drivers make up approximately 80% of the labour force in a bus and coach operation, noting that drivers can often take on other roles in an organisation (eg. cleaning, etc).
Data collated from national surveys conducted by the BIC in 2018 and 2020 indicate that the driver workforce of the bus and coach industry is more than 60,000. Much of the data presented in this section is extrapolated from surveys conducted by the Australian Bureau of Statistics based on primary (main) occupation. As such the data is under-reported, however it provides a good analysis of demographics and general workforce trends.
The number of bus and coach drivers
The number of bus and coach drivers increased very strongly since 2013 (Figure 3.12) and is expected to stay fairly stable over the next 5 years, rising from 41,100 in 2017 to 41,400 in 2022. There will, however, be an estimated 12,000 job openings during this time from worker turnover—a very high number compared with other occupations, and may be attributable to the stresses involved in the job including irregular working hours, pressures on the road and long periods of time sitting idle. The number of bus and coach drivers employed in each state and territory is roughly in line with the average for all occupations except in the states Vic, SA and WA (Figure 3.13). Vic and WA have a lower number of drivers than the all jobs average whilst SA has more, the reason for which is not immediately clear.
The demograhic profile of bus and coach drivers
Bus and coach drivers are aged 56 years on average, as compared to 40 years for the Australian workforce as a whole (Figure 3.14). Further, there is some level of bimodality in the age profile, with a greater number than average aged between 45-54 years and also above 60. One of the major challenges for the industry is the high proportion (82%) above 45, and the relative difficulty in recruiting the younger generation, with just 7% of the workforce less than 35 years old. This ‘silver tsunami’ of impending retirements will hit the industry hard and place even greater pressure on bus operators.
In Figure 3.15, the education level of bus and coach drivers is compared with the all jobs average. Bus and coach driving is lower skilled work although almost half (48%) have some form of post-secondary qualification. This compares with a working population average of 56%. Certificate III/IV are the most popular of such qualifications and accounts for 22% of all drivers.
A number of other vital statistics for the bus and coach driving profession are collated in Table 3.8. Weekly pay is slightly lower than average but likely to vary significantly depending on how much overtime and weekend/public holiday work attracting penalty rates (1.5-2.5 times standard) is completed. The full-share is around two-thirds, and there is a trend towards casualisation of the workforce (for some regional/rural operators, whole depots might depend on casual staff). Finally, there is a significant gender imbalance in the industry, and in some jurisdictions targeted recruitment campaigns aimed at women have been conducted (e.g., in Canberra).
Table 3.8: Key statistics on the bus and coach driving profession
Item Industry average Average for all jobs
Weekly pay $1,151 $1,230
Employment size 41,100 workers
Future growth Stable
Skill level rating Lower skill
Unemployment Lower unemployment
Full-time share 67.3% 68.4%
Average full-time 38.5 hours 40.0 hours
Average age 56 years 40 years
Gender share 14% female 46.7% female
Source: Job Outlook, 2018.

5757Moving People > Australian Bus and Coach Industry: a snapshot
Figure 3.12: Number of bus and coach drivers historical trend and projection 2007-2022
25,000
27,000
29,000
31,000
33,000
35,000
37,000
39,000
41,000
43,000
45,000
2007 2009 2011 2013 2015 2017 2019 2021
Workforce trend and projection (2007-22)
Source: Australian Bureau of Statistics, 2017
Figure 3.13: Bus and coach drivers employed by state/territory 2017
0%
5%
10%
15%
20%
25%
30%
35%
NSW VIC QLD WA SA TAS NT ACT
Bus and coach drivers employed by state and territory (2017)
Bus and coach drivers All jobs average
Source: Australian Bureau of Statistics, 2017

5858 Moving People > Australian Bus and Coach Industry: a snapshot
Figure 3.14: Bus and coach drivers employed by age profile 2017
0%
5%
10%
15%
20%
25%
30%
15-19 20-24 25-34 35-44 45-54 55-59 60-64 65 andOver
Bus and coach drivers employed by age profile (2017)
Bus and coach drivers All jobs average
Source: Australian Bureau of Statistics, 2017
Figure 3.15: Bus and coach drivers employed by education level 2016
0% 5% 10% 15% 20% 25% 30%
Post Graduate/Graduate Diploma or…
Bachelor degree
Advanced Diploma/Diploma
Certificate III/IV
Year 12
Years 11 & 10
Below Year 10
Bus and coach drivers employed by education level (2016)
All jobs average Bus and coach drivers
Source: Australian Bureau of Statistics, 2016

5959Moving People > Australian Bus and Coach Industry: a snapshot
Hire and retention of quality bus drivers
Hiring and keeping quality drivers is an ever-present challenge for bus and coach operators. One of the hurdles is the significant barriers to entry for the driving profession. Potential candidates often need to pay hundreds of dollars upfront on applications to different government bodies and spend weeks (on rare occasions even months) waiting for approval before they can begin the training process and start earning a salary. For better or worse, the allure of ride-hailing companies with their dramatically lower barrier to entry for driving work would also siphon off would-be bus drivers. There is also a major lack of harmonisation in terms of the qualifications (e.g., driver authority, licence upgrades, working with children check) required between states and territories. It is indeed difficult for aspiring drivers to move interstate. Finally, bus driving often competes with other heavy vehicle work such as truck driving. Whilst bus driving brings many advantages such as the opportunity to interact with the public (making it a highly skilled customer service job not attractive to all), it can be difficult for truck drivers working regular hours to move into a profession that has more irregularity (e.g., split/broken shifts and shifts at odd hours). The issues of driver turnover and staff retention is hence a major issue for those new to the industry.
Driver recruitment is an issue not only in Australia but across many developed countries. Singapore is tackling this challenge by embarking on an effort to enhance the image and professionalise bus industry workers. It is important that the profession is well regarded in the community and that those working in it are respected and see it as an honour to serve the public. Bus drivers are termed bus captains (as they are also in Hong Kong) with their customer service focus engrained and freed from the need to complete heavy manual work. In comparison, for most private operators in Australia, the onus remains on the driver to fuel and sweep their buses. In October 2016, the Singapore Bus Academy (SGBA) was launched which is an anchor initiative under the SkillsFuture Industry Manpower Plan to form a one-stop shop for those wishing to enter the bus driving industry. Their role is to centrally recruit and train drivers, after which they are deployed according to need amongst individual bus operators. Some state associations (e.g., BusNSW) in conjunction with accredited training providers are starting to take on this role too in an effort to assist their members. There is some challenge to restore the idyllic notions of the profession in being “the dream of every boy” (Kompier, 1996).

6060 Moving People > Australian Bus and Coach Industry: a snapshot
M
OVING PEOPLE
THEPASSENGERS

6161Moving People > Australian Bus and Coach Industry: a snapshot
The Bus Passenger4 Who is the passengerVital statistics for the bus and coach industry in terms of passengers carried in relation to other modes are compiled in this Section, and segmented by different markets (national/capital city and journey-to-work/service type) and with different measures (passenger kilometres and passenger boardings). The majority of statistics are obtained from the BITRE yearbook (ABS, 2017c).
4 .1 Mode choice
National trends
The car continues to dominate the Australian land passenger transport task according to all metrics including passenger kilometres (pkm) which normalises for different trip lengths (as compared with passenger trips/journeys which would skew towards very short/urban travel). In 2015-16, the total passenger kilometres travelled in Australia was 433.1 billion, of which private cars accounted for 64% or 279.1 billion pkm, whilst the bus and coach sector accounted for just 5% or 21.6 billion pkm (Figure 4.1). Bus and coach did carry a greater share than rail, and represent around 57% of public transport pkm. The other land transport modes (10%) comprise primarily of the non-freight use of light commercial vehicles, with contributions from motorcycles, non-business use of trucks and ferries. Of the land passenger transport modes (i.e., excluding air travel), bus and coach account for 6% of pkm travelled.
The 6% bus and coach mode share of land passenger modes held steady for the past 20 years, though it previously peaked at 7% around 1990 and troughed at 5% around 1980 (Figure 4.2). National pkm travelled has been steadily rising throughout this period, across all land modes. Between 1974 and 2016, car passenger kilometres have risen on average 3.0% per annum, compared with 4.7% for bus/coach and just 1.5% per annum for rail. Air travel has recorded the highest increase, rising 18.6% per annum during this 40 year period.
Capital city trends
In Australian capitals, total passenger kilometres travelled is 197.3 billion, of which the majority (80%) is met by private vehicles, contributing 157.85 billion pkm in 2014-15 (Figure 4.3). Buses contribute 4% to the capital city passenger transport task, whilst heavy rail contributes 6%, when considered in passenger kilometre terms. In absolute terms this equates to 12.14 billion pkm for rail and 7.13 billion pkm for bus. The aggregate models show heavy rail trips in metropolitan Australia at twice the length of the average urban bus trip. This is because rail networks are designed for longer radial trips whilst bus networks are mainly geared for shorter trips in the inner city and as first/last mile services to rail in the middle and outer suburbs.10 As a result, on a passenger kilometre basis rail dominates but in passenger trip terms buses carry more people.
Bus share of urban modes by pkm is presently 3.6%, having increased from a low of 3.1% in 2014. At the beginning of the time series (1977), buses enjoyed a share of 4.1% (Figure 4.4). In absolute terms, however, bus passenger kilometres has risen on average 2.3% per annum between 1976 and 2015. Rail use and the private car have each risen 3.0% on average per annum during the same period.
When disaggregated by capital city (Figure 4.5), the performance of bus is revealed in the context of major developments over the past four decades. Amongst the five largest capitals, the average annual growth rate has been highest in Melbourne (4.6%), followed by Brisbane (4.6%), Sydney (1.6%), Adelaide (1.4%) and Perth (1.2%). Among the smaller capital cities, Darwin had the highest average annual growth rate of bus passenger transport (26.3%) albeit from a very low base, followed by Canberra (3.8%) while Hobart experienced negative growth (-0.4%). Brisbane’s success since the turn of the century (averaging 5.7% per annum) has been remarkable, and attributable to the staged opening of their dedicated busway network.
10 There are increasingly exceptions to this including express services and cross-town orbitals (e.g., Metrobus in Sydney and SmartBus in Melbourne). ITLS with BIC is conducting another study evaluating their success in the context of bus rapid transit and branded bus services. The Victorian government’s Suburban Rail Loop is a radical proposal which will be an Australian first in delivering circumferential rail travel to Melbourne and enabling a more polycentric urban form.

6262 Moving People > Australian Bus and Coach Industry: a snapshot
Figure 4.1: National mode share by passenger kilometres, of a total 433.1 billion passenger kilometres travelled in 2015-2016
64%5%4%
17%
10%
National mode share by passenger kilometres (2015-16)
Passenger cars
Buses
Rail
Air
Other
Source: BITRE, 2017
Figure 4.2: Historical trend of bus/coach contribution to the national land passenger transport task, overlayed on national passenger kilometres travelled on land modes 1974-2016
4.0%
4.5%
5.0%
5.5%
6.0%
6.5%
7.0%
7.5%
050
100150200250300350400
Billi
ons
National bus/coach mode share historical trend (1974-2016)
National passenger kilometres Bus share of land passenger modes
Source: BITRE, 2017

6363Moving People > Australian Bus and Coach Industry: a snapshot
Figure 4.3: Capital city mode share by passenger kilometres, out of a total 197.26 billion passenger kilometres travelled in 2014-2015
80%
9%
1%6%
0.8% 4% 0.17%
Capital city mode share by passenger kilometres (2014-15)
Passenger cars
Commercial vehicles
Motor cycles
Rail
Light rail
Bus
Ferry
Source: BITRE, 2017
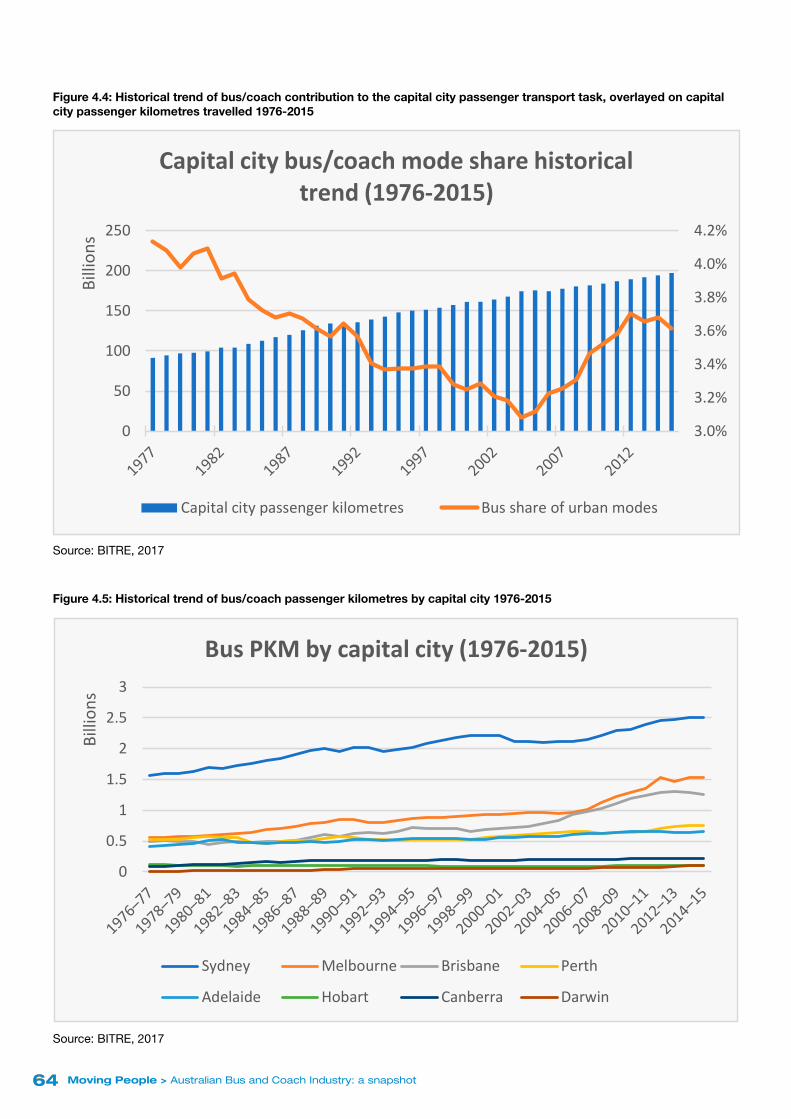
6464 Moving People > Australian Bus and Coach Industry: a snapshot
Figure 4.4: Historical trend of bus/coach contribution to the capital city passenger transport task, overlayed on capital city passenger kilometres travelled 1976-2015
3.0%
3.2%
3.4%
3.6%
3.8%
4.0%
4.2%
0
50
100
150
200
250
Billi
ons
Capital city bus/coach mode share historical trend (1976-2015)
Capital city passenger kilometres Bus share of urban modes
Source: BITRE, 2017
Figure 4.5: Historical trend of bus/coach passenger kilometres by capital city 1976-2015
0
0.5
1
1.5
2
2.5
3
Billion
s
Bus PKM by capital city (1976-2015)
Sydney Melbourne Brisbane Perth
Adelaide Hobart Canberra Darwin
Source: BITRE, 2017

6565Moving People > Australian Bus and Coach Industry: a snapshot
4 .2 The commute for the passengerA major policy focus of late relates to the crucial link between cities, urban sprawl and commute time. In a study on lengthy commutes, BITRE (2016) found average commuting time in Australia to be 29 minutes one way. This is consistent with the idea of Marchetti’s constant—the notion that humans have across the ages had a travel time budget of one hour (30 min each way) (Marchetti, 1994), allowing increasing travel distances (and helping expand cities) as transportation technologies improved. Recent policy initiatives such as the ‘20 minute’ city in Melbourne and ‘three cities’ in Sydney are example of these principles in play.
Commute time trends
For nearly one-quarter of commuters in Australia, however, or about two million people, the travel time is 45 minutes or more one way. Lengthy commutes are mainly an urban phenomenon and generally associated with larger conurbations, with 77% of all lengthy commutes found within Australia’s five largest cities. In Sydney, 73.2% of lengthy commutes were on public transport (mainly intercity train or train plus bus connection) whilst just 16% of car driver trips were lengthy commuters. The study found average driving commutes to be one-third shorter than public transport users, whilst also enjoying higher speeds (33 km/h for cars as compared with 21 km/h on public transport).
Commuting times also rise with income and qualifications. 26% of those with Bachelor level qualifications or higher were lengthy commuters compared with just 16% of those with Year 11 or below qualifications. Those earning more than $150 000 per year commuted 36 minutes on average while those earning between $20,000-$30,000 commuted for an average of 26 minutes. These findings call into question the adage that many people are being priced out of our capital cities into the peri-urban periphery, forcing extremely long commutes. BITRE (2016) purported that lengthy commuting was mostly a temporary situation as people change residences as a key adaptation mechanism.
The journey-to-work
The main non-discretionary trip purpose, the journey-to-work, is dominated Australia-wide by car (79%) where the majority of this is by sole occupancy vehicles, as opposed to pooled or shared trips (Figure 4.6). An implied notional average private vehicle occupancy may be calculated by comparing car driver only and car passenger only journeys (applicable only for journey-to-work trips). This figure is approximately 1.07-1.10, having dropped from 1.10-1.16 in 1996. Cars comprised of 7.06 million trips out of a total 8.92 million journey-to-work trips made on Census Day 2016. Public transport enjoys a 14% mode share (1.21 million trips), with 10% using public transport exclusively, and another 4% using public transport in combination with some other motorised mode as an access/egress component. According to Kim and Han (2011), public transport mode share in Australia is the fourth lowest amongst Organisation for Economic Co-operation and Development (OECD) countries, surpassing only New Zealand, the United States and Canada.
Public transport journey-to-work mode share has fluctuated both in absolute and percentage terms between 1986 and 2016 (Figure 4.7). There appears to be a slight trough during the turn of the 21st century (to a low of 10.8% for public transport and public transport plus other mode) but use has since rebounded and now strongly on the rise. Public transport plus other modes (e.g., park and ride, kiss and ride, bike and ride) is also rising albeit from a lower base.

6666 Moving People > Australian Bus and Coach Industry: a snapshot
Figure 4.6: Journey-to-work by mode (2016), out of a total working population of 8.92 million
10%0.2%
74%
5%
1% 1%
1%
4% 4%
Journey-to-work by mode (2016)
Public transport
Taxi
Car as driver
Car as passenger
Truck
Motor bike/Motor scooter
Source: BITRE, 2017
Figure 4.7: Historical trend of public transport and public transport plus other method in the journey-to-work mode share 1986-2016
0.0%
2.0%
4.0%
6.0%
8.0%
10.0%
12.0%
0
2
4
6
8
10
1986 1991 1996 2001 2006 2011 2016
Mill
ions
Public transport journey-to-work mode share historical trend (1986-2016)
Working population Public transport mode share
Public transport and other mode
Source: BITRE, 2017

6767Moving People > Australian Bus and Coach Industry: a snapshot
4 .3 Bus and coach patronageOver the past 2 decades, public operators in Melbourne, Perth, Adelaide and Darwin have been replaced by competitively tendered private operations. Today, public bus operators remain in Sydney, Brisbane, Canberra and Tasmania (Hobart, Launceston and Burnie), and continue to carry large numbers of passengers (Figure 4.8). State Transit Authority of NSW remains the largest public operator, carrying 212.78 million passengers in 2016-17, constituting a vast majority of metropolitan bus passengers (despite active
in 4 of 15 Sydney contract regions during the data period11).
Patronage by state/territory and service type is now considered (Table 4.1). Patronage figures are consistent with population size in each state, and it is evident how metropolitan (including outer metropolitan in NSW) services dwarf rural and regional passenger numbers. The dominance of school children is also apparent, although reliable data has not been forthcoming in these instances. The question of what these patronage figures mean for bus and coach productivity is further explored in Section 3.4.
Figure 4.8: Passenger boardings by government operator in 2016-2017
Note (*) Metro Tasmania includes services in Hobart, Launceston and Burnie, whilst (**) State Transit includes four contract regions in Sydney plus Newcastle
0 50 100 150 200 250
State Transit**
Brisbane Transport
Transport Canberra
Metro Tasmania*
Millions
Passenger boardings by government operator (2016-17)
Passenger boardings
Source: Transport for NSW, 2017, Metro, 2017, Brisbane City Council, 2017, ACT Government, 2017
11
11 Region 6 in Sydney’s Inner West has been operated by Transit Systems since 1 July, 2018

6868 Moving People > Australian Bus and Coach Industry: a snapshot
Table 4.1: Total passengers carried by the bus and coach industry in each state/territory (data collated by ITLS correspondence with state/territory authorities and associations)
Passenger boardings per annum (2016-17)
NSW VIC QLD WA SA TAS ACT NT
Metro/ Outer
275,000,000 118,000,000 111,700,000 80,017,000 51,123,468 8,200,000 16,547,078 3,863,106
Rural/Regional
5,700,000 11,800,000 11,330,000 2,348,000 432,157 1,770,000 115,741
Coach/Charter
753,389
Contracted Coach
1,380,000 60,000 177,000
Eligible Students
65,000 65,000 77,142
School routes
1,800 1,400 270 410 246
School boardings
40,700,000 10,516,000 6,000,000 1,748,963 2,387,215

6969Moving People > Australian Bus and Coach Industry: a snapshot
4 .4 The value of mobility for the passengerBus and coach transport services provide an important social inclusion function which is often overlooked in economic appraisal and the political process. The risk of social exclusion may be defined using five dimension thresholds (Table 4.2) that describe the situation of a person. It can be measured using a scale from 0 to 5, each point representing a different threshold that has been met and a higher aggregate score representing a greater risk of social exclusion. The implications of social exclusion are manifold and include higher risk of divorce and separation, disability, illness, substance addiction and social isolation, all of which forms a positive feedback loop in the predicament people face. Social exclusion also has indirect impacts on health through living in neighbourhoods with concentrations of deprivation, high unemployment, poor quality housing, limited access to services and a poor quality environment.
Based on empirical work in Melbourne, Stanley et al. (2011) found statistically significant relationships between household income, trip rates, and the risk of social exclusion, and estimated the value of additional trips for the adult population to be just under $20 per trip, a figure which is estimated to decline with increasing household income levels. This is up to four times the value of what is traditionally used in transport planning and is particularly relevant in the context of benefit estimation in project/transport appraisal. Stanley et al. (2018) took a rural and regional perspective on the issue and found a unit trip value of $18.50 (2016 prices) for regional route bus users. Assuming a regional town route cost of $120 per hour to provide, the break-even boarding rate in terms of user social inclusion benefits would hence be 6.5 passengers per service hour.
Whilst such services would only ever recover a small proportion of their direct service cost in financial terms from fares, there is significant social value both to users at risk of exclusion and the wider society in terms of savings in flow-on costs, such as crime, unemployment and adverse health outcomes. The bus has a major role to play in supporting social inclusion.
The research has led to the Victorian government’s adoption of minimum service levels in outer urban Melbourne, described as social transit, the implementation of which has led to significant patronage growth and social benefits. Stanley and Stanley (2007) suggests that minimum service standards for route bus systems in existing urban areas and growth suburbs be set at hourly services seven days a weeks, for at least 12 hours per day or longer. These levels will provide most people with a travel option at most times, sufficient to avoid most prospective transport service-related social exclusion. More broadly on the policy agenda, is the desire to encourage independent regional mobility, particularly to strengthen bridging social capital. This extends beyond mere accessibility planning for particular activities (i.e., the spectrum from special purpose transport to mainstream transport options), but ought to form a regionally integrated system that offers transport information, education and assistance and co-ordinates all forms of local transport, to better meet regional mobility needs: route buses, spare seats on school buses, community transport, walking and cycling, share cars, taxis and ride-hailing services, mobility scooters and wheelchairs. This general approach is becoming known in the United Kingdom as a total transport approach to planning and delivering regional mobility services.
Table 4.2: Dimensions and definitions of social exclusion
Dimension Definition
Household income Less than a threshold of $500 gross per week
Employment status Neither employed, retired, in education or training, looking after family, nor undertaking voluntary work
Political activity Did not contribute to/participate in a government political party, campaign, or action group to improve social/environmental conditions, to a local community committee/group in the past 12 months
Social support Not able to get help if you need it from close or extended family, friends or neighbours
Participation Did not attend a library, sport (participant or spectator), hobby, or arts event in the past month
Source: Stanley, et al., 2011

7070 Moving People > Australian Bus and Coach Industry: a snapshot
M
OVING PEOPLE
THECOACH SECTOR

7171Moving People > Australian Bus and Coach Industry: a snapshot
Long Distance and Tourism Sector5 About the Coach SectorWithin the bus and coach industry, the coach sector services a wide range of passengers including international tourists and backpackers travelling for work and leisure, the emerging “baby boomer” market, school students on educational and sporting excursions and business groups attending conferences and events. The vehicles used by the coach sector vary in size and design according to the needs of the traveller. This can mean that a coach could be a luxury long distance high deck vehicle equipped with on board facilities or a smaller coach carrying out charter services for small groups.
Within this diverse setting, coach services can be divided into three broad categories:
• Long Distance
• Tour
• Charter.
Long distance coaches operate along fixed routes with individual passengers generally travelling distances of 40 kilometres or greater. These services operate in accordance with a timetable and have designated stops along a fixed route.
Long distance services provide a vital service, transporting tourists between capital cities and regional towns and transporting domestic travellers to smaller regional villages. Some long distance coach services form part of a regional “hub and spoke” transport network that includes rail services and are contracted by state government agencies (e.g. TrainLink services in NSW and V/Line services in Vic), whilst other long distance services operate on a commercial basis and can include “hop on hop off” packages.
Tourist Services are pre-booked services that take individual tourists to destinations on a publicly available itinerary. Unlike Long Distance services, passengers on tourist services generally have a common origin or destination (or both). Tourist Services include a single seat on a day tour (e.g. Sydney to the Blue Mountains and return) or an extended tour that operates over multiple days or weeks and can include accommodation and meals (e.g. Central Australia and Kakadu tour).
Charter services involve a coach hired by a group of passengers for transport to a destination for an agreed fee, where:
• the hirer determines the route and time of travel
• all passengers’ journeys have a common origin and/or common destinations.
Charter services would include, for example, booking a coach to take a group of students on a school excursion or a social group to a concert or sporting event.
Coaches also have the potential to play a role in the new digital transport economy including the “Mobility as a Service” (MaaS) concept. Pilots are currently underway in tourist hotspots to trial the use of long distance and tourist services as a part of a MaaS plan. The Pilots aim to test the effectiveness of MaaS in helping passengers to get to and around these locations.
In view of the importance and diversity of the coach sector, it is necessary for all levels of government to support the involvement, significance and economic value of the coach sector to the tourism industry via a recognition, both of what the coach sector does, and what it can do into the future.
5 .1 The coach sector and the tourism dollarCharter and tour coaches play an important role in meeting the needs of local, interstate and international tourists and visitors. Data on the mode choice of tourists and the conditions around which such choices are made, has been gathered from Tourism Research Australia - International Visitor Survey (IVS) and National Visitor Survey (NVS). The IVS samples 40,000 departing, short-term international travellers aged 15 years and over who have been visiting Australia (TRA, 2016a) whilst the NVS surveys via the phone approximately 120,000 Australian residents aged 15 years and over (TRA, 2016b). One limitation in the data from these surveys is only overnight visits are considered.

7272 Moving People > Australian Bus and Coach Industry: a snapshot
International visitors
In the year ending March 2018, Australia welcomed 8.3 million visitors to the country, who spent a total of 269 million nights and contributed $4.2 billion to the Australian economy (Figure 5.1). A total of 1.74 million visitors hailed from Greater China (including Hong Kong, Macau and Taiwan), spending a total of $1.3 billion in the country. New Zealand ranks second in terms of visitor numbers but overall expenditure is low per capita, and ranking fourth overall in total. Apart from the United States, United Kingdom and Germany, other countries in the top ten all came from our neighbours in Asia.
The average spend by visitors across all states and territories is $108 per night, with higher spending in Vic ($117) and NSW ($111) and the lowest average spend ($85) in WA (Figure 5.2). The number of visitors varies roughly in proportion to the population of each state/territory, average 0.47-0.56 visitors per capita in NSW, Vic and Qld. The territories were better represented, however, with 1.01 visitors per capita in ACT and 0.70 in NT. SA and WA were the least well represented, seeing just 0.28 and 0.37 visitors per capita respectively.
The modes international travellers use whilst in Australia bears a strong relationship with the total number of nights stayed and the average length of each stay (Figure 5.3). Out of the 250.9 million nights stayed in 2016, 44.5% of those nights could be attributed to self-drive vehicles, and aircraft 20.7% of those nights. The three bus and coach modes in total account for 6.7% (or 16.7 million) of all nights stayed. The average length of each stay varies considerably with each bus mode, being shortest (5 days) for charter/tour services, 10 days for shuttle/courtesy bus and 30 days for long distance coach (on par with self-drive). These are consistent with expectations between self-organised travel arrangements and booked tours.
There is a clear link between the travels of international visitors (as measured by total nights spent) and their modal preferences (Figure 5.4). Long distance coach performs strongly for visitors to the ACT as well as in Qld. Interurban rail is most prevalent in NSW and is almost non-existent beyond the eastern seaboard. Aircraft and self-drive vehicle show up as proportional to the visitor numbers in each state/territory (as indeed they dominate as preferred modes). Visitor mode choice also varies by trip purpose (Figure 5.5). Apart from ship, boat or ferry, bus and coach users are most likely to be travelling for holiday, followed by education. Around 10% of coach travellers would use it for employment purposes. Those visiting friends and relatives are most likely to self-drive whilst business travel is mainly conducted using aircraft and taxi/hire car.
Another important aspect is how life cycle might impact travel mode (Figure 5.6). Amongst coach users, 41% were young single and 33% mid-life single. Older married couples are a major market for charter/tour buses as well as shuttle for courtesy buses. Again, aircraft and self-driving sees the greatest diversity (or most even mix) in terms of the life cycle from which users hailed.

7373Moving People > Australian Bus and Coach Industry: a snapshot
Figure 5.1: Top 10 countries from which visitors hailed by number of visitors and expenditure in the year ending March 2018
2004006008001,0001,2001,400
500
1,000
1,500
2,000
Mill
ions
Thou
sand
s
Total international visitors and expenditure by country (2017-18)
Visitor numbers (left) Expenditure (right)
Source: Tourism Research Australia, 2018
Figure 5.2: Visitors and expenditure by state/territory
60
70
80
90
100
110
120
1,000
2,000
3,000
4,000
5,000
NSW VIC QLD WA SA TAS NT ACT
Thou
sand
s
International visitors and expenditure by state/territory (2017-18)
Visitors numbers (left) Average expenditure per night (right)
Source: Tourism Research Australia, 2018

7474 Moving People > Australian Bus and Coach Industry: a snapshot
Figure 5.3: Total number of nights spent and the average length of each stay for those who travelled on each particular mode
05101520253035
020406080
100120
Mill
ions
International visitors stay by mode (2016)
Total nights (left) Average length (right)
Source: Tourism Research Australia, 2016a
Figure 5.4: International visitor nights spent by mode and state/territory of travel
0%10%20%30%40%50%60%70%80%90%100%
International visitor mode share by state (2016)
NSW VIC QLD SA WA TAS NT ACT
Source: Tourism Research Australia, 2016a

7575Moving People > Australian Bus and Coach Industry: a snapshot
Figure 5.5: International visitor nights spent by mode and travel purpose
0%20%40%60%80%
100%
International visitor mode share by travel purpose (2016)
Holiday Visiting friends and relatives
Business Employment
Education Other reason - In transit
Source: Tourism Research Australia, 2016a
Figure 5.6: International visitor nights spent by mode and life cycle
0%20%40%60%80%
100%
International visitor mode share by life cycle (2016)
Young single Midlife single Couple no kids
Parents with kids Older single Older married
Source: Tourism Research Australia, 2016a

7676 Moving People > Australian Bus and Coach Industry: a snapshot
National Visitors
Australian visitors spent on average 3-5 nights on domestic travel. They are overwhelming users of self-drive vehicles and air travel, accounting for 90% or 311 million nights in total (Figure 5.7). A total 8.2 million nights may be attributable to rail travel whilst bus/coach can be credited for 5.5 million nights of stay. Comparing across states and territories (Figure 5.8), visitors in NSW are proportionally overrepresented in the use of bus/coach, railway and self-drive vehicle modes. There is a roughly even mix (20% each) of bus/coach visitors to NSW, Vic and Qld. A greater than average proportion of visitors to Qld used aircraft as well as other land and water modes.
In terms of trip purpose (Figure 5.9), 2.2 million nights were
spent by bus/coach users travelling on holiday, compared to 1.5 million nights visiting friends and relatives. Holiday travellers were proportionally more likely to self-drive and use other land and water modes, whilst visitors to friends and relatives were more likely to use rail. As expected, the greatest proportion (40%) of aircraft users travelled for business or other purposes.
Interesting observations may be made between a traveller’s life cycle and their mode of choice (Figure 5.10). Single people (either young, midlife or older) are far more likely to choose bus/coach and rail relative to other life stages (both 53%). Couples and families, on the other hand, have greater propensity to choose aircraft, self-drive and other land and water modes.
Figure 5.7: Mode share of domestic visitors as measured by total nights stayed
2% 2% 2%
28%
65%
1%
NVF Mode share by nights stayed (2016)
Bus/Coach
Railway
Other land or water
Aircraft
Self-drive vehicle
Unknown
Source: Tourism Research Australia, 2016b

7777Moving People > Australian Bus and Coach Industry: a snapshot
Figure 5.8: Domestic visitor nights spent by mode and state/territory of travel
0%10%20%30%40%50%60%70%80%90%
100%
Bus/Coach Railway Other land andwater
Aircraft Self-drive vehicle
NVF Nights spend by mode and state (2016)
NSW VIC QLD SA WA TAS ACT NT
Source: Tourism Research Australia, 2016b
Figure 5.9: Domestic visitor nights spent by mode and travel purpose
0%
20%
40%
60%
80%
100%
Bus/Coach Railway Other land andwater
Aircraft Self-drive vehicle
NVF Nights spend by mode and travel purpose (2016)
Holiday Visiting friends and relatives Business - Other - Not stated/not asked
Source: Tourism Research Australia, 2016b

7878 Moving People > Australian Bus and Coach Industry: a snapshot
Figure 5.10: Domestic visitor nights spent by mode and life cycle
0%10%20%30%40%50%60%70%80%90%
100%
Bus/Coach Railway Other land andwater
Aircraft Self-drive vehicle
NVF Nights spend by mode and life cycle (2016)
Young single - Midlife single Older single Couple/Family Other
Source: Tourism Research Australia, 2016b

7979Moving People > Australian Bus and Coach Industry: a snapshot
5 .2 Coaches driving land transport tourism to regional AustraliaThe landscape for public transport and tourism in Australia is changing which provides all levels of government and industry with an opportunity to review policy impacting coach services and introduce strategies to grow Australian coach tourism.
There are a number of strategies that can be adopted to provide social, environmental and economic benefits for communities across Australia, including:
• targeted marketing
• investment in infrastructure, services and training
• regulatory reform.
There are 9 key areas that all levels of government and industry should adopt to increase travel by coach to generate dispersal of tourists from major cities and attractions to
regional Australia and grow Australia’s tourism economy. These are set out in summary in Table 5.1. A comprehensive explanation of these strategies is provided in Coach Solutions for Land Transport Tourism (Bus Industry Confederation 2019).
1. New marketing strategy for coach travel.
2. Better data via market research.
3. Coach infrastructure in Australian cities and major regional towns.
4. Airport infrastructure and access.
5. National Parks access.
6. Addressing skills shortages.
7. Service and tourism investment incentives.
8. Heavy Vehicle Regulation.
9. Performance based Disability Standards.
Table 5.1 Key strategic areas for coach travel to disperse tourists to regional Australia
Strategic Area OutcomesMarketing of land transport options as part of unique tourism experiences.
Educates tourists (prior to arrival) about land transport options and increases tourism by linking regions, cities and tourist icons.
Market research on how and why visitors travel to different regions, the reason for their travel, and perceptions of travel modes.
Provides land transport tourism data and trends to assist future investment and planning decisions by Governments and industry.
Investment in modern transport infrastructure in cities and major regional towns (and along tourist routes) to provide facilities where travellers can effectively transfer between services or commence/complete a journey.
Ensures a world class, “whole of journey” experience for tourists and domestic travellers by integrating different modes and providing seamless transfers.
Investment in airport infrastructure for coaches. Enhances the experience for tourists when connecting to coaches via major airports.
Reduction in administration to access National Parks including the introduction of standardised fees and payment process.
Promotes the inclusion of National Parks in tourism experiences and the dispersion of tourists to regional areas.
Development of a formal coach driver and manager qualification within the national vocational educational and training framework.
- Creates skilled and customer-focussed coach drivers to enhance the customer experience.
- Creates managers with expertise in coach operations.
Investment in passenger services via a land-based subsidy scheme for coach services in regional areas, and taxation incentives to encourage investment in vehicles and depots.
- Ensures the viability of coach services in remote and regional areas.
- Assists social inclusion.
- Helps make regional areas attractive places to live and work.
- Enhances the customer experience via new vehicle technology.
- Supports the manufacturing sector.
A national and consistent approach to heavy vehicle regulation.
Facilitates the use of higher productivity coaches by accredited operators meeting a minimum safety standard for the delivery of coach services across all states.
Flexibility within Accessible Transport Standards for pre-booked tourist and charter services.
- Allows for the effective us of the coach fleet.
- Allows for tailored solutions for customers with disabilities.

8080 Moving People > Australian Bus and Coach Industry: a snapshot
FROM THE 2018 CONFERENCE BROCHURE VERSION 5 (FOR SOME REASON THE LINKS FOLDER IS MISSING ALL THE LINKS!!)
M
OVING PEOPLE
INDUSTRYPOLICY

8181Moving People > Australian Bus and Coach Industry: a snapshot
Industry Areas of Policy and Program FocusSections 6-12 provide a short summary of current Industry policy and program discussion points and focus on key issues for the consideration of all governments.
Each Section looks at current bus and coach related issues and offers thought leadership from the authors from ITLS and the BIC on structural issues and developing matters of importance for the Australian bus and coach industry, governments and the community.
6 Federal Election Primer – 2019
6 .1 Moving People, Cities, Regions and the Federal GovernmentAustralians love their cars, and this dependency has created challenges not only in our cities but in regions, towns and villages as our population increases and major regional centres grow.
The productivity, sustainability and liveability of our cities and regions is critical to the health of the Australian economy and the quality of life of Australians.
Public transport in our cities and regions plays a vital role in meeting the mass and social transit needs of the community and deliver important government policy outcomes.
Travelling in cars, especially single use trips provides personal mobility outcomes and personal space and time benefits but this comes with economic, environmental and community costs.
In the context of a fast growing population and increasing urbanisation, congestion is impacting on the economy, reducing our living standards and increasing the cost of living.
At the same time Australia’s growing regional centres are entertaining the same transport problems of our growing cities 20 years ago and surrounding towns and villages are challenged with poor transport and mobility options, just as middle and outer suburbs of our cities are today.
All of this adds up to poor economic, environmental and societal performance.
This is the reason why the federal government has a strategic and leadership role to play in our cities and regions future transport choices and public transport.
The delivery of public transport services is the domain of state, territory and in some instances local government.
The federal government has a role to assist state, territory and local governments to deliver national policy outcomes.
There are a number of national policy outcomes of better public transport services and improvements.
> Urban productivity
> Regional connectivity and decentralisation
> Environmental improvement
> Social inclusion
> Improved personal health outcomes
> Road safety benefits
It is not rocket science to understand what makes public transport and bus services attract more people to use it.
> Frequency of services
> Span of operating hours per day
> Reliability
It is these three core fundamentals of public transport service delivery that the federal government should focus on. This will assist state, territory and local governments to increase the number of services and patronage on public transport in the city and country and in doing so, reduce the number of individual trips taken by car.
This federal election primer outlines the ideas of the BIC on federal policy and programs that will make a difference, be appealing to the electorate and form the foundation of a future Intergovernmental Agreement on Moving People.

8282 Moving People > Australian Bus and Coach Industry: a snapshot
6 .2 ‘Fair Go’ Guarantee for Public Transport Users, Drivers and ManufacturersThe bus industry believes in a ‘fair go’ for all Australians. We believe that good infrastructure, human services and urban and regional policy hold the key to unlocking the enormous potential of our places and people
The federal government has a national strategic policy and program role to address the growing need for better public transport and mobility services in our cities and regions.
This is why we call on the federal government to adopt our ‘Fair Go’ Guarantee.
This policy delivers a ‘fair go’ for:
• Australian commuters through guaranteed service levels and fairer fares no matter where they live
• Australian businesses through the prioritisation of the Australian bus manufacturing sector and recognition of public transport as an essential service
• Australian workers through recognising the essential
role that bus drivers play in our community.
Table 6.1: ‘Turn Up and Go’ Minimum Service Levels
Weekday Services Weekend Services
Frequency Span Frequency Span
Inner/Middle Metropolitan Suburbs
15 min5.30am – 10.30pm
17 hours20 min
6.30am – 10.30pm 16 hours
Interface Suburbs 20 min6.00am – 10.30pm
16.5 hours30 min
6.00am – 10.30pm 15.5 hours
Major Regional Centres 30 min6.00am – 9.30pm
15 hours45 mins
7.00 am- 9.30pm 14 hours
Regional Areas 30 min6.00am – 7.30pm
13 hours60 mins
8.00am – 7.30pm 11 hours
6 .3 The ‘Fair Go’ Guarantee 10 Point Action PlanACTION 1: Develop an Intergovernmental Agreement on Moving People that will underpin the ‘Fair Go’ Guarantee.
ACTION 2: Introduce a Public Transport Users ‘Fair Go’ Guarantee based on Minimum Service Levels for Australia’s bus networks to bring about a ‘turn up and go’ public transport paradigm as the centrepiece condition of federal government public transport and road infrastructure funding.
ACTION 3: Prioritise improved bus services in Australian cities’ outer suburbs as part of City Deals/partnerships and other means where network coverage, service frequency, operating hours and integration with other modes of public transport is poor in comparison to inner/middle suburbs.
ACTION 4: Invest in high capacity bus service infrastructure such as bus rapid transit to link population centres with employment and activity clusters to augment other services and fill rail network gaps.
ACTION 5: Introduce new and expand existing funding program(s) to improve regional and rural public transport through better integration with existing public transport and other transport services that includes strong tourism infrastructure and service links.
ACTION 6: Improve regional connectivity and accessibility through better utilisation of existing regional transport assets and services and the establishment of Regional Accessibility Committees to achieve this.
ACTION 7: Provide incentives to states and territories to improve travel to learn and school bus services and provide financial incentives for parents to make school bus travel part of daily travel plans as a key congestion busting strategy.
ACTION 8: Provide investment incentives to promote eco – electro bus mobility to renew the Australian bus fleet by retiring Euro III and below emission standard buses and replacing with Euro VI diesel, hybrid or electric buses that includes ‘A Fair Go’ Guarantee for Australian manufacturers based on Australian content procurement requirements.
ACTION 9: Recognise public transport as an ‘essential service’ under industrial relations laws to minimise disruption to services and introduce ‘A Fair Go’ Guarantee for bus drivers to recognise bus drivers as essential service workers to improve driver safety.
ACTION 10: Exclude special school bus service provision from the NDIS and retain the skilled and mature regulated market that exists.
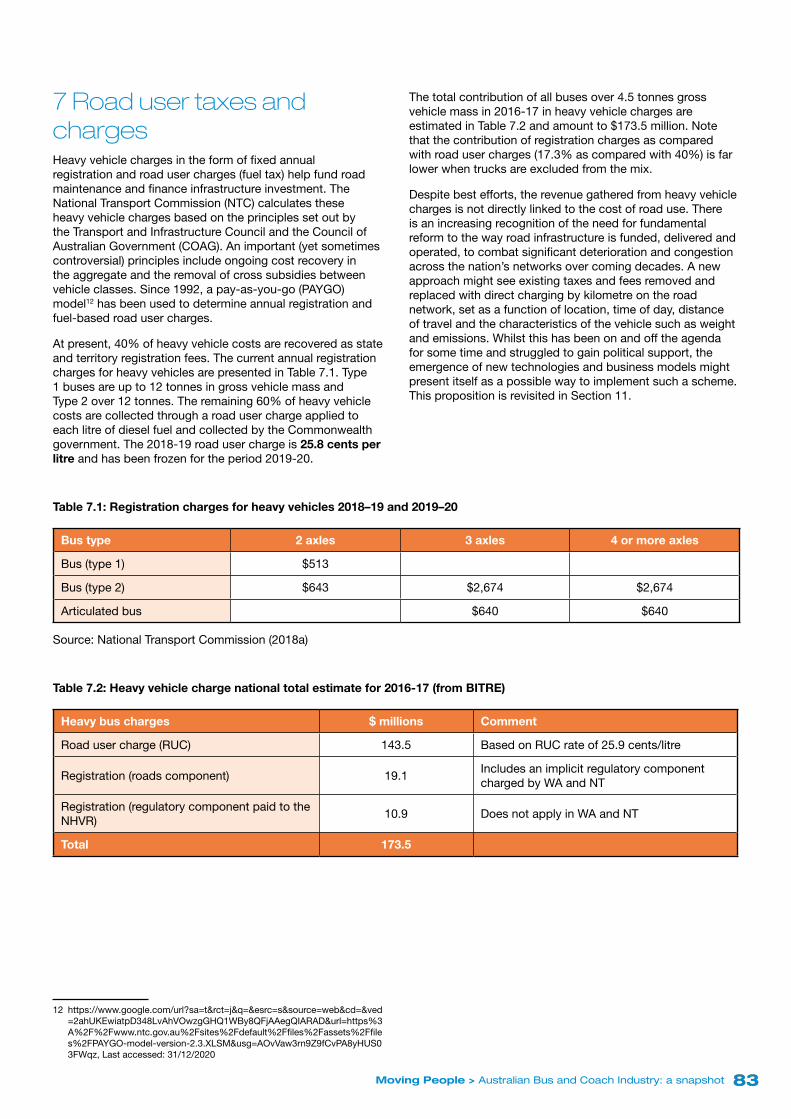
8383Moving People > Australian Bus and Coach Industry: a snapshot
7 Road user taxes and chargesHeavy vehicle charges in the form of fixed annual registration and road user charges (fuel tax) help fund road maintenance and finance infrastructure investment. The National Transport Commission (NTC) calculates these heavy vehicle charges based on the principles set out by the Transport and Infrastructure Council and the Council of Australian Government (COAG). An important (yet sometimes controversial) principles include ongoing cost recovery in the aggregate and the removal of cross subsidies between vehicle classes. Since 1992, a pay-as-you-go (PAYGO) model12 has been used to determine annual registration and fuel-based road user charges.
At present, 40% of heavy vehicle costs are recovered as state and territory registration fees. The current annual registration charges for heavy vehicles are presented in Table 7.1. Type 1 buses are up to 12 tonnes in gross vehicle mass and Type 2 over 12 tonnes. The remaining 60% of heavy vehicle costs are collected through a road user charge applied to each litre of diesel fuel and collected by the Commonwealth government. The 2018-19 road user charge is 25.8 cents per litre and has been frozen for the period 2019-20.
The total contribution of all buses over 4.5 tonnes gross vehicle mass in 2016-17 in heavy vehicle charges are estimated in Table 7.2 and amount to $173.5 million. Note that the contribution of registration charges as compared with road user charges (17.3% as compared with 40%) is far lower when trucks are excluded from the mix.
Despite best efforts, the revenue gathered from heavy vehicle charges is not directly linked to the cost of road use. There is an increasing recognition of the need for fundamental reform to the way road infrastructure is funded, delivered and operated, to combat significant deterioration and congestion across the nation’s networks over coming decades. A new approach might see existing taxes and fees removed and replaced with direct charging by kilometre on the road network, set as a function of location, time of day, distance of travel and the characteristics of the vehicle such as weight and emissions. Whilst this has been on and off the agenda for some time and struggled to gain political support, the emergence of new technologies and business models might present itself as a possible way to implement such a scheme. This proposition is revisited in Section 11.
Table 7.1: Registration charges for heavy vehicles 2018–19 and 2019–20
Bus type 2 axles 3 axles 4 or more axles
Bus (type 1) $513
Bus (type 2) $643 $2,674 $2,674
Articulated bus $640 $640
Source: National Transport Commission (2018a)
Table 7.2: Heavy vehicle charge national total estimate for 2016-17 (from BITRE)
Heavy bus charges $ millions Comment
Road user charge (RUC) 143.5 Based on RUC rate of 25.9 cents/litre
Registration (roads component) 19.1Includes an implicit regulatory component charged by WA and NT
Registration (regulatory component paid to the NHVR)
10.9 Does not apply in WA and NT
Total 173.5
12 https://www.google.com/url?sa=t&rct=j&q=&esrc=s&source=web&cd=&ved=2ahUKEwiatpD348LvAhVOwzgGHQ1WBy8QFjAAegQIARAD&url=https%3A%2F%2Fwww.ntc.gov.au%2Fsites%2Fdefault%2Ffiles%2Fassets%2Ffiles%2FPAYGO-model-version-2.3.XLSM&usg=AOvVaw3rn9Z9fCvPA8yHUS03FWqz, Last accessed: 31/12/2020

8484 Moving People > Australian Bus and Coach Industry: a snapshot
8 Perceptions and realities of car costs on societyThe external costs of cars extend beyond carbon dioxide emissions but into air and noise pollution, congestion, traffic accidents, impacts on physical and mental health. Externalities result in private costs below true costs and quantity consumed above what is optimal. Stanley and Hensher (2011) estimated unit costs for these externalities and found that based on 2015 prices, a $0.66/L corrective tax is required to account for the unpriced, negative externalities of private car travel (Table 8.1). This might be implemented in the form of additional fuel excise and redistributed to each purpose accordingly (e.g., in the form of purchasing abatements for emissions).
The presence of these social (external) costs is what leads to a disconnect between perceived and the actual costs of private cars and public transport. Figure 8.1 highlights the perceptions and the realities of costs per kilometre by mode from a study undertaken at ITLS. If external costs were paid by car users, and the actual cost of travel choices understood, then private car use would be less. Currently private car use is significantly under-priced which encourages excessive use as indicated in Figure 4.3 where capital city mode share by passenger kilometres is 80% by passenger cars.
On the other hand, public transport brings with it numerous positive externalities in the form of wider economic benefits such as value uplift, economies of agglomeration plus health and wellbeing estimates. Road user charging in the form of a price per kilometre varied by geography and time of day has been espoused since the 1960s as an equitable mechanism to bring the transport market into equilibrium, with added network management benefits. Such measures has faced significant opposition throughout the world, though future technologies and business models (see Section 11) might make such a proposition for a comprehensive reform agenda more politically palatable in the future.

8585Moving People > Australian Bus and Coach Industry: a snapshot
Table 8.1: Estimate of corrective fuel excise (tax) for Australian passenger cars—2015 price estimate
Indicator Stanley and Hensher (2011) 2017 base run (2015 prices)
Passenger vehicle fuel economy (mpg) 21.5 22
Vehicle mile tax portion of fuel price elasticity (β) 0.4 0.5
Carbon externality (c/gal) 32* 42
Air pollution and noise cost (c/mL) 2.4 1.6
Congestion cost (c/mL) 10.9 11.9
Accident external cost (c/mL) 3.5 4.5
Corrective tax $0.49/L $0.66/L
Contribution to corrective tax from…
Congestion 26.3c/L 35.9c/L
Accidents 8.4c/L 13.6c/L
Carbon (greenhouse gas emissions) 8.4c/L 11.1c/L
Air/noise pollution 5.8c/L 4.8c/L
Source: Stanley and Hensher (2011)13
Figure 8.1: Perceived and actual costs of private car and public transport (ITLS estimate from 2009-10 BITRE data/ABS/RACV)
0
10
20
30
40
50
60
User perceived Government perceived Actual
$c/p
km
Cost per passenger kilometre by mode
Private car Public transport
13 Includes $0.10/gallon energy security not included in the present analysis

8686 Moving People > Australian Bus and Coach Industry: a snapshot
9 Contractual developmentsThe majority of route and school services in Australia are operated under contract to the government and therefore this Section outlines recent developments in contracting, presenting the best practices in contract design based on a landmark global review and look to where contracts might head in the future. The chapter concludes with an overview of procurement reforms in Singapore.
9 .1 Recent developments in AustraliaAustralia has traditionally been dominated by large public operators in the major capitals and a plethora of family-based bus operators who own their own vehicles and depots in the outer suburbs and across the rest of the country. Reforms in the past few decades have led to the contracting out of many public operators, and a major consolidation of urban operators whose licence to operate are subsequently based on a competitive tender or negotiated basis. During this period, a number of large national companies have emerged (through mergers and acquisitions – see Table 3.2) as well as multinational giants who have entered the market.
In contracted environments, there is an increasing trend for government to own assets (depots and buses), which often requires negotiation with the incumbent owners. Planning responsibilities also sit solely with the authority. The principles behind these management contracts have been implemented in full in Perth and Adelaide. In NSW, the largest state, four different market arbitration or procurement approaches may be seen:
• Sydney Metropolitan (SMBSC)—competitively tendered
• Outer Metropolitan14 (OSMBSC)—presently negotiated, with performance-based benchmarking
• Rural/Regional—going through an offer/acceptance process based on independent benchmarking
• Long distance coach15– economically deregulated.
Around Australia, contract cycles tend to be between 7 and 10 years, usually with a first option to extend for another 3 years. Strict performance indicators are specified, relating to punctuality and reliability, safety, customer satisfaction and revenue protection. In cases where operators continue to own buses, general requirements are for an average age of 12 years and no bus to be greater than 25 years. The regulator/authority specifies in various ways across the states and territories the types of buses that can be selected and how they are procured. In NSW, the government specifies an approved panel from which operators may purchase their buses. Individual chassis and body manufacturers tender to be placed on that panel.
14 Includes South Coast, Blue Mountains, Central Coast and Hunter regions—but (crucially!) not the Southern Highlands
15 Defined as regular routes where each passenger is conveyed for at least 40 km
A major point of contention in public policy relates to the comparative merits of tendering versus negotiation. It is understandable that incumbents favour negotiation whereas new entrants prefer a tender process—and is a major focus of lobbying efforts. There is an at times dogmatic view in government, however, that an open auction through tendering always produces the most cost-effective outcome. ITLS research has shown that whilst this is true in the case of an incumbent government monopoly, cost savings tend to be exhausted after three rounds, and quality begins to suffer. A forced tender also produces uncertainty, as a very successful incumbent operator can lose their right to provide services by an underpriced bid from an optimistic or inexperienced new entrant (who cannot deliver). This phenomenon is known as the winners’ curse and played out in the case of Transfield/Broadspectrum in Adelaide.
A tender process also causes disruption through transition costs which can amount to 10% of the tender price but is usually ignored by government (Hensher et al., 2016). Tendering can also hurt the regulator/operator relationship. A blind desire to tender can be considered an overemphasis on efficiency or cost minimisation at the expense of effectiveness (Table 3.5) Value for money in the procurement process is important but only as an intermediate goal whereas a trusting partnership might deliver more tangible service improvements for the end user.
Competitive tendering is recommended when performance is lagging, whilst a partnership based on negotiation is preferred when performance is sound. In both cases actionable benchmarking is essential. The ultimate threat of a full competitive tender remains in the event of operator non-performance.

8787Moving People > Australian Bus and Coach Industry: a snapshot
9 .2 Best practice in bus contractingSince 1989, ITLS has run the International Conference Series on Competition and Ownership in Land Passenger Transport (known as the Thredbo series16), which has grown to become the world’s premier conference on public transport institutional reform, contract design and implementation. The series has reviewed global developments and compiled what it believes to be best practices in contracting, in many cases even pre-empting where governments have moved in terms of land passenger transport reform. For a complete account of best practices and developments over the past 30 years, readers are directed to the landmark review by Wong and Hensher (2018).17
Amongst many themes, one of the key centrepieces of the Thredbo series has been the STO (strategic/tactical/operational) framework (Figure 9.1) coined by Didier van de Velde (1997) which allowed a range of issues to be framed within this setting as a way of understanding the various roles of stakeholders—in particular, operators and regulators. The three tiers were later synonymised with (S) transport policy, (T) system planning and (O) service delivery. The transport policy or broad strategic goals for assessing market reform were in the domain of regulators whilst operational goals related to service delivery were best handled by transport providers. It was at the interface between strategic planning and transport operations—the tactical link—which was most often the cause of tension and adversity between the regulator and operator. Overreach may have led to operators perceiving regulators as “interfering in their business” whilst regulators lamented operators for “a lack of vision”.
Table 9.1 offers an illustrative framework indicating where the tactical role ought to sit depending on four different scenarios. The bottom right corner is most high risk (operator has good scope to grow patronage and regulator prepared to spend to develop service) due to the difficulties in forecasting patronage associated with major service development. Contained herein are references to risk allocation which is summarised in Table 9.2 in terms of different contract types based on revenue and production risk allocated between the regulator and operator.
16 For details of the conference series, refer to: https://thredbo-conference-series.org
17 The full paper is available at: https://doi.org/10.1016/j.retrec.2018.04.003

8888 Moving People > Australian Bus and Coach Industry: a snapshot
Figure 9.1: The original STO (strategic/tactical/operational) framework from van de Velde (1997: 6), which has grown to become a Thredbo centrepiece.
Decision level General description Decisions
“Software” “Hardware”
StrategicLong term (5 years)
What do we want to achieve? General AimsTransport policy
Market shareProfitability
General service characteristicsAreas
Target groupsIntermodality
TacticalMedium term (1-2 years)
Which services can help to achieve these aims?
Detailed service characteristics
FaresImage
Additional services
VehiclesRoutes
Timetables
OperationalShort term (1-6 months)
How to produce these services?
SalesSelling activities
Information to the public
ProductionInfrastructure management
Vehicle rostering and maintenancePersonnel rostering and management
Table 9.1: Organising the tactical environment, adapted from Stanley and Longva (2010: 82)
ContextOperator has little scope to grow patronage
Operator has good scope to grow patronage
Regulator not prepared to spend to develop service
Tactical role with regulator, gross cost contract with incentive (patronage and operational performance)
Tactical role with operator, super-incentive contract
Regulator prepared to spend to develop service
Tactical role with regulator, gross cost contract with incentive (patronage, operational and qualitative performance)
Tactical role with operator, revenue/patronage incentive-based contract (high risk environment)
Table 9.2: Various cost/revenue sharing contractual arrangements, adapted from Stanley and van de Velde (2008: 24)
Revenue risk borne by…
Regulator (Shared) Operator
Production risk borne by…
Regulator Management contract
(Shared)Gross cost contract with shared production cost risk
Operator Gross cost contract
Gross cost contract with patronage incentive
Net cost contract
Net cost contract with shared revenue risk
Super-incentive contract18
18 These are common in many Scandinavian countries

8989Moving People > Australian Bus and Coach Industry: a snapshot
9 .3 Future competition and regulation issuesIn recent years, Thredbo has looked to the future in terms of where the competition and ownership space might head. Wong and Hensher (2018) envisaged a number of issues (roughly in this order) which may emerge to become important policy areas over the next 30 years.
> Multi-modal contracts—There is a move across government to enlarge contract regions and include complementary modes to enhance system integration and the customer experience. The recent multi-modal offering in Newcastle, Australia bringing together buses, ferries and light rail is a national first and a case in point. The private sector may form joint ventures to compete for these larger contract offerings.
> Access contracts—Railway (and perhaps also bus rapid transit) operators are looking at expanding their service offering to cover the first/last mile to/from stations, whether this be in the form of fixed route buses, flexible bus services (microtransit), carsharing or cycle hire. The implications of this on existing public transport demand and public transport contracts remain unclear. In Australia, though, Sydney’s Region 6 contract offering19 is a pioneering first of its kind to combine fixed route buses and on demand services. Under a gross cost contract model, an agreed number of ‘on demand service hours’ (excluding meal breaks and multiplied by each day type) is paid to the operator. There is no separate on demand kilometre rate.
> Next generation economic deregulation—Public transport contracts are shifting from their output-based form (delivering kilometres on defined modes) to outcome-based models which seek to deliver accessibility using any mode, maximising for network efficiency. There are opportunities to combine elements of competitive tendering and autonomous market initiative to create the next generation service delivery model.
> Intermediate mode regulation—Ridesourcing and microtransit provided by transportation network companies (and to a lesser extent cycle hire and carsharing) have had to battle outdated regulation to become mainstream (see Section 11). Opportunities exist for a more streamlined approach based on a common platform and incentive payments to better integrate intermediate modes with other modes (e.g., public transport).
> Autonomous vehicle regulation—The ownership model for autonomous vehicles will determine its implications for productivity, traffic congestion, road capacity and the urban form. Regulations and incentives can help pool vehicles and move the community towards shared mobility. Pricing signals can help discourage autonomous zero occupancy deadheading—the influx of which will clog cities.
> Mobility as a service (MaaS) contracts— A personalised, one-stop travel management platform digitally unifying trip creation, purchase and delivery
19 This contract has been won by eminent Thredbo contributor and ITLS alumnus Neil Smith (Chairperson of Transit Systems and Tower Transit).
across all modes can help move people away from vehicle ownership towards mobility consumed as a service (see Section 11). Mode-agnostic, mobility contracts offered by brokers/aggregators20 of the system to suppliers of transport assets/capacity can help deliver such service. There will also be the opportunity to implement road pricing (revisiting the 1960s topic which also characterised Thredbo’s early years) defined by time of day, geography and modal efficiency within this system to help optimise for network efficiency (Wong et al., 2017)—including, for instance, preventing an influx of point-to-point transportation.
> Urban aviation regulation—Uber and Airbus (and other players) are developing autonomous vertical take-off and landing aircraft with the view of using them for urban point-to-point transport. Regulations will be required surrounding new safety challenges as well as to minimise externalities on the urban realm (perhaps only permitting flight above existing roads below a certain altitude).
9 .4 Case study Singapore bus contracting modelOver a few years the Australian bus and coach industry has looked with interest to Singapore as they reform their bus industry and transition to a Bus Contracting Model (BCM). ITLS advised heavily in terms of the design of the BCM and continue to be well linked with the Land Transport Authority (LTA) as they continue the reform process.
Goh and Swee (2017) provides an overview of Singapore’s bus industry history, which historically (as is in Australia) has been operated on a wholly privatised model where bus operators own their assets, bore revenue and cost risks. There was a lack of contestability as incumbent operators had territorial monopoly through assigned licence to the operator. The BCM, modelled on the Perth and London model of management contracts, restructured the industry and transferred fare revenue and asset risks (owning buses, depots and fleet management systems) to the government (a gross cost model). One key motivation of the BCM was to strengthen the government’s ability to respond to changes in travel demand and service level expectations.
The BCM tender process truly took up all the values espoused by Thredbo. The level of transparency in the process lends itself to great confidence in the system and a large pool of competitors. Not only was the bid panel announced, but all bids and bid prices were made public. Such information is not forthcoming in Australia. There was also a heavy emphasis on quality in the evaluation which was conducted as a two-envelope process where bid prices were only considered after a quality prequalification round.
20 These may include existing mode-specific operators and forward-thinking non-mobility providers (e.g., technology startups, banks, property developers) working in partnership to exploit this new business opportunity. The conditions around which such businesses might want to invest in this new entrepreneurial model (or otherwise) is the focus of present research by the authors at ITLS.

9090 Moving People > Australian Bus and Coach Industry: a snapshot
The process of transition to the BCM was also handled well. Overseas visits were conducted with the union to Perth and London to have them see first-hand how bus workers would fare under a contracted model. A tripartite workgroup comprising the LTA, incumbent bus operators SBS Transit and SMRT Buses, the union, and the manpower ministry (chaired by a Senior Minister of State for Transport) was also set up to determine the transitional arrangement for the bus workforce. The agreed terms and conditions included that:
• all affected employees must be offered a job by an incoming operator
• employment terms and conditions for an affected employee cannot be worse-off
• affected employees have a choice to transfer to the new incoming operator or be redeployed by their current employer, where feasible.
The first three tranches were tendered (Table 9.3) and the remaining network placed on negotiated contracts (Table 9.4) with incumbent operators from 1 September 2016 which would progressively be subject to tender as those contracts expired (2-10 years). This rotating round regime maximises competition by not overburdening interested parties with potential contract offerings at the time. The transition to new operators was implemented during school holidays so as to minimise the impact on commuters.
Table 9.3: Singapore bus contracting rounds and winners
Tender round
WinnerBid price
(SGD for 5 years)
Cost rankDate
commenced
Number of buses (initially)
Number of routes
New depot
Bulim Tower Transit 556 million3rd cheapest of 8 shortlisted bids
May 2016 380 27 Bulim
Loyang Go-Ahead 498 millionCheapest of 8
shortlisted bidsSeptember
2016395 22 Loyang
Seletar SBS Transit 480 millionCheapest of 10 shortlisted bids
March 2018 380 24Sungei Seletar
Bukit Merah SBS Transit412-475 million
4th cheapest of 7 shortlisted bids
November 2018
340 18 Ulu Pandan
Source: Land Transport Authority
Table 9.4: Remaining contract rounds and offerings
Incumbent operator Package name Depot RoutesContract renewal
year
SBS Transit Bedok Bedok North 24 2023
SBS Transit Bishan-Toa Payoh Ang Mo Kio 24 2026
SBS Transit Sengkang-Hougang Hougang 30 2021
SBS Transit Clementi Bukit Batok 24 2025
SBS Transit Jurong West Soon Lee 26 2024
SBS Transit Sengkang-Punggol Sengkang West 12
SBS Transit Serangoon-Eunos Kim Chuan 23 2025
SBS Transit TampinesEast Coast (Integrated
Depot21)27 2024
SMRT Buses Sembawang-Yishun Mandai 23 2020
SMRT BusesChoa Chu Kang-Bukit
PanjangGali Batu 32 2023
SMRT Buses Woodlands Woodlands 21 2023
Source: Land Transport Authority
21 This will be a Singapore first in combining train stabling facilities for 3 MRT lines (East West, Downtown and the future Thomson-East Coast Line) plus an integrated bus depot.

9191Moving People > Australian Bus and Coach Industry: a snapshot
10 New technologies, business models and trendsIn this Section we take a look into the future at what new technologies and business models might mean for the Australian bus and coach industry. Excerpts from Wong (2018) cover new passenger transport entrants, on demand trials and the mobility as a service (MaaS) proposition.
10 .1 New entrants in the passenger mobility marketThe emerging transport paradigm is being shaped by a number of forces front and centre of which are new entrants in the passenger mobility market. Loosely dubbed transportation network companies (TNCs), these shared mobility providers offer carsharing, ridesharing and bikesharing under a variety of models. As of May 2018, there are 35 (and rapidly growing) active players in the Australian market (Figure 10.1) — all rarely profitable and supported by aggressive venture capital investors. Beyond these service providers, a host of related businesses (both startups as well as new ventures by multinationals) in the data business and as technology suppliers (building digital platforms and the like) have also spurned operating in the business-to-consumer, business-to-business and business-to-government spaces.
Major Australian players in the rideshare sector (aided by NSW government Point-to-Point reforms) include the homegrown GoCatch, Uber, and recent new additions Estonia’s Taxify, India’s Ola and China’s Didi Chuxing. What might be less recognised is that Japan is behind the entire ridesharing industry with SoftBank (its most successful investment being China’s Alibaba). SoftBank is the largest single shareholder in most ridesharing companies (including 15% of Uber) and has indeed pushed the company to retreat from many markets, recently selling its South East Asian business to Grab, following its exit from China in 2016 (competitors all being SoftBank-backed ventures), leaving India and Brazil as the next key battlegrounds.
In amidst big deals and big money is the question of how TNCs are interacting with conventional public transport providers and their impacts on travel behaviour and the broader urban realm. Evidence from the US shows ridesharing both competing and complementing traditional public transport, depending on market and demographic. There is also increasing evidence that TNCs are contributing to rising congestion in the urban core. However, little empirical data has been made available locally to draw conclusions in the Australian context.
An interesting question is why there are such few instances of collaboration between incumbent bus and rail operators and these new shared mobility players. In the US, there exists a number of cases of local governments and public transport operators cooperating with TNCs to provide integrated service, particularly in providing first/last mile connections. The are no such examples in Australia, with the sole exception being Canberra’s Night Rider+Uber initiative. In this instance, the ACT government has withdrawn their demand-responsive late-night buses from the suburbs and replaced them with more frequent service on their trunk
(Rapid) network. Using promotional codes, customers benefit from a $10 discount off their Uber connection from a public Night Ride service—of which the government contributes $5 with Uber subsidising the other $5. Taxi operators have lost out (despite being initially approached for this partnership) and evidence points to Uber driver-partners making better money from higher passenger turnover and shorter trips.
So why have we not seen more of these joint initiatives? There seems to be elements of suspicion, mistrust and territorialism amongst the incumbents’ view of (and even between) TNCs. The choice by Uber to compete head-on with brick and mortar players in every conceivable market (often whilst roadblocked by local authorities) certainly did not help its reputation, although many say this attitude is rapidly changing as a result of recent controversies and new leadership. Whilst their initial (understood) objective was to replace public transport, their tone these days is far more conciliatory wanting to cooperate and work with government agencies and public transport operators. Issues in power dynamics remain, however, particularly around the control of branding, the customer and data—not well suited to private industry who also hold these dearly. The Canberra exception with its public operator may show the necessity for government intervention to foster collaborative efforts, as supported by the development of government-led on demand trials in NSW.

9292 Moving People > Australian Bus and Coach Industry: a snapshot
Figure 10.1: Shared mobility providers in Australia—the vast majority of which have entered over the past three years
SShhaarreedd mmoobbiilliittyy sseerrvviicceess iinn AAuussttrraalliiaa
Source: MaaS Australia, MaaS Readiness Assessment in Australia – shared mobility services, 2017 14
35+ shared mobility Appsand more to come!
Source: Eldaly and von Hessberg, 2018
10.2 On demand pilots and trials
Many jurisdictions look to NSW and Sydney for government-led innovation in the passenger transport space. The Future Transport agenda embarked by the NSW government has now evolved into a strategic vision that is the 2056 Roadmap, which showcases (amongst other things) the role MaaS might play in the future. Importantly, Transport for NSW has followed through its 2016 Summit with demonstrated commitments and funding, including through on demand trials (Table10.1 in Metropolitan Sydney, Outer Metropolitan and soon to be Rural and Regional NSW.
NSW bus operators have responded enthusiastically, working in conjunction with technology providers such as Via, Routematch and TaxiCaller (though some have developed in-house products) to deliver some very innovative service offerings. Despite initially involving larger players such as Uber, these proposals have not proceeded. Each pilot varies in implementation, fare structures and operations which will allow government and industry to test what works and what does not. In 2017, the Rural and Regional on demand offering received over 70 expressions of interest from NSW operators. Some operators are developing their own on demand products independent of government though none have thus far been launched at the time of this report being prepared.
It is apparent, in order to adequately measure the success of any on demand trial, the data collated must also be able to aid in answering the following questions:
• what proportion are repeat customers
• are customers shifting from existing public bus services or from the private car
• what are the impacts on existing bus patronage
• are there any potential cost savings to replace fixed route buses with on demand services
• what are the impacts of a lack of fare/ticketing integration and fragmentation of the user base in the current implementation model (this maybe more difficult to test).
What on demand operators have shared is that far more people are using cash than expected, and also booking via their telephone interface, due to (at least initially) confidence issues around use of the service. The most successful systems to date have hence been those with a human element complementing the technological interface with the customer. To date, marketing efforts have also been poor, with many customers knowing about the service only after seeing the vehicles out on the road. It will be interesting to observe how many of these services are continued beyond their present pilot phase, and how they will integrate with (or displace) existing bus services in the future.
The Rural and Regional round also throws up the question of scalability for the on demand proposition. One point of reference is the ArrivaClick service (based on Via’s platform) in the town of Sittingbourne (Kent) in south east UK (population 60,000). The service enjoys higher utilisation per vehicle than Via’s product in New York City, as it quickly became the best option in town with the residents feeling a strong sense of ownership towards the service and using it for a host of trip purposes. It remains to be seen whether this level of success can be replicated in Australia.

9393Moving People > Australian Bus and Coach Industry: a snapshot
Table 10.1: On demand trials in NSW (as at mid-2018)
Start Date Service Name Lead OperatorTechnology
PartnerVehicle Type Vehicle Number
October 2017Punchbowl On Demand (POD)
Punchbowl Bus Company
?? Hino Poncho 1
November 2017 Transdev Link Transdev ??Mercedes Sprinter
4
November 2017 Ride Plus (Manly) Transdev ??Mercedes Sprinter
4
November 2017Ride Plus (Eastern
Suburbs)Transdev ??
Mercedes Sprinter
4
November 2017Keoride (Northern
Beaches)Keolis Downer
Via (formerly Routematch)
Toyota Corolla + Toyota RAV4
4+4
December 2017 BRIDJ Transit SystemsBRIDJ
(acquisition)Iveco Daily 5
January 2018Premier Illawarra
On Demand (PODPI)
Premier Motor Service
TaxiCallerToyota Hi-Ace
Commuter4
January 2018Newcastle
Transport On Demand
Keolis Downer Via BCI Proma LF 4
January 2018 Interline ConnectInterline Bus
ServicesThoreb BCI Citirider 12 2
January 2018 OurBus ComfortDelGro In-HouseToyota Hi-Ace
Commuter4
March 2018Keoride
(Macquarie Park)Keolis Downer Via
Mercedes Sprinter
??
May 2018Newcastle eBike
On DemandBYKKO ??
(Electric bikesharing)
156 ebikes, 19 docking stations
May 2018 Coast ConnectCommunity
Transport Central Coast
Liftango (formerly Routematch)
Renault Master Bus
??

9494 Moving People > Australian Bus and Coach Industry: a snapshot
11 Mobility as a service (MaaS)Mobility as a Service (MaaS) is a popular interpretation of future collaborative and connected urban transportation, centred on a changing society embracing a sharing culture which can satisfy mobility needs without owning assets such as a car. MaaS emerges because of opportunities afforded by digital information platforms to plan and deliver multi-modal mobility options in point-to-point trips and/or first-and-last mile travel to public transport journeys. MaaS packages will provide consumers with seamless mobility options with integrated payments through a single application in much the same way as unified mobile plans provide users with a choice of calls, text and data options.
The premise for the MaaS concept is to transform mobility based on asset ownership (usually, in the form of a private vehicle) to one where it may be consumed as a service. Whilst conventional public transport already exists as a service, the reality in Australian cities is that it cannot serve adequately all trip purposes at all trip times. Spatially, public transport is geared towards radial trips into the CBD and temporally during journey to work hours (where sufficient scale exists—the essence of mass transit in bringing many people onto a single vehicle). As such, public transport mode share remains low in Australian cities, let alone in rural and regional towns. With the advent of transportation network companies (TNCs), the idea is that public transport complemented with these shared mobility services (carsharing, ridesharing and bikesharing) can offer service on par and exceeding that of vehicle ownership. Various MaaS schemes have already been trialled around Europe for several years (e.g., UbiGo in Gothenburg and Whim in Helsinki).
The challenge in integrating public transport and shared mobility services are manifold. Firstly, an interconnected payment method is necessary, as well as an integrated journey planning algorithm. Whilst these exist as technological requirements, more challenging perhaps are institutional issues surrounding government regulation and strategic support, as well as business collaboration, memoranda of understanding and contracts between various parties concerning revenue sharing, branding and control of the customer. Many of these issues can only be determined having understood what consumers demand.
If realised, the MaaS concept promises benefits for all stakeholders. For customers, it provides a one-stop shop experience in transportation which is available already in other utility markets such as water and electricity. Depending on individual circumstance, MaaS will likely save consumers money as compared with private vehicle ownership, where many costs such as purchase, depreciation (and even maintenance) are generally perceived to be ‘sunk’, let alone the costs imposed on society borne by us all. For transport operators, MaaS exists as a new opportunity to expand market share (but also at the risk of being consumed by other players).
For government, MaaS offers the potential to reduce subsidy on existing contracted services (especially for buses). These opportunities exist in two dimensions (Wong et al., 2017):
• Spatially, MaaS can integrate on demand services in marginal environments (e.g., outer suburbs experiencing poor patronage) with successful mass transit corridors. First/last mile travel to railway stations is a particular opportunity given parking constraints. However, challenges remain in meeting school travel demand
• Temporally, TNCs can supplement peak services, thus outsourcing the most expensive service by reducing peak vehicle requirements (a model rarely described). Experience from South Africa (minibus taxi and formal bus integration) shows the opportunity to reduce vehicle requirements by 40% on a single corridor.
ITLS has developed a framework surrounding the ecosystem for MaaS (Figure 11.1). Central to this are what the ITLS call mobility brokers/aggregators who bring together specialised businesses and value add by offering that integrating function. These mobility brokers purchase the transport asset/capacity from transport suppliers, including from bus and coach operators, then bundle these as mobility products for subscribers. Opportunities exist for suppliers to also take on this broker role, hence the blue box in the diagram (or they may be new entrants). Transport operators, platform providers and financial enterprises are crucial entities in the broker business model. Government will then alter its relationship with industry given this new mobility focus, including by reforming existing public transport contracts. Key concepts (shown by linkages) under the ITLS framework include:
• Mobility packages: Pay-as-you-go (PAYG) plans or subscription-based packages which bundle together various entitlements and grant customers a defined volume of access to each mode, similar to mobile plans which combine calls, text and data options (examples in Figure 11.2)
• Mobility contracts: Interface for bringing together interested businesses as partners under a new entrepreneurial model for delivering MaaS (the mobility broker/aggregator).
ITLS has used advanced modelling techniques to elucidate consumer and business preferences to design these bundled mobility packages and mode-agnostic mobility contracts. Findings will help inform where the bus and coach industry might head in the future.22
22 A compilation of ITLS MaaS research, including details of a forthcoming trial in Sydney, is available at: https://sydney.edu.au/business/news-and-events/news/2018/08/05/mobility-as-a-service.html

9595Moving People > Australian Bus and Coach Industry: a snapshot
Figure 11.1: ITLS proposed framework for the MaaS ecosystem, comprising the new function for a mobility broker aggregating different suppliers and delivering integrated service to demanders
Source: Wong et al., 2017
Figure 11.2: Individually tailored mobility packages tested in our ITLS research (Ho et al., 2018). Each MaaS plan was defined by a number of entitlements, including the quantity of public transport and carshare, as well as discounts on the use of taxi and uberPOOL. ITLS also tested whether credit rollover between each subscription period (fortnight) was important. The Current Travel Record refers to the respondent’s present travel behaviour—noting that it is usually far more expensive due to the (often hidden) costs of vehicle ownership

9696 Moving People > Australian Bus and Coach Industry: a snapshot
One of the key interests, concerns how MaaS might effect the design and specification of future bus contracts. Whilst present contracts are narrow, area-specific, output-based arrangements to deliver kilometres on defined vehicles types (i.e., buses), we believe future contracts may evolve to become broader, mode-agnostic, outcome-based mobility contract offerings where a broker/aggregator has the flexibility to deliver accessibility using any vehicle of their choosing. Clearly, margins will vary between modes, but it is in this context where opportunities exist for the MaaS operator to internally cross-subsidise between modes by breeding complementarity and deploying the type of service most appropriate for each market.
For the bus and coach industry, imminent developments bring enormous new business opportunities, but will also face the reality of greater competition as more and more players enter the mobility sector. It is encouraging to see many operators taking risks and pursuing opportunities to reinvent themselves from bus operators to wholescale mobility providers. Multinational operators have the resources for research and development but may be less agile in the Australian market due to their more complex business structures. Some local operators are particularly innovative, whilst many others take a “wait and see approach”. For some, however, their attitude may be that they “don’t believe” in on demand or MaaS and thus becoming oblivious to the latest developments. For technology players, the dogma often goes the other way—fervent enthusiasm without regard for broader societal implications or practical limitations.

9797Moving People > Australian Bus and Coach Industry: a snapshot
12 Bus rapid transit and branded bus servicesThe humble bus is often criticised. The underappreciated workhorse carries more people than trains even in cities with extensive rail systems (e.g., London), yet the age-old adage that buses are boring and trains are sexy holds stronger than ever. This belief resonates in Australian capitals despite buses accounting for the bulk of the passenger transport task from their sheer spatial availability, especially for shorter journeys in the inner city and as first/last mile services to rail in middle and outer suburbs (Wong and Hensher, 2019). As a result, the importance of bus dominates rail in passenger trip terms.
Despite this fundamental patronage/fact for buses as compared to rail, and the greater cost, rail has been the preferred modal choice for Australian governments at state and federal levels for decades. The well-documented saga that is choice versus blind commitment (Hensher, 1999, Hensher and Waters, 1994) continues to manifest itself around Australia, most recently in Canberra (Capital Metro), the Gold Coast (G:Link) and Sydney (CBD and South East Light Rail, and the proposed Parramatta LRT).
In an ideal world, we as a community ought to consider a transport problem objectively and then select the most appropriate transport mode to meet that challenge. This is a rational but often unpopular approach given that bus rapid transit (BRT often being most cost effective) simply does not typically resonate with the community nor carry the same political benefits as rail. This is often the result of the public’s existing experiences and biases on buses and trains (Hensher et al., 2019). Indeed, bus services are conventionally perceived to be slow, polluting and unreliable (with poor service frequencies and ride quality) as there has been a constant failure to argue that service quality is a result of right-of-way (i.e., linked to congestion-induced travel time delay) and not traction technology (rubber versus steel wheels). It is therefore difficult for the public to imagine a bus-based service offering (BRT) which carries over many of the characteristics intrinsic to rail (although the growing interest in ‘trackless trams’ is encouraging).
Over the past two decades, BRT-lite or branded bus services (BBS) have emerged as a cost-effective reform to improve the bus network. There is growing interest around Australia in these schemes with a dedicated brand identity (fleet, stops, marketing, etc.), coupled with some level of bus priority and operating on estimated wait times (at least from the customer perspective) as opposed to traditional timetables and schedules. Often, these are developed and implemented together with wider network rationalisation, simplifying route structures and stopping patterns and consolidating services onto high frequency trunk corridors.
Interestingly, BBS is not usually delivered in the context of a bus versus rail debate, but rather in a politically-motivated environment to deliver better bus services at a fraction of the cost base - and to do so quickly.
The rationale for BBS is that its distinct brand identity attracts patronage by making the bus network more legible and easier to navigate. Further, reforms usually follow best practices in network design, including a more appropriate mix of patronage versus coverage-oriented services (Walker, 2008, Nielsen et al., 2005), refined stop spacing
and positioning, and adding cross-town orbitals to create a more ‘gridded’ network (thereby enhancing connectivity) as opposed to the traditional focus on radial routes in and out of the CBD.
12 .1 Review of BRT and BBS - a study of 27 systems in AustraliaBus rapid transit (BRT) on dedicated right-of-way and branded bus services (BBS) with a distinct visual identity have been implemented in various forms around Australia over the past three decades. A major public policy debate has surrounded the relative success of these bus priority and branding measures as compared with generic route services in attracting patronage.
BIC’s Policy Paper 12: from workhorse to thoroughbred - a review of bus rapid transit and branded bus service performance in Australia and future opportunities, explores a metric known as a (gross) performance ratio to quantify the success for each of 7 BRT and 20 BBS systems as compared with regular route buses across six Australian capitals. Distinctive locational characteristics are identified of various bus priority and brand identity initiatives as a way of controlling for influences that are not under the control of the offered services, so that various systems can be meaningfully compared giving a net performance ratio. This allows an informed comparison between systems and cities, controlling for operating environment and other service characteristics.
The aim of the study was to evaluate the performance of BRT and BBS schemes in Australia, relative to generic route services in their respective six capital cities. Studied systems are summarised in Table 12.1 and are scored according to their BBS (fleet deployed and brand identity) and BRT bus priority characteristics. Services operating outside the standard contractual framework such as airport shuttles and tourist products were excluded in the study.
The first characteristic refers to whether a system is operated using a dedicated fleet. This allows for more specialised fleet characteristics including dedicated liveries and vehicle type (e.g., double-decker buses), but also reduces operational flexibility, resulting in increased vehicle and driver requirements. Brand identity refers to the prominence of a service against the broader network structure—none, where the service is unnamed (in contrast to the infrastructure name which often still exists); weak means that whilst the brand exists, it is not applied prominently nor consistently across customer-facing material; for medium, the brand is recognised consistently in timetables, network maps, bus stops and on the bus destination; and finally, strong signals a prominent branding applied across all mediums plus a fleet operated in dedicated livery. Bus priority can refer to a dedicated carriageway separated by a physical median or a dedicated lane with the potential for traffic conflicts (usually kerbside). The three levels refer to the proportion of the service granted each quality of bus priority. Signal priority in the form of induction-loop queue jumps and transponder-activated signals is captured within this characteristic.

As noted, premium bus services in Australia score highly either on brand identity or bus priority - but never both! This is peculiar and very much unlike implementation in other parts of the world. However, the tendency for branding elements not to accompany developed-world BRT implementation (especially in the US) - an example of BRT creep, but also the different institutional contexts at play. As such, all upgraded bus services in Australia can be categorised as either BRT or BBS - and can be considered mutually exclusive.
The results of the study of these BRT and BBS systems around Australia, reinforce the merits of upgraded bus services both as standalone initiatives and also as an alternative to expensive, rail-based infrastructure investment. Specifically, there are four key findings of policy relevance.
1. Australia has had some success with BRT and BBS, but in general, states and territories have not fully committed to nor funded in most instances these services to form the core of the transport network and thereby deliver the best patronage results.
2. The analysis of different BRT and BBS systems show that service productivity is higher than standard route services and that this could be improved through a variety of hard and soft factors including greater bus priority, turn-up-and-go frequency, increased service span, and the provision of real time passenger information.
3. Passenger boardings on BRT and BBS increases with the frequency of services and service kilometres (as quantity measures) and BRT/BBS boardings can be higher than light and heavy rail at a fraction of the cost for the equivalent service characteristics between rail and bus.
4. Australian BBS have had varying success but there is real room for expansion through simple and long-term consistency in marketing, common livery, network simplicity and customer information.
12 .2 Key recommendations for governments Fundamentally, any investment in public transport in our cities and regions should focus on the customer and giving them improved access to public transport, and this requires a recognition of the need to service all of metropolitan areas and not to focus on a few corridors that may deliver high patronage. Rail, in particular, is expensive, albeit popular, but typically is radial and directionally focussed on the central areas of cities (lacking circumferential service support). Changing land use is showing up significant gaps in public transport service levels that require cross-regional travel which is commonly serviced by the car due to the paucity of sufficiently attractive travel times provided by public transport. Greater frequency in localised corridors often carries the high risk of poor coverage and connectivity throughout an urban area creating disparities in equitable levels of public transport service provision. The great appeal of the bus is its flexibility in adjusting to changing demands for improved public transport and this is especially true where the opportunity exists to provide a dedicated corridor solution.
The need to find ways to make public transport more attractive in such settings suggests a greater role for bus, especially where it can be offered with significant bus priority. There is often a high amount of bus capacity in a metropolitan area but the great majority of that capacity has to compete every day with the car and other traffic in congested road settings. The call to ‘solve’ this by investing in more heavy rail (including metros) is a positive move but it is a very expensive one, and often ignores the possibility of a BRT or even BBS treatment as an initial first investment which may even have sufficient merit in time to continue as the preferred solution. The opportunity to deliver value for money for the taxpayers’ dollar has never been so real, as the call for greater investment in transport infrastructure comes at a time of increasingly scarce funding, given demands on the budget from other sectors such as health and education. There is increasing evidence of patronage appeal of BRT and BBS in contrast to regular road-based public transport services.
9898 Moving People > Australian Bus and Coach Industry: a snapshot

9999Moving People > Australian Bus and Coach Industry: a snapshot
Recommendation 1
In any assessment of future investment in public transport, the full range of public transport options should be assessed on a level playing field including the prospect of improving the service levels of existing services (which includes moving some existing regular bus services to BBS). This should be recognised through Infrastructure Australia and equivalent state organisations.
Recommendation 2
Greater visibility of bus services, approaching that of rail, should be a priority. While the patronage benefits have to be weighed up against the costs of upgrading public transport, the need for greater visibility of bus-based transport is clear and shown in this study as a significant contributor to potential patronage growth, after controlling for the environment within which the comparison of services are made.
Recommendation 3
Road-based rapid transit could be delivered in small-scale forms and incrementally ramped up so as not to require a massive initial investment. These require minimal expenditure on physical and network infrastructure and include change of service measures, branded buses and priority measures for existing routes through to dedicated right-of-way, where practical, by reallocating existing road capacity.
Recommendation 4
There should be greater government and community support in recognition of road based rapid transit due to its wider range of service types and flexibility of operation that can uplift the community and social inclusion value of an entire public transport network.
Recommendation 5
Given that road-based rapid transit provides the flexibility to operate on a closed and/or open system, including the provision of similar operations and customer service characteristics of rail-based rapid transit, then it should always be assessed as a possible alternative to a rail solution, especially light rail, and the recent interest in ‘trackless trams’ offers an appealing setting within which to promote this initiative.
Recommendation 6
The secondary impacts (network effects) of public transport priority on congestion, infrastructure savings, mode choice, social inclusion and land use are not well understood and has been identified as a research gap requiring further study. There is also a need for a coordinated multimodal approach in the assessment of frequent (trunk) services across Australia through the development of a consistent national benchmarking methodology so as to place different modes, cities and operational paradigms on a level playing field in service assessment and project appraisal.

100100 Moving People > Australian Bus and Coach Industry: a snapshot
Appendix 1
Solutions for Policy Thinkers Series
EXECUTIVE SUMMARY
TITLE SUMMARY DESCRIPTION
Policy Thinkers Series – 12
Moving People from Workhorse to Thoroughbred: Review of bus rapid transit and branded bus service performance in Australia and future opportunities
A major public policy debate has surrounded the relative success of bus priority and branding measures as compared with generic route services in attracting patronage. In this paper, a gross performance ratio is presented, to quantify the success for each of 7 Bus Rapid Transit and 20 Branded Bus Service systems as compared with regular route buses across six Australian capital cities.
The Paper provides 6 key recommendations to support a progressive commitment to positioning bus-based services within the broader remit of government to provide value for money investment in public transport in our cities and regions throughout Australia.
Policy Thinkers Series – 11 Published June 2019
Moving People in the Future: Land passenger transport and “new” mobility technology
This Paper explores socio-economic trends and their interaction with new technologies, largely by developing optimistic and pessimistic scenarios about how the future of land passenger transport might emerge in coming years.
Policy measures to help ensure that emerging transport technologies are net contributors to social welfare are outlined, including transport pricing reform, urban land use/transport planning to promote more compact towns and cities and to slow urban sprawl, together with shared mobility contracts to support social inclusion from local transport.
Policy Thinkers Series – 10 Published – May 2018
The value of getting there: mobility for stronger Australian regions
Mobility is a fundamental requirement for well-functioning regions and for the wellbeing of their residents (and visitors). This Paper first examines the potential for agglomeration economies from mobility improvements in Australian regions, concluding that this prospect is most likely to be relevant for those regions with the largest urban centres (e.g. 200,000 population).
Policy Thinkers Series – 9 Published – June 2017
Improved public transport services supporting city productivity growth: an Australian city case study
Australian cities are increasingly pursuing compact settlement. This paper explores the opportunities to use urban structure to promote productivity growth. It examines the contribution of population and employment density and travel times.
Policy Thinkers Series – 8 Published – August 2016
Local government roles in C21 integrated land use transport planning
This Policy Paper examines ways in which local government can support the major development directions and, based on the conclusions from the governance Policy Paper 6, be recognised as a vital partner in so doing. In this Paper we examine desirable development directions for our cities and regions, then explore local government roles in these directions, at both the strategic and local levels.
Policy Thinkers Series – 7 Published – April 2016
National Guidelines: Bus Services Procurement and Bus Service Contracts
The bus and coach industry has, for a long time, fostered relationships with academics, industry experts and government, to grow public transport services and patronage and to help develop contractual frameworks that support this growth. These connections and experience have been utilised in preparing the enclosed guidelines. These guidelines have been framed with public value uppermost in mind, while recognising the importance of a financially viable bus industry if quality bus services are to be provided on a sustainable basis for our communities.
Policy Thinkers Series – 6 Published – October 2015
Governance for integrated urban land use transport policy and planning
Australia is relatively unusual in having state governments responsible for (speaking for) capital cities. This role is more commonly associated with local government in some format. The difficulties Australian cities have in establishing and pursuing integrated strategic land use transport policy directions over time is partly a function of our adversarial political environment.
This Paper looks at governance, with a particular focus on integrated governance in land use transport policy and planning and how it might be improved in Australian cities, to enable them to deliver better economic, social and environmental outcomes.

101101Moving People > Australian Bus and Coach Industry: a snapshot
TITLE SUMMARY DESCRIPTION
Policy Thinkers Series – 5 Published – October 2015
Urban land use transport integration and the vital role for Australia’s forgotten inner/middle suburbs
Australia’s capital cities are all seeking to achieve more compact settlement patterns, as an essential element for improving their long term sustainability. The inner/middle suburbs are vital to successful outcomes. This is where most urban Australians live and work. This paper examines how strategic land use transport policy in our major cities can be shaped to promote productivity growth and better share the benefits from this productivity growth more widely among city residents.
Policy Thinkers Series – 4 Published – March 2015
Connecting Neighbourhoods: The 20 minute city
A ‘20 minute city’ is one in which most people are able to undertake most activities needed for a good life within a 20 minute walk, cycle or public transport trip from where they live. This Policy Paper puts forward that a neighbourhood structure embedded in a 20 minute city, with good local and regional transport choices, is likely to promote many positive outcomes in terms of personal and societal wellbeing, enhance liveability (which is already a strong international brand for our cities), as well as being cost effective to service and supportive of increased economic productivity. Flowon effects will include lower traffic congestion levels, improved health outcomes, lower accident costs, reduced emissions (greenhouse gases and air pollutants) and greater social inclusion.
Policy Thinkers Series – 3 Published – October 2014
Public transport: funding growth in urban route services
BIC’s various Moving People publications have made the case for increasing the provision of public transport services in Australia’s cities, both because of the benefits these deliver for service users but also, and perhaps more importantly, for the wider nationally significant economic, social and environmental benefits they deliver. A current Australian infrastructure backlog of about $150b had been estimated. Public transport forms an important part of this backlog.
Policy Thinkers Series – 2 Published – June 2014
Sustainable transport in Australian cities: targeting vehicle kilometres of travel
Overall urban densities in our cities need to increase by 50-100 per cent over the next 30-40 or so years, with allowance for local circumstances. This will enable greater availability of local services, including local public transport. Minimum density targets of about 35 people plus jobs per hectare should be adopted in land use/transport strategies/plans for our cities, to both support development of 20 minute neighbourhoods and provide an effective market for local and trunk public transport.
This Paper takes a unique approach to understanding the challenges of Australian cities and the interrelationship between land use strategies and reducing vehicle kilometres travelled.
Policy Thinkers Series – 1 Published – March 2014
Pricing opportunities for Australia: Paying our way in land transport
Pricing is the hot button issue in the infrastructure and transport policy space. Paying our way for the use of our roads is the key to ensuring that infrastructure gets built when and where it is needed. The BIC supports the development of a comprehensive user pays system for all road users that is based on the costs of maintaining and building roads and externalities related to driving that will generate future revenue to fund infrastructure and pay for better public transport services.

102102 Moving People > Australian Bus and Coach Industry: a snapshot
Special Edition Policy Papers
EXECUTIVE SUMMARY
TITLE SUMMARY DESCRIPTION
Published – April 2019
Coach solutions for driving land transport tourism
This Paper outlines a 10 year strategy policy for driving land transport tourism. There are 9 key areas that all levels of government and industry should adopt to increase travel by coach to generate dispersal of tourists from major cities and attractions to regional Australia and grow Australia’s tourism economy.
Published – May 2018
Australian Government’s role in the development of cities
Cities are becoming more complex and this poses challenges for policy and planning. Links between land use, transport, economic productivity, housing markets and social exclusion illustrate this complexity. Integrated governance is central to tackling such cross-cutting issues.
Awareness of the importance and urgency of taking more integrated approaches to city strategic land use transport policy and planning is widespread and practice is generally improving. However, the rate of improvement in land use transport planning capability in Australia, and more broadly, is running ahead of improvements in governance (and funding arrangements).
Published – July 2016
Improving public transport service: Hobart – A corridors case study
Hobart faces more traffic congestion problems and slower public transport unless city planners make sensible land-use and transport decisions going forward. This report finds that Hobart is very low density and car dependent, and that structural changes in the economy were leading to the highest productivity jobs being located in central or inner parts of the city. The study also found that jobs were moving in at the same time as people were moving out for cheaper housing, and Hobart’s fringe densities were as low as they went in Australian cities.
Published – March 2014
Rapid Transit: investing in Australia’s Transport Future
This report has been developed as a result of the Bus Industry Confederation undertaking a two week Rapid Transit Study Visit of North America in August and September of 2012 and information collected by the BIC’s internal research program. The report analyses the advantages of building Rapid Transit against benefits which can be achieved by simply improving existing transport networks, modal considerations notwithstanding.
Published – December 2012
Moving People Solutions for a Liveable Australia
This policy statement sees the BIC taking the lead in the national discussion on how we fund moving people infrastructure and services in the future. The aim of the report is to generate discussion about how Australia should shape its future land transport policy, to promote national goals for productivity, sustainability, liveability and social inclusion.
Industry Guides and Advisories
EXECUTIVE SUMMARIES
TITLE SUMMARY DESCRIPTION
Published – March 2019
Bus Fire Evacuation Protocol
This Advisory was developed as part of a safety project funded by the federal government through the Heavy Vehicle Safety Initiative Funding Agreement, administered by the National Heavy Vehicle Regulator (NHVR). The lead entity in delivering this project was the Bus Industry Confederation (BIC), overseen by a Working Committee and by representatives from the NHVR.
The objective of the Advisory is to assist bus and coach operators in the delivery of tangible improvements in heavy vehicle safety with the adoption of a bus fire evacuation protocol including associated training packages that can be used to train bus drivers on how to reduce the risks associated with bus fires. A dedicated website has been setup as a one-stop-shop for the Advisory and associated materials and templates from which operators are free to use. www.movingpeople.com.au/bus-fire-evac

103103Moving People > Australian Bus and Coach Industry: a snapshot
TITLE SUMMARY DESCRIPTION
Published – April 2016Tyre Operations & Maintenance – Industry Advisory
This Advisory was developed by the bus and coach industry in order to assist bus operators in the adoption of appropriate policies and procedures relating to the safe operation, maintenance and management of bus tyres.The Advisory contains critical information and practical guidelines in the following key areas:
• understanding the specification of a tyre and its components
• compliance Regulations for tyres and effects of increased mass limits
• tyre retreading requirements and the process
• tyre fleet costs and buy or lease options
• reducing full life cost of tyres
• maintenance guidelines.
Published – March 2015National IR & Workplace Health & Safety Guide
This Guide has been edited by Australian Public Transport Industrial Association (APTIA). APTIA is the industrial arm of the BIC. This guide is a one-stop document for Bus & Coach Operators on matters relating to:
• Casual Employment
• Employment Contract (Fair Work Act)
• Employment Rights
• Work Health & Safety
• Policy templates (such as: bullying/harrassment, drug & alcohol, gender equality, record keeping, etc.)
• Health & Wellbeing of the workforce
Published – March 2015Health & Wellbeing Awareness Guide
This Guide is for all employers interested in promoting health and wellbeing in their employees to encourage a more productive and active workforce. This is an industry specific Awareness Guide.
Published – September 2014Fire Mitigation Advisory – Industry Advisory
Fire mitigation on buses is seen as a key safety issue for bus operators and drivers, bus suppliers and manufacturers, bus passengers and government agencies at all levels. Currently every week in Australia at least one bus experiences a potentially fatal fire incident. The potential for a fatal bus fire in Australia does exist, especially for buses operating in high density urban environments or in traffic tunnels.
This Advisory has been developed as part of a joint project undertaken by the Bus Industry Confederation (BIC) and the Queensland, New South Wales and Western Australia transport authorities, to capture in one document the key actions to reduce the frequency and severity of fire on buses.
Published – October 2012Door Safety Advisory – Industry Advisory
This Industry Advisory is a guideline on how to adopt and maintain proven successful door safety systems used by the bus and coach industry to ensure safe work practices by drivers and to ensure the safety of passengers.
Published – October 2012Accessible Transport Standards – Operator Guidelines
Comprehensive guidelines on the Accessible Transport Standards under the Disability Discrimination Act. This guide covers critical legislation, definitions, compliance time frames and how to achieve the compliance and techniques for communicating with people with disabilities.
Published – June 2012Incident Management Guide – Operator Guidelines
The purpose of this guide is to provide specific guidelines on managing incidents to minimise the direct impact on staff and passengers (and indirect impact on family, friends and community). Bus and coach operators will learn how to minimise business risk, disruption and loss and ensure that services are provided in line with community expectations, duty of care and occupational health and safety requirements.
Published – 2007Environment Management System Guideline
The purpose of this manual is to provide bus and coach businesses with a step by step guide to environmentally responsible management of their daily operations. The manual has been designed for bus and coach operations of all sizes, including owner-drivers or single vehicle operations. This Guideline aims to:
• outline general environmental responsibilities
• provide advice on getting started
• detail how to develop an Environmental Management System (EMS)
• help organisations to incorporate environmentally sensitive practices into existing maintenance regimes and business practices.

104104 Moving People > Australian Bus and Coach Industry: a snapshot
Research
Essential Services
Manufacturing
Long Distance, Tour and Charter
Industrial Relations
Cities and Infrastructure
Value Capture
Innovative Funding
PT Contracts and Benchmarking
Regulation and Reform
Industry Standards
Accessibility and Social Inclusion
Technical, Environment and Safety
Zero Emissions
105105Moving People > Australian Bus and Coach Industry: a snapshot
Appendix 2 Bus and coach industry briefing paper on policy and advocacy directions and current issues [May 2020]The purpose of this document is to report on the bus and coach industry to state and federal government ministers, shadow ministers, senior officers in various Departments involved in transport, planning, roads, infrastructure, cities and tourism portfolios. This report would usually form the basis for a meeting agenda in a face-to-face environment across Australia with the BIC Chairman and BIC Executive Director. During this current period of pandemic disruption, this traditional ‘BIC on the Road’ report will be circulated via email communiques and meetings established by means of voice or video as required.
Research work program 2019-2022The Research Work Program 2019-2022 was agreed by the BIC Council on 4 April 2020 and is available on request.
Key research publication recently released or for release in 2020/21 include:
> Policy Paper 11 – Released 2019.
Moving People in the Future: Land passenger transport and “new” mobility technology was published in June 2019. The substance of this report formed the foundation of the BIC submission to the House of Representative Inquiry into Automated Mass Transit. The BIC appeared as a witness to this committee in February 2019. The Hansard record of the evidence provided by the Executive Director is available on request.
> Moving People - The Bus and Coach Industry in Australia – A Snapshot.
The BIC has commissioned ITLS Sydney University to undertake research to support a 2020 snapshot of the Australian Bus and Coach Industry.
> Moving People: from workhorse to thoroughbred - a review of bus rapid transit and branded bus service performance in Australia and future opportunities
> A Cities Report looking at Federal Government House of Representative and Senate Inquiries from 2017 to 2020.
Bus services are an essential serviceThe Bus Industry Confederation (BIC) and the Bus Australia Network (BAN) have long presented the case for public transport services to be recognised as an essential service. The continuation of public transport services under current industrial relations laws is not guaranteed as a result of
industrial action such as strikes and withdrawal of labour. Unlike the Qantas case several years ago, public transport is not recognised as an essential service, and the Minister has no “step in rights“ to cease industrial action.
The BIC has argued for many years that public transport should be recognised in the Fair Work Act as an essential service. It is the BIC’s contention that if public transport services including bus public transport services, (buses carry more passengers per day than any other mode) are stopped due to industrial actions for any prolonged period, it will lead to significant economic and social dislocation. It should be noted that public transport is recognised as an essential service in a number of western developed economies.
By Economic and Social Dislocation We Mean:
Mass transit
Public Transport is a mass transit provider and despite Australia’s relatively low patronage/passenger trips taken by public transport (about 8% to 10% of trips) public transport is a major contributor to keeping our cities and regions moving and managing the impact of congestion and its productivity impacts on the economy. If public transport was stopped overnight, cities that generate 80% of the value of Australia’s GDP would grind to a halt.
Social transit
Public Transport is a social transit provider and provides a vital link to people who are less well off, without a car, cannot afford a car, cannot drive or don’t have a license; public transport moves people to connect to services, employment, education, social and recreational activities that are important to an individual’s social well-being and their contribution to the economy and society. If public transport was stopped overnight a large part of the population would be socially isolated and the health impacts of this would be have a significant impact on the economy and community.
The disruption of mass and social transit on a large scale as a result of industrial action or a health crisis such as the Covid-19 pandemic, demand that public transport is recognised as an essential service and the appropriate action be taken for public transport to continue to operate.
In the case of the Covid-19 pandemic, how public transport can continue to operate and minimise health risk for bus drivers and bus passengers is the key issue at hand that involves state and territory contractual arrangements, bus service operational issues and health risk and management issues.
This is further explored with an industry perspective for all governments to consider immediately in the case of the current pandemic and put in place an essential service strategy for public transport going forward.

106106 Moving People > Australian Bus and Coach Industry: a snapshot
Industry position on managing Covid-19Government contracted public transport services include route or commuter services in our cities and regions that involves high and low volume passenger services related to where the services are provided and the time of day/night and school bus services.
Key Proposals for safe service operations of buses
• Temperature testing of drivers and staff.
• Drivers offered to wear effective masks.
• No cash payments
• Rear and middle door entry where available.
• A conductor to be introduced as a temporary measure on all city services and peak town services to manage passenger numbers and seating and cleaning of hard services on bus.
Key Proposals for business assistance of bus operations
• Suspension of the Road User Charge (RUC) component of fuel excise for buses and coaches. This would mean a full rebate of fuel excise paid for fuel used for the purposes of bus and coach travel as applies to miners and farmers operating off road. Currently fuel excise is 43.2 cents per litre of which buses and coaches and Industry can claim approximately 27.3 cents per litre as a rebate and the difference is the RUC which is currently frozen at 25. 8 cents per litre. Industry is seeking government to continue with the proposed suspension of the RUC due to Covid-19 and for an agreed period of time (no less than 6 months), after return to normal services.
• Suspension or waiving of government fees, taxes and charges (mainly state based) such as payroll tax, registration fees and certificates of insurance fees.
• Suspension of road tolls for buses and coaches for an agreed period.
Key Principles for bus service contracts
A number of temporary working arrangements (principles) could be considered to enable bus operators and relevant authorities to be responsive to the changing and foreseeable Covid-19 scenarios.
A starting point in recognising public transport as an essential service is that the continuation of bus services and timetable arrangements is assured in some form depending on the circumstance.
The continuation of services in the context of Covid-19 based on patronage and social distance measures could mean:
• consideration of increasing bus services in peak commute periods, where patronage levels are still high, by running more frequent services or another bus on the same timetable to split passengers per bus/social distance
• in the case of patronage decline maintain the peak hour commute timetable and reduce frequency of off-peak services to one hour
• consider as a last resort, holiday or weekend time-tables based on declining patronage
• school services to operate until such times as schools
are shut down.
The following principles are suggested but may vary dependent on differing contractual arrangements in each state and territory. These principles should form the basis for discussion between state associations, bus operators and relevant
authorities.
Review and agree the processes required to:
• implement any restrictions, alterations and cancellations of services
• deal with circumstances where a bus operator is unable to deliver services due to Covid-19 related issues
• provide ongoing support by the Authority for bus operators and their employees who may otherwise be adversely affected through loss of income
• establish arrangements for ongoing consultation with bus operators and monitoring, including any proposed temporary arrangements put in place
• implement temporary arrangements consistent with the requirements for variations under Bus Service Contracts.
• consider an agreement by the parties to treat the Covid-19 Emergency as though it is a Force Majeure Event under the Contract on a state by state basis.
• more flexible work conditions that enable employers the ability to keep their employees gainfully employed whilst experiencing a downturn in service requirement.
The De-Regulated Sector – long distance, tour, charter and express services
This sector of Industry has stopped like many other industries/businesses.
No passengers means no tours and no charters which is largely due to the obvious issues related to travelling on buses and coaches for extended periods of time and distance. This sector of Industry has gone into hibernation as a result of COVID 19. As examples, passengers are not undertaking:
• long distance tourism travel trips such as East Coast “hop on hop off” backpacker tours, around Tasmania
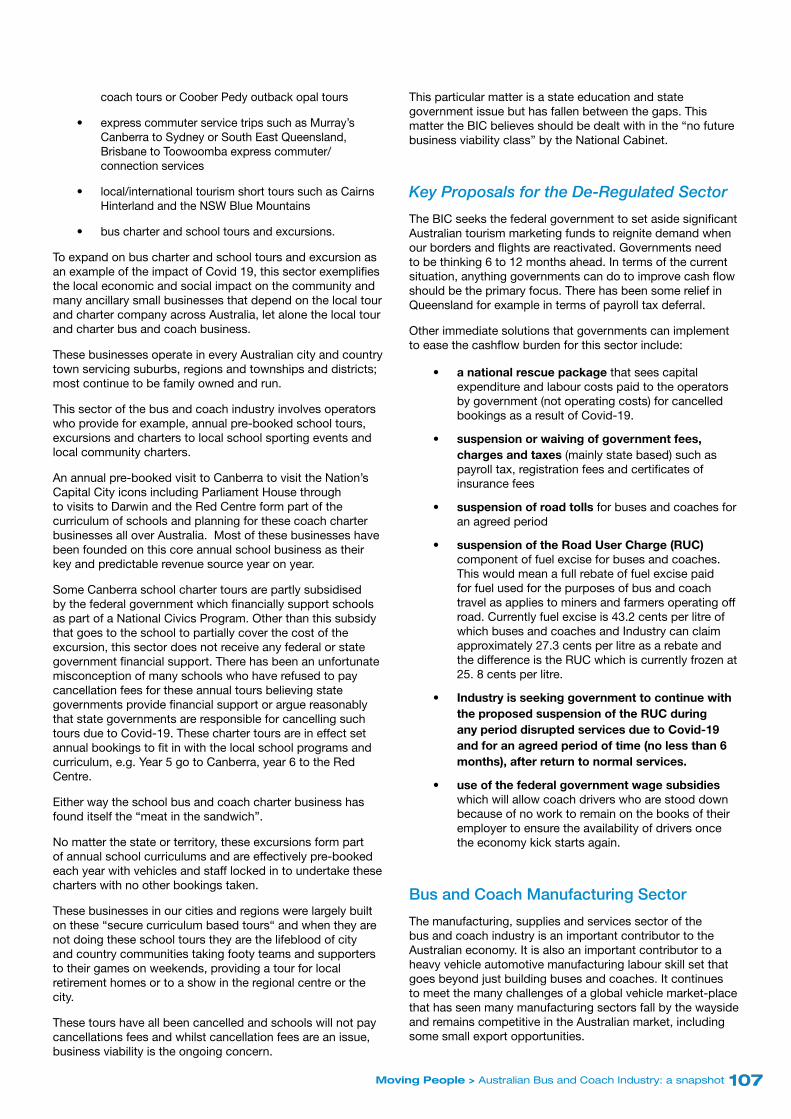
107107Moving People > Australian Bus and Coach Industry: a snapshot
coach tours or Coober Pedy outback opal tours
• express commuter service trips such as Murray’s Canberra to Sydney or South East Queensland, Brisbane to Toowoomba express commuter/connection services
• local/international tourism short tours such as Cairns Hinterland and the NSW Blue Mountains
• bus charter and school tours and excursions.
To expand on bus charter and school tours and excursion as an example of the impact of Covid 19, this sector exemplifies the local economic and social impact on the community and many ancillary small businesses that depend on the local tour and charter company across Australia, let alone the local tour and charter bus and coach business.
These businesses operate in every Australian city and country town servicing suburbs, regions and townships and districts; most continue to be family owned and run.
This sector of the bus and coach industry involves operators who provide for example, annual pre-booked school tours, excursions and charters to local school sporting events and local community charters.
An annual pre-booked visit to Canberra to visit the Nation’s Capital City icons including Parliament House through to visits to Darwin and the Red Centre form part of the curriculum of schools and planning for these coach charter businesses all over Australia. Most of these businesses have been founded on this core annual school business as their key and predictable revenue source year on year.
Some Canberra school charter tours are partly subsidised by the federal government which financially support schools as part of a National Civics Program. Other than this subsidy that goes to the school to partially cover the cost of the excursion, this sector does not receive any federal or state government financial support. There has been an unfortunate misconception of many schools who have refused to pay cancellation fees for these annual tours believing state governments provide financial support or argue reasonably that state governments are responsible for cancelling such tours due to Covid-19. These charter tours are in effect set annual bookings to fit in with the local school programs and curriculum, e.g. Year 5 go to Canberra, year 6 to the Red Centre.
Either way the school bus and coach charter business has found itself the “meat in the sandwich”.
No matter the state or territory, these excursions form part of annual school curriculums and are effectively pre-booked each year with vehicles and staff locked in to undertake these charters with no other bookings taken.
These businesses in our cities and regions were largely built on these “secure curriculum based tours“ and when they are not doing these school tours they are the lifeblood of city and country communities taking footy teams and supporters to their games on weekends, providing a tour for local retirement homes or to a show in the regional centre or the city.
These tours have all been cancelled and schools will not pay cancellations fees and whilst cancellation fees are an issue, business viability is the ongoing concern.
This particular matter is a state education and state government issue but has fallen between the gaps. This matter the BIC believes should be dealt with in the “no future business viability class” by the National Cabinet.
Key Proposals for the De-Regulated Sector
The BIC seeks the federal government to set aside significant Australian tourism marketing funds to reignite demand when our borders and flights are reactivated. Governments need to be thinking 6 to 12 months ahead. In terms of the current situation, anything governments can do to improve cash flow should be the primary focus. There has been some relief in Queensland for example in terms of payroll tax deferral.
Other immediate solutions that governments can implement to ease the cashflow burden for this sector include:
• a national rescue package that sees capital expenditure and labour costs paid to the operators by government (not operating costs) for cancelled bookings as a result of Covid-19.
• suspension or waiving of government fees, charges and taxes (mainly state based) such as payroll tax, registration fees and certificates of insurance fees
• suspension of road tolls for buses and coaches for an agreed period
• suspension of the Road User Charge (RUC) component of fuel excise for buses and coaches. This would mean a full rebate of fuel excise paid for fuel used for the purposes of bus and coach travel as applies to miners and farmers operating off road. Currently fuel excise is 43.2 cents per litre of which buses and coaches and Industry can claim approximately 27.3 cents per litre as a rebate and the difference is the RUC which is currently frozen at 25. 8 cents per litre.
• Industry is seeking government to continue with the proposed suspension of the RUC during any period disrupted services due to Covid-19 and for an agreed period of time (no less than 6 months), after return to normal services.
• use of the federal government wage subsidies which will allow coach drivers who are stood down because of no work to remain on the books of their employer to ensure the availability of drivers once the economy kick starts again.
Bus and Coach Manufacturing Sector
The manufacturing, supplies and services sector of the bus and coach industry is an important contributor to the Australian economy. It is also an important contributor to a heavy vehicle automotive manufacturing labour skill set that goes beyond just building buses and coaches. It continues to meet the many challenges of a global vehicle market-place that has seen many manufacturing sectors fall by the wayside and remains competitive in the Australian market, including some small export opportunities.

108108 Moving People > Australian Bus and Coach Industry: a snapshot
The BIC estimates that in the manufacturing of the completed bus, $5 billion is contributed to the Australian economy each year and close to $1.5 billion in supplies and services to keep the bus operational and delivering services.
The BIC estimates that the manufacturing sector employs more than 10,000 people in Australia including a strong network of Australian and global component manufacturers (eg. public transport seats) and suppliers that support the build of a bus (eg. air conditioning units) most of whom have setup businesses in Australia.
The BIC recommends that state and territory governments vehicle replacement procurement for bus and coaches be maintained if not accelerated to support the sector and retention of jobs.
Industrial relations and workplace health & safety
Industrial Relations 2020
The Australian Public Transportation Industrial Association (APTIA) is the industrial arm of the Bus industry Confederation and will focus on a range of issues in 2020 including recognition of public transport bus services as an essential service and the finalisation of the 4-yearly review into the modern awards including the Passenger Vehicle Transportation Award 2010.
APTIA will monitor the 2019 decision in the Skene case. This case relates to the payment of leave entitlements to employees who are considered casual employees but have a regular expectation of continued work and therefore entitled to such leave. This could have significant impact on the Industry. The Skene case is now being tested in Rossato’s case in which the federal government has intervened.
APTIA will monitor the decision in the Mondelez case, which decided that personal leave should be calculated by the day not hours. This has been appealed to the High Court and the federal government has intervened in this case.
In both cases the Federal Industrial Relations, Minister, the Hon Christian Porter has indicated the government will introduce legislation to overturn any decisions that impact unfairly upon employers.
The Minister for Industrial Relations has also identified a number of issues that will form the basis of any legislative changes this include matters specific to the passenger transport industry:
• casual employment
• improving protections of employees, wages and entitlements
• unfair dismissals
• enterprise bargaining.
Bus driver violence and abuse
The BIC supports all states and territories introducing strong penalties for attacks on bus drivers and putting bus passengers at risk.
The BIC is concerned about the increased levels of abuse and violence directed at bus drivers (and passengers) and calls for a strong regime of penalties to be introduced in parallel with an ongoing information campaign to inform the public of the consequences and seriousness of committing crimes on people providing a public service to the community.
The BIC is undertaking a joint initiative with the Australian Railways Association, Rail Tram and Bus Union and TrackSafe. Patronage on public transport continues to grow and so too do incidents of anti-social behaviour and violence towards transport staff. Like emergency personnel, public transport staff provide a vital service for our communities, assisting millions of Australians to travel around our cities and regions daily. These individuals deserve to go to work and do their job without threat or harm so they can return home safely.
The Western Australian Government first led the way in 2009 when it introduced mandatory jail for assaults against public officers (police, ambulance officers, transit guards, court security officers, prison officers and youth custodial officers). The legislation was further strengthened in 2014, introducing a minimum jail term of 12 months for grievous bodily harm to public officers; nine months for bodily harm (in circumstances of aggravation); and six months for assault causing bodily harm. Calling the legislative changes “an effective deterrent against violence”, in 2016, the Western Australian Government reported that a 26 per cent reduction in assaults against public officers and a 35 per cent reduction in incidents obstructing public officers had been achieved since amending the legislation in 2009. In March 2016, the South Australian Government demonstrated its value for and commitment to public transport staff by increasing penalties for assault on transport staff to equal that of assaulting emergency services personnel.
Rather than wait for another victim to act, we implore all jurisdictions/Ministers to adopt a similar approach in Queensland by amending legislation to include increased penalties for those who assault public transport staff and then ensuring these heightened penalties are applied. Anti-social and violent behaviour towards public transport staff is unacceptable. Elevating penalties to align with assaults on emergency services staff will reinforce to the travelling public that abusing and assaulting transport staff whilst they are simply doing their job will not be tolerated.
Safety of all persons is the number one priority for public transport operators, including staff. To address anti-social behaviour and assaults on staff, public transport operators should educate customer-facing employees in protective personal violence elimination security approaches such as (but not limited to):
• maintaining situational awareness
• effective communication techniques
• de-escalation methods
• best practice security support to staff through empirically validated advances in security technologies (body-worm cameras, CCTV, security screens and duress alarms).
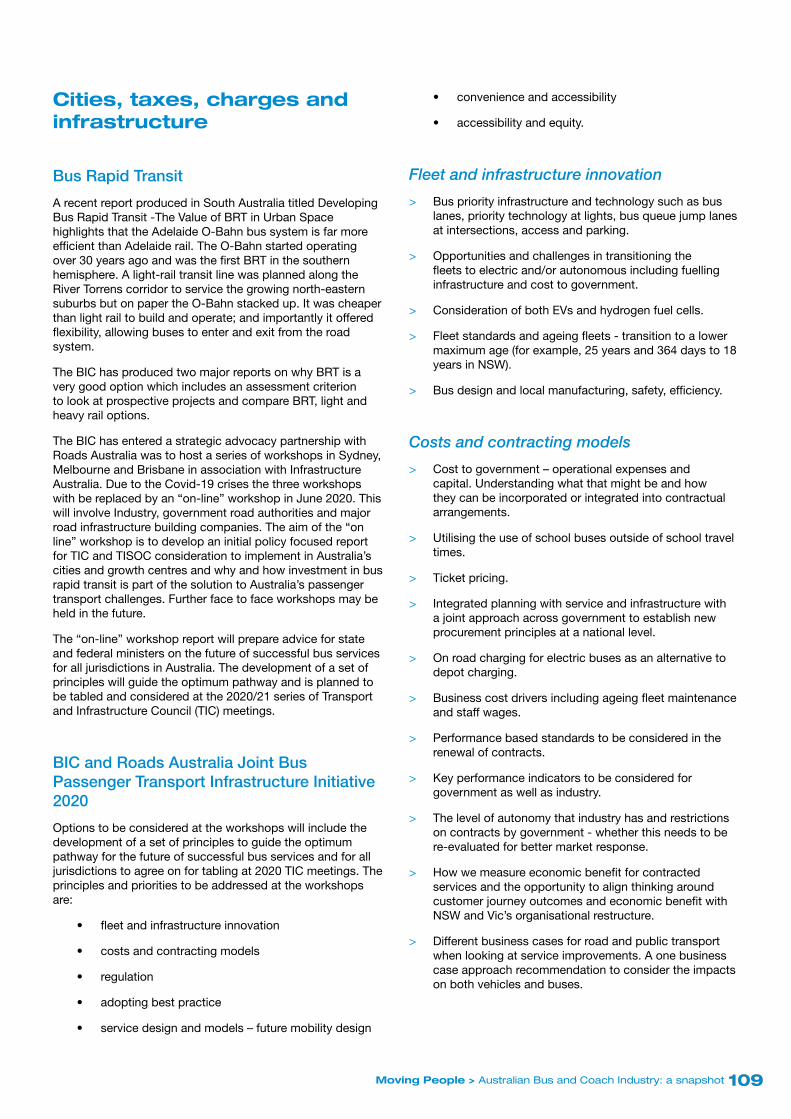
109109Moving People > Australian Bus and Coach Industry: a snapshot
Cities, taxes, charges and infrastructure
Bus Rapid Transit
A recent report produced in South Australia titled Developing Bus Rapid Transit -The Value of BRT in Urban Space highlights that the Adelaide O-Bahn bus system is far more efficient than Adelaide rail. The O-Bahn started operating over 30 years ago and was the first BRT in the southern hemisphere. A light-rail transit line was planned along the River Torrens corridor to service the growing north-eastern suburbs but on paper the O-Bahn stacked up. It was cheaper than light rail to build and operate; and importantly it offered flexibility, allowing buses to enter and exit from the road system.
The BIC has produced two major reports on why BRT is a very good option which includes an assessment criterion to look at prospective projects and compare BRT, light and heavy rail options.
The BIC has entered a strategic advocacy partnership with Roads Australia was to host a series of workshops in Sydney, Melbourne and Brisbane in association with Infrastructure Australia. Due to the Covid-19 crises the three workshops with be replaced by an “on-line” workshop in June 2020. This will involve Industry, government road authorities and major road infrastructure building companies. The aim of the “on line” workshop is to develop an initial policy focused report for TIC and TISOC consideration to implement in Australia’s cities and growth centres and why and how investment in bus rapid transit is part of the solution to Australia’s passenger transport challenges. Further face to face workshops may be held in the future.
The “on-line” workshop report will prepare advice for state and federal ministers on the future of successful bus services for all jurisdictions in Australia. The development of a set of principles will guide the optimum pathway and is planned to be tabled and considered at the 2020/21 series of Transport and Infrastructure Council (TIC) meetings.
BIC and Roads Australia Joint Bus Passenger Transport Infrastructure Initiative 2020
Options to be considered at the workshops will include the development of a set of principles to guide the optimum pathway for the future of successful bus services and for all jurisdictions to agree on for tabling at 2020 TIC meetings. The principles and priorities to be addressed at the workshops are:
• fleet and infrastructure innovation
• costs and contracting models
• regulation
• adopting best practice
• service design and models – future mobility design
• convenience and accessibility
• accessibility and equity.
Fleet and infrastructure innovation
> Bus priority infrastructure and technology such as bus lanes, priority technology at lights, bus queue jump lanes at intersections, access and parking.
> Opportunities and challenges in transitioning the fleets to electric and/or autonomous including fuelling infrastructure and cost to government.
> Consideration of both EVs and hydrogen fuel cells.
> Fleet standards and ageing fleets - transition to a lower maximum age (for example, 25 years and 364 days to 18 years in NSW).
> Bus design and local manufacturing, safety, efficiency.
Costs and contracting models
> Cost to government – operational expenses and capital. Understanding what that might be and how they can be incorporated or integrated into contractual arrangements.
> Utilising the use of school buses outside of school travel times.
> Ticket pricing.
> Integrated planning with service and infrastructure with a joint approach across government to establish new procurement principles at a national level.
> On road charging for electric buses as an alternative to depot charging.
> Business cost drivers including ageing fleet maintenance and staff wages.
> Performance based standards to be considered in the renewal of contracts.
> Key performance indicators to be considered for government as well as industry.
> The level of autonomy that industry has and restrictions on contracts by government - whether this needs to be re-evaluated for better market response.
> How we measure economic benefit for contracted services and the opportunity to align thinking around customer journey outcomes and economic benefit with NSW and Vic’s organisational restructure.
> Different business cases for road and public transport when looking at service improvements. A one business case approach recommendation to consider the impacts on both vehicles and buses.

110110 Moving People > Australian Bus and Coach Industry: a snapshot
Regulation
> Commercial viability – the NSW example of a 24-seat bus mobility as a service option where the driver, vehicle and passengers are not covered in NSW P2P legislation due to being more than 12 seats.
> National Heavy Vehicle Law - safety record.
> Regulatory issues currently only based on contract.
> Rigid compliance with disability standards.
> Areas and zones - the level of control by government in planning and limited impact of local councils.
Adopting best practice
> Common benchmarking of both industry and government.
> Assessing the key drivers of community satisfaction and customer satisfaction.
> Ensuring good research is conducted to determine data requirements and safety outcomes and how to transfer this knowledge to drive best practice.
> NSW inquiry into electric buses to examine the benefits and barriers to city and regional public transport fleets.
> Learning pilots and trials (for example, TfNSW and its current On Demand service trial) and transparency around the different models and their outcomes.
> Attracting and retaining staff in the industry and the challenges around this including population growth, congestion and increasing bus services.
Service design and models - future mobility design
> Changing markets and what technology might be introduced.
> On demand vs fixed scheduled services vs turn up and go and ensuring the bus mode has appropriate frequency and coverage.
> Importance of mass transit services and connectivity to rail.
> New business partnerships such as technology and bus companies.
> Councils - local area traffic plans impact bus services and therefore impact the reliability of the bus service.
> What drives the customer experience - Comfort - Improvement of regional and rural public transport connectivity.
> Improvement of local bus services in outer suburbs.
> Ensure services can cater for the disabled, mobility impaired, families and students.
Convenience and accessibility
> Ticket cost.
> One ticket solution for each state that is consistent with metropolitan areas.
> Enhancement of service and technology on buses including WiFi, USB charging, bus stops with real time data and bike racks.
Accessibility and Equity
> Improvement of regional and rural public transport connectivity.
> Improvement of local bus services in outer suburbs.
> Ensure services can cater for the disabled, mobility impaired, families and students.
Value capture and innovative fundingThe BIC supports the adoption of innovative funding and finance options including value capture as outlined in BIC’s Policy Paper 3: Public Transport: funding growth in urban route services.
Road User Charging
The BIC supports the introduction of road pricing for all road users based on use, like any other utility charge (i.e. electricity, water) as outlined in BIC’s Policy Paper 1: Pricing opportunities for Australia: Paying our way in land transport.
Road pricing could be introduced in stages as:
• heavy vehicle pricing
• general congestion charging
• time of day tolling.
The BIC supports the introduction of an independent heavy vehicle pricing regulator. The independent pricing regulator should differentiate between trucks and buses, taking into account external benefits such as reduced congestion, emissions and road wear.
Heavy Vehicle Charges and Road Reform trials
The NTC was tasked as part of its 2015-18 work program to investigate future pricing arrangements for heavy vehicles. This was to include a number of road pricing trials being managed through TISOC.
The Federal Minister at the time for Urban Infrastructure, Paul Fletcher, was taking a lead on this project and announced in late 2017 a National Heavy Vehicle Charging Pilot. This pilot under the new Minister Alan Tudge saw

111111Moving People > Australian Bus and Coach Industry: a snapshot
selected participants involved in a pilot program to test the replacement of registration fees and the fuel-based Road User Charge with a national direct user charge. The pilot will run initially through to 2020.
The Pilot has also established small targeted and temporary programs to look at location specific heavy vehicle charging trial proposals.
The BIC has sought the introduction of comprehensive road pricing for all road users and this national Pilot is a step in that direction.
The Business Case Program for Location-Specific Heavy Vehicle Charging Trials were sought in 2019 seeking ideas for potential trials to investigate the feasibility and willingness of industry to pay an additional charge (above PAYGO) for an additional level of access or improvement on identified routes. These types of trials are likely to be more suited to the trucking industry (e.g. road improvements to run higher productivity vehicles) but the federal Department was happy to explore how it could be applicable to buses and coaches.
The National Heavy Vehicle Charging Pilot involved designing and testing options to replace the fuel charge and registration fees. The first on-road stages of these trials are ‘cashless’ i.e. will involve participants receiving a mock invoice outlining what they paid under the current PAYGO system compared with an alternative mass-distance or mass-distance-location charge.
The Department designed how the on-road stage of the Pilot could work in practice e.g. how to measure mass (dynamically or through weight categories), requirements for telematics or paper based system, how to record location and distance, how to reduce the administrative burden for operators. The Department met with the BIC to work through these approaches and identify candidates for a small-scale rollout of the on-road stage. There is opportunity for bus operators to be involved.
Buslines and Bayswater Buslines have been participating in the pilot.
The Department is now running a National Heavy Vehicle Charging Pilot. The National Pilot is a partnership between government and industry testing potential direct user charging options for heavy vehicles. Representative of the Department were at the 2019 BIC Conference in Canberra to seek participation in the trial.
As mentioned, a Small Scale On-Road trial of the National Pilot has been running over the past 5 months with 11 participants (including 2 BIC members) and over 180 vehicles.
Similar to the Small Scale trial, the Large Scale On-Road trial is free to participate in and will include both telematics and manual reporting options to collect data. It will start in 2020 with 100 businesses and over 1000 vehicles across the country.
The Large Scale On-Road Trial is supported by the BIC as a means to an end to introduce a comprehensive road user charging system established for all road users and a great way for the bus and coach industry to have its say about potential alternative heavy vehicle charges, better understand current charges and talk directly to the Department about the National Pilot.
The Department is currently recruiting for the trial and looking for participants from Industry across all states and territories, particularly those with a small or medium sized fleet. This does not exclude large fleets. The BIC and State Associations are actively supporting the recruitment of bus companies to participate.
How the Large Scale On-Road Trial works
The Department states…
“There is no cost to participating in the Trial and the impost on your time is minimal.
Each month during the trial participants’ road use data will be collected using telematics or a manual reporting option * and a mock invoice will be produced. (*During the life of the trial, the Department will pay for installation of telematics or hubodometers for eligible businesses.)
The mock invoice will compare what you currently pay, registration and fuel-based charges, with a potential alternative charge based on mass, distance and location.
The mock invoice will also include data analysis; insights on fuel consumption; operational costs and broader industry trends. All data collected in the trials is protected under confidentiality agreements and cannot be shared outside of the project.”
It is important for all sectors of Industry to have a say in any future changes to Heavy Vehicle Charging. This is an important step to ensure that bus is clearly differentiated from trucks and freight when it comes to road charges.
The BIC seeks the support of all jurisdictions to be aware of the need to clearly differentiate between buses, coaches and trucks that takes into account the different operating task of passengers and freight and the positive and external benefits of travelling by bus and coach as opposed to single or low passenger car trip averages.
National PT contracts and benchmarking
Bus service procurement and contracts – A National Framework
In April 2016, the BIC published Policy Paper 7: National Guidelines for Procuring Bus Services and Bus Service Contracts, calling for the development of a national approach or framework within which the procurement of bus services is undertaken. It also lists how bus contractual terms and conditions, KPI’s (such as patronage, service levels) should be determined.
The ‘national framework’ would have an agreed set of parameters and guidelines whilst still allow for the idiosyncrasies that occur in each state/territory. It would also cover the types of services and purchase of vehicles.

112112 Moving People > Australian Bus and Coach Industry: a snapshot
The ‘national framework’ would apply to:
• existing and renewal of contracts
• tenders/contract negotiations
• procurement of vehicles and services.
Adopting a ‘national framework’ will:
• provide a level of consistency across tenders, contracts and vehicle purchasing arrangements
• give operators and manufacturers a level of certainty
• reduce costs – a micro economic reform that will save money for taxpayers, governments and businesses in every state and territory.
National Disability Insurance Authority
The BIC is seeking assurances from the NDIA, federal, state and territory governments about the continuation of special school bus services by contracted private operators. States and territories provide these services in different ways, but where private bus operators undertake the task, they have proven over a long period to provide cost effective transport services and provide the highest levels of care and professionalism. These special school services have been developed over many years in close partnership with the communities and schools they service and relationships with the families for whom they provide the services. They are in effect a part of a mature regulated marketplace that provides transport choices to parents.
National Travel to Learn and School Bus Travel Policy
The Bus Australia Network will continue to investigate the development of a National Travel to Learn and School Bus Travel Policy based on four principles:
1. Quality – Improving the quality, coverage and variety of bus services available for school travel.
2. Safety – Ensuring the safety of children travelling to school while they are on the bus and around the bus.
3. Fairness – Meeting the needs of all school children regardless of location, age and situation.
4. Efficiency – Establishing a system of funding and operation for school bus services which delivers value for money to government.
Goals of a National Position on Travel to Learn and School Bus Travel Policy
A National Travel to Learn and School Bus Travel Policy be based on three goals.
1. Achieving national harmonisation regarding regulation, accreditation and vehicle sourcing for school bus services.
2. The establishment of a jurisdictional taskforce to identify principles and guidelines to be adopted in school bus contracting, through BIC’s National Contracts Working Group.
3. Promoting and maintaining the high safety standards of school bus travel.
Regulation, reform and industry standards
Review of Heavy Vehicle National Law (HVNL)
The Review of HVNL should agree the following principles. The BIC has responded fully to the Consultation Papers in 2019.
Six key principles in the review of HVNL
1. Recognition that one size does not fit all when it comes to heavy vehicle law – different sectors have different needs. The HVNL should recognise the difference between truck and bus and the task undertaken including technical issues with vehicles and contracted operations – including specific recognition of a national minimum safety standard for accreditation for buses and coaches.
2. The HVNL should have a stronger performance and risk-based approach, that provides operational flexibility, is less prescriptive and offers performance based/alternative compliance approaches for operators to meet the law. This should include incentives for the operators and recognise good compliance performance and should include greater acceptance of technology as a compliance tool. The HVNL should not prescribe the technology only the compliance performance outcome and establish an appropriate alternative compliance enforcement regime that allows on road enforcement resources to be better targeted and for good operators to get on with the job.
3. The HVNL maintenance group is unnecessary. The law should be allowed to work and not be under constant scrutiny and review (generally by jurisdictions) where there are issues raised or problems identified, due to things like idiosyncratic industry operational needs or state differences. This would be better dealt with through NHVR and specific regulation to address these types of issues. The HVNL maintenance group is a contributing factor to promulgating state by state HV laws and undermining national uniformity.
4. The impacts of the HVNL on the future passenger task. The HVNL should be considered more thoroughly when it comes to buses, in the context of the future passenger task, the future impacts on the task such as population growth and congestion, automation and the efficient functioning, for example, of cities and the transport network. The HVNL should not be considered in isolation of these broader societal outcomes.

113113Moving People > Australian Bus and Coach Industry: a snapshot
5. The HVNL should be more focused on the use of technology to manage access and safety.
6. A Performance Based Standards (PBS) bus system is required. The PBS is too complex and limits productivity in many instances and simply adds costs because it is based on ‘old school paradigms’ about infrastructure, safety, environment and other factors that are focused on the negative and not providing access. The PBS should focus on productivity outcomes and how and what access can be achieved.
Controlled Access Bus network
The BIC is seeking the support of state and territory governments to prioritise through the NHVR work program and local government, the identification and mapping of high productivity, Controlled Access Bus networks in their state/territory.
Minimum bus safety accreditation – NHVR Accreditation
The BIC supports a minimum bus safety accreditation regime that is mutually recognised as “The Standard” for all bus operations across Australia including:
• government contracted services
• school and community services
• charter and touring services.
Each state and territory currently requires a level of accreditation to operate bus passenger services but with no consistency around what operators are doing to meet their legal obligations under HVNL.
The BIC has held discussions with the NHVR to coordinate with jurisdictions and Industry, an agreed accreditation regime that sets a minimum safety standard for passenger bus operations and services in Australia.
State and territory governments would retain administrative management of the state and territory based accreditation scheme but mutually recognise the minimum standard as the benchmark for all buses to meet to be entitled to pass through their jurisdiction.
The Standard would be based on 3 core modules.
1. The Driver – license, driver authority, health etc.
2. The Vehicle – road worthiness and maintenance records, etc.
3. The Operator (management) – driving hour records and other legal requirements, etc.
The Standard will:
• set a core set of safety standards adopted across all types of operations
• ensure all bus services operate safely and be mutually recognised across borders
• set a minimum audit regime consistent across all jurisdictions
• enable the flexibility for states to build additional requirements above The Standard within their own accreditation regimes.
The BIC does not support NHVR Codes of Practice for the bus Industry.
Performance Based Standards (PBS) specifically for buses
The PBS is a scheme operated under the jurisdiction of the National Heavy Vehicle Regulator (NHVR). The scheme allows vehicles to operate outside of the Australian Design Rules (ADR) standards as long as the vehicle complies with 16 minimum vehicle performance standards (to ensure they are stable on the road and can turn and stop safely) and 4 infrastructure protection standards.
The PBS scheme was originally designed primarily for trucks and the associated productivity benefits. Buses are eligible but take-up has been minimal as the scheme requires 100% pass mark for each of the 20 PBS criteria. Access to the road network is then classified (e.g. general access, restricted access).
Adopting a PBS scheme specifically for buses would:
• allow for an effective evaluation of environmental, social and infrastructure benefits of innovative bus vehicles above and beyond the current PBS criteria which is solely focussed on safety and infrastructure
• encourage higher productivity and safety through innovative and optimised vehicle design – for example a tri-articulated 25m bus or 14.5m steerable two axle bus.

114114 Moving People > Australian Bus and Coach Industry: a snapshot
Accessibility and social inclusion
Regional connectivity, accessibility and the decentralisation debate
The BIC supports a strong focus of federal, state and local governments on regional connectivity and accessibility between village, town, regional centre and city. Regional transport connectivity provides economic benefits and provides access to services, education, employment and recreation for those who don’t own a car, have access to a car or don’t/can’t drive.
The BIC’s Policy Paper 10: The value of getting there: mobility for stronger Australian regions and special edition policy paper: Australian Government’s role in the development of cities have a strong focus on regional transport and decentralised transport (no single entity controls everything).
The papers identify that transport connectivity and accessibility through transport infrastructure investment and improved passenger services are a major factor and attracter in achieving decentralisation outcomes.
The BIC supports regional passenger rail and coach transport services that support economic growth and promotes regional tourism and social inclusion.
Federal and state governments should support regular passenger transport services for regional communities, including coach services and facilities where no rail service exists. Regional coach services should connect passengers to their destination or closest rail service link.
The federal government should fund Regional Accessibility Committees in regional areas to coordinate travel needs with available transport assets as has occurred in Warrnambool and trialled in Port Pirie.
Accessible Transport Standards
The BIC participates on the National Public Transport Advisory Committee, (NAPTAC) and more recently in 2019-2020 the National Accessibility Transport Taskforce (NATT).
Key areas for consideration by state and local governments in regard the Standards and the bus and coach industry.
> Accessible Bus Stops and whole of Journey accessibility.
> Accessible Transport Standards compliance reporting.
> Labelling of mobility devices to identify complying mobility devices eligible to travel on public transport.
> Definition of charter services and whether the standards apply to charter services – Industry position is NO.
> The complaints process and Australian Human Rights Commission and cross over with other discrimination authorities.
> Safe carriage of people with a disability and alignment of accessible transport standards with the requirements of Australian Design Rules.
> Occupational Health and Safety impacts of Accessible Transport Standard requirements.
> Modernisation of the Standards.
National Accessibility Transport Taskforce Terms of Reference -Background
The Department of Transport and Main Roads (Queensland) (DTMR) and the Department of Infrastructure, Transport, Cities and Regional Development are establishing a taskforce to modernise the Disability Standards for Accessible Public Transport 2002 (DSAPT).
Purpose of NATT
The National Accessible Transport Taskforce (the Taskforce) will lead the modernisation of the DSAPT, recognising that state, territory and local governments have expertise and close relationships with industry and people with disability. A functional outcome is sought for public transport providers and operators that improves dignity, accessibility and inclusion for people with disability.
The Taskforce will deliver a modernised DSAPT drawn from the current standards and requirements under the National Construction Code (NCC). The Taskforce will be led by a Steering Committee which acknowledges that the Disability Discrimination Act 1992 and its accompanying disability standards as maintained by the Commonwealth, are the primary legal force to the elimination of disability discrimination. The Steering Committee will provide oversight and direction to the Taskforce and ensure that a national perspective is provided to the work of the Taskforce.
Guiding principles of NATT
This reform approach is built on the following guiding principles endorsed by the Transport and Infrastructure Council.
> People with disability have a right to access public transport.
The Disability Standards for Accessible Public Transport pursue the removal of discrimination against people with disability first and foremost. The reform process pursued must place people with disability at the centre of their considerations.
> Accessibility is a service, not an exercise in compliance.
An accessible public transport network anticipates and responds to the varying needs of its customers with disability. This requires thinking beyond compliance with minimum standards and toward a focus on accessibility as a service. The reform process should be open to engaging with opportunities to develop best practise, rather than minimum prescriptive standards.
> Solutions should meet the service needs of all stakeholders and be developed through co-design.
The new approach should learn from the past modernisation process which primarily focussed on the current individual standards and how they can be amended. This limited the range of solutions to those

115115Moving People > Australian Bus and Coach Industry: a snapshot
that fit within the existing framework. The new approach should be open to considering performance based standards and/or functional outcomes; jurisdictional and modal specific standards; prescriptive standards; or other innovative solutions.
> Reform should strive for certainty without sacrificing best functional outcome.
Certainty, both legal and in relation to service provision is important for all stakeholders. However, transport operators and providers who take only a minimum standard interpretation of the Transport Standards in fact face greater risk of failing to meet the objectives of accessible public transport. This is because minimum standards do not always achieve the best functional outcomes for people with disability and can result in an unintended discriminatory outcome.
Guidelines for equivalent access for travel on buses and coaches
The development of Equivalent Access Guidelines may be a useful tool but difficult to develop a one size fits all set of bus driver/operator guidelines to meet the many varied access requests that are made.
Equivalent Access Guidelines would need to be developed in consultation with organisations representing people with disabilities.
There are some core issues for consideration for inclusion from the BIC perspective.
1. Some mobility devices do not meet the access requirement of the DSAPT for a bus or coach – we need to be clear on what mobility device can travel and have a right of refusal to carry.
2. Equal access should allow for a separate, segregated or parallel service to be provided which is currently not allowed under the Act. The focus of the Act should be performance based and not prescriptive and be about delivering the mobility outcome and not technical adherence to the accessible transport standards.
3. Bus stops and accessible infrastructure standards should be clearly identified as not the responsibility of a bus operator and a reason to refuse travel if whole of journey access cannot be provided, including things like adventure travel type experiences.
Technology, environment and safety
Euro VI Emission Standards
The government does not have a clear or agreed date for the introduction of Euro VI emission standards as an ADR. The BIC is seeking confirmation on these dates.
Euro VI bus and coach issues
The BIC has concerns about the problems faced by bus chassis manufacturers and bus body manufacturers in relation to the ‘crystal balling’ of the market to determine the number of chassis they should import, and have in stock, when new ADRs are introduced that set an implementation date that simultaneously introduces a new vehicle/model to the marketplace.
Currently the vehicle certification process for buses demands that a vehicle be fully built and ready for service before it can be “ADR plated”.
This requirement and the introduction of new vehicle emission standards sees bus and coach manufacturers having to complete vehicles as stock vehicles with “standard”23 seating configurations installed so that the bus can be ADR plated by the emission change over date.
Due to the large variations in bus operational conditions, such as school services, route bus or charter services, the industry practice for stock buses is that the seats are left out until a customer is found for the stock bus and then the seats are fitted to meet the specific operating requirements of the customer. If seats are fitted before the intended customer is known, there is no certainty that the vehicle can be sold with the “standard” seating configuration in place, typically what happens is that the “standard” seating is removed and replaced with the customer specified seating.
The BIC has proposed an alternative approach be adopted by the federal government. The BIC has proposed that buses and coaches be allowed to be built and pre-plated “without seats”. Once the seats are fitted, the bus can then be fully and correctly plated in accordance with the final seating arrangements.
Rules would be required to ensure that chassis were not flooding the market to take advantage of these proposed changes, some suggestions of rules are as follows:
• chassis must have arrived prior to September 30 of the relevant year for new models and all new vehicles and have documentary evidence of the arrival date
• completed vehicles must have arrived prior to December 15 of the relevant year with documentary evidence of the arrival date
• all units must be completed by 31st June of the following relevant year
• these standards apply to vehicles with a seating capacity of 30 to 61 seats utilised in school, charter, tourism and city bus services.
The BIC is seeking the support of all jurisdictions for this approach for the bus industry and BIC would then work through the details of such a process with the Department.
23 The reality is that there is no standard seat configuration until it is known what work the bus will be used for such as will it be a school, charter or route type bus and this is only known once the customer is confirmed.

116116 Moving People > Australian Bus and Coach Industry: a snapshot
Energy Transition to Electric Vehicles
The possibility of substituting electricity for oil as a fuel source for motor vehicles is of considerable global interest, for reasons such as the opportunity for lower emissions of greenhouse gases and air pollutants (NOx, NHMC and PM), improved tank-to-wheel efficiency (about three times higher than ICEs, according to EU 2017), energy security, lower operating costs, and quieter, smoother operation. Opportunities provided by vehicle batteries, and their usage patterns, to link electric vehicles (EVs) to distributed energy systems are a further source of appeal. However, challenges such as high capital costs, range anxiety (partly linked to a shortage of charging locations), battery size, battery life and management of used batteries stand in the way of rapid implementation.
Global and European sales are currently very small, with plug-in hybrid and battery EV sales, for example, representing only 1.2% of all new cars sold in the EU in 2015 (EEA 2017). The share was 22.5% in Norway (not an EU member). On a more positive note, China sold 0.5m electric vehicles in 2016, including buses and commercial vehicles, but is targeting manufacture of 7 million battery cars and hybrid vehicles by 2025 (driven much by air quality concerns). Shenzhen, with its fleet of more than 16,300 buses, is the world’s largest and only all-electric bus fleet. Electric bus technologies featured prominently in Shenzhen Bus Group’s24 Bukit Merah bus contract bid in Singapore25. Volvo has announced that it will only launch electric and hybrid models starting from 2019. France and the UK have announced plans to ban sales of diesel and petrol cars by 2040, with local air quality again a key driver of this change but GHG emission reduction is also important. The Netherlands and Norway plan earlier phase out dates.
Australia’s GHG emissions should make penetration of EVs powered by renewable energy a policy priority. A relatively fast move towards electric vehicles (EVs), in particular, would be of great assistance in terms of lowering emissions outcomes. CSIRO (2017) estimates that electric vehicles are already 50-70% less emissions intensive than ICEs in Australia, arguing they are essential to widespread emissions reductions from light vehicles. They find, however, that electric vehicles are not yet cost competitive. A recent meta-study of take up forecasts by ENA and CSIRO (2017) found that, without significant policy interventions or sharp rises in fuel prices, electric vehicle adoption is likely to remain well below 15% in Australia by 2030. Electric vehicles are, therefore, currently not expected to provide a major contribution in reducing light vehicle emissions intensity before 2030. However, there may be scope to focus on a transition for buses to electric vehicles as a priority that could be fast tracked taking onto account the issues further outlined.
Electric Buses
The BIC sees future bus technology to be fully electric vehicles based on a transition that takes into account the Australian circumstance when it comes to the existing fleet and a range of other factors. A small number (less than a hand full) of large buses operate on Australian roads.
24 A subsidiary of Hong Kong-based Transport International.25 This tender was subsequently awarded to incumbent SBS Transit on 23
February 2018
There are a number of electric bus trials underway around Australia, with no real commitment as yet to move to a fully electric fleet. The ACT government has made some announcements to this effect. In July 2019, the Victorian government announced that it will procure 50 hybrid electric buses to be delivered by 2022. This is the result of hybrid bus trials run in Victoria since 2011 which found that hybrid buses used 30% less fuel than a standard diesel bus and improved emission performance and reduced noise significantly during idling and departure from stops. Fuel savings however were very closely linked to the ‘duty cycle’ of the hybrid vehicle.
The decision to move to hybrid technology by the Victorian government in some way reflects the realities of the Australian bus market-place and the challenges of introducing a fully electric bus fleet in the context of a low emission Euro VI diesel bus that delivers significant reliability and whole of life benefits and surprisingly to some, emission benefits.
Key Issus for consideration that impact on the Australian take up of Electric Buses1. The existing Australian bus fleet has an average age of
12 years or less in most states and territories with an expected full bus life of 20 to 25 years.
2. Modern diesel is extremely competitive in a whole of life and emissions sense. Compared to the cost of new electric buses.
3. Battery range, life and cost.
4. Re-charging infrastructure and availability whether depot based or on-road and the possible impact on base load power for re-charging of larger numbers of vehicles at one time.
5. Lack of incentives to encourage procurement of electric vehicles and invest in electric charging infrastructure.
6. Road infrastructure impacts of increased bus gross vehicle mass as a result of batteries.
The BIC recommends a transitional approach to the adoption of fully electric bus technology for Australia.
This transition should take into account:
• the current historical investment in the diesel bus fleet and whole of life asset values
• existing government fleet replacement programs based on the key issues outlined
• acceptance of a mix of fuel and vehicle types in the short to medium term that includes diesel, gas, hybrid and electric vehicle in the interests of transport and energy security
• federal government incentives, (investment allowance, accelerated depreciation, up front capital differential payment), to support transition to electric buses. This could be provided on the basis of agreed delivery of the increased number and frequency of bus public transport services, similar to

117117Moving People > Australian Bus and Coach Industry: a snapshot
“asset recycling” principles. The BIC is undertaking some work currently on this “incentives economic model” for consideration by the federal government
• federal government support for local manufacturing capability to manufacture hybrid and electric vehicles.
National Bus and Coach Vehicle Safety Specification Project – NHVR Heavy Vehicle Safety Initiative Funding 2020 – 2021
The BIC has made an application to the NHVR Heavy Vehicle Safety initiative to develop a National Bus and Coach Safety Vehicle Specification Advisory (Advisory) as part of Tranche 5 of this funding program to be completed by end June 2021.
The BIC seeks all jurisdictions support for this project and funding request.
The Project in summary will provide a standardised national bus and coach vehicle safety specification advisory (Advisory) for bus and coach operators, bus and coach vehicle and service procurers (government and private) and passengers.
The Advisory will deliver heavy vehicle (bus and coach) safety outcomes through the development of materials to support increased safety awareness and compliance through a heavy vehicle bus and coach safety education and awareness publication.
The Advisory aims to:
• provide guidance to bus and coach buyers on the required safety standards under Australian Design Rules, unique state-based vehicle standards (where applicable) and Industry best practice in specifying a bus or coach for passenger services
• establish agreed and consistent minimum bus and coach (vehicle) safety standards in consultation with all jurisdictions and relevant parties
• capture the operational features and characteristics of the Australian bus and coach industry to provide safe, efficient and comfortable buses and coaches through the provision of this information in one document.
The specifications in the Advisory will include the safety requirements and outcomes that are called for in government and private sector procurement tenders/contracts.
A key issue to be addressed by this Advisory will be consistency across jurisdictions.
In some instances bus safety requirements employed by some sections of the bus industry or by procurers of bus and coach services are in excess of national regulation, whilst at the same time some state based regulations are commonly ‘cherry picked’ to achieve a perceived optimum safety outcome even in states where such regulation is not applicable. This can result in vehicles being over specified for their purpose and cost of vehicles increased.
Currently many (but not all) bus supply tenders/contracts require compliance to existing BIC safety related advisories,
such as the BIC Bus Door Safety Advisory and the BIC Bus Fire Mitigation Advisory.
In summary the proposed National Bus and Coach Vehicle Safety Specification Advisory aims to achieve the following outcomes.
1. Allow government to work with industry to agree a set of bus and coach vehicle standards and core safety outcomes that are aligned with the operational features and characteristics of the Australian bus and coach Industry.
2. Encourage best safety and productivity practices for all bus and coach vehicle types.
3. Provide industry and transport regulators and authorities with a consolidated reference document (Advisory) that contains information on the systems and standards to the form the basis for all bus and coach safety specifications.
4. Encourage consistency of standards across the Industry to maximise the safety performance and efficiency of the bus and coach fleet.
5. Assist operators and procurers of buses and coaches generally with the information and guidance to make informed decisions regarding safety when purchasing new buses and coaches.
A full copy of the funding application is available upon request.
Vehicle Width – 2.55 metre vehicles
The BIC supports an ADR system which is based on world best vehicle standards and safety requirements. The current ADR for vehicle width is 2.5 metres.
The BIC also supports PBS for heavy vehicles which allows manufacturers to apply for PBS approved ADR exceptions. The BIC is concerned that PBS buses are being approved by the PBS panel that do not provide any productivity, safety or environmental benefit that defeats the original purpose of the PBS scheme.
High productivity vehicles PBS approved to Level 1 road network access were recently provided general access if they did not operate near legal mass limits. PBS Level 1 over width buses were explicitly excluded from the national law change by Ministers. The BIC is trying to ascertain the actual status of this exclusion and if over width buses under national law cannot be provided general access to the road network.
This also relates to the recent review of PBS by the NTC that recommends that state and territory governments identify networks for each access level.
The BIC can make available a paper that outlines the concerns about the PBS approval process and PBS approved 2.55m buses and access to a suitable road network.

118118 Moving People > Australian Bus and Coach Industry: a snapshot
Review of Australian Design Rule 58 (Omnibus for Hire and Reward)
The BIC is participating in the review of ADR 58. The BIC in this context supports making the ADR clearer and less ambiguous. The BIC supports harmonising with EU vehicle standards when it is practical but not at the expense of lowering existing vehicle safety standards or for the sake of harmonisation alone.
Review of Road Vehicle Standards (RVSA) Act
On 28 November 2018, the Road Vehicle Standards Bills passed through Parliament and the new legislation will introduce a number of regulatory changes to the provision of a road vehicle in Australia. Together with this legislation, a new set of Road Vehicle Standards Rules (which will be the regulations under the Road Vehicles Standards Act) are also being introduced.
The Road Vehicle Standards Act (RVSA) was scheduled to commence on 10 December 2019, this has now been delayed to 1 July 2021 or at an earlier date, but the Department has indicated that the new system may be introduced as early as 1 July 2020.
The Act enables most MVSA approval holders to be able to continue importing and providing vehicles under their existing approvals until late 2020. These regulatory changes, and the associated administrative processes include:
• introduction of the Register of Approved Vehicles, an online, publicly accessible database of vehicles approved for supply in Australia
• changes to the supply of mainstream (full volume) new vehicles
• clarifying suppliers’ recall responsibilities for all vehicles
• improving consumer access to a wider range of specialist and enthusiast vehicles
• simplifying the process for providing vehicles through the Registered Automotive Workshop Scheme (RAWS) while improving the quality assurance of those vehicles
• simplifying the pathways for importing vehicles granted concessions against national vehicle standards
• strengthening the government’s compliance and enforcement powers
• enhancing and replacing IT systems used to administer the RVSA
• ability for Vehicle Safety Standards branch (VSS) to recover the costs associated with the administration of the RVSA.
This will mean that suppliers and manufacturers of certified components, chassis, bus bodies and completed buses will be affected by these changes. Information provided by VSS is available at the following web pages:
• Road Vehicle Standards legislation implementation https://infrastructure.gov.au/vehicles/rvs/index.aspx
• RVSA Implementation Consultation Framework https://infrastructure.gov.au/vehicles/rvs/rvsa_implementation_consultation_framework.aspx
VSS initiated five consultation groups to facilitate the implementation of the new legislative framework and the BIC is represented on the following:
• Type Approvals Group
• RVSA Tools Group
• Concessional RAV Entry Group
• Road Vehicle Recalls Group
• Vehicle Certification Group.
The BIC has attended a number of meetings and has summitted a detailed response to VSS in regard to:
• RVSA legislation for ‘Standard’ and ‘Non-Standard’ vehicles under the one Type Approval
• RAV ‘Entry Pathway Sub-Category’ processes
• Renewal of approvals
• Opt-In approvals
• RAV Month and Year of Build Date
• Test Facility Registration
• Cost Recovery Impact Statement
• Sub Assembly Data Sheets (SADS) associated with SARN approvals.
The consolidation process has now been moved to more direct consultation and the BIC is part of the group that includes truck and trailer representatives. The Department has provided a response to all of the BIC issues and these responses are available on request.
The BIC Bus Safety Initiative 2019 – 2021
The 2019 BIC Conference included a session focused on the development of a national approach to bus safety issues that impact on road safety. This session concluded with the call for Federal Assistant Minister for Road Safety Scott Buchholz to take a lead on this initiative through TIC and TISOC meetings and processes.
The national approach would agree a bus safety strategy that would remove duplication, pick up good ideas already in place and agree a national package that delivers national benefits to address the myriad of issues that bus operators deal with on a daily basis that impact on road safety, driver safety, passenger, personal and community safety.

119119Moving People > Australian Bus and Coach Industry: a snapshot
Ten key national recommendations for government to ensure bus safety
1. A national minimum bus safety accreditation framework that is mutually recognised by all jurisdictions.
2. A national bus safety data set that is collected by police and accident investigators that will better reflect what is happening on the road for accidents, injuries and fatalities involving buses, pedestrians and other vehicles.
3. A national and uniform school bus safety signage and lighting standard and road user education program.
4. A national bus specification safety standard for government contracted services.
5. A national approach to seat belts on buses.
6. A national approach to bus driver penalties and sanctions for driver abuse and violence.
7. A national standard for driver protection on buses and driver training in dealing with violence and abuse.
8. A national bus stop standard for passenger security and protection.
9. Recognition of public transport as an essential service so that no passengers are left behind as a result of industrial action.
10. A national bus safety awareness campaign.
School Bus Flashing Lights and Signage
The NSW Government undertook a review of the requirement for school bus flashing lights and signage on the back of buses in 2017-18. This signage warns other road users that a school bus is stopping or stopped and that children will be entering or egressing the bus.
The requirement exists in other states and territories but there is no common approach to the specification of the signage or types of lighting arrangements.
The BIC has developed a national specification for school bus flashing lights and signage for consideration of the NHVR and jurisdictions.
Long distance, tour and charter
National Long Distance, Charter, Express and Tourism Policy
In 2019, the BIC published a special edition policy paper: Coach solutions for land transport tourism.
This policy paper statement on the Long Distance, Charter, Tour and Express sector of the bus and coach industry focussed around the development of a 2028 National and Regional Land Transport Tourism Plan. The publication is available on the BIC website at www.movingpeople.com.au.
The BIC has published a 10 year moving people strategy for driving land transport tourism.
In developing this strategy, the BIC has worked closely with members of the Bus Australia Network and collaborated with coach operators and tourism organisations. A clear and planned strategy is urgently needed to support the diverse range of passenger transport services provided by the coach sector and the benefits that they bring to our communities and the Australian economy.
This 10-year strategy document will reach the desks of more than 450 senior executives and politicians including:
> current serving Members and Senators of federal parliament
> state politicians with a tourism, regional development, or local government portfolio
> CEO’s of state tourism councils and local government associations
> a huge cross-section of Australian bus and coach operators....and many more.
The publication includes 9 key areas that all levels of government and industry should adopt to increase travel by coach to generate dispersal of tourists from major cities and attractions to regional Australia and grow Australia’s tourism economy.
1. New marketing strategy for coach travel.
2. Better data via market research.
3. Coach infrastructure in Australian cities and major regional towns.
4. Airport infrastructure and access.
5. National Parks access.
6. Addressing skills shortages.
7. Service and tourism investment incentives.
8. Heavy Vehicle Regulation.
9. Performance based Disability Standards.

Appendix 3
Honour Roll of Councillors 1995-20201995-1996 Bus Industry Confederation
1996-1997 Bus Industry Confederation
1997-1998 Bus Industry Confederation
1998-1999 Bus Industry Confederation
1999-2000 Bus Industry Confederation
2000-2001 Bus Industry Confederation
Executive Director, Barrie MacDonald Deputy Director, Rhett Parsons
Executive Director, Barrie MacDonald
CEO, Barrie MacDonald BIC Coordinator, Ian MacDonald
CEO, Barrie MacDonald BIC Coordinator, Ian MacDonald
CEO, Barrie MacDonald BIC Coordinator, Ian MacDonald
Notary, Darryl Mellish BIC Coordinator, Ian MacDonald
Chairman Simon Bath (Volvo) Vacant Keith Todd (ABCA) Keith Todd (ABCA) Keith Todd (ABCA) Stephen Lucas (Vic)
Deputy Chairman
Peter Moore (ACTA) Peter Moore (ACTA) as Acting Chairman
Peter Moore (ACTA) Peter Moore (ACTA) Simon Bath (Volvo) Simon Bath (Volvo)
Chassis Manufacturers
Simon Bath (Volvo) Ian Boyle (Mercedes-Benz)
Simon Bath (Volvo) Ian Boyle (Mercedes-Benz)
Lawrie Baker (Volvo) Ian Boyle (Mercedes-Benz)
Lawrie Baker (Volvo) Ian Boyle (Mercedes-Benz)
Simon Bath (Volvo) Horst Koerner (Scania)
Simon Bath (Volvo) Horst Koerner (Scania)
Body Manufacturers
Ken McEwen (JRA) Barry Reardon (Custom Coaches)
Owen Quinn (JRA) Barry Martin (Ansair)
Bob Smith (Custom Coaches) Laurie Stewart (Austral Pacific)
Bob Smith (Custom Coaches) Laurie Stewart (Austral Pacific)
Bob Smith (Custom Coaches) Geoff Grenda (Volgren)
Bob Smith (Custom Coaches) Geoff Grenda (Volgren)
Associated Services Providers
Peter Townsend Denis McConnell (McConnell Seats) David Scarr (Isringhausen)
Peter Duncan (ZF Australia) Peter Duncan (ZF Australia) Peter Duncan (ZF Australia) Peter Duncan (ZF Australia)
Australian Bus & Coach Association
Robert Hertogs Joe Pulitano Keith Todd
Robert Hertogs Joe Pulitano Keith Todd
Robert Hertogs Joe Pulitano Keith Todd
Robert HertogsJoe PulitanoKeith Todd
Joe PulitanoPeter RenwickKeith Todd
ABCA reforms as the State & Territory Bus & Coach Associations Keith Todd (NSW)Peter Threlkeld (NSW)Doug Kefford (Vic)Stephen Lucas (Vic)Peter Dunn (SA)
Australian City Transit Association
Len Harper Peter Moore
Guy Thurston Peter Moore
Guy ThurstonPeter Moore
Guy ThurstonPeter Moore
UITP Peter Moore (UITP) Peter Moore (UITP)
2001-2002 Bus Industry Confederation
2002-2003 Bus Industry Confederation
2003-2004 Bus Industry Confederation
2004-2005 Bus Industry Confederation
2005-2006 Bus Industry Confederation
2006-2007 Bus Industry Confederation
Notary, Darryl Mellish BIC Coordinator, Ian MacDonald
Executive Director, Michael Apps Executive Director, Michael Apps Executive Director, Michael Apps Executive Director, Michael Apps Executive Director, Michael Apps
Chairman Stephen Lucas (Vic) Stephen Lucas (Vic) Stephen Lucas (Vic) Stephen Lucas (Vic) Stephen Lucas (Vic) Stephen Lucas (Vic)
Vice Chairman Simon Bath (Volvo) Simon Bath (Volvo) Geoff Grenda (Volgren) Geoff Grenda (Volgren) Geoff Grenda (Volgren) Geoff Grenda (Volgren)
Chassis Manufacturers
Simon Bath (Volvo)Horst Koerner (Scania)Chris Meehan (Mercedes-Benz)
Simon Bath (Volvo) Horst Koerner (Scania)
Chris Meehan (Mercedes-Benz) David Mead (Volvo) Trevor O’Brien (Scania)
Chris Meehan (Mercedes-Benz) David Mead (Volvo) Trevor O’Brien (Scania)
Chris Meehan (Mercedes-Benz) Trevor O’Brien (Scania)David Mead (Volvo)
Chris Meehan (Mercedes-Benz) David Mead (Volvo) Steve Heanes (Iveco Bus)
Body Manufacturers
Bob Smith (Custom Coaches) Geoff Grenda (Volgren)
Mark Burgess (Custom Coaches) Geoff Grenda (Volgren)
Mark Burgess (Custom Coaches) Geoff Grenda (Volgren)
Mark Burgess (Custom Coaches) Geoff Grenda (Volgren) Paul Hoffman (Express Coach Builders)
Mark Burgess (Custom Coaches) Geoff Grenda (Volgren) Paul Hoffman (Express Coach Builders)
Mark Burgess (Custom Coaches) Geoff Grenda (Volgren) Paul Hoffman (Express Coach Builders)
Associated Services Providers
Peter Duncan (ZF Australia) Peter Duncan (ZF Australia) Peter Duncan (ZF Australia) John Wymond (ABCUA) Allan Smith (McConnell Seats)
Peter Smith (Southport Engineering) Allan Smith (McConnell Seats)
Peter Smith (Southport Engineering) Allan Smith (McConnell Seats)
Australian Bus Operators
Keith Todd (NSW)Peter Threlkeld (NSW)Doug Kefford (Vic)Stephen Lucas (Vic)Peter Dunn (SA)
Keith Todd (NSW)Peter Threlkeld (NSW)Doug Kefford (Vic)Stephen Lucas (Vic)Peter Dunn (SA)
Keith Todd (NSW)Peter Threlkeld (NSW)Doug Kefford (Vic)Stephen Lucas (Vic)Peter Dunn (SA)
Keith Todd (NSW)Peter Threlkeld (NSW)Doug Kefford (Vic)Stephen Lucas (Vic)Roger Quinsey (SA)
Peter Threlkeld (NSW) Frank D’Apuzzo (NSW) Stephen Lucas (Vic) Doug Kefford (Vic) Shane Dewsbury (Tas) Roger Quinsey (SA) Wayne Patch (Qld) David van Kuyl (WA)
Peter Threlkeld (NSW) Frank D’Apuzzo (NSW) Stephen Lucas (Vic) Doug Kefford (Vic) Shane Dewsbury (Tas) Roger Quinsey (SA) Wayne Patch (Qld) Michael Baulch (WA)
Urban Bus Group
Jonathan Cook (ATE) Jonathan Cook (ATE) Jonathan Cook (ATE) Jonathan Cook (ATE) Jonathan Cook (ATE)
UITP Peter Moore (UITP) Peter Moore (UITP) Peter Moore (UITP) Peter Moore (UITP) Peter Moore (UITP) Peter Moore (UITP)
Unions John Allan (TWU) John Allan (TWU)
120120 Moving People > Australian Bus and Coach Industry: a snapshot 121121Moving People > Australian Bus and Coach Industry: a snapshot

122122 Moving People > Australian Bus and Coach Industry: a snapshot
Honour Roll Councillors 1995-20202007-2008 Bus Industry Confederation
2008-2009 Bus Industry Confederation
2009-2010 Bus Industry Confederation
2010-2011 Bus Industry Confederation
2011-2012 Bus Industry Confederation
2012-2013 Bus Industry Confederation
Executive Director, Michael Apps Executive Director, Michael Apps Executive Director, Michael Apps Executive Director, Michael Apps Executive Director, Michael Apps Executive Director, Michael Apps
Chairman Stephen Lucas (Vic) Scott Grenda (Vic) Scott Grenda (Vic) Scott Grenda (Vic) Wayne Patch (Qld) Wayne Patch (Qld)
Vice Chairman Scott Grenda (Vic) David Mead (Volvo) David Mead (Volvo) David Mead (Volvo) Steve Heanes (Iveco Bus) Steve Heanes (Iveco Bus)
Chassis Manufacturers
Chris Meehan (Mercedes Benz) David Mead (Volvo) Steve Heanes (Iveco Bus)*
David Mead (Volvo)Steve Heanes (Iveco Bus)Chris Meehan (Mercedes Benz)*
David Mead (Volvo) Steve Heanes (Iveco Bus) Chris Meehan (Mercedes-Benz)*
David Mead (Volvo) Steve Heanes (Iveco Bus) Chris Meehan (Mercedes-Benz)*
David Mead (Volvo) Steve Heanes (Iveco Bus)Grant Simmonds (Mercedes-Benz)*
Peter Duncan (Volvo) Steve Heanes (Iveco Bus) Grant Simmonds (Mercedes-Benz)*
Body Manufacturers
Mark Burgess (Custom Coaches) Geoff Grenda (Volgren) Paul Hoffman (Express Coach Builders)*
Mark Burgess (Custom Coaches) Geoff Grenda (Volgren) Paul Hoffman (Express Coach Builders)*
Mark Burgess (Custom Coaches) Geoff Grenda (Volgren) Paul Hoffman (Express Coach Builders)*
Mark Burgess (Custom Coaches) Geoff Grenda (Volgren) Paul Hoffman (Express Coach Builders)*
Mark Burgess (Custom Coaches)Paul Hoffman (Express Coach Builders)Peter Dale (Volgren)*
Peter Dale (Volgren) Paul Hoffman (Express Coach Builders)Andrew Boulton (Custom Coaches)*
Associated Services Providers
Peter Smith (Southport Engineering) Allan Smith (McConnell Seats)
Peter Smith (Southport Engineering) Allan Smith (McConnell Seats)
Peter Smith (Southport Engineering) Allan Smith (McConnell Seats)
Peter Smith (Southport Engineering) Allan Smith (McConnell Seats)
Anthony O’Donnell (QTK Group) Allan Smith (McConnell Seats)Grant Watson (Parts Supply/Hanover Displays)*
Anthony O’Donnell (QTK Group) Allan Smith (McConnell Seats)Grant Watson (Parts Supply/Hanover Displays)*
State & Territory Bus & Coach Associations
Peter Threlkeld (NSW)Frank D’Apuzzo (NSW)Stephen Lucas (Vic)Scott Grenda (Vic)Shane Dewsbury (Tas)Roger Quinsey (SA)Wayne Patch (Qld)Michael Baulch (WA)
Stephen Rowe (NSW) Frank D’Apuzzo (NSW) Stephen Lucas (Vic) Scott Grenda (Vic) Shane Dewsbury (Tas) Roger Quinsey (SA) Wayne Patch (Qld) Michael Baulch (WA)
Stephen Rowe (NSW) Frank D’Apuzzo (NSW) Stephen Lucas (Vic) Scott Grenda (Vic) Shane Dewsbury (Tas) Roger Quinsey (SA) Wayne Patch (Qld) Michael Baulch (WA)
Stephen Rowe (NSW) Frank D’Apuzzo (NSW) Stephen Lucas (Vic) Scott Grenda (Vic) Shane Dewsbury (Tas) Roger Quinsey (SA) Wayne Patch (Qld) Michael Baulch (WA)
Stephen Rowe (NSW) Steve Scott (NSW)Peter Ferris (NSW)* Stephen Lucas (Vic) Scott Grenda (Vic)Geoff Vickers (Vic)* Shane Dewsbury (Tas) Roger Quinsey (SA) Wayne Patch (Qld)Graham Davis (Qld)*Michael Baulch (WA)
Peter Ferris (NSW) Steve Scott (NSW)Stephen Rowe (NSW)* Stephen Lucas (Vic) Scott Grenda (Vic)Geoff Vickers (Vic)* Shane Dewsbury (Tas) Dean McGinty (SA) Sam Lucas (SA)*Wayne Patch (Qld)Tony Hopkins (Qld)*Michael Baulch (WA)
UITP Peter Moore (UITP) Peter Moore (UITP) Peter Moore (UITP) Peter Moore (UITP)
Urban Bus Group
Jonathan Cook (ATE) Jonathan Cook (ATE) Jonathan Cook (ATE) Jonathan Cook (ATE) Jonathan Cook (ATE) Jonathan Cook (ATE)
Unions John Allan (TWU) Adrian Denyer (TWU) Adrian Denyer (TWU) Adrian Denyer (TWU)
122122 Moving People > Australian Bus and Coach Industry: a snapshot 123123Moving People > Australian Bus and Coach Industry: a snapshot 123123Moving People > Australian Bus and Coach Industry: a snapshot

124 125124 125Moving People > Australian Bus and Coach Industry: a snapshot Moving People > Australian Bus and Coach Industry: a snapshot124124 Moving People > Australian Bus and Coach Industry: a snapshot
Honour Roll Councillors 1995-20202013-2014 Bus Industry Confederation
2014-2015 Bus Industry Confederation
2015-2016 Bus Industry Confederation
2016-2017 Bus Industry Confederation
2017-2018 Bus Industry Confederation
2018-2019 Bus Industry Confederation
2019-2020 Bus Industry Confederation *non voting members discontinued
Executive Director, Michael Apps Executive Director, Michael Apps Executive Director, Michael Apps Executive Director, Michael Apps
Executive Director, Michael Apps
Executive Director, Michael Apps
Executive Director, Michael Apps
Chairman Wayne Patch (Qld) Wayne Patch (Qld) Wayne Patch (Qld) Wayne Patch (Qld) Wayne Patch (Qld) Wayne Patch (Qld) Wayne Patch (Qld)
Vice Chairman Steve Heanes (Iveco Bus) Steve Heanes (Iveco Bus) Steve Heanes (Iveco Bus) Steve Heanes (Iveco Bus) Steve Heanes (Iveco Bus) Steve Heanes (Iveco Bus) Steve Heanes (Iveco Bus)
Chassis Manufacturers
David Mead (Volvo) Steve Heanes (Iveco Bus) Julian Gurney (Scania)*
David Mead (Volvo) Steve Heanes (Iveco Bus) Julian Gurney (Scania)*
Julian Gurney (Scania) Steve Heanes (Iveco Bus)Anthony O’Donnell (BCSA)*
Julian Gurney (Scania) Steve Heanes (Iveco Bus)Anthony O’Donnell (BCSA)*
Julian Gurney (Scania) Steve Heanes (Iveco Bus)Anthony O’Donnell (BCSA)*
Julian Gurney (Scania) Steve Heanes (Iveco Bus)Kevin Fielding (Hino)*
Julian Gurney (Scania) Steve Heanes (Iveco Bus)
Body Manufacturers
Peter Dale (Volgren) Paul Hoffman (Express Coach Builders)Andrew Boulton (Custom Coaches)*
Peter Dale (Volgren) Paul Hoffman (Express Coach Builders)
Peter Dale (Volgren) Anthony Fisicaro (HVA)Mark Burgess (Custom Bus)*
Peter Dale (Volgren) Anthony Fisicaro (HVA)Greg Shanley (Custom Bus)*
Peter Dale (Volgren) Anthony Fisicaro (HVA)Greg Shanley (Custom Bus)*
Peter Dale (Volgren) Anthony Fisicaro (HVA)Anthony Roder (Bustech)*
Scott Dunn (Dunn Group)Anthony Roder (Bustech)
Associated Service Providers
Bob Barwick (Mobitec)James Lowe (McConnell Seats)Grant Watson (Parts Supply/Hanover Displays)*
Bob Barwick (Mobitec)James Lowe (McConnell Seats)Grant Watson (Parts Supply/Hanover Displays)*
Grant Watson (Parts Supply/Hanover Displays)James Lowe (McConnell Seats)Jamie Dunlop (Thermo King)*
James Lowe (McConnell Seats)Jamie Dunlop (Thermo King)Greg Nielsen (Bandag/Bridgestone)*
James Lowe (McConnell Seats)Jamie Dunlop (Thermo King)Greg Nielsen (Bandag/Bridgestone)*
James Lowe (McConnell Seats)Jamie Dunlop (Thermo King)Geoff Stewart (Multispares)*
James Lowe (McConnell Seats)Rob Pullbrook (Mobitec)
State & Territory Bus & Coach Associations
Peter Ferris (NSW) Steve Scott (NSW)Stephen Rowe (NSW)* Stephen Lucas (Vic) Geoff Vickers (Vic)Rob Wright (Vic)* Shane Dewsbury (Tas) Dean McGinty (SA) Sam Lucas (SA)*Wayne Patch (Qld)Tony Hopkins (Qld)*Michael Baulch (WA)
Peter Ferris (NSW) Steve Scott (NSW)Stephen Rowe (NSW)* Stephen Lucas (Vic)Geoff Vickers (Vic)Rob Wright (Vic)* Shane Dewsbury (Tas) Sam Lucas (SA)Wayne Patch (Qld)Tony Hopkins (Qld)*Michael Baulch (WA)
Peter Ferris (NSW) Steve Scott (NSW)Stephen Rowe (NSW)*Geoff Vickers (Vic)Rob Wright (Vic)Sam Lucas (Vic)* Shane Dewsbury (Tas) Ben Romanowski (SA)Wayne Patch (Qld)Rolf Mitchell (Qld)*Michael Baulch (WA)
Peter Ferris (NSW) Steve Scott (NSW)Stephen Rowe (NSW)* Geoff Vickers (Vic)Rob Wright (Vic)Sam Lucas (Vic)* Shane Dewsbury (Tas) Ben Romanowski (SA)Wayne Patch (Qld)Rolf Mitchell (Qld)*Dennis Sutton (WA)
Peter Ferris (NSW) Steve Scott (NSW)John King (NSW)*Geoff Vickers (Vic)Rob Wright (Vic)Sam Lucas (Vic)* Shane Dewsbury (Tas) Ben Romanowski (SA)Wayne Patch (Qld)Rolf Mitchell (Qld)*Dennis Sutton (WA)
Peter Ferris (NSW) Steve Scott (NSW)John King (NSW)*Rob Wright (Vic)Sam Lucas (Vic)Ashley McHarry (Vic)* Shane Dewsbury (Tas) Ben Romanowski (SA)Wayne Patch (Qld)Tony Gear (Qld)*Dennis Sutton (WA)
Peter Ferris (NSW) Steve Scott (NSW)Rob Wright (Vic)Sam Lucas (Vic)Shane Dewsbury (Tas) Ben Romanowski (SA)Wayne Patch (Qld)Rolf Mitchell (Qld)Dennis Sutton (WA)
Urban Bus Group Jonathan Cook (ATE) Jonathan Cook (ATE) Jonathan Cook (ATE) Jonathan Cook (Keolis Downer) Jonathan Cook (Keolis Downer) Laurent Offroy (Keolis Downer)Frank Oliveri (G&C Oliveri)
Tony Hopkins (CDC)Laurent Offroy (Keolis Downer)Adam Begg (Kinetic)
125125Moving People > Australian Bus and Coach Industry: a snapshot

126126 Moving People > Australian Bus and Coach Industry: a snapshot
STATE AND INTERNATIONAL ASSOCIATION PARTNERS
PUBLIC TRANSPORT AND URBAN TRANSPORT GROUPS
BusNSW Bus SA BusVic BusWA Queensland Bus Industry Council
Tasmanian Bus Association
American Public Transportation
Association
Bus & Coach Association (NZ)
ATG Buslines Group Busways Group ComfortDelGro Corporation Australia
Greyhound Australia Interline Bus Service Keolis Downer
Kinetic Group Murrays Australia Port Stephens Coaches
Premier Transport Group
Punchbowl Bus Company
Red Bus Services Rover Coaches
Transit Systems Victorian Touring Coaches
Brisbane City Council Busways Group ComfortDelGro Corporation Australia
Department of Transport Victoria
Greyhound Australia Keolis Downer Kinetic Group
Nuline Charter/Bayside Coaches
Public Transport Authority of WA
Pulitano Group State Transit Authority of NSW
Transdev Australasia Transit Systems TransLink
Transport Canberra
BUS OPERATOR GROUP
Appendix 4
BIC National Members Support those who Support BIC (Current at 31 December, 2020)
UITP (International Association of Public Transport
Australia / New Zealand)

127127Moving People > Australian Bus and Coach Industry: a snapshot
BUS AND COACH MANUFACTURERS
Bus & Coach International
Bus & Coach Sales Australasia
Bustech Group Challenger Bus & Coach
Coach Design Custom Denning Ebusco
Express Coach Builders
Gemilang Coachwork Global Bus Ventures Hino Bus Australia I-Bus Sales Australia Irizar Asia Pacific IVECO Bus
Mercedes-Benz Bus & Coach
Penske Commercial Vehicles
Scania Australia Volgren Volvo Bus Australia Yutong Australia
SEAT GROUP
AIRCON GROUP
Coachair Australia Cooltek Asia Pacific Denso Automotive Systems Australia
Thermo King Bus Australia
Valeo Group
McConnell Seats Australia
StyleRide Seating Systems
ASSOCIATED SERVICES PROVIDERS
Accreditation Manager Advantech Australia Airbags Australia Axalta Coating Systems
Beneco BFI Fire Bridgestone/Bandag
Bus Finance Australia
powered by isuzu
Bus Stop Sales BusInsure Camira Group Coachworks Connect Source Consat Telematics
Consolidated Insurance Agencies
Cummins Curratechnic Dal-Trans Distinctive Systems (Australia)
Downer EDI Engineering Power
Electromotiv
FleetSafe/Mobileye Fry’s Spares Future Fleet International
GIRO Go Transit Media Group
Heritage Finance ICS Service Solutions
Curratechnic

128128 Moving People > Australian Bus and Coach Industry: a snapshot
ASSOCIATED SERVICES PROVIDERS continued
Ideas Enterprise Independent Tyre Monitoring Solution
INIT Into Training Australia iris Asia-Pacific ISRI Seats JCDecaux Australia
Kevrek (Australia) KINNECT KlineFire LSM Technologies Luminator Technology Group
MAHA Australia MKW Insurance Brokers
MTData Solutions Multispares Navigate Health netBI Novo Transport Systems
O’Brien Glass Industries
Omnibus
Optibus Parts Supply Solutions/Hanover
PBA Transit Planning Piper Alderman Pitcher Partners Precision Cleaning Australia
PrimeWorks
Quantum Risk Management
Redcat Wheel Safety Routematch Software S.M.S Diesel Spares Scriptus Consulting SMC Corporation (Australia)
Streamline Co
SURA Australian Bus and Coach
The Orion Network Thoreb Australia Tiger Spider Transfab Transit Training Solutions
Transportme
Trapeze Group ANZ Tru Vision TWUSUPER United Safety & Survivability Corporation
Valvoline Australia Ventura Systems Australia
Victorian Diesel Services
Voith Turbo Wales Bus & Body Repairs
Webfleet Solutions
TRUCK | TRAILER | BUS | 4WD & INDUSTRIAL PARTS
Tranzmile | Whites Diesels
Zafety Lug Lock Australasia
ZF Services Australia

129129Moving People > Australian Bus and Coach Industry: a snapshot
ReferencesABC 2018. Bus sales data. In: AUSTRALIAN BUS AND COACH (ed.).
ABS 2016. Education and Work. In: AUSTRALIAN BUREAU OF STATISTICS (ed.). Canberra, Australia.
ABS 2017. Labour force survey. In: AUSTRALIAN BUREAU OF STATISTICS (ed.). Canberra, Australia.
ABS2017c. Survey of motor vehicle use. In: AUSTRALIAN BUREAU OF STATISTICS (ed.). Canberra, Australia.
ABS 2018. Survey of motor vehicle use. In: AUSTRALIAN BUREAU OF STATISTICS (ed.). Canberra, Australia.
ABS 2019. Motor vehicle census. In: AUSTRALIAN BUREAU OF STATISTICS (ed.). Canberra, Australia.
ABS 2020. Motor vehicle census. In: AUSTRALIAN BUREAU OF STATISTICS (ed.). Canberra, Australia.
ACT GOVERNMENT 2017. Transport Canberra and City Services: Annual Report 2016-17. Canberra, Australia.
ATAP 2017. Australian transport assessment and planning guidelines: M1 Public transport. Canberra, Australia: Transport and Infrastructure Council.
AUSTRADE 2019. Future Transport – Industry Overview [Online]. Canberra, Australia: Australian Government. Available: https://www.austrade.gov.au/future-transport/industry-overview/ [Accessed 20 February 2020].
BITRE 2016. Cities: Lengthy commutes in Australia. Research Report 144. Canberra, Australia: Bureau of Infrastructure, Transport and Regional Economics.
BITRE 2017. Yearbook 2017: Australian infrastructure statistics. In: BUREAU OF INFRASTRUCTURE TRANSPORT AND REGIONAL ECONOMICS (ed.). Canberra, Australia: Department of Infrastructure and Regional Development.
BITRE 2018. Road trauma Australia 2017 statistical summary. In: BUREAU OF INFRASTRUCTURE TRANSPORT AND REGIONAL ECONOMICS (ed.). Canberra, Australia: Department of Infrastructure and Regional Development.
BITRE 2019. Australian Road Deaths Database. In: BUREAU OF INFRASTRUCTURE TRANSPORT AND REGIONAL ECONOMICS (ed.). Canberra, Australia: Department of Infrastructure and Regional Development.
BITRE 2020. Australian Road Deaths Database. In: BUREAU OF INFRASTRUCTURE TRANSPORT AND REGIONAL ECONOMICS (ed.). Canberra, Australia: Department of Infrastructure and Regional Development.
BRAY, D. & WALLIS, I. 2008. Adelaide bus service reform: Impacts, achievements and lessons. In Hensher, D. A. (Ed.), Reforms in Public Transport. Research in Transportation Economics, 22, 126-136.
BRISBANE CITY COUNCIL 2017. Annual Report 2016-17. Brisbane, Australia.
BUS INDUSTRY CONFEDERATION 2019. Moving People: Coach solutions for land transport tourism. Canberra, Australia.
DEPARTMENT OF THE ENVIRONMENT AND ENERGY 2017. Australia’s emissions projections 2017. Canberra, Australia: Australian Government.
ELDALY, H. & VON HESSBERG, C. 2018. Mobility as service—The state of play. Mobility as a Service 2018: Digital mobility, smart journeys. Sydney, Australia: Intelligent Transport Systems Australia (ITSA).
FLEET LISTS. 2018. Australian Bus Fleet Lists [Online]. Available: https://fleetlists.busaustralia.com [Accessed 23 August 2018].
FROST AND SULLIVAN, 2017, Australian Intelligent Mobility Market: Trends, Technologies and Opportunities, 2016-2025, May 2017
GOH, P. S. & SWEE, A. 2017. Singapore’s experience with transition to bus contracting model. 15th International Conference on Competition and Ownership in Land Passenger Transport (Thredbo 15). Stockholm, Sweden.
HENSHER, D. A. 1999. A bus-based transitway or light rail? Continuing the saga on choice versus blind commitment. Road & Transport Research, 8, 3-21.
HENSHER, D.A., 2015. Cost efficiency under negotiated performance-based contracts and benchmarking—Are there gains through competitive tendering in the absence of an incumbent public monopolist?. Journal of Transport Economics and Policy (JTEP), 49(1), pp.133-148.
HENSHER, D. A. 2015. Using contracted assets to undertake non-contracted services as a way to improve cost efficiency under negotiated or tendered bus contracts. Journal of Strategic Contracting and Negotiation, 1, 111-128.
HENSHER, D. A., HOA, C. & MULLEY, C. M. 2016. Disruption Costs in Bus Contract Transitions. Sydney, Australia: Institute of Transport and Logistics Studies.
HENSHER, D. A. & WALLIS, I. P. 2005. Competitive tendering as a contracting mechanism for subsidising transport: the bus experience. Journal of Transport Economics and Policy (JTEP), 39, 295-322.
HENSHER, D. A. & WATERS, W. G., II. 1994. Light rail and bus priority systems: Choice or blind commitment? Research in Transportation Economics, 3, 139-162.
HENSHER, D. A., BALBONTIN, C., HO, C. & MULLEY, C. 2019. Cross-cultural contrasts of preferences for bus rapid transit and light rail transit. Journal of Transport Economics and Policy, 53, 47-73.
HO, C., HENSHER, D. A., MULLEY, C. & WONG, Y. Z. 2018. Potential uptake and willingness-to-pay for mobility as a service (MaaS): A stated choice study. Transportation Research Part A: Policy and Practice, 117, 302-218.
HODSON-WALKER, N. 1970. The value of safety belts: a review. Canadian Medical Association Journal, 102, 391.
JOB OUTLOOK. 2018. Bus and coach drivers [Online]. Canberra, Australia: Australian Government. Available: https://joboutlook.gov.au/Occupation.aspx?search=alpha&code=7312 [Accessed 19 August 2018].

130130 Moving People > Australian Bus and Coach Industry: a snapshot
KIM, G. & HAN, S. 2011. Comparative analysis of transportation sustainability in OECD countries. Journal of the Eastern Asia Society for Transportation Studies, 9, 82-97.
KOMPIER, M. A. 1996. Bus drivers: Occupational stress and stress prevention, International Labour Office Geneva.
MARCHETTI, C. 1994. Anthropological invariants in travel behavior. Technological Forecasting and Social Change, 47, 75-88.
METRO 2017. Annual Report 2016-17.
MULLEY, C., HENSHER, D. A. & COSGROVE, D. 2017. Is rail cleaner and greener than bus? Transportation Research Part D: Transport and Environment, 51, 14-28.
NIELSEN, G., NELSON, J., MULLEY, C., TEGNER, G., LIND, G. & LANGE, T. 2005. Public Transport—Planning the Networks. Best Practice Guide 2. Stavanger, Norway: HiTrans.
NTC 2016. Who moves what where: Freight and passenger transport in Australia. Melbourne, Australia: National Transport Commission.
NTC 2018a. Heavy vehicles / Heavy vehicle charges / Registration charges for heavy vehicles 2018–19 and 2019–20 [Online]. National Transport Commission. Available: https://www.ntc.gov.au/heavy-vehicles/heavy-vehicle-charges/registration-charges-for-heavy-vehicles-2018-19-and-2019-20/ [Accessed 7 June 2018].
OSTI 2018. Bus safety report: Bus fires in New South Wales in 2018. Sydney, Australia: Office of Transport Safety Investigations.
STANLEY, J. 2018. Hong Kong Franchise Bus Safety Framework: Including Comparisons with Melbourne Arrangements. Second report prepared by Stanley & Co Pty Ltd for the Independent Review Committee on Hong Kong’s Franchised Bus Services. Melbourne, Australia.
STANLEY, J., HENSHER, D. A., STANLEY, J., CURRIE, G., GREENE, W. H. & VELLA-BRODRICK, D. 2011. Social exclusion and the value of mobility. Journal of Transport Economics and Policy (JTEP), 45, 197-222.
STANLEY, J. & LONGVA, F. 2010. Workshop report—A successful contractual setting. In van de Velde, D., Veeneman, W., Hensher, D. A., & Steel, R. (Eds.), Reforming Public Transport throughout the World. Research in Transportation Economics, 29, 80-88.
STANLEY, J. & STANLEY, J. 2007. Public transport and social policy goals. Road & Transport Research: A Journal of Australian and New Zealand Research and Practice, 16, 20.
STANLEY, J., STANLEY, J., BALBONTIN, C. & HENSHER, D. 2018. Social exclusion: the roles of mobility and bridging social capital in regional Australia. Transportation Research Part A: Policy and Practice.
STANLEY, J. & VAN DE VELDE, D. 2008. Risk and reward in public transport contracting. In Hensher, D. A. (Ed.), Reforms in Public Transport. Research in Transportation Economics, 22, 20-25.
STANLEY, J. K. & HENSHER, D. A. 2011. Environmental and social taxes: Reforming road pricing in Australia. Road & Transport Research: A Journal of Australian and New Zealand Research and Practice, 20, 71.
TRA 2016a. International visitor survey (IVS). In: TOURISM RESEARCH AUSTRALIA (ed.).
TRA 2016b. National visitor survey (NVS). In: TOURISM RESEARCH AUSTRALIA (ed.).
TRA 2018. International visitor survey (IVS). In: TOURISM RESEARCH AUSTRALIA (ed.).
TRANSPORT FOR NSW 2017. State Transit: Annual report 2016-17. Sydney, Australia.
VAN DE VELDE, D. 1997. Entrepreneurship and tendering in local public transport services. 5th International Conference on Competition and Ownership in Land Passenger Transport (Thredbo 5). Leeds, United Kingdom.
WALLIS, I. P. & BRAY, D. J. 2014. The contracting of urban bus services – Recent Australian developments. Research in Transportation Economics, 48, 48-61.
WALKER, J. 2008. Purpose-driven public transport: Creating a clear conversation about public transport goals. Journal of Transport Geography, 16, 436-442.
WONG, Y. Z. 2018. Mobility as a service (MaaS): What does it mean for the NSW bus & coach industry? Bulletin. Sydney, Australia: BusNSW.
WONG, Y. Z. & HENSHER, D. A. 2018. The Thredbo story: A journey of competition and ownership in land passenger transport In Alexandersson, G., Hensher, D. A. & Steel, R. (Eds.), Competition and Ownership in Land Passenger Transport (Selected papers from the Thredbo 15 conference). Research in Transportation Economics, 69, 9-22.
WONG, Y. Z. & HENSHER, D. A. 2019. State of the Industry: Vital Statistics - Strategic Outlook. Canberra, Australia: Bus Industry Confederation.
WONG, Y. Z., HENSHER, D. A. & MULLEY, C. 2017. Emerging transport technologies and the modal efficiency framework: A case for mobility as a service (MaaS). 15th International Conference on Competition and Ownership in Land Passenger Transport (Thredbo 15). Stockholm, Sweden.

131131Moving People > Australian Bus and Coach Industry: a snapshot
BusNSW North Parramatta, NSW P +61 2 8839 9500 E [email protected] W busnsw.com.au
Queensland Bus Industry Council Stones Corner, Qld P +61 7 3397 1700 E [email protected] W qbic.com.au
Bus & Coach Association SASBus
Bus SA Adelaide, SA P +61 8 8269 1077 E [email protected] W bussa.asn.au
TasBus Derwent Park, Tas P +61 3 6277 7880 E [email protected] W tasbus.com.au
Bus Industry Confederation Barton, ACT
P +61 2 6247 5990 E [email protected]
W movingpeople.com.au BusVic Port Melbourne, Vic P +61 3 9645 3300 E [email protected] W busvic.asn.au
BUSWA
BusWA Mandura, WA P +61 418 914 815 E [email protected] W buswa.com.au
Bus Australia Network

132132 Moving People > Australian Bus and Coach Industry: a snapshot

ISBN: 978-0-6485585-1-4
Copyright 2021 Bus Industry Confederation Inc.
First Published September 2021.
This work is copyright. Apart from any use as permitted under the Copyright Act 1968, no part may be reproduced by any process without prior written permission from the Bus Industry Confederation. Requests and enquiries concerning reproduction and rights should be addressed to the BIC National Secretariat, PO Box 6171, KINGSTON ACT 2604.
Email: [email protected].


![POUR UNE CONFÉDÉRATION PALESTINIENNE [For a Palestinian Confederation]](https://static.fdokumen.com/doc/165x107/631617cf511772fe4510aa46/pour-une-confederation-palestinienne-for-a-palestinian-confederation.jpg)


