Motivational and Skills, Social, and Self-Management Predictors of College Outcomes: Constructing...
27
10.1177/0013164404272493 EDUCATIONAL AND PSYCHOLOGICAL MEASUREMENT LE ET AL. MOTIVATIONAL AND SKILLS, SOCIAL, AND SELF-MANAGEMENT PREDICTORS OF COLLEGE OUTCOMES: CONSTRUCTING THE STUDENT READINESS INVENTORY HUY LE Human Resources Research Organization ALEX CASILLAS University of Iowa STEVEN B. ROBBINS RONELLE LANGLEY ACT, Inc. The authors used a rational-empirical approach to construct the Student Readiness Inven- tory, measuring psychosocial and academic-related skill factors found to predict two important college outcomes, academic performance and retention, in a recent meta- analysis. The initial item pool was administered to 5,970 first-year college students and high school seniors to empirically validate and cross-validate the underlying factor struc- ture. Ten first-order and 3 second-order factors were derived, partially resembling the original conceptual model. Future study is needed to explore the criterion and predictive validities of the factors constituting this inventory. Keywords: academic performance; college outcomes; academic-related skills; noncognitive predictors; psychosocial factors; retention The search for predictors of college success has long been a research theme in the educational psychology literature (Hezlett et al., 2001; Pascarella & Terenzini, 1991). This line of research has both theoretical and practical significance. Theoretically, the identification of higher order factors Correspondence concerning this article should be addressed to Steven B. Robbins, ACT, Inc., P.O. Box 168, Iowa City, IA 52243-0168; e-mail: [email protected]. Educational and Psychological Measurement, Vol. 65 No. 3, June 2005 482-508 DOI: 10.1177/0013164404272493 © 2005 Sage Publications 482
-
Upload
hocvienquany -
Category
Documents
-
view
0 -
download
0
Transcript of Motivational and Skills, Social, and Self-Management Predictors of College Outcomes: Constructing...
10.1177/0013164404272493EDUCATIONAL AND PSYCHOLOGICAL MEASUREMENT
LE ET AL.
MOTIVATIONAL AND SKILLS, SOCIAL, ANDSELF-MANAGEMENT PREDICTORS OF COLLEGE OUTCOMES:
CONSTRUCTING THE STUDENT READINESS INVENTORY
HUY LEHuman Resources Research Organization
ALEX CASILLASUniversity of Iowa
STEVEN B. ROBBINSRONELLE LANGLEY
ACT, Inc.
The authors used a rational-empirical approach to construct the Student Readiness Inven-tory, measuring psychosocial and academic-related skill factors found to predict twoimportant college outcomes, academic performance and retention, in a recent meta-analysis. The initial item pool was administered to 5,970 first-year college students andhigh school seniors to empirically validate and cross-validate the underlying factor struc-ture. Ten first-order and 3 second-order factors were derived, partially resembling theoriginal conceptual model. Future study is needed to explore the criterion and predictivevalidities of the factors constituting this inventory.
Keywords: academic performance; college outcomes; academic-related skills;noncognitive predictors; psychosocial factors; retention
The search for predictors of college success has long been a researchtheme in the educational psychology literature (Hezlett et al., 2001;Pascarella & Terenzini, 1991). This line of research has both theoretical andpractical significance. Theoretically, the identification of higher order factors
Correspondence concerning this article should be addressed to Steven B. Robbins, ACT, Inc.,P.O. Box 168, Iowa City, IA 52243-0168; e-mail: [email protected].
Educational and Psychological Measurement, Vol. 65 No. 3, June 2005 482-508DOI: 10.1177/0013164404272493© 2005 Sage Publications
482
associated with college success would shed light on students’ behaviors incollege. Practically, these factors could assist colleges by targeting key areasfor developmental intervention to reduce both the academic and the persis-tence “risk” of entering students. Although the educational literature isreplete with theories and models proposing various psychosocial and/orskill factors that may influence students’ college success (cf. Pascarella &Terenzini, 1991; Tinto, 1975, 1993), the diversity of the constructs and thelack of an integrative framework limit the development of a multidimen-sional inventory with strong psychometric and conceptual underpinnings.
Robbins et al. (2004) recently sought to provide this integration by meta-analytically examining the validities of various psychosocial and study skillsconstructs in predicting two important college success criteria: academic per-formance (i.e., college grade point average [GPA]) and persistence (i.e., col-lege retention). On the basis of 109 studies, the authors identified and studiednine broad constructs derived from educational persistence and motivationalmodels of college success: achievement motivation, academic goals, institu-tional commitment, perceived social support, social involvement, academicself-efficacy, general self-concept, academic-related skills, and contextualinfluences. After controlling for the effects of traditional predictors (i.e., highschool GPA, ACT and SAT assessment scores, and socioeconomic status),these researchers identified three psychosocial constructs that have demon-strated incremental validity in predicting the academic performance crite-rion: academic self-efficacy, achievement motivation, and academic goals.Additionally, six constructs were found to be predictive of the persistencecriterion (above and beyond the effects of the traditional predictors): aca-demic goals, academic self-efficacy, institutional commitment, academic-related skills, social support, and social involvement.
Robbins et al. (2004) proposed that the composite of psychosocial andacademic-related skill predictors was best understood by three higher orderconstructs: motivation, academic-related skills, and social engagement.They also pointed to the limitations of the current empirical research due tothe absence of well-constructed measures subsumed under the same con-structs and the dearth of studies examining several important motivationalconstructs that rendered meta-analytical examination unfeasible. Despitethese limitations, we believe that Robbins et al.’s meta-analysis provides aunified framework for guiding the development of a comprehensive psycho-social and skills inventory for predicting college success. Therefore, the pur-pose of this study was to propose and develop an inventory of psychosocialand skill factors that (a) captures the aforementioned higher order constructs,(b) includes other important constructs missing in Robbins et al.’s meta-analysis that may be predictive of college success criteria, and (c) establishesthe foundation for the construct validation process of the resulting inventory.To overcome the limitations of Robbins et al.’s meta-analysis, we reviewedcurrent theories and models, including those from other relevant literatures
LE ET AL. 483
(i.e., personality and industrial-organizational), to identify additional con-structs for inclusion in our measure development efforts.
Current Theories and Models of College Success
Motivation theories. Covington (2000) and Eccles and Wigfield (2002)provided comprehensive reviews of the motivation theories that relate to stu-dents’college success. As discussed in these reviews, theories can be catego-rized into two groups: achievement-as-drive and achievement-as-goal theo-ries (Covington, 2000). For the former group, the key construct is motivationto achieve (also called achievement drive; Atkinson, 1964; McCelland,1980). Indeed, Robbins et al.’s (2004) meta-analysis showed that this con-struct is predictive of college students’ academic performance above andbeyond traditional predictors. Expectancy-value theories (e.g., Wigfield &Eccles, 2000) represent the latter group. Two major constructs suggested inthese theories, self-expectancy and values, were also examined in Robbinset al.’s meta-analysis (as academic self-efficacy and academic goals, respec-tively) and found to be the best predictors for both college outcome criteria.In summary, it appears that the validities of key constructs suggested underthe prevalent motivational theories were appropriately covered in Robbinset al.’s meta-analysis.
Models combining motivation and skill constructs. The self-regulatedlearning model (Schunk & Zimmerman, 2003; Zimmerman, 1986;Zimmerman & Martinez-Pons, 1986) combines motivational constructs(e.g., goals, self-efficacy, and self-esteem) and cognitive skills (e.g., self-regulated learning strategies, including metacognitive, motivational, andbehavioral strategies) to explain the processes through which students self-regulate their learning. As such, the model explains the processes determin-ing students’performance in college. Accordingly, both the motivational andcognitive skill constructs suggested in the model were included in Robbinset al.’s (2004) meta-analysis.
Pintrich and colleagues (e.g., Pintrich, 1989, 2000; Pintrich & De Groot,1990) suggested another model integrating motivational constructs derivedfrom expectancy-value and goal theories, as well as cognitive constructs(e.g., background knowledge, learning strategies, and self-regulatory andmetacognitive theories), to predict students’ academic performance. Themodel further introduced an affective construct, test anxiety, that was notexamined in Robbins et al.’s meta-analysis. According to this model, testanxiety is an important predictor of students’ academic performance(Pintrich, Smith, Garcia, & McKeachie, 1993). Therefore, we included thisconstruct in our current measure development efforts.
484 EDUCATIONAL AND PSYCHOLOGICAL MEASUREMENT
The educational persistence models. The two leading models in the edu-cational literature predicting students’college retention were proposed byTinto (1975, 1993) and Bean (1980, 1985). As shown by Robbins et al.(2004), these models have several common factors: (a) contextual influence,which includes factors pertaining to an institution that may be likely to affectcollege outcomes; (b) perceived social support; (c) social involvement; and(d) academic engagement, which includes commitment to obtain a degreeand commitment to an academic institution. Because of their roles in the edu-cational literature, both models have been well researched. Accordingly, theconstructs from these models also were examined in Robbins et al.’s meta-analysis. In particular, the social support, social involvement, and institu-tional commitment factors were found to be predictive of the college reten-tion criterion and were included in the current study.
Other Relevant Literatures
We broadened our search for potential predictors by examining the per-sonality and industrial-organizational psychology literatures. For example,in recent years, there has been a growing consensus in these literatures aboutthe basic structure of personality. Specifically, many agree that there are fivebroad personality constructs: emotional stability (or neuroticism), extro-version, conscientiousness, agreeableness, and openness (Digman, 1990;Goldberg, 1993; John, 1990). Of these, conscientiousness, emotional stabil-ity, and agreeableness have repeatedly been found to be predictive of twoimportant criteria in the organizational literature: job performance (Barrick& Mount, 1991; Hurtz & Donovan, 2000; Saldago, 1997; Tett, Jackson, &Rothstein, 1991) and turnover (Caligiuri, 2000; Saldago, 2002). These twocriteria are analogous to the criteria of academic performance and reten-tion in the educational literature. Furthermore, variations of these constructshave been found to be predictive of college performance (e.g., Malloch &Michael, 1981; Wolfe & Johnson, 1995) and college retention (Brown &Cross, 1993) in the educational measurement literature. Thus, it seems likelythat these personality constructs are useful predictors of college outcomecriteria. Indeed, findings from recent studies (e.g., Chamorro-Premuzic &Furnham, 2003; Okun & Finch, 1998; Paunonen & Ashton, 2001) havesupported this assertion. Consequently, these constructs also were includedin our scale development efforts.
The Conceptual Model
We constructed a rational model to direct scale construction efforts usingthe three content domains that surfaced in Robbins et al.’s (2004) meta-
LE ET AL. 485
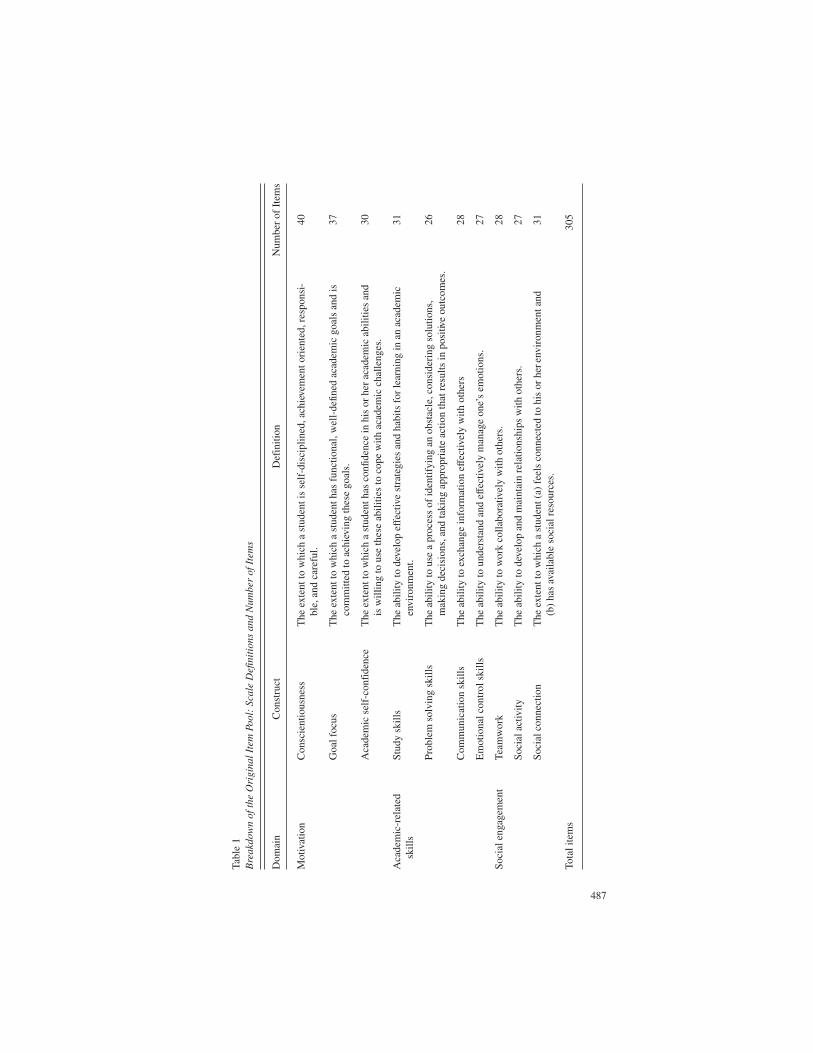
analysis: motivation, academic-related skills, and social engagement. Themotivation domain includes personal characteristics that help students suc-ceed academically by focusing and maintaining energies on goal-directedactivities. The academic-related skills domain includes cognitive, behav-ioral, and affective tools and abilities necessary to successfully complete aca-demic-related tasks. Finally, the social engagement domain includes inter-personal factors that influence students’ successful integration or adaptationinto their environment. As stated above, we expanded the model by includingconstructs believed to be predictive of college success but not examined inRobbins et al.’s meta-analysis.
The initial conceptual model consists of 10 constructs grouped underthree content domains. Specifically, the motivation domain includes threeconstructs: conscientiousness, goal focus, and academic self-efficacy. Con-scientiousness partially reflects the achievement motivation construct, but italso includes dependability (cf. Hough, 1992; Mount & Barrick, 1995). Webelieved that including both constructs would improve the model, becausethe student academic performance criterion is analogous to the job perfor-mance criterion in the organizational literature (cf. Barrick & Mount, 1991;Hurtz & Donovan, 2000; Saldago, 1997; Tett et al., 1991). The academic-related skills domain includes four constructs: study skills, problem solvingskills, communication skills, and emotional control skills. With the excep-tion of emotional control skills, these constructs were examined in Robbinset al.’s (2004) meta-analysis under the general domain of academic-relatedskills. In our conceptual model, we further specified the constructs to facili-tate the item writing process. Emotional control skills captures the affectivecomponent included in Pintrich’s (1989, 2000) model. It also reflects theconstruct of emotional stability, which has been found to be predictive ofjob performance and turnover criteria in the organizational literature (cf.Saldago, 2002; Tett et al., 1991).
The social engagement domain includes three constructs: sociability,social connection, and teamwork. The first two constructs are analogous tothe social involvement and social support constructs featured in Robbinset al.’s (2004) meta-analysis. Teamwork was also included in the conceptualmodel, because it captures the construct of agreeableness, which has beenfound to be predictive of job performance (Farsides & Woodfield, 2003;Hurtz & Donovan, 2000; Tett et al., 1991) and turnover (Caligiuri, 2000;Saldago, 2002) in the organizational literature. Conceivably, those criteriaare analogous to academic performance and college retention, the two col-lege outcomes of interest. Thus, the inclusion of the teamwork construct wasexpected to enhance the model for predicting college outcomes. Table 1 fea-tures definitions for all constructs in the conceptual model.
486 EDUCATIONAL AND PSYCHOLOGICAL MEASUREMENT
487
Tabl
e 1
Bre
akdo
wn
of th
e O
rigi
nal I
tem
Poo
l: S
cale
Def
init
ions
and
Num
ber
of I
tem
s
Dom
ain
Con
stru
ctD
efin
ition
Num
ber
of I
tem
s
Mot
ivat
ion
Con
scie
ntio
usne
ssT
he e
xten
t to
whi
ch a
stu
dent
is s
elf-
disc
iplin
ed, a
chie
vem
ent o
rien
ted,
res
pons
i -bl
e, a
nd c
aref
ul.
40
Goa
l foc
usT
he e
xten
t to
whi
ch a
stu
dent
has
fun
ctio
nal,
wel
l-de
fined
aca
dem
ic g
oals
and
isco
mm
itted
to a
chie
ving
thes
e go
als.
37
Aca
dem
ic s
elf-
conf
iden
ceT
he e
xten
t to
whi
ch a
stu
dent
has
con
fiden
ce in
his
or
her
acad
emic
abi
litie
s an
dis
will
ing
to u
se th
ese
abili
ties
to c
ope
with
aca
dem
ic c
halle
nges
.30
Aca
dem
ic-r
elat
edsk
ills
Stud
y sk
ills
The
abi
lity
to d
evel
op e
ffec
tive
stra
tegi
es a
nd h
abits
for
lear
ning
in a
n ac
adem
icen
viro
nmen
t.31
Prob
lem
sol
ving
ski
llsT
he a
bilit
y to
use
a p
roce
ss o
f id
entif
ying
an
obst
acle
, con
side
ring
sol
utio
ns,
mak
ing
deci
sion
s, a
nd ta
king
app
ropr
iate
act
ion
that
res
ults
in p
ositi
ve o
utco
mes
.26
Com
mun
icat
ion
skill
sT
he a
bilit
y to
exc
hang
e in
form
atio
n ef
fect
ivel
y w
ith o
ther
s28
Em
otio
nal c
ontr
ol s
kills
The
abi
lity
to u
nder
stan
d an
d ef
fect
ivel
y m
anag
e on
e’s
emot
ions
.27
Soci
al e
ngag
emen
tTe
amw
ork
The
abi
lity
to w
ork
colla
bora
tivel
y w
ith o
ther
s.28
Soci
al a
ctiv
ityT
he a
bilit
y to
dev
elop
and
mai
ntai
n re
latio
nshi
ps w
ith o
ther
s.27
Soci
al c
onne
ctio
nT
he e
xten
t to
whi
ch a
stu
dent
(a)
fee
ls c
onne
cted
to h
is o
r he
renv
iron
men
t and
(b)
has
avai
labl
e so
cial
res
ourc
es.
31
Tota
l ite
ms
305
Method
General Overview of the Inventory Development Procedure
We followed the construct validation approach (e.g., Clark & Watson,1995; Loevinger, 1957; Nunnally & Bernstein, 1994) to develop the scales ofinterest. Subsequently, a sequential exploratory-confirmatory procedure (cf.Gerbing & Hamilton, 1996) was used to empirically determine the factorstructure of the scales and to select items. First, we sought comments on theproposed model from experts in the subfields of education, counseling, andpersonality psychology. The general consensus was that the model appro-priately captured the constructs theoretically expected to be predictors ofcollege outcomes.
Thus, we began the scale development process using this conceptualmodel as a foundation. Specifically, we first generated items representing theconstructs in the conceptual model (see Table 1). After some revisions, theitems were administered to samples of college and high school students. Wecarried out an exploratory factor analysis to empirically examine the factorsunderlying these items. Items were screened on the basis of their pattern andstructure coefficients. Next, confirmatory factor analysis was implementedon data from a new sample to (a) confirm the factor structure and (b) reselectthe items. Finally, we attempted to determine the higher order factor structureof the scales by using second-order factor analyses.
Item Generation Procedure
Item writing. A research team composed of three applied psychologistswrote items representing the constructs illustrated in the conceptual model.For each construct, the writers developed a definition and then wrote itemsbroadly believed to capture the construct. First, the writers generated itemsindependently and then met to discuss which items were to be retained and/orrevised. This procedure yielded an initial pool of 320 items. In addition, onthe basis of earlier research concerning the optimal number of responseoptions in Likert-type scales (Green & Rao, 1970; Matell & Jacoby, 1972),items were set to a 6-point, Likert-type response scale ranging from stronglydisagree (1) to strongly agree (6).
Preliminary test of item clarity. To ensure that the items would be compre-hensible to 1st-year college students, we organized the items into two forms,each containing 160 items, and administered them to a small group of highschool seniors (N = 38). The students were asked to rate the readability of theitems (i.e., the extent to which they understood the meaning of the items)using a 5-point, Likert-type scale ranging from very easy to understand (1) to
488 EDUCATIONAL AND PSYCHOLOGICAL MEASUREMENT

very difficult to understand (5). On the basis of the mean ratings of item clar-ity, we deleted or revised items. Subsequently, the revised items were pre-sented to a group of experts in education and communication, who wereasked to comment on item clarity. The items were again revised on the basisof this feedback. The resulting item pool consisted of 305 items. (Table 1 fea-tures the number of items assigned to each scale.)
Study Design
The questionnaires. For various practical administrative concerns (e.g.,time constraints, potential fatigue), we organized the items into 10 partiallyoverlapping forms. Specifically, the 305 items were first randomly assignedto five nonoverlapping item clusters, each with 61 items. Subsequently, wecreated 10 different questionnaires by using three different clusters for eachform. Thus, each questionnaire consisted of 183 items, which requiredapproximately 30 minutes for students to complete. The questionnaires wereadministered sequentially to the study sample. This procedure followed thebalanced incomplete block spiraling design (cf. Zwick, 1987). It ensured thatthe minimum sample size of the correlation between any two items (i.e., theeffective sample size) was approximately three tenths of the total sample size.The maximum sample size was approximately three fifths of the total samplesize. In the terminology of generalizability theory (Cronbach, Gleser, Nanda,& Rajaratnam, 1972), the current study design is the two-facet nested designp:(i:j), where i, j, and p represent conditions in the universes of items, testforms, and the population of subjects, respectively.
Test administration procedure. The questionnaires were administered tothe study sample in a group setting during class time. Students were informedthat participation was voluntary and that the questionnaire would requireapproximately 30 minutes. The 10 forms of the questionnaire were spirallydistributed to students in each test administration session.
Study sample. Because the scales were constructed with the goal of identi-fying at-risk college students, the primary population of interest was 1st-yearstudents at postsecondary institutions (i.e., community colleges and 4-yearuniversities). Thus, we selected samples that closely resemble this popula-tion. Specifically, we recruited 1st-year students at community colleges anduniversities, as well as high school seniors, to participate in the study. Partici-pating institutions were given group summaries of their students’ results asan incentive for participating.
A total of 50 institutions (22 high schools, 22 community colleges, and six4-year universities) participated in the study. Reflecting the ACT customerbase, high schools primarily were located in the Midwest, South, Southeast,
LE ET AL. 489
and Southwest, whereas 2- and 4-year colleges were dispersed across allregions (the ACT is administered to more than 5 millions students and adultseach year). The total number of questionnaires returned was 6,456 (highschool: 2,337; community college: 2,471; university: 1,648). Of these, 5,970were usable. Data from 486 questionnaires were discarded because partici-pants did not indicate which test form was used, rendering the forms un-scorable, or because of random response patterns. Participants were mostlyfemale (57.2%) and Caucasian (66.9%), with a mean age of 20 years (SD =5.90 years, range 16 to 68 years). Because of the relatively small sample sizesof some ethnic and racial subgroups (e.g., n = 48 Native Americans, n = 23Native Hawaiian/Pacific Islanders), we were unable to make group compari-sons using each ethnic and racial groups. Instead, we grouped ethnic andracial minorities into an overall “minority” group. This group was used forsome of the comparative analyses presented in subsequent sections.
Data Analyses
Step 1: Exploratory factor analysis. First, we used exploratory factoranalysis to examine the factors underlying the data. These analyses were car-ried out on approximately two thirds of the total sample, henceforth referredto as the exploratory sample. We used the SAS (version 8.01; SAS Institute,1999) FACTOR procedure and specified principal-axis factoring as theextraction method (cf. Gorsuch, 1997; Nunnally & Bernstein, 1994). Thenumber of factors to be retained was determined on the basis of several crite-ria, including examination of the resulting scree plot, parallel analysis, andfactor interpretability. The factors were then rotated using the oblimin rota-tion method, which allowed the factors to be correlated (cf. Gorsuch, 1997).On the basis of both the pattern coefficients and structure coefficients, wepreselected items for further analysis in the next step. The selected itemswere expected to maximize a “clean” factor structure.
Step 2: Confirmatory factor analysis. The purpose of this analysis wastwofold: (a) to confirm the factors determined in the previous step and (b) toreselect items representing the factors. The confirmatory factor analysis wascarried out on the remaining one third of the total sample, henceforth referredto as the confirmatory sample. We specified the measurement model on thebasis of the pattern of item–latent factor relationships found in the explor-atory step. Specifically, for each item, the path from its respective latent fac-tor (i.e., regression weight for the factor or path coefficient) was allowed to befreely estimated while the paths from other factors were constrained to bezero. We examined the extent to which the model fit the data by using thecombination of several fit indexes (i.e., the comparative fit index [CFI], theroot mean square error of approximation [RMSEA], and the standardized
490 EDUCATIONAL AND PSYCHOLOGICAL MEASUREMENT
root mean square residual [SRMR]; Hu & Bentler, 1999). We then reselectedthe items on the basis of the magnitudes of their path coefficients usingLISREL (version 8.30) (Jöreskog & Sörbom, 1999). Approximately 10items were selected for each factor.
Step 3: Analyses to determine scale properties. For these analyses, theentire sample was used. We estimated the internal consistency reliability(i.e., Cronbach’s coefficient �) of scores on the resulting scales for the factorsdetermined in the previous steps. We also estimated the scales’ intercorre-lations, as well as their correlations with demographic variables (i.e., age,gender, ethnicity, and family income) and achievement scores (i.e., reportedhigh school GPA, ACT Assessment scores). The SAS CORR procedure wasused for these analyses.
Step 4: Second-order analyses. We examined the higher factor structureof the scales using second-order analyses. The resulting factor structure wasthen compared with the conceptual model. For these analyses, we followedthe exploratory-confirmatory procedure used in Steps 1 and 2. Specifically,we again randomly split the entire sample into two new, independent sub-samples. The first subsample was used to “explore” the higher order factorstructure underlying the factors established in the earlier steps (Steps 1 and2). Particularly, we expected to recover second-order factors similarlyhypothesized to reflect the motivation, academic-related skills, and socialengagement constructs. Exploratory factor analysis was carried out on thebasis of the correlations of the first-order factors. Next, the second subsamplewas used to confirm the factor structure by means of second-order confirma-tory analysis (cf. Rindskopf & Rose, 1988).
Additionally, we performed measurement equivalence analyses (cf.Byrne, Shavelson, & Muthen, 1989; Vandenberg & Lance, 2000) to furtherexamine the factorial equivalence of the scales across the following sets ofsubgroups: (a) men versus women, (b) ethnic majority versus minority, and(c) high school versus community college versus university students. Thisanalysis involved comparing hierarchically nested models by means ofmultigroup confirmatory factor analysis. The factor structures of the scales(i.e., path coefficients and interfactor covariances) were not expected to varysignificantly across the subgroups.
Results
Exploratory Factor Analysis
We randomly selected 3,300 responses (330 for each test form) from thetotal 5,970 responses for this analysis. Because of our partially overlapping
LE ET AL. 491
study design, the effective sample size ranged from 990 (i.e., three tenths of3,300) to 1,980 (i.e., three fifths of 3,300). Exploratory factor analysis(principal-axis factoring) with pairwise deletion was carried out. On the basisof the resulting scree plot (Cattell, 1966), we initially extracted 11 factors.The factors were then rotated using the oblimin rotation method (differentrotation methods were also used to thoroughly examine the factor solutions,including different oblique [i.e., promax and oblimin with different parame-ters] and orthogonal [varimax and quartimax] methods, all of which yieldedessentially the same results). On item examination, we decided to retain only10 factors because of the uninterpretability of the items belonging to Factor11. Following the suggestion of a reviewer, we additionally conducted a par-allel analysis (using the procedure provided by Thompson & Daniel, 1996)to further determine the number of factors to be extracted. This analysisresulted in 16 factors. However, out of those factors, only 10 were interpret-able. These 10 factors were very similar to those retained in the earlieranalyses.
We reran the exploratory factor analysis specifying a 10-factor solutionusing oblique rotation (using the oblimin rotation [ � = 0] method). The 10factors appeared interpretable. The 10 factors accounted for about 37.4% ofthe total variance. This percentage of variance appeared to be acceptable,given the relatively large number of items examined (i.e., 305). The factorswere low to moderately correlated with one another. The mean of theinterfactor correlations was .06 (range r = |.02| to |.42|), and the standard devi-ation was .19. (A table with the resulting factors and factor intercorrelationsand the number of items clearly associated with each factor is available fromthe authors on request.) From these results, we tentatively selected 145 itemson the basis of the relative magnitudes of their pattern coefficients (i.e., largerthan .30 on the principal factor and lower than .20 on other secondary factors)for further (confirmatory) analysis.
Confirmatory Factor Analysis
Data for this analysis were the remaining 2,670 responses (minimum n =800). Confirmatory factor analysis was carried out examining the modelspecifying 10 latent factors with 145 items as indicators. The items werespecified to be indicators of the factors determined in the earlier step. Weused the maximum likelihood estimation method, with sample size specifiedas the geometric mean of sample sizes of all correlation pairs (n = 1,035; cf.Viswesvaran & Ones, 1995). The model showed a very good fit ( @ 2 =10,486.72, df = 10,250, p = .05, CFI = .99, RMSEA = .012, SRMR = .035),confirming the factor structures determined in the exploratory analysis. Wethen proceeded to reselect the items on the basis of the magnitudes of theregression weights for their assigned factors, as previously stated in the
492 EDUCATIONAL AND PSYCHOLOGICAL MEASUREMENT
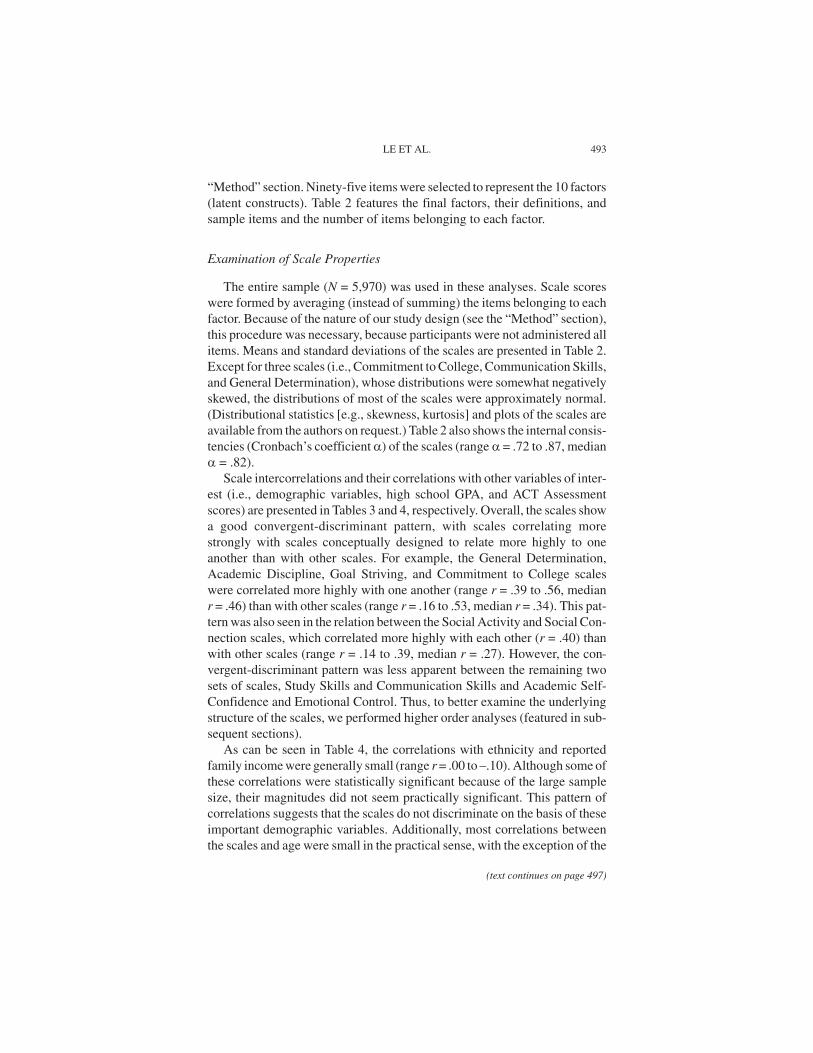
“Method” section. Ninety-five items were selected to represent the 10 factors(latent constructs). Table 2 features the final factors, their definitions, andsample items and the number of items belonging to each factor.
Examination of Scale Properties
The entire sample (N = 5,970) was used in these analyses. Scale scoreswere formed by averaging (instead of summing) the items belonging to eachfactor. Because of the nature of our study design (see the “Method” section),this procedure was necessary, because participants were not administered allitems. Means and standard deviations of the scales are presented in Table 2.Except for three scales (i.e., Commitment to College, Communication Skills,and General Determination), whose distributions were somewhat negativelyskewed, the distributions of most of the scales were approximately normal.(Distributional statistics [e.g., skewness, kurtosis] and plots of the scales areavailable from the authors on request.) Table 2 also shows the internal consis-tencies (Cronbach’s coefficient �) of the scales (range � = .72 to .87, median� = .82).
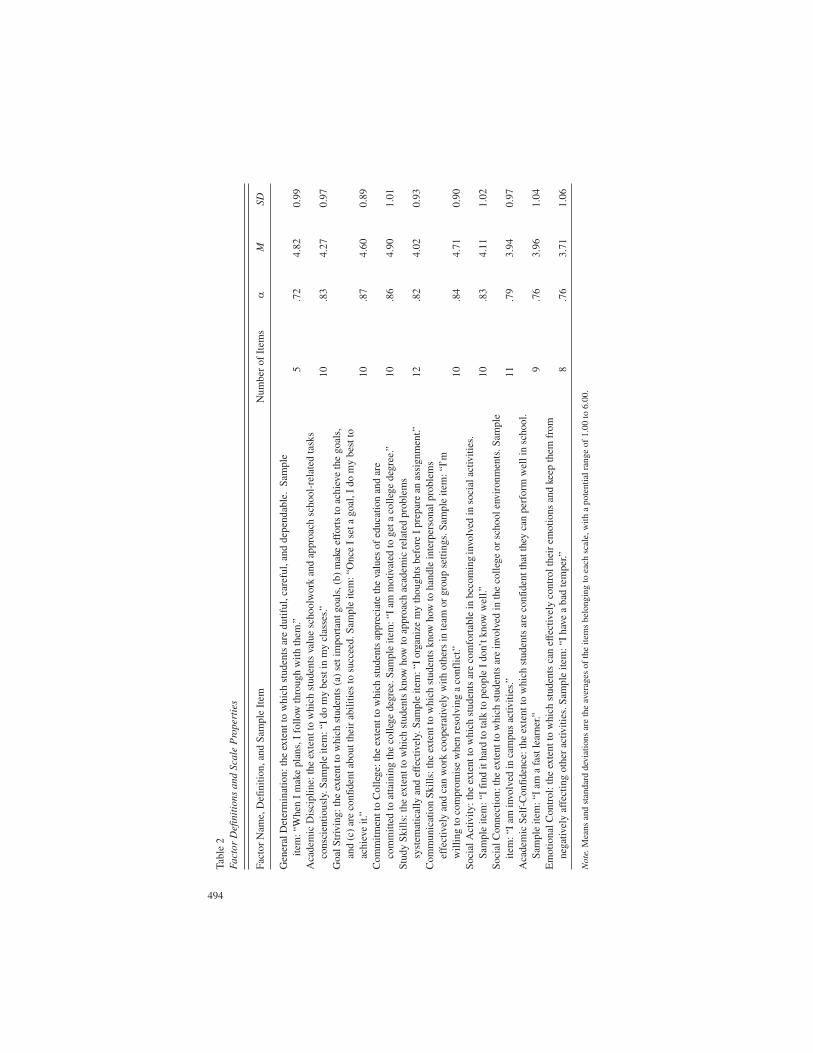
Scale intercorrelations and their correlations with other variables of inter-est (i.e., demographic variables, high school GPA, and ACT Assessmentscores) are presented in Tables 3 and 4, respectively. Overall, the scales showa good convergent-discriminant pattern, with scales correlating morestrongly with scales conceptually designed to relate more highly to oneanother than with other scales. For example, the General Determination,Academic Discipline, Goal Striving, and Commitment to College scaleswere correlated more highly with one another (range r = .39 to .56, medianr = .46) than with other scales (range r = .16 to .53, median r = .34). This pat-tern was also seen in the relation between the Social Activity and Social Con-nection scales, which correlated more highly with each other (r = .40) thanwith other scales (range r = .14 to .39, median r = .27). However, the con-vergent-discriminant pattern was less apparent between the remaining twosets of scales, Study Skills and Communication Skills and Academic Self-Confidence and Emotional Control. Thus, to better examine the underlyingstructure of the scales, we performed higher order analyses (featured in sub-sequent sections).
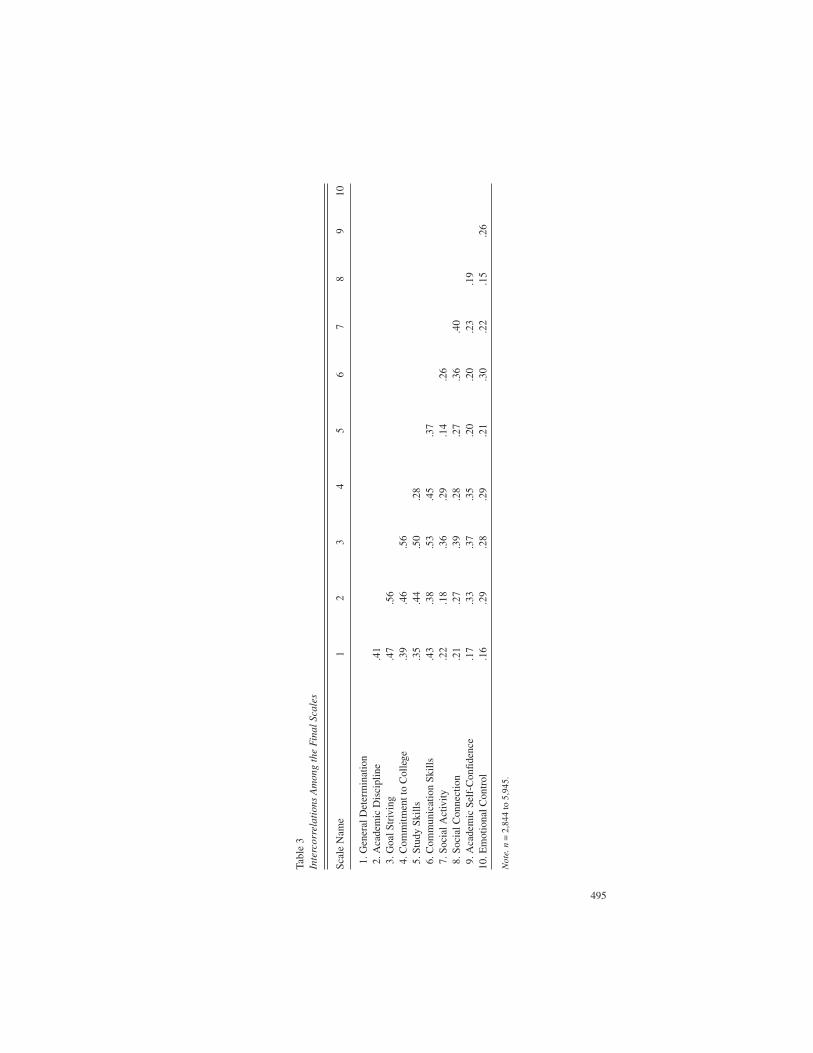
As can be seen in Table 4, the correlations with ethnicity and reportedfamily income were generally small (range r = .00 to –.10). Although some ofthese correlations were statistically significant because of the large samplesize, their magnitudes did not seem practically significant. This pattern ofcorrelations suggests that the scales do not discriminate on the basis of theseimportant demographic variables. Additionally, most correlations betweenthe scales and age were small in the practical sense, with the exception of the
LE ET AL. 493
(text continues on page 497)
494
Tabl
e 2
Fact
or D
efin
itio
ns a
nd S
cale
Pro
pert
ies
Fact
or N
ame,
Def
initi
on, a
nd S
ampl
e It
emN
umbe
r of
Ite
ms
�M
SD
Gen
eral
Det
erm
inat
ion:
the
exte
nt to
whi
ch s
tude
nts
are
dutif
ul, c
aref
ul, a
nd d
epen
dabl
e. S
ampl
eite
m: “
Whe
n I
mak
e pl
ans,
I f
ollo
w th
roug
h w
ith th
em.”
5.7
24.
820.
99A
cade
mic
Dis
cipl
ine:
the
exte
nt to
whi
ch s
tude
nts
valu
e sc
hool
wor
k an
d ap
proa
ch s
choo
l-re
late
d ta
sks
cons
cien
tious
ly. S
ampl
e ite
m: “
I do
my
best
in m
y cl
asse
s.”10
.83
4.27
0.97
Goa
l Str
ivin
g: th
e ex
tent
to w
hich
stu
dent
s (a
) se
t im
port
ant g
oals
, (b)
mak
e ef
fort
s to
ach
ieve
the
goal
s,an
d (c
) ar
e co
nfid
ent a
bout
thei
r ab
ilitie
s to
suc
ceed
. Sam
ple
item
: “O
nce
I se
t a g
oal,
I do
my
best
toac
hiev
e it.
”10
.87
4.60
0.89
Com
mitm
ent t
o C
olle
ge: t
he e
xten
t to
whi
ch s
tude
nts
appr
ecia
te th
e va
lues
of
educ
atio
n an
d ar
eco
mm
itted
to a
ttain
ing
the
colle
ge d
egre
e. S
ampl
e ite
m: “
I am
mot
ivat
ed to
get
a c
olle
ge d
egre
e.”
10.8
64.
901.
01St
udy
Skill
s: th
e ex
tent
to w
hich
stu
dent
s kn
ow h
ow to
app
roac
h ac
adem
ic r
elat
ed p
robl
ems
syst
emat
ical
ly a
nd e
ffec
tivel
y. S
ampl
e ite
m: “
I or
gani
ze m
y th
ough
ts b
efor
e I
prep
are
an a
ssig
nmen
t.”12
.82
4.02
0.93
Com
mun
icat
ion
Skill
s: th
e ex
tent
to w
hich
stu
dent
s kn
ow h
ow to
han
dle
inte
rper
sona
l pro
blem
sef
fect
ivel
y an
d ca
n w
ork
coop
erat
ivel
y w
ith o
ther
s in
team
or
grou
p se
tting
s. S
ampl
e ite
m: “
I’m
will
ing
to c
ompr
omis
e w
hen
reso
lvin
g a
conf
lict.”
10.8
44.
710.
90So
cial
Act
ivity
: the
ext
ent t
o w
hich
stu
dent
s ar
e co
mfo
rtab
le in
bec
omin
gin
volv
ed in
soc
ial a
ctiv
ities
.Sa
mpl
e ite
m: “
I fi
nd it
har
d to
talk
to p
eopl
e I
don’
t kno
w w
ell.”
10.8
34.
111.
02So
cial
Con
nect
ion:
the
exte
nt to
whi
ch s
tude
nts
are
invo
lved
in th
e co
llege
or
scho
ol e
nvir
onm
ents
. Sam
ple
item
: “I
am in
volv
ed in
cam
pus
activ
ities
.”11
.79
3.94
0.97
Aca
dem
ic S
elf-
Con
fide
nce:
the
exte
nt to
whi
ch s
tude
nts
are
conf
iden
t tha
t the
y ca
n pe
rfor
m w
ell i
n sc
hool
.Sa
mpl
e ite
m: “
I am
a fa
st le
arne
r.”9
.76
3.96
1.04
Em
otio
nal C
ontr
ol: t
he e
xten
t to
whi
ch s
tude
nts
can
effe
ctiv
ely
cont
rol t
heir
em
otio
ns a
nd k
eep
them
fro
mne
gativ
ely
affe
ctin
g ot
her
activ
ities
. Sam
ple
item
: “I
have
a b
ad te
mpe
r.”8
.76
3.71
1.06
Not
e.M
eans
and
sta
ndar
d de
viat
ions
are
the
aver
ages
of
the
item
s be
long
ing
to e
ach
scal
e, w
ith a
pot
entia
l ran
ge o
f 1.
00 to
6.0
0.
495
Tabl
e 3
Inte
rcor
rela
tion
s A
mon
g th
e Fi
nal S
cale
s
Scal
e N
ame
12
34
56
78
910
1. G
ener
al D
eter
min
atio
n2.
Aca
dem
ic D
isci
plin
e.4
13.
Goa
l Str
ivin
g.4
7.5
64.
Com
mitm
ent t
o C
olle
ge.3
9.4
6.5
65.
Stu
dy S
kills
.35
.44
.50
.28
6. C
omm
unic
atio
n Sk
ills
.43
.38
.53
.45
.37
7. S
ocia
l Act
ivity
.22
.18
.36
.29
.14
.26
8. S
ocia
l Con
nect
ion
.21
.27
.39
.28
.27
.36
.40
9. A
cade
mic
Sel
f-C
onfi
denc
e.1
7.3
3.3
7.3
5.2
0.2
0.2
3.1
910
. Em
otio
nal C
ontr
ol.1
6.2
9.2
8.2
9.2
1.3
0.2
2.1
5.2
6
Not
e.n
= 2
,844
to 5
,945
.
496
Tabl
e 4
Cor
rela
tion
s of
the
Scal
es W
ith
Dem
ogra
phic
and
Aca
dem
ic V
aria
bles
Scal
eE
thni
city
aIn
com
eA
geG
ende
rbH
igh
Scho
ol G
PAA
CT
Sco
re
Gen
eral
Det
erm
inat
ion
–.01
–.01
.10
.15
.11
–.01
Aca
dem
ic D
isci
plin
e–.
01.0
0.1
3.2
4.2
8.0
5G
oal S
triv
ing
–.07
–.03
.14
.15
.16
–.02
Com
mitm
ent t
o C
olle
ge–.
02–.
00.0
7.2
3.2
1.0
7St
udy
Skill
s–.
10–.
06.2
1.1
4.0
9–.
00C
omm
unic
atio
n Sk
ills
.03
–.02
.07
.22
.12
.03
Soci
al A
ctiv
ity.0
6.0
5–.
00.1
0.0
8–.
03So
cial
Con
nect
ion
.06
.06
–.15
.12
.20
.05
Aca
dem
ic S
elf-
Con
fide
nce
.01
.01
–.01
.06
.32
.32
Em
otio
nal C
ontr
ol–.
02.0
1.1
1.0
5.1
0.0
5
Not
e.n
= 1
,601
to 5
,948
.a.
Min
ority
= 0
, maj
ority
= 1
.b.
Mal
e =
0, f
emal
e =
1.
correlation between the Study Skills scale and age (r = .21). We thought thatthis correlation might be influenced by the fact that older respondents weremore likely to be community college or university students. Therefore, wecarried out additional analyses partialing out student status (high school stu-dent vs. community college or university student). The resulting correlation(r = .19) was only slightly smaller than the zero-order correlation. Althoughthis finding ruled out the hypothesis that the correlation was due to studentstatus, the reason for this correlation remains unknown. If replicated, we planto explore this issue in subsequent research.
Several scales (i.e., Commitment to College, Communication Skills, Aca-demic Discipline, and to a lesser extent General Determination, Goal Striv-ing, and Study Skills) were correlated with gender (range r = .14 to .24). Spe-cifically, these correlations indicated that women tended to score higher thanmen on these scales. These findings were generally expected, given thenature of the constructs underlying the scales and previous research findingsthat men and women tend to score differently on various psychological mea-sures, including measures of agreeableness (Budaev, 1999; Charbonneau &Nicol, 2002; Feingold, 1994), measures of conscientiousness (Charbonneau& Nicol, 2002; Gullone & Moore, 2000; Guthrie, Ash, & Stevens, 2003), andstudy strategy measures (e.g., Hong & Milgram, 1999; Slotte, Lonka, &Lindblom-Ylaenne, 2001). Moreover, a recent international study conductedby the Organisation for Economic Co-operation and Development (2003)found that on average, adolescent girls tend to score higher on measures ofmotivation, self-related cognitions, and learning strategies.
Initial validity estimates using achievement indices. The relationsbetween the scales and high school GPA and ACT Assessment scores ap-peared consistent with the theoretically expected pattern, thus providingsome initial evidence for the construct validity of the scales. Specifically,Commitment to College, Social Connection, Academic Discipline, and Aca-demic Self-Confidence were somewhat correlated with high school GPA(range r = .20 to .32). Moreover, as theoretically expected (cf. Bandura,1997), the Academic Self-Confidence scale was found to be somewhat corre-lated with students’ ACT Assessment scores (r = .32). All correlationsreported in the text are observed correlations. Correlations between truescores (i.e., correlations disattenuated by the effect of measurement error) arelikely to be higher.
Examining the Higher Order Factor Structure of the Scales
As described in the “Method” section, we used exploratory factor analysison the basis of the correlations among the 10 first-order factors to determinethe second-order factors. Those correlations were obtained from the confir-
LE ET AL. 497
matory factor analysis carried out on a new subsample (n = 3,970, with effec-tive sample size ranging from 1,867 to 3,957). Examination of the resultantscree plot suggested that there were 3 to 4 second-order factors underlyingthe 10 first-order factors. We initially used a solution with 4 second-orderfactors. On the basis of the meanings of the first-order factors that served asindicators, the second-order factors were named Motivation (underlying theCommitment to College, Goal Striving, Academic Discipline, and GeneralDetermination scales), Skills (underlying the Study Skills and Communica-tion Skills scales), Social Engagement (underlying the Social Activity andSocial Connection scales), and Self-Management (underlying the AcademicSelf-Confidence and Emotional Control scales).
A second-order confirmatory factor analysis was then carried out on theremaining holdout sample (n = 2,000, with effective sample size rangingfrom 566 to 1,987). Following Viswesvaran and Ones’s (1995) suggestion,we calculated the geometric mean of the sample sizes of all the bivariate cor-relations and used the result (n = 1,060) as the sample size in our confirma-tory factor analysis. Each scale was split into two halves to create indicatorsfor the first-order factors. The analysis confirmed the higher order factorstructure found in the exploratory factor analysis (fit indices: @ 2 = 695.52,df = 154, p < .001, CFI = .927, RMSEA =.058, SRMR = .043). However, theestimated correlation between the second-order constructs of skills and moti-vation was quite high (r = .96). This finding suggests that the two constructsmay be the same. To explore this possibility, we carried out an additionalanalysis, testing a model containing three second-order factors, with theskills and motivation constructs combined into a single factor (henceforthreferred to as Model 2). Model 2 was nested within the model with four sec-ond-order factors model discussed earlier (henceforth referred to as Model1), so we could compare the fit indices of the two models to determine theappropriateness of Model 2. In particular, we examined the differencebetween the chi-square values of the two models, which itself is distributed asa chi-square statistic with degrees of freedom equal to the difference in thedegrees of freedom of the models (Widaman, 1985). Model 2 provided a rea-sonable fit (fit indices: @ 2 = 712.34, df = 157, p < .001, CFI = .925, RMSEA =.058, SRMR = .044). The chi-square difference was statistically significant( �@ 2 = 16.82, df = 3, p < .001), indicating that Model 2 did not fit the data aswell as Model 1. It is worth noting that the chi-square difference statistic, justlike the chi-square statistic, is largely dependent on sample size (see Cheung& Rensvold, 2002). With a sufficiently large sample, the chi-square statisticprovides a sensitive statistical test—but not a practical test—for model fit. Infact, our sample size was relatively large (effective n = 1,060), which likelyinflated the small difference between the models. Recently, Yuan and Bentler(2004) showed that the nested chi-square test is not reliable when the basemodel is not correctly specified. Although we believed that our Model 1 was
498 EDUCATIONAL AND PSYCHOLOGICAL MEASUREMENT
LE ET AL. 499
generally appropriate, there might have been some minor misspecifications(e.g., unspecified correlated errors between the indicators) that affected theresult provided by the chi-square test.
On the basis of the results of simulation studies, Cheung and Rensvold(2002) suggested using the CFI (Bentler, 1990) to compare the degree offit of hierarchically nested models. Specifically, these researchers recom-mended that a difference of .01 or larger in the CFI indicates that the nestedmodel does not fit as well as the original model. When applying this criterion,we found that the difference in CFI between the models was only .002, whichis considerably smaller than the suggested cutoff value. Thus, Model 2,which is more parsimonious than Model 1, was retained.
Examining Model 2, the first-order factors indicating the motivationsecond-order construct had estimated standardized path coefficients rangingfrom .69 to .89 (general determination = .80, academic discipline = .80, goalstriving = .89, commitment to college = .74, study skills = .69, and communi-cation skills = .70). For the second-order construct of social engagement, theestimated standardized path coefficient of social activity was .71, and socialconnection was .77. For the self-management second-order construct, theestimated standardized path coefficient of academic self-confidence was.67, and emotional control was .58. The estimated correlation betweenmotivation and social engagement was .64, between motivation and self-management was .80, and between social engagement and self-managementwas .59.
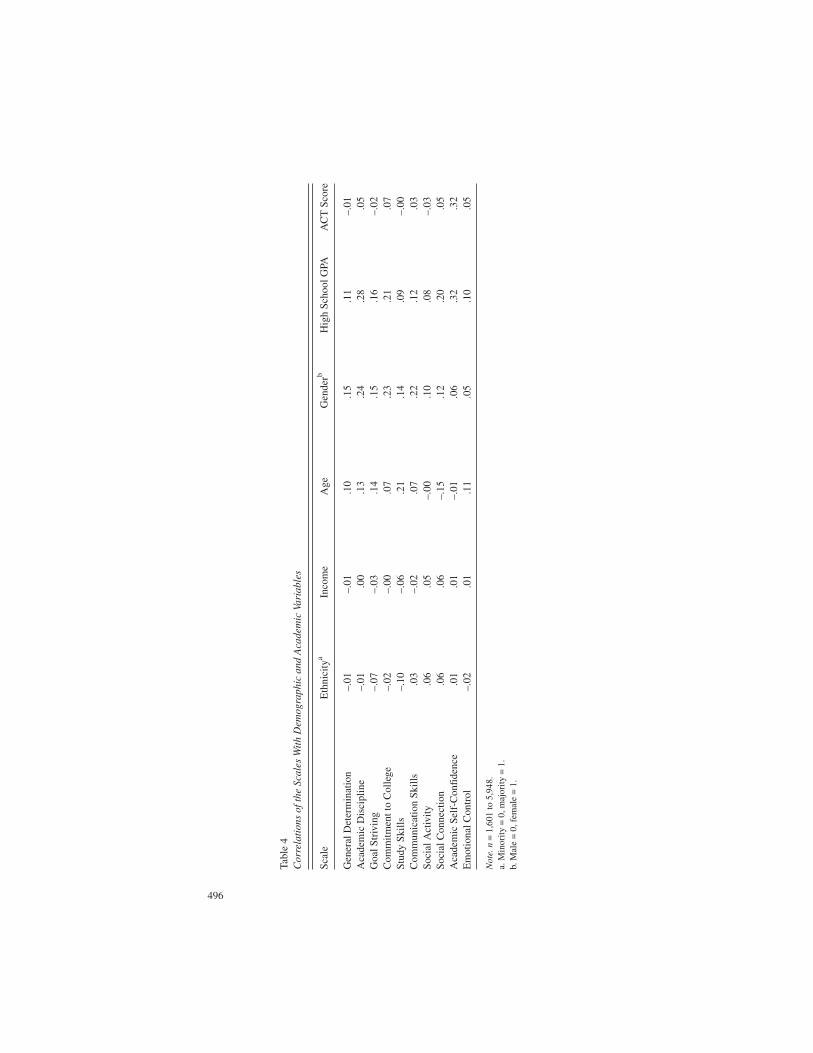
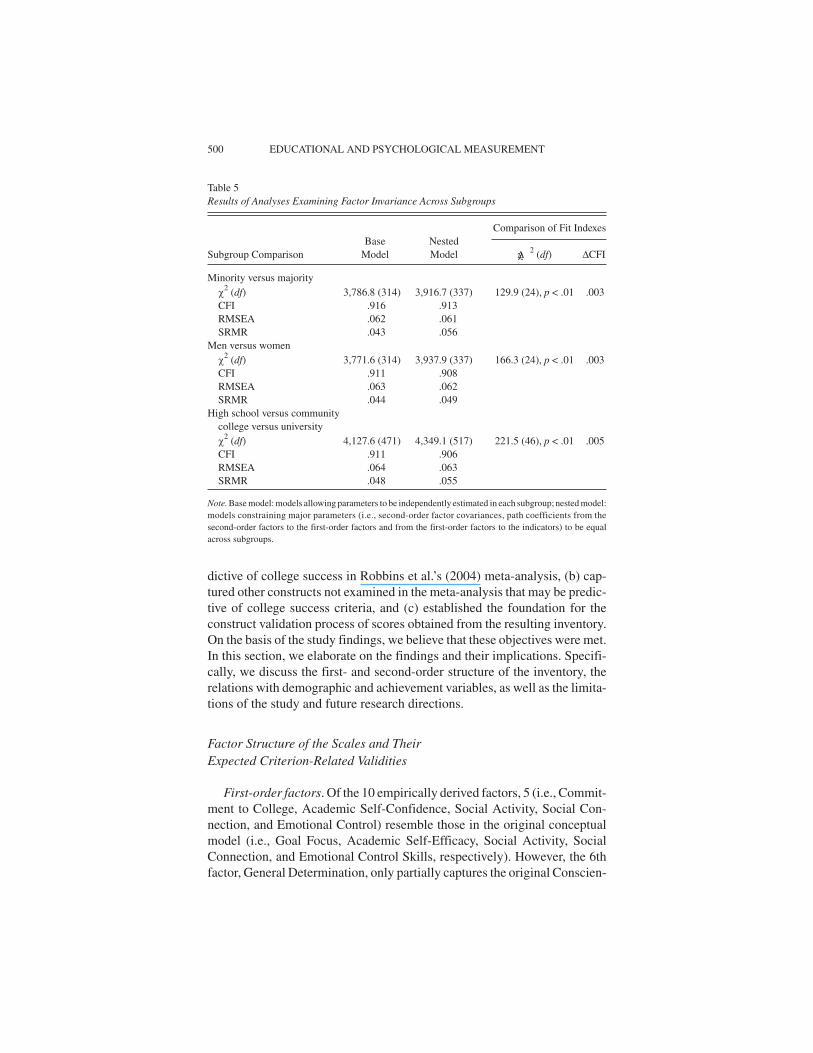
Potential subgroup differences. As mentioned in the “Method” section,we carried out additional analyses to examine the equivalence of the factorstructure of the scales across different subgroups (men vs. women, highschool vs. community college vs. university students, and majority vs. mi-nority). Specifically, we compared base models, which allowed parametersto be independently estimated in each subgroup, with nested models, inwhich the major parameters (i.e., second-order factor covariances, path co-efficients from the second-order factors to the first-order factors and fromthe first-order factors to the indicators) were constrained to be equal acrossthe subgroups. Table 5 features the results of these analyses. As can be seen,all nested models had reasonable fit. Although the chi-square differenceswere statistically significant for all the comparisons, the differences in CFIwere much smaller (from .003 to .005) than the cutoff criterion of .01 sug-gested by Cheung and Rensvold (2002). These results indicated that the fac-tor structure (path coefficients and covariances) was invariant across subgroups.
Discussion
The main objective of the current study was to develop an inventory ofpsychosocial and skill factors that (a) captured the constructs found to be pre-
dictive of college success in Robbins et al.’s (2004) meta-analysis, (b) cap-tured other constructs not examined in the meta-analysis that may be predic-tive of college success criteria, and (c) established the foundation for theconstruct validation process of scores obtained from the resulting inventory.On the basis of the study findings, we believe that these objectives were met.In this section, we elaborate on the findings and their implications. Specifi-cally, we discuss the first- and second-order structure of the inventory, therelations with demographic and achievement variables, as well as the limita-tions of the study and future research directions.
Factor Structure of the Scales and TheirExpected Criterion-Related Validities
First-order factors. Of the 10 empirically derived factors, 5 (i.e., Commit-ment to College, Academic Self-Confidence, Social Activity, Social Con-nection, and Emotional Control) resemble those in the original conceptualmodel (i.e., Goal Focus, Academic Self-Efficacy, Social Activity, SocialConnection, and Emotional Control Skills, respectively). However, the 6thfactor, General Determination, only partially captures the original Conscien-
500 EDUCATIONAL AND PSYCHOLOGICAL MEASUREMENT
Table 5Results of Analyses Examining Factor Invariance Across Subgroups
Comparison of Fit IndexesBase Nested
Subgroup Comparison Model Model �@ 2 (df) � CFI
Minority versus majority@ 2 (df) 3,786.8 (314) 3,916.7 (337) 129.9 (24), p < .01 .003CFI .916 .913RMSEA .062 .061SRMR .043 .056
Men versus women@ 2 (df) 3,771.6 (314) 3,937.9 (337) 166.3 (24), p < .01 .003CFI .911 .908RMSEA .063 .062SRMR .044 .049
High school versus communitycollege versus university@ 2 (df) 4,127.6 (471) 4,349.1 (517) 221.5 (46), p < .01 .005CFI .911 .906RMSEA .064 .063SRMR .048 .055
Note. Base model: models allowing parameters to be independently estimated in each subgroup; nested model:models constraining major parameters (i.e., second-order factor covariances, path coefficients from thesecond-order factors to the first-order factors and from the first-order factors to the indicators) to be equalacross subgroups.
tiousness factor, because it primarily includes items constituting the Depend-ability subfactor of Conscientiousness. The remaining four factors appear tobe combinations of two original factors. Specifically, the obtained StudySkills factor includes items belonging to the original Study Skills and Prob-lem Solving Skills factors. The obtained Goal Striving factor combines itemsof the original Goal Focus and Conscientiousness factors. Similarly, the ob-tained Communication Skills factor includes items from the original Com-munication Skills and Teamwork factors. And the obtained Academic Disci-pline factor combines items from the original Conscientiousness and StudySkills factors. Overall, the findings partially confirmed the factors originallysuggested in the conceptual model.
Several of the first-order factors are similar to those examined in Robbinset al.’s (2004) meta-analysis. In the motivation domain, the Commitment toCollege factor appears to capture both the goal commitment and institutionalcommitment constructs. Similarly, the Goal Striving factor seems to capturethe achievement motivation and goal commitment constructs. The AcademicSelf-Confidence and Study Skills factors resemble the academic self-efficacy and academic-related skills constructs, respectively, included inRobbins et al.’s meta-analysis. In the social engagement domain, the SocialConnection factor appears to represent the constructs of social support andsocial involvement. Finally, the Sociability factor is highly similar to thesocial involvement construct. Because comparable scales were found to pro-vide important incremental validities in predicting college outcomes in Rob-bins et al.’s meta-analysis, we expect that the scales developed in this studywill be similarly predictive of such outcomes. This hypothesis should beexamined with future research.
The remaining four first-order factors (Academic Discipline, GeneralDetermination, Communication Skills, and Emotional Control) appear torepresent relatively new factors not examined in Robbins et al.’s (2004) meta-analysis. It again should be noted that the scope of the meta-analysis was sub-ject to the limitations of the literature on which it was based. As mentionedbefore, on the basis of our study of the related literature, we attempted toovercome such limitations by including items representing constructs poten-tially predictive of the outcomes of interest. Accordingly, we expect thatfuture research will find that these “new” factors will also contribute posi-tively to the prediction of college outcomes.
Second-order factors. We found three higher order factors underlying thefirst-order factors, just as in the conceptual model. The Social Engagementfactor reflects items and scales originally suggested in the conceptual model.However, first-order constructs forming the Motivation and Academic-Related Skills higher order factors in the conceptual model were combinedinto one single factor: Motivation and Skills. Consequently, this higher orderfactor contains a range of factors that appear to tap motivation and conscien-
LE ET AL. 501
tiousness, as well as academic and communication skills. The other higherorder factor, Self-Management, emerged as a separate second-order factorincluding Academic Self-Confidence and Emotional Control. This finding,although initially surprising, seems consistent with recent research showingthat generalized self-efficacy, self-esteem, and emotional stability can begrouped under the general construct of core self-evaluation (Judge, Erez,Bono, & Thoresen, 2002). This core self-evaluation construct has beenshown to be a good predictor of job performance, turnover, and job satisfac-tion (Judge & Bono, 2001). Together with Robbins et al.’s (2004) meta-analytic findings about the predictive abilities of academic self-efficacy forcollege outcomes, the current finding suggests that the Self-Managementfactor may be an important predictor of the criteria of interest.
As explained earlier, the very high correlation between the two higherorder factors Motivation and Skills led us to combine them to form the Moti-vation and Skills factor. This finding is puzzling given that the scales consti-tuting the original higher order factors were written to be theoretically dis-tinct on the basis of the existing literature. In the current context, motivationis conceptualized as psychological characteristics that drive students toengage in the pursuit of academic-related behaviors, whereas skills are gen-erally defined as the proficiency to perform well academically. One possibleexplanation is that these factors, despite their relatively distinct research his-tories, may be measuring the same thing. This is sometimes referred to as the“jangle” fallacy (Block, 1995), in which the same construct bears differentnames. From another perspective, we may be observing the incongruencebetween the specificity of measurement and the motivational constructsrather than the similarity of the motivation and skill constructs (i.e., the lackof measurement specificity may be creating the apparent similarity).
In the past, researchers have treated the two constructs differently, and wefollowed that practice when writing items to capture the constructs. Despiteconceptual distinction, some existing empirical evidence suggests that thetwo constructs may be highly correlated. In their meta-analysis, Robbinset al. (2004) found that the corrected correlations between academic-relatedskills and two motivational constructs, achievement motivation and goals,were .82 and .69, respectively. Applying the formula used for correlation ofcomposite scores (see Hunter & Schmidt, 1990; Nunnally & Bernstein,1994), we estimated the correlation between academic-related skills and theequally weighted composite of achievement motivation and goals, a proxy ofthe motivation to succeed construct, may be as high as .83. This calculationwas based on the estimated corrected correlation between achievement moti-vation and goals (r = .65), as found in Robbins et al. (2004). Because thisproxy is only a rough representation of the motivation construct, it may bethat the true correlation between the skills and motivation constructs, if prop-erly operationalized, could be as high as the value obtained in this study (cf.Hunter & Schmidt, 1990). Indeed, it is possible that those individuals who
502 EDUCATIONAL AND PSYCHOLOGICAL MEASUREMENT
have the skills to succeed academically are more motivated to do well inacademic environments, which is consistent with the expectancy theory(Vroom, 1964). Conversely, it is also possible that students who are moti-vated sufficiently have made necessary efforts to equip themselves with theskills needed to succeed. This is an interesting research question that requiresfurther examination. Thus, we believe that it is important to replicate the find-ing in the current study and to reexamine the high magnitude of associationbetween the motivation and skills constructs before any firm conclusionsabout the relation between the constructs can be made. On the basis of empiri-cal evidence in the study, we have elected to retain the three second-order fac-tor model with the Motivation and Skills factors collapsed into a single factor.
Relations With Demographic Variables
As stated in the “Results” section, most of the correlations between thescales and the demographic variables of interest (age, family income, andethnicity) are small and, despite their statistical significance, of little practi-cal significance. However, correlations between several scales (Commitmentto College, Teamwork, and Academic Discipline) and gender were some-what larger in magnitude, thereby raising questions about the potentially dif-ferential interpretations of the scales’contents by men and women. This con-cern was somewhat alleviated by our measurement equivalence analyses,which showed that the factorial structure of the scales was invariant acrossgenders. However, our analyses could not provide a definitive answer toquestions such as the potentially differential predictive validity of the scalesacross these groups. Such questions will be addressed when the criterion dataare available. We are in the process of collecting such data.
Limitations and Future Research
Normative data. Because of the nature of the design, participants did notrespond to all items. This limitation forced us to average available responsesfor items belonging to each scale to form scale scores. Although this proce-dure should not seriously affect our correlation-based (or covariance-based)analyses (Zwick, 1987), the estimations of scale distributional characteristics(i.e., mean, standard deviation, skewness, and kurtosis) may not be as accu-rate. Accordingly, further study with a traditional, fully crossed design (i.e.,all students responding to all items; cf. Cronbach et al., 1972) is needed toobtain more conclusive information about the characteristics of the scales.Moreover, a detailed sampling procedure targeting the population of interest(i.e., community colleges, 4-year universities across different levels of selec-tivity) should be used to obtain the normative data that are essential for thescales’ evaluation and use.
LE ET AL. 503
Criterion-related and construct validity. The main purpose of the scalesconstructed in the study is to assist in identifying students who are at higherrisk for falling behind academically or dropping out. As such, validities inpredicting the college outcomes of interest are the most important criteria forevaluating the scales. Without criterion data (i.e., data about students’ GPAsand enrollment status), we could not perform the analyses to directly addressthe issue. The results of the current study suggest that the scales presented inthis study may satisfactorily capture the constructs supported by the existingliterature on college outcomes. For example, in Robbins et al.’s (2004) meta-analysis, validities of the constructs examined were found to be generalizableacross different operationalizations and situations. In accordance with theacademically and professionally accepted standard pertaining to validitygeneralization research (American Educational Research Association,American Psychological Association, & National Council on Measurementin Education, 1999; Campbell, 1990; Schmidt, Hunter, Pearlman, & Hirsh,1985), we believe that the scales developed as part of this study will showpredictive validity for academic performance and retention. However, de-spite our confidence, it is necessary to directly estimate the magnitudes of thevalidities, as well as to collect data using other established measures to exam-ine whether the pattern of convergent-discriminant relations with such mea-sures is supportive of the construct validity of the current inventory. Thus,additional research is needed to develop a more compelling construct validityargument.
Future directions. We believe that the careful construction of the StudentReadiness Inventory is an essential first step in examining the incrementalvalidity of psychosocial and study skill factors when predicting college per-formance and retention. We are currently surveying a national sample ofentering 1st-year students at both 2- and 4-year postsecondary institutions.Because we have the students’ ACT Assessment records, we will be able tocontrol for measures of standardized achievement, high school academicperformance, and socioeconomic status before determining the role thatnoncognitive factors, as measured by the Student Readiness Inventory, playon college outcomes.
Additionally, an important question concerning the practical value of theinventory will need to be addressed: If at-risk students are to be identified,can educational institutions use interventions to help these students improvetheir chances of success? Indeed, the literature suggests that tailored inter-ventions can boost students’success, particularly within the retention and en-rollment management arena. For example, Hattie, Biggs, and Purdie (1996)used meta-analytic techniques to examine 51 study skills interventions todetermine the conditions under which interventions are effective. They foundthat the promotion of learner activity and contextual learning led to positiveoutcomes. In another meta-analytic study of career education interventions
504 EDUCATIONAL AND PSYCHOLOGICAL MEASUREMENT
emphasizing basic academic skills, work habits, and work values, Evans andBurck (1992) found that the overall effect size (e.g., Cohen’s d) of 67 studieswas .16, producing a positive gain in academic achievement. Thus, it seemsthat if at-risk students can be identified early (e.g., at the beginning of their1st year of college), developmental interventions designed to facilitate stu-dent success may yield significant positive outcomes. Thus, we are interestedin forming partnerships with institutions who are committed to examin-ing the efficacy of such interventions for at-risk students identified in their 1styear.
Finally, we are interested in exploring whether the aforementionednoncognitive factors can influence course placement decisions for those stu-dents who appear within the “decision zone” of either a more difficult or eas-ier college course on the basis of achievement testing (e.g., the ACT Assess-ment or COMPASS [Computer-Adaptive Placement Assessment andSupport System]). For example, when controlling for achievement testscores, will noncognitive factors predict successful performance on a moredifficult course? That is, given two students with comparable achievementscores, do motivational and skills, social, and self-management factors dem-onstrate incremental validity for course placement? We hope to explore suchquestions in future research.
References
American Educational Research Association, American Psychological Association, & NationalCouncil on Measurement in Education. (1999). Standards for educational and psychologicaltesting. Washington, DC: Authors.
Atkinson, J. W. (1964). An introduction to motivation. Princeton, NJ: Van Nostrand Reinhold.Bandura, A. (1997). Self-efficacy: The exercise of control. New York: W. H. Freeman.Barrick, M. R., & Mount, M. K. (1991). The Big Five personality dimensions and job perfor-
mance: A meta-analysis. Personnel Psychology, 44, 1-25.Bean, J. P. (1980). Dropouts and turnover: The synthesis and test of a causal model of student at-
trition. Research in Higher Education, 12, 155-187.Bean, J. P. (1985). Interaction effects based on class level in an explanatory model of college stu-
dent dropout syndrome. American Educational Research Journal, 22, 35-64.Bentler, P. M.(1990). Comparative fit indexes in structural models. Psychological Bulletin, 107,
238-246.Block, J. (1995). A contrarian view of the five-factor approach to personality description. Psy-
chological Bulletin, 117, 187-215.Brown, N., & Cross, E. J. (1993). Retention in engineering and personality. Educational and Psy-
chological Measurement, 53, 661-671.Budaev, S.V. (1999). Sex differences in the Big Five personality factors: Testing an evolutionary
hypothesis. Personality and Individual Differences, 26, 801-813.Byrne, B. M., Shavelson, R. J., & Muthen, B. (1989). Testing for the equivalence of factor
covariance and mean structures: The issue of partial measurement invariance. PsychologicalBulletin, 105, 456-466.
Caligiuri, P. M. (2000). The Big Five personality characteristics as predictors of expatriate’s de-sire to terminate the assignment and supervisor-rated performance. Personnel Psychology,53, 67-88.
LE ET AL. 505

Campbell, J. P. (1990). Modeling the performance prediction problem in industrial and orga-nizational psychology. In M. V. Dunnette & L. M. Hough (Eds), Handbook of industrial andorganizational psychology (Vol. 1, 2nd ed., pp. 687-732). Palo Alto, CA: Consulting Psy-chologists Press.
Cattell, R. B. (1966). The scree test for the number of factors. Multivariate Behavioral Research,1, 245-276.
Chamorro-Premuzic, T., & Furnham, A. (2003). Personality predicts academic performance:Evidence from two longitudinal university samples. Journal of Research in Personality, 37,319-338.
Charbonneau, D., & Nicol, A. M. (2002). Emotional intelligence and prosocial behaviors in ado-lescents. Psychological Reports, 90, 361-370.
Cheung, G. W., & Rensvold, R. B. (2002). Evaluating goodness-of-fit indexes for testing mea-surement invariance. Structural Equation Modeling, 9, 233-255.
Clark, L. A., & Watson, D. (1995). Constructing validity: Basic issues in objective scale develop-ment. Psychological Assessment, 7, 309-319.
Covington, M. (2000). Goal theory, motivation, and school achievement: An integrative review.Annual Review of Psychology, 51, 171-200.
Cronbach, L. J., Gleser, G. C., Nanda, H., & Rajaratnam, N. (1972). The dependability of behav-ioral measurements: Theory of generalizability for scores and profiles. New York: JohnWiley.
Digman, J. M. (1990). Personality structure: Emergence of the five-factor model. Annual Reviewof Psychology, 41, 417-440.
Eccles, J. S., & Wigfield, A. (2002). Motivational beliefs, values, and goals. Annual Review ofPsychology, 53, 109-132.
Evans, J. H., & Burck, H. D. (1992). The effects of career education interventions on academicachievement: A meta-analysis. Journal of Counseling & Development, 71, 63-68.
Farsides, T., & Woodfield, R. (2003). Individual differences and undergraduate academic suc-cess: The roles of personality, intelligence, and application. Personality and Individual Dif-ferences, 34, 1225-1243.
Feingold, A. (1994). Gender differences in personality: A meta-analysis. Psychological Bulletin,116, 429-456.
Gerbing, D. W., & Hamilton, J. G. (1996). Viability of exploratory factor analysis as a precursorto confirmatory factor analysis. Structural Equation Modeling, 3, 62-72.
Goldberg, L. R. (1993). The structure of phenotypic personality traits. American Psychologist,48, 26-34.
Gorsuch, R. L. (1997). Exploratory factor analysis: Its role in item analysis. Journal of Personal-ity Assessment, 68, 532-560.
Green, P. E., & Rao, V. R. (1970). Rating scales and information recovery—How many scalesand response categories to use? Journal of Marketing, 34, 33-39.
Gullone, E., & Moore, S. (2000). Adolescent risk-taking and the five factor model of personality.Journal of Adolescence, 23, 393-407.
Guthrie, J. P., Ash, R. A., & Stevens, C. D. (2003). Are women “better” than men? Personalitydifferences and expatriate selection. Journal of Managerial Psychology, 18, 229-243.
Hattie, J., Biggs, J., & Purdie, N. (1996). Effects of learning skills interventions on student learn-ing: A meta-analysis. Review of Educational Research, 66, 99-136.
Hezlett, S., Kuncel, N., Vey, A., Ahart, A., Ones, D., Campbell, J., et al. (2001, March). The effec-tiveness of the SAT in predicting success early and late in college: A comprehensive meta-analysis. Paper presented at the annual meeting of the National Council of Measurement inEducation, Seattle, WA.
Hong, E., & Milgram, R. M. (1999). Preferred and actual homework style: A cross-cultural ex-amination. Educational Research, 41, 251-265.
506 EDUCATIONAL AND PSYCHOLOGICAL MEASUREMENT
Hough, L. M. (1992). The Big Five personality variables-construct confusion: Description ver-sus prediction. Human Performance, 5, 139-155.
Hu, L., & Bentler, P. M. (1999). Cutoff criteria for fit indexes in covariance structure analysis:Conventional criteria versus new alternatives. Structural Equation Modeling, 6, 1-55.
Hunter, J. E., & Schmidt, F. L. (1990). Methods of meta-analysis: Correcting error and bias in re-search findings. Newbury Park, CA: Sage.
Hurtz, G. M., & Donovan, J. J. (2000). Personality and job performance: The Big Five revisited.Journal of Applied Psychology, 85, 869-879.
John, O. P. (1990). The “Big Five” factor taxonomy: Dimensions of personality in the natural lan-guage and in questionnaires. In L. A. Pervin (Ed.), Handbook of personality: Theory and re-search (pp. 66-100). New York: Guilford.
Jöreskog, K. G., & Sörbom, D. (1999). LISREL 8.30 and PRELIS 2.30. Chicago: Scientific Soft-ware International.
Judge, T. A., & Bono, J. E. (2001). Relationship of core self-evaluations traits—self-esteem, gen-eralized self-efficacy, locus of control, and emotional stability—with job satisfaction and jobperformance: A meta-analysis. Journal of Applied Psychology, 86, 80-92.
Judge, T. A., Erez, A., Bono, J. E., & Thoresen, C. J. (2002). Are measures of self-esteem,neuroticism, locus of control, and generalized self-efficacy indicators of a common core con-struct? Journal of Personality and Social Psychology, 83, 693-710.
Loevinger, J. (1957). Objective tests as instruments of psychological theory. Psychological Re-ports, 3, 635-694.
Malloch, D. C., & Michael, W. B. (1981). Predicting student grade point average at a communitycollege from scholastic aptitude tests and from measures representing three constructs inVroom’s expectancy theory model of motivation. Educational and Psychological Measure-ment, 41, 1127-1135.
Matell, M. S., & Jacoby, J. (1972). Is there an optimal number of alternatives for Likert-scaleitems? Effects on testing time and scale properties. Journal of Applied Psychology, 56, 506-509.
McCelland, D. C. (1980). Motive dispositions: The merit of operant and respondent measures.Review of Personality and Social Psychology, 1, 10-41.
Mount, M. K., & Barrick, M. R. (1995). The Big Five personality dimensions: Implications forresearch and practice in human resource management. Research in Personnel & Human Re-sources Management, 13, 153-200.
Nunnally, J. C., & Bernstein, I. H. (1994). Psychometric theory (3rd ed.). New York: McGraw-Hill.
Okun, M. A., & Finch, J. F. (1998). The big-five personality dimensions and the process of insti-tutional departure. Contemporary Educational Psychology, 23, 233-256.
Organisation for Economic Co-operation and Development. (2003). Education at a glance:OECD indicators. Paris, France: Author.
Pascarella, E., & Terenzini, P. (1991). How college affects students: Findings and insights fromtwenty years of research. San Francisco: Jossey-Bass.
Paunonen, S. V., & Ashton, M. C. (2001). Big Five predictors of academic achievement. Journalof Research in Personality, 35, 78-90.
Pintrich, P. R. (1989). The dynamic interplay of student motivation and cognition in the collegeclassroom. In C. Ames & M. Maehr (Eds.), Advances in motivation and achievement: Moti-vation-enhancing environments (Vol. 6, pp. 117-160). Greenwich, CT: JAI.
Pintrich, P. R. (2000). An achievement goal perspective on issues in motivation terminology,theory, and research. Contemporary Educational Psychology, 25, 92-104.
Pintrich, P. R., & De Groot, E. V. (1990). Motivational and self-regulated learning components ofclassroom academic performance. Journal of Educational Psychology, 82, 33-40.
LE ET AL. 507
Pintrich, P. R., Smith, D.A.F., Garcia, T., & McKeachie, W. J. (1993). Reliability and predictivevalidity of the Motivated Strategies for Learning Questionnaire (MSLQ). Educational andPsychological Measurement, 53, 801-813.
Rindskopf, D., & Rose, T. (1988). Some theory and applications of confirmatory second-orderfactor analysis. Multivariate Behavioral Research, 23, 51-67.
Robbins, S. B., Lauver, K., Le, H., Davis, D., Langley, R., & Carlstrom, A. (2004). Dopsychosocial and study skill factors predict college outcomes? A meta-analysis. Psychologi-cal Bulletin, 130, 261-288.
Saldago, J. (1997). The five factor model of personality and job performance in the EuropeanCommunity. Journal of Applied Psychology, 82, 30-43.
Saldago, J. (2002). The Big Five personality dimensions and counterproductive behaviors. Inter-national Journal of Selection & Assessment, 10, 117-125.
SAS Institute. (1999). The SAS system for Windows. Cary, NC: Author.Schmidt, F. L., Hunter, J. E., Pearlman, K., & Hirsh, H. R. (1985). Forty questions about validity
generalization and meta-analysis. Personnel Psychology, 38, 697-798.Schunk, D. H., & Zimmerman, B. J. (2003). Self-regulation and learning. In W. M. Reynolds &
G. E. Miller (Eds.), Handbook of psychology, Vol. 7: Educational psychology (pp. 59-78).New York: John Wiley.
Slotte, V., Lonka, K., & Lindblom-Ylaenne, S. (2001). Study-strategy use in learning from text.Does gender make any difference? Instructional Science, 29, 255-272.
Tett, R. P., Jackson, D. N., & Rothstein, M. (1991). Personality measures as predictors of job per-formance: A meta-analytic review. Personnel Psychology, 44, 703-742.
Thompson, B., & Daniel, L. G. (1996). Factor analytic evidence for the construct validity ofscores: A historical overview and some guidelines. Educational and Psychological Mea-surement, 56, 197-208.
Tinto, V. (1975). Dropout from higher education: A theoretical synthesis of recent research. Re-view of Educational Research, 45, 89-125.
Tinto, V. (1993). Leaving college: Rethinking the cause and cures of student attrition (2nd ed.).Chicago: University of Chicago Press.
Vandenberg, R. J., & Lance, C. E. (2000). A review and synthesis of the measurement invarianceliterature: Suggestions, practices, and recommendations for organizational research. Orga-nizational Research Methods, 3, 4-70.
Viswesvaran, C., & Ones, D. S. (1995). Theory testing: Combining psychometric meta-analysisand structural equations modeling. Personnel Psychology, 48, 865-885.
Vroom, V. H. (1964). Work and motivation. New York: John Wiley.Widaman, K. F. (1985). Hierarchically nested covariance structure models for multitrait-
multimethod data. Applied Psychological Measurement, 9, 1-26.Wigfield, A., & Eccles, J. S. (2000). Expectancy-value theory of achievement motivation. Con-
temporary Educational Psychology, 25, 68-81.Wolfe, R. N., & Johnson, S. D. (1995). Personality as a predictor of college performance. Educa-
tional and Psychological Measurement, 55, 177-185.Yuan, K. H., & Bentler, P. M. (2004). On chi-square difference and z tests in mean and covariance
structure analysis when the base model is misspecified. Educational and PsychologicalMeasurement, 64, 737-757.
Zimmerman, B. J. (1986). Development of self-regulated learning: Which are the key subpro-cesses? Contemporary Educational Psychology, 16, 307-313.
Zimmerman, B. J., & Martinez-Pons, M. (1986). Development of a structured interview forassessing student use of self-regulated learning strategies. American Educational ResearchJournal, 23, 614-628.
Zwick, R. (1987). Assessing the dimensionality of NAEP reading data. Journal of EducationalMeasurement, 24, 293-308.
508 EDUCATIONAL AND PSYCHOLOGICAL MEASUREMENT