Motif-Blind, Genome-Wide Discovery of cis-Regulatory Modules in Drosophila and Mouse
23
Motif-blind, genome-wide discovery of cis-regulatory modules in Drosophila and mouse Miriam R. Kantorovitz 1,* , Majid Kazemian 2,* , Sarah Kinston 3 , Diego Miranda-Saavedra 3 , Qiyun Zhu 4 , Gene E. Robinson 5,6 , Berthold Göttgens 3,! , Marc S. Halfon 4,7,! , and Saurabh Sinha 2,5,! 1 Dept. of Mathematics, University of Illinois at Urbana-Champaign, Urbana, IL 61801, U.S.A. 2 Dept. of Computer Science, University of Illinois at Urbana-Champaign, Urbana, IL 61801, U.S.A. 3 Cambridge Institute for Medical Research, University of Cambridge, Cambridge CB2 0XY, U.K. 4 Dept. of Biological Sciences, SUNY Buffalo, NY, U.S.A. 5 Dept. of Entomology, University of Illinois at Urbana-Champaign, Urbana, IL 61801, U.S.A. 6 Institute for Genomic Biology, University of Illinois at Urbana-Champaign, Urbana, IL 61801, U.S.A. 7 Dept. of Biochemistry, SUNY Buffalo, NY, U.S.A. SUMMARY We present new approaches to cis-regulatory module (CRM) discovery in the common scenario where relevant transcription factors and/or motifs are unknown. Beginning with a small list of CRMs mediating a common gene expression pattern, we search genome-wide for CRMs with similar functionality, using new statistical scores, and without requiring known motifs or accurate motif discovery. We cross-validate our predictions on 31 regulatory networks in Drosophila and through correlations with gene expression data. Five predicted modules tested using an in vivo reporter gene assay all show tissue-specific regulatory activity. We also demonstrate our methods’ ability to predict mammalian tissue-specific enhancers. Finally, we predict human CRMs that regulate early blood and cardiovascular development. In vivo transgenic mouse analysis of two predicted CRMs demonstrates that both have appropriate enhancer activity. Overall, 7/7 predictions were validated successfully in vivo, demonstrating the effectiveness of our approach for insect and mammalian genomes. INTRODUCTION In metazoans, much of transcriptional regulation is mediated by cis-regulatory modules (CRMs; also “modules” or “enhancers”), that form the building blocks of gene regulatory networks (Carroll et al., 2001). CRM identification formerly had been possible only through a dedicated empirical approach of testing sequence fragments for regulatory activity in a reporter gene assay. The genomics era has led to the development of new genome-wide © 2009 Elsevier Inc. All rights reserved. ! Corresponding authors. [email protected] Ph: 217-333-3233, [email protected] Ph: 716-829-3126, [email protected] Ph: 01223 336829 * Equal contribution Publisher's Disclaimer: This is a PDF file of an unedited manuscript that has been accepted for publication. As a service to our customers we are providing this early version of the manuscript. The manuscript will undergo copyediting, typesetting, and review of the resulting proof before it is published in its final citable form. Please note that during the production process errors may be discovered which could affect the content, and all legal disclaimers that apply to the journal pertain. NIH Public Access Author Manuscript Dev Cell. Author manuscript; available in PMC 2010 October 1. Published in final edited form as: Dev Cell. 2009 October ; 17(4): 568–579. doi:10.1016/j.devcel.2009.09.002. NIH-PA Author Manuscript NIH-PA Author Manuscript NIH-PA Author Manuscript
-
Upload
independent -
Category
Documents
-
view
3 -
download
0
Transcript of Motif-Blind, Genome-Wide Discovery of cis-Regulatory Modules in Drosophila and Mouse

Motif-blind, genome-wide discovery of cis-regulatory modules inDrosophila and mouse
Miriam R. Kantorovitz1,*, Majid Kazemian2,*, Sarah Kinston3, Diego Miranda-Saavedra3,Qiyun Zhu4, Gene E. Robinson5,6, Berthold Göttgens3,!, Marc S. Halfon4,7,!, and SaurabhSinha2,5,!1Dept. of Mathematics, University of Illinois at Urbana-Champaign, Urbana, IL 61801, U.S.A.2Dept. of Computer Science, University of Illinois at Urbana-Champaign, Urbana, IL 61801, U.S.A.3Cambridge Institute for Medical Research, University of Cambridge, Cambridge CB2 0XY, U.K.4Dept. of Biological Sciences, SUNY Buffalo, NY, U.S.A.5Dept. of Entomology, University of Illinois at Urbana-Champaign, Urbana, IL 61801, U.S.A.6Institute for Genomic Biology, University of Illinois at Urbana-Champaign, Urbana, IL 61801, U.S.A.7Dept. of Biochemistry, SUNY Buffalo, NY, U.S.A.
SUMMARYWe present new approaches to cis-regulatory module (CRM) discovery in the common scenariowhere relevant transcription factors and/or motifs are unknown. Beginning with a small list of CRMsmediating a common gene expression pattern, we search genome-wide for CRMs with similarfunctionality, using new statistical scores, and without requiring known motifs or accurate motifdiscovery. We cross-validate our predictions on 31 regulatory networks in Drosophila and throughcorrelations with gene expression data. Five predicted modules tested using an in vivo reporter geneassay all show tissue-specific regulatory activity. We also demonstrate our methods’ ability to predictmammalian tissue-specific enhancers. Finally, we predict human CRMs that regulate early bloodand cardiovascular development. In vivo transgenic mouse analysis of two predicted CRMsdemonstrates that both have appropriate enhancer activity. Overall, 7/7 predictions were validatedsuccessfully in vivo, demonstrating the effectiveness of our approach for insect and mammaliangenomes.
INTRODUCTIONIn metazoans, much of transcriptional regulation is mediated by cis-regulatory modules(CRMs; also “modules” or “enhancers”), that form the building blocks of gene regulatorynetworks (Carroll et al., 2001). CRM identification formerly had been possible only througha dedicated empirical approach of testing sequence fragments for regulatory activity in areporter gene assay. The genomics era has led to the development of new genome-wide
© 2009 Elsevier Inc. All rights reserved.!Corresponding authors. [email protected] Ph: 217-333-3233, [email protected] Ph: 716-829-3126, [email protected] Ph: 01223336829*Equal contributionPublisher's Disclaimer: This is a PDF file of an unedited manuscript that has been accepted for publication. As a service to our customerswe are providing this early version of the manuscript. The manuscript will undergo copyediting, typesetting, and review of the resultingproof before it is published in its final citable form. Please note that during the production process errors may be discovered which couldaffect the content, and all legal disclaimers that apply to the journal pertain.
NIH Public AccessAuthor ManuscriptDev Cell. Author manuscript; available in PMC 2010 October 1.
Published in final edited form as:Dev Cell. 2009 October ; 17(4): 568–579. doi:10.1016/j.devcel.2009.09.002.
NIH
-PA Author Manuscript
NIH
-PA Author Manuscript
NIH
-PA Author Manuscript
techniques to screen for potential gene-regulatory regions, such as chromatinimmunoprecipitation coupled to genomic tiling arrays (ChIP-chip) (Li et al., 2008) or ultrahigh-throughput sequencing (ChIP-Seq) (Visel et al., 2009). Although they show greatpromise, even these empirical methods do not identify regulatory elements or predict theirtissue-specific activity with complete accuracy. Importantly, the fact that it is impossible toassay all tissue types under all conditions means that potential CRMs will be missed by thesetechniques.
In recent years, computational methods have provided an attractive complementary approachfor module identification. However, their effectiveness has been limited to a few well-understood biological systems, where prior knowledge of the requisite TFs and their bindingsites could be exploited. This paper examines CRM prediction in the much more commonscenario where knowledge of the relevant TFs and/or their binding specificities (motifs) ismissing. We tackle here a common variant of this problem:
Suppose a small set of modules participating in a transcriptional sub-network is known a priori.The task is to use such information as “training data” to guide the search for other modules inthat sub-network. We call this task the “supervised CRM prediction problem”. The term sub-network refers here to a group of genes that are coordinately expressed as a result of havingcommon regulatory inputs. We define a successful CRM prediction as identification of asequence that drives an expression pattern commensurate with a nearby gene’s endogenousexpression. Depending on how specific the expression patterns of the training CRMs are, asuccessfully predicted CRM may recapitulate their common expression pattern, or may not.
Computational methods for CRM prediction (Berman et al., 2002; Halfon et al., 2002) (Frithet al., 2003) (Sinha et al., 2003) (Philippakis et al., 2005) (Donaldson et al., 2005) typicallyscan the genome for clusters of putative binding sites that are defined by sequence similarityto known motifs. This approach may fail on at least two grounds. First, motif information issparse as of now; e.g., motif databases for Drosophila catalog only ~12% of the estimatednumber of TFs. Intense efforts are being made to characterize the binding specificities of allTFs in mouse (Berger et al., 2006) and fruitfly (Noyes et al., 2008) and may in the long termalleviate the problem. However, these efforts are labor-intensive and relatively expensive andthe problem may thus persist for scientists studying organisms other than human/mouse andfruitfly. A second, more serious problem facing CRM discovery stems from the fact that mostcomputational tools need prior knowledge of the TFs relevant to the specific regulatory networkof interest. For less studied regulatory systems, such knowledge may not be available.Admittedly, even if the relevant TFs and/or their motifs are unknown, computational motiffinding tools may be used to discover position-weight-matrix (PWM) motifs from the trainingdata. However, the modest success rate of motif-finding programs, as suggested by a recentsurvey (Tompa et al., 2005), casts doubts upon the prospect of CRM discovery based oncomputational motif finding.
Here, we address simultaneously both problems by undertaking supervised CRM discovery inthe absence of motif knowledge and without relying upon accurate motif finding. We proposeand examine various statistics to capture the functional similarity (due to shared binding sites)between a candidate CRM and the given set of modules. These statistics belong to the realmof “alignment-free” sequence comparison, since the similarity to be detected is not due toorthology. The statistics are based on frequencies of short words, akin to many motif-findingprograms, but without the usual objective of finding the most specific (biochemically accurate)characterization of the TF’s binding sites. All new methods developed here are made publiclyavailable as source code at http://veda.cs.uiuc.edu/scrm/index.htm
Kantorovitz et al. Page 2
Dev Cell. Author manuscript; available in PMC 2010 October 1.
NIH
-PA Author Manuscript
NIH
-PA Author Manuscript
NIH
-PA Author Manuscript

Previous attempts at solving the supervised CRM prediction problem (Chan and Kibler,2005; Grad et al., 2004; Nazina and Papatsenko, 2003) have been primarily tested on a singledata set, the anterior-posterior patterning sub-network in D. melanogaster. We now evaluatetwo existing and seven new scoring schemes on 31 data sets in Drosophila and eight data setsin mammals, and perform in vivo validation in both species. In our previous work (Ivan et al.,2008), we proposed computational methods for CRM discovery without prior knowledge ofmotifs or modules, where the search was constrained to regions around co-regulated genes.Here, we relax that constraint and enable genome-wide search by leveraging the priorknowledge of related CRMs where available. The methods of (Ivan et al., 2008) are notapplicable in this setting. An unsupervised version of our problem was also addressed in(Rajewsky et al., 2002) through the use of Poisson statistics on short word counts.
We performed extensive cross-validation tests with our scores on 31 data sets representing abroad spectrum of regulatory sub-networks in D. melanogaster, exploiting known modulescatalogued in the REDfly database (Halfon et al., 2008). Our tests established the feasibilityof supervised CRM prediction for about half of the examined data sets, and also identified datasets that are not amenable to our scores. We then predicted modules genome-wide for eachamenable regulatory sub-network, and found their neighboring genes to be highly enriched forthe expected expression patterns. We filtered our predicted module collection based on geneexpression data, producing a high confidence set of putative CRMs belonging to a regulatorysub-network. We tested five predicted modules in vivo and found each of the five to drivereporter gene expression that recapitulates aspects of the endogenous gene expression(although not always in the expected pattern).
Assessment of the supervised prediction pipeline on eight data sets in mammals, comprising244 tissue-specific enhancers, led to ~60% of the enhancers being recovered. We finally appliedthis pipeline to predict CRMs with roles in mammalian blood and cardiovascular development.In vivo validation in transgenic mice allowed us to demonstrate successful identification oftwo regulatory regions with the predicted activity and demonstrates the extensibility of ourcomputational approach beyond Drosophila.
RESULTSScoring schemes
Given a genomic region in which to search, each of our CRM prediction schemes scans thesequence with a shifting window of fixed size, and scores the window for similarity to a (given)training set of CRMs. Thus, the crucial component of each of these schemes is its unique scoringsystem for matching a candidate module (“test CRM”) to the set of known “training modules”.These scoring schemes are described next at a general level; details are available in Methodsand Supplementary Note S1.
1. Markov chain-based score—The “HexMCD” score trains separate generative models(5th order Markov chains) for training modules and background sequences, and quantifieswhich model matches the test sequence better. This score was originally proposed by (Grad etal., 2004).
2. Dot product-based scores, with statistical significance estimation (“D2z”)—These scores are based on the dot-product of k-mer frequency distributions of training and testsequences. Importantly, the scores are made to reflect the statistical significance of this dot-product, by analytical computation of “z-scores” under suitable null models; hence the name“D2z”. For technical reasons described in Methods, we had to develop and implement thisanalytical calculation differently from our previous work (Ivan et al., 2008; Kantorovitz et al.,2007) on the D2z score. We developed three scoring schemes in this category (Methods).
Kantorovitz et al. Page 3
Dev Cell. Author manuscript; available in PMC 2010 October 1.
NIH
-PA Author Manuscript
NIH
-PA Author Manuscript
NIH
-PA Author Manuscript

3. Selection of representative k-mers, followed by Poisson statistics—In the newscore called “Poisson Additive Conditional” or “PAC”, words that are even weakly associatedwith the training CRMs are identified and their additive contributions to the similarity scoreare based on overrepresentation of those words in the test sequence, relative to backgroundsequences, calculated using Poisson statistics (Methods).
4. Selection of representative k-mers, followed by weighted sum of counts—The
two scores in this category are generically defined as where n(w) is the numberof occurrences of word w in the test sequence, σ(w) is a weight reflecting its association withthe training modules, and the set W comprises the top ranking words based on σ(w). In the“HexDiff” score of (Chan and Kibler, 2005), re-implemented here, the weight of a word is theratio of its frequency in training and background sequences. In the “HexYMF” scheme wehave designed, the weight of w is the “z-score” (see Methods) of the count of w in the trainingCRMs,.
5. Motif database-driven score—We developed a program, called Stubb-MDB (“Stubbbased on Motif Database”), that begins with a large compendium of experimentally validatedmotifs (Matys et al., 2003) (Noyes et al., 2008) (Halfon et al., 2008), determines the motifsthat are relevant to the regulatory sub-network of interest and runs the Stubb program (Sinhaet al., 2003) with these short-listed motifs to score the test sequence for matches to the motifs.This motif-based approach provides a useful point of comparison to the motif-blind approachesoutlined above (1-4).
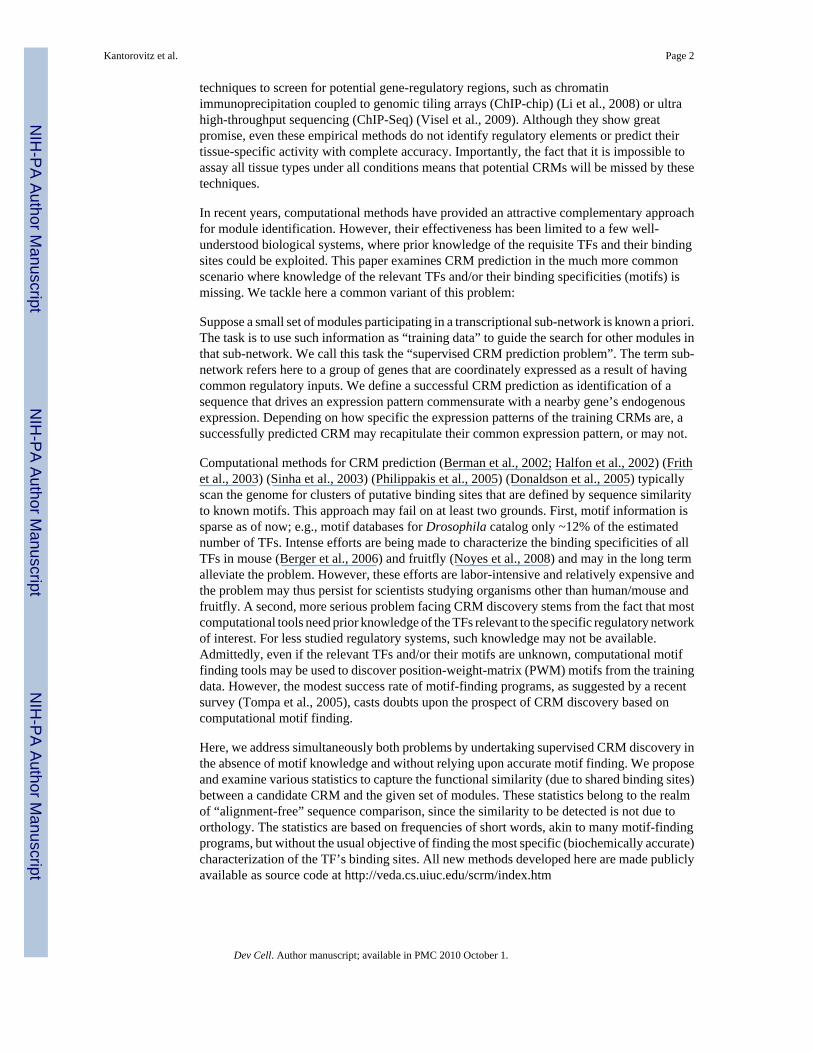
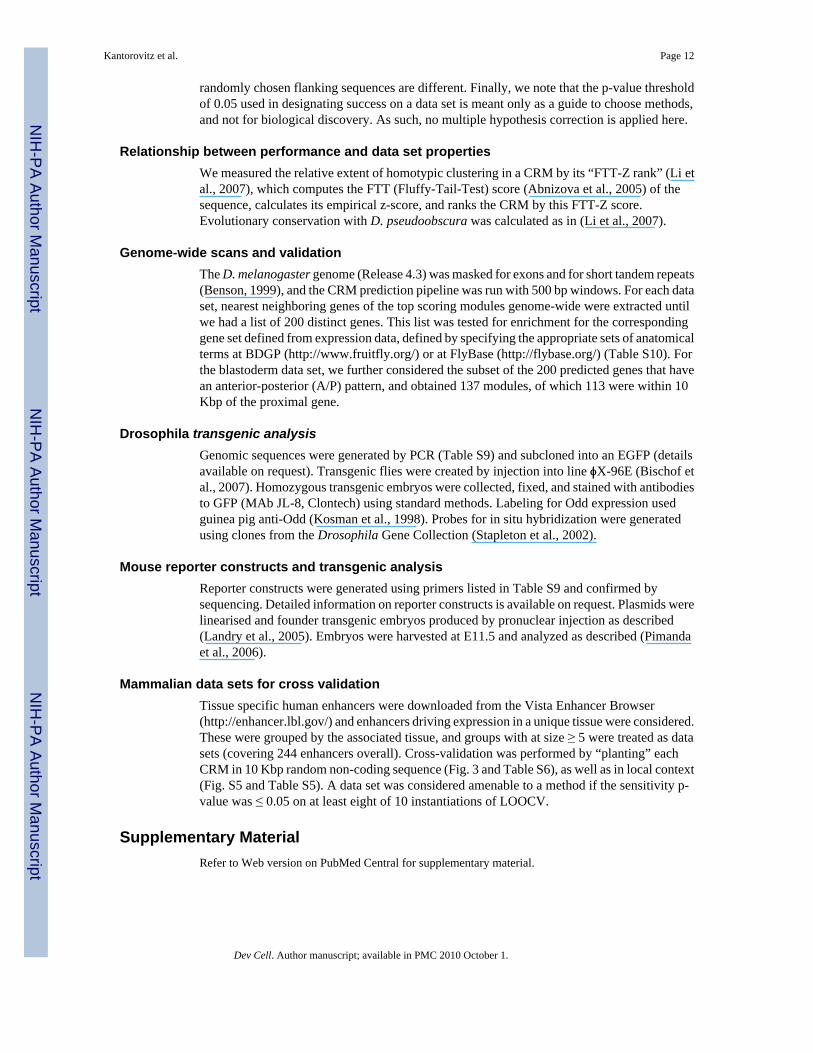
Comparison of different scoring schemes and characterization of data setsWe utilized a modified version of the CRM prediction benchmark developed in our previouswork (Ivan et al., 2008). The new benchmark consists of 31 data sets, each data set comprisinga collection of bona fide CRMs that mediate gene expression patterns with some level ofcommonality. We employed “leave-one-out cross-validation” (LOOCV) to assess the relativeperformance of our scoring schemes (see Methods). Fig. 1(A) summarizes the results of ourcross-validation tests, with asterisks indicating cases where the CRM-level sensitivity wasstatistically significant (p ≤ 0.05; see Supplementary Note S2). In such cases, we say that themethod is “successful” on the data set. We immediately note that the best motif-blind methods(HexMCD, HexDiff-rc, HexYMF-s200-rc) succeed on close to half of the data sets. In contrast,the method that makes use of a motif database (Stubb-MDB-rc) succeeds on fewer data sets.We also tested an alternative motif-based pipeline - that of using “Clover” (Frith et al., 2004)for motif selection and “ClusterBuster” (Frith et al., 2003) for scanning with selected motifs -and found success levels to be comparable to that of Stubb-MDB (Supplementary Note S3).Nucleotide-level sensitivity measurements show similar trends (Fig. S1). Repeating the crossvalidation exercise four times (see Methods), we examined which methods succeed on aspecific data set in all four LOOCV “instantiations” (Table S3). We find that 15 of the 31 datasets have at least one method (among the eight listed) for which this consistency requirementis met (Fig. 1D). We designate these as the “amenable” data sets, i.e., the CRMs in such a dataset have the extent and kind of sequence similarity that we need for supervised prediction. Wefind that for data sets neuroectoderm and blastoderm, all shown methods succeed consistently,suggesting that these two regulatory sub-networks are among the most easy ones for supervisedCRM prediction. A closer look at the top 200 words used by HexYMF for the blastoderm dataset reveals matches to six of canonical motifs for this network (Fig. S4). We also find examples,such as cardiac-mesoderm, eye.1 and mesectoderm, where only one of the methods is aconsistent performer (white cells in Fig. 1D), indicating that the common sequence features ofthe CRMs in each of these regulatory sub-networks may be harder to capture.
Kantorovitz et al. Page 4
Dev Cell. Author manuscript; available in PMC 2010 October 1.
NIH
-PA Author Manuscript
NIH
-PA Author Manuscript
NIH
-PA Author Manuscript

Fig. 1B and 1C show one-on-one comparison of the eight methods. We find the top fourmethods - HexMCD, PAC-rc, HexYMF-s200-rc and HexDiff-rc - to be competitive with oneanother. The emerging theme however is that CRMs in different data sets are best predictedby different scoring schemes. For instance, the “D2z-cond-weights” score is the only methodconsistently successful on the “somatic muscle” data set (Fig. 1D), even though in the finaltally over all data sets (Fig. 1B, 1C) it is the least successful score. It is natural to ask if acombination of two or three methods can yield better predictive performance on average. Wechose the methods HexYMF-s200-rc, HexDiff-rc and PAC-rc to build what we call a “fusion”method - which scores a candidate sequence by the product of the scores from these threemethods. Fig. 1B and 1C show that this naïve combination method is indeed better overall thanany individual method. It has consistent performance on 10 data sets (Fig. 1D), the most amongall methods. It is also the superior method in one-on-one comparisons (Fig. 1B).
Finally, we attempted to find characteristics of data sets that allow strong performance. Wefound a significant correlation between prediction accuracy on a data set and (i) the extent ofhomotypic clustering of short words in the training set (Fig. S2A, P=0.009), (ii) the GC contentof the training set (Fig. S2B, P=0.005), and (iii) the extent of nucleotide-level conservationwith orthologous sequence (Fig. S2C, P=0.007). We did not however see a significantcorrelation between the number of training CRMs and the performance on a data set.
Multi-species comparisons improve predictionsWe obtained the orthologs of the training CRMs from each of two other Drosophila species,and predicted CRMs in D. melanogaster sequence with each of these training sets. Scores fromthese runs were then averaged to give us a multi-species score profile. Cross-validation on all31 data sets showed that the multi-species version of HexMCD substantially outperformed itssingle species version (Fig. 1E; Table S3).
Role of the training setWe asked if the success of our supervised CRM prediction methods is due to an ability of ourscoring schemes to learn the characteristics of the specific regulatory sub-network, or an abilityto infer general sequence characteristics of CRMs. We constructed for each data set a “randomtraining set” consisting of REDfly CRMs from outside of that regulatory sub-network, andrepeated the above evaluation. Of the 16 data sets on which the “fusion” method performssignificantly well (Fig. 1A), nine data sets perform worse when using the random training set,meaning that the CRM predictions are specific to the particular regulatory sub-network. Onthe other hand, the performance on seven data sets, though significantly strong, is comparableto that with training sets comprising randomly selected CRMs, suggestive of a less specifictype of CRM prediction based on sequence characteristics of CRMs in general (Table 1).Interestingly, the data sets that give rise to specific prediction are typically smaller than thenon-specific ones (P < 0.02, Table 1) and their expression patterns, as measured by the numberof individual anatomy terms defining the pattern (Table S7), more specific (P < 0.002, Table1). We also assessed the value of the training set by executing an unsupervised CRM predictionmethod (“CSam”, from our previous work (Ivan et al., 2008)) on each of the 31 data sets. Themethod was successful on only one of the data sets (data not shown), indicating a majoradvantage conferred by the use of the training set, and also pointing out that our modifiedbenchmark is substantially “harder” than that of (Ivan et al., 2008). (See Supplementary NoteS4.)
Genome-wide prediction of Drosophila CRMsFor each of the 15 amenable data sets, taking all known modules as training data, we scannedthe non-coding genome of D. melanogaster for the highest scoring modules, using the “fusion”method as well as the best individual scoring scheme from the cross-validation results for that
Kantorovitz et al. Page 5
Dev Cell. Author manuscript; available in PMC 2010 October 1.
NIH
-PA Author Manuscript
NIH
-PA Author Manuscript
NIH
-PA Author Manuscript

data set. We then used gene expression databases (FlyBase, BDGP) to test the quality of thesegenome-wide predictions. First, we defined a set of genes (“expression gene set”) withexpression patterns commensurate with those of the CRMs in the data set (see Methods). Wenext took the modules predicted for that data set and extracted their nearest neighboring genes(“predicted gene set”). Finally, we performed hypergeometric tests of enrichment between theexpression gene set and the predicted gene set (Table 2). Of the 15 data sets, eight hadenrichment p-value ≤ 10-10, and 14 had p-value ≤ 0.01 either with fusion or the best individualscoring scheme. (Given that 15×2 tests were done, 13 are significant at p < 0.05 with Bonferronicorrection.) The strongest enrichments were observed for the data sets blastoderm, imaginaldisc, and wing. In a negative control experiment, we “predicted” random genes for each dataset and performed the same test for enrichment; the enrichment p-value was not significant onany data set (Table 2). Thus, intersecting the predictions with gene expression data providesstrong support for our genome-wide CRM predictions. Furthermore, taking this intersectiongives us a high confidence set of module predictions for each of the 15 data sets, which aremade available in an online interface with “Genome Browser” integration (SupplementaryNote S5). This interface also lists associations with motifs from existing databases, for eachdata set.
In vivo validation of predictions for the blastoderm data setThe blastoderm dataset performed strongly in the cross-validation exercises using each of thescoring methods and had the strongest gene expression pattern enrichment in the genome widesearch. We therefore focused our follow-up efforts on this high-performing dataset. Ourcompendium lists 113 modules as being related to the training CRMs in this data set (seeMethods and Table S2). 33 of these top modules belong to the training set itself, while anadditional 26 are known modules that were not included in the training set (Table S2). Theremaining 54 (= 113 - 33 - 26) modules are novel CRM predictions. (Also see SupplementaryNote S6.)
Although the expression pattern enrichment results and successful prediction of knownmodules not included in the training set suggest that a large fraction of our predictions arecorrect, only in vivo testing of the predicted elements can confirm that they have regulatoryfunction. We therefore chose five putative modules, located near the genes edl, srp, odd,SoxN, and cas, for in vivo validation using a GFP-based reporter construct in transgenicDrosophila embryos. (None of these was predicted by the motif-based “Ahab” program in(Schroeder et al., 2004). Remarkably, all five tested constructs showed reporter gene expressionin a pattern consistent with the expression of their predicted associated gene (Fig. 2).Interestingly, although the five modules were selected using the blastoderm data set as trainingdata, and all five associated genes are expressed during the blastoderm stage of development,only two of the identified CRMs, those for edl and srp, appear to regulate blastoderm-stagegene expression (Fig. 2A,B,G,H). Both of these also regulate expression at later stages indevelopment. In the case of edl, this later expression is a subset of the complete expressionpattern of the gene (Fig. 2C-F), consistent with the notion of modular gene regulation throughthe action of multiple CRMs for each gene (Arnone and Davidson, 1997). Expression drivenby the srp CRM more comprehensively covers the range of endogenous srp expression, inaddition to driving apparently ectopic reporter gene expression in the midgut of later stageembryos (Fig. 2I, 2J and data not shown). This may represent actual ectopic expression, butmay also simply be perdurance of GFP expression in tissues that developed from earlier srp-expressing progenitors. The SoxN and cas CRMs closely recapitulate subsets of the centralnervous system expression of their respective associated genes from mid-embryogenesis on(Fig. 2M-2T), while the odd CRM recapitulates native odd expression in a number of tissuesincluding mid-stage mesodermal progenitor cells and late-stage fat body (Fig. 2K, 2L and datanot shown). Ectopic reporter gene expression is observed in cardioblasts (data not shown). This
Kantorovitz et al. Page 6
Dev Cell. Author manuscript; available in PMC 2010 October 1.
NIH
-PA Author Manuscript
NIH
-PA Author Manuscript
NIH
-PA Author Manuscript

may again merely represent perdurance of the GFP reporter in a subset of mesodermal cells,or may indicate improper activity of the CRM in descendants of a common cell lineage (asubset of Odd-negative cardioblasts are sibling cells to Odd-positive pericardial cells, arisingfrom a common progenitor (Ward and Skeath, 2000)). Detailed experimental analysis will beneeded to distinguish between these possibilities.
Application to data sets of tissue-specific enhancers from mouseEncouraged by these strong validation results, we also sought to determine whether ourmethods would work effectively for prediction of mammalian CRMs. We constructed eightnew data sets, comprising a total of 244 CRMs that drive expression in specific tissues in mouse(Pennacchio et al., 2006). We performed leave-one-out cross validation as in the Drosophilaanalysis above, with each of the seven motif-blind methods. Seven of the eight data sets wereamenable to consistent prediction by at least one method, over 10 LOOCV instantiations(Methods, Fig. 3, Table S3); as observed previously, no one method proved universallysuperior. (Also see results on cross validation with native flanks, Fig. S5, Table S5.) Theaccuracy is especially noteworthy on the forebrain, hindbrain rhombencephalon, and neuraltube data sets, being at 75-85% at the CRM lavel, and 58-76% at the nucleotide level (Fig. 3,Table S6). Overall, roughly 60% of the full complement of enhancers tested were recoveredby supervised prediction in a cross-validation setting, making a strong case for thegeneralizability of the approach.
Application to early blood and cardiovascular development in human/mouseTo follow up on these results in a genome-wide manner, we turned to a data set of ten enhancersknown to function in the developing blood and vasculature (Supplementary Note S8). We usedthe two top-scoring methods from LOOCV, HexYMF-s200-rc (54% sensitivity) and PAC-rc(48% sensitivity), to predict CRMs in the human genome. For efficiency, the search was limitedto “evolutionarily conserved regions” (ECRs) (Loots and Ovcharenko, 2007) based on human-mouse conservation. The top 1000 CRM predictions (of each method) were then assessed forenrichment for a set of genes known to be differentially expressed in blood stem cells. PredictedCRMs with a neighboring gene in this set were counted, and were found to be highly statisticallysignificant when using either method (z-scores > 10 and > 6 respectively, see Fig. 3C.)
All ten training CRMs contain consensus binding sites for the Ets and GATA families oftranscription factors. We therefore tested the top 1000 CRM predictions for the presence ofGATA and Ets motifs (Fig. 3D). We found 234 of the top 1000 predictions from PAC-rc tohave the Ets motif; comparing this to a random expectation of 59, we see a four-fold enrichmentand a z-score of > 45. Similar enrichment for the GATA motif is observed (z > 13) in the PAC-rc predictions and for both motifs in the HexYMF-200-rc predictions (z > 7, Fig. 3D).
We constructed a high confidence CRM prediction set for each method by taking the 1000 toppredictions, requiring that a neighboring gene be in the blood stem-cell gene set, and specifyingthat either the Ets or GATA motif be present. This led to 75 distinct predicted CRMs based onHexYMF-200-rc and 114 based on PAC-rc (Table S4).
In vivo validation in mouseTo demonstrate that the above approach was indeed able to identify regulatory modules andpredict their in vivo biological activity, we generated lacZ reporter constructs for two predictedintronic elements for testing in transgenic mouse embryos. Neither of the two respective geneloci has previously been implicated in either blood or cardiovascular development. The firstgene (EBF3) encodes a little-known paralog of early B-cell factor EBF1, a helix-loop-helixtranscription factor important during early B-lymphocyte development (Busslinger et al.,2000). (The predicted CRM is ranked at 41 by HexYMF-s200-rc and 63 by PAC-rc.) The
Kantorovitz et al. Page 7
Dev Cell. Author manuscript; available in PMC 2010 October 1.
NIH
-PA Author Manuscript
NIH
-PA Author Manuscript
NIH
-PA Author Manuscript

second gene (C1ORF164) corresponds to an uncharacterized open reading frame onchromosome 1 predicted to encode a ring-finger-domain containing protein. (The predictedCRM is ranked 12 by HexYMF-s200-rc and 23 by PAC-rc)
Multiple transgenic founders were generated for each construct and day E11.5 embryos werecollected and stained for reporter gene activity. As exemplified by a representative Lyl1promoter transgenic embryo, the 10 elements used as training data all show tissue specificenhancer activity by driving expression in blood vessels, the heart, and developing blood cellsin the fetal liver (Fig. 4). The transgenic embryos generated with the EBF3 and C1ORF164candidate enhancers reproducibly showed transgene expression in two and three (respectively)of these three tissues thus demonstrating that the computational screen not only led to theidentification of bona fide transcriptional enhancers, but more importantly was able to predictthe tissue specific activity of these elements.
DISCUSSIONThe problem of supervised CRM prediction is easily motivated when we consider that theinteractions in a regulatory sub-network involve up to hundreds of genes (Davidson, 2006) anda relatively small set of TFs. Clearly, there is a significant layer of combinatorial regulation inbetween, implemented through cis-regulatory modules. We thus expect tens to hundreds ofmodules that share some degree of similarity in their binding site content, and we should beable to predict most of these given a representative subset. Such an initial set of modulestypically will be obtained through reporter gene assays, computational methods or high-throughput technologies such as ChIP-chip. Our algorithms will then leverage the initial set toprovide much greater coverage of the regulatory sub-network. We have demonstrated here thatour methods apply similarly to both the Drosophila and mouse genomes with high accuracy.
It is important to contrast our method with the “tissue-specific CRM prediction” approachesundertaken in (Chen and Blanchette, 2007; Hallikas et al., 2006; Pennacchio et al., 2007; Smithet al., 2007; Yu et al., 2007) for the human genome. All of these methods rely upon a largecollection of vertebrate TF motifs (from TRANSFAC (Matys et al., 2003) and/or JASPAR(Bryne et al., 2008)), which is their main point of difference from our approach. Moreover,their problem formulation and data assumptions are distinct from ours: their strategy hingeson large scale gene expression data across a large spectrum of tissues (Chen and Blanchette,2007; Pennacchio et al., 2007; Smith et al., 2007; Yu et al., 2007) or on knowledge of TFsmediating the specific transcriptional response (Hallikas et al., 2006). In many cases, suchinformation may not be available. We require instead the prior knowledge of some of the CRMsinvolved in a particular regulatory sub-network (which could be a tissue-specific sub-network).The “EDGI” program of (Sosinsky et al., 2007) has a similar objective to ours, i.e., CRMprediction without motif knowledge, relying instead on inter-species conservation andclustering of binding sites, but the only published tests of this method have been on the A/Ppatterning network in Drosophila, precluding statements about its broader applicability. Themost definitive test of any method is its ability to predict CRMs that function in vivo. Currentsuccess rates based on in vivo validation top out at approximately 80% in Drosophila and 70%in mouse (Table S8). Although continued validation using a larger number of predictions drawnfrom a broader selection of datasets is still required, the 100% true-positive rate we haveachieved so far in both fly and mouse is highly encouraging and at a minimum puts our methodon a par with the top existing approaches.
Recent advances in genome-scale empirical methods represent a promising new means forCRM discovery and will provide an important complement to, although not a replacement for,computational methods. For example, (Visel et al., 2009) have described a ChIP-seq basedstudy in which CRM sequences were enriched through chromatin immunoprecipitation of the
Kantorovitz et al. Page 8
Dev Cell. Author manuscript; available in PMC 2010 October 1.
NIH
-PA Author Manuscript
NIH
-PA Author Manuscript
NIH
-PA Author Manuscript

common enhancer binding protein p300 using RNA isolated from specific tissues. At present,such approaches require significant amounts of biological material, which represents aparticular problem when studying stem cell systems or early developmental programs.Employing a computational strategy not only circumvents the need for pure cell populationsbut also has the potential to provide information on cis-regulatory elements operating in allcell types. Moreover, while tissue-specific p300-directed ChIP-Seq can reveal that twomodules are active in the same tissue, it makes no predictions as to whether they may be relatedin terms of their control mechanisms or the specific sub-networks in which they participate.Importantly, our methods should be easily adaptable for assessing which empirically-identifiedCRMs are functioning through related mechanisms, and data from empirical methods willtherefore provide valuable input to the computational discovery approaches we have outlinedhere. Consequently, the approach developed here represents a widely applicable strategy fordeciphering transcriptional regulatory networks across a wide range of model systems.
We recommend use of the cross-validation step as a quick method to assess whether a set ofmodules is amenable to computational prediction, and if so, which scores are good at capturingthe essence of these regulatory sequences. If the user finds that his or her data set does notshow consistently significant performance with any of our methods, he or she should notproceed further with our pipeline. Although the absolute performance values in cross-validation do not pertain to genome-wide prediction accuracy, the empirical p-values do giveus an idea of whether the supervised prediction scheme is feasible for the data set.
Our CRM prediction pipeline encapsulates a broad variety of scoring schemes to capture theessential features of functionally related modules. We implemented two previously reportedscoring schemes (HexDiff and HexMCD), designed five novel motif-blind scoring schemes(HexYMF, PAC, and three variants of D2z), and examined statistical issues related to them(such as normalization for background composition). Our results (Fig. 1B, 1C) show that eachof the scoring schemes explored has its merits, and there is no universally superior method. Atthe same time, some general trends may guide us in our search for better scores. For instance,counting words on both strands improved performance of most scores (See Table S1 andSupplementary Note S7). Using a subset of 100-200 6-mers rather than all k-mers was anotherbeneficial choice which presumably increases the signal by removing words unrelated to thetrue motifs in the data. It is also clear that motif-blind approaches are competitive with or betterthan the motif-based Stubb-MDB (or Clover-ClusterBuster). In fact, the data sets on whichStubb-MDB is the “best performing” method (neuroectoderm, ventral ectoderm and ectoderm.2) are those on which almost all methods are successful. We believe this will in general be thecase for motif-based methods, although a comprehensive test of existing approaches (e.g.,(Philippakis et al., 2005)) has not yet been conducted.
We have used slightly different pipelines for genome-wide prediction in Drosophila and human- the fusion method and the best LOOCV method were deployed in the former, while the twobest LOOCV methods were used in the human scans. This is meant to show that the underlyingstatistical scoring schemes may be used in a variety of ways that can be decided be the user.Also, the vertebrate analysis filters the CRM predictions for presence of either the GATA orthe Ets motif, while the Drosophila analysis does not impose any motif filter. Again, thisdemonstrates the flexibility of including optional filters, which could potentially aid in refiningthe tissue specificity of predictions, based on the user’s prior knowledge of the biologicalsystem. Note that even in the vertebrate case the motif filters were used post-search to prioritizethe results; the search itself, like the Drosophila search, was conducted in a fully motif-blindfashion.
The strong correlations seen between performance and simple properties of data sets—size,GC content, etc. (Fig. S2A-C)—are suggestive of a possible source of “contamination” in the
Kantorovitz et al. Page 9
Dev Cell. Author manuscript; available in PMC 2010 October 1.
NIH
-PA Author Manuscript
NIH
-PA Author Manuscript
NIH
-PA Author Manuscript

training sets. Experimentally identified modules are not always the minimal sequence requiredfor the specific function, and may include non-regulatory sequences flanking the functionallyimportant core(s). Since CRMs in general demonstrate a higher degree of evolutionarysequence conservation, GC content and, in some cases, homotypic motif clustering than theirflanking regions (Li et al., 2007), data sets with relatively lower values of these variables maybe the ones with greater “contamination”, which may partially explain their relatively lowamenability to prediction.
One may define a successful prediction as either a module with expression consistent with thetraining set, or as a module capturing some aspect of its associated gene’s expression pattern.While we consider the latter condition to be necessary, the former condition depends largelyon how tightly defined the training set is, and on the nature of the TFs that act via the trainingCRMs. These TFs will frequently also regulate other biological processes, and may lead oursupervised prediction framework to report modules related to those processes. For instance, ofthe five tested Drosophila modules, only two (edl, srp) mediated the predicted blastoderm geneexpression, but three drove expression in the brain and midline of the central nervous system(edl, cas, SoxN); suggestively, many of the gap and pair-rule genes that regulate geneexpression in the blastoderm also act during nervous system development. It is also possiblethat a training set spans a very broad spectrum of expression patterns, making it hard to learnthe cis-regulatory commonalities from them. In such cases, the supervised prediction may learngeneric characteristics of CRMs and predict successfully, but without specificity, or may failcompletely. This may explain why smaller datasets with more tightly defined expressioncharacteristics led to more specific CRM detection in our LOOCV experiments.
METHODSNew scoring schemes
HexYMF—The z-score of a word is calculated by the YMF program (Sinha and Tompa,2000), based on its count in training CRMs, and mean and standard deviation calculated froma 3rd order Markov chain trained on background sequences. In our implementation, called“HexYMF-s200-rc”, W comprises the 200 top-ranking 6-mers by z-score (hence “-s200”), andn(w) denotes the count of w on both strands of a sequence.
Poisson Additive Conditional (PAC)—This score is defined as:
where F(λ,x) is the cumulative Poisson distribution function, λ(w) is the expected count of w in the test sequence, and n(w) is its observed count. W is the setof the most overrepresented words in training CRMs, as defined above. Note that 1-F(λ(w),n(w)-1) represents the p-value of the observed count of w. This score considers the words thatare most associated with the training set, and then examines how overrepresented each of thesewords is in the test sequence, relative to the assumed background. The implementation is called“PAC-rc” since word counts on both strands are considered in identifying the set W.
D2z score—The “D2 statistic” is the number of k-mer matches between two given sequences,and the “D2z score” introduced in our earlier work (Kantorovitz et al., 2007) computes thestatistical significance (z-score) of this number. Here, we cannot use the calculations from(Kantorovitz et al., 2007) (also used in (Ivan et al., 2008)) since the model under which the z-score was computed is inapplicable in the supervised prediction setting. In the null model of(Kantorovitz et al., 2007), both sequences are random sequences, while in our setting thetraining sequence S is known (treated as a fixed sequence) and only the test sequence T israndom (in the null model). We show how to analytically calculate the z-score for D2 under
Kantorovitz et al. Page 10
Dev Cell. Author manuscript; available in PMC 2010 October 1.
NIH
-PA Author Manuscript
NIH
-PA Author Manuscript
NIH
-PA Author Manuscript

this setting and call it conditional-D2z. In addition, we develop the following variations of theconditional D2z score. (All derivations are provided in Supplementary Methods.)
• Subsets of words: This restricts the summation to k-mers w ∈ W defined above.
• Weighted summation: Here, the D2 score is redefined to be a weighted dot product,with z(w) (see HexYMF) as weights, i.e., we re-define D2 as
and compute its z-score.
• Reverse complement counting: We extended the D2z score of (Kantorovitz et al.,2007) to count words on both strands while ignoring statistical dependencies betweenthe strands.
The three variants of D2z score that are used in our final pipeline include “D2z-cond-mo1-weights-rc”, “D2z-cond-weights”, and “D2z-cond-s100” (“-cond” for conditional z-score, “-mo1” for first order Markov background, “-weights” for weighted summation, “-rc” forcounting words on both strands, and “-s100” for subset of top 100 words).
Stubb-MDB—Given a set of experimentally characterized motifs (PWMs) and a set S oftraining CRMs, the first step determines the relevance of each motif M to S, as follows:
1. Calculate the “log likelihood ratio score” of M for each sequence s in S as:
where HMM(M, p) is a two-state zeroth orderHMM (Sinha et al., 2003), with motif transition probability p and backgroundtransition probability 1-p. The value pglobal in the denominator is the maximumlikelihood value of this parameter learned from genomic background, while pfree inthe numerator is a free parameter trained on sequence s.
2. Calculate the empirical p-value of LLR(s,M) based on scores of equal length windowsin genomic background.
3. Declare M to be relevant to S if more than 10% of sequences s in S have p-value(LLR(s,M)) ≤ 0.05.
The second step is to filter the relevant motifs for redundancies based on relative entropybetween two PWMs. The final step is to scan the test sequence for CRMs using Stubb (Sinhaet al., 2003), using the top 10 relevant, non-redundant motifs.
Evaluation of CRM prediction by cross-validationIf there are n CRMs in a data set, the cross-validation was done in n “folds”. In each fold, oneCRM is the test data and the remaining n-1 CRMs are training data. The former is embeddedin a 10 Kbp long non-coding genomic sequence with G/C content similar to the native flankof the CRM, thus creating the “test sequence”. For each data set, the average length L of knownmodules was computed and the task in each fold was to predict a module of length L in the testsequence. The highest scoring window by each scoring scheme was treated as the predictionof that scheme. We obtain L-length predictions in all n test sequences, which are then evaluatedbased on overlap with the embedded CRMs. We use two measures of accuracy: (i) “nucleotidelevel sensitivity”, determined by the base-pair overlap, and (ii) “CRM level sensitivity”,determined by the number of folds where the true and predicted CRMs overlap by 100 bp ormore. Due to this experimental design, the sensitivity values are equal to the respectiveprecision (PPV) values. We further compute empirical p-values of the sensitivity, as in (Ivanet al., 2008). Note that the test CRM is embedded in a randomly chosen non-coding region,instead of being kept in its native flank, in order to maximize the odds that there are no otherrelated modules in a test sequence. In different “instantiations” of cross-validation, the
Kantorovitz et al. Page 11
Dev Cell. Author manuscript; available in PMC 2010 October 1.
NIH
-PA Author Manuscript
NIH
-PA Author Manuscript
NIH
-PA Author Manuscript
randomly chosen flanking sequences are different. Finally, we note that the p-value thresholdof 0.05 used in designating success on a data set is meant only as a guide to choose methods,and not for biological discovery. As such, no multiple hypothesis correction is applied here.
Relationship between performance and data set propertiesWe measured the relative extent of homotypic clustering in a CRM by its “FTT-Z rank” (Li etal., 2007), which computes the FTT (Fluffy-Tail-Test) score (Abnizova et al., 2005) of thesequence, calculates its empirical z-score, and ranks the CRM by this FTT-Z score.Evolutionary conservation with D. pseudoobscura was calculated as in (Li et al., 2007).
Genome-wide scans and validationThe D. melanogaster genome (Release 4.3) was masked for exons and for short tandem repeats(Benson, 1999), and the CRM prediction pipeline was run with 500 bp windows. For each dataset, nearest neighboring genes of the top scoring modules genome-wide were extracted untilwe had a list of 200 distinct genes. This list was tested for enrichment for the correspondinggene set defined from expression data, defined by specifying the appropriate sets of anatomicalterms at BDGP (http://www.fruitfly.org/) or at FlyBase (http://flybase.org/) (Table S10). Forthe blastoderm data set, we further considered the subset of the 200 predicted genes that havean anterior-posterior (A/P) pattern, and obtained 137 modules, of which 113 were within 10Kbp of the proximal gene.
Drosophila transgenic analysisGenomic sequences were generated by PCR (Table S9) and subcloned into an EGFP (detailsavailable on request). Transgenic flies were created by injection into line ϕX-96E (Bischof etal., 2007). Homozygous transgenic embryos were collected, fixed, and stained with antibodiesto GFP (MAb JL-8, Clontech) using standard methods. Labeling for Odd expression usedguinea pig anti-Odd (Kosman et al., 1998). Probes for in situ hybridization were generatedusing clones from the Drosophila Gene Collection (Stapleton et al., 2002).
Mouse reporter constructs and transgenic analysisReporter constructs were generated using primers listed in Table S9 and confirmed bysequencing. Detailed information on reporter constructs is available on request. Plasmids werelinearised and founder transgenic embryos produced by pronuclear injection as described(Landry et al., 2005). Embryos were harvested at E11.5 and analyzed as described (Pimandaet al., 2006).
Mammalian data sets for cross validationTissue specific human enhancers were downloaded from the Vista Enhancer Browser(http://enhancer.lbl.gov/) and enhancers driving expression in a unique tissue were considered.These were grouped by the associated tissue, and groups with at size ≥ 5 were treated as datasets (covering 244 enhancers overall). Cross-validation was performed by “planting” eachCRM in 10 Kbp random non-coding sequence (Fig. 3 and Table S6), as well as in local context(Fig. S5 and Table S5). A data set was considered amenable to a method if the sensitivity p-value was ≤ 0.05 on at least eight of 10 instantiations of LOOCV.
Supplementary MaterialRefer to Web version on PubMed Central for supplementary material.
Kantorovitz et al. Page 12
Dev Cell. Author manuscript; available in PMC 2010 October 1.
NIH
-PA Author Manuscript
NIH
-PA Author Manuscript
NIH
-PA Author Manuscript

AcknowledgmentsThis research was funded in part by the NIH (grant #1R01GM085233-01, to SS and MSH), the Illinois SociogenomicsInitiative (to GER), and the Leukaemia Research Fund and Leukemia and Lymphoma Society (to BG). We thank JackLeatherbarrow for technical support, Jim Skeath for anti-Odd antiserum, and the Duke University Model SystemsGenomics for fly injections. We thank Ivan Ovcharenko for providing ECRs between human and mouse.
REFERENCESAbnizova I, te Boekhorst R, Walter K, Gilks WR. Some statistical properties of regulatory DNA
sequences, and their use in predicting regulatory regions in the Drosophila genome: the fluffy-tail test.BMC Bioinformatics 2005;6:109. [PubMed: 15857505]
Arnone MI, Davidson EH. The hardwiring of development: organization and function of genomicregulatory systems. Development 1997;124:1851–64. [PubMed: 9169833]
Benson G. Tandem repeats finder: a program to analyze DNA sequences. Nucleic Acids Res1999;27:573–80. [PubMed: 9862982]
Berger MF, Philippakis AA, Qureshi AM, He FS, Estep PW 3rd, Bulyk ML. Compact, universal DNAmicroarrays to comprehensively determine transcription-factor binding site specificities. NatBiotechnol 2006;24:1429–35. [PubMed: 16998473]
Berman BP, Nibu Y, Pfeiffer BD, Tomancak P, Celniker SE, Levine M, Rubin GM, Eisen MB. Exploitingtranscription factor binding site clustering to identify cis-regulatory modules involved in patternformation in the Drosophila genome. Proc Natl Acad Sci U S A 2002;99:757–62. [PubMed: 11805330]
Bischof J, Maeda RK, Hediger M, Karch F, Basler K. An optimized transgenesis system for Drosophilausing germ-line-specific phiC31 integrases. Proc Natl Acad Sci U S A 2007;104:3312–7. [PubMed:17360644]
Bryne JC, Valen E, Tang MH, Marstrand T, Winther O, da Piedade I, Krogh A, Lenhard B, Sandelin A.JASPAR, the open access database of transcription factor-binding profiles: new content and tools inthe 2008 update. Nucleic Acids Res 2008;36:D102–6. [PubMed: 18006571]
Busslinger M, Nutt SL, Rolink AG. Lineage commitment in lymphopoiesis. Curr Opin Immunol2000;12:151–8. [PubMed: 10712946]
Carroll, SB.; Grenier, JK.; Weatherbee, SD. Molecular Genetics and the Evolution of Animal Design.Blackwell Science; Massachusetts: 2001. From DNA to Diversity.
Chan BY, Kibler D. Using hexamers to predict cis-regulatory motifs in Drosophila. BMC Bioinformatics2005;6:262. [PubMed: 16253142]
Chen X, Blanchette M. Prediction of tissue-specific cis-regulatory modules using Bayesian networks andregression trees. BMC Bioinformatics 2007;8(Suppl 10):S2.
Davidson, EH. The Regulatory Genome: Gene Regulatory Networks in Development and Evolution.Academic Press; Burlington, MA: 2006.
Donaldson IJ, Chapman M, Gottgens B. TFBScluster: a resource for the characterization of transcriptionalregulatory networks. Bioinformatics 2005;21:3058–9. [PubMed: 15855248]
Frith MC, Fu Y, Yu L, Chen JF, Hansen U, Weng Z. Detection of functional DNA motifs via statisticalover-representation. Nucleic Acids Res 2004;32:1372–81. [PubMed: 14988425]
Frith MC, Li MC, Weng Z. Cluster-Buster: Finding dense clusters of motifs in DNA sequences. NucleicAcids Res 2003;31:3666–8. [PubMed: 12824389]
Grad YH, Roth FP, Halfon MS, Church GM. Prediction of similarly acting cis-regulatory modules bysubsequence profiling and comparative genomics in Drosophila melanogaster and D.pseudoobscura.Bioinformatics 2004;20:2738–50. [PubMed: 15145800]
Halfon MS, Gallo SM, Bergman CM. REDfly 2.0: an integrated database of cis-regulatory modules andtranscription factor binding sites in Drosophila. Nucleic Acids Res 2008;36:D594–8. [PubMed:18039705]
Halfon MS, Grad Y, Church GM, Michelson AM. Computation-based discovery of related transcriptionalregulatory modules and motifs using an experimentally validated combinatorial model. Genome Res2002;12:1019–28. [PubMed: 12097338]
Kantorovitz et al. Page 13
Dev Cell. Author manuscript; available in PMC 2010 October 1.
NIH
-PA Author Manuscript
NIH
-PA Author Manuscript
NIH
-PA Author Manuscript

Hallikas O, Palin K, Sinjushina N, Rautiainen R, Partanen J, Ukkonen E, Taipale J. Genome-wideprediction of mammalian enhancers based on analysis of transcription-factor binding affinity. Cell2006;124:47–59. [PubMed: 16413481]
Ivan A, Halfon MS, Sinha S. Computational discovery of cis-regulatory modules in Drosophila withoutprior knowledge of motifs. Genome Biol 2008;9:R22. [PubMed: 18226245]
Kantorovitz MR, Robinson GE, Sinha S. A statistical method for alignment-free comparison of regulatorysequences. Bioinformatics 2007;23:i249–55. [PubMed: 17646303]
Kosman D, Small S, Reinitz J. Rapid preparation of a panel of polyclonal antibodies to Drosophilasegmentation proteins. Dev Genes Evol 1998;208:290–4. [PubMed: 9683745]
Landry JR, Kinston S, Knezevic K, Donaldson IJ, Green AR, Gottgens B. Fli1, Elf1, and Ets1 regulatethe proximal promoter of the LMO2 gene in endothelial cells. Blood 2005;106:2680–7. [PubMed:15994290]
Li L, Zhu Q, He X, Sinha S, Halfon MS. Large-scale analysis of transcriptional cis-regulatory modulesreveals both common features and distinct subclasses. Genome Biol 2007;8:R101. [PubMed:17550599]
Li XY, MacArthur S, Bourgon R, Nix D, Pollard DA, Iyer VN, Hechmer A, Simirenko L, Stapleton M,Luengo Hendriks CL, et al. Transcription factors bind thousands of active and inactive regions in theDrosophila blastoderm. PLoS Biol 2008;6:e27. [PubMed: 18271625]
Loots G, Ovcharenko I. ECRbase: database of evolutionary conserved regions, promoters, andtranscription factor binding sites in vertebrate genomes. Bioinformatics 2007;23:122–4. [PubMed:17090579]
Matys V, Fricke E, Geffers R, Gossling E, Haubrock M, Hehl R, Hornischer K, Karas D, Kel AE, Kel-Margoulis OV, et al. TRANSFAC: transcriptional regulation, from patterns to profiles. Nucleic AcidsRes 2003;31:374–8. [PubMed: 12520026]
Miranda-Saavedra D, De S, Trotter MW, Teichmann SA, Gottgens B. BloodExpress: a database of geneexpression in mouse haematopoiesis. Nucleic Acids Res 2009;37:D873–9. [PubMed: 18987008]
Nazina AG, Papatsenko DA. Statistical extraction of Drosophila cis-regulatory modules using exhaustiveassessment of local word frequency. BMC Bioinformatics 2003;4:65. [PubMed: 14690551]
Noyes MB, Meng X, Wakabayashi A, Sinha S, Brodsky MH, Wolfe SA. A systematic characterizationof factors that regulate Drosophila segmentation via a bacterial one-hybrid system. Nucleic AcidsRes 2008;36:2547–60. [PubMed: 18332042]
Pennacchio LA, Ahituv N, Moses AM, Prabhakar S, Nobrega MA, Shoukry M, Minovitsky S, DubchakI, Holt A, Lewis KD, et al. In vivo enhancer analysis of human conserved non-coding sequences.Nature 2006;444:499–502. [PubMed: 17086198]
Pennacchio LA, Loots GG, Nobrega MA, Ovcharenko I. Predicting tissue-specific enhancers in thehuman genome. Genome Res 2007;17:201–11. [PubMed: 17210927]
Philippakis AA, He FS, Bulyk ML. Modulefinder: a tool for computational discovery of cis regulatorymodules. Pac Symp Biocomput 2005:519–30. [PubMed: 15759656]
Pimanda JE, Chan WY, Donaldson IJ, Bowen M, Green AR, Gottgens B. Endoglin expression in theendothelium is regulated by Fli-1, Erg, and Elf-1 acting on the promoter and a -8-kb enhancer. Blood2006;107:4737–45. [PubMed: 16484587]
Rajewsky N, Vergassola M, Gaul U, Siggia ED. Computational detection of genomic cis-regulatorymodules applied to body patterning in the early Drosophila embryo. BMC Bioinformatics 2002;3:30.[PubMed: 12398796]
Schroeder MD, Pearce M, Fak J, Fan H, Unnerstall U, Emberly E, Rajewsky N, Siggia ED, Gaul U.Transcriptional control in the segmentation gene network of Drosophila. PLoS Biol 2004;2:E271.[PubMed: 15340490]
Sinha S, Tompa M. A statistical method for finding transcription factor binding sites. Proc Int Conf IntellSyst Mol Biol 2000;8:344–54. [PubMed: 10977095]
Sinha S, van Nimwegen E, Siggia ED. A probabilistic method to detect regulatory modules.Bioinformatics 2003;19(Suppl 1):i292–301. [PubMed: 12855472]
Smith AD, Sumazin P, Zhang MQ. Tissue-specific regulatory elements in mammalian promoters. MolSyst Biol 2007;3:73. [PubMed: 17224917]
Kantorovitz et al. Page 14
Dev Cell. Author manuscript; available in PMC 2010 October 1.
NIH
-PA Author Manuscript
NIH
-PA Author Manuscript
NIH
-PA Author Manuscript

Sosinsky A, Honig B, Mann RS, Califano A. Discovering transcriptional regulatory regions in Drosophilaby a nonalignment method for phylogenetic footprinting. Proc Natl Acad Sci U S A 2007;104:6305–10. [PubMed: 17395715]
Stapleton M, Liao G, Brokstein P, Hong L, Carninci P, Shiraki T, Hayashizaki Y, Champe M, Pacleb J,Wan K, et al. The Drosophila gene collection: identification of putative full-length cDNAs for 70%of D. melanogaster genes. Genome Res 2002;12:1294–300. [PubMed: 12176937]
Tompa M, Li N, Bailey TL, Church GM, De Moor B, Eskin E, Favorov AV, Frith MC, Fu Y, Kent WJ,et al. Assessing computational tools for the discovery of transcription factor binding sites. NatBiotechnol 2005;23:137–44. [PubMed: 15637633]
Visel A, Blow MJ, Li Z, Zhang T, Akiyama JA, Holt A, Plajzer-Frick I, Shoukry M, Wright C, Chen F,et al. ChIP-seq accurately predicts tissue-specific activity of enhancers. Nature 2009;457:854–8.[PubMed: 19212405]
Ward EJ, Skeath JB. Characterization of a novel subset of cardiac cells and their progenitors in theDrosophila embryo. Development 2000;127:4959–69. [PubMed: 11044409]
Yu X, Lin J, Zack DJ, Qian J. Identification of tissue-specific cis-regulatory modules based on interactionsbetween transcription factors. BMC Bioinformatics 2007;8:437. [PubMed: 17996093]
Kantorovitz et al. Page 15
Dev Cell. Author manuscript; available in PMC 2010 October 1.
NIH
-PA Author Manuscript
NIH
-PA Author Manuscript
NIH
-PA Author Manuscript
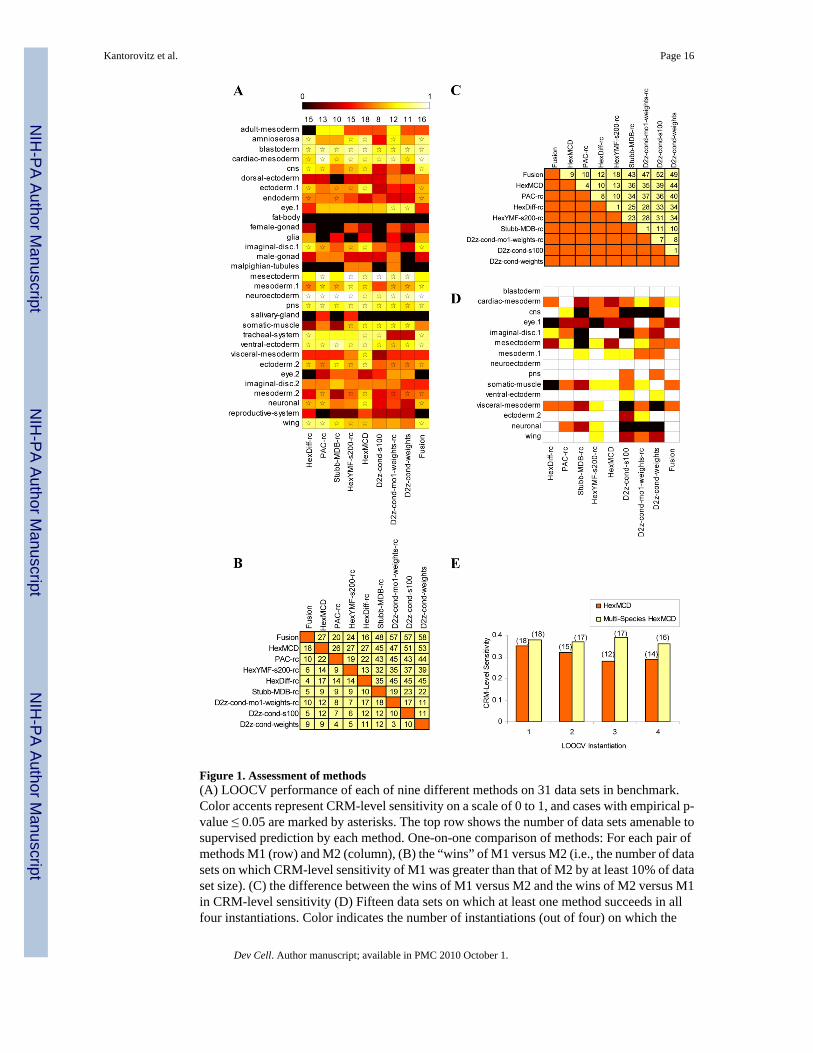
Figure 1. Assessment of methods(A) LOOCV performance of each of nine different methods on 31 data sets in benchmark.Color accents represent CRM-level sensitivity on a scale of 0 to 1, and cases with empirical p-value ≤ 0.05 are marked by asterisks. The top row shows the number of data sets amenable tosupervised prediction by each method. One-on-one comparison of methods: For each pair ofmethods M1 (row) and M2 (column), (B) the “wins” of M1 versus M2 (i.e., the number of datasets on which CRM-level sensitivity of M1 was greater than that of M2 by at least 10% of dataset size). (C) the difference between the wins of M1 versus M2 and the wins of M2 versus M1in CRM-level sensitivity (D) Fifteen data sets on which at least one method succeeds in allfour instantiations. Color indicates the number of instantiations (out of four) on which the
Kantorovitz et al. Page 16
Dev Cell. Author manuscript; available in PMC 2010 October 1.
NIH
-PA Author Manuscript
NIH
-PA Author Manuscript
NIH
-PA Author Manuscript

performance was significant (p ≤ 0.05): white=4, yellow=3, orange=2, brown=1, black=0. (E)Comparison of single species and multi-species versions of HexMCD. For each each LOOCVinstantiation, the average CRM-level sensitivity over all data sets (y-axis) and number ofamenable data sets (number above each bar) are compared between the two methods.
Kantorovitz et al. Page 17
Dev Cell. Author manuscript; available in PMC 2010 October 1.
NIH
-PA Author Manuscript
NIH
-PA Author Manuscript
NIH
-PA Author Manuscript

Figure 2. In vivo validation of Drosophila CRM predictionsEach predicted CRM was used to drive a GFP reporter gene in transgenic embryos. Expressionwas visualized using antibodies to GFP and compared to the endogenous expression of theputative associated gene as determined by whole mount in situ hybridization to mRNA (in thecase of odd, Odd antiserum). All embryos are shown with anterior to the left. (A) The edl CRMdrives expression in the anterior of blastoderm stage embryos consistent with endogenousedl expression (B). At embryonic stage 10, reporter gene expression (C) mimics edl geneexpression (D) at the ventral midline. By stage 11, reporter gene expression is no longer seenat the ventral midline despite continued endogenous gene expression at this site (arrowheadsin E and F); however, reporter gene expression is maintained in the developing brain (arrowsin E and F). The srp CRM reporter gene (G) is expressed similarly to srp mRNA (H) in theblastoderm as well as in stage 8 embryos in the developing posterior endoderm (I, J,arrowheads) and anterior endoderm (I, J, arrows). The odd CRM recapitulates odd geneexpression in mesodermal progenitors (K, magenta in L) but not in the ecotderm (L; anti-Oddis in green and is nuclear, GFP expression driven by the Odd CRM reporter is in magenta andprimarily cytoplasmic). Inset in L shows a close up of the mesodermal cluster marked by the
Kantorovitz et al. Page 18
Dev Cell. Author manuscript; available in PMC 2010 October 1.
NIH
-PA Author Manuscript
NIH
-PA Author Manuscript
NIH
-PA Author Manuscript

arrowhead. (M-P) The SoxN CRM drives reporter gene expression in a subset of theendogenous mRNA pattern in the central nervous system. At stage 9, reporter gene expressionis visible in the brain (M, arrow) but not the remainder of the central nervous system (M,arrowhead; compare with N). By stage 14, additional nervous system expression is apparent(O), consistent with endogenous SoxN (P). (Q-T) cas CRM reporter gene expression faithfullyreproduces cas expression in the late embryonic ventral nerve cord and brain. Nerve cordexpression of both the reporter gene and the endogenous mRNA is most prominent in a set oflateral cells in the thoracic segments (arrows in Q, R); additional reporter gene expression inmidline cells (Q, arrowhead) is likely perdurance from a slightly earlier stage of expression(data not shown). Brain expression of the reporter gene, like that of cas mRNA, is strongest ina group of medial cells (S, T, arrows), with weaker expression laterally (S, T, arrowheads).
Kantorovitz et al. Page 19
Dev Cell. Author manuscript; available in PMC 2010 October 1.
NIH
-PA Author Manuscript
NIH
-PA Author Manuscript
NIH
-PA Author Manuscript

Figure 3. In silico validation on mammalian enhancers(A) LOOCV performance of each of seven different motif-blind methods on 8 data sets inbenchmark. Format is identical to that of Fig. 1A. (B) Consistency of a method’s accuracy oneach data set, over ten instantiations of LOOCV. Colors and numbers indicate the number ofinstantiations on which the performance was significant (at p ≤ 0.05). (C) The set of nearestgenes for the top 1000 CRM predictions for early blood and cardiovascular development inhuman/mouse was intersected with a set of 7035 genes differentially expressed in blood stemcells in mouse (Miranda-Saavedra et al., 2009). The intersection size (“Predictions”) wassignificantly above chance expectation (“Z-score”; mean 204, standard deviation 13, estimatedby simulations). (D) Predicted CRMs were scanned for significant occurrence of Ets-relatedand GATA motifs from TRANSFAC, counts of motif-containing predictions are in Column3, and significance estimates of these counts, based on random sampling of CRMs, are inColumn 4.
Kantorovitz et al. Page 20
Dev Cell. Author manuscript; available in PMC 2010 October 1.
NIH
-PA Author Manuscript
NIH
-PA Author Manuscript
NIH
-PA Author Manuscript

Figure 4. Validation of predicted CRMs for in vivo activity in blood and cardiovascular tissuesusing transgenic mouse assaysLacZ reporter constructs were microinjected into mouse embryos and assayed by wholemountstaining of midgestation F0 embryos. Shown to the left is a transgenic embryo with the LYL1promoter construct showing transgene expression in heart (read arrowhead), fetal liver (purplearrowhead) and vessels (green arrowhead). The middle and right hand panels showrepresentative transgenic embryos with reporter constructs for the predicted CRMs in exon 3of C1ORF164 and exon 6 of EBF3 respectively. Arrowheads indicate staining in heart, fetalliver and vessels.
Kantorovitz et al. Page 21
Dev Cell. Author manuscript; available in PMC 2010 October 1.
NIH
-PA Author Manuscript
NIH
-PA Author Manuscript
NIH
-PA Author Manuscript

NIH
-PA Author Manuscript
NIH
-PA Author Manuscript
NIH
-PA Author Manuscript
Kantorovitz et al. Page 22Ta
ble
1
Cat
egor
izat
ion
of d
ata s
ets a
men
able
to th
e Fus
ion
met
hod
into
“spe
cific
” and
“non
-spe
cific
” (co
lum
n 4)
. “Sp
ecifi
c“ in
dica
tes t
hat n
ucle
otid
e-le
vel s
ensi
tivity
in L
OO
CV
test
s was
bet
ter (≥0
.05)
whe
n th
e pr
oper
trai
ning
set w
as u
sed
(col
umn
2) th
an w
hen
a ra
ndom
ized
trai
ning
set w
as u
sed
(col
umn
3). C
olum
ns5
and
6 lis
t the
size
of d
ata
sets
and
num
ber o
f ana
tom
y te
rms u
sed
in d
efin
ing
them
resp
ectiv
ely.
Val
ues f
or th
e sp
ecifi
c an
d no
n-sp
ecifi
c da
ta se
ts w
ere
com
pare
d us
ing
a on
e-ta
iled
Wilc
oxon
rank
-sum
test
. See
als
o Fi
g. S
3D
atas
et“r
eal”
trai
ning
set
“ran
dom
”tr
aini
ng se
tPerf
orm
ance
n(da
tase
t)n(
anat
omy
term
s)
blas
tode
rm0.
450.
23sp
ecifi
c77
1w
ing
0.34
0.29
spec
ific
337
endo
derm
0.22
0.15
spec
ific
1613
mes
oder
m.1
0.32
0.18
spec
ific
162
vent
ral_
ecto
derm
0.34
0.19
spec
ific
124
trach
ea1-
syst
em0.
320.
15sp
ecifi
c9
7ca
rdia
c-m
esod
erm
0.47
0.07
spec
ific
89
amni
oser
osa
0.30
0sp
ecifi
c7
3ne
uroe
ctod
erm
0.76
0.14
spec
ific
72
mea
n (s
td)
0.39
(0.1
6)0.
16(0
.08)
22.2
5(23
.63)
4.38
(2.9
2)N
euro
nal
0.23
0.25
non-
spec
ific
5431
ecto
derm
.20.
180.
20no
n-sp
ecifi
c51
16Im
agin
al-d
isc.
10.
250.
25no
n-sp
ecifi
c47
14M
esod
erm
.20.
200.
18no
n-sp
ecifi
c45
47ec
tode
rm.1
0.19
0.17
non-
spec
ific
374
Cns
0.33
0.32
non-
spec
ific
3421
Pns
0.3
0.3
non-
spec
ific
2415
mea
n (s
td)
0.24
(0.0
6)0.
24(0
.06)
41.7
1(10
.58)
20.1
2(13
.27)
P(sp
ecifi
c<no
n-sp
ecifi
c)<
0.01
3<
0.00
2
Dev Cell. Author manuscript; available in PMC 2010 October 1.

NIH
-PA Author Manuscript
NIH
-PA Author Manuscript
NIH
-PA Author Manuscript
Kantorovitz et al. Page 23Ta
ble
2
Gen
ome-
wid
e C
RM
pre
dict
ions
for t
he 1
5 am
enab
le d
ata
sets
, usi
ng th
e “F
usio
n” m
etho
d an
d th
e be
st in
divi
dual
met
hod
from
LO
OC
V te
sts.
The
Hyp
erge
omet
ric p
-val
ue o
f enr
ichm
ent (
P F,P
L,P R
) bet
wee
n th
e pr
edic
ted
CR
Ms f
or a
dat
a se
t and
the
corr
espo
ndin
g ex
pres
sion
-bas
ed g
ene
sets
are
show
n,al
ong
with
the s
ize o
f the
inte
rsec
tion
(KF,
KL,
KR
). C
olum
n m
= si
ze o
f exp
ress
ion
gene
set,
Col
umn
N =
tota
l num
ber o
f gen
es in
the e
xpre
ssio
n da
ta so
urce
.Th
e co
lum
n “R
ando
m”
is th
e re
sult
of a
neg
ativ
e co
ntro
l, w
here
CR
M p
redi
ctio
ns w
ere
repl
aced
by
rand
om lo
catio
ns
Dat
aset
mN
FUSI
ON
LOO
CVBe
st LO
OCV
Met
hod
Rand
omP F
K FP L
K LP R
K R
blas
tode
rm20
855
726.
7E-2
445
6.7E
-28
49H
exM
CD
0.48
8ca
rdia
c_m
esod
erm
248
5572
5.4E
-01
98.
9E-0
16
PAC
-rc
0.95
5cn
s84
655
728.
2E-0
757
1.6E
-11
68H
exD
iff-r
c0.
2734
eye.
176
1414
92.
9E-0
12
4.5E
-03
5D
2z-c
ond-
mo1
-wei
ghts
-rc
1.00
0im
agin
al_d
isc.
131
814
149
1.9E
-19
331.
9E-1
933
Hex
MC
D0.
833
mes
ecto
derm
9355
727.
4E-1
322
1.8E
-03
10D
2z-c
ond-
s100
0.86
2m
esod
erm
.176
855
721.
5E-0
239
1.3E
-03
47PA
C-r
c0.
7425
neur
oect
oder
m60
1414
91.
9E-1
213
1.1E
-08
10H
exY
MF-
s200
-rc
1.00
0pn
s97
5572
8.0E
-06
143.
8E-0
513
PAC
-rc
0.27
5so
mat
ic_m
uscl
e76
1414
99.
3E-0
911
2.9E
-01
2D
2z-c
ond-
wei
ghts
1.00
0ve
ntra
l_ec
tode
rm32
855
727.
0E-1
341
5.9E
-11
38PA
C-r
c0.
1316
visc
eral
_mes
oder
m13
455
728.
3E-0
515
5.1E
-06
17H
exM
CD
0.11
8ec
tode
rm.2
841
5572
3.8E
-12
691.
1E-1
066
Hex
MC
D0.
2634
neur
onal
6655
725.
4E-0
49
1.1E
-04
10H
exM
CD
0.91
1w
ing
3014
149
5.3E
-15
209.
9E-1
116
Hex
Diff
-rc
0.86
1
Dev Cell. Author manuscript; available in PMC 2010 October 1.