
Most organic molecules and functional groups are transparent ...
37
381 CHAPTER 7 ULTRAVIOLET SPECTROSCOPY M ost organic molecules and functional groups are transparent in the portions of the electro- magnetic spectrum that we call the ultraviolet (UV) and visible (VIS) regions—that is, the regions where wavelengths range from 190 nm to 800 nm. Consequently, absorption spec- troscopy is of limited utility in this range of wavelengths. However, in some cases we can derive use- ful information from these regions of the spectrum. That information, when combined with the detail provided by infrared and nuclear magnetic resonance (NMR) spectra, can lead to valuable structural proposals. 7.1 THE NATURE OF ELECTRONIC EXCITATIONS When continuous radiation passes through a transparent material, a portion of the radiation may be absorbed. If that occurs, the residual radiation, when it is passed through a prism, yields a spectrum with gaps in it, called an absorption spectrum. As a result of energy absorption, atoms or mole- cules pass from a state of low energy (the initial, or ground state) to a state of higher energy (the excited state). Figure 7.1 depicts this excitation process, which is quantized. The electromagnetic radiation that is absorbed has energy exactly equal to the energy difference between the excited and ground states. In the case of ultraviolet and visible spectroscopy, the transitions that result in the absorption of electromagnetic radiation in this region of the spectrum are transitions between electronic energy levels. As a molecule absorbs energy, an electron is promoted from an occupied orbital to an unoccupied orbital of greater potential energy. Generally, the most probable transition is from the highest occupied molecular orbital (HOMO) to the lowest unoccupied molecular orbital (LUMO). The energy differences between electronic levels in most molecules vary from 125 to 650 kJ/mole (kilojoules per mole). For most molecules, the lowest-energy occupied molecular orbitals are the s orbitals, which correspond to s bonds. The p orbitals lie at somewhat higher energy levels, and orbitals that hold unshared pairs, the nonbonding (n) orbitals, lie at even higher energies. The unoccupied, or antibonding orbitals (p * and s *), are the orbitals of highest energy. Figure 7.2a shows a typical progression of electronic energy levels. E(excited) ΔE = [E(excited) – E(ground)] = hυ E(ground) FIGURE 7.1 The excitation process.
-
Upload
khangminh22 -
Category
Documents
-
view
1 -
download
0
Transcript of Most organic molecules and functional groups are transparent ...
381
C H A P T E R 7
ULTRAVIOLET SPECTROSCOPY
Most organic molecules and functional groups are transparent in the portions of the electro-magnetic spectrum that we call the ultraviolet (UV) and visible (VIS) regions—that is, theregions where wavelengths range from 190 nm to 800 nm. Consequently, absorption spec-
troscopy is of limited utility in this range of wavelengths. However, in some cases we can derive use-ful information from these regions of the spectrum. That information, when combined with the detailprovided by infrared and nuclear magnetic resonance (NMR) spectra, can lead to valuable structuralproposals.
7.1 THE NATURE OF ELECTRONIC EXCITATIONS
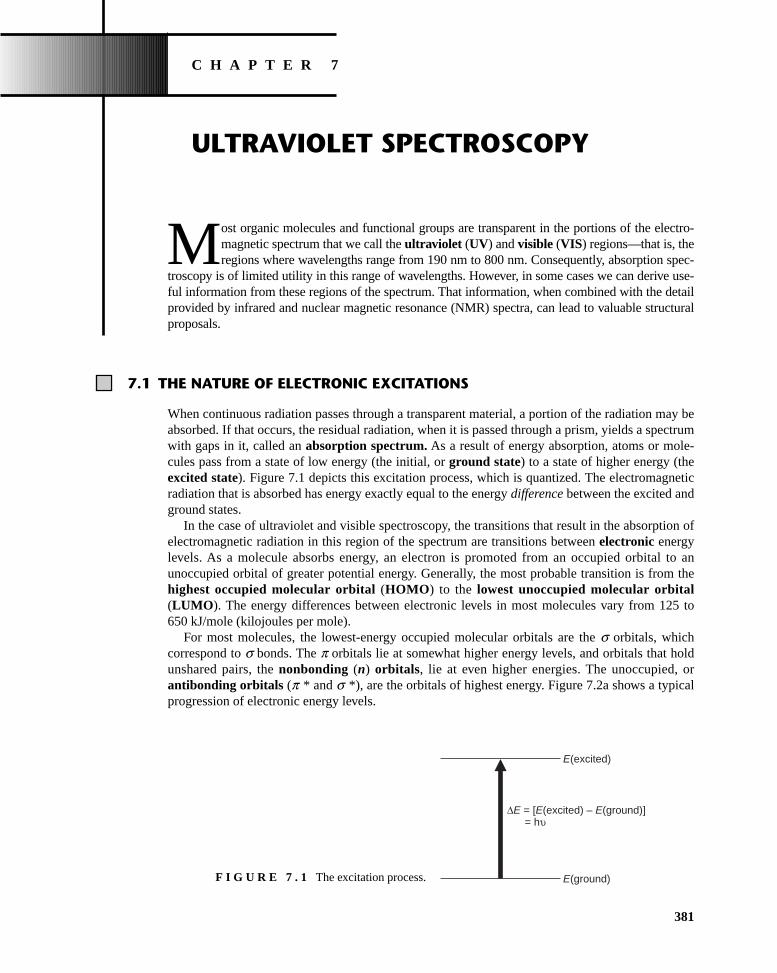
When continuous radiation passes through a transparent material, a portion of the radiation may beabsorbed. If that occurs, the residual radiation, when it is passed through a prism, yields a spectrumwith gaps in it, called an absorption spectrum. As a result of energy absorption, atoms or mole-cules pass from a state of low energy (the initial, or ground state) to a state of higher energy (theexcited state). Figure 7.1 depicts this excitation process, which is quantized. The electromagneticradiation that is absorbed has energy exactly equal to the energy difference between the excited andground states.
In the case of ultraviolet and visible spectroscopy, the transitions that result in the absorption ofelectromagnetic radiation in this region of the spectrum are transitions between electronic energylevels. As a molecule absorbs energy, an electron is promoted from an occupied orbital to anunoccupied orbital of greater potential energy. Generally, the most probable transition is from thehighest occupied molecular orbital (HOMO) to the lowest unoccupied molecular orbital(LUMO). The energy differences between electronic levels in most molecules vary from 125 to650 kJ/mole (kilojoules per mole).
For most molecules, the lowest-energy occupied molecular orbitals are the s orbitals, whichcorrespond to s bonds. The p orbitals lie at somewhat higher energy levels, and orbitals that holdunshared pairs, the nonbonding (n) orbitals, lie at even higher energies. The unoccupied, orantibonding orbitals (p * and s *), are the orbitals of highest energy. Figure 7.2a shows a typicalprogression of electronic energy levels.
E(excited)
ΔE = [E(excited) – E(ground)] = hυ
E(ground)F I G U R E 7 . 1 The excitation process.
14782_07_Ch7_p381-417.pp2.qxd 2/2/08 1:22 AM Page 381

382 Ultraviolet Spectroscopy
In all compounds other than alkanes, the electrons may undergo several possible transitions ofdifferent energies. Some of the most important transitions are
Increasing energy
Figure 7.2b illustrates these transitions. Electronic energy levels in aromatic molecules are morecomplicated than the ones depicted here. Section 7.14 will describe the electronic transitions ofaromatic compounds.
Clearly, the energy required to bring about transitions from the highest occupied energy level(HOMO) in the ground state to the lowest unoccupied energy level (LUMO) is less than the energyrequired to bring about a transition from a lower occupied energy level. Thus, in Figure 7.2b an n U p* transition would have a lower energy than a p U p* transition. For many purposes, thetransition of lowest energy is the most important.
Not all of the transitions that at first sight appear possible are observed. Certain restrictions,called selection rules, must be considered. One important selection rule states that transitionsthat involve a change in the spin quantum number of an electron during the transition are notallowed to take place; they are called “forbidden” transitions. Other selection rules deal withthe numbers of electrons that may be excited at one time, with symmetry properties of the mol-ecule and of the electronic states, and with other factors that need not be discussed here.Transitions that are formally forbidden by the selection rules are often not observed. However,theoretical treatments are rather approximate, and in certain cases forbidden transitions are ob-served, although the intensity of the absorption tends to be much lower than for transitions thatare allowed by the selection rules. The n U p* transition is the most common type of forbiddentransition.
————
———U
s —U s * In alkanes
s —U p* In carbonyl compounds
p —U p* In alkenes, carbonyl compounds, alkynes,azo compounds, and so on
n —U s* In oxygen, nitrogen, sulfur, and halogen compounds
n —U p* In carbonyl compounds
Unoccupiedlevels
Occupied levels
n σ
n
σ
π
Energy n
σ
π
(a) (b)
σ* σ*
π* π*
*
π π*
σ π*
σ σ*
n π*
F I G U R E 7 . 2 Electronic energy levels and transitions.
14782_07_Ch7_p381-417.pp2.qxd 2/2/08 1:22 AM Page 382

7.3 Principles of Absorption Spectroscopy 383
7.2 THE ORIGIN OF UV BAND STRUCTURE
For an atom that absorbs in the ultraviolet, the absorption spectrum sometimes consists of verysharp lines, as would be expected for a quantized process occurring between two discrete energylevels. For molecules, however, the UV absorption usually occurs over a wide range of wavelengthsbecause molecules (as opposed to atoms) normally have many excited modes of vibration and rota-tion at room temperature. In fact, the vibration of molecules cannot be completely “frozen out” evenat absolute zero. Consequently, a collection of molecules generally has its members in many statesof vibrational and rotational excitation. The energy levels for these states are quite closely spaced,corresponding to energy differences considerably smaller than those of electronic levels. Therotational and vibrational levels are thus “superimposed” on the electronic levels. A molecule maytherefore undergo electronic and vibrational–rotational excitation simultaneously, as shown inFigure 7.3.
Because there are so many possible transitions, each differing from the others by only a slightamount, each electronic transition consists of a vast number of lines spaced so closely that thespectrophotometer cannot resolve them. Rather, the instrument traces an “envelope” over the entirepattern. What is observed from these types of combined transitions is that the UV spectrum of amolecule usually consists of a broad band of absorption centered near the wavelength of the majortransition.
Vibrational levels
Vibrational levels
ELECTRONIC EXCITED STATE
ELECTRONIC GROUND STATE
v1
v2
v3
v1
v2
v3
v4
E1
E0
F I G U R E 7 . 3 Electronic transitions with vibrational transitions superimposed. (Rotational levels,which are very closely spaced within the vibrational levels, are omitted for clarity.)
7.3 PRINCIPLES OF ABSORPTION SPECTROSCOPY
The greater the number of molecules capable of absorbing light of a given wavelength, the greaterthe extent of light absorption. Furthermore, the more effectively a molecule absorbs light of a givenwavelength, the greater the extent of light absorption. From these guiding ideas, the followingempirical expression, known as the Beer–Lambert Law, may be formulated.
14782_07_Ch7_p381-417.pp2.qxd 2/2/08 1:22 AM Page 383

384 Ultraviolet Spectroscopy
A = log(I0/I ) = ecl for a given wavelength Equation 7.1
A = absorbance
I0 = intensity of light incident upon sample cell
I = intensity of light leaving sample cell
c = molar concentration of solute
l = length of sample cell (cm)
e = molar absorptivity
The term log (I0/I ) is also known as the absorbance (or the optical density in older literature) and maybe represented by A. The molar absorptivity (formerly known as the molar extinction coefficient) isa property of the molecule undergoing an electronic transition and is not a function of the variableparameters involved in preparing a solution. The size of the absorbing system and the probability thatthe electronic transition will take place control the absorptivity, which ranges from 0 to 106. Valuesabove 104 are termed high-intensity absorptions, while values below 103 are low-intensity absorp-tions. Forbidden transitions (see Section 7.1) have absorptivities in the range from 0 to 1000.
The Beer–Lambert Law is rigorously obeyed when a single species gives rise to the observedabsorption. The law may not be obeyed, however, when different forms of the absorbing moleculeare in equilibrium, when solute and solvent form complexes through some sort of association, whenthermal equilibrium exists between the ground electronic state and a low-lying excited state, orwhen fluorescent compounds or compounds changed by irradiation are present.
7.4 INSTRUMENTATION
The typical ultraviolet–visible spectrophotometer consists of a light source, a monochromator,and a detector. The light source is usually a deuterium lamp, which emits electromagnetic radiationin the ultraviolet region of the spectrum. A second light source, a tungsten lamp, is used for wave-lengths in the visible region of the spectrum. The monochromator is a diffraction grating; its role isto spread the beam of light into its component wavelengths. A system of slits focuses the desiredwavelength on the sample cell. The light that passes through the sample cell reaches the detector,which records the intensity of the transmitted light I . The detector is generally a photomultipliertube, although in modern instruments photodiodes are also used. In a typical double-beam instru-ment, the light emanating from the light source is split into two beams, the sample beam and thereference beam. When there is no sample cell in the reference beam, the detected light is taken tobe equal to the intensity of light entering the sample I0.
The sample cell must be constructed of a material that is transparent to the electromagnetic radi-ation being used in the experiment. For spectra in the visible range of the spectrum, cells composedof glass or plastic are generally suitable. For measurements in the ultraviolet region of the spectrum,however, glass and plastic cannot be used because they absorb ultraviolet radiation. Instead, cellsmade of quartz must be used since quartz does not absorb radiation in this region.
The instrument design just described is quite suitable for measurement at only one wavelength.If a complete spectrum is desired, this type of instrument has some deficiencies. A mechanicalsystem is required to rotate the monochromator and provide a scan of all desired wavelengths. Thistype of system operates slowly, and therefore considerable time is required to record a spectrum.
A modern improvement on the traditional spectrophotometer is the diode-array spectro-photometer. A diode array consists of a series of photodiode detectors positioned side by side on asilicon crystal. Each diode is designed to record a narrow band of the spectrum. The diodes are con-nected so that the entire spectrum is recorded at once. This type of detector has no moving parts and
14782_07_Ch7_p381-417.pp2.qxd 2/2/08 1:22 AM Page 384

can record spectra very quickly. Furthermore, its output can be passed to a computer, which canprocess the information and provide a variety of useful output formats. Since the number of photodi-odes is limited, the speed and convenience described here are obtained at some small cost in resolu-tion. For many applications, however, the advantages of this type of instrument outweigh the loss ofresolution.
7.5 Presentation of Spectra 385
7.5 PRESENTATION OF SPECTRA
The ultraviolet–visible spectrum is generally recorded as a plot of absorbance versus wavelength. Itis customary to then replot the data with either e or log e plotted on the ordinate and wavelengthplotted on the abscissa. Figure 7.4, the spectrum of benzoic acid, is typical of the manner in whichspectra are displayed. However, very few electronic spectra are reproduced in the scientific litera-ture; most are described by indications of the wavelength maxima and absorptivities of the principalabsorption peaks. For benzoic acid, a typical description might be
lmax = 230 nm log e = 4.2
272 3.1
282 2.9
Figure 7.4 is the actual spectrum that corresponds to these data.
F I G U R E 7 . 4 Ultraviolet spectrum of benzoic acid in cyclohexane. (From Friedel, R. A., and M. Orchin,Ultraviolet Spectra of Aromatic Compounds, John Wiley and Sons, New York, 1951. Reprinted by permission.)
14782_07_Ch7_p381-417.pp2.qxd 2/2/08 1:22 AM Page 385

386 Ultraviolet Spectroscopy
7.6 SOLVENTS
The choice of the solvent to be used in ultraviolet spectroscopy is quite important. The first criterionfor a good solvent is that it should not absorb ultraviolet radiation in the same region as the sub-stance whose spectrum is being determined. Usually solvents that do not contain conjugated sys-tems are most suitable for this purpose, although they vary regarding the shortest wavelength atwhich they remain transparent to ultraviolet radiation. Table 7.1 lists some common ultravioletspectroscopy solvents and their cutoff points or minimum regions of transparency.
Of the solvents listed in Table 7.1, water, 95% ethanol, and hexane are most commonly used.Each is transparent in the regions of the ultraviolet spectrum in which interesting absorption peaksfrom sample molecules are likely to occur.
A second criterion for a good solvent is its effect on the fine structure of an absorption band. Figure 7.5 illustrates the effects of polar and nonpolar solvents on an absorption band. A non-polar solvent does not hydrogen bond with the solute, and the spectrum of the solute closelyapproximates the spectrum that would be produced in the gaseous state, in which fine structureis often observed. In a polar solvent, the hydrogen bonding forms a solute–solvent complex, andthe fine structure may disappear.
TA B L E 7 . 1SOLVENT CUTOFFS
Acetonitrile 190 nm n-Hexane 201 nm
Chloroform 240 Methanol 205
Cyclohexane 195 Isooctane 195
1,4-Dioxane 215 Water 190
95% Ethanol 205 Trimethyl phosphate 210
F I G U R E 7 . 5 Ultraviolet spectra of phenol in ethanol and in isooctane. (From Coggeshall, N. D., andE. M. Lang, Journal of the American Chemical Society, 70 (1948): 3288. Reprinted by permission.)
14782_07_Ch7_p381-417.pp2.qxd 2/2/08 1:22 AM Page 386

A third criterion for a good solvent is its ability to influence the wavelength of ultraviolet lightthat will be absorbed via stabilization of either the ground or the excited state. Polar solvents do notform hydrogen bonds as readily with the excited states of polar molecules as with their groundstates, and these polar solvents increase the energies of electronic transitions in the molecules. Polarsolvents shift transitions of the nU p * type to shorter wavelengths. On the other hand, in somecases the excited states may form stronger hydrogen bonds than the corresponding ground states.In such a case, a polar solvent shifts an absorption to longer wavelength since the energy of theelectronic transition is decreased. Polar solvents shift transitions of the p U p * type to longerwavelengths. Table 7.2 illustrates typical effects of a series of solvents on an electronic transition.
7.7 What is a Chromophore? 387
7.7 WHAT IS A CHROMOPHORE?
Although the absorption of ultraviolet radiation results from the excitation of electrons from groundto excited states, the nuclei that the electrons hold together in bonds play an important role in deter-mining which wavelengths of radiation are absorbed. The nuclei determine the strength with whichthe electrons are bound and thus influence the energy spacing between ground and excited states.Hence, the characteristic energy of a transition and the wavelength of radiation absorbed are proper-ties of a group of atoms rather than of electrons themselves. The group of atoms producing such anabsorption is called a chromophore. As structural changes occur in a chromophore, the exact energyand intensity of the absorption are expected to change accordingly. Very often, it is extremely difficultto predict from theory how the absorption will change as the structure of the chromophore ismodified, and it is necessary to apply empirical working guides to predict such relationships.
Alkanes. For molecules, such as alkanes, that contain nothing but single bonds and lack atomswith unshared electron pairs, the only electronic transitions possible are of the s U s * type.These transitions are of such a high energy that they absorb ultraviolet energy at very short wave-lengths—shorter than the wavelengths that are experimentally accessible using typical spectropho-tometers. Figure 7.6 illustrates this type of transition. The excitation of the s-bonding electron tothe s *-antibonding orbital is depicted at the right.
Alcohols, Ethers, Amines, and Sulfur Compounds. In saturated molecules that contain atoms bear-ing nonbonding pairs of electrons, transitions of the nU s * type become important. They are also
TA B L E 7 . 2SOLVENT SHIFTS ON THE nU p * TRANSITION OF ACETONE
Solvent H2O CH3OH C2H5OH CHCl3 C6H14
lmax (nm) 264.5 270 272 277 279
σ*
σ
C
CC
C
C C
σ σ*
F I G U R E 7 . 6 s U s * transition.
14782_07_Ch7_p381-417.pp2.qxd 2/2/08 1:22 AM Page 387

388 Ultraviolet Spectroscopy
rather high-energy transitions, but they do absorb radiation that lies within an experimentally accessiblerange. Alcohols and amines absorb in the range from 175 to 200 nm, while organic thiols and sulfidesabsorb between 200 and 220 nm. Most of the absorptions are below the cutoff points for the commonsolvents, so they are not observed in solution spectra. Figure 7.7 illustrates an nU s* transition for anamine. The excitation of the nonbonding electron to the antibonding orbital is shown at the right.
Alkenes and Alkynes. With unsaturated molecules, p U p* transitions become possible. Thesetransitions are of rather high energy as well, but their positions are sensitive to the presence of sub-stitution, as will be clear later. Alkenes absorb around 175 nm, and alkynes absorb around 170 nm.Figure 7.8 shows this type of transition.
Carbonyl Compounds. Unsaturated molecules that contain atoms such as oxygen or nitrogen mayalso undergo nU p * transitions. These are perhaps the most interesting and most studied transi-tions, particularly among carbonyl compounds. These transitions are also rather sensitive to sub-stitution on the chromophoric structure. The typical carbonyl compound undergoes an n U p *transition around 280 to 290 nm (e = 15). Most n U p * transitions are forbidden and hence areof low intensity. Carbonyl compounds also have a pU p * transition at about 188 nm (e = 900).Figure 7.9 shows the nU p * and pU p * transitions of the carbonyl group.1
C N
C N
σCN*
n (sp3)
σCN
C N
n σ*
C N
F I G U R E 7 . 7 nU s* transition.
CC
CC
CC
π*
π
π π*
F I G U R E 7 . 8 p U p* transition.
1 Contrary to what you might expect from simple theory, the oxygen atom of the carbonyl group is not sp2 hybridized.Spectroscopists have shown that although the carbon atom is sp2 hybridized, the hybridization of the oxygen atom moreclosely approximates sp.
14782_07_Ch7_p381-417.pp2.qxd 2/2/08 1:22 AM Page 388

Table 7.3 lists typical absorptions of simple isolated chromophores. You may notice that thesesimple chromophores nearly all absorb at approximately the same wavelength (160 to 210 nm).
The attachment of substituent groups in place of hydrogen on a basic chromophore structurechanges the position and intensity of an absorption band of the chromophore. The substituentgroups may not give rise to the absorption of the ultraviolet radiation themselves, but their presencemodifies the absorption of the principal chromophore. Substituents that increase the intensity of theabsorption, and possibly the wavelength, are called auxochromes. Typical auxochromes includemethyl, hydroxyl, alkoxy, halogen, and amino groups.
Other substituents may have any of four kinds of effects on the absorption:
1. Bathochromic shift (red shift)—a shift to lower energy or longer wavelength.
2. Hypsochromic shift (blue shift)—a shift to higher energy or shorter wavelength.
3. Hyperchromic effect—an increase in intensity.
4. Hypochromic effect—a decrease in intensity.
7.7 What is a Chromophore? 389
C Oπ*
n (py)
C O CO
C O
C O
OC π
C O
C O
σCO (sp2–sp)
n (sp)
C O
π π*
n π*σ*
F I G U R E 7 . 9 Electronic transitions of the carbonyl group.
14782_07_Ch7_p381-417.pp2.qxd 2/2/08 1:22 AM Page 389

390 Ultraviolet Spectroscopy
7.8 THE EFFECT OF CONJUGATION
One of the best ways to bring about a bathochromic shift is to increase the extent of conjugation ina double-bonded system. In the presence of conjugated double bonds, the electronic energy levelsof a chromophore move closer together. As a result, the energy required to produce a transition froman occupied electronic energy level to an unoccupied level decreases, and the wavelength of thelight absorbed becomes longer. Figure 7.10 illustrates the bathochromic shift that is observed in aseries of conjugated polyenes as the length of the conjugated chain is increased.
Conjugation of two chromophores not only results in a bathochromic shift but increases theintensity of the absorption. These two effects are of prime importance in the use and interpretationof electronic spectra of organic molecules because conjugation shifts the selective light absorptionof isolated chromophores from a region of the spectrum that is not readily accessible to a region that
TA B L E 7 . 3TYPICAL ABSORPTIONS OF SIMPLE ISOLATED CHROMOPHORES
Class Transition lmax (nm) log e Class Transition lmax (nm) log e
RIOH nU s * 180 2.5 RINO2 nU p * 271 <1.0
RIOIR nU s * 180 3.5 RICHO pU p * 190 2.0
RINH2 nU s * 190 3.5 nU p * 290 1.0
RISH nU s * 210 3.0 R2CO pU p * 180 3.0
R2CJCR2 pU p * 175 3.0 nU p * 280 1.5
RICKCIR pU p * 170 3.0 RCOOH nU p * 205 1.5
RICKN nU p * 160 <1.0 RCOOR� nU p * 205 1.5
RINJNIR nU p * 340 <1.0 RCONH2 nU p * 210 1.5
F I G U R E 7 . 1 0 CH3I(CHJCH)nICH3 ultraviolet spectra of dimethylpolyenes. (a) n = 3; (b) n = 4;(c) n = 5. (From Nayler, P., and M. C. Whiting, Journal of the Chemical Society (1955): 3042.)
14782_07_Ch7_p381-417.pp2.qxd 2/2/08 1:22 AM Page 390

7.9 THE EFFECT OF CONJUGATION ON ALKENES
The bathochromic shift that results from an increase in the length of a conjugated system implies thatan increase in conjugation decreases the energy required for electronic excitation. This is true and canbe explained most easily by the use of molecular orbital theory. According to molecular orbital (MO)theory, the atomic p orbitals on each of the carbon atoms combine to make p molecular orbitals. Forinstance, in the case of ethylene (ethene), we have two atomic p orbitals, f1 and f2. From these twop orbitals we form two p molecular orbitals, y1 and y2*, by taking linear combinations. The bondingorbital y1 results from the addition of the wave functions of the two p orbitals, and the antibondingorbital y2* results from the subtraction of these two wave functions. The new bonding orbital, amolecular orbital, has an energy lower than that of either of the original p orbitals; likewise, theantibonding orbital has an elevated energy. Figure 7.11 illustrates this diagrammatically.
Notice that two atomic orbitals were combined to build the molecular orbitals, and as a result,two molecular orbitals were formed. There were also two electrons, one in each of the atomicp orbitals. As a result of combination, the new p system contains two electrons. Because we fill thelower-energy orbitals first, these electrons end up in y1, the bonding orbital, and they constitute anew p bond. Electronic transition in this system is a pU p * transition from y1 to y2*.
Now, moving from this simple two-orbital case, consider 1,3-butadiene, which has four atomicp orbitals that form its p system of two conjugated double bonds. Since we had four atomic orbitalswith which to build, four molecular orbitals result. Figure 7.12 represents the orbitals of ethylene onthe same energy scale as the new orbitals for the sake of comparison.
Notice that the transition of lowest energy in 1,3-butadiene, y2U y3*, is a p U p* transition andthat it has a lower energy than the corresponding transition in ethylene, y1U y2*. This result is gen-eral. As we increase the number of p orbitals making up the conjugated system, the transition from thehighest occupied molecular orbital (HOMO) to the lowest unoccupied molecular orbital (LUMO) has
is easily studied with commercially available spectrophotometers. The exact position and intensityof the absorption band of the conjugated system can be correlated with the extent of conjugation inthe system. Table 7.4 illustrates the effect of conjugation on some typical electronic transitions.
TA B L E 7 . 4EFFECT OF CONJUGATION ON ELECTRONIC TRANSITIONS
lmax (nm) e
Alkenes
Ethylene 175 15,0001,3-Butadiene 217 21,0001,3,5-Hexatriene 258 35,000b-Carotene (11 double bonds) 465 125,000
Ketones
AcetonepU p * 189 900nU p * 280 12
3-Buten-2-onepU p * 213 7,100nU p * 320 27
7.9 The Effect of Conjugation on Alkenes 391
14782_07_Ch7_p381-417.pp2.qxd 2/2/08 1:22 AM Page 391

C
C C
Antibonding orbital
(�2* = φ1 ± φ2)
CAtomic orbital
φ2
C C(�1 = φ1 + φ2)
Bondingorbital
φ2φ1 π π*
�2*
�1
Atomic orbitalφ1
F I G U R E 7 . 1 1 Formation of the molecular orbitals for ethylene.
CC
CC CC
CC
CCC C
CCCC
CCCC
�2*
2p orbitals
�1
�2
�1
�3*
1,3-butadieneethylene
CH2 CH2––
4p orbitals
CH2 CH–CH CH2–– ––
π π* π π*
�4*
F I G U R E 7 . 1 2 A comparison of the molecular orbital energy levels and the energy of the pU p *transitions in ethylene and 1,3-butadiene.
392
14782_07_Ch7_p381-417.pp2.qxd 2/2/08 1:22 AM Page 392

7.9 The Effect of Conjugation on Alkenes 393
progressively lower energy. The energy gap dividing the bonding and antibonding orbitals becomesprogressively smaller with increasing conjugation. Figure 7.13 plots the molecular orbital energy levelsof several conjugated polyenes of increasing chain length on a common energy scale. Arrows indicatethe HOMO–LUMO transitions. The increased conjugation shifts the observed wavelength of theabsorption to higher values.
In a qualitatively similar fashion, many auxochromes exert their bathochromic shifts by meansof an extension of the length of the conjugated system. The strongest auxochromes invariablypossess a pair of unshared electrons on the atom attached to the double-bond system. Resonanceinteraction of this lone pair with the double bond(s) increases the length of the conjugated system.
As a result of this interaction, as just shown, the nonbonded electrons become part of the p system of molecular orbitals, increasing its length by one extra orbital. Figure 7.14 depictsthis interaction for ethylene and an unspecified atom, B, with an unshared electron pair.However, any of the typical auxochromic groups, IOH, IOR, IX, or INH2, could have beenillustrated specifically.
In the new system, the transition from the highest occupied orbital y2 to the antibonding orbitaly3* always has lower energy than the p U p* transition would have in the system without theinteraction. Although MO theory can explain this general result, it is beyond the scope of thisbook.
Ethylene Butadiene Hexatriene Octatetraene
ENERGY
F I G U R E 7 . 1 3 A comparison of thepU p * energy gap in a series of polyenesof increasing chain length.
•• ••
C C B•• ••C C B+–
14782_07_Ch7_p381-417.pp2.qxd 2/2/08 1:23 AM Page 393

394 Ultraviolet Spectroscopy
In similar fashion, methyl groups also produce a bathochromic shift. However, as methyl groupsdo not have unshared electrons, the interaction is thought to result from overlap of the CIH bond-ing orbitals with the p system as follows:
This type of interaction is often called hyperconjugation. Its net effect is an extension of the p system.
H
H
C C
C
H
H
H
H
7.10 THE WOODWARD–FIESER RULES FOR DIENES
In butadiene, two possible p U p * transitions can occur: y2 U y3* and y2 U y4*. We have al-ready discussed the easily observable y2U y3* transition (see Fig. 7.12). The y2U y4* transitionis not often observed, for two reasons. First, it lies near 175 nm for butadiene; second, it is a forbid-den transition for the s-trans conformation of double bonds in butadiene.
175 nm (forbidden)
230 nm (allowed)
175 nm (allowed)
271 nm (allowed)
s-transconformation
s-cisconformation
4∗ψ 3∗ψ 2ψ 1ψ
4∗ψ 3∗ψ 2ψ 1ψ
π
�1
π*�2
�3*
C––C––
–
–
B··
B··
C––C
n
Nonbondingelectrons on B
Molecular orbitalsof resonance system
Ethylene
F I G U R E 7 . 1 4 Energy relationships ofthe new molecular orbitals and the interactingp system and its auxochrome.
14782_07_Ch7_p381-417.pp2.qxd 2/2/08 1:23 AM Page 394

A transition at 175 nm lies below the cutoff points of the common solvents used to determineUV spectra (Table 7.1) and therefore is not easily detectable. Furthermore, the s-trans conformationis more favorable for butadiene than is the s-cis conformation. Therefore, the 175-nm band is notusually detected.
In general, conjugated dienes exhibit an intense band (e = 20,000 to 26,000) in the region from217 to 245 nm, owing to a p U p * transition. The position of this band appears to be quite insensi-tive to the nature of the solvent.
Butadiene and many simple conjugated dienes exist in a planar s-trans conformation, as noted.Generally, alkyl substitution produces bathochromic shifts and hyperchromic effects. However,with certain patterns of alkyl substitution, the wavelength increases but the intensity decreases. The1,3-dialkylbutadienes possess too much crowding between alkyl groups to permit them to exist inthe s-trans conformation. They convert, by rotation around the single bond, to an s-cis conforma-tion, which absorbs at longer wavelengths but with lower intensity than the corresponding s-transconformation.
In cyclic dienes, where the central bond is a part of the ring system, the diene chromophore isusually held rigidly in either the s-trans (transoid) or the s-cis (cisoid) orientation. Typical absorp-tion spectra follow the expected pattern:
By studying a vast number of dienes of each type, Woodward and Fieser devised an empiricalcorrelation of structural variations that enables us to predict the wavelength at which a conjugateddiene will absorb. Table 7.5 summarizes the rules. Following are a few sample applications of theserules. Notice that the pertinent parts of the structures are shown in bold face.
Homoannular diene (cisoid or s-cis)Less intense, ε = 5,000–15,000λ longer (273 nm)
Heteroannular diene (transoid or s-trans)More intense, ε = 12,000–28,000λ shorter (234 nm)
CH3
H
C
H
H
H
H
HH
H
C
C C
CH3 CH3
C C CH3
C
C
s-trans s-cis
7.10 The Woodward–Fieser Rules for Dienes 395
14782_07_Ch7_p381-417.pp2.qxd 2/2/08 1:23 AM Page 395

TA B L E 7 . 5EMPIRICAL RULES FOR DIENES
Homoannular Heteroannular(cisoid) (transoid)
Parent l = 253 nm l = 214 nm
Increments for:
Double-bond-extending conjugation 30 30
Alkyl substituent or ring residue 5 5
Exocyclic double bond 5 5
Polar groupings:
IOCOCH3 0 0
IOR 6 6
ICl, IBr 5 5
INR2 60 60
H
C
H
H
H
CH3
C
C C
H
H H
C
CH3
H
HC
C C
CH3
Transoid: 214 nmObserved: 217 nm
Transoid: 214 nm Alkyl groups: 3 � 5 = 15 229 nm
Observed: 228 nm
Transoid: 214 nm Ring residues: 3 � 5 = 15Exocyclic double bond: 5 234 nm
Observed: 235 nm
Transoid: 214 nm Ring residues: 3 � 5 = 15Exocyclic double bond: 5—OR: 6 240 nm
Observed: 241 nm
CH3
CH3CH2OExocyclic double bond
CH3
Exocyclic double bond
396
14782_07_Ch7_p381-417.pp2.qxd 2/2/08 1:23 AM Page 396
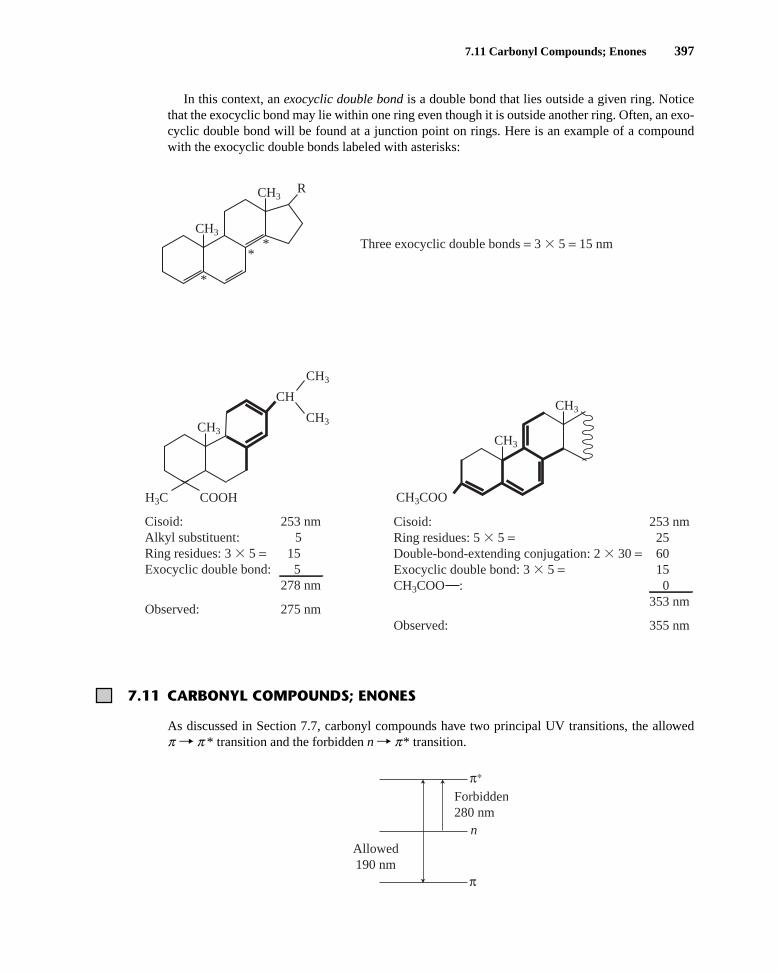
In this context, an exocyclic double bond is a double bond that lies outside a given ring. Noticethat the exocyclic bond may lie within one ring even though it is outside another ring. Often, an exo-cyclic double bond will be found at a junction point on rings. Here is an example of a compoundwith the exocyclic double bonds labeled with asterisks:
7.11 Carbonyl Compounds; Enones 397
Cisoid: 253 nm Alkyl substituent: 5Ring residues: 3 � 5 = 15Exocyclic double bond: 5 278 nm
Observed: 275 nm
Cisoid: 253 nm Ring residues: 5 � 5 = 25Double-bond-extending conjugation: 2 � 30 = 60Exocyclic double bond: 3 � 5 = 15CH3COO : 0 353 nm
Observed: 355 nm
CH3COO
CH3
CH3
CH3
CH3
CH3
CH
H3C COOH
CH3
CH3
R
Three exocyclic double bonds = 3 � 5 = 15 nm *
*
*
7.11 CARBONYL COMPOUNDS; ENONES
As discussed in Section 7.7, carbonyl compounds have two principal UV transitions, the allowed p U p * transition and the forbidden nU p* transition.
Forbidden280 nm
n
π∗
π
Allowed190 nm
14782_07_Ch7_p381-417.pp2.qxd 2/2/08 1:23 AM Page 397

398 Ultraviolet Spectroscopy
Of these, only the nU p * transition, although it is weak (forbidden), is commonly observed abovethe usual cutoff points of solvents. Substitution on the carbonyl group by an auxochrome with alone pair of electrons, such as INR2, IOH, IOR, INH2, or IX, as in amides, acids, esters, oracid chlorides, gives a pronounced hypsochromic effect on the n U p * transition and a lesser,bathochromic effect on the p U p * transition. Such bathochromic shifts are caused by resonanceinteraction similar to that discussed in Section 7.9. Seldom, however, are these effects large enoughto bring the p U p * band into the region above the solvent cutoff point. Table 7.6 lists thehypsochromic effects of an acetyl group on the nU p * transition.
The hypsochromic shift of the nU p * is due primarily to the inductive effect of the oxygen,nitrogen, or halogen atoms. They withdraw electrons from the carbonyl carbon, causing the lonepair of electrons on oxygen to be held more firmly than they would be in the absence of the induc-tive effect.
If the carbonyl group is part of a conjugated system of double bonds, both the nU p * and the p U p * bands are shifted to longer wavelengths. However, the energy of the n U p * transitiondoes not decrease as rapidly as that of the p U p * band, which is more intense. If the conjugatedchain becomes long enough, the nU p * band is “buried” under the more intense p U p * band.Figure 7.15 illustrates this effect for a series of polyene aldehydes.
Figure 7.16 shows the molecular orbitals of a simple enone system, along with those of thenoninteracting double bond and the carbonyl group.
TA B L E 7 . 6HYPSOCHROMIC EFFECTS OF LONE-PAIR AUXOCHROMESON THE nU p * TRANSITION OF A CARBONYL GROUP
OO
lmax emax Solvent
CH3 C H 12 Hexane
CH3 C CH3 15 Hexane
CH3 C Cl 53 Hexane
CH3 C NH2 — Water
CH3 C OCH2CH3 60 Water
CH3 C OH 41 Ethanol
O
O
O
O
O
293 nm
279
235
214
204
204
14782_07_Ch7_p381-417.pp2.qxd 2/2/08 1:23 AM Page 398

F I G U R E 7 . 1 5 The spectra of a series of polyenealdehydes. (From Murrell, J. N., The Theory of the Electronic Spectra of Organic Molecules, Methuen andCo., Ltd., London, 1963. Reprinted by permission.)
––
n
π*
π
165 nm
C––C–
–
–
–C–C
– –
–– O–C–
C––O–
–
Alkene Enone Carbonyl
�2
�1
�3*
�4*
320 nm
218 nm
n
π
π*
280 nm
190 nm
F I G U R E 7 . 1 6 The orbitals of an enone system compared to those of the noninteracting chromophores.
399
14782_07_Ch7_p381-417.pp2.qxd 2/2/08 1:23 AM Page 399

400 Ultraviolet Spectroscopy
7.12 WOODWARD’S RULES FOR ENONES
The conjugation of a double bond with a carbonyl group leads to intense absorption (e = 8,000 to20,000) corresponding to a pU p * transition of the carbonyl group. The absorption is found between220 and 250 nm in simple enones. The nU p * transition is much less intense (e = 50 to 100) and ap-pears at 310 to 330 nm. Although the pU p * transition is affected in predictable fashion by structuralmodifications of the chromophore, the nU p * transition does not exhibit such predictable behavior.
Woodward examined the ultraviolet spectra of numerous enones and devised a set of empiricalrules that enable us to predict the wavelength at which the p U p * transition occurs in an unknownenone. Table 7.7 summarizes these rules.
TA B L E 7 . 7EMPIRICAL RULES FOR ENONES
Base values:
Six-membered ring or acyclic parent enone = 215 nm
Five-membered ring parent enone = 202 nm
Acyclic dienone = 245 nm
Increments for:
Double-bond-extending conjugation 30
Alkyl group or ring residue a 10
b 12
g and higher 18
Polar groupings:
IOH a 35
b 30
d 50
IOCOCH3 a,b,d 6
IOCH3 a 35
b 30
g 17
d 31
ICl a 15
b 12
IBr a 25
b 30
INR2 b 95
Exocyclic double bond 5
Homocyclic diene component 39
Solvent correction Variable
lEtOHmax (calc) = Total
Cb d
d gb ba a
C C O C C C C C
14782_07_Ch7_p381-417.pp2.qxd 2/2/08 1:23 AM Page 400

Following are a few sample applications of these rules. The pertinent parts of the structures areshown in bold face.
7.12 Woodward’s Rules for Enones 401
CH3
C
CH3
CH3C
C
CH3
CH3
Acyclic enone: 215 nm -CH3: 10 -CH3: 2 � 12 = 24 249 nm
Observed: 249 nm
O
αβ
β α
CH3
OCOCH3
O
β
α
δγ
Six-membered enone: 215 nm Double-bond-extending conjugation: 30Homocyclic diene: 39 -Ring residue: 18 302 nm
Observed: 300 nm
δ
Five-membered enone: 202 nm -Ring residue: 2 � 12 = 24Exocyclic double bond: 5 231 nm
Observed: 226 nm
βFive-membered enone: 202 nm -Br: 25 -Ring residue: 2 � 12 = 24Exocyclic double bond: 5 256 nm
Observed: 251 nm
αβ
O
βα
CH3
Oβα
Br
Six-membered enone: 215 nm Double-bond-extending conjugation: 30 -Ring residue: 12 -Ring residue: 18Exocyclic double bond: 5
280 nm
Observed: 280 nm
β
Oβα
CH3
CH3R
δ
γ
δ
14782_07_Ch7_p381-417.pp2.qxd 2/2/08 1:23 AM Page 401

402 Ultraviolet Spectroscopy
7.13 a,b-UNSATURATED ALDEHYDES, ACIDS, AND ESTERS
a,b-Unsaturated aldehydes generally follow the same rules as enones (see the preceding section)except that their absorptions are displaced by about 5 to 8 nm toward shorter wavelength than thoseof the corresponding ketones. Table 7.8 lists the empirical rules for unsaturated aldehydes.
Nielsen developed a set of rules for a,b-unsaturated acids and esters that are similar to those forenones (Table 7.9).
Consider 2-cyclohexenoic and 2-cycloheptenoic acids as examples:
, -dialkyl 217 nm calc.
Double bond is in a six-membered ring, 217 nm obs.adds nothing
, -dialkyl 217 nm
Double bond is in a seven-membered ring + 5
222 nm calc.
222 nm obs.
β
βα
α
COOH
COOH
7.14 AROMATIC COMPOUNDS
The absorptions that result from transitions within the benzene chromophore can be quite complex.The ultraviolet spectrum contains three absorption bands, which sometimes contain a great deal offine structure. The electronic transitions are basically of the pU p * type, but their details are not assimple as in the cases of the classes of chromophores described in earlier sections of this chapter.
Figure 7.17a shows the molecular orbitals of benzene. If you were to attempt a simple explana-tion for the electronic transitions in benzene, you would conclude that there are four possible transi-tions, but each transition has the same energy. You would predict that the ultraviolet spectrum ofbenzene consists of one absorption peak. However, owing to electron–electron repulsions and sym-metry considerations, the actual energy states from which electronic transitions occur are somewhatmodified. Figure 7.17b shows the energy-state levels of benzene. Three electronic transitions take
TA B L E 7 . 8EMPIRICAL RULES FOR UNSATURATEDALDEHYDES
C
H
O
C C
αβ
β
Parent 208 nm
With a or b alkyl groups 220
With a,b or b,b alkyl groups 230
With a,b,b alkyl groups 242
14782_07_Ch7_p381-417.pp2.qxd 2/2/08 1:23 AM Page 402

7.14 Aromatic Compounds 403
TA B L E 7 . 9EMPIRICAL RULES FOR UNSATURATED ACIDS AND ESTERS
Base values for:
With a or b alkyl group 208 nm
With a,b or b,b alkyl groups 217
With a,b,b alkyl groups 225
For an exocyclic a,b double bond Add 5 nm
For an endocyclic a,b double bond in a five- or seven-membered ring Add 5 nm
C
COOR
C
β
β
α
C
COOH
C
β
β
α
place to these excited states. Those transitions, which are indicated in Figure 7.17b, are the so-calledprimary bands at 184 and 202 nm and the secondary (fine-structure) band at 255 nm. Figure 7.18is the spectrum of benzene. Of the primary bands, the 184-nm band (the second primary band) hasa molar absorptivity of 47,000. It is an allowed transition. Nevertheless, this transition is not ob-served under usual experimental conditions because absorptions at this wavelength are in the vacuumultraviolet region of the spectrum, beyond the range of most commercial instruments. In polycyclicaromatic compounds, the second primary band is often shifted to longer wavelengths, in which case
π6*
π4* π5*
π2 π3
π1
E1u
180 nm(allowed)
B1u
B2u
A1g
200 nm(forbidden)
260 nm(forbidden)
(a) Molecular orbitals (b) Energy states
F I G U R E 7 . 1 7 Molecular orbitals and energy states for benzene.
14782_07_Ch7_p381-417.pp2.qxd 2/2/08 1:23 AM Page 403

404 Ultraviolet Spectroscopy
it can be observed under ordinary conditions. The 202-nm band is much less intense (e = 7400), andit corresponds to a forbidden transition. The secondary band is the least intense of the benzene bands(e = 230). It also corresponds to a symmetry-forbidden electronic transition. The secondary band,caused by interaction of the electronic energy levels with vibrational modes, appears with a greatdeal of fine structure. This fine structure is lost if the spectrum of benzene is determined in a polarsolvent or if a single functional group is substituted onto the benzene ring. In such cases, the sec-ondary band appears as a broad peak, lacking in any interesting detail.
Substitution on the benzene ring can cause bathochromic and hyperchromic shifts. Unfortunately,these shifts are difficult to predict. Consequently, it is impossible to formulate empirical rules topredict the spectra of aromatic substances as was done for dienes, enones, and the other classes ofcompounds discussed earlier in this chapter. You may gain a qualitative understanding of the effectsof substitution by classifying substituents into groups.
F I G U R E 7 . 1 8 Ultraviolet spectrum of benzene.(From Petruska, J., Journal of Chemical Physics, 34(1961): 1121. Reprinted by permission.)
Substituents that carry nonbonding electrons (n electrons) can cause shifts in the primary andsecondary absorption bands. The nonbonding electrons can increase the length of the p systemthrough resonance.
Y Y Y
•• ••
•• •• + +Y
–
••••
+
•• ••
–
–
A. Substituents with Unshared Electrons
14782_07_Ch7_p381-417.pp2.qxd 2/2/08 1:23 AM Page 404

The more available these n electrons are for interaction with the p system of the aromatic ring, thegreater the shifts will be. Examples of groups with n electrons are the amino, hydroxyl, andmethoxy groups, as well as the halogens.
Interactions of this type between the n and p electrons usually cause shifts in the primary andsecondary benzene absorption bands to longer wavelength (extended conjugation). In addition, thepresence of n electrons in these compounds gives the possibility of nU p* transitions. If an n elec-tron is excited into the extended p* chromophore, the atom from which it was removed becomeselectron deficient, while the p system of the aromatic ring (which also includes atom Y) acquires anextra electron. This causes a separation of charge in the molecule and is generally represented asregular resonance, as was shown earlier. However, the extra electron in the ring is actually in a p*orbital and would be better represented by structures of the following type, with the asterisk repre-senting the excited electron:
Such an excited state is often called a charge-transfer or an electron-transfer excited state.In compounds that are acids or bases, pH changes can have very significant effects on the posi-
tions of the primary and secondary bands. Table 7.10 illustrates the effects of changing the pH ofthe solution on the absorption bands of various substituted benzenes. In going from benzene to phe-nol, notice the shift from 203.5 to 210.5 nm—a 7-nm shift—in the primary band. The secondaryband shifts from 254 to 270 nm—a 16-nm shift. However, in phenoxide ion, the conjugate base ofphenol, the primary band shifts from 203.5 to 235 nm (a 31.5-nm shift), and the secondary bandshifts from 254 to 287 nm (a 33-nm shift). The intensity of the secondary band also increases.In phenoxide ion, there are more n electrons, and they are more available for interaction with thearomatic p system than in phenol.
Y Y Y+ +Y+
*–
• +
•–*
– •*
–•*
7.14 Aromatic Compounds 405
TA B L E 7 . 1 0pH EFFECTS ON ABSORPTION BANDS
Primary Secondary
Substituent l (nm) e l (nm) e
203.5 7,400 254 204
IOH 210.5 6,200 270 1,450
IO− 235 9,400 287 2,600
INH2 230 8,600 280 1,430
INH3+ 203 7,500 254 169
ICOOH 230 11,600 273 970
ICOO− 224 8,700 268 560
—H
14782_07_Ch7_p381-417.pp2.qxd 2/2/08 1:23 AM Page 405

406 Ultraviolet Spectroscopy
Substituents that are themselves chromophores usually contain p electrons. Just as in the case ofn electrons, interaction of the benzene-ring electrons and the p electrons of the substituent can pro-duce a new electron transfer band. At times, this new band may be so intense as to obscure the sec-ondary band of the benzene system. Notice that this interaction induces the opposite polarity; thering becomes electron deficient.
Table 7.10 demonstrates the effect of acidity or basicity of the solution on such a chromophoricsubstituent group. In the case of benzoic acid, the primary and secondary bands are shifted substan-tially from those noted for benzene. However, the magnitudes of the shifts are somewhat smaller inthe case of benzoate ion, the conjugate base of benzoic acid. The intensities of the peaks are lowerthan for benzoic acid as well. We expect electron transfer of the sort just shown to be less likelywhen the functional group already bears a negative charge.
R
C O• •
• •
+
R
C O• •
• •
••– +
R
C O• •
• •
••–
R
C O• •
• •
••–
+
B. Substituents Capable of p-Conjugation
Substituents may have differing effects on the positions of absorption maxima, depending onwhether they are electron releasing or electron withdrawing. Any substituent, regardless of its influ-ence on the electron distribution elsewhere in the aromatic molecule, shifts the primary absorptionband to longer wavelength. Electron-withdrawing groups have essentially no effect on the positionof the secondary absorption band unless, of course, the electron-withdrawing group is also capableof acting as a chromophore. However, electron-releasing groups increase both the wavelength andthe intensity of the secondary absorption band. Table 7.11 summarizes these effects, with electron-releasing and electron-withdrawing substituents grouped together.
C. Electron-Releasing and Electron-Withdrawing Effects
With disubstituted benzene derivatives, it is necessary to consider the effect of each of the twosubstituents. For para-disubstituted benzenes, two possibilities exist. If both groups are electronreleasing or if they are both electron withdrawing, they exert effects similar to those observed withmonosubstituted benzenes. The group with the stronger effect determines the extent of shifting of
D. Disubstituted Benzene Derivatives
The comparison of aniline and anilinium ion illustrates a reverse case. Aniline exhibits shiftssimilar to those of phenol. From benzene to aniline, the primary band shifts from 203.5 to 230 nm (a26.5-nm shift), and the secondary band shifts from 254 to 280 nm (a 26-nm shift). However, theselarge shifts are not observed in the case of anilinium ion, the conjugate acid of aniline. For anilin-ium ion, the primary and secondary bands do not shift at all. The quaternary nitrogen of aniliniumion has no unshared pairs of electrons to interact with the benzene p system. Consequently, thespectrum of anilinium ion is almost identical to that of benzene.
14782_07_Ch7_p381-417.pp2.qxd 2/2/08 1:23 AM Page 406

7.14 Aromatic Compounds 407
TA B L E 7 . 1 1ULTRAVIOLET MAXIMA FOR VARIOUS AROMATIC COMPOUNDS
Primary Secondary
Substituent l (nm) e l (nm) e
203.5 7,400 254 204
ICH3 206.5 7,000 261 225
ICl 209.5 7,400 263.5 190
IBr 210 7,900 261 192
IOH 210.5 6,200 270 1,450
IOCH3 217 6,400 269 1,480
INH2 230 8,600 280 1,430
ICN 224 13,000 271 1,000
ICOOH 230 11,600 273 970
ICOCH3 245.5 9,800
ICHO 249.5 11,400
INO2 268.5 7,800
—H
Electron-releasing substituents
Electron-withdrawing substituents
the primary absorption band. If one of the groups is electron releasing while the other is electronwithdrawing, the magnitude of the shift of the primary band is greater than the sum of the shifts due to the individual groups. The enhanced shifting is due to resonance interactions of thefollowing type:
If the two groups of a disubstituted benzene derivative are either ortho or meta to each other,the magnitude of the observed shift is approximately equal to the sum of the shifts caused by the individual groups. With substitution of these types, there is no opportunity for the kind ofdirect resonance interaction between substituent groups that is observed with para substituents.In the case of ortho substituents, the steric inability of both groups to achieve coplanarityinhibits resonance.
For the special case of substituted benzoyl derivatives, an empirical correlation of structure withthe observed position of the primary absorption band has been developed (Table 7.12). It provides ameans of estimating the position of the primary band for benzoyl derivatives within about 5 nm.
O–
O• •
H2N N+
O–
O–
H2N N++
14782_07_Ch7_p381-417.pp2.qxd 2/2/08 1:23 AM Page 407

408 Ultraviolet Spectroscopy
TA B L E 7 . 1 2EMPIRICAL RULES FOR BENZOYL DERIVATIVES
Following are two sample applications of these rules:
Parent chromophore: 246 nm o-Ring residue: 3m-Br: 2 251 nm
Observed: 253 nm
O
Br
Parent chromophore: 230 nm m-OH: 2 � 7 = 14p-OH: 25 269 nm
Observed: 270 nm
O
C OH
OH
HO
HO
Parent chromophore:
R = alkyl or ring residue 246
R = H 250
R = OH or Oalkyl 230
Increment for each substituent:
—Alkyl or ring residue o, m 3
p 10
—OH, —OCH3, or —Oalkyl o, m 7
p 25
—O– o 11
m 20
p 78
—Cl o, m 0
p 10
—Br o, m 2
p 15
—NH2 o, m 13
p 58
—NHCOCH3 o, m 20
p 45
—NHCH3 p 73
—N(CH3)2 o, m 20
p 85
O
C R
14782_07_Ch7_p381-417.pp2.qxd 2/2/08 1:23 AM Page 408

7.14 Aromatic Compounds 409
Researchers have observed that the primary and secondary bands in the spectra of polynuclear aromatic hydrocarbons shift to longer wavelength. In fact, even the second primary band,which appears at 184 nm for benzene, is shifted to a wavelength within the range of most UVspectrophotometers. This band lies at 220 nm in the spectrum of naphthalene. As the extent ofconjugation increases, the magnitude of the bathochromic shift also increases.
The ultraviolet spectra of the polynuclear aromatic hydrocarbons possess characteristic shapesand fine structure. In the study of spectra of substituted polynuclear aromatic derivatives, it iscommon practice to compare them with the spectrum of the unsubstituted hydrocarbon. The natureof the chromophore can be identified on the basis of similarity of peak shapes and fine structure.This technique involves the use of model compounds. Section 7.15 will discuss it further.
Figure 7.19 shows the ultraviolet spectra of naphthalene and anthracene. Notice the characteristicshape and fine structure of each spectrum, as well as the effect of increased conjugation on thepositions of the absorption maxima.
E. Polynuclear Aromatic Hydrocarbons and Heterocyclic Compounds
F I G U R E 7 . 1 9 Ultraviolet spectraof naphthalene and anthracene. (FromFriedel, R. A., and M. Orchin, UltravioletSpectra of Aromatic Compounds, JohnWiley and Sons, New York, 1951. Reprintedby permission.)
14782_07_Ch7_p381-417.pp2.qxd 2/2/08 1:23 AM Page 409

410 Ultraviolet Spectroscopy
Heterocyclic molecules have electronic transitions that include combinations of p U p* and n U p* transitions. The spectra can be rather complex, and analysis of the transitions involved willbe left to more advanced treatments. The common method of studying derivatives of heterocyclicmolecules is to compare them to the spectra of the parent heterocyclic systems. Section 7.15 willfurther describe the use of model compounds in this fashion.
Figure 7.20 includes the ultraviolet spectra of pyridine, quinoline, and isoquinoline. You maywish to compare the spectrum of pyridine with that of benzene (Fig. 7.18) and the spectra of quino-line and isoquinoline with the spectrum of naphthalene (Fig. 7.19).
F I G U R E 7 . 2 0 The ultraviolet spectra of pyridine, quinoline, and isoquinoline. (From Friedel, R. A.,and M. Orchin, Ultraviolet Spectra of Aromatic Compounds, John Wiley and Sons, New York, 1951.Reprinted by permission.)
14782_07_Ch7_p381-417.pp2.qxd 2/2/08 1:23 AM Page 410

7.15 Model Compound Studies 411
7.15 MODEL COMPOUND STUDIES
F I G U R E 7 . 2 1 The ultraviolet spectrum of 9-methylanthracene. (From Friedel, R. A., and M. Orchin,Ultraviolet Spectra of Aromatic Compounds, John Wiley and Sons, New York, 1951. Reprinted by permission.)
Very often, the ultraviolet spectra of several members of a particular class of compounds are verysimilar. Unless you are thoroughly familiar with the spectroscopic properties of each member of theclass of compounds, it is very difficult to distinguish the substitution patterns of individual mole-cules by their ultraviolet spectra. You can, however, determine the gross nature of the chromophoreof an unknown substance by this method. Then, based on knowledge of the chromophore, you canemploy the other spectroscopic techniques described in this book to elucidate the precise structureand substitution of the molecule.
This approach—the use of model compounds—is one of the best ways to put the technique of ul-traviolet spectroscopy to work. By comparing the UV spectrum of an unknown substance with thatof a similar but less highly substituted compound, you can determine whether or not they containthe same chromophore. Many of the books listed in the references at the end of this chapter containlarge collections of spectra of suitable model compounds, and with their help you can establish thegeneral structure of the part of the molecule that contains the p electrons. You can then utilizeinfrared or NMR spectroscopy to determine the detailed structure.
As an example, consider an unknown substance that has the molecular formula C15H12. Acomparison of its spectrum (Fig. 7.21) with that of anthracene (Fig. 7.19) shows that the two spec-tra are nearly identical. Disregarding minor bathochromic shifts, the same general peak shape andfine structure appear in the spectra of both the unknown and anthracene, the model compound.You may then conclude that the unknown is a substituted anthracene derivative. Further structuredetermination reveals that the unknown is 9-methylanthracene. The spectra of model compoundscan be obtained from published catalogues of ultraviolet spectra. In cases in which a suitablemodel compound is not available, a model compound can be synthesized and its spectrumdetermined.
14782_07_Ch7_p381-417.pp2.qxd 2/2/08 1:23 AM Page 411

412 Ultraviolet Spectroscopy
TA B L E 7 . 1 3RELATIONSHIP BETWEEN THE COLOR OF LIGHT ABSORBED BY ACOMPOUND AND THE OBSERVED COLOR OF THE COMPOUND
Color of Light Wavelength of Light ObservedAbsorbed Absorbed (nm) Color
Violet 400 Yellow
Blue 450 Orange
Blue-green 500 Red
Yellow-green 530 Red-violet
Yellow 550 Violet
Orange-red 600 Blue-green
Red 700 Green
7.16 VISIBLE SPECTRA: COLOR IN COMPOUNDS
The portion of the electromagnetic spectrum lying between about 400 and 750 nm is the visibleregion. Light waves with wavelengths between these limits appear colored to the human eye. Asanyone who has seen light diffracted by a prism or the diffraction effect of a rainbow knows, oneend of the visible spectrum is violet, and the other is red. Light with wavelengths near 400 nm isviolet, while that with wavelengths near 750 nm is red.
The phenomenon of color in compounds, however, is not as straightforward as the precedingdiscussion would suggest. If a substance absorbs visible light, it appears to have a color; if not, itappears white. However, compounds that absorb light in the visible region of the spectrum do notpossess the color corresponding to the wavelength of the absorbed light. Rather, there is an inverserelationship between the observed color and the color absorbed.
When we observe light emitted from a source, as from a lamp or an emission spectrum, we ob-serve the color corresponding to the wavelength of the light being emitted. A light source emittingviolet light emits light at the high-energy end of the visible spectrum. A light source emitting redlight emits light at the low-energy end of the spectrum.
However, when we observe the color of a particular object or substance, we do not observe thatobject or substance emitting light. (Certainly, the substance does not glow in the dark.) Rather, weobserve the light that is being reflected. The color that our eye perceives is not the color correspond-ing to the wavelength of the light absorbed but its complement. When white light falls on an object,light of a particular wavelength is absorbed. The remainder of the light is reflected. The eye and brainregister all of the reflected light as the color complementary to the color that was absorbed.
In the case of transparent objects or solutions, the eye receives the light that is transmitted.Again, light of a particular wavelength is absorbed, and the remaining light passes through to reachthe eye. As before, the eye registers this transmitted light as the color complementary to the colorthat was absorbed. Table 7.13 illustrates the relationship between the wavelength of light absorbedby a substance and the color perceived by an observer.
Some familiar compounds may serve to underscore these relationships between the absorptionspectrum and the observed color. The structural formulas of these examples are shown. Notice thateach of these substances has a highly extended conjugated system of electrons. Such extensive con-jugation shifts their electronic spectra to such long wavelengths that they absorb visible light andappear colored.
14782_07_Ch7_p381-417.pp2.qxd 2/2/08 1:23 AM Page 412
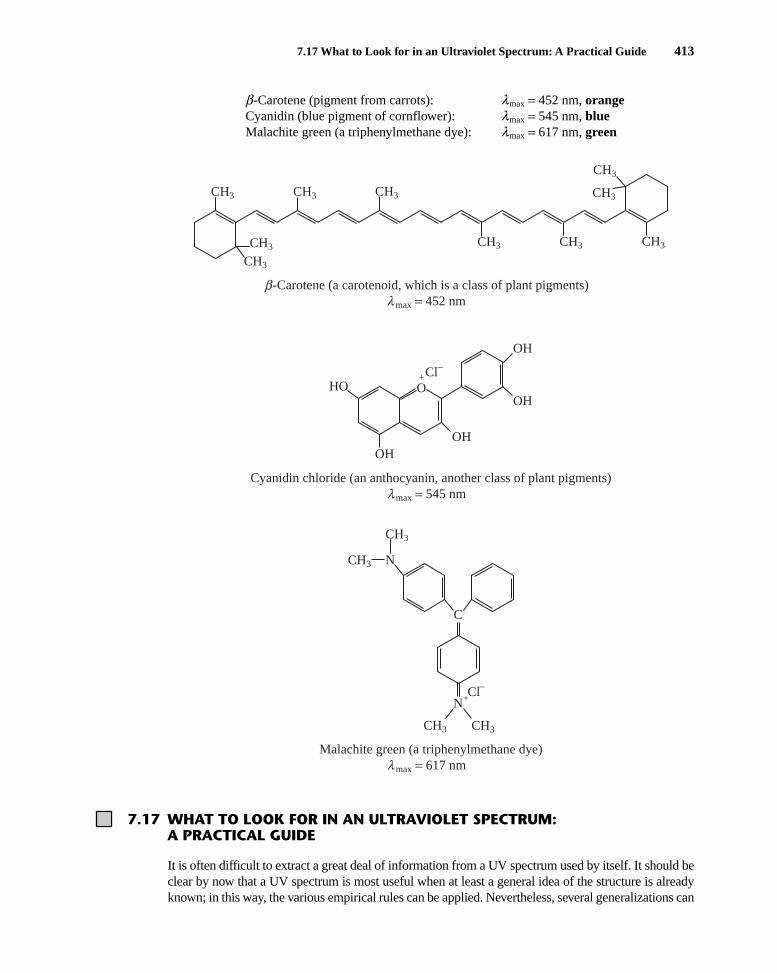
b-Carotene (pigment from carrots): lmax = 452 nm, orangeCyanidin (blue pigment of cornflower): lmax = 545 nm, blueMalachite green (a triphenylmethane dye): lmax = 617 nm, green
λMalachite green (a triphenylmethane dye)
max = 617 nm
CH3
N
CH3
+–Cl
CH3
CH3
N
C
λCyanidin chloride (an anthocyanin, another class of plant pigments)
max = 545 nm
HO
OH
OH
OH
OH
O+
–Cl
βλ
CH3 CH3 CH3
CH3 CH3 CH3
CH3
CH3
-Carotene (a carotenoid, which is a class of plant pigments)
max = 452 nm
CH3
CH3
7.17 What to Look for in an Ultraviolet Spectrum: A Practical Guide 413
7.17 WHAT TO LOOK FOR IN AN ULTRAVIOLET SPECTRUM:A PRACTICAL GUIDE
It is often difficult to extract a great deal of information from a UV spectrum used by itself. It should beclear by now that a UV spectrum is most useful when at least a general idea of the structure is alreadyknown; in this way, the various empirical rules can be applied. Nevertheless, several generalizations can
14782_07_Ch7_p381-417.pp2.qxd 2/2/08 1:23 AM Page 413

414 Ultraviolet Spectroscopy
serve to guide our use of UV data. These generalizations are a good deal more meaningful when com-bined with infrared and NMR data—which can, for instance, definitely identify carbonyl groups, dou-ble bonds, aromatic systems, nitro groups, nitriles, enones, and other important chromophores. In theabsence of infrared or NMR data, the following observations should be taken only as guidelines:
1. A single band of low-to-medium intensity (e = 100 to 10,000) at wavelengths less than 220 nmusually indicates an n U s* transition. Amines, alcohols, ethers, and thiols are possibilities,provided the nonbonded electrons are not included in a conjugated system. An exception to thisgeneralization is that the nU p* transition of cyano groups (ICKN : ) appears in this region.However, this is a weak transition (e < 100), and the cyano group is easily identified in the in-frared. Do not neglect to look for NIH, OIH, CIO, and SIH bands in the infrared spectrum.
2. A single band of low intensity (e = 10 to 100) in the region 250 to 360 nm, with no majorabsorption at shorter wavelengths (200 to 250 nm), usually indicates an nU p* transition.Since the absorption does not occur at long wavelength, a simple, or unconjugated, chro-mophore is indicated, generally one that contains an O, N, or S atom. Examples of this mayinclude CJ O, CJN, NJN, INO2, ICOOR, ICOOH, or ICONH2. Once again, infraredand NMR spectra should help a great deal.
3. Two bands of medium intensity (e = 1,000 to 10,000), both with lmax above 200 nm, gener-ally indicate the presence of an aromatic system. If an aromatic system is present, there maybe a good deal of fine structure in the longer-wavelength band (in nonpolar solvents only).Substitution on the aromatic rings increases the molar absorptivity above 10,000, particu-larly if the substituent increases the length of the conjugated system.
In polynuclear aromatic substances, a third band appears near 200 nm, a band that in sim-pler aromatics occurs below 200 nm, where it cannot be observed. Most polynuclear aro-matics (and heterocyclic compounds) have very characteristic intensity and band-shape(fine-structure) patterns, and they may often be identified via comparison to spectra that areavailable in the literature. The textbooks by Jaffé and Orchin and by Scott, which are listedin the references at the end of this chapter, are good sources of spectra.
4. Bands of high intensity (e = 10,000 to 20,000) that appear above 210 nm generally representeither an a,b-unsaturated ketone (check the infrared spectrum), a diene, or a polyene. Thegreater the length of the conjugated system, the longer the observed wavelength. For dienes,the lmax may be calculated using the Woodward–Fieser Rules (Section 7.10).
5. Simple ketones, acids, esters, amides, and other compounds containing both p systems andunshared electron pairs show two absorptions: an n U p* transition at longer wavelengths(>300 nm, low intensity) and a p U p* transition at shorter wavelengths (<250 nm, highintensity). With conjugation (enones), the lmax of the p U p* band moves to longer wave-lengths and can be predicted by Woodward’s Rules (Section 7.12). The e value usually risesabove 10,000 with conjugation, and as it is very intense, it may obscure or bury the weakernU p* transition.
For a,b-unsaturated esters and acids, Nielsen’s Rules (Section 7.13) may be used topredict the position of lmax with increasing conjugation and substitution.
6. Compounds that are highly colored (have absorption in the visible region) are likely to containa long-chain conjugated system or a polycyclic aromatic chromophore. Benzenoid compoundsmay be colored if they have enough conjugating substituents. For nonaromatic systems, usu-ally a minimum of four to five conjugated chromophores are required to produce absorption inthe visible region. However, some simple nitro, azo, nitroso, a-diketo, polybromo, andpolyiodo compounds may also exhibit color, as may many compounds with quinoid structures.
14782_07_Ch7_p381-417.pp2.qxd 2/2/08 1:23 AM Page 414

Problems 415
*1. The ultraviolet spectrum of benzonitrile shows a primary absorption band at 224 nm and a secondary band at 271 nm.
(a) If a solution of benzonitrile in water, with a concentration of 1 × 10⁻⁴ molar, is examined ata wavelength of 224 nm, the absorbance is determined to be 1.30. The cell length is 1 cm.What is the molar absorptivity of this absorption band?
(b) If the same solution is examined at 271 nm, what will be the absorbance reading (e = 1000)? What will be the intensity ratio, I0/I?
*2. Draw structural formulas that are consistent with the following observations:
(a) An acid C7H4O2Cl2 shows a UV maximum at 242 nm.
(b) A ketone C8H14O shows a UV maximum at 248 nm.
(c) An aldehyde C8H12O absorbs in the UV with lmax = 244 nm.
*3. Predict the UV maximum for each of the following substances:
(a)
CH2 CH3CH
O
C
(b)
CH3
C
CH3
CH2C
C
CH3
O
CH3
O(c)
(e) CH3
CH3
CH3
OCH3
O
C
(f)
CH3
CH3
O
R(d)
(g)
CH3
(h)
CH3O
OCH3
O
(i)
O
OCH3
O
C
NCH3
O
C
H
(j)CH3
CH3
O
C
P R O B L E M S
14782_07_Ch7_p381-417.pp2.qxd 2/2/08 1:23 AM Page 415

416 Ultraviolet Spectroscopy
*4. The UV spectrum of acetone shows absorption maxima at 166, 189, and 279 nm. What type oftransition is responsible for each of these bands?
*5. Chloromethane has an absorption maximum at 172 nm, bromomethane shows an absorption at204 nm, and iodomethane shows a band at 258 nm. What type of transition is responsible foreach band? How can the trend of absorptions be explained?
*6. What types of electronic transitions are possible for each of the following compounds?
(a) Cyclopentene
(b) Acetaldehyde
(c) Dimethyl ether
(d) Methyl vinyl ether
(e) Triethylamine
(f) Cyclohexane
7. Predict and explain whether UV/visible spectroscopy can be used to distinguish between thefollowing pairs of compounds. If possible, support your answers with calculations.
O
O
OCH3 CH3
CH3
CH3
OCH3 CH3
CH3
CH3
CH2 CH3 CH3
CH3
O
OH CH2 OH
CH3CH3 CH2
CH2 CH3OCH3
O
CH3OCH3 CH2
O
O
14782_07_Ch7_p381-417.pp2.qxd 2/2/08 1:23 AM Page 416

References 417
8. (a) Predict the UV maximum for the reactant and product of the following photochemical reaction:
(b) Is UV spectroscopy a good way to distinguish the reactant from the product?
(c) How would you use infrared spectroscopy to distinguish between the reactant and the product?
(d) How would you use proton NMR to distinguish between the reactant and the product (twoways)?
(e) How could you distinguish between the reactant and the product by using DEPT NMR (seeChapter 10)?
OOCH3
CH3
CH3 CH3 CH3
CH3
CH3
CHCH3
h�
American Petroleum Institute Research Project 44, SelectedUltraviolet Spectral Data, Vols. I–IV, ThermodynamicsResearch Center, Texas A&M University, College Station,Texas, 1945–1977.
Friedel, R. A., and M. Orchin, Ultraviolet Spectra of AromaticCompounds, John Wiley and Sons, New York, 1951.
Graselli, J. G., and W. M. Ritchey, eds., Atlas of Spectral Dataand Physical Constants, CRC Press, Cleveland, OH,1975.
Hershenson, H. M., Ultraviolet Absorption Spectra: Index for1954–1957, Academic Press, New York, 1959.
Jaffé, H. H., and M. Orchin, Theory and Applications of Ultraviolet Spectroscopy, John Wiley and Sons, NewYork, 1964.
Parikh, V. M., Absorption Spectroscopy of Organic Molecules,Addison–Wesley Publishing Co., Reading, MA, 1974,Chapter 2.
R E F E R E N C E S
Scott, A. I., Interpretation of the Ultraviolet Spectra of NaturalProducts, Pergamon Press, New York, 1964.
Silverstein, R. M., F. X. Webster, and D. J. KiemleSpectrometric Identification of Organic Compounds,7th ed., John Wiley and Sons, New York, 2005.
Stern, E. S., and T. C. J. Timmons, Electronic AbsorptionSpectroscopy in Organic Chemistry, St. Martin’s Press,New York, 1971.
Websitehttp://webbook.nist.gov/chemistry/
The National Institute of Standards and Technology(NIST) has developed the WebBook. This site includesUV/visible spectra, gas phase infrared spectra, and massspectral data for compounds.
14782_07_Ch7_p381-417.pp2.qxd 2/2/08 1:23 AM Page 417