Supple and Subtle: John Polkinghorne's Engagement with Reality
Upload
independentCategory
view
0download
0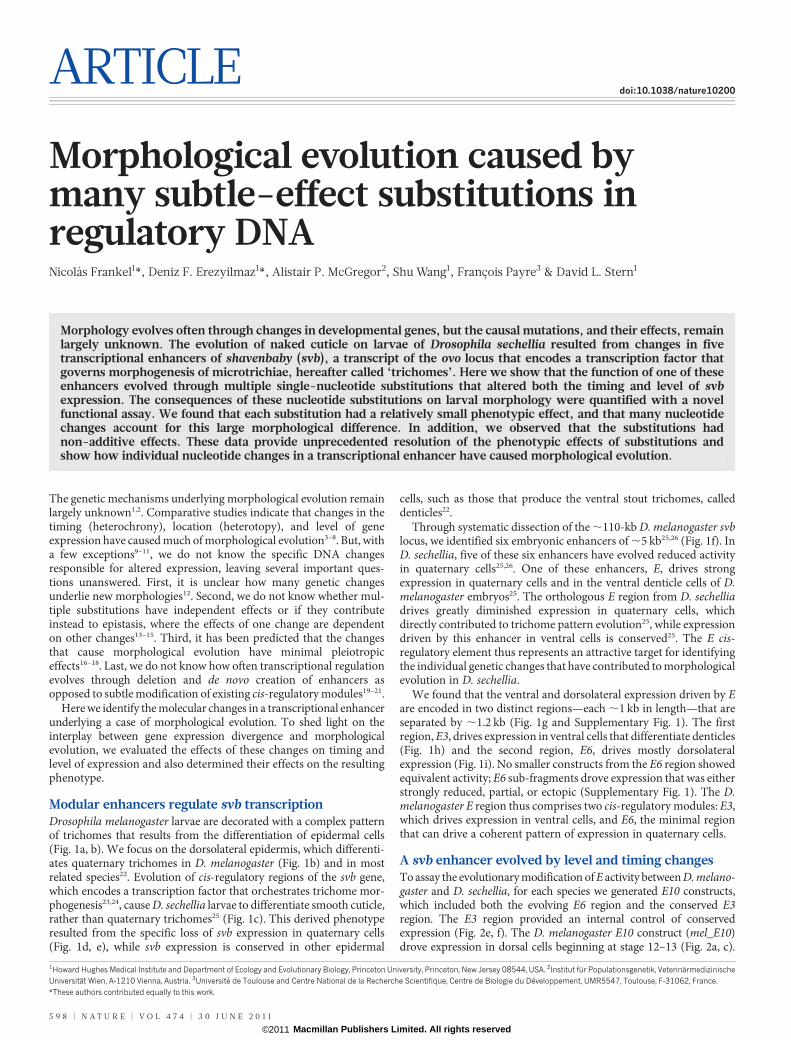
ARTICLEdoi:10.1038/nature10200
Morphological evolution caused bymany subtle-effect substitutions inregulatory DNANicolas Frankel1*, Deniz F. Erezyilmaz1*, Alistair P. McGregor2, Shu Wang1, François Payre3 & David L. Stern1
Morphology evolves often through changes in developmental genes, but the causal mutations, and their effects, remainlargely unknown. The evolution of naked cuticle on larvae of Drosophila sechellia resulted from changes in fivetranscriptional enhancers of shavenbaby (svb), a transcript of the ovo locus that encodes a transcription factor thatgoverns morphogenesis of microtrichiae, hereafter called ‘trichomes’. Here we show that the function of one of theseenhancers evolved through multiple single-nucleotide substitutions that altered both the timing and level of svbexpression. The consequences of these nucleotide substitutions on larval morphology were quantified with a novelfunctional assay. We found that each substitution had a relatively small phenotypic effect, and that many nucleotidechanges account for this large morphological difference. In addition, we observed that the substitutions hadnon-additive effects. These data provide unprecedented resolution of the phenotypic effects of substitutions andshow how individual nucleotide changes in a transcriptional enhancer have caused morphological evolution.
The genetic mechanisms underlying morphological evolution remainlargely unknown1,2. Comparative studies indicate that changes in thetiming (heterochrony), location (heterotopy), and level of geneexpression have caused much of morphological evolution3–8. But, witha few exceptions9–11, we do not know the specific DNA changesresponsible for altered expression, leaving several important ques-tions unanswered. First, it is unclear how many genetic changesunderlie new morphologies12. Second, we do not know whether mul-tiple substitutions have independent effects or if they contributeinstead to epistasis, where the effects of one change are dependenton other changes13–15. Third, it has been predicted that the changesthat cause morphological evolution have minimal pleiotropiceffects16–18. Last, we do not know how often transcriptional regulationevolves through deletion and de novo creation of enhancers asopposed to subtle modification of existing cis-regulatory modules19–21.
Here we identify the molecular changes in a transcriptional enhancerunderlying a case of morphological evolution. To shed light on theinterplay between gene expression divergence and morphologicalevolution, we evaluated the effects of these changes on timing andlevel of expression and also determined their effects on the resultingphenotype.
Modular enhancers regulate svb transcriptionDrosophila melanogaster larvae are decorated with a complex patternof trichomes that results from the differentiation of epidermal cells(Fig. 1a, b). We focus on the dorsolateral epidermis, which differenti-ates quaternary trichomes in D. melanogaster (Fig. 1b) and in mostrelated species22. Evolution of cis-regulatory regions of the svb gene,which encodes a transcription factor that orchestrates trichome mor-phogenesis23,24, cause D. sechellia larvae to differentiate smooth cuticle,rather than quaternary trichomes25 (Fig. 1c). This derived phenotyperesulted from the specific loss of svb expression in quaternary cells(Fig. 1d, e), while svb expression is conserved in other epidermal
cells, such as those that produce the ventral stout trichomes, calleddenticles22.
Through systematic dissection of the ,110-kb D. melanogaster svblocus, we identified six embryonic enhancers of ,5 kb25,26 (Fig. 1f). InD. sechellia, five of these six enhancers have evolved reduced activityin quaternary cells25,26. One of these enhancers, E, drives strongexpression in quaternary cells and in the ventral denticle cells of D.melanogaster embryos25. The orthologous E region from D. sechelliadrives greatly diminished expression in quaternary cells, whichdirectly contributed to trichome pattern evolution25, while expressiondriven by this enhancer in ventral cells is conserved25. The E cis-regulatory element thus represents an attractive target for identifyingthe individual genetic changes that have contributed to morphologicalevolution in D. sechellia.
We found that the ventral and dorsolateral expression driven by Eare encoded in two distinct regions—each ,1 kb in length—that areseparated by ,1.2 kb (Fig. 1g and Supplementary Fig. 1). The firstregion, E3, drives expression in ventral cells that differentiate denticles(Fig. 1h) and the second region, E6, drives mostly dorsolateralexpression (Fig. 1i). No smaller constructs from the E6 region showedequivalent activity; E6 sub-fragments drove expression that was eitherstrongly reduced, partial, or ectopic (Supplementary Fig. 1). The D.melanogaster E region thus comprises two cis-regulatory modules: E3,which drives expression in ventral cells, and E6, the minimal regionthat can drive a coherent pattern of expression in quaternary cells.
A svb enhancer evolved by level and timing changesTo assay the evolutionary modification of E activity between D. melano-gaster and D. sechellia, for each species we generated E10 constructs,which included both the evolving E6 region and the conserved E3region. The E3 region provided an internal control of conservedexpression (Fig. 2e, f). The D. melanogaster E10 construct (mel_E10)drove expression in dorsal cells beginning at stage 12–13 (Fig. 2a, c).
1Howard Hughes Medical Institute and Department of Ecology and Evolutionary Biology, Princeton University, Princeton, New Jersey 08544, USA. 2Institut fur Populationsgenetik, VeterinarmedizinischeUniversitat Wien, A-1210 Vienna, Austria. 3Universite de Toulouse and Centre National de la Recherche Scientifique, Centre de Biologie du Developpement, UMR5547, Toulouse, F-31062, France.*These authors contributed equally to this work.
5 9 8 | N A T U R E | V O L 4 7 4 | 3 0 J U N E 2 0 1 1
Macmillan Publishers Limited. All rights reserved©2011

This pattern strengthened and spread to more lateral cells in later stages(Fig. 2e, g). In stage 16 embryos, mel_E10 expression persisted in manydorsal and lateral cells (Fig. 2i), while endogenous svb messenger RNAis not present at this stage (data not shown). These constructs thereforeproduce artificially high levels of mRNA in late-stage embryos. Thisexperimental artefact allowed discovery of the surprising fact that,whereas the D. sechellia E10 (sec_E10) does not drive expression beforestage 14 (Fig. 2b, d, f), it does drive expression in quaternary cells in late-stage embryos (Fig. 2h, j), albeit at a much lower level than doesmel_E10. In a separate set of experiments, we confirmed that the D.sechellia E6 region indeed drives this late dorsal expression (data notshown), indicating that it retains some weak and heterochronic expres-sion. In contrast, the ventral expression driven by sec_E10 matched thetiming and levels driven by mel_E10. These data therefore show thatconserved ventral expression and divergent dorsal expression of the E10regions from D. melanogaster and D. sechellia is correlated with thepatterns of trichomes produced by each species, further localizingevolutionary changes to within the E6 region.
The E6 enhancer evolved at an accelerated rateNext we attempted to identify the DNA changes that caused theevolutionary shift in E6 function. We compared the sequences of
the E6 region between D. sechellia and five closely related species,all of which, like D. melanogaster, produce a dense lawn of quaternarytrichomes. Multiple sequence alignment allowed us to identifythirteen substitutions and one single-nucleotide deletion that areunique to D. sechellia (Fig. 3a, b and Supplementary Fig. 2). TheseD. sechellia-specific substitutions are located in a region of , 500 bp(the ‘focal region’) of otherwise high sequence conservation, even inD. sechellia (Fig. 3a).
Given the functional importance of E6, we examined whether thisapparent clustering of substitutions within a highly conserved blockrepresented an unusual substitution rate. We sequenced the E6 focalregion from eight additional isolates of D. sechellia. All nine D. sechel-lia sequences were identical (data not shown), which is consistentwith the low levels of polymorphism detected in other regions ofthe D. sechellia genome27,28. The absence of polymorphism in the E6region in D. sechellia prevented us from using common tests of selec-tion that rely on allele frequencies29. Instead, we analysed substitutionrates in the D. sechellia and D. simulans lineages, using D. melano-gaster as an outgroup30. We observed a significant increase in D. sechelliadivergence, compared to D. simulans, in the focal region of E6 (Fig. 3c;Tajima’s relative rate test, x2 5 6.25, P 5 0.012, 503 alignable bases). Todetermine whether this pattern of accelerated divergence reflects sim-ply an accelerated evolutionary rate of substitution at this genomiclocus in D. sechellia, we sequenced ,9,000 bp of DNA flanking thefocal region, which does not include any of the other evolved enhan-cers, both from D. sechellia and from D. simulans. The ,9,000 bpregion has not evolved at significantly different rates in the two lineages(Fig. 3d; Tajima’s relative rate test, x2 5 0.56, P 5 0.45, 7,072 alignable
Ptp4E SIP3
5 kb
1 kb
7EAZ
DG2 DG3
g
f
h
CG12680 svb/ovo
E6E3
E6
E10
i
E3
e
d
b c
a
E
Figure 1 | The pattern of trichomes has evolved between Drosophila speciesowing to changes in the enhancers of the svb gene. a, Lateral view drawing ofa first instar larva of D. melanogaster. The rectangle indicates the region shownin b and c. b, c, The pattern of dorsolateral trichomes on the fourth abdominalsegment of D. melanogaster (b) and D. sechellia (c). Some of the dorsolateralcells differentiate thin ‘quaternary’ trichomes in D. melanogaster and nakedcuticle in D. sechellia. d, e, Pattern of svb RNA expression in stage 14 embryos ofD. melanogaster (d) and D. sechellia (e). f, Diagram illustrating the location ofthe six enhancers of svb (open boxes). The enhancers 7, E and A were referred toas proximal, medial and distal, respectively, in ref. 25. Genes in the region areindicated with grey boxes and only the first exon of svb is shown. g, Summary ofthe dissection of the E enhancer in D. melanogaster. Boxes indicate theenhancer constructs discussed in the text. h, The E3 region drives expression inventral stripes. i, The E6 region drives expression in quaternary cells.
a
D. melanogaster E10
St. 12
St. 13
St. 14
St. 15
b
c d
e f
g h
i j
D. sechellia E10
St. 16
St. 12
St. 13
St. 14
St. 15
St. 16
Figure 2 | D. sechellia E6 shows decreased and delayed expression relative toD. melanogaster E6. a, c, e, g, i, The D. melanogaster E10 construct drivesexpression that is detected first in the most dorsal cells of stage (St.) 12 embryos(a). This expression strengthens and spreads laterally through stages 13 (c), 14(e), 15 (g) and 16 (i). b, d, The D. sechellia E10 construct does not drivedetectable expression in stage 12 (b) or 13 (d) embryos. f, h, j, Dorsal expression(white arrows) is detected in only some stage 14 embryos (f) and is clearlyobservable in stage 15 and 16 embryos (h, j). e, f, Both the D. melanogaster andD. sechellia E10 constructs drive similar expression in ventral cells (blackarrows).
ARTICLE RESEARCH
3 0 J U N E 2 0 1 1 | V O L 4 7 4 | N A T U R E | 5 9 9
Macmillan Publishers Limited. All rights reserved©2011

bases). In the D. sechellia lineage, the focal region experienced asignificantly higher substitution rate (4.8 times higher) than did theflanking regions (Fisher’s exact test, two-tailed P 5 0.016). Therefore,when compared to neighbouring regions, the focal region of E6 evolvedat a faster rate in the D. sechellia lineage, indicating that it has evolvedunder positive selection31, or relaxed constraints32, or both.
Substitutions in E6 altered enhancer functionTo assay the effect of the D. sechellia-specific substitutions in E6 onenhancer activity, we introduced all of these substitutions intomel_E10. We also performed the reciprocal experiment by reversingthe D. sechellia-specific substitutions to the D. melanogaster sequencein sec_E10. To enable trichome rescue experiments, the mutated E10versions were placed upstream of a svb complementary DNA thatcontained a heterologous tag in the 39 untranslated region (UTR),which allowed us to differentiate expression driven by the transgenefrom expression driven by the endogenous svb gene.
In stage 14 embryos, the D. melanogaster E10 construct carrying all ofthe D. sechellia-specific substitutions (mel_mut_All) drove substantiallyweaker expression in quaternary cells than did mel_E10 (Fig. 4a, c).Conversely, the D. sechellia E10 carrying all of the ‘reverse’ substitutionsto the D. melanogaster state (sec_mut_All) drove substantially strongerdorsal expression than did sec_E10 (Fig. 4b, d). These mani-pulated enhancers did not perfectly reproduce the temporal andspatial differences between mel_E10 and sec_E10 (Fig. 4), indicating
that at least one other substitution in E10 contributed to the functionaldivergence of these enhancers. All together, these results confirm thatat least one of the D. sechellia-specific substitutions in the E6 regioncaused most of the species difference in E6 function.
Many substitutions caused morphological evolutionNext we asked which of the D. sechellia-specific substitutions causedthe altered function of E6 in D. sechellia. As the D. sechellia-specificsubstitutions in the E6 enhancer appeared to be clustered in sevenregions (Fig. 3a), we mutated separately these seven clusters of nucleo-tides (Fig. 3b) from the D. melanogaster to the D. sechellia sequence inmel_E10. We also performed the reverse experiment, separately mut-ating each of seven clusters from the D. sechellia to the D. melanogastersequence in sec_E10. Some of the D. melanogaster constructs withindividual mutated clusters showed weaker lateral expression in stage14 embryos than mel_E10 did (data not shown). Quantification of the
TAATTTATAATTTATAACTTA
TTTGCTACAGCTGCTTCGTTGCAGCTGCTTCATTGCAATTGC
CATTAGGCCCATTAGGCCCAT-AATTA
TGGACAAGAGAATAGCCGTTAGTTAGTTGGACAAGAGAATAGCCGTTAGTTAGTTGGCCAAGAGAATAGCCGTTAGCCAGT
ATGCGTGGACAATGCGTGGACAATGTGTGTACA
GAAGAAAGAGGAAAGAGAAAA
GTCGCTACTGGCGACAGCAAAGCGGAGTGTCCCATATGTG-CGCCAGTAGCGACAGCAAAGTGGAGTGTCTCATACGTG-CACCAGTAGCGACAGCACAGTGGAGTGTCTCATCCGT
183 246 346 388
689591452
melsimsec
melsimsec
a
b
c
d
mut_1 mut_2 mut_3 mut_4
mut_5 mut_6 mut_7
D. melanogaster D. simulans
D. sechellia
D. simulans
D. sechellia
D. melanogaster
0.007
0.009
0.048 0.005
0.027
0.013
0.014
0.042
1 6 75
Focal region432
100%
0%
1,0079008007006005004003002001001
Figure 3 | Sequence conservation of the E6 region and location of the D.sechellia-specific substitutions. a, The aligned E6 sequences from D.melanogaster, D. simulans, D. mauritiana, D. sechellia, D. yakuba and D.erecta are represented as thick horizontal lines, with thin regions indicatinggaps in the alignments. (Full alignment is provided in Supplementary Fig. 2.)Sequence conservation over a 10-bp sliding window is represented above bythe height of the grey bars. The positions of D. sechellia-specific substitutionsare indicated with vertical red lines, the seven clusters of substitutions areindicated below the red lines, and the ‘focal region’ is labelled. b, Sequences ofthe seven regions containing the D. sechellia-specific substitutions (enclosed inrectangles) with the aligned sequences from D. melanogaster (mel), D.simulans (sim) and D. sechellia (sec). c, d, Evolutionary trees of the E6 focalregion (c) and 9 kb outside of the focal region (d), where branch lengths areproportional to the substitution rate. Numbers indicate number ofsubstitutions per site on average.
mel_E10sec_E10mel_mut_Allsec_mut_Allmel_mut_1mel_mut_2mel_mut_3mel_mut_4mel_mut_5mel_mut_6mel_mut_7sec_mut_1sec_mut_2sec_mut_3sec_mut_4sec_mut_5sec_mut_6sec_mut_7
mel_mut_All
Embryonic stage
Pro
por
tion
of e
mb
ryos
sho
win
g s
tain
ing
11 12 13 14 15 16
sec_mut_All
emel_E10Strain sec_E10
******
NS
NSNS*
NS*
NSNSNS
*********
****
c d
a b
mel_E10 sec_E10
Figure 4 | Evolutionary engineering of the E10 enhancer reveals the role ofevolved substitutions in altering the levels and timing of expression.a, b, Reporter gene expression driven by the D. melanogaster E10 (a) and D.sechellia E10 (b) constructs in stage 14 D. melanogaster embryos. c, Introducingall seven clusters of D. sechellia-specific substitutions into a mel_E10 construct(mel_mut_All) strongly reduces dorsal expression in stage 14 embryos.d, Introducing the respective D. melanogaster nucleotides into a sec_E10construct (sec_mut_All) almost completely restores dorsolateral expression instage 14 embryos. e, The onset of expression driven by the E10 and mutenhancers was quantified by counting the proportion of embryos showingdorsolateral expression at each of six embryonic stages. The mel_mut_All andsec_mut_All show strong changes in the onset of expression compared with therespective wild-type constructs. Five of the D. melanogaster mut lines also showdelayed onset of expression compared with the mel_E10 construct. Two of thesec_mut lines show significant differences in the onset of expression comparedwith sec_E10. The E10 and mut_All comparisons were made at stage 13 and theindividual cluster mel_mut and sec_mut comparisons were made at stages 12and 14, respectively. Sequential Bonferroni test P values: *P , 0.05, **P , 0.01.NS, not significant.
RESEARCH ARTICLE
6 0 0 | N A T U R E | V O L 4 7 4 | 3 0 J U N E 2 0 1 1
Macmillan Publishers Limited. All rights reserved©2011

onset of expression revealed further that five of seven of the D. mela-nogaster mutated enhancers drove significantly delayed expressionwhen compared to mel_E10 (Fig. 4e and Supplementary Table 1). Inthe reciprocal experiments, some sec_E10 constructs with clusters of D.melanogaster substitutions drove slightly stronger dorsolateralexpression in quaternary cells than did sec_E10 (data not shown).Some of these sec_mut constructs drove a significantly altered onsetof expression than did sec_E10, but these differences were not of largemagnitude (Fig. 4e and Supplementary Table 1). Most importantly, nosingle cluster of substitutions in either direction recapitulated the tem-poral onset of expression observed when all substitutions were intro-duced together (Fig. 4e).
These results indicate that at least five of the D. sechellia-specificsubstitutions in the E6 region contributed to the functional divergenceof this enhancer. We therefore quantified the ability of these con-structs to rescue trichomes in an embryo that lacked endogenoussvb activity (Fig. 5). We tested first whether mel_E10 and sec_E10could rescue the production of trichomes with normal morphologyin the correct spatial domains (Fig. 5a–c, i). mel_E10 rescued many,but not all, of the quaternary trichomes (Fig. 5c, m, n) and recoveredmany ventral trichomes (Supplementary Fig. 3). The incomplete res-cue of both dorsal and ventral trichomes was expected, because mul-tiple svb enhancers together contribute to the complete pattern of svbexpression26. sec_E10 rescued ventral trichomes as well as mel_E10did (Supplementary Fig. 3), but recovered only a few dorsal trichomes(Fig. 5i, m), consistent with the conserved and evolved functions ofE10. Therefore, this rescue assay provides a reliable readout of thenormal function of svb enhancers.
Because the D. sechellia-specific substitutions in E6 are sufficient toalmost completely recapitulate the differences in expression patternsbetween the species, we asked whether these changes were sufficient to
modify trichome patterning. Introduction of all of the D. sechellia-specific substitutions from E6 into mel_E10, mel_mut_All, causedlarvae to produce many fewer trichomes than did mel_E10, and thusto look more like D. sechellia (Fig. 5d, m, n). Conversely, larvaecarrying the reversed substitutions in a D. sechellia background(sec_mut_All) looked more like D. melanogaster larvae (Fig. 5l, m).
To determine how many substitutions cause this species differencein enhancer activity, we tested whether each cluster of substitutionsinfluenced trichome patterns. In mel_mut_2, mel_mut_3, mel_mut_4and mel_mut_5, the D. melanogaster to D. sechellia substitutionsreduced the number of trichomes produced by 4.6–33.5% (Fig. 5e–h, m, n and Supplementary Table 3). In contrast, in only sec_mut_2and sec_mut_3 did the D. sechellia to D. melanogaster substitutionsincrease the number of trichomes by 9.9–14.6% (Fig. 5j, k, m, n andSupplementary Table 3).
Larvae carrying mel_mut_All differentiated significantly more tri-chomes than did larvae carrying sec_E10. The opposite is also true;sec_mut_All did not rescue as many trichomes as did mel_E10. Thus,additional substitutions within E10, other than those we tested, mightalso have contributed to the morphological difference between D.melanogaster and D. sechellia.
The functional rescue experiments show that at least four clusters ofsubstitutions in E6 can alter trichome patterning on their own. Both theonset of expression data and the trichome rescue data indicate that theD. sechellia-specific substitutions show epistasis with respect to eachother and with respect to the remaining E10 sequence. Indeed, themagnitude of the effect of mutating all seven clusters of substitutionstogether on trichome patterning is not recapitulated by summing upthe effects of all clusters acting alone (Fig. 5m, n and SupplementaryTable 3). The impact of each substitution on larval morphology is thuspartly dependent on which other substitutions are already present.
Num
ber
of
dor
sal t
richo
mes
140m
120
100
80
60
40
20
0E10 1 2 3 4 5 7 All
0
20
40
Num
ber
of
late
ral t
richo
mes
30
10
6
50
60
mel_mut_All sec_E10mel_E10
n
mel_mut_2 mel_mut_3 mel_mut_4 mel_mut_5 sec_mut_Allmel
a
sec_mut_3sec_mut_2svb null
b c d e f g h i j k l
mutE10 1 2 3 4 5 7 All6
mut
D
L
Figure 5 | Effect of the engineered substitutions on trichome rescue indorsal and lateral regions of the sixth abdominal segment of first instarlarvae. a, Wild-type D. melanogaster. b, svb null. c, mel_E10 in a svb nullbackground. The dorsal (D) and lateral (L) regions where trichomes werecounted are delimited with a dashed line. d–h, mel_E10 constructs carrying allD. sechellia substitutions (d), or cluster 2 (e), 3 (f), 4 (g), or 5 (h) substitutions ina svb null background. i, mel_E10 in a svb null background. j–l, sec_E10constructs carrying cluster 2 (e), 3 (f), or all D. melanogaster substitutions
(l). m, n, Number of trichomes rescued by the mel (black) and sec (red)constructs in the dorsal (m) and lateral (n) regions. All larvae carrying sec_mutconstructs differentiated zero trichomes in the lateral region, and for claritythese data are not shown in n. Open circles represent counts for each individual.Closed circles and lines indicate the means and standard deviations,respectively. Grey shading encompasses the constructs with trichome countsthat were significantly different from the E10 construct of the respective species(P , 0.05, Dunnet’s test).
ARTICLE RESEARCH
3 0 J U N E 2 0 1 1 | V O L 4 7 4 | N A T U R E | 6 0 1
Macmillan Publishers Limited. All rights reserved©2011

Note that there is not perfect congruence between the analysis ofgene expression patterns and the functional readout of trichomenumber. For example, mel_mut_6 altered expression timing, butnot trichome number. This suggests that subtle expression differencesmay not always correctly predict the effects of genetic changes onmorphological evolution.
DiscussionWe have identified molecular changes in a cis-regulatory region thatcontributed to a morphological difference between closely relatedspecies. We found that, taken individually, each genetic change in atranscriptional enhancer had a relatively small effect on gene expres-sion and on the final phenotype, but that when they were combined,they produced a large morphological difference. The substitutionsthat contributed to morphological evolution showed substantial epis-tasis, both with respect to the background E10 construct and withrespect to the other substitutions in E6. It is impossible to know theactual order in which these substitutions occurred nor whether all ofthe mutations went to fixation independently or whether some co-segregated. Thus we focused on the effects of individual clusters ofsubstitutions in the background of the parental species.
Our results indicate that at least five substitutions in the E10region—at least four in the mutated clusters and at least one othersite—contributed to altered function of the E6 enhancer in D. sechel-lia. Similarly, a study of pigmentation differences among D. melano-gaster populations showed that multiple polymorphisms of smalleffect in enhancers of the gene ebony account for large phenotypicdifferences10. We propose that enhancer structure influences the pat-terns of genetic change. When the function of a cis-regulatory modulerelies on multiple transcription-factor-binding sites, each with a smalleffect on expression, evolution may require changes of a large numberof such sites to cause a significant phenotypic change.
Detecting the action of natural selection on specific non-codinggenomic regions remains a major challenge for evolutionary gen-etics33–35. The accelerated substitution rate that we observed in theD. sechellia E6 focal region indicates that this region experiencedeither positive selection36, relaxation of purifying selection37, or both.In addition, none of the D. melanogaster to D. sechellia mutations ledto a significant increase in trichome number, and none of the recip-rocal mutations led to a decrease in trichome number. That is, alongthe lineage leading to D. sechellia, the E6 enhancer seems to haveaccumulated only substitutions that decrease trichome number.These observations also are consistent with the action of directionalselection36, unless random mutations in this enhancer preferentiallycause loss of expression.
When we reverted the D. sechellia-specific substitutions to theancestral state, the D. sechellia E10 construct regained most of thefunctionality present in the D. melanogaster E10 construct. Thus, inprinciple, descendants of modern D. sechellia could re-evolve at leastsome trichomes through the accumulation of single-nucleotide sub-stitutions in an existing enhancer. Our results contrast with otherrecent studies of cis-regulatory evolution that have discovered largedeletions in transcriptional enhancers9. For example, the wholesaledeletion of an enhancer caused the loss of pelvic structures in somestickleback populations11. Although this is a striking result, large dele-tions may contribute to morphological evolution only rarely. Forexample, enhancer deletions may have deleterious pleiotropic effects,because many single enhancer ‘modules’ in fact encode expression inmultiple domains1,38–40. In addition, new expression patterns maysometimes evolve through modification of existing enhancers21,41,42.Widespread deletion of cis-regulatory DNA may thus reduce theevolutionary potential of existing enhancers. It is worth noting thatthe stickleback populations with different pelvic structures divergedless than 10,000 years ago11. Our study focuses on morphologicaldifferences between species that diverged approximately 500,000years ago. The markedly different genetic architecture discovered in
these two cases may indicate that different kinds of mutations areselected over different evolutionary timescales2
Our results suggest an additional explanation for the predominanceof single-nucleotide substitutions that have altered E6 function. Someconstructs carrying large deletions of the E6 element generatedectopic expression (Supplementary Fig. 1). This may be a generalfeature of enhancers that require multiple activation and repressiveactivities to define a precise spatiotemporal pattern of expression43,44.In such cases, large insertions or deletions may result in ectopicexpression and, potentially, in dominant pleiotropic effects. In con-trast, single-nucleotide substitutions within activator and repressorbinding sites may result in subtle changes in expression with minimalpleiotropic effects. For example, substitutions that lead to hetero-chrony in enhancer activity can modify a transcriptional programwithout deleterious effects on development. Such a heterochronicshift in enhancer activity could result from either downregulationof enhancer activity or from a temporal delay in the initiation ofenhancer activation. Either or both kinds of events may have occurredin the D. sechellia lineage.
METHODS SUMMARYEmbryos were collected and fixed using standard conditions and b-galactosidaseexpression was detected with immunohistochemistry using a rabbit anti-b-galactosidase antibody (Cappel) used at 1:2,000 and an anti-rabbit antibodycoupled to HRP (Santa Cruz Biotech), also used at 1:2,000. Staining wasdeveloped with DAB/Nickel.
To detect the expression of transgenic svb transcripts, we made an RNA probecomplementary to the lacZ and SV40 sequence in the 39 UTR of the svb cDNAusing the Dig RNA labelling kit (Roche). We tested for heterochronic changes inthe onset of transgene expression by comparing the proportion of embryos show-ing staining between constructs at a single stage. We then tested for differences inthe proportions of stained embryos with the Barnard test using a sequentialBonferroni correction for multiple tests.
For trichome rescue experiments, we cloned D. melanogaster and D. sechelliaE10 into pRSQsvb26. Mutant plasmids were generated using site-directed muta-genesis (Genescript USA). Constructs were integrated into the attP site of lineM(33P3-RFP.attP)ZH- 86Fb; M(vas-int.Dm)ZH-2A. Males homozygous for thetransgene were crossed to svb2/FM7c;twi::GFP females. Non-fluorescent firstinstar larvae from this cross were mounted on a microscope slide in a drop ofHoyer’s:lactic acid (1:1). Cleared cuticles were imaged with phase-contrast micro-scopy. Dorsal and lateral regions were defined using morphological landmarksand programmed as macros in ImageJ software45. Trichomes were counted usingthe cell-counter option of ImageJ. We performed pairwise comparisons of trich-ome numbers between the wild-type construct and each mutated construct andthe statistical significance of comparisons was determined with Dunnet’s test. Fulldetails of methods used can be found in Supplementary Information.
Received 4 February; accepted 13 May 2011.
1. Monteiro, A. & Podlaha, O. Wings, horns, and butterfly eyespots: how do complextraits evolve? PLoS Biol. 7, e37 (2009).
2. Stern, D. L. Evolution, Development, & The Predictable Genome (Roberts & Co.,2010).
3. Stern, D. L. & Orgogozo, V. The loci of evolution: how predictable is geneticevolution? Evolution 62, 2155–2177 (2008).
4. Carroll, S. B. Evo-devo and an expanding evolutionary synthesis: a genetic theoryof morphological evolution. Cell 134, 25–36 (2008).
5. Erezyilmaz, D. F., Riddiford, L. M. & Truman, J. W. The pupal specifier broad directsprogressive morphogenesis in a direct-developing insect. Proc. Natl Acad. Sci. USA103, 6925–6930 (2006).
6. Davidson, E. H. The Regulatory Genome: Gene Regulatory Networks in Developmentand Evolution (Academic, 2006).
7. Carroll, S. B., Grenier, J. K. & Weatherbee, S. D. From DNA to Diversity: MolecularGenetics and the Evolution of Animal Design (Blackwell Science, 2001).
8. Wilkins, A. S. The Evolution of Developmental Pathways (Sinauer Associates, 2002).9. Jeong, S. et al. The evolution of gene regulation underlies a morphological
difference between two Drosophila sister species. Cell 132, 783–793 (2008).10. Rebeiz, M., Pool, J. E., Kassner, V. A., Aquadro, C. F. & Carroll, S. B. Stepwise
modification of a modular enhancer underlies adaptation in a Drosophilapopulation. Science 326, 1663–1667 (2009).
11. Chan, Y. F. et al. Adaptive evolution of pelvic reduction in sticklebacks by recurrentdeletion of a Pitx1 enhancer. Science 327, 302–305 (2010).
12. Nadeau, N. J. & Jiggins, C. D. A golden age for evolutionary genetics? Genomicstudies of adaptation in natural populations. Trends Genet. 26, 484–492 (2010).
RESEARCH ARTICLE
6 0 2 | N A T U R E | V O L 4 7 4 | 3 0 J U N E 2 0 1 1
Macmillan Publishers Limited. All rights reserved©2011

13. Phillips, P. C. Epistasis—the essential role of gene interactions in the structure andevolution of genetic systems. Nature Rev. Genet. 9, 855–867 (2008).
14. Gerke, J., Lorenz, K. & Cohen, B. Genetic interactions between transcription factorscause natural variation in yeast. Science 323, 498–501 (2009).
15. Weinreich, D. M., Watson, R. A. & Chao, L. Perspective: sign epistasis and geneticconstraint on evolutionary trajectories. Evolution 59, 1165–1174 (2005).
16. Carroll, S. B. Homeotic genes and the evolution of arthropods and chordates.Nature 376, 479–485 (1995).
17. Akam, M. Hox genes, homeosis and the evolution of segment identity: no need forhopeless monsters. Int. J. Dev. Biol. 42, 445–451 (1998).
18. Stern, D. L. Perspective: evolutionary developmental biology and the problem ofvariation. Evolution 54, 1079–1091 (2000).
19. Wray, G. A. et al. The evolution of transcriptional regulation in eukaryotes. Mol. Biol.Evol. 20, 1377–1419 (2003).
20. Ludwig, M. Z. et al. Functional evolution of a cis-regulatory module. PLoS Biol. 3,e93 (2005).
21. Gompel, N., Prud’homme, B., Wittkopp, P. J., Kassner, V. A. & Carroll, S. B. Chancecaught on the wing: cis-regulatory evolution and the origin of pigment patterns inDrosophila. Nature 433, 481–487 (2005).
22. Sucena, E. & Stern, D. L. Divergence of larval morphology between Drosophilasechellia and its sibling species caused by cis-regulatory evolution of ovo/shaven-baby. Proc. Natl Acad. Sci. USA 97, 4530–4534 (2000).
23. Chanut-Delalande, H., Fernandes, I., Roch, F., Payre, F. & Plaza, S. Shavenbabycouples patterning to epidermal cell shape control. PLoS Biol. 4, e290 (2006).
24. Payre, F., Vincent, A. & Carreno, S. ovo/svb integrates Wingless and DER pathwaysto control epidermis differentiation. Nature 400, 271–275 (1999).
25. McGregor, A. P. et al. Morphological evolution through multiple cis-regulatorymutations at a single gene. Nature 448, 587–590 (2007).
26. Frankel, N. et al. Phenotypic robustness conferred by apparently redundanttranscriptional enhancers. Nature 466, 490–493 (2010).
27. Kliman, R. M. et al. The population genetics of the origin and divergence of theDrosophila simulans complex species. Genetics 156, 1913–1931 (2000).
28. Legrand, D. et al. Species-wide genetic variation and demographic history ofDrosophila sechellia, a species lacking population structure. Genetics 182,1197–1206 (2009).
29. Nielsen, R. Molecular signatures of natural selection. Annu. Rev. Genet. 39,197–218 (2005).
30. Tajima, F. Simplemethods for testing themolecular evolutionary clock hypothesis.Genetics 135, 599–607 (1993).
31. Endo, T., Ikeo, K. & Gojobori, T. Large-scale search for genes on which positiveselection may operate. Mol. Biol. Evol. 13, 685–690 (1996).
32. Baines, J. F., Chen, Y.,Das, A. & Stephan, W.DNAsequence variation at a duplicatedgene: excess of replacement polymorphism and extensive haplotype structure inthe Drosophila melanogaster bicoid region. Mol. Biol. Evol. 19, 989–998 (2002).
33. Andolfatto, P. Adaptive evolution of non-coding DNA in Drosophila. Nature 437,1149–1152 (2005).
34. Haygood, R., Babbitt, C. C., Fedrigo, O. & Wray, G. A. Contrasts between adaptivecoding and noncoding changes during human evolution. Proc. Natl Acad. Sci. USA107, 7853–7857 (2010).
35. Moses, A. M. Statistical tests for natural selection on regulatory regions based onthe strength of transcription factor binding sites. BMC Evol. Biol. 9, 286 (2009).
36. Orr, H. A. Testing natural selection vs. genetic drift in phenotypic evolution usingquantitative trait locus data. Genetics 149, 2099–2104 (1998).
37. Casillas, S., Barbadilla, A. & Bergman, C. M. Purifying selection maintains highlyconserved noncoding sequences in Drosophila. Mol. Biol. Evol. 24, 2222–2234(2007).
38. Swanson, C. I., Evans, N. C. & Barolo, S. Structural rules and complex regulatorycircuitry constrain expression of a Notch- and EGFR-regulated eye enhancer. Dev.Cell 18, 359–370 (2010).
39. Klingler, M., Soong, J., Butler, B. & Gergen, J. P. Disperse versus compact elementsfor the regulation of runt stripes in Drosophila. Dev. Biol. 177, 73–84 (1996).
40. Howard, K. R. & Struhl, G. Decoding positional information: regulation of the pair-rule gene hairy. Development 110, 1223–1231 (1990).
41. Wittkopp, P. J. Evolution of cis-regulatory sequence and function in Diptera.Heredity 97, 139–147 (2006).
42. Williams, T. M. et al. The regulation and evolution of a genetic switch controllingsexually dimorphic traits in Drosophila. Cell 134, 610–623 (2008).
43. Yuh, C.-H., Bolouri, H. & Davidson, E. H. Genomic cis-regulatory logic: experimentaland computational analysis of a sea urchingene. Science279,1896–1902 (1998).
44. Small, S., Blair, A. & Levine, M.Regulation of even-skipped stripe 2 in theDrosophilaembryo. EMBO J. 11, 4047–4057 (1992).
45. Rasband, W. S. ImageJ Æhttp://imagej.nih.gov/ij/æ (United States NationalInstitutes of Health, 1997–2011).
Supplementary Information is linked to the online version of the paper atwww.nature.com/nature.
Acknowledgements We thank G. Davis, P. Parikh and P. Valenti for assistance withcloning and the Drosophila Species Stock Center for fly stocks. This work was supportedby the Pew Charitable Trusts Latin American Fellows Program in the BiomedicalSciences Fellowship to N.F., a Ruth L. Kirschstein National Research Service Award toD.F.E. (F32 GM 83546-02), Agence Nationale de la Recherche (Blanc 2008,Netoshape) to F.P., and NIH (GM063622-06A1) and NSF (IOS-0640339) grants toD.L.S.
Author Contributions N.F., D.F.E., A.P.M. and D.L.S. designed the experiments andanalysed the data. N.F., D.F.E., A.P.M., S.W. and F.P. performed the experimental work.N.F. and D.L.S. wrote the manuscript. D.F.E., A.P.M. and F.P. commented on themanuscript at all stages.
Author Information Reprints and permissions information is available atwww.nature.com/reprints. The authors declare no competing financial interests.Readers are welcome to comment on the online version of this article atwww.nature.com/nature. Correspondence and requests for materials should beaddressed to D.L.S. ([email protected]).
ARTICLE RESEARCH
3 0 J U N E 2 0 1 1 | V O L 4 7 4 | N A T U R E | 6 0 3
Macmillan Publishers Limited. All rights reserved©2011
Copyright © 2022 FDOKUMEN