Monthly average daily solar radiation and clearness index contour maps over Oman
15
Monthly average daily solar radiation and clearness index contour maps over Oman Ali Al-Lawati a,1 , Atsu S.S. Dorvlo b, * , Joseph A. Jervase a,1 a Department of Information Engineering, College of Engineering, Sultan Qaboos University, P.O. Box 33, Al-Khod, Muscat 123, Oman b Department of Mathematics and Statistics, College of Science, Sultan Qaboos University, P.O. Box 36, Al-Khod, Muscat 123, Oman Received 20 October 2001; accepted 20 March 2002 Abstract Using meteorological data spanning more than ten years in Oman, radial basis function neural networks were developed for estimation of the solar radiation and clearness index for any location in Oman, given its longitude, latitude, altitude, sunshine hours and month of the year. Data generated for 25 different loca- tions were then used to plot contour maps for monthly average daily solar radiation and clearness index over Oman. These maps will serve as a much needed reference for design and performance evaluation of solar energy conversion systems in this region. Ó 2002 Elsevier Science Ltd. All rights reserved. Keywords: Clearness index; Neural network; Radial basis function; Regression model; Solar radiation 1. Introduction A pre-requisite for design and performance evaluation of solar energy conversion systems is the availability of solar radiation data [1,2]. As a consequence of the cost involved in the purchase and maintenance of global radiation measuring equipment, many locations worldwide lack this facility [2]. To circumvent this problem, solar radiation is estimated from the number of sunshine hours Energy Conversion and Management 44 (2003) 691–705 www.elsevier.com/locate/enconman * Corresponding author: Tel.: +968-515-411; fax: +968-513-415. E-mail addresses: [email protected] (A. Al-Lawati), [email protected] (A.S.S. Dorvlo), [email protected] (J.A. Jervase). 1 Fax: +968-514-023. 0196-8904/02/$ - see front matter Ó 2002 Elsevier Science Ltd. All rights reserved. PII:S0196-8904(02)00080-8
-
Upload
independent -
Category
Documents
-
view
0 -
download
0
Transcript of Monthly average daily solar radiation and clearness index contour maps over Oman

Monthly average daily solar radiation and clearnessindex contour maps over Oman
Ali Al-Lawati a,1, Atsu S.S. Dorvlo b,*, Joseph A. Jervase a,1
a Department of Information Engineering, College of Engineering, Sultan Qaboos University,
P.O. Box 33, Al-Khod, Muscat 123, Omanb Department of Mathematics and Statistics, College of Science, Sultan Qaboos University,
P.O. Box 36, Al-Khod, Muscat 123, Oman
Received 20 October 2001; accepted 20 March 2002
Abstract
Using meteorological data spanning more than ten years in Oman, radial basis function neural networks
were developed for estimation of the solar radiation and clearness index for any location in Oman, given its
longitude, latitude, altitude, sunshine hours and month of the year. Data generated for 25 different loca-
tions were then used to plot contour maps for monthly average daily solar radiation and clearness index
over Oman. These maps will serve as a much needed reference for design and performance evaluation of
solar energy conversion systems in this region.
� 2002 Elsevier Science Ltd. All rights reserved.
Keywords: Clearness index; Neural network; Radial basis function; Regression model; Solar radiation
1. Introduction
A pre-requisite for design and performance evaluation of solar energy conversion systems is theavailability of solar radiation data [1,2]. As a consequence of the cost involved in the purchase andmaintenance of global radiation measuring equipment, many locations worldwide lack this facility[2]. To circumvent this problem, solar radiation is estimated from the number of sunshine hours
Energy Conversion and Management 44 (2003) 691–705www.elsevier.com/locate/enconman
*Corresponding author: Tel.: +968-515-411; fax: +968-513-415.
E-mail addresses: [email protected] (A. Al-Lawati), [email protected] (A.S.S. Dorvlo), [email protected]
(J.A. Jervase).1 Fax: +968-514-023.
0196-8904/02/$ - see front matter � 2002 Elsevier Science Ltd. All rights reserved.
PII: S0196-8904(02)00080-8

[3], for which data are usually more widely available [1]. A number of regression models have beenproposed in the literature for estimation of the solar radiation [1,3–8].
In this work, a class of artificial neural networks, ANNs, known as radial basis functions,RBFs, is used to estimate solar radiation and clearness index. ANNs may be considered asmultivariate nonlinear computational models that are capable of estimating nonlinear relation-ships between complex data [9–11]. The RBF networks in this paper are used first for determi-nation of the sunshine hours at 25 locations in Oman. This is then followed by an estimation ofthe clearness index and subsequently, computation of the solar radiation. Using the root meansquare error, RMSE, between the recorded and estimated values of the solar radiation, as ameasure, the RBF model prediction was shown to be better than the regression models whenapplied to these data. The RBF generated data are then used for plotting contour maps for solarradiation and clearness index.
2. Data
Table 1 shows the geographical details of the meteorological stations in Oman of which onlythe first eight, namely, Buraimi, Fahud, Marmul, Masirah, Salalah, Seeb, Sohar and Sur, had acomplete set of sunshine and solar radiation data for the period 1986–1998. The source of these
Table 1
Meteorological stations in Oman considered in the study
Location Latitude (�N) Longitude (�E) Elevation (m)
1 Buraimi 24.24 55.79 298.9
2 Fahud 22.35 56.49 170.0
3 Marmul 18.14 55.17 269.0
4 Masirah 20.67 58.91 18.8
5 Salalah 17.03 54.09 20.0
6 Seeb 23.58 58.29 8.4
7 Sohar 24.47 56.64 3.6
8 Sur 22.54 59.47 13.8
9 Khasab 26.21 56.24 3.1
10 Saiq 23.07 57.64 1754.9
11 Nizwa 22.86 57.54 459.5
12 Yalooni 19.95 57.12 153.6
13 Thumrait 17.67 54.02 466.9
14 Qairoon Hairiti 17.25 54.09 878.3
15 Mina Raysut 16.90 53.92 3.0
16 Diba 25.62 56.26 19.8
17 Rustaq 23.41 57.42 322.0
18 Samail 23.31 57.94 414.0
19 Rusayl 23.56 58.21 66.5
20 Mina Sultan Qaboos 23.63 58.57 4.1
21 Bahla 22.99 57.31 589.2
22 Adam 22.39 57.52 285.1
23 Ibra 22.74 58.51 469.2
24 Umm Zamaim 20.82 57.12 131.0
25 Mina Sultan Qaboos Buoy 23.68 58.54 0.0
692 A. Al-Lawati et al. / Energy Conversion and Management 44 (2003) 691–705

data is the Directorate General of Civil Aviation and Meteorology [12]. The long term monthlyaverage daily hours of bright sunshine, S, are given in Table 2. The sunshine ratio, S=S0, can becomputed from these values. Here, S0 is the monthly average maximum possible number of dailyhours of bright sunshine, i.e. the day length optimum sunshine hours, S0, averaged over a month.S0 is evaluated using the relationship [1]
S0 ¼2
15cos�1ð� tan/ tan dÞ ð1Þ
where d represents the declination, i.e. the angular position of the sun at solar noon and is givenby d ¼ 23:45 sinð360ðð284þ nÞ=365Þ (in degrees), / is the latitude of the location and n is the daynumber, for example n is one for the first of January.
The clearness index, H=H 0, is defined as the respective monthly mean daily values of the globaland extra terrestrial radiation on a horizontal surface. H is the average of the measured values ofthe global radiation, H. The extra terrestrial radiation, H0, can be evaluated using
H0 ¼24� 3600�Gsc
p1
�þ 0:033 cos
360n365
� ��cos/ cos d sinxs
hþ pxs
180sin/ sind
iJ=m2day
ð2Þ
where Gsc ¼ 1367 W/m2 is the solar constant, xs ¼ cos�1ð� tan/ tan dÞ, n, / and d are as definedearlier. Table 3 shows the recorded monthly mean daily solar radiation, H , for the eight mete-orological stations.
Table 2
Measured monthly average daily sunshine hours for eight meteorological stations
Location Jan Feb Mar Apr May Jun Jul Aug Sep Oct Nov Dec
1 Buraimi 8.63 8.65 9.29 10.55 11.83 12.26 12.09 11.55 11.03 10.44 9.83 8.7
2 Fahud 8.56 8.70 9.35 10.35 11.49 11.83 11.22 10.83 10.58 10.19 9.58 7.90
3 Marmul 9.28 9.64 10.17 10.60 11.16 10.46 9.88 10.33 10.59 10.29 9.59 9.29
4 Masirah 9.37 9.56 9.36 9.99 11.38 9.96 7.85 8.23 9.06 10.08 9.93 9.20
5 Salalah 9.57 9.28 9.36 10.24 11.05 6.61 1.87 1.35 5.65 10.21 9.96 9.55
6 Seeb 8.38 8.82 8.51 9.73 11.43 11.24 9.83 9.99 10.28 10.24 9.73 8.81
7 Sohar 8.21 8.61 8.10 9.43 11.05 10.76 8.91 8.88 9.51 9.82 9.57 8.54
8 Sur 8.53 9.19 8.58 10.06 11.16 10.97 8.79 9.43 9.95 10.11 9.82 8.81
Table 3
Measured average daily solar radiation in MJ/m2 day by month for eight meteorological stations in Oman
Location Jan Feb Mar Apr May Jun Jul Aug Sep Oct Nov Dec
1 Buraimi 14.36 16.58 19.07 22.12 24.60 23.79 21.32 21.84 21.48 19.04 15.58 13.49
2 Fahud 15.90 17.58 20.24 23.04 24.92 24.43 22.44 22.11 21.70 19.24 16.22 14.69
3 Marmul 19.18 21.84 23.83 25.29 25.24 22.56 21.12 22.60 23.90 22.66 19.90 17.95
4 Masirah 14.05 15.81 18.68 20.27 21.50 19.81 16.98 17.99 17.75 17.04 14.92 13.31
5 Salalah 15.59 16.60 18.85 20.27 20.91 17.99 12.28 10.58 15.19 17.92 16.16 14.88
6 Seeb 13.98 16.92 19.25 22.41 24.43 24.64 22.13 21.62 21.11 18.75 15.97 13.82
7 Sohar 14.38 18.27 19.63 24.75 27.59 27.29 24.65 24.07 23.10 19.69 16.09 14.59
8 Sur 11.89 13.31 15.37 17.46 18.53 17.66 15.86 16.40 15.94 15.06 13.02 11.19
A. Al-Lawati et al. / Energy Conversion and Management 44 (2003) 691–705 693
3. RBF model algorithm for solar radiation estimation
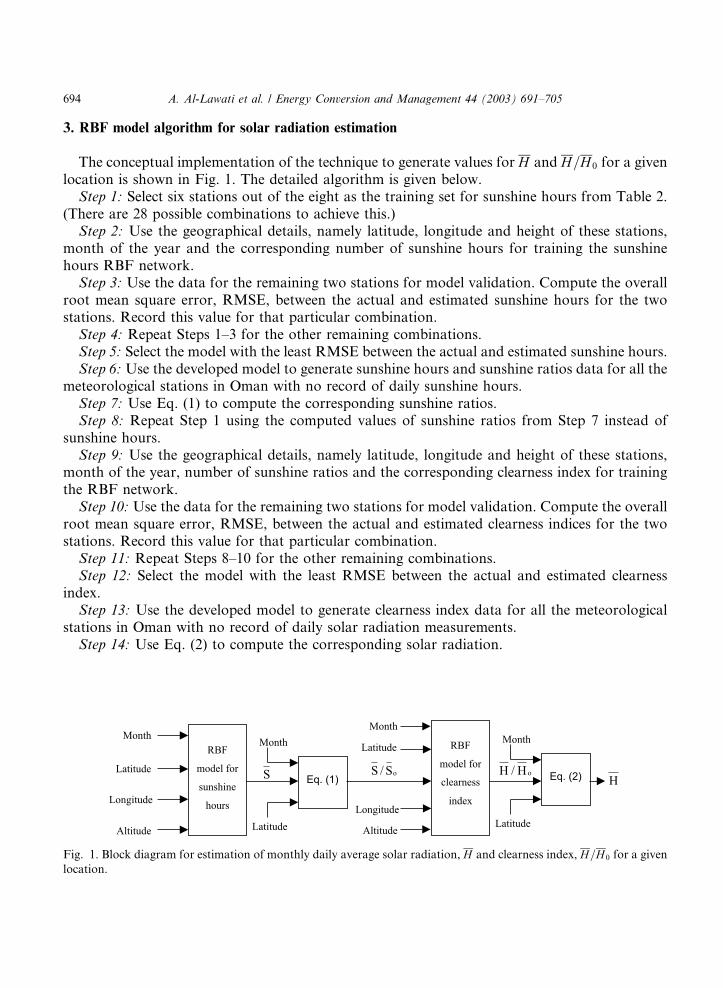
The conceptual implementation of the technique to generate values for H and H=H 0 for a givenlocation is shown in Fig. 1. The detailed algorithm is given below.Step 1: Select six stations out of the eight as the training set for sunshine hours from Table 2.
(There are 28 possible combinations to achieve this.)Step 2: Use the geographical details, namely latitude, longitude and height of these stations,
month of the year and the corresponding number of sunshine hours for training the sunshinehours RBF network.Step 3: Use the data for the remaining two stations for model validation. Compute the overall
root mean square error, RMSE, between the actual and estimated sunshine hours for the twostations. Record this value for that particular combination.Step 4: Repeat Steps 1–3 for the other remaining combinations.Step 5: Select the model with the least RMSE between the actual and estimated sunshine hours.Step 6: Use the developed model to generate sunshine hours and sunshine ratios data for all the
meteorological stations in Oman with no record of daily sunshine hours.Step 7: Use Eq. (1) to compute the corresponding sunshine ratios.Step 8: Repeat Step 1 using the computed values of sunshine ratios from Step 7 instead of
sunshine hours.Step 9: Use the geographical details, namely latitude, longitude and height of these stations,
month of the year, number of sunshine ratios and the corresponding clearness index for trainingthe RBF network.Step 10: Use the data for the remaining two stations for model validation. Compute the overall
root mean square error, RMSE, between the actual and estimated clearness indices for the twostations. Record this value for that particular combination.Step 11: Repeat Steps 8–10 for the other remaining combinations.Step 12: Select the model with the least RMSE between the actual and estimated clearness
index.Step 13: Use the developed model to generate clearness index data for all the meteorological
stations in Oman with no record of daily solar radiation measurements.Step 14: Use Eq. (2) to compute the corresponding solar radiation.
Fig. 1. Block diagram for estimation of monthly daily average solar radiation, H and clearness index, H=H 0 for a given
location.
694 A. Al-Lawati et al. / Energy Conversion and Management 44 (2003) 691–705

Step 15: Use the data in Steps 13 and 14 to generate contour maps to show the spatial variationof H and H=H 0 on a monthly basis over Oman.
We note that Steps 1–6 are needed for estimating the sunshine hours, which in turn are used forthe estimation of solar radiation in Steps 7–14.
4. Computations and results
Using the data in Table 2 for sunshine hours, the algorithm described above was followed forthe development of a RBF model for estimation of the sunshine hours for a location based on itslongitude, latitude, altitude and month of the year. The model adopted, based on minimumRMSE, was obtained using Buraimi, Fahud, Marmul, Masirah, Salalah and Sur data as thetraining set and Seeb and Sohar data for validation. This model was then used to generatesunshine hours data for all the meteorological stations shown in Table 1 on a monthly basis.These data are summarized in Table 4. With the aid of Eq. (1), the corresponding sunshine ratioswere computed. The outcome of these computations is given in Table 5. The sunshine ratio values
Table 4
Estimated monthly average daily sunshine hours for 25 meteorological stations
Location Jan Feb Mar Apr May Jun Jul Aug Sep Oct Nov Dec
Buraimi 8.63 8.65 9.29 10.56 11.81 12.30 12.05 11.56 11.04 10.43 9.83 8.97
Fahud 8.56 8.70 9.32 10.40 11.49 11.75 11.29 10.85 10.50 10.24 9.56 7.90
Marmul 9.28 9.64 10.18 10.60 11.16 10.47 9.88 10.33 10.59 10.29 9.59 9.29
Masirah 9.37 9.57 9.34 10.04 11.28 10.09 7.72 8.33 9.01 10.10 9.93 9.20
Salalah 9.57 9.28 9.36 10.24 11.05 6.61 1.87 1.35 5.65 10.21 9.96 9.55
Seeb 8.38 8.87 8.49 9.54 10.49 10.25 9.08 9.22 9.71 9.60 9.39 8.56
Sohar 8.38 8.51 8.46 8.81 9.12 9.08 8.76 8.75 8.85 8.81 8.70 8.35
Sur 8.53 9.18 8.61 9.98 11.30 10.79 8.97 9.28 10.03 10.07 9.83 8.80
Khasab 8.36 8.40 8.39 8.50 8.58 8.60 8.54 8.52 8.53 8.50 8.46 8.35
Saiq 8.38 8.38 8.38 8.38 8.38 8.38 8.38 8.38 8.38 8.38 8.38 8.38
Nizwa 8.40 8.41 8.46 8.58 8.70 8.74 8.72 8.68 8.63 8.57 8.52 8.46
Yalooni 8.80 8.89 9.24 9.78 10.46 10.14 9.41 9.37 9.43 9.67 9.25 8.35
Thumrait 8.44 8.47 8.50 8.53 8.56 8.52 8.48 8.52 8.53 8.51 8.46 8.44
Qairoon Hairiti 8.38 8.38 8.38 8.38 8.38 8.38 8.38 8.38 8.38 8.38 8.38 8.38
Mina Raysut 9.53 9.25 9.32 10.18 10.96 6.63 2.01 1.50 5.70 10.15 9.91 9.51
Diba 8.36 8.42 8.42 8.60 8.75 8.77 8.66 8.63 8.65 8.60 8.53 8.32
Rustaq 8.53 8.55 8.95 9.73 10.49 10.78 10.62 10.32 10.01 9.64 9.27 8.69
Samail 8.42 8.43 8.53 8.75 8.97 9.05 9.01 8.93 8.84 8.73 8.63 8.51
Rusayl 8.41 8.83 8.62 9.63 10.57 10.40 9.36 9.40 9.75 9.65 9.38 8.41
MSQ� 8.32 8.88 8.43 9.57 10.56 10.34 9.13 9.27 9.82 9.64 9.42 8.57
Bahla 8.38 8.38 8.38 8.38 8.39 8.39 8.39 8.39 8.38 8.38 8.38 8.38
Adam 8.54 8.60 9.03 9.80 10.56 10.81 10.61 10.32 10.02 9.69 9.26 8.48
Ibra 8.39 8.39 8.41 8.45 8.50 8.52 8.51 8.49 8.47 8.45 8.43 8.41
Umm Zamaim 8.80 8.89 9.25 9.94 10.80 10.51 9.62 9.53 9.56 9.84 9.39 8.22
MSQ� Buoy 8.32 8.86 8.42 9.53 10.48 10.28 9.12 9.25 9.78 9.59 9.39 8.56*Mina Sultan Qaboos.
A. Al-Lawati et al. / Energy Conversion and Management 44 (2003) 691–705 695
for the first eight stations (Buraimi, Fahud, Marmul, Masirah, Salalah, Seeb, Sohar and Sur), inaddition to their geographical details and month of the year, served as the input for developing aRBF model for estimation of the clearness index, as depicted in Fig. 1. The optimum model wasobtained using Fahud, Marmul, Masirah, Salalah, Seeb and Sur as the training set and Buraimiand Sohar as the testing set. The monthly average daily solar radiation was then evaluated usingEq. (2). The RMSE value for this optimum model was 0.89 MJ/m2 day using the testing set dataonly. Inclusion of the training data led to an overall RMSE value of 0.36 MJ/m2 day. A com-parison with regression model results follows.
Ampratwum and Dorvlo [3] investigated a number of regression models for estimation of solarradiation from the sunshine hours for Oman. These were the linear, quadratic, linear-logarithmic,logarithmic, power and power–trigonometric (P–T) models. Their results have revealed that theP–T model gave the best estimate. The locations considered in that study were Marmul, Masirah,Salalah, Seeb and Sur. Table 6 displays the comparison of RMSE between the measured andcomputed values of monthly average daily solar radiation using the RBF model and the P–Tregression model. The RBF model gives better estimates in four out of five stations. Furthermore,the RBF model is global, i.e. it can be used for any location, unlike the regression models,
Table 5
Estimated monthly average daily sunshine ratio for 25 meteorological stations
Location Jan Feb Mar Apr May Jun Jul Aug Sep Oct Nov Dec
Buraimi 0.808 0.774 0.784 0.839 0.896 0.913 0.903 0.902 0.911 0.915 0.910 0.852
Fahud 0.793 0.774 0.785 0.830 0.879 0.880 0.854 0.852 0.867 0.894 0.877 0.742
Marmul 0.840 0.845 0.855 0.853 0.868 0.801 0.762 0.820 0.876 0.890 0.861 0.850
Masirah 0.860 0.845 0.786 0.804 0.869 0.762 0.588 0.657 0.745 0.879 0.902 0.854
Salalah 0.861 0.811 0.786 0.826 0.864 0.508 0.145 0.107 0.468 0.881 0.890 0.868
Seeb 0.781 0.792 0.715 0.760 0.798 0.763 0.683 0.721 0.802 0.841 0.866 0.810
Sohar 0.785 0.762 0.714 0.700 0.691 0.673 0.656 0.683 0.730 0.773 0.806 0.795
Sur 0.791 0.816 0.725 0.796 0.864 0.808 0.678 0.728 0.829 0.880 0.902 0.827
Khasab 0.792 0.756 0.708 0.673 0.646 0.631 0.634 0.661 0.703 0.749 0.791 0.804
Saiq 0.779 0.746 0.706 0.668 0.639 0.625 0.632 0.656 0.691 0.733 0.770 0.790
Nizwa 0.781 0.748 0.713 0.684 0.664 0.653 0.658 0.680 0.712 0.749 0.783 0.796
Yalooni 0.805 0.784 0.778 0.785 0.808 0.769 0.720 0.740 0.780 0.840 0.838 0.772
Thumrait 0.762 0.741 0.715 0.687 0.667 0.653 0.655 0.677 0.706 0.735 0.758 0.771
Qairoon Hairiti 0.755 0.732 0.704 0.676 0.654 0.644 0.648 0.667 0.693 0.723 0.749 0.762
Mina Raysut 0.857 0.808 0.783 0.821 0.857 0.510 0.156 0.119 0.471 0.875 0.885 0.864
Diba 0.789 0.757 0.711 0.682 0.660 0.646 0.645 0.671 0.713 0.757 0.795 0.798
Rustaq 0.795 0.763 0.755 0.775 0.799 0.804 0.800 0.807 0.826 0.844 0.854 0.821
Samail 0.784 0.751 0.719 0.697 0.683 0.675 0.678 0.699 0.730 0.764 0.795 0.804
Rusayl 0.784 0.788 0.726 0.767 0.804 0.775 0.704 0.735 0.805 0.845 0.865 0.795
MSQ� 0.777 0.792 0.711 0.762 0.803 0.770 0.687 0.725 0.810 0.844 0.869 0.811
Bahla 0.779 0.746 0.706 0.668 0.640 0.626 0.633 0.657 0.692 0.733 0.771 0.790
Adam 0.791 0.764 0.761 0.782 0.808 0.810 0.803 0.810 0.828 0.846 0.849 0.796
Ibra 0.778 0.746 0.709 0.674 0.649 0.637 0.642 0.665 0.700 0.738 0.774 0.791
Umm Zamaim 0.808 0.786 0.779 0.796 0.831 0.794 0.733 0.751 0.790 0.856 0.854 0.765
MSQ� Buoy 0.776 0.791 0.710 0.758 0.797 0.765 0.686 0.723 0.807 0.840 0.866 0.811*Mina Sultan Qaboos.
696 A. Al-Lawati et al. / Energy Conversion and Management 44 (2003) 691–705

which are location specific, i.e. each location is characterized by a set of unique regression co-efficients.
An alternative approach to the estimation of solar radiation is to bypass the use of sunshineratio and develop a RBF model for estimation of the solar radiation directly from the sunshinehours as one of the input parameters. However, results obtained by following this approach have
Table 6
Comparison of RMSE between measured and computed values of monthly average daily solar radiation in MJ/m2 day
using the RBF model and the P–T regression model
Station RBF model P–T model�
Marmul 0.1117 1.0005
Masirah 0.0660 0.3127
Salalah 0.0722 0.2592
Seeb 0.7753 0.4167
Sur 0.1234 0.3887*Values obtained from [3].
Table 7
Estimated monthly average daily clearness index for 25 meteorological stations
Location Jan Feb Mar Apr May Jun Jul Aug Sep Oct Nov Dec
Buraimi 0.583 0.576 0.574 0.580 0.585 0.583 0.578 0.579 0.582 0.582 0.579 0.575
Fahud 0.620 0.597 0.592 0.614 0.632 0.604 0.570 0.582 0.612 0.628 0.613 0.601
Marmul 0.689 0.690 0.685 0.664 0.645 0.579 0.540 0.594 0.664 0.701 0.695 0.670
Masirah 0.529 0.522 0.542 0.536 0.545 0.504 0.428 0.472 0.499 0.544 0.546 0.524
Salalah 0.546 0.524 0.529 0.537 0.536 0.463 0.317 0.278 0.420 0.550 0.550 0.545
Seeb 0.562 0.583 0.568 0.594 0.606 0.579 0.519 0.538 0.576 0.594 0.603 0.573
Sohar 0.619 0.632 0.626 0.625 0.620 0.604 0.584 0.586 0.598 0.611 0.623 0.622
Sur 0.463 0.455 0.454 0.458 0.473 0.436 0.401 0.427 0.459 0.488 0.495 0.461
Khasab 0.596 0.601 0.599 0.594 0.588 0.583 0.579 0.579 0.582 0.587 0.595 0.598
Saiq 0.572 0.572 0.572 0.572 0.572 0.572 0.572 0.572 0.572 0.572 0.572 0.572
Nizwa 0.572 0.572 0.572 0.572 0.572 0.572 0.572 0.572 0.572 0.572 0.572 0.572
Yalooni 0.619 0.606 0.591 0.577 0.571 0.534 0.511 0.536 0.572 0.603 0.603 0.591
Thumrait 0.577 0.576 0.575 0.573 0.571 0.569 0.569 0.569 0.571 0.573 0.575 0.575
Qairoon Hairiti 0.572 0.572 0.572 0.572 0.572 0.572 0.572 0.572 0.572 0.572 0.572 0.572
Mina Raysut 0.545 0.524 0.530 0.538 0.538 0.468 0.325 0.286 0.427 0.550 0.550 0.545
Diba 0.604 0.609 0.606 0.600 0.594 0.586 0.580 0.580 0.586 0.594 0.603 0.606
Rustaq 0.579 0.574 0.570 0.568 0.567 0.564 0.564 0.568 0.574 0.578 0.578 0.575
Samail 0.573 0.572 0.572 0.571 0.571 0.571 0.571 0.571 0.572 0.572 0.573 0.573
Rusayl 0.570 0.585 0.564 0.583 0.592 0.566 0.518 0.538 0.575 0.596 0.600 0.570
MSQ� 0.541 0.561 0.545 0.571 0.582 0.558 0.504 0.523 0.561 0.576 0.586 0.555
Bahla 0.572 0.572 0.572 0.572 0.572 0.572 0.572 0.572 0.572 0.572 0.572 0.572
Adam 0.588 0.578 0.570 0.567 0.564 0.556 0.554 0.564 0.579 0.588 0.587 0.581
Ibra 0.572 0.572 0.572 0.572 0.572 0.572 0.572 0.572 0.572 0.572 0.572 0.572
Umm Zamaim 0.625 0.608 0.591 0.582 0.586 0.542 0.503 0.531 0.573 0.608 0.603 0.590
MSQ� Buoy 0.545 0.566 0.550 0.576 0.587 0.562 0.510 0.528 0.564 0.579 0.589 0.560*Mina Sultan Qaboos.
A. Al-Lawati et al. / Energy Conversion and Management 44 (2003) 691–705 697

yielded higher values of RMSE. Furthermore, most of the models for estimating solar radiationappearing in the literature use the sunshine ratio [13,14].
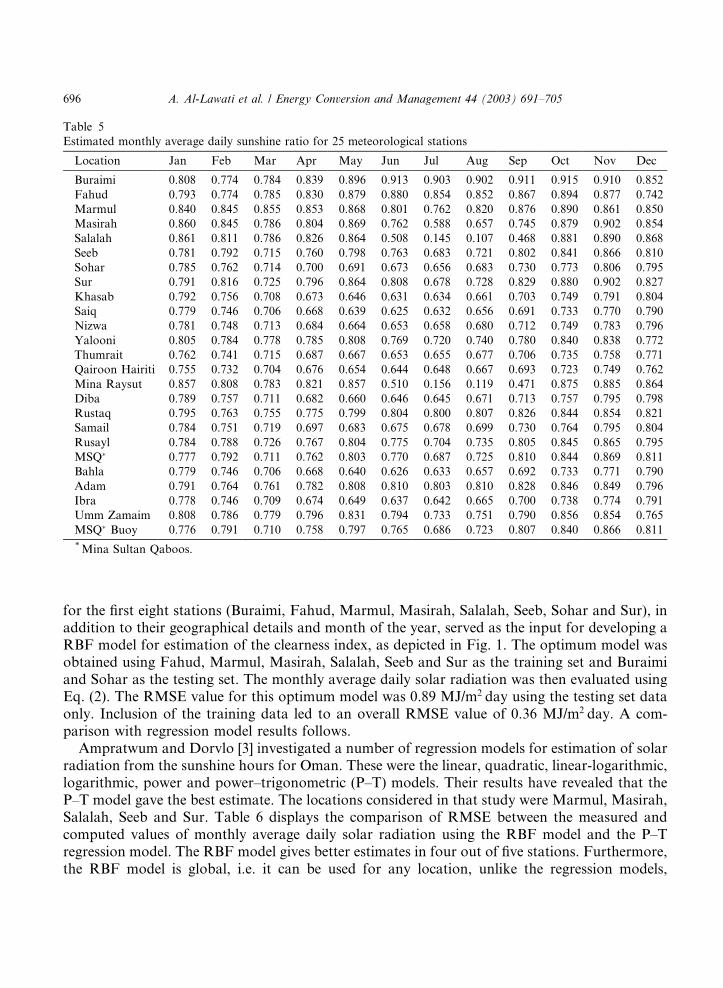
The data generated for clearness index and solar radiation for the 25 meteorological stations inOman are given in Tables 7 and 8. The values for H and H=H 0 shown in these tables were used toplot contour maps over Oman on a monthly basis. Figs. 2–4 show the plots for H . Figs.5–7 display contour maps for H=H 0. In general, there seem to be two types of maps for solarradiation. September through May have similar plots. The June, July, August plots are differentfrom the plots of the other months. These happen to be the hottest months in Oman.
5. Conclusions
RBF models have been developed for estimation of the solar radiation and clearness index for alocation given its longitude, latitude altitude and number of sunshine hours, as well as the monthof the year. Data generated using these models were used to plot contour maps for solar radiationand clearness index over Oman. These maps can be used to estimate these parameters in anylocation in Oman.
Table 8
Estimated monthly average daily solar radiation for 25 meteorological stations in MJ/m2 day
Location Jan Feb Mar Apr May Jun Jul Aug Sep Oct Nov Dec
Buraimi 14.35 16.46 19.24 21.80 23.24 23.49 23.07 22.10 20.22 17.42 14.73 13.40
Fahud 15.91 17.58 20.18 23.15 24.97 24.16 22.60 22.24 21.53 19.30 16.22 14.68
Marmul 19.25 21.62 24.09 25.21 25.16 22.64 21.04 22.65 23.89 22.67 19.88 17.96
Masirah 14.06 15.77 18.71 20.29 21.47 19.98 16.85 18.03 17.73 17.06 14.93 13.30
Salalah 15.57 16.66 18.75 20.40 20.83 18.00 12.28 10.58 15.18 18.01 16.04 14.93
Seeb 14.03 16.84 19.14 22.33 24.01 23.29 20.66 20.55 20.11 17.94 15.56 13.58
Sohar 15.16 18.00 20.91 23.44 24.63 24.36 23.29 22.36 20.75 18.22 15.78 14.42
Sur 11.85 13.38 15.43 17.28 18.72 17.44 15.90 16.32 16.12 14.94 13.05 11.20
Khasab 14.01 16.60 19.67 22.18 23.44 23.67 23.22 22.05 19.94 17.09 14.49 13.26
Saiq 14.46 16.66 19.36 21.55 22.66 22.95 22.73 21.86 20.04 17.41 14.92 13.73
Nizwa 14.54 16.73 19.40 21.55 22.64 22.92 22.70 21.85 20.06 17.46 14.99 13.81
Yalooni 16.71 18.49 20.52 21.85 22.41 21.11 20.08 20.47 20.40 19.10 16.70 15.22
Thumrait 16.26 18.15 20.29 21.76 22.25 22.22 22.09 21.71 20.59 18.63 16.58 15.54
Qairoon Hairiti 16.25 18.13 20.25 21.74 22.26 22.27 22.18 21.81 20.67 18.68 16.62 15.61
Mina Raysut 15.57 16.69 18.79 20.44 20.89 18.16 12.58 10.90 15.43 18.03 16.07 14.97
Diba 14.39 17.01 20.02 22.46 23.63 23.75 23.22 22.13 20.17 17.44 14.89 13.64
Rustaq 14.53 16.62 19.22 21.38 22.47 22.66 22.42 21.70 20.07 17.51 14.96 13.69
Samail 14.40 16.61 19.31 21.51 22.62 22.92 22.70 21.83 20.00 17.36 14.86 13.66
Rusayl 14.24 16.91 19.01 21.93 23.49 22.76 20.61 20.54 20.09 18.00 15.48 13.52
MSQ� 13.51 16.19 18.36 21.48 23.08 22.43 20.07 19.99 19.56 17.40 15.09 13.14
Bahla 14.49 16.69 19.38 21.55 22.66 22.95 22.73 21.86 20.05 17.43 14.94 13.76
Adam 15.09 17.00 19.40 21.38 22.30 22.25 21.95 21.55 20.34 18.04 15.51 14.16
Ibra 14.57 16.75 19.42 21.56 22.64 22.91 22.70 21.86 20.08 17.49 15.02 13.84
Umm Zamaim 16.57 18.34 20.36 22.03 23.05 21.50 19.81 20.31 20.34 19.05 16.43 14.92
MSQ� Buoy 13.59 16.31 18.51 21.65 23.26 22.62 20.31 20.18 19.69 17.47 15.15 13.23*Mina Sultan Qaboos.
698 A. Al-Lawati et al. / Energy Conversion and Management 44 (2003) 691–705

Fig. 2. Contour maps for monthly average daily solar radiation in MJ/m2 day for Oman (January–April).
A. Al-Lawati et al. / Energy Conversion and Management 44 (2003) 691–705 699
Fig. 3. Contour maps for monthly average daily solar radiation in MJ/m2 day for Oman (May–August).
700 A. Al-Lawati et al. / Energy Conversion and Management 44 (2003) 691–705

Fig. 4. Contour maps for monthly average daily solar radiation in MJ/m2 day for Oman (September–December).
A. Al-Lawati et al. / Energy Conversion and Management 44 (2003) 691–705 701

Fig. 5. Contour maps of monthly average daily clearness index for Oman (January–April).
702 A. Al-Lawati et al. / Energy Conversion and Management 44 (2003) 691–705

Fig. 6. Contour maps of monthly average daily clearness index for Oman (May–August).
A. Al-Lawati et al. / Energy Conversion and Management 44 (2003) 691–705 703

Fig. 7. Contour maps of monthly average daily clearness index for Oman (September–December).
704 A. Al-Lawati et al. / Energy Conversion and Management 44 (2003) 691–705

References
[1] Duffie JA, Beckman WA. Solar engineering of thermal processes. New York: John Wiley and Sons; 1991.
[2] Coppolino S. A new correlation between clearness index and relative sunshine. Renewable Energy 1994;4(4):417–
23.
[3] Ampratwum DB, Dorvlo ASS. Estimation of solar radiation from the number of sunshine hours. Appl Energy
1999;63:161–7.
[4] Angstrom A. On the computation of global solar radiation from records of sunshine. Arkiv Geophysik
1956;3(23):551.
[5] Black JN, Bonython CW, Prescott JA. Solar radiation and the duration of sunshine. QJR Met Soc 1954;84:231–5.
[6] Rietveld MR. A new method for estimating the regression coefficients in the formula relating solar radiation to
sunshine. Agric Meteorol 1978;19:243–52.
[7] Newland FJ. A study of solar radiation models for the coastal region of South China. Solar Energy 1986;43(4):227–
35.
[8] Akinoglu BG, Ecevit A. Construction of a quadratic model using modified Angstrom coefficients to estimate global
solar radiation. Solar Energy 1990;45:85–92.
[9] Haykin S. Neural Networks. New York: MacMillan College Publishing Company; 1994.
[10] Fausett L. Fundamentals of Neural Networks. Englewood Cliffs, NJ: Prentice Hall International; 1994.
[11] Trigo RM, Palutikof JP. Simulation of daily temperatures for climate change scenarios over Portugal: A neural
network model approach. Climate Res 1999;13:45–59.
[12] Oman Ministry of Communications, Annual Climatic Summaries. Directorate General of Civil Aviation and
Meteorology, Department of Meteorology, Sultanate of Oman, 1986–1998.
[13] Hussain M, Rahman L, Rahman MM. Techniques to obtain improved prediction of global radiation from
sunshine duration. Renewable Energy 1999;18:263–75.
[14] Singh OP, Srivastava SK, Gaur A. Empirical relationship to estimate global radiation from hours of sunshine.
Energy Convers Mgmt 1996;37:501–4.
A. Al-Lawati et al. / Energy Conversion and Management 44 (2003) 691–705 705