Monte Carlo study of the translocation of a polymer chain through a hole
11
Monte Carlo study of the translocation of a polymer chain through a hole Waldemar Nowicki a, * , Gra _ zyna Nowicka a , Jolanta Narkiewicz-Michałek b a Faculty of Chemistry, Adam Mickiewicz University, Grunwaldzka 6, 60-780 Poznan ´, Poland b Faculty of Chemistry, Maria Curie-Skłodowska University, M. Skłodowska-Curie Pl. 3, 20-031 Lublin, Poland article info Article history: Received 27 March 2009 Received in revised form 16 September 2009 Accepted 11 October 2009 Available online 10 November 2009 Keywords: Self-avoiding walk Excluded volume Surface curvature Athermal solution abstract The translocation of a polymer chain through a narrow hole in a rigid obstacle has been studied by the static Monte Carlo simulations. A modified self-avoiding walk on a cubic lat- tice has been used to model the polymer in an athermal solution. The entropy of the chain before, in the course, and after the translocation process has been estimated by the statis- tical counting method. The thermodynamic generalized forces governing the translocation have been calculated. The influence of the system geometry on the entropic barrier land- scape is discussed. Ó 2009 Elsevier Ltd. All rights reserved. 1. Introduction The passage of a macromolecule through a nanometer- size pore is a fundamental event in various biological pro- cesses including protein translocation across membranes [1,2], gene transduction between bacteria [3] and the introduction of viral DNA to the cytoplasm of bacterial cell [4]. In addition to its biological relevance, this process is of key importance in a growing number of applications, like drug delivery [5], ultrarapid DNA sequencing [6], separa- tion and purification of synthetic and biological polymers [7,8], to name a few. The polymer chain threading through a nanopore is a complicated phenomenon. It has been extensively studied both by theoretical and simulation methods. The threading of the chain is usually induced by the external force. Sev- eral effects have been considered as sources of driving forces of the translocation process: the electrostatic inter- action between charged macromolecules and the external electric field [9–11], the gradient of the chemical potential in the direction parallel to the nanopore axis [12,13], the difference in the Flory–Huggins interaction parameters between the solutions on both sides of a nanoporous mem- brane [14], the entropic force arising from the spatial con- finement imposed on the polymer chain [15–17], the selective adsorption of polymer on one side of the mem- brane [18–21], the curvature-induced difference of lipid fluctuations between the two halves of the bilayer (in the case of the translocation through a curved membrane) [22], the ratchet mechanism [23], et cetera. Threading a polymer through a narrow nanopore was modelled by various methods. The translocation of the polymer molecule through the nanopore placed in the external field was studied via molecular dynamics method [9,10], Brownian dynamics simulation [12,24], Langevine dynamics simulation [25], dissipative particle dynamics method [26] and others. The translocation problem was also frequently addressed by different modifications of 2D and 3D dynamic Monte Carlo (MC) simulations [18,22,27–34]. Results of different simulations allow for- mulation of some conclusions concerning dynamic fea- tures of translocation, i.e. the macromolecule velocity [35,36], kinetic equations of the translocation process [14], dependence of translocation time on the polymer length [30,32,33], chain diffusion coefficient [22,36]. The simulations indicated the presence of two different re- gimes of translocation dynamics depending on the ratio of the pore to polymer lengths as well as two different re- 0014-3057/$ - see front matter Ó 2009 Elsevier Ltd. All rights reserved. doi:10.1016/j.eurpolymj.2009.10.012 * Corresponding author. E-mail address: [email protected] (W. Nowicki). European Polymer Journal 46 (2010) 112–122 Contents lists available at ScienceDirect European Polymer Journal journal homepage: www.elsevier.com/locate/europolj
-
Upload
independent -
Category
Documents
-
view
2 -
download
0
Transcript of Monte Carlo study of the translocation of a polymer chain through a hole
European Polymer Journal 46 (2010) 112–122
Contents lists available at ScienceDirect
European Polymer Journal
journal homepage: www.elsevier .com/locate /europol j
Monte Carlo study of the translocation of a polymer chain through a hole
Waldemar Nowicki a,*, Gra _zyna Nowicka a, Jolanta Narkiewicz-Michałek b
a Faculty of Chemistry, Adam Mickiewicz University, Grunwaldzka 6, 60-780 Poznan, Polandb Faculty of Chemistry, Maria Curie-Skłodowska University, M. Skłodowska-Curie Pl. 3, 20-031 Lublin, Poland
a r t i c l e i n f o
Article history:Received 27 March 2009Received in revised form 16 September 2009Accepted 11 October 2009Available online 10 November 2009
Keywords:Self-avoiding walkExcluded volumeSurface curvatureAthermal solution
0014-3057/$ - see front matter � 2009 Elsevier Ltddoi:10.1016/j.eurpolymj.2009.10.012
* Corresponding author.E-mail address: [email protected] (W. Nowick
a b s t r a c t
The translocation of a polymer chain through a narrow hole in a rigid obstacle has beenstudied by the static Monte Carlo simulations. A modified self-avoiding walk on a cubic lat-tice has been used to model the polymer in an athermal solution. The entropy of the chainbefore, in the course, and after the translocation process has been estimated by the statis-tical counting method. The thermodynamic generalized forces governing the translocationhave been calculated. The influence of the system geometry on the entropic barrier land-scape is discussed.
� 2009 Elsevier Ltd. All rights reserved.
1. Introduction
The passage of a macromolecule through a nanometer-size pore is a fundamental event in various biological pro-cesses including protein translocation across membranes[1,2], gene transduction between bacteria [3] and theintroduction of viral DNA to the cytoplasm of bacterial cell[4]. In addition to its biological relevance, this process is ofkey importance in a growing number of applications, likedrug delivery [5], ultrarapid DNA sequencing [6], separa-tion and purification of synthetic and biological polymers[7,8], to name a few.
The polymer chain threading through a nanopore is acomplicated phenomenon. It has been extensively studiedboth by theoretical and simulation methods. The threadingof the chain is usually induced by the external force. Sev-eral effects have been considered as sources of drivingforces of the translocation process: the electrostatic inter-action between charged macromolecules and the externalelectric field [9–11], the gradient of the chemical potentialin the direction parallel to the nanopore axis [12,13], thedifference in the Flory–Huggins interaction parameters
. All rights reserved.
i).
between the solutions on both sides of a nanoporous mem-brane [14], the entropic force arising from the spatial con-finement imposed on the polymer chain [15–17], theselective adsorption of polymer on one side of the mem-brane [18–21], the curvature-induced difference of lipidfluctuations between the two halves of the bilayer (in thecase of the translocation through a curved membrane)[22], the ratchet mechanism [23], et cetera.
Threading a polymer through a narrow nanopore wasmodelled by various methods. The translocation of thepolymer molecule through the nanopore placed in theexternal field was studied via molecular dynamics method[9,10], Brownian dynamics simulation [12,24], Langevinedynamics simulation [25], dissipative particle dynamicsmethod [26] and others. The translocation problem wasalso frequently addressed by different modifications of2D and 3D dynamic Monte Carlo (MC) simulations[18,22,27–34]. Results of different simulations allow for-mulation of some conclusions concerning dynamic fea-tures of translocation, i.e. the macromolecule velocity[35,36], kinetic equations of the translocation process[14], dependence of translocation time on the polymerlength [30,32,33], chain diffusion coefficient [22,36]. Thesimulations indicated the presence of two different re-gimes of translocation dynamics depending on the ratioof the pore to polymer lengths as well as two different re-
W. Nowicki et al. / European Polymer Journal 46 (2010) 112–122 113
gimes for the probability of translocation depending onthe voltage applied [9]. Also, the influence of temperatureon the translocation time was extensively studied[9,10,32]. The anomalous dynamics of translocation wasdiscussed by Kantor and Kardar [37]. Simulations of thetranslocation through a nanopore in the absence of anexternal driving force were performed by the 2D MCmethod [25,28] for the system containing a chain initiallysituated in the middle of the pore. The escape time re-quired for the polymer to completely exit the pore wasstudied. The MC simulations were also used for investiga-tions of distribution of charged and neutral polymers withdifferent flexibilities between two spheres of varying vol-ume, connected by a short and narrow cylinder [27]. Also,the translocation in systems containing many macromole-cules was considered [29].
An important quantity describing the chain transloca-tion process is the height of the Helmholtz free energy bar-rier which has to be overcome in the course of thetranslocation. However, full understanding of the physicalbackgrounds of the process needs the information aboutdetails of the entire landscape of free energy [38].
The main objective of the paper was to estimate the ex-cess free energy of the chain translocation at all steps ofthe process and, as a consequence, to calculate the thermo-dynamic generalized forces produced by the confiningenvironment of the chain in the course of the chain trans-location. The information about these forces is of impor-tance because it allows anticipation of the external forcesnecessary to induce the translocation. Using the staticMonte Carlo (MC) method [39] and the statistical counting(SC) method [40] we have studied a system of a single iso-lated polymer chain restricted into geometrical constrains.The chain was represented by the modified self-avoidingwalk ((1 1 2) SAW) [41], thus the model can be related tothe properties of a macromolecule in an athermal solution,where the crucial quantity, fully determining the systemproperties, is the conformational entropy. The method ap-plied does not allow a direct study of the translocationdynamics. Nevertheless, it can be employed for the compu-tation of the conformational entropy at all steps of thetranslocation and for numerical calculations of partialderivatives of entropy with respect to distance and volume,corresponding to the generalized thermodynamic forces –the mechanical force and pressure.
In this study we calculated exact values of the free en-ergy of the system governed only by excluded volume ef-fects. Nevertheless, these values can be also interpretedas the entopic components of free energy in more compli-cated systems governed by strong interactions (e.g. elec-trostatic potentials).
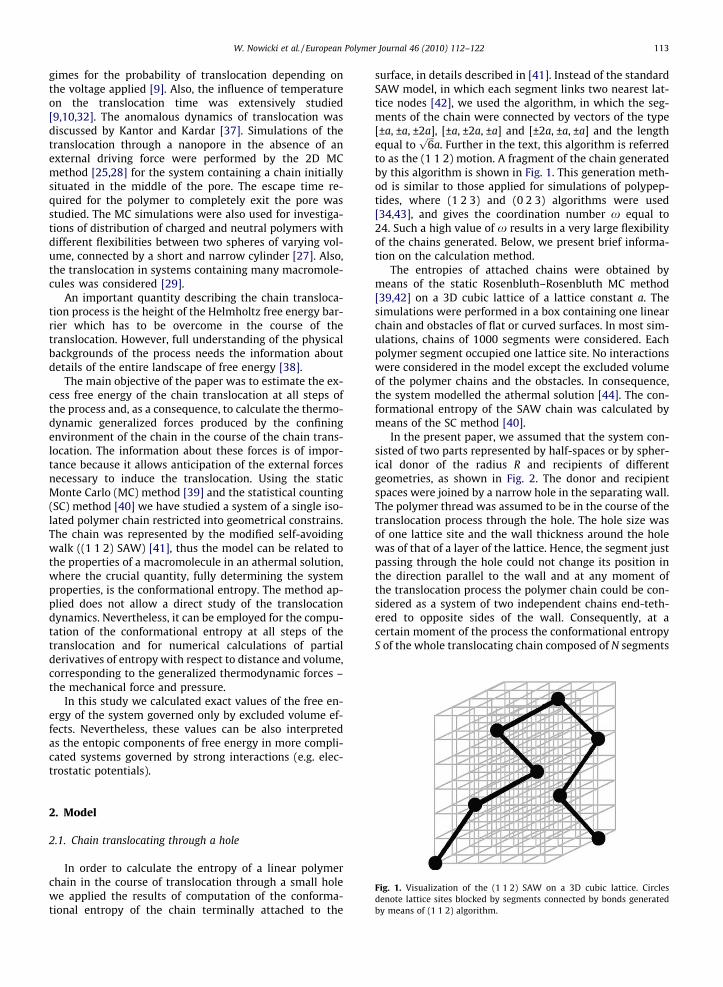
Fig. 1. Visualization of the (1 1 2) SAW on a 3D cubic lattice. Circlesdenote lattice sites blocked by segments connected by bonds generatedby means of (1 1 2) algorithm.
2. Model
2.1. Chain translocating through a hole
In order to calculate the entropy of a linear polymerchain in the course of translocation through a small holewe applied the results of computation of the conforma-tional entropy of the chain terminally attached to the
surface, in details described in [41]. Instead of the standardSAW model, in which each segment links two nearest lat-tice nodes [42], we used the algorithm, in which the seg-ments of the chain were connected by vectors of the type[±a, ±a, ±2a], [±a, ±2a, ±a] and [±2a, ±a, ±a] and the lengthequal to
ffiffiffi6p
a. Further in the text, this algorithm is referredto as the (1 1 2) motion. A fragment of the chain generatedby this algorithm is shown in Fig. 1. This generation meth-od is similar to those applied for simulations of polypep-tides, where (1 2 3) and (0 2 3) algorithms were used[34,43], and gives the coordination number x equal to24. Such a high value of x results in a very large flexibilityof the chains generated. Below, we present brief informa-tion on the calculation method.
The entropies of attached chains were obtained bymeans of the static Rosenbluth–Rosenbluth MC method[39,42] on a 3D cubic lattice of a lattice constant a. Thesimulations were performed in a box containing one linearchain and obstacles of flat or curved surfaces. In most sim-ulations, chains of 1000 segments were considered. Eachpolymer segment occupied one lattice site. No interactionswere considered in the model except the excluded volumeof the polymer chains and the obstacles. In consequence,the system modelled the athermal solution [44]. The con-formational entropy of the SAW chain was calculated bymeans of the SC method [40].
In the present paper, we assumed that the system con-sisted of two parts represented by half-spaces or by spher-ical donor of the radius R and recipients of differentgeometries, as shown in Fig. 2. The donor and recipientspaces were joined by a narrow hole in the separating wall.The polymer thread was assumed to be in the course of thetranslocation process through the hole. The hole size wasof one lattice site and the wall thickness around the holewas of that of a layer of the lattice. Hence, the segment justpassing through the hole could not change its position inthe direction parallel to the wall and at any moment ofthe translocation process the polymer chain could be con-sidered as a system of two independent chains end-teth-ered to opposite sides of the wall. Consequently, at acertain moment of the process the conformational entropyS of the whole translocating chain composed of N segments
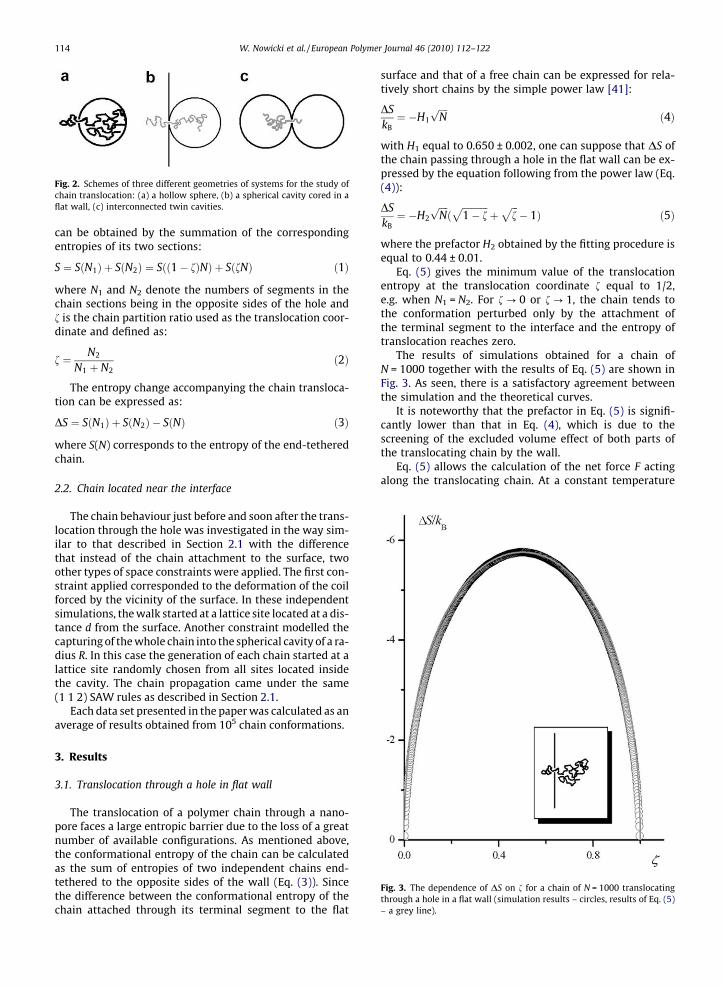
Fig. 2. Schemes of three different geometries of systems for the study ofchain translocation: (a) a hollow sphere, (b) a spherical cavity cored in aflat wall, (c) interconnected twin cavities.
Fig. 3. The dependence of DS on f for a chain of N = 1000 translocatingthrough a hole in a flat wall (simulation results – circles, results of Eq. (5)– a grey line).
114 W. Nowicki et al. / European Polymer Journal 46 (2010) 112–122
can be obtained by the summation of the correspondingentropies of its two sections:
S ¼ SðN1Þ þ SðN2Þ ¼ Sðð1� fÞNÞ þ SðfNÞ ð1Þ
where N1 and N2 denote the numbers of segments in thechain sections being in the opposite sides of the hole andf is the chain partition ratio used as the translocation coor-dinate and defined as:
f ¼ N2
N1 þ N2ð2Þ
The entropy change accompanying the chain transloca-tion can be expressed as:
DS ¼ SðN1Þ þ SðN2Þ � SðNÞ ð3Þ
where S(N) corresponds to the entropy of the end-tetheredchain.
2.2. Chain located near the interface
The chain behaviour just before and soon after the trans-location through the hole was investigated in the way sim-ilar to that described in Section 2.1 with the differencethat instead of the chain attachment to the surface, twoother types of space constraints were applied. The first con-straint applied corresponded to the deformation of the coilforced by the vicinity of the surface. In these independentsimulations, the walk started at a lattice site located at a dis-tance d from the surface. Another constraint modelled thecapturing of the whole chain into the spherical cavity of a ra-dius R. In this case the generation of each chain started at alattice site randomly chosen from all sites located insidethe cavity. The chain propagation came under the same(1 1 2) SAW rules as described in Section 2.1.
Each data set presented in the paper was calculated as anaverage of results obtained from 105 chain conformations.
3. Results
3.1. Translocation through a hole in flat wall
The translocation of a polymer chain through a nano-pore faces a large entropic barrier due to the loss of a greatnumber of available configurations. As mentioned above,the conformational entropy of the chain can be calculatedas the sum of entropies of two independent chains end-tethered to the opposite sides of the wall (Eq. (3)). Sincethe difference between the conformational entropy of thechain attached through its terminal segment to the flat
surface and that of a free chain can be expressed for rela-tively short chains by the simple power law [41]:
DSkB¼ �H1
ffiffiffiffiNp
ð4Þ
with H1 equal to 0.650 ± 0.002, one can suppose that DS ofthe chain passing through a hole in the flat wall can be ex-pressed by the equation following from the power law (Eq.(4)):
DSkB¼ �H2
ffiffiffiffiNpðffiffiffiffiffiffiffiffiffiffiffi1� f
pþ
ffiffiffif
p� 1Þ ð5Þ
where the prefactor H2 obtained by the fitting procedure isequal to 0.44 ± 0.01.
Eq. (5) gives the minimum value of the translocationentropy at the translocation coordinate f equal to 1/2,e.g. when N1 = N2. For f ? 0 or f ? 1, the chain tends tothe conformation perturbed only by the attachment ofthe terminal segment to the interface and the entropy oftranslocation reaches zero.
The results of simulations obtained for a chain ofN = 1000 together with the results of Eq. (5) are shown inFig. 3. As seen, there is a satisfactory agreement betweenthe simulation and the theoretical curves.
It is noteworthy that the prefactor in Eq. (5) is signifi-cantly lower than that in Eq. (4), which is due to thescreening of the excluded volume effect of both parts ofthe translocating chain by the wall.
Eq. (5) allows the calculation of the net force F actingalong the translocating chain. At a constant temperature
W. Nowicki et al. / European Polymer Journal 46 (2010) 112–122 115
T this force is equal to the derivative of the change in freeenergy upon the translocation, DA, with respect to thelength x of the chain section which crossed the wall:
F ¼ @DA@x
� �T¼ @const
@x
� �T� T
@DS@x
� �T¼ �T
@DS@x
� �T
¼ � TNl
@DS@f
� �T
ð6Þ
Finally, the following relation between the force F, thetranslocation coordinate f, and the number of segmentsin the whole chain, N, can be obtained:
FlT¼ � 1
N@DS@f
� �T¼ H2kB
2ffiffiffiffiNp 1ffiffiffiffiffiffiffiffiffiffiffi
1� fp � 1ffiffiffi
fp
� �ð7Þ
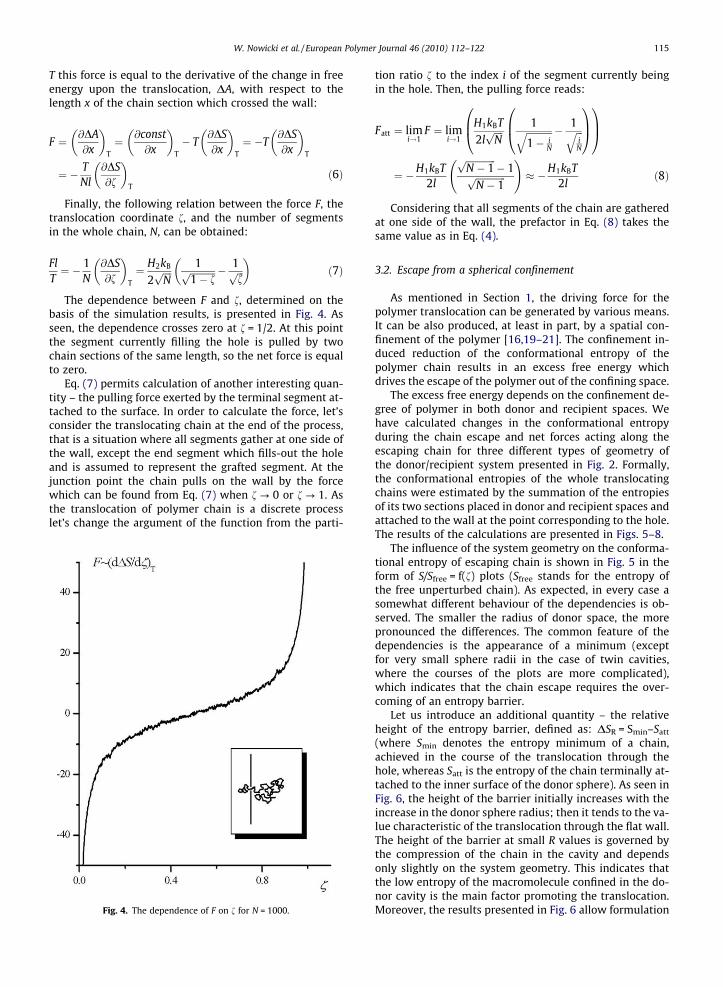
The dependence between F and f, determined on thebasis of the simulation results, is presented in Fig. 4. Asseen, the dependence crosses zero at f = 1/2. At this pointthe segment currently filling the hole is pulled by twochain sections of the same length, so the net force is equalto zero.
Eq. (7) permits calculation of another interesting quan-tity – the pulling force exerted by the terminal segment at-tached to the surface. In order to calculate the force, let’sconsider the translocating chain at the end of the process,that is a situation where all segments gather at one side ofthe wall, except the end segment which fills-out the holeand is assumed to represent the grafted segment. At thejunction point the chain pulls on the wall by the forcewhich can be found from Eq. (7) when f ? 0 or f ? 1. Asthe translocation of polymer chain is a discrete processlet’s change the argument of the function from the parti-
Fig. 4. The dependence of F on f for N = 1000.
tion ratio f to the index i of the segment currently beingin the hole. Then, the pulling force reads:
Fatt ¼ limi!1
F ¼ limi!1
H1kBT
2lffiffiffiffiNp 1ffiffiffiffiffiffiffiffiffiffiffi
1� iN
q � 1ffiffiffiiN
q0B@
1CA
0B@
1CA
¼ �H1kBT2l
ffiffiffiffiffiffiffiffiffiffiffiffiffiN � 1p
� 1ffiffiffiffiffiffiffiffiffiffiffiffiffiN � 1p
!� �H1kBT
2lð8Þ
Considering that all segments of the chain are gatheredat one side of the wall, the prefactor in Eq. (8) takes thesame value as in Eq. (4).
3.2. Escape from a spherical confinement
As mentioned in Section 1, the driving force for thepolymer translocation can be generated by various means.It can be also produced, at least in part, by a spatial con-finement of the polymer [16,19–21]. The confinement in-duced reduction of the conformational entropy of thepolymer chain results in an excess free energy whichdrives the escape of the polymer out of the confining space.
The excess free energy depends on the confinement de-gree of polymer in both donor and recipient spaces. Wehave calculated changes in the conformational entropyduring the chain escape and net forces acting along theescaping chain for three different types of geometry ofthe donor/recipient system presented in Fig. 2. Formally,the conformational entropies of the whole translocatingchains were estimated by the summation of the entropiesof its two sections placed in donor and recipient spaces andattached to the wall at the point corresponding to the hole.The results of the calculations are presented in Figs. 5–8.
The influence of the system geometry on the conforma-tional entropy of escaping chain is shown in Fig. 5 in theform of S/Sfree = f(f) plots (Sfree stands for the entropy ofthe free unperturbed chain). As expected, in every case asomewhat different behaviour of the dependencies is ob-served. The smaller the radius of donor space, the morepronounced the differences. The common feature of thedependencies is the appearance of a minimum (exceptfor very small sphere radii in the case of twin cavities,where the courses of the plots are more complicated),which indicates that the chain escape requires the over-coming of an entropy barrier.
Let us introduce an additional quantity – the relativeheight of the entropy barrier, defined as: DSR = Smin–Satt
(where Smin denotes the entropy minimum of a chain,achieved in the course of the translocation through thehole, whereas Satt is the entropy of the chain terminally at-tached to the inner surface of the donor sphere). As seen inFig. 6, the height of the barrier initially increases with theincrease in the donor sphere radius; then it tends to the va-lue characteristic of the translocation through the flat wall.The height of the barrier at small R values is governed bythe compression of the chain in the cavity and dependsonly slightly on the system geometry. This indicates thatthe low entropy of the macromolecule confined in the do-nor cavity is the main factor promoting the translocation.Moreover, the results presented in Fig. 6 allow formulation
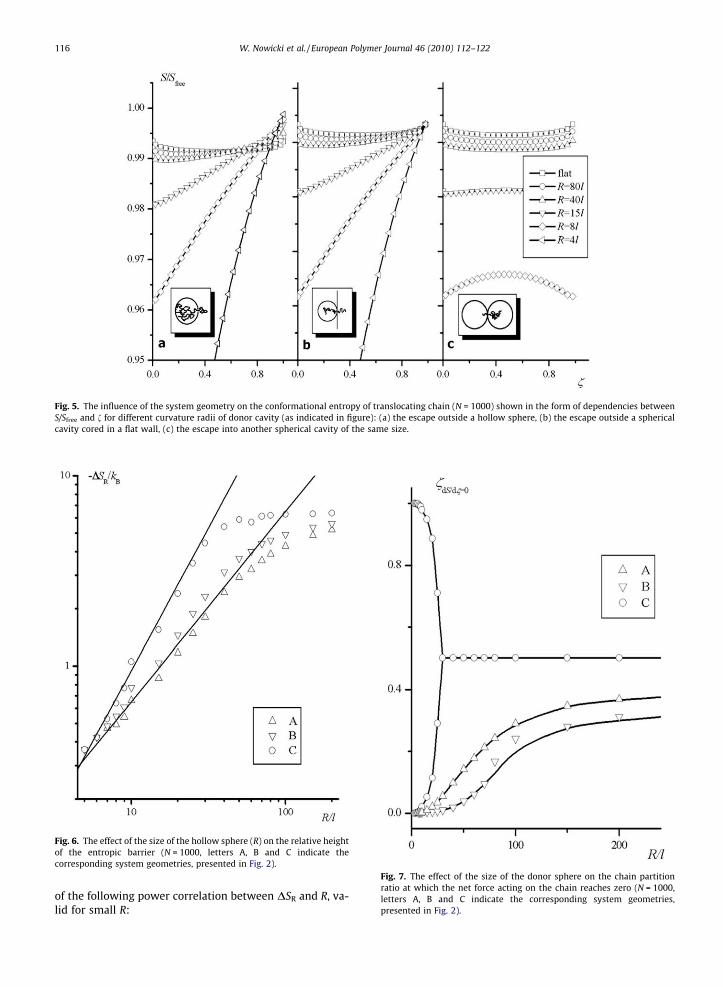
Fig. 5. The influence of the system geometry on the conformational entropy of translocating chain (N = 1000) shown in the form of dependencies betweenS/Sfree and f for different curvature radii of donor cavity (as indicated in figure): (a) the escape outside a hollow sphere, (b) the escape outside a sphericalcavity cored in a flat wall, (c) the escape into another spherical cavity of the same size.
Fig. 6. The effect of the size of the hollow sphere (R) on the relative heightof the entropic barrier (N = 1000, letters A, B and C indicate thecorresponding system geometries, presented in Fig. 2).
Fig. 7. The effect of the size of the donor sphere on the chain partitionratio at which the net force acting on the chain reaches zero (N = 1000,letters A, B and C indicate the corresponding system geometries,presented in Fig. 2).
116 W. Nowicki et al. / European Polymer Journal 46 (2010) 112–122
of the following power correlation between DSR and R, va-lid for small R:
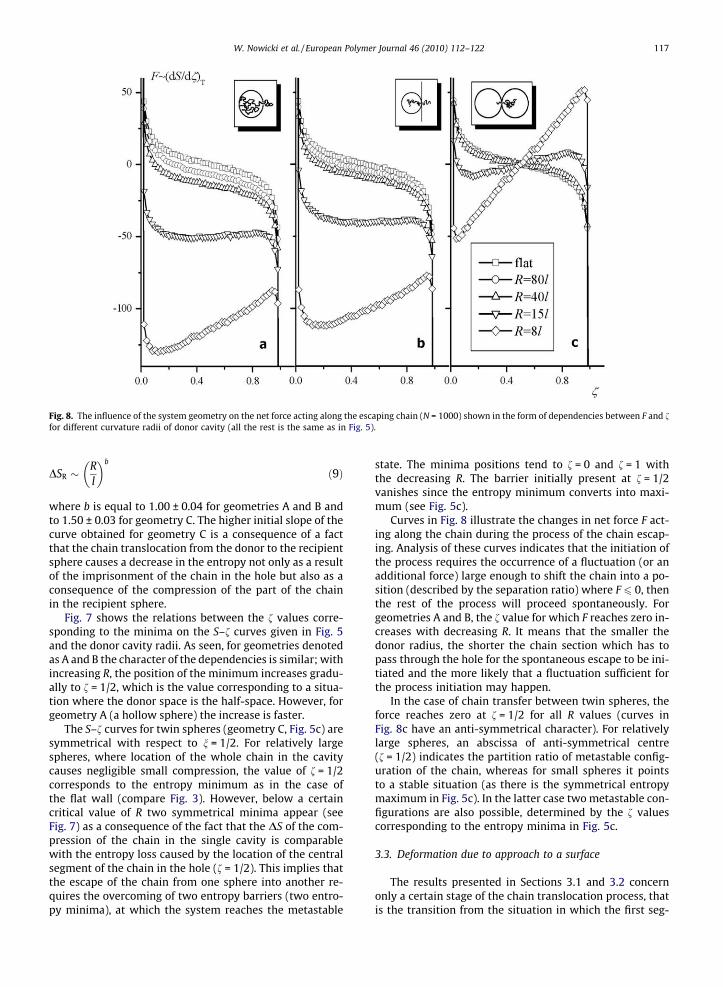
Fig. 8. The influence of the system geometry on the net force acting along the escaping chain (N = 1000) shown in the form of dependencies between F and ffor different curvature radii of donor cavity (all the rest is the same as in Fig. 5).
W. Nowicki et al. / European Polymer Journal 46 (2010) 112–122 117
DSR �Rl
� �b
ð9Þ
where b is equal to 1.00 ± 0.04 for geometries A and B andto 1.50 ± 0.03 for geometry C. The higher initial slope of thecurve obtained for geometry C is a consequence of a factthat the chain translocation from the donor to the recipientsphere causes a decrease in the entropy not only as a resultof the imprisonment of the chain in the hole but also as aconsequence of the compression of the part of the chainin the recipient sphere.
Fig. 7 shows the relations between the f values corre-sponding to the minima on the S–f curves given in Fig. 5and the donor cavity radii. As seen, for geometries denotedas A and B the character of the dependencies is similar; withincreasing R, the position of the minimum increases gradu-ally to f = 1/2, which is the value corresponding to a situa-tion where the donor space is the half-space. However, forgeometry A (a hollow sphere) the increase is faster.
The S–f curves for twin spheres (geometry C, Fig. 5c) aresymmetrical with respect to n = 1/2. For relatively largespheres, where location of the whole chain in the cavitycauses negligible small compression, the value of f = 1/2corresponds to the entropy minimum as in the case ofthe flat wall (compare Fig. 3). However, below a certaincritical value of R two symmetrical minima appear (seeFig. 7) as a consequence of the fact that the DS of the com-pression of the chain in the single cavity is comparablewith the entropy loss caused by the location of the centralsegment of the chain in the hole (f = 1/2). This implies thatthe escape of the chain from one sphere into another re-quires the overcoming of two entropy barriers (two entro-py minima), at which the system reaches the metastable
state. The minima positions tend to f = 0 and f = 1 withthe decreasing R. The barrier initially present at f = 1/2vanishes since the entropy minimum converts into maxi-mum (see Fig. 5c).
Curves in Fig. 8 illustrate the changes in net force F act-ing along the chain during the process of the chain escap-ing. Analysis of these curves indicates that the initiation ofthe process requires the occurrence of a fluctuation (or anadditional force) large enough to shift the chain into a po-sition (described by the separation ratio) where F 6 0, thenthe rest of the process will proceed spontaneously. Forgeometries A and B, the f value for which F reaches zero in-creases with decreasing R. It means that the smaller thedonor radius, the shorter the chain section which has topass through the hole for the spontaneous escape to be ini-tiated and the more likely that a fluctuation sufficient forthe process initiation may happen.
In the case of chain transfer between twin spheres, theforce reaches zero at f = 1/2 for all R values (curves inFig. 8c have an anti-symmetrical character). For relativelylarge spheres, an abscissa of anti-symmetrical centre(f = 1/2) indicates the partition ratio of metastable config-uration of the chain, whereas for small spheres it pointsto a stable situation (as there is the symmetrical entropymaximum in Fig. 5c). In the latter case two metastable con-figurations are also possible, determined by the f valuescorresponding to the entropy minima in Fig. 5c.
3.3. Deformation due to approach to a surface
The results presented in Sections 3.1 and 3.2 concernonly a certain stage of the chain translocation process, thatis the transition from the situation in which the first seg-
118 W. Nowicki et al. / European Polymer Journal 46 (2010) 112–122
ment is in a hole to the situation in which the last segmentis there. However, the approaching of the terminal seg-ment to the hole, as well as the reverse process, that isthe withdrawing of the last segment from the hole andmoving away of the whole macromolecule far from thewall, also involve a change in the conformational entropyof the polymer.
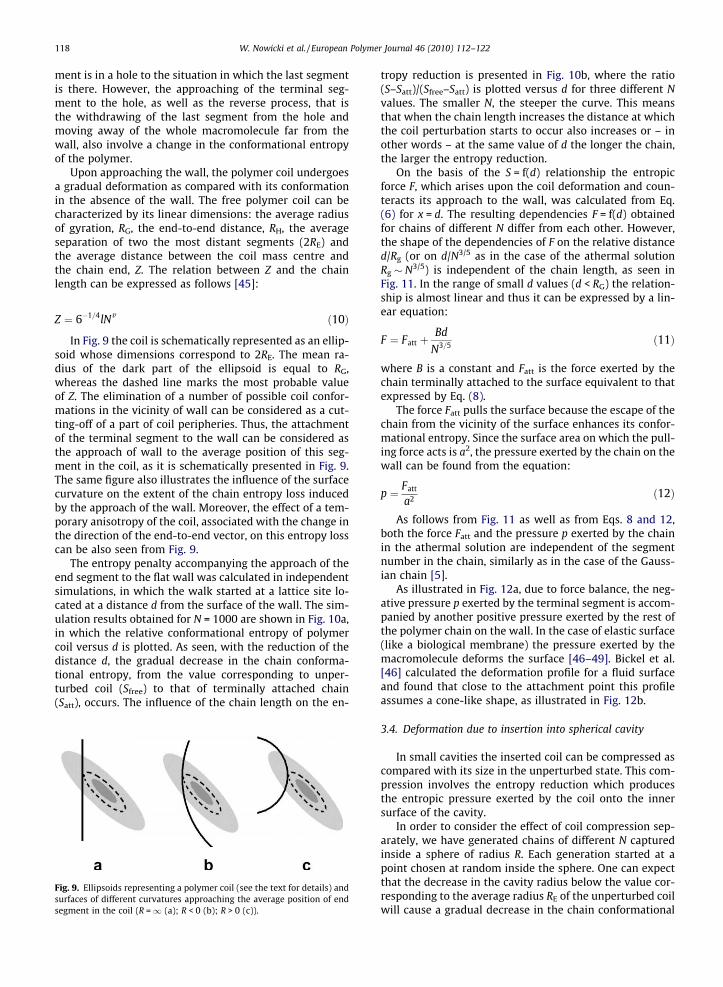
Upon approaching the wall, the polymer coil undergoesa gradual deformation as compared with its conformationin the absence of the wall. The free polymer coil can becharacterized by its linear dimensions: the average radiusof gyration, RG, the end-to-end distance, RH, the averageseparation of two the most distant segments (2RE) andthe average distance between the coil mass centre andthe chain end, Z. The relation between Z and the chainlength can be expressed as follows [45]:
Z ¼ 6�1=4lNv ð10Þ
In Fig. 9 the coil is schematically represented as an ellip-soid whose dimensions correspond to 2RE. The mean ra-dius of the dark part of the ellipsoid is equal to RG,whereas the dashed line marks the most probable valueof Z. The elimination of a number of possible coil confor-mations in the vicinity of wall can be considered as a cut-ting-off of a part of coil peripheries. Thus, the attachmentof the terminal segment to the wall can be considered asthe approach of wall to the average position of this seg-ment in the coil, as it is schematically presented in Fig. 9.The same figure also illustrates the influence of the surfacecurvature on the extent of the chain entropy loss inducedby the approach of the wall. Moreover, the effect of a tem-porary anisotropy of the coil, associated with the change inthe direction of the end-to-end vector, on this entropy losscan be also seen from Fig. 9.
The entropy penalty accompanying the approach of theend segment to the flat wall was calculated in independentsimulations, in which the walk started at a lattice site lo-cated at a distance d from the surface of the wall. The sim-ulation results obtained for N = 1000 are shown in Fig. 10a,in which the relative conformational entropy of polymercoil versus d is plotted. As seen, with the reduction of thedistance d, the gradual decrease in the chain conforma-tional entropy, from the value corresponding to unper-turbed coil (Sfree) to that of terminally attached chain(Satt), occurs. The influence of the chain length on the en-
Fig. 9. Ellipsoids representing a polymer coil (see the text for details) andsurfaces of different curvatures approaching the average position of endsegment in the coil (R =1 (a); R < 0 (b); R > 0 (c)).
tropy reduction is presented in Fig. 10b, where the ratio(S–Satt)/(Sfree–Satt) is plotted versus d for three different Nvalues. The smaller N, the steeper the curve. This meansthat when the chain length increases the distance at whichthe coil perturbation starts to occur also increases or – inother words – at the same value of d the longer the chain,the larger the entropy reduction.
On the basis of the S = f(d) relationship the entropicforce F, which arises upon the coil deformation and coun-teracts its approach to the wall, was calculated from Eq.(6) for x = d. The resulting dependencies F = f(d) obtainedfor chains of different N differ from each other. However,the shape of the dependencies of F on the relative distanced/Rg (or on d/N3/5 as in the case of the athermal solutionRg � N3/5) is independent of the chain length, as seen inFig. 11. In the range of small d values (d < RG) the relation-ship is almost linear and thus it can be expressed by a lin-ear equation:
F ¼ Fatt þBd
N3=5 ð11Þ
where B is a constant and Fatt is the force exerted by thechain terminally attached to the surface equivalent to thatexpressed by Eq. (8).
The force Fatt pulls the surface because the escape of thechain from the vicinity of the surface enhances its confor-mational entropy. Since the surface area on which the pull-ing force acts is a2, the pressure exerted by the chain on thewall can be found from the equation:
p ¼ Fatt
a2 ð12Þ
As follows from Fig. 11 as well as from Eqs. 8 and 12,both the force Fatt and the pressure p exerted by the chainin the athermal solution are independent of the segmentnumber in the chain, similarly as in the case of the Gauss-ian chain [5].
As illustrated in Fig. 12a, due to force balance, the neg-ative pressure p exerted by the terminal segment is accom-panied by another positive pressure exerted by the rest ofthe polymer chain on the wall. In the case of elastic surface(like a biological membrane) the pressure exerted by themacromolecule deforms the surface [46–49]. Bickel et al.[46] calculated the deformation profile for a fluid surfaceand found that close to the attachment point this profileassumes a cone-like shape, as illustrated in Fig. 12b.
3.4. Deformation due to insertion into spherical cavity
In small cavities the inserted coil can be compressed ascompared with its size in the unperturbed state. This com-pression involves the entropy reduction which producesthe entropic pressure exerted by the coil onto the innersurface of the cavity.
In order to consider the effect of coil compression sep-arately, we have generated chains of different N capturedinside a sphere of radius R. Each generation started at apoint chosen at random inside the sphere. One can expectthat the decrease in the cavity radius below the value cor-responding to the average radius RE of the unperturbed coilwill cause a gradual decrease in the chain conformational
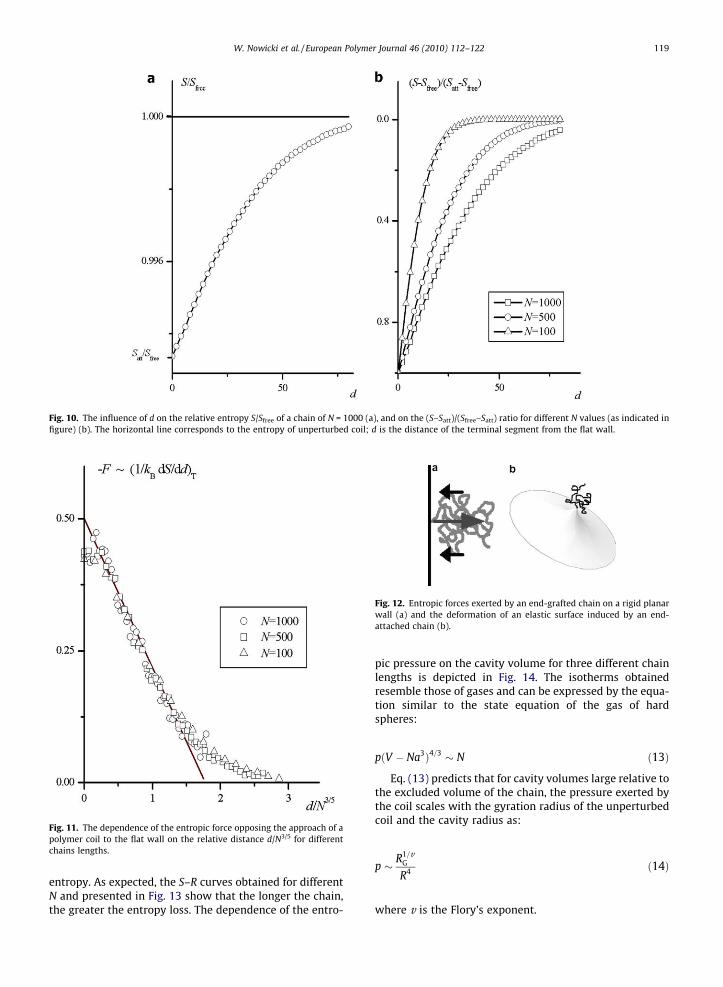
Fig. 10. The influence of d on the relative entropy S/Sfree of a chain of N = 1000 (a), and on the (S–Satt)/(Sfree–Satt) ratio for different N values (as indicated infigure) (b). The horizontal line corresponds to the entropy of unperturbed coil; d is the distance of the terminal segment from the flat wall.
Fig. 11. The dependence of the entropic force opposing the approach of apolymer coil to the flat wall on the relative distance d/N3/5 for differentchains lengths.
Fig. 12. Entropic forces exerted by an end-grafted chain on a rigid planarwall (a) and the deformation of an elastic surface induced by an end-attached chain (b).
W. Nowicki et al. / European Polymer Journal 46 (2010) 112–122 119
entropy. As expected, the S–R curves obtained for differentN and presented in Fig. 13 show that the longer the chain,the greater the entropy loss. The dependence of the entro-
pic pressure on the cavity volume for three different chainlengths is depicted in Fig. 14. The isotherms obtainedresemble those of gases and can be expressed by the equa-tion similar to the state equation of the gas of hardspheres:
pðV � Na3Þ4=3 � N ð13Þ
Eq. (13) predicts that for cavity volumes large relative tothe excluded volume of the chain, the pressure exerted bythe coil scales with the gyration radius of the unperturbedcoil and the cavity radius as:
p � R1=vG
R4 ð14Þ
where v is the Flory’s exponent.
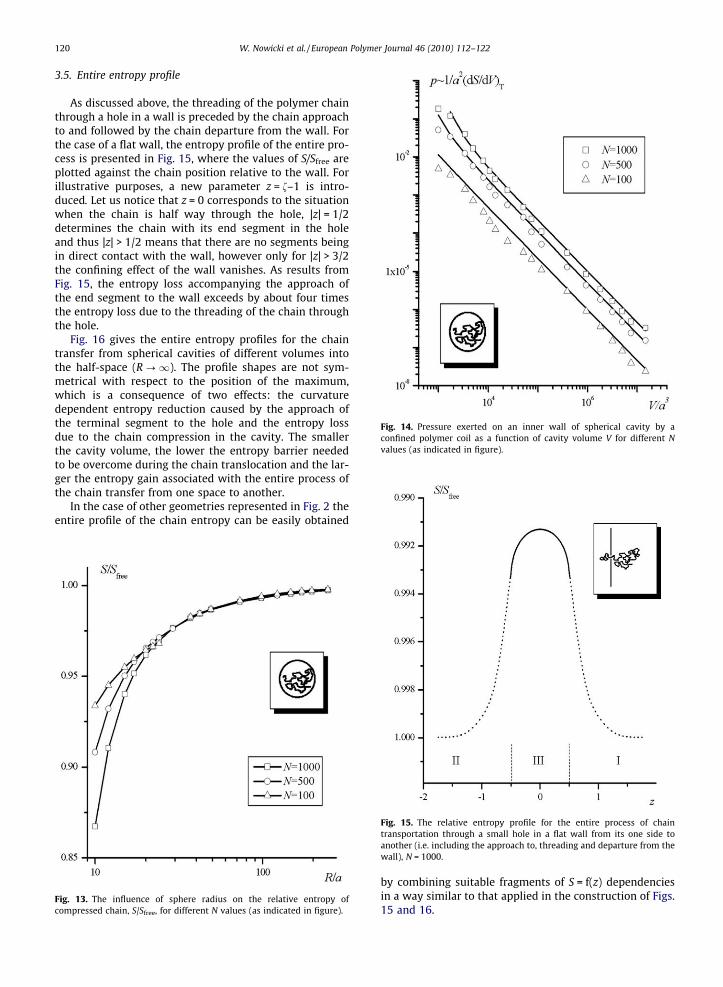
Fig. 14. Pressure exerted on an inner wall of spherical cavity by aconfined polymer coil as a function of cavity volume V for different Nvalues (as indicated in figure).
120 W. Nowicki et al. / European Polymer Journal 46 (2010) 112–122
3.5. Entire entropy profile
As discussed above, the threading of the polymer chainthrough a hole in a wall is preceded by the chain approachto and followed by the chain departure from the wall. Forthe case of a flat wall, the entropy profile of the entire pro-cess is presented in Fig. 15, where the values of S/Sfree areplotted against the chain position relative to the wall. Forillustrative purposes, a new parameter z = f–1 is intro-duced. Let us notice that z = 0 corresponds to the situationwhen the chain is half way through the hole, |z| = 1/2determines the chain with its end segment in the holeand thus |z| > 1/2 means that there are no segments beingin direct contact with the wall, however only for |z| > 3/2the confining effect of the wall vanishes. As results fromFig. 15, the entropy loss accompanying the approach ofthe end segment to the wall exceeds by about four timesthe entropy loss due to the threading of the chain throughthe hole.
Fig. 16 gives the entire entropy profiles for the chaintransfer from spherical cavities of different volumes intothe half-space (R ?1). The profile shapes are not sym-metrical with respect to the position of the maximum,which is a consequence of two effects: the curvaturedependent entropy reduction caused by the approach ofthe terminal segment to the hole and the entropy lossdue to the chain compression in the cavity. The smallerthe cavity volume, the lower the entropy barrier neededto be overcome during the chain translocation and the lar-ger the entropy gain associated with the entire process ofthe chain transfer from one space to another.
In the case of other geometries represented in Fig. 2 theentire profile of the chain entropy can be easily obtained
Fig. 13. The influence of sphere radius on the relative entropy ofcompressed chain, S/Sfree, for different N values (as indicated in figure).
Fig. 15. The relative entropy profile for the entire process of chaintransportation through a small hole in a flat wall from its one side toanother (i.e. including the approach to, threading and departure from thewall), N = 1000.
by combining suitable fragments of S = f(z) dependenciesin a way similar to that applied in the construction of Figs.15 and 16.
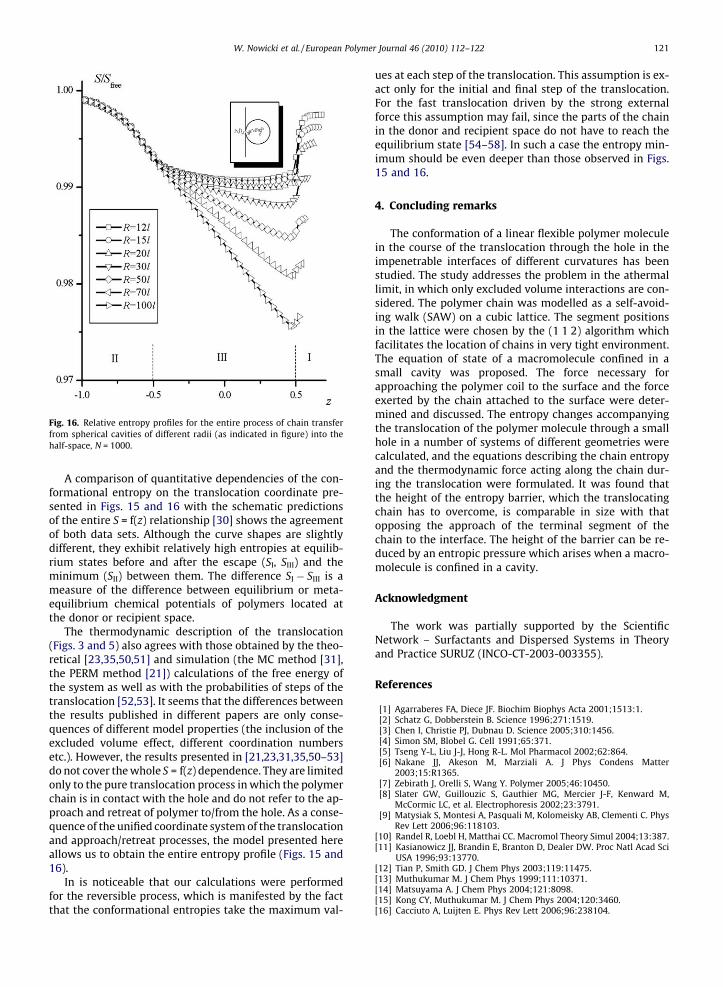
Fig. 16. Relative entropy profiles for the entire process of chain transferfrom spherical cavities of different radii (as indicated in figure) into thehalf-space, N = 1000.
W. Nowicki et al. / European Polymer Journal 46 (2010) 112–122 121
A comparison of quantitative dependencies of the con-formational entropy on the translocation coordinate pre-sented in Figs. 15 and 16 with the schematic predictionsof the entire S = f(z) relationship [30] shows the agreementof both data sets. Although the curve shapes are slightlydifferent, they exhibit relatively high entropies at equilib-rium states before and after the escape (SI, SIII) and theminimum (SII) between them. The difference SI � SIII is ameasure of the difference between equilibrium or meta-equilibrium chemical potentials of polymers located atthe donor or recipient space.
The thermodynamic description of the translocation(Figs. 3 and 5) also agrees with those obtained by the theo-retical [23,35,50,51] and simulation (the MC method [31],the PERM method [21]) calculations of the free energy ofthe system as well as with the probabilities of steps of thetranslocation [52,53]. It seems that the differences betweenthe results published in different papers are only conse-quences of different model properties (the inclusion of theexcluded volume effect, different coordination numbersetc.). However, the results presented in [21,23,31,35,50–53]do not cover the whole S = f(z) dependence. They are limitedonly to the pure translocation process in which the polymerchain is in contact with the hole and do not refer to the ap-proach and retreat of polymer to/from the hole. As a conse-quence of the unified coordinate system of the translocationand approach/retreat processes, the model presented hereallows us to obtain the entire entropy profile (Figs. 15 and16).
In is noticeable that our calculations were performedfor the reversible process, which is manifested by the factthat the conformational entropies take the maximum val-
ues at each step of the translocation. This assumption is ex-act only for the initial and final step of the translocation.For the fast translocation driven by the strong externalforce this assumption may fail, since the parts of the chainin the donor and recipient space do not have to reach theequilibrium state [54–58]. In such a case the entropy min-imum should be even deeper than those observed in Figs.15 and 16.
4. Concluding remarks
The conformation of a linear flexible polymer moleculein the course of the translocation through the hole in theimpenetrable interfaces of different curvatures has beenstudied. The study addresses the problem in the athermallimit, in which only excluded volume interactions are con-sidered. The polymer chain was modelled as a self-avoid-ing walk (SAW) on a cubic lattice. The segment positionsin the lattice were chosen by the (1 1 2) algorithm whichfacilitates the location of chains in very tight environment.The equation of state of a macromolecule confined in asmall cavity was proposed. The force necessary forapproaching the polymer coil to the surface and the forceexerted by the chain attached to the surface were deter-mined and discussed. The entropy changes accompanyingthe translocation of the polymer molecule through a smallhole in a number of systems of different geometries werecalculated, and the equations describing the chain entropyand the thermodynamic force acting along the chain dur-ing the translocation were formulated. It was found thatthe height of the entropy barrier, which the translocatingchain has to overcome, is comparable in size with thatopposing the approach of the terminal segment of thechain to the interface. The height of the barrier can be re-duced by an entropic pressure which arises when a macro-molecule is confined in a cavity.
Acknowledgment
The work was partially supported by the ScientificNetwork – Surfactants and Dispersed Systems in Theoryand Practice SURUZ (INCO-CT-2003-003355).
References
[1] Agarraberes FA, Diece JF. Biochim Biophys Acta 2001;1513:1.[2] Schatz G, Dobberstein B. Science 1996;271:1519.[3] Chen I, Christie PJ, Dubnau D. Science 2005;310:1456.[4] Simon SM, Blobel G. Cell 1991;65:371.[5] Tseng Y-L, Liu J-J, Hong R-L. Mol Pharmacol 2002;62:864.[6] Nakane JJ, Akeson M, Marziali A. J Phys Condens Matter
2003;15:R1365.[7] Zebirath J, Orelli S, Wang Y. Polymer 2005;46:10450.[8] Slater GW, Guillouzic S, Gauthier MG, Mercier J-F, Kenward M,
McCormic LC, et al. Electrophoresis 2002;23:3791.[9] Matysiak S, Montesi A, Pasquali M, Kolomeisky AB, Clementi C. Phys
Rev Lett 2006;96:118103.[10] Randel R, Loebl H, Matthai CC. Macromol Theory Simul 2004;13:387.[11] Kasianowicz JJ, Brandin E, Branton D, Dealer DW. Proc Natl Acad Sci
USA 1996;93:13770.[12] Tian P, Smith GD. J Chem Phys 2003;119:11475.[13] Muthukumar M. J Chem Phys 1999;111:10371.[14] Matsuyama A. J Chem Phys 2004;121:8098.[15] Kong CY, Muthukumar M. J Chem Phys 2004;120:3460.[16] Cacciuto A, Luijten E. Phys Rev Lett 2006;96:238104.
122 W. Nowicki et al. / European Polymer Journal 46 (2010) 112–122
[17] Sakaue T, Raphaël E. Macromolecules 2006;39:2621.[18] Milchev A, Binder K, Bhattacharya A. J Chem Phys 2004;121:6042.[19] Luijten E, Cacciuto A. Comp Phys Commun 2007;177:150.[20] Inamdar MM, Gelbart WM, Philips R. Biophys J 2006;91:441.[21] Shen Y, Hang L. Polymer 2007;48:3593.[22] Baumgärtner A, Skolnick J. Phys Rev Lett 1995;74:2142.[23] Sung W, Park PJ. Phys Rev Lett 1996;77:783.[24] Kong CY, Muthukumar M. Electrophoresis 2002;23:2697.[25] Huopaniemi I, Luo K, Ala-Nisssila T, Ying SC. J Chem Phys
2006;125:124901.[26] Qian J, Lu ZY, Li Z-S. Polymer 2007;48:3601.[27] Sousa AF, Pais AACC, Linse P. J Chem Phys 2005;122:214902.[28] Luo K, Ala-Nissila T, Ying S-C. J Chem Phys 2006;124:034714.[29] Luo M-B. Polymer 2005;46:5730.[30] Muthukumar M. Phys Rev Lett 2001;86:3188.[31] Chern SS, Cardenas AE, Coalson RD. J Chem Phys 2001;115:7772.[32] Loebl HC, Randel R, Goodwin SP, Mathai CC. Phys Rev E
2003;67:041913.[33] Xie Y, Yang H, Yu H, Shi Q, Wang X, Chen J. J Chem Phys
2006;124:174906.[34] Sikorski A, Romiszowski P. J Mol Model 2005;11:379.[35] Kejian D, Furu Z, Dongquin C, Zengliang Y. Biochem Biophys Res
Commun 2006;341:139.[36] Lubensky DK, Nelson DR. Biophys J 1999;77:1824.[37] Kantor Y, Kardar M. Phys Rev E 2004;69:021806.[38] Muthukumar M. J Chem Phys 2003;118:5174.[39] Frenkel D. Introduction to Monte Carlo methods. In: Attig N, Binder
K, Grubmüller H, Kremer K, editors. Computational soft matter: fromsynthetic polymers to proteins, lecture notes, vol. 23. Jülich; 2004. p.29–60.
[40] Zhao D, Huang Y, He Z, Qian R. J Chem Phys 1996;104:1672.[41] Nowicki W, Nowicka G, Narkiewicz-Michałek J. Polymer
2009;50:2161.[42] Sokal AD. In: Binder K, editor. Monte Carlo and molecular dynamics
simulations in polymer science. New York: Oxford University Press;1995.
[43] Gan HH, Tropsha A, Schlick T. J Chem Phys 2000;113:5511.[44] Skolnick J, Kolinski A. Adv Chem Phys 1990;78:223.[45] Nowicki W. Macromolecules 2002;35:1424.[46] Bickel T, Jeppesen C, Marques CM. Eur Phys J E 2001;4:33.[47] Lipowsky R, Döbereiner H-G, Hiergeist C, Indrani V. Physica A
1998;249:536.[48] Lipowsky R. Colloids Surf A Physicochem Eng Aspects 1997;128:255.[49] Tribet C, Vial F. Soft Matter 2008;4:68.[50] Chuang J, Kantor Y, Kardar M. Phys Rev E 2001;65:011802.[51] Park PJ, Sung W. Phys Rev E 1998;57(1):730.[52] Cifra P. Macromolecules 2005;38:3984.[53] Cifra P. J Chem Phys 2006;124:024706.[54] Panja D, Barkema GT, Ball RC. J Phys Condens Matter
2007;19:432202.[55] Panja D, Barkema GT, Ball RC. J Phys Condens Matter
2008;20:075101.[56] Vocks H, Panja D, Barkema GT, Ball RC. J Phys Condens Matter
2008;20:095224.[57] Dubbeldam JLA, Milchev A, Rostiashvili VG, Vilgis TA. Europhys Lett
2007;79:18002.[58] Dubbeldam JLA, Milchev A, Rostiashvili VG, Vilgis TA. Phys Rev E
2007;76:010801.