Monitoring of wildfires in boreal forests using large area AVHRR NDVI composite image data
11
REMOTE SENS. ENVIRON. 45:61-71 (1993) Monitoring of Wildfires in Boreal Forests Using Large Area AVHRR NDVI Composite Image Data Eric S. Kasischke and Nancy H. F. French Center for Earth Sciences, Environmental Research Institute of Michigan, Ann Arbor Peter Harrell and Norman L. Christensen, Jr. School of the Environment, Duke University, Durham Susan L. Ustin Department of Land, Air and Water Resources, University of California, Davis Donald Barry Alaska Fire Service, U.S. Bureau of Land Management, Fairbanks Normalized difference vegetation index (NDVI) However, the total area contained within the fire composite image data, produced from A VHRR data boundaries mapped by A VHRR were only 61% of collected in 1990, were evaluated for locating and those mapped by the field observers. However, the mapping the areal extent of wildfires in the boreal A VHRR data used in this study did not span the forests of Alaska during that year. A technique entire time period during which fires occurred, and was developed to map forest fire boundaries by it is believed the areal estimates could be improved subtracting a late-summer A VHRR NDVI image significantly if an expanded A VHRR data set were from an early summer scene. The locations and used. boundaries of wildfires within the interior region of Alaska were obtained from the Alaska Fire Ser- INTRODUCTION vice, and compared to the AVHRR-derived fire- boundary map. It was found that AVHRR detected In severe fire seasons, large areas of interior Alaska 89.5% of all fires with sizes greater than 2000 ha are burned in wildfires. The area burned during with no false alarms and that, for most cases, the the 1990 fire season in Alaska (1.28 million ha or general shape of the fire boundary detected by 12,800 km 2) was the fifth highest total since rec- AVHRR matched those mapped byfield observers, ord keeping began in 1940. A significant amount of the area burned in 1990 (and other years as well) occurred in a few large fires. Of the total Address correspondence to Eric S. Kasisehke, P.O. Box 134001, Ann Arbor, MI 48113-4001. area burned in 1990, 84% were in fires larger Received 9 March 1992; revised 3 September 1992. than 10,000 ha or 100 km 2, and almost 98% in 0034-4257 / 93 / $6.00 ©Elsevier Science Publishing Co. Inc., 1993 655 Avenue of the Americas, New York, NY 10010 61
Transcript of Monitoring of wildfires in boreal forests using large area AVHRR NDVI composite image data

REMOTE SENS. ENVIRON. 45:61-71 (1993)
Monitoring of Wildfires in Boreal Forests Using Large Area AVHRR NDVI Composite Image Data
Eric S. Kasischke and Nancy H. F. French Center for Earth Sciences, Environmental Research Institute of Michigan, Ann Arbor
Peter Harrell and Norman L. Christensen, Jr. School of the Environment, Duke University, Durham
Susan L. Ustin Department of Land, Air and Water Resources, University of California, Davis
Donald Barry Alaska Fire Service, U.S. Bureau of Land Management, Fairbanks
Normalized difference vegetation index (NDVI) However, the total area contained within the fire composite image data, produced from A VHRR data boundaries mapped by A VHRR were only 61% of collected in 1990, were evaluated for locating and those mapped by the field observers. However, the mapping the areal extent of wildfires in the boreal A VHRR data used in this study did not span the forests of Alaska during that year. A technique entire time period during which fires occurred, and was developed to map forest fire boundaries by it is believed the areal estimates could be improved subtracting a late-summer A VHRR NDVI image significantly if an expanded A VHRR data set were from an early summer scene. The locations and used. boundaries of wildfires within the interior region of Alaska were obtained from the Alaska Fire Ser- INTRODUCTION vice, and compared to the AVHRR-derived fire- boundary map. It was found that AVHRR detected In severe fire seasons, large areas of interior Alaska 89.5% of all fires with sizes greater than 2000 ha are burned in wildfires. The area burned during with no false alarms and that, for most cases, the the 1990 fire season in Alaska (1.28 million ha or general shape of the fire boundary detected by 12,800 km 2) was the fifth highest total since rec- AVHRR matched those mapped byfield observers, ord keeping began in 1940. A significant amount
of the area burned in 1990 (and other years as well) occurred in a few large fires. Of the total
Address correspondence to Eric S. Kasisehke, P.O. Box 134001, Ann Arbor, MI 48113-4001. area burned in 1990, 84% were in fires larger
Received 9 March 1992; revised 3 September 1992. than 10,000 ha or 100 km 2, and almost 98% in
0034-4257 / 93 / $6.00 ©Elsevier Science Publishing Co. Inc., 1993 655 Avenue of the Americas, New York, NY 10010 61

62 Kasischke et al.
fires larger than 1000 ha or 10 km 2. Because of 1. What is the detection accuracy on AVHRR their large sizes and remoteness, forest fires in imagery for fires >400 ha in size? boreal regions are suitable for monitoring with 2. How does the total areal extent estimated lower-resolution satellite sensing systems, from AVHRR data compare to that esti-
During the summer of 1991, the EROS Data mated from field records? Center (EDC) of the U.S. Geologic Survey pro- 3. For larger fires (> 10,000 ha), how do the duced a set of composite images of the state of boundaries mapped fi'om AVHRR images Alaska from data collected by NOAA's Advanced compare to those mapped from field Very High Resolution Radiometer (AVHRR) dur- records? ing 1990 and 1991. The images were generated from AVHRR source data of 1.1 km resolution, which were resampled to 1 km × 1 km pixels and BACKGROUND composited over 15-16 day intervals to create the bimonthly data sets. This compositing technique Depending upon whose figures are used, boreal utilized the maximum normalized vegetation in- forests cover between 8% (Schlesinger, 1984)and dex (NDVI) "greenness" value as the basis of 10% (Olson et al., 1978) of the world's land selection of pixels for each image. This methodol- surface. Literature references strongly suggest ogy is the same as that used to produce the that these ecosystems may be of critical impor- biweekly composite AVHRR images of the conter- tance in global climate change studies because of minous United States (Sadowski and Watkins, their role as a source and sink of greenhouse 1991; Eidenshink, 1992), which have been re- gases. For example, it has been estimated by cently used to develop aland-cover characteristics Olson et al. (1978) that boreal forests contain data set for the conterminous U.S. (Loveland et 25.5% of the carbon sequestered in aboveground al., 1992). In this article, we examine the NDVI biomass in terrestrial ecosystems. Schlesinger composite imagery produced from source data (1984) estimates that boreal forests contain 16.4% collected during the summer of 1990. of the below-ground carbon sequestered in terres-
Figure 1 presents two of the NDVI composite trial ecosystems. images produced by EDC. One image was gener- A major factor in many ecosystem processes ated from data collected between 15 and 30 June within boreal forests is the widespread occur- 1990, while the other was generated from data rence of wildfires (Wein and MacLean, 1983; collected between 1 and 15 August 1990. These Dyrness et al., 1986), which play an especially images are from the east central basin of Alaska important role in nutrient cycling and the release between the Alaska Range on the south and the of trace gases into the atmosphere (Crutzen et Brooks Range on the north, an area where a high al., 1979; Mooney et al., 1987). percentage of the wildfires in Alaska occur. It will The fire regime in the interior forests of Alaska be shown in this article that the large areas in the is not dissimilar to forests found in the northern August image exhibiting a significant decrease in regions Canada and Eurasia. We shall use data the NDVI value correspond with the boundaries on Alaska fires to illustrate some properties of of the large wildfires that occurred in this region boreal forests. In Figure 2a we present a plot of during the 1990 fire season. Mthough the AVHRR the total areal extent of the boundaries of wildfires is not directly detecting the fire itself, it is de- in Alaska since 1940 (Alaska Fire Service, 1991; tecting a scar left on the landscape which is the Gabriel and Tande, 1983). Over this time period, result of severe damage to the vegetation cover. 17.6 million ha of land were subjected to wildfire, We utilize this scar as a surrogate for estimation representing approximately 18% of the boreal of the areal extent of the fire. forest region of Alaska. Over 75% of the area
The overall goal of the research presented in burned in the past half century occurred during this article is to evaluate the utility of composite- fires occurring in only 12 years (Fig. 2a) within AVHRR data for determining the locations and this time period (e.g., 1940, 1941, 1946, 1947, mapping the areal extent of wildfires (via detec- 1950, 1954, 1957, 1969, 1977, 1988, 1990, 1991). tion of burn scars) in boreal forest ecosystems. The occurrence of fires in Alaska in any given More specifically, this research focused on an- year is highly dependent upon the availability of swering the following questions: moisture during the growing season (Dyrness et

Monitoring Wildfires in Boreal Forests 63
1,000 ha in size, 98% occurred in fires greater than 1,000 ha in size, 85% greater than 10,000 ha in size, and 66 % occurred in fires greater than 25,000 ha in size. The four largest fires during this time period were 117,000 ha, 162,000 ha, 186,000 ha, and 219,000 ha, respectively. Each of these fires represents a larger area than was burned during the entire fire season from 25 other years during the last half century.
From a climate change standpoint, not only is the study of the occurrence of fire in boreal forests important for the cycles of greenhouse gases, but they may also be an indicator of changes in climate patterns. This results from the sensitiv- ity of fire in boreal forests to climate conditions (Wien and MacLean, 1983). Figure 2b illustrates the longer-term trends in the fire history record. This plot was generated by a running average of the area burned for a given year with the areas of the previous two and subsequent two fire seasons. This plot shows there were four major fire periods during the past half century, the result of either extremely high individual fire years (e.g., 1957 and 1969) or several significant fire years grouped together (e.g., 1940 and 1941; and 1988, 1990, and 1991). This plot suggests there is a longer- term periodicity to climatic factors controlling wildfires in boreal forests.
Although adequate historical and annual rec- ords are available for Alaska, information concern-
Figure 5. False-color IR image of test area generated from Bands 1 and 2 of the June 1990 AVHRR data with the AVHRR-detected fire scars presented in yellow.
Figure 1. Composite 1990 AVHRR images of the interior of Alaska produced by the EROS Data Center. Green indi- cates a high NDVI, yellow and red are low values, and white areas are very low to zero NDVI. The top image was generated from data collected between 15 and 30 June 1990, the bottom image from data collected between 1 and 15 August. Large areas in the August image that ex- hibit a drop in NDVI correspond to the locations of wild- fires that occurred during the summer of 1990.
al., 1986), with severe fire years occurring during the drier, warmer springs and summers. During severe fire years, large fires are the rule rather than the exception. For example, during the years 1988, 1990, and 1991, a total of 2.84 million ha of boreal forest burned in the state of Alaska. Of this total area, 1.6% occurred in fires less than

64 Kasischke et al.
(") Alaska Wildfires annual area burned
25O0OOO
2 0 0 0 0 0 0 ¸
"O m 1 5 0 0 0 0 0 E
° I ~ 1000O00.
A A 1
0 , 1935 19'45 1955 1965 1975 19'85 1995
Year
Alaska Wildfires five-year average
1000000-
800000 -
t -
"0 600000- - -
E
400000-
2 0 0 0 0 0 - - -
Figure 2. Are',d extent of wildfires in the state of Alaska from historical records: a) Plot of total hectares burned in wildfires in Alaska
935 19T45 19r55 19r65 19T75 19r85 1995 for the period of 1940-1991; b) 5-year aver- Year age of area burned per year.
ing the total area of boreal forests burned on a nautics and Space Administration (NASA)is using global basis is not easily obtained. Crutzen et al. this capability to coordinate the collection of a (1979) estimate that be tween 1 million ha and daily global AVHRR for an 18-month period span- 1.5 million ha of boreal forest burn every year. ning 1992 and 1993 as parts of its Earth Observing However, given that the boreal forests of Alaska System. Because a significant portion of the burned represent approximately 4% of the world's total, boreal forest occurs in events which cover large extrapolation of the area burned in Alaska each areas, the 1 km AVHRR data may provide a useful year (340,000 ha per year average since 1940) means for estimation of forest fire extent in north- leads to an estimate of 8.5 million ha per year on ern regions on a global basis. In addition, analysis a global scale, of these data may provide additional information
The AVHRR system has the capability to map on the severity of the fires, as well as on the the entire world, including its boreal forests in an patterns of regrowth of vegetation on these sites. efficient and timely manner. The National Aero- Such information is important in a variety of eco-

Monitoring Wildfires in Boreal Forests 65
which were copied onto U.S. Geological Survey 1 ° × 3 ° quad sheets.
There are several methods used to generate the fire boundary map. For those fires which are being actively managed, careful records of the boundaries of fires are maintained because of the need to precisely locate areas requiring fire suppression efforts. Upon completion of an event, the final boundary maps are transferred to perma- nent record. For large fires which are not actively managed, a fire observer maps the boundary of the fires from observations made from a light aircraft.
.... p J With respect to comparison with the AVHRR data set, there are several aspects of the accuracy Figure 3. Study area location in the state of Alaska. of the AFS fire maps which must be considered. First, there is the question of how well does the
system process studies, and is not readily derived outer edge of the fire boundary mapped by visual from ground-based records and/or studies, observation actually match reality. We feel that
in most cases, the boundaries match fairly well, to within 1-2 km. We base this assessment on
METHODOLOGY the fact that there is a high degree of terrain relief or the presence of significant land attributes (e.g.,
The location of the study area is presented in lakes, rivers, etc.) to provide benchmarks to the Figure 3. The southern boundary for the study field observers. In addition, most field observers area was the Alaska Range, and the northeastern have a large degree of familiarity of the area they boundary is the Brooks Range. These mountain are working in.
The second question of accuracy has to do ranges are above the tree line, and have extensive with the characteristics of the fires themselves. glacier fields as well. Hence they are easily mapped on the AVHRR imagery as areas with Fires do not burn uniformly throughout an area, low NDVI that remain unchanged between the and thus the resultant scarring to the vegetation,
which is detected on AVHRR imagery, will not two dates (see Fig. 1). be uniform. A portion of the fire area mapped by
the AFS is likely to have little or no fire scar because of little fire impact on a certain portion
Mapping of Fire Boundaries from of the area. Thus, we would expect the areal Historical Records
extent of the fires estimated by the AFS to be an During 1990, a total of 76 fire events whose upper bound. How much of an overestimation mapped boundaries contained areas larger than these boundaries represent is difficult to estimate 400 ha occurred within the study area. Most of without further research. the large-scale wildfires in remote regions of The fire boundaries were digitized and en- Alaska are started by lightning strikes, and thus tered into a computer geographic information sys- an event is typically the combination of numerous tem (GIS) data base. Information on each mapped small fires which eventually merge to some de- fire was added to this database for use in the gree. These events represent 70% of all area analysis. This additional information included the burned in the state for 1990. During the summer start and stop dates for each fire, fire-boundary of 1991, records on all fire events that occurred size, and the latitude and longitude of the origin in the study area for the 1990 fire season were point for each fire (as provided by the AFS). Using obtained from the Alaska Fire Service, Bureau of the data base, the boundaries from the different Land Management, located in Fairbanks, Alaska. fires were combined and mapped into an appro- These records contained hand-drawn maps of the priate geographic projection. For this study, we fire boundaries derived from field observations, employed the Albers Equal Area Projection using

66 Kasischke et al.
1990 FIRES Interior Alaska
Lat . 6 2 . 0 0 - 6 8 . 0 0 ~
Long 1 4 1 . 0 0 - 1 5 5 . 0 0 I +
151.0|1 i l . oon +
~c
• - .* 7 * * ~ * . Fa i r~nks . .
*
• , . 4 ~ 2 -g • O r i g i n - A l l F i r e s
. 8 o u n d o r i e s - F i r e s > 1 0 , 0 0 0 ho 8
+ I I I I + 12.ooz e m ~ee 2ee 3ee ~4~ .on
Figure 4. Map of points of origins of all fires and boundaries of fires > 10,000 ha in size h)cated in the test region. Also plotted on the map are the two major rivers (Tanana and Yukon) which flow through the test site.
the same projection attributes as the EDC-gener- Mapping of Fire Boundaries from AVHRR ated AVHRR data sets. This allowed us to compare NDVI Data readily the mapped fire boundaries provided by the Alaska Fire Service to the boundaries mapped Two sets of 14-day composite AVHRR imagery from the AVHRR data set. Figure 4 presents a p roduced by the EROS Data Center were used in map of the points of origin for all fires within the this analysis: 1) one generated from data collected study area, as well as the boundaries of those fires be tween 15 and 30 June 1990; and 2) one gener- whose size was greater than 10,000 ha. ated from data collected be tween I and 15 August

Monitoring Wildfires in Boreal Forests 67
1990. The approach used to analyze the AVHRR the Alaska Fire Service. The number of detections data set included the following steps: First, the and false alarms were then tabulated. NDVI channels for the two dates were normalized The areal extent of the AVHRR-detected fires to one another by selection of an area with high was then compared to those represented by the NDVI (e.g., forested areas) and an area with low digitized fire records. Using the initial threshold NDVI (the ice fields of the Alaskan Range) in oft1 = 23, it was found that the AVHRR-estimated both images, and calculating an offset which was areas were considerably smaller than the fire rec- applied to the August data. It was found that the ord areas. To try to improve this detection accu- minimum NDVI remained the same, while the racy, a second detection image was generated maximum value increased between June and Au- with a second threshold (t2 = 18) 20% lower than gust. After this normalization, the August NDVI tl. The boundaries of the fires that were detected values were subtracted from the June NDVI val- from the second threshold were then converted ues; those values which were above a certain to a vector format and imported into the GIS threshold were then considered to be candidate data base, and their areas compared to the areas burned areas, contained in the fire records.
Next, any detections which were located above the treeline (> 750 m elevation in interior Alaska) along with any pixels within 1 km of major RESULTS river systems were eliminated for consideration as potential fires. The latter pixels were eliminated Using the initial threshold of an NDVI difference because although the geometric registration ap- of 23 between the two images resulted in detec- peared to be quite good, some misregistration tion of 35 out of the 78 fires with areas of 1 pixel should be expected, and therefore false alarms may (1 km z) or larger. However, using the 1-pixel size occur due to the low NDVI of a river signature, criteria also resulted in a large number (76) false
The initial threshold (t 0 chosen for determin- alarms. If we counted only those polygons con- ing areas of significant change between the two taining a minimum of 2 pixels, the number of images was an NDVI difference of 23. This thresh- detections dropped by one to 34, and the number old level was selected because it resulted in a of false alarms was lowered to three, two of which number of detected fires which was within the were 2 pixels in size and one of which was 4 same order of magnitude as the number of fires pixels in size. The areas of these false alarms which have occurred in this region in the past. represent < 0.001% of the total acreage burned Based upon past history, the upper boundary of in this region for the entire summer of 1990. fires > 400 ha in size expected for this region is Thus, although the overall level of false alarms 100. A threshold of tl = 23 resulted in 111 possible may seem to be high relative to the total number fires, while a threshold of tl = 24 resulted in > 250 of fires (8.5 %), they are insignificant relative to possible fires, the total area burned.
The boundaries of all remaining detected Table 1 summarizes the detection statistics polygons with areas were converted to a vector for six different fire size classes (note: 100 ha = 1 format and imported into the GIS data base. Fig- AVHRR composite image pixel): 1) 400-1000 ha; ure 5 presents a false-color AVHRR image of the 2) 1000-2000 ha; 3) 2000-5000 ha; 4) 5000- test site, with the differences detected in the 10,000 ha; 5)10,000-40,000 ha; and 6)>40,000 above process displayed in yellow. Comparison of ha. From this table, it can be seen that the detec- these areas to the fire locations in Figure 4 shows tion rate improves significantly for fire sizes a clear correlation. > 1000 ha. For fires with a size greater than 1000
ha, the rate of detection was 73.2 % (with no false alarms). For fires with a size greater than 2000
Data Analysis ha, the rate of detection of 89.5% (with no false The accuracy of using the AVHRR data set for alarms). Review of the start and stop dates for fire detection was determined by comparing the the four missed fires showed that one (fire no. locations ofthe polygons derived from the change- 126) had expired prior to the middle of June. detection image to the fire locations derived from After fires, there can be a significant amount of
68 Kasischke et al.
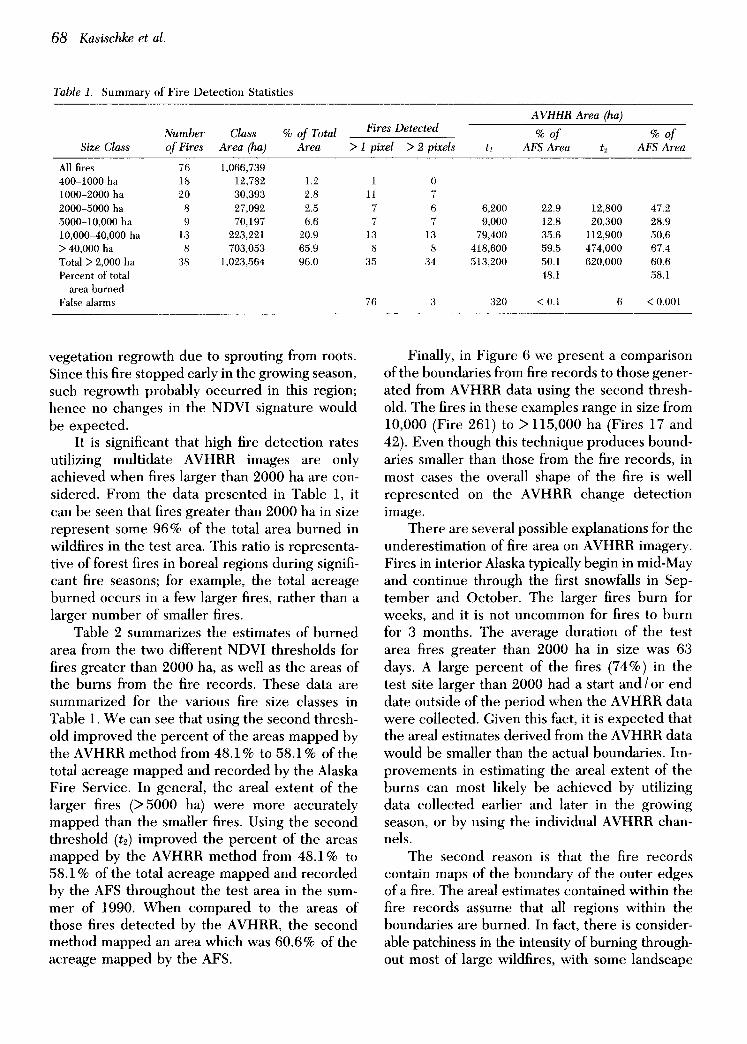
Table 1. Su m m ary of Fire Detec t ion Statistics
A VHHR Area (ha)
Number Class % of Total Fires Detected % of % of Size Class of Fires' Area (ha) Area > 1 pixel > 2 pixels t1 AFS Area t2 AFS Area
All fires 76 1,066,739 400-1000 ha 18 12,782 1.2 1 0 1000-2000 ha 20 30,393 2.8 11 7 2000-5000 ha 8 27,092 2.5 7 6 6,200 22.9 12,800 47.2 5000-10,000 ha 9 70,197 6.6 7 7 9,000 12.8 20,300 28.9 10,000-40,000 ha 13 223,221 20.9 13 13 79,400 35.6 112,900 50.6 > 40,000 ha 8 703,053 65.9 8 8 418,600 59.5 474,000 67.4 Tota] > 2,000 ha 38 1,023,564 96.0 35 34 513,200 50.1 620,000 60.6 Percent of total 48.1 58.1
area burned False 'alarms 76 3 320 < 0.1 6 < 0.001
vegetation regrowth due to sprouting from roots. Finally, in Figure 6 we present a comparison Since this fire stopped early in the growing season, of the boundaries from fire records to those gener- such regrowth probably occurred in this region; ated from AVHRR data using the second thresh- hence no changes in the NDVI signature would old. The fires in these examples range in size from be expected. 10,000 (Fire 261) to > 115,000 ha (Fires 17 and
It is significant that high fire detection rates 42). Even though this technique produces bound- utilizing multidate AVHRR images are only aries smaller than those from the fire records, in achieved when fires larger than 2000 ha are con- most cases the overall shape of the fire is well sidereal. From the data presented in Table 1, it represented on the AVHRR change detection can be seen that fires greater than 2000 ha in size image. represent some 96 % of the total area burned in There are several possible explanations for the wildfires in the test area. This ratio is representa- underestimation of fire area on AVHRR imagery. tive of forest fires in boreal regions during signifi- Fires in interior Alaska typically begin in mid-May cant fire seasons; for example, the total acreage and continue through the first snowfalls in Sep- burned occurs in a few larger fires, rather than a tember and October. The larger fires burn for larger number of smaller fires, weeks, and it is not uncommon for fires to burn
Table 2 summarizes the estimates of burned for 3 months. The average duration of the test area from the two different NDVI thresholds for area fires greater than 2000 ha in size was 63 fires greater than 2000 ha, as well as the areas of days. A large percent of the fires (74%) in the the burns from the fire records. These data are test site larger than 2000 had a start and/or end summarized for the various fire size classes in date outside of the period when the AVHRR data Table 1. We can see that using the second thresh- were collected. Given this fact, it is expected that old improved the percent of the areas mapped by the areal estimates derived from the AVHRR data the AVHRR method from 48.1% to 58.1% of the would be smaller than the actual boundaries. Im- total acreage mapped and recorded by the Alaska provements in estimating the areal extent of the Fire Service. In general, the areal extent of the burns can most likely be achieved by utilizing larger fires (>5000 ha) were more accurately data collected earlier and later in the growing mapped than the smaller fires. Using the second season, or by using the individual AVHRR chan- threshold (t2) improved the percent of the areas nels. mapped by the AVHRR method from 48.1% to The second reason is that the fire records 58.1% of the total acreage mapped and recorded contain maps of the boundary of the outer edges by the AFS throughout the test area in the sum- of a fire. The areal estimates contained within the mer of 1990. When compared to the areas of fire records assume that all regions within the those fires detected by the AVHRR, the second boundaries are burned. In fact, there is consider- method mapped an area which was 60.6 % of the able patchiness in the intensity of burning through- acreage mapped by the AFS. out most of large wildfires, with some landscape

Monitoring Wildfires in Boreal Forests 69
Table 2. Comparison of Actual versus AVHRR-Measured Areas of Fires in Interior Alaska for 1990 Fire Season
A VHRR Fire Data
Measured Threshold 1 Threshold 2 Fire Size % of % of
Fire No. (ha) Size (ha) Actual Size (ha) Actual
2000-5000 ha
89 2,188 1,100 50.3 2,000 91.4 210 2,409 1,000 41.5 1,300 54.0 368 2,623 600 22.9 1,500 57.2 319 3,320 undetected
91 3,692 600 16.3 1,300 35.2 75 3,982 1,500 37.7 2,700 67.8
436 4,222 undetected 322 4,656 1,400 30.1 4,000 85.9
5000-10,000 ha
347 5,169 900 17.4 1,700 32.9 302 6,385 undetected 348 7,328 2,200 30,0 3,800 51.9 126 7,763 undetected
43 7,996 1,300 16,3 2,200 27.5 183 8,118 1,600 19,7 2,300 28.3 434 8,617 300 3.5 2,100 24.4 297 9,250 1,400 15.1 5,200 56.2
2781415 9,571 1,300 13.6 3,000 31.3 10,000-40,000 ha
423 10,121 2,400 23.7 3,700 36.6 261 10,400 5,900 56.7 10,000 96.2 212 10,590 3,900 36.8 5,400 51.0 279 10,600 3,400 32.1 3,800 35.8 435 11,822 1,000 8.5 1,400 11.8 419 12,387 5,900 47.6 9,000 72.7 346 13,150 5,800 44.1 8,100 61.6 296 18,590 11,000 59.2 13,600 73.2 298 18,800 3,000 16.0 7,300 38.8 152 20,441 9,000 44.0 12,200 59.7 301 22,570 5,500 24.4 10,500 46.5 349 28,760 4,300 15.0 5,700 19.8 299 34,990 18,300 52.3 22,200 63.4
> 40,000 ha
320 41,090 31,500 76.7 35,200 85.7 228 44,880 37,500 83.6 44,000 98.0
88 53,850 31,400 58.3 36,900 68.5 421 66,919 10,200 15.2 16,100 24.1
229•262 74,330 57,300 77.1 67,200 90.4 17 117,500 70,600 60.1 72,300 61.5 42 116,500 79,300 68.1 86,200 74.0
437 187,984 100,800 53.6 116,100 61.8
units more susceptible to burning than others, biomass burning in the world's boreal forests. A Thus, the ground-truth used in this study in many desired end product of this system is a better cases most likely overestimates that actual area estimate of greenhouse gas emissions due to this burned, burning. Such estimates are of critical importance
to scientists studying global climate change, as well as to analysts who are developing policies
CONCLUSIONS to address global change issues, especially with respect to the present uncertainties in the sources
In this article, we have presented the initial re- and sinks of atmospheric CO2 in northern terres- sults of a project to develop a system to monitor trial ecosystems (see, e.g., Tans et al., 1990).

70 Kasischke et al.
AFS Boundary
~ AVHRR Boundary ~ .
Fire 349
( ~ Fire 301 Fire 261 ~
Fire 299
20 km derived boundaries of forest fires (rect- angular edges) to boundaries derived from Alaska Fire Service Records Fire 228 (smooth edges).
We have shown that two-date AVHRR data in the growing season. In addition, since the ma- can be used to detect the locations of the large- jority of acreage burned is contained within a few burned areas in the boreal regions of Alaska. The large fires, it would not be unreasonable to derive high detection rates for fires greater than 2000 better areal estimates from higher resolution sys- ha in size (which represent a very high portion of tems such as Landsat, Spot or the ERS-1 SAR [a the total acreage burned) considered with the recent study by Kasischke et al. (1992) shows that true impact of the false alarms (which represent fire boundaries are easily mapped on ERS-1 SAR an area < 0.001% of the total area burned in the imagery]. test site) demonstrates the potential for using In closing, we should note that there are sev- AVHRR to monitor boreal forest fires on a global eral aspects of biomass burning in boreal regions basis. Although the total acreage estimated by the which contrast sharply with biomass burning in AVHRR data was considerably lower than the other regions of the world, such as the rainforests areas mapped by the Alaska Fire Service, we of South America or the savannah regions of Af- believe that these estimates can be improved by rica. First, in these other regions, the sources of using AVHRR data sets collected earlier and later biomass burning are largely anthropogenic. In

Monitoring Wildfires in Boreal Forests 71
South America, it is associated with the slash and Crutzen, P. J., Heidt, L. E., Krasnec, J. P., Pollock, W. H., burn techniques used in recent ly cleared tracts of and Seiler, W. (1979), Biomass burning as a source of
atmospheric gases CO, H2, NzO, NO, CH3C1, and COS, rainforest. In Africa, biomass burning is associated Nature 282:253-256. with the annual burning of large areas used as pasture or being cultivated. In boreal regions, the Dyrness, C. T., Viereck, L. A., and Van Cleve, K. (1986),
Fire in taiga communities of interior Alaska, in Forest larger fires are almost entirely started by light- Ecosystems in the Alaskan Taiga (K. Van Cleve, F. S. ning. Human-caused fires represent a high per- Chapin III, P. W. Flanagan, L. A. Viereck, and C. T. centage of the number of fires, but they represent Dyrness, Eds.), Ecological Series Vol. 57, Springer- a very small percent of total area burned. Verlag, New York, pp. 74-86.
The second point of contrast is the size and Eidenshink, J. C. (1992), The 1990 conterminous U.S. n u m b e r of fires. Although many fires occur in AVHRR data set, Photogramm. Eng. Remote Sens., forth- boreal forests, relatively few large fires result in coming. the vast majority of acreage burned. In South Gabriel, H. W., and Tande, G. F. (1983), A Regional Ap- America and Africa, the cumulative effect of bio- proach to Fire History in Alaska, BLM-Alaska Technical
Report 9, Bureau of Land Management, Anchorage, AK, mass burning is the result of a large number of 34 pp. small fires.
These differences lead to alternate methods Kasischke, E. S., Bourgeau-Chavez, L. L., French, N. H. F., Harrell, P., and Christensen, N. L. Jr. (1992), Initial
of using AVHRR for detect ion ofbiomass burning, observations on the use of SAR imagery to monitor wild- For the smaller fires in South America and Africa, fires in boreal forests, Int. J. Remote Sens., forthcoming. the areal extent of burning is indirectly inferred Loveland, T. R., Merchant, J. W., Ohlen, D. O., and Brown, J. from the number and duration of thermal-signa- F. (1992), Development of a Land-Cover Characteristics tures or the extent of smoke plumes resulting Data Base for the Conterminous U.S., Photogramm. Eng. from fires (Malingreau et al., 1990). In boreal Remote Sens. 57:1453-1463. regions, it is bel ieved that areal extent of burning Malingreau, J. P., LaPorte, N., and Gregoire, J. M. (1990), can be directly mapped. Exceptional fire events in the tropics-southern Guinee,
January 1987, Int. J. Remote Sens. 11(12):2121-2123.
Mooney, H. A., Vitousek, P. M., and Matson, P. A. (1987), Exchange of materials between terrestrial ecosystems and
The research discussed in this paper was supported by the National Aeronautics and Space Administration under Grant the atmosphere, Science 238:926-932. No. NAGW-2645 to the Environmental Research Institute of Olson, J. S., Pfuderer, H. A., and Chan, Y. H. (1978), Changes Michigan, Grant No. NAGW-2692 to Duke University, and in the Global Carbon Cycle and the Biosphere, ORNL/ Grant No. NAGW-2636 to the University of California, Davis, ETS-109, Oak Ridge, TN, 169 pp. and by the Environmental Protection Agency, through Cooper- ative Research and Development Agreement No. CX819062- Sadowski, F. G., and Watkins, A. H. (1991), Development 01-0 to the Consortium for International Earth Science Infor- of land data sets for studies of global climate change, mation Network. Although this research was supported by the Proceedings of the ASPRS Convention, Baltimore, MD. EPA, it has not been subjected to Agency review and therefore Schlesinger, W. H. (1984), Soil organic matter: a source of does not necessarily reflect the views of the Agency and no oJ~cial endorsement should be inferred. The authors would atmospheric CO2, in The Role of Terrestrial Vegetation in like to thank ]. Colwell and C. Fox of ERIM for their support the Global Carbon Cycle-Measurement by Remote Sens- in processing the images used in this paper. Finally, we would ing (G. M. Woodwell, Ed.), Wiley, Chichester, pp. 111- also like to thank Laurent Guigni of the University of Montreal 127. for assisting us in digitizing the fire boundary maps used in Tans, P. P., Fung, I. Y., and Takahashi, T. (1990), Observa- this study, tional constraints on the global atmospheric COz budget,
Science 247:1431-1438.
R E F E R E N C E S Wein, R. W., and MacLean, D. A. (1983), The Role of Fire in Northern Circumpolar Ecosystems (Scope 18), Wiley,
Alaska Fire Service (1991), 1991 Fire Statistics and Season Chichester. Summary, Bureau of Land Management, U.S. Department of the Interior, Fairbanks, AK.