Monitoring of temperature profiles and surface morphologies during laser sintering of alumina...
9
Please cite this article in press as: B. Qian, et al., Monitoring of temperature profiles and surface morphologies during laser sintering of alumina ceramics, J. Asian Ceram. Soc. (2014), http://dx.doi.org/10.1016/j.jascer.2014.01.009 ARTICLE IN PRESS G Model JASCER 67 1–9 Journal of Asian Ceramic Societies xxx (2014) xxx–xxx Contents lists available at ScienceDirect Journal of Asian Ceramic Societies jo ur nal ho me page: www.elsevier.com/locate/jascer Monitoring of temperature profiles and surface morphologies during laser sintering of alumina ceramics Bin Qian a , Lauri Taimisto b , Antti Lehti b , Heidi Piili b , Olli Nyrhilä c , Antti Salminen b,d , Zhijian Shen a,∗ Q1 a University of Stockholm, Department of Materials and Environmental Chemistry, Arrhenius Laboratory, Stockholm University, Stockholm, Sweden b Lappeenranta university of Technology, Laser Processing Research Group, Lappeenranta, Finland c EOS Finland, Turku, Finland d Machine Technology Centre Turku Ltd, Turku, Finland a r t i c l e i n f o Article history: Received 30 November 2013 Received in revised form 21 January 2014 Accepted 22 January 2014 Available online xxx Keywords: Monitoring Laser sintering Ceramics Alumina a b s t r a c t Additive manufacturing of alumina by laser is a delicate process and small changes of processing parame- ters might cause less controlled and understood consequences. The real-time monitoring of temperature profiles, spectrum profiles and surface morphologies were evaluated in off-axial set-up for controlling the laser sintering of alumina ceramics. The real-time spectrometer and pyrometer were used for rapid monitoring of the thermal stability during the laser sintering process. An active illumination imaging system successfully recorded the high temperature melt pool and surrounding area simultaneously. The captured images also showed how the defects form and progress during the laser sintering process. All of these real-time monitoring methods have shown a great potential for on-line quality control during laser sintering of ceramics. © 2014 The Ceramic Society of Japan and the Korean Ceramic Society. Production and hosting by Elsevier B.V. All rights reserved. 1. Introduction The term “laser sintering”, when used in this article, is an empiri- Q2 cal term, which includes solid state sintering, liquid phase sintering or partial melting and melt-solidification processes. Laser sintering is belonging to the family of Laser Additive Manufacturing (LAM). This is a well-known technology for the fabrication of complex functional parts [1]. By using a combination of computer aided design (CAD) and computer aided manufacture (CAM) bodies can be “printed” directly into their final shape. A controlled high-energy laser beam is used to fuse particle granules directly into complex net-shaped 3D-components in a layer-by-layer manner. When the laser beam spot scans over the particle granules, they consoli- date either through sintering or melting/solidification reactions [2]. Often the components include designed functional features that ∗ Corresponding author. Tel.: +46 8 162388; mobile: +46 70 8796488. E-mail address: [email protected] (Z. Shen). Peer review under responsibility of The Ceramic Society of Japan and the Korean Ceramic Society. 2187-0764 © 2014 The Ceramic Society of Japan and the Korean Ceramic Society. Production and hosting by Elsevier B.V. All rights reserved. http://dx.doi.org/10.1016/j.jascer.2014.01.009 otherwise are difficult or even impossible to fabricate by other methods. In addition, this bottom-up approach allows the use of different laser scanning parameters in different parts of the con- solidated body to fit with different quality parameters [3]. Thus, overhanging structure parts are compensated for over-heating that might induce deformation or curving [4]. Real-time monitoring of the process has become important for detection of any unpredicted fault and for continuous control of the interior quality. Laser sintered plastic and metal parts, but no ceramic parts, have been produced in industrial scale. To prepare ceramic bodies effi- cient lasers are needed with carefully controlled parameters. The high melting point, low thermal conductivity and poor thermal shock resistance are examples of the intrinsic difficulties com- mon for laser sintering of ceramics [5]. Alumina (Al 2 O 3 ) is one of the most widely used ceramics because of its good mechani- cal strength, thermal and wear resistance properties, and the use of laser sintering for alumina is reported [6,7]. Laser-materials interactions, however, for different ceramics are much more com- Q3 plicated than for metals and are yet to be clearly understood in detail. Therefore, real-time monitoring of the laser process would Q4 be important to control the more sensitive sintering of ceramics. Measuring of temperatures and/or surface morphologies is used in metal laser sintering, but is less common for ceramics [8,9]. Real- time monitoring techniques are expected to become important tools for ceramic laser sintering and the different monitoring tech- niques need to be evaluated with respect to their performances. A control technique and general and better understandings of the laser–ceramic interactions will be important for further progress. 1 2 3 4 5 6 7 8 9 10 11 12 13 14 15 16 17 18 19 20 21 22 23 24 25 26 27 28 29 30 31 32 33 34 35 36 37 38 39 40 41 42 43 44 45 46 47 48 49 50 51 52 53 54 55 56 57 58 59 60 61 62 63 64
Transcript of Monitoring of temperature profiles and surface morphologies during laser sintering of alumina...

J
Ms
BQ1
a
b
c
d
a
ARRAA
KMLCA
1
Q2coiTfdblnldO
PC
2Ph
1
2
3
4
5
6
7
8
9
10
11
12
13
14
15
16
17
18
19
20
21
22
23
24
25
26
27
28
29
30
31
32
33
34
35
36
ARTICLE IN PRESSG ModelASCER 67 1–9
Journal of Asian Ceramic Societies xxx (2014) xxx–xxx
Contents lists available at ScienceDirect
Journal of Asian Ceramic Societies
jo ur nal ho me page: www.elsev ier .com/ locate / jascer
onitoring of temperature profiles and surface morphologies during laserintering of alumina ceramics
in Qiana, Lauri Taimistob, Antti Lehtib, Heidi Piili b, Olli Nyrhiläc, Antti Salminenb,d, Zhijian Shena,∗
University of Stockholm, Department of Materials and Environmental Chemistry, Arrhenius Laboratory, Stockholm University, Stockholm, SwedenLappeenranta university of Technology, Laser Processing Research Group, Lappeenranta, FinlandEOS Finland, Turku, FinlandMachine Technology Centre Turku Ltd, Turku, Finland
r t i c l e i n f o
rticle history:eceived 30 November 2013eceived in revised form 21 January 2014ccepted 22 January 2014vailable online xxx
a b s t r a c t
Additive manufacturing of alumina by laser is a delicate process and small changes of processing parame-ters might cause less controlled and understood consequences. The real-time monitoring of temperatureprofiles, spectrum profiles and surface morphologies were evaluated in off-axial set-up for controllingthe laser sintering of alumina ceramics. The real-time spectrometer and pyrometer were used for rapid
eywords:onitoring
aser sinteringeramicslumina
monitoring of the thermal stability during the laser sintering process. An active illumination imagingsystem successfully recorded the high temperature melt pool and surrounding area simultaneously. Thecaptured images also showed how the defects form and progress during the laser sintering process. Allof these real-time monitoring methods have shown a great potential for on-line quality control duringlaser sintering of ceramics.
© 2014 The Ceramic Society of Japan and the Korean Ceramic Society. Production and hosting by
omdsomtf
bchsmoc
37
38
39
40
41
42
43
44
45
46
47
48
49
50
51
52
. Introduction
The term “laser sintering”, when used in this article, is an empiri-al term, which includes solid state sintering, liquid phase sinteringr partial melting and melt-solidification processes. Laser sinterings belonging to the family of Laser Additive Manufacturing (LAM).his is a well-known technology for the fabrication of complexunctional parts [1]. By using a combination of computer aidedesign (CAD) and computer aided manufacture (CAM) bodies cane “printed” directly into their final shape. A controlled high-energy
aser beam is used to fuse particle granules directly into complexet-shaped 3D-components in a layer-by-layer manner. When the
aser beam spot scans over the particle granules, they consoli-ate either through sintering or melting/solidification reactions [2].ften the components include designed functional features that
Please cite this article in press as: B. Qian, et al., Monitoring of temperalumina ceramics, J. Asian Ceram. Soc. (2014), http://dx.doi.org/10.10
∗ Corresponding author. Tel.: +46 8 162388; mobile: +46 70 8796488.E-mail address: [email protected] (Z. Shen).
eer review under responsibility of The Ceramic Society of Japan and the Koreaneramic Society.
187-0764 © 2014 The Ceramic Society of Japan and the Korean Ceramic Society.roduction and hosting by Elsevier B.V. All rights reserved.ttp://dx.doi.org/10.1016/j.jascer.2014.01.009
oi Q3pd Q4bMmttnAl
53
54
55
56
57
58
59
60
Elsevier B.V. All rights reserved.
therwise are difficult or even impossible to fabricate by otherethods. In addition, this bottom-up approach allows the use of
ifferent laser scanning parameters in different parts of the con-olidated body to fit with different quality parameters [3]. Thus,verhanging structure parts are compensated for over-heating thatight induce deformation or curving [4]. Real-time monitoring of
he process has become important for detection of any unpredictedault and for continuous control of the interior quality.
Laser sintered plastic and metal parts, but no ceramic parts, haveeen produced in industrial scale. To prepare ceramic bodies effi-ient lasers are needed with carefully controlled parameters. Theigh melting point, low thermal conductivity and poor thermalhock resistance are examples of the intrinsic difficulties com-on for laser sintering of ceramics [5]. Alumina (Al2O3) is one
f the most widely used ceramics because of its good mechani-al strength, thermal and wear resistance properties, and the usef laser sintering for alumina is reported [6,7]. Laser-materialsnteractions, however, for different ceramics are much more com-
licated than for metals and are yet to be clearly understood inetail. Therefore, real-time monitoring of the laser process would
e important to control the more sensitive sintering of ceramics.easuring of temperatures and/or surface morphologies is used inetal laser sintering, but is less common for ceramics [8,9]. Real-
ime monitoring techniques are expected to become important
ature profiles and surface morphologies during laser sintering of16/j.jascer.2014.01.009
ools for ceramic laser sintering and the different monitoring tech-iques need to be evaluated with respect to their performances.
control technique and general and better understandings of theaser–ceramic interactions will be important for further progress.
61
62
63
64

ARTICLE IN PRESSG ModelJASCER 67 1–9
2 eramic Societies xxx (2014) xxx–xxx
imstwf
1
1
utt
Q
w
aloa
1
cftuoTatrtatTtr
1
fcgbtritubsa
2
Q5Aptp
Fig. 1. (a) The schematic diagram of the hatch line laser-scanning pattern is illus-trated. The hatch lines in the stripes are close (0.05 mm), whereas the strip widthisi
pwd
tmo(J
ETaabgsanfloaip
taefiCbthclt Q6epr
65
66
67
68
69
70
71
72
73
74
75
76
77
78
79
80
81
82
83
84
85
86
87
88
89
90
91
92
93
94
95
96
97
98
99
100
101
102
103
104
105
106
107
108
109
110
111
112
113
114
115
116
117
118
119
120
121
122
123
124
125
126
127
128
129
130
131
132
133
134
135
136
137
138
139
140
141
142
143
144
145
146
147
148
149
150
151
152
153
154
155
156
157
158
159
160
161
B. Qian et al. / Journal of Asian C
In this study, three different monitoring methods were exam-ned and compared during laser sintering of alumina ceramics. The
ain target is to evaluate real-time measurements by pyrometer,pectrometer and a surface imaging system. Their ability for con-rolling the laser process in production will be observed and tohat extent they might be used for a better understanding of the
undamental phenomena taking place.
.1. Laser sintering principles
.1.1. Standard parametersMost important parameters in laser sintering of ceramics are
sually laser power, focal spot size, scanning speed, hatch line pat-ern and scan distances. The total energy input Q (unit J/m) fromhe laser beam can be easily calculated as Eq. (1) shows.
= P
v(1)
here P is the laser power and v is the scanning speed [10].All these parameters can be set in the laser sintering program
nd kept constant or varied during the process. The complexity ofaser sintering of ceramics, however, demands a detailed controlbtained by real-time monitoring to set proper parameters and tovoid processing faults.
.1.2. The detecting elementIn principle, the detecting element can be installed either in a
o-axial or an off-axial manner [9,11,12]. An appropriate exampleor explaining the difference of these two modes is the tempera-ure monitoring. The co-axial set-up refers to the same scanningnit for material processing and monitoring, while off-axial set-upnly uses the laser beam without an additional scanning system.he advantage of a co-axial set-up is that the detector element islways focusing on the current process zone, but must considerhe restriction of the optical components. The semi-reflective mir-or could reflect almost all light from the laser wavelength and canransmit the melt pool radiation in other spectral ranges. The off-xial set-up does not have restrictions in system design, but thehermal radiation is captured from the entire heat-affected zone.hus, the obtained temperature would be lower than the maximumemperature within the focal spot, but the average temperature stilleflects the overall thermal state.
.1.3. Optical imagingThe co-axial imaging system records the real-time information
rom the melt pool and when coupled with a high-speed CMOSamera a monitor system will be achieved [13–15]. The melt pooleometry and evolution during the laser sintering process cane extracted from the 2D images. Simultaneous observation ofhe high and low temperature areas is difficult. It is possible toeduce the laser radiation intensity by a filter, but the capturedmages will then reflect the brightness contrasts and to enhancehe signals of cooler areas an additional diode illumination (LED) issed. The off-axial imaging system can be used for flaw detectiony identifying any deviations in the powder bed before the lasercanning and inspect the same consolidated surface morphologyfter laser sintering.
. Experiments
The powder material used was high purity �-alumina (99.99%
Please cite this article in press as: B. Qian, et al., Monitoring of temperalumina ceramics, J. Asian Ceram. Soc. (2014), http://dx.doi.org/10.10
l2O3 from TAIMICRON, ultrafine grade TM-DAR) with a meanarticle size of 0.10 �m. An X-ray diffraction (XRD) analysis ofhe powder (XRD equipment from Seifert, Ahrensburg, Germany)roved a single-phase corundum structure with narrow and strong
alpt
s 2 mm. (b) An illumined surface where a 4 mm square of alumina powder is laserintered with a heat input of 400 J/m. The image was captured by a CCD-cameramaging system and the illumination came from a strong LED laser source.
eaks and no detected crystalline contaminants. Alumina powderas pressed into tablets by uniaxial dry-pressing at 50 MPa. Theensity of pressed pellet is 2.26 g/m3.
To evaluate the different real-time monitoring techniques, theop layer of these alumina tablets is consolidated. Consolidated alu-
ina pieces were cleaned in an ultrasonic bath with a mixturef alcohol and water and characterized with optical microscopyOM, Olympus SZX12) and scanning electron microscopy (SEM,EOL JSM-7000F).
All studies described in this paper were made by using anOSINT M 270 Selective Laser Sintering system from EOS GmbH.he laser was a 200 W continuous wave Nd:YAG fiber laser with
Gaussian intensity profile operating at a wavelength of 1070 nmnd the typical focal spot diameter is 70 �m. All the tests wereased on laser sintering of one alumina layer at a time of the pressedreen bodies. The scanning hatch line pattern used in all tests ischematically illustrated in Fig. 1. The hatch line distance was fixedt 0.05 mm and the stripes can width was 2 mm, where this scan-ing pattern was set to a 4 mm square surface. The XRD analysis of aat surface of laser sintered alumina after cooling showed that thenly crystalline phase was �-alumina, with an obvious texture oflong [1 1 3]. The sintered alumina had a brittle fracture and SEMnspection of fracture sections revealed that very few pores wasresent, indicating a fully dense alumina.
The active illumination imaging system (manufactured by Cavi-ar) consists of a control unit, lighting system, control software and
CCD-camera. The imaging system mounted to the laser sinteringquipment is shown in Fig. 2a–d. The optics and the camera arexed outside the laser sintering machine. To prevent the camerasCD-array to solarize/over exposure, an additional lighting is doney a strong 810 nm light source (diode laser, Cavilux HF) attachedo the laser unit via optical fiber. This laser has a light with muchigher intensity compared to the thermal radiation [16,17]. Theamera has an optical filter with transmission mainly to this wave-ength and will decrease the light emission of the laser spot. Thus,he image contrasts or relates to the absorption and reflection prop-
rties in this wavelength. The camera can expose up to 30 frameser second and from time-expended videos it is possible to detectapid phenomena.
A pyrometer (Temperature-Control-System, TCS) is calibrated
ature profiles and surface morphologies during laser sintering of16/j.jascer.2014.01.009
nd used for on-line temperature measurement and control of theaser process. The optical head of the pyrometer, attached to sup-ort, was mounted inside the chamber and it was adjustable fromhe outside. Optical fibers transmit data into the pyrometer and the
162
163
164
165

ARTICLE IN PRESSG ModelJASCER 67 1–9
B. Qian et al. / Journal of Asian Ceramic Societies xxx (2014) xxx–xxx 3
F aging
l r whe
r1irpwstrbCevvtft
3
3
srifnltclsiaopT
ttitrs Q7a
etpmode Q8aaaDcsbTsatpTtaac[
166
167
168
169
170
171
172
173
174
175
176
177
178
179
180
181
182
183
184
185
186
187
188
189
190
191
192
193
194
195
196
197
198
199
200
201
202
203
204
205
206
207
208
209
210
211
212
213
214
215
216
217
218
219
220
221
222
223
224
225
226
227
228
229
230
231
232
233
234
ig. 2. The monitoring equipment, where (a and b) are the active illumination imocated inside the chamber. In (d) an image from the inside of the sintering chambe
adiation was divided into two measuring ranges 1200–400 nm and400–1700 nm. The chosen radiation ranges are optimal for study-
ng alumina (melting point 2072 ◦C) and relates to temperatureanges about 1400–1800/1800–2130 ◦C. For each recorded range ahoto-detector turns the radiation intensity into a photo-current,here the photo-current ratio is independent of the spectral emis-
ion coefficient at the work piece surface. This allows simpleemperature detection at different surfaces or of different mate-ials. The pyrometer uses a round-shaped detecting area that cane focused and the spectrometer (Ocean Optics HR2000+) uses aCD-array detector. The spectrometer can be used to record themission spectrum as intensity for each specific wavelength inter-al from 200 to 600 nm. It centers on the ultraviolet end of theisible light range (400–700 nm). Note the cut-off toward loweremperatures (600 nm) and that the measuring range is differentrom the pyrometer. The optical head of this spectrometer, attachedo a support, was mounted inside the chamber, see Fig. 2d.
. Results and discussion of monitoring methods
.1. Temperature by a pyrometer
An off-axial pyrometer set-up was used in the laser sinteringystem. The recordings cover the whole heat-affected zone andegister the highest average temperature when alumina powders consolidated. The observed variations of average temperature asunctions of the laser energy input (J/m), laser power (W) and scan-ing speeds (mm/s) are summarized in Fig. 3a–c, respectively. The
aser energy input, after adjusting for scanning speed, is expectedo give similar results. However, when scanning speed was keptonstant and laser power was varied, measured temperature isower than when laser power was kept constant and scanningpeed varied, see Fig. 3a. The temperature of the sintering processncreases rapidly, when energy input increases and reaches a level
Please cite this article in press as: B. Qian, et al., Monitoring of temperalumina ceramics, J. Asian Ceram. Soc. (2014), http://dx.doi.org/10.10
t 1900–2000 ◦C at heat input values of 400 J/m or laser powersf 20 W at 50 mm/s scanning speed. Thereafter, the average tem-eratures are at the same level, even when energy input increases.he heat diffuses outward as the formed alumina melt equilibrates
rtnm
system installed outside the chamber; (c) is the measuring unit of the pyrometern the spectrometer was in use.
hermally with the surroundings. When the input energy increasehe melt will also penetrate deeper into the body. Scanning speeds a parameter of importance as it influences the added energy perime unit. Increase in scanning speed from 50 mm/s to 150 mm/sesulted in a decrease of 100 ◦C in average process temperature, aseen in Fig. 3c. The faster the laser beam moves, the less time is
vailable to interact with the alumina material.The average temperature is not increasing linearly with the laser
nergy input. The laser beam provides a large amount of concen-rated energy in a blink of time into a limited area (70 �m) of theowder bed, inducing melting of the starting powder material. Theelting of alumina powder consumes energy, but stabilizes on the
ther hand at ∼2070 ◦C in the melted volume. The melt pool alwaysiffuses heat into the surrounding area and this process is influ-nced by many factors. Important is the very short time available
nd the ceramics low thermal conductivity, but also grain contactsnd other physical factors might affect the heat flow. The measuredverage will become a merged result of the different thermal states.uring these short interaction times the heat-affected zone will beomplicated by the laser beam scanning in a zigzag way, where thehort laser and materials interaction time is partly compensatedy the following scanning track only 0.05 mm away, cf. Fig. 2a.he 2 mm jump between separated stripes and any changes incan direction might give the opposite effect with a local temper-ture fall. The interaction efficiencies between the laser beam andhe diffusion heated alumina material might also change by tem-erature as well as surface ability to reflect or adsorb the laser.he balance between all these variables results in strongly fluc-uating temperature at locally heated areas and an instability ofverage temperature. Temperature monitoring has been reportedlso to be affected by uncontrolled surface geometries, such asurving of materials that might result in local high temperatures4,14].
The measurements reported above by pyrometer give only a
ature profiles and surface morphologies during laser sintering of16/j.jascer.2014.01.009
ough estimation of the ongoing process for the materials interac-ion with the laser beam. It might be used for a first estimate whenew ceramics are introduced, but has less value for research or foronitoring a production process.
235
236
237
ARTICLE IN PRESSG ModelJASCER 67 1–9
4 B. Qian et al. / Journal of Asian Ceramic Societies xxx (2014) xxx–xxx
F f-axials
3s
cwmeiteaaNrrvcas
ypahsrtsptam
wostp(iaHetc
st
ctislsdsbias4
hilhioo
3
swcwtdabiihtbrstF
es
238
239
240
241
242
243
244
245
246
247
248
249
250
251
252
253
254
255
256
257
258
259
260
261
262
263
264
265
266
267
268
269
270
271
272
273
274
275
276
277
278
279
280
281
282
283
284
285
286
287
288
289
290
291
292
293
294
295
296
297
298
299
300
301
302
303
304
305
306
307
308
309
310
311
312
313
314
315
316
317
318
319
320
321
322
323
324
325
326
327
328
ig. 3. The evolution of the average temperature of the hot area detected by an ofpeed in mm/s.
.2. Real-time thermal radiation profiles recorded by apectrometer and a pyrometer
The real-time off-axial spectra of the thermal radiation wereaptured at the same time by a spectrometer and a pyrometerhen a Nd:YAG fiber laser beam (1070 nm) interacts with alu-ina powder. The time-resolved spectra are captured from the
ntire heat-affected zone, but the strong surface laser-ceramicnteractions might dominate in the spectrometer records. The rela-ionships between the increase in heat input and the measuredmitted intensities and wavelengths by elapsed spectrometer timere summarized in Fig. 4a–d. The captured spectra are includingll the emitted radiation from the laser and material interactions.o narrow peak caused by photo- or thermoluminescence was
esolved in the broad emission. The emitted very short wavelengthseflect the laser-material interactions and cannot directly be con-eyed as alumina temperatures (∼6000–7000 ◦C). The figure alsoompares the results with a real-time pyrometer recording, sett longer recorded emission wavelengths, measuring the aluminaurface temperature.
Using the lowest heat input of 100 J/m, the spectrometer recordsielded few low and fluctuating emission intensities whereas theyrometer temperatures were below measuring range, reflectingn unsatisfying and unstable sintering situation. By increasing theeat inputs to 200 J/m, the measured electromagnetic emissionseen by the spectrometer and pyrometer give more consistentecords shown in Fig. 4a and b, respectively. The laser radia-ion interacts preferable in several parallel bands across the lasercanned alumina area, where the local temperature recordings byyrometry consequently show rapid local temperature intensifica-ions. Neither at 100 nor at 200 J/m, are the heat inputs enough tochieve a stable and acceptable sintering condition by the laser-aterial interaction at 1070 nm wavelength.At a heat input of 400 J/m the recording is more stable and the
hole scanned 4 mm squared area is heated to above 2000 ◦C, withne notable exception as a cooler band is running across the area,ee Fig. 4c and d. The pyrometer shows that the time width ofhis band is around 0.3 s. At 700 J/m the band with lower tem-eratures has become much narrower and at the highest input1000 J/m) thermal flow from surrounding heated areas has equal-zed temperatures. In fact, at 1000 J/m pyrometer curve stabilizest a temperature around the melting point of alumina (2072 ◦C).owever, note that a heat input of 1000 J/m saturates the recordedmission intensities and the heat is seen to diffuse well outside ofhe intended laser scanned area. This energy input is too high to be
Please cite this article in press as: B. Qian, et al., Monitoring of temperalumina ceramics, J. Asian Ceram. Soc. (2014), http://dx.doi.org/10.10
ontrolled.From the results achieved, the changes of the emission spectrum
hape reflect the stability of the alumina laser sintering. The real-ime temperature variation captured by pyrometer is essentially
gtts
pyrometer versus (a) the heat input in J/m, (b) laser power in W and (c) scanning
onsistent with spectrometer observations. The spectrum andemperature profiles are also useful for detailed observation of thenstant local heating behavior. The very short temperature droptill needs an explanation. This is too large to be caused by theaser beam zigzagging within the hatch line block with 0.05 mmeparation, but the laser stop at the end and restart in a differentirection at another distant hatch line block. Thus, a hypotheticalource of the apparent 0.3 s descent in transferred energy mighte a result of the complicated hatch pattern, cf. Fig. 2a. With the
ncrease of the total energy input, the accumulated heat diffusesnd eliminates temperature differences. The laser hatch trackhould be modified to allow a uniform temperature within the
mm × 4 mm area.The real-time monitoring by both spectrometry and pyrometry
as shown to be efficient tools to track even short-time events dur-ng the fast laser scan. At higher energy inputs the recordings showess fluctuation and reflect a more stable sintering process. In theeat input interval 400–700 J/m the average process temperature
ndicates that an acceptable sintering condition will be found andther energy inputs within this region should be tried to find theptimal level.
.3. Real-time surface morphology by an active imaging system
An off-axial imaging system is used to record the real-time laserintering process. It has a laser lighting and the captured imagesill reflect the brightness and emissions from the heated area that
ould be affected by several factors. The appearing contrasts inhite/black images result from difference of light reflectivity from
he surface. The reflectivity might be influenced by illumination andetecting angle, the surface roughness (powder vs. consolidatedlumina) and the melt pool. In addition, the contrast is influencedy the difference in materials absorption ability in the illuminat-
ng laser wavelength (810 nm). The high absorption by aluminanduces an overall dark-gray contrast in the recorded images. Theigh temperature melt pool radiates a thermal signature and athe same time have strong absorption, similar to a “black body”,ecoming black. In this way, the optical imaging system grasps theeal-time recording of the high and low temperature zone at theame time, but the interpretation needs training. Typical imageshat are captured during laser sintering of alumina are shown inig. 5.
The imaging system illustrates the quality of consolidated lay-rs when the heat input increase by the same energies used in theection above, i.e. 200, 400, 700 and 1000 J/m, see Fig. 5a–c, d–f,
ature profiles and surface morphologies during laser sintering of16/j.jascer.2014.01.009
–i and j–l, respectively. Three images at each energy level followhe process after 1/3, 2/3 and full sintering time (∼6 s). Only par-ial melting of alumina powder along parallel bands crossing thecanned area can be seen at 200 J/m. This should be compared with
329
330
331
332

Please cite this article in press as: B. Qian, et al., Monitoring of temperature profiles and surface morphologies during laser sintering ofalumina ceramics, J. Asian Ceram. Soc. (2014), http://dx.doi.org/10.1016/j.jascer.2014.01.009
ARTICLE IN PRESSG ModelJASCER 67 1–9
B. Qian et al. / Journal of Asian Ceramic Societies xxx (2014) xxx–xxx 5
Fig. 4. Comparison of spectrometer (left column) and pyrometer (right column) recordings of the laser-material interaction process when alumina was laser sintered.Different heat input levels were used and the real-time spectrometer and pyrometer profiles were measured, comprising the heat inputs of 200 J/m (a and b), 400 J/m(c and d), 700 J/m (e and f) and 1000 J/m (g and h). See details in text.

ARTICLE IN PRESSG ModelJASCER 67 1–9
6 B. Qian et al. / Journal of Asian Ceramic Societies xxx (2014) xxx–xxx
F alum2 evel a
thjsmgcmzpetcmq
eca
tcdfmsadb
tftsl
333
334
335
336
337
338
339
340
341
342
343
344
345
346
347
348
349
350
351
352
353
354
355
356
357
358
359
360
361
362
363
364
365
366
ig. 5. Top view images captured by the active illumination imaging system when00 J/m, in (d–f) 400 J/m, in (g–i) 700 J/m and in (j–l) 1000 J/m. For each heat input l
he band structure of emitted light shown in Fig. 4a. There are moreeated bands at the first half of sintering then after the laser beam
ump to the next scan block, cf., Fig. 5a and c. The opposite ordereems to occur at 400 J/m and the circumstances ruling preferredaterial-laser interaction is unclear. Total melting of the alumina
rain layer was achieved at 400 J/m and resulted in a consolidatedoating kept within the scanned area, see Fig. 5f. The heat accu-ulating effect by time is indicated at 700 J/mw here the final melt
one seem to exceed the scanned area, see Fig. 5i. This is even moreronounced at the highest heat input 1000 J/m, see Fig. 5l. Too largenergy inputs in a restricted area might cause the melt pool pene-rating deeper into the alumina body. A lack of underneath supportan cause a slight concave look of the melt pool surface. In sum-ary, the level of energy input has a strong effect upon the apparent
uality of consolidated alumina.
Please cite this article in press as: B. Qian, et al., Monitoring of temperalumina ceramics, J. Asian Ceram. Soc. (2014), http://dx.doi.org/10.10
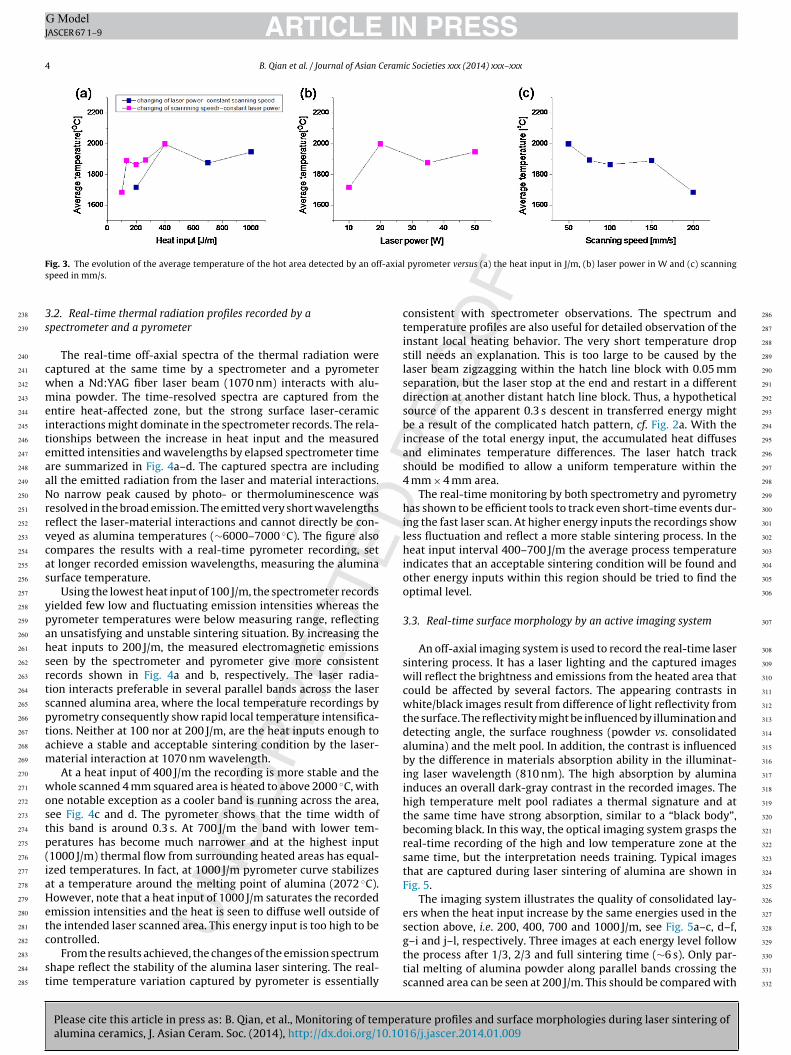
The time-evolution of a melt pool is followed with a new imagevery 1/30 s in Fig. 6a–f. The image is exposed at the edge of theompacted alumina powder disc where the reflective edge is seens a curved white band. At the top dark-gray surface the laser
emlA
ina was consolidated with different heat input values. In (a–c) the heat input was sequence of three images was exposed after 1/3, 2/3 and full time.
rack has reached the edge leaving a trail of melted alumina that isooling and the laser beam is turning direction. Once the laser irra-iates upon the alumina powder body again a small dark melt poolorms, see yellow arrow in Fig. 6b. Following the time and the
ovement into the alumina disc, the melt pool can be followed,ee Fig. 6c–f. The diameter of the melt pool increases and it causeslso a deeper penetration into the material. By observing theseetails of the laser sintering process the best laser parameters cane set.
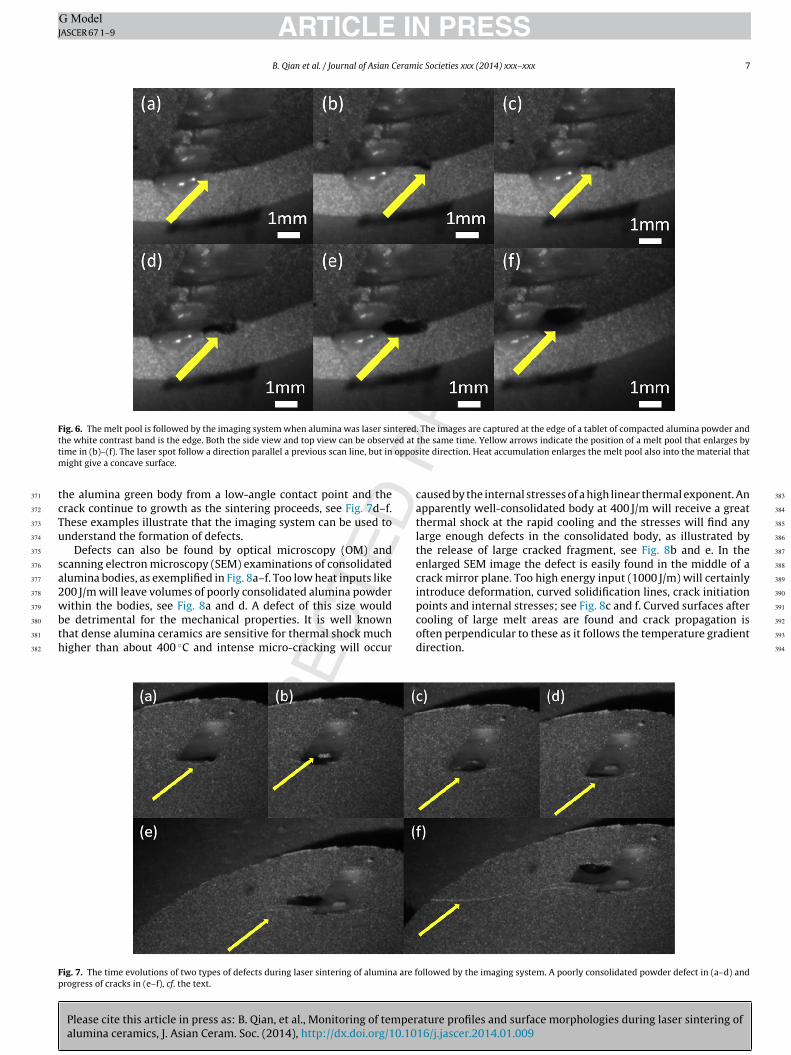
The imaging system is good for on-line control during laser sin-ering and it is also possible to follow how a critical defect mayorm. The formation of a defect, being an un-melted body, withinhe consolidated alumina can be followed, see Fig. 7a–d. Duringintering of alumina a tiny crack forms at the front of the movingaser spot, see yellow arrow in Fig. 7a. This crack at the powder
ature profiles and surface morphologies during laser sintering of16/j.jascer.2014.01.009
dge of the melt pool creates a small fragment that moves into theelted area, see Fig. 7b. This fragment is only partially melted and
eaves a porous defect in the consolidated part, see Fig. 7c and d.nother example is the evolution of a thermally induced crack into
367
368
369
370
ARTICLE IN PRESSG ModelJASCER 67 1–9
B. Qian et al. / Journal of Asian Ceramic Societies xxx (2014) xxx–xxx 7
Fig. 6. The melt pool is followed by the imaging system when alumina was laser sintered. The images are captured at the edge of a tablet of compacted alumina powder andt ed at
t opposm
tcTu
sa2wbth
catlteci
Fp
371
372
373
374
375
376
377
378
379
380
381
382
383
384
385
386
387
388
389
390
he white contrast band is the edge. Both the side view and top view can be observime in (b)–(f). The laser spot follow a direction parallel a previous scan line, but in
ight give a concave surface.
he alumina green body from a low-angle contact point and therack continue to growth as the sintering proceeds, see Fig. 7d–f.hese examples illustrate that the imaging system can be used tonderstand the formation of defects.
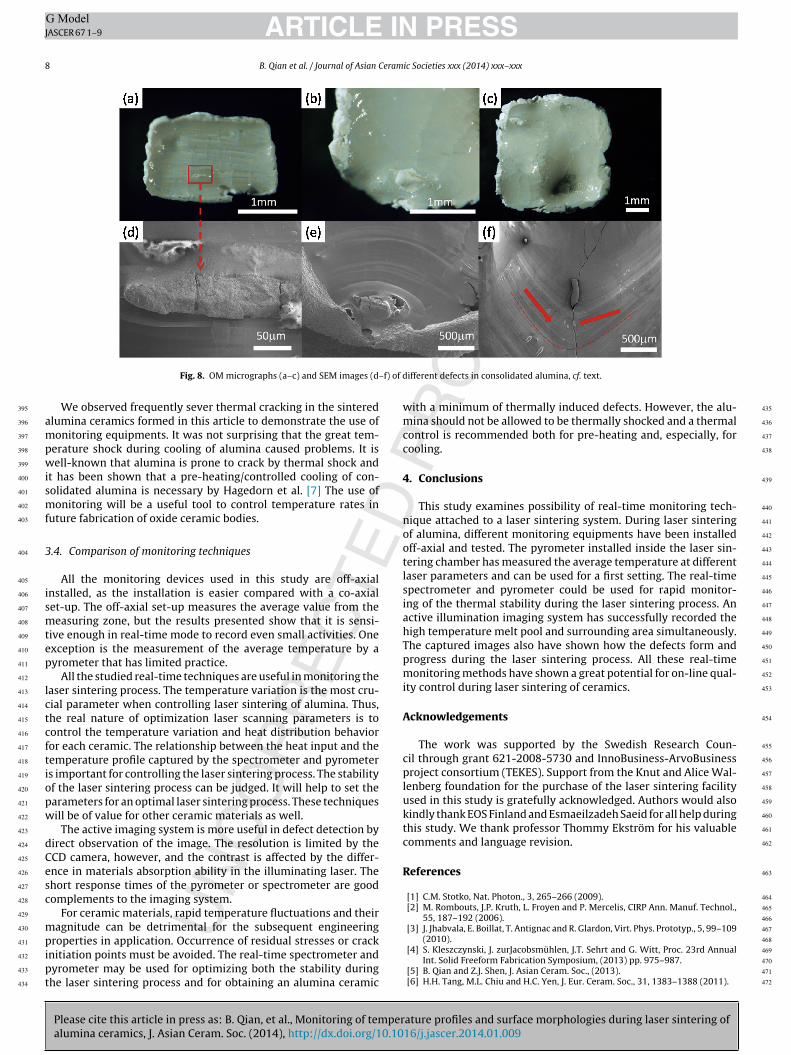
Defects can also be found by optical microscopy (OM) andcanning electron microscopy (SEM) examinations of consolidatedlumina bodies, as exemplified in Fig. 8a–f. Too low heat inputs like00 J/m will leave volumes of poorly consolidated alumina powder
Please cite this article in press as: B. Qian, et al., Monitoring of temperalumina ceramics, J. Asian Ceram. Soc. (2014), http://dx.doi.org/10.10
ithin the bodies, see Fig. 8a and d. A defect of this size woulde detrimental for the mechanical properties. It is well knownhat dense alumina ceramics are sensitive for thermal shock muchigher than about 400 ◦C and intense micro-cracking will occur
pcod
ig. 7. The time evolutions of two types of defects during laser sintering of alumina are frogress of cracks in (e–f), cf. the text.
the same time. Yellow arrows indicate the position of a melt pool that enlarges byite direction. Heat accumulation enlarges the melt pool also into the material that
aused by the internal stresses of a high linear thermal exponent. Anpparently well-consolidated body at 400 J/m will receive a greathermal shock at the rapid cooling and the stresses will find anyarge enough defects in the consolidated body, as illustrated byhe release of large cracked fragment, see Fig. 8b and e. In thenlarged SEM image the defect is easily found in the middle of arack mirror plane. Too high energy input (1000 J/m) will certainlyntroduce deformation, curved solidification lines, crack initiation
ature profiles and surface morphologies during laser sintering of16/j.jascer.2014.01.009
oints and internal stresses; see Fig. 8c and f. Curved surfaces afterooling of large melt areas are found and crack propagation isften perpendicular to these as it follows the temperature gradientirection.
ollowed by the imaging system. A poorly consolidated powder defect in (a–d) and
391
392
393
394
ARTICLE IN PRESSG ModelJASCER 67 1–9
8 B. Qian et al. / Journal of Asian Ceramic Societies xxx (2014) xxx–xxx
f) of d
ampwismf
3
ismtep
lctcftiopw
dCesc
mpipt
wmcc
4
nootlsiahTpmi
A
cpluktc
R
395
396
397
398
399
400
401
402
403
404
405
406
407
408
409
410
411
412
413
414
415
416
417
418
419
420
421
422
423
424
425
426
427
428
429
430
431
432
433
434
435
436
437
438
439
440
441
442
443
444
445
446
447
448
449
450
451
452
453
454
455
456
457
458
459
460
461
462
463
464
465
466
467
Fig. 8. OM micrographs (a–c) and SEM images (d–
We observed frequently sever thermal cracking in the sinteredlumina ceramics formed in this article to demonstrate the use ofonitoring equipments. It was not surprising that the great tem-
erature shock during cooling of alumina caused problems. It isell-known that alumina is prone to crack by thermal shock and
t has been shown that a pre-heating/controlled cooling of con-olidated alumina is necessary by Hagedorn et al. [7] The use ofonitoring will be a useful tool to control temperature rates in
uture fabrication of oxide ceramic bodies.
.4. Comparison of monitoring techniques
All the monitoring devices used in this study are off-axialnstalled, as the installation is easier compared with a co-axialet-up. The off-axial set-up measures the average value from theeasuring zone, but the results presented show that it is sensi-
ive enough in real-time mode to record even small activities. Onexception is the measurement of the average temperature by ayrometer that has limited practice.
All the studied real-time techniques are useful in monitoring theaser sintering process. The temperature variation is the most cru-ial parameter when controlling laser sintering of alumina. Thus,he real nature of optimization laser scanning parameters is toontrol the temperature variation and heat distribution behavioror each ceramic. The relationship between the heat input and theemperature profile captured by the spectrometer and pyrometers important for controlling the laser sintering process. The stabilityf the laser sintering process can be judged. It will help to set thearameters for an optimal laser sintering process. These techniquesill be of value for other ceramic materials as well.
The active imaging system is more useful in defect detection byirect observation of the image. The resolution is limited by theCD camera, however, and the contrast is affected by the differ-nce in materials absorption ability in the illuminating laser. Thehort response times of the pyrometer or spectrometer are goodomplements to the imaging system.
For ceramic materials, rapid temperature fluctuations and theiragnitude can be detrimental for the subsequent engineering
Please cite this article in press as: B. Qian, et al., Monitoring of temperalumina ceramics, J. Asian Ceram. Soc. (2014), http://dx.doi.org/10.10
roperties in application. Occurrence of residual stresses or cracknitiation points must be avoided. The real-time spectrometer andyrometer may be used for optimizing both the stability duringhe laser sintering process and for obtaining an alumina ceramic
ifferent defects in consolidated alumina, cf. text.
ith a minimum of thermally induced defects. However, the alu-ina should not be allowed to be thermally shocked and a thermal
ontrol is recommended both for pre-heating and, especially, forooling.
. Conclusions
This study examines possibility of real-time monitoring tech-ique attached to a laser sintering system. During laser sinteringf alumina, different monitoring equipments have been installedff-axial and tested. The pyrometer installed inside the laser sin-ering chamber has measured the average temperature at differentaser parameters and can be used for a first setting. The real-timepectrometer and pyrometer could be used for rapid monitor-ng of the thermal stability during the laser sintering process. Anctive illumination imaging system has successfully recorded theigh temperature melt pool and surrounding area simultaneously.he captured images also have shown how the defects form androgress during the laser sintering process. All these real-timeonitoring methods have shown a great potential for on-line qual-
ty control during laser sintering of ceramics.
cknowledgements
The work was supported by the Swedish Research Coun-il through grant 621-2008-5730 and InnoBusiness-ArvoBusinessroject consortium (TEKES). Support from the Knut and Alice Wal-
enberg foundation for the purchase of the laser sintering facilitysed in this study is gratefully acknowledged. Authors would alsoindly thank EOS Finland and Esmaeilzadeh Saeid for all help duringhis study. We thank professor Thommy Ekström for his valuableomments and language revision.
eferences
[1] C.M. Stotko, Nat. Photon., 3, 265–266 (2009).[2] M. Rombouts, J.P. Kruth, L. Froyen and P. Mercelis, CIRP Ann. Manuf. Technol.,
55, 187–192 (2006).[3] J. Jhabvala, E. Boillat, T. Antignac and R. Glardon, Virt. Phys. Prototyp., 5, 99–109
ature profiles and surface morphologies during laser sintering of16/j.jascer.2014.01.009
(2010).[4] S. Kleszczynski, J. zurJacobsmühlen, J.T. Sehrt and G. Witt, Proc. 23rd Annual
Int. Solid Freeform Fabrication Symposium, (2013) pp. 975–987.[5] B. Qian and Z.J. Shen, J. Asian Ceram. Soc., (2013).[6] H.H. Tang, M.L. Chiu and H.C. Yen, J. Eur. Ceram. Soc., 31, 1383–1388 (2011).
468
469
470
471
472

ARTICLE IN PRESSG ModelJASCER 67 1–9
eram
Q9[
[[
[
[[
473
474
475
476
477
478
479
480
481
482
483
484
B. Qian et al. / Journal of Asian C
[7] Y.C. Hagedorn, J. Wilkes, W. Meiners, K. Wissenbach and R. Poprawe, Phys.Procedia, 5, 587–594 (2010).
[8] J. ZurJacobsmuhlen, S. Kleszczynski, D. Schneider and G. Witt, I2MTC, (2013).[9] T. Craeghs, S. Clijsters, E. Yasa, and J.P. Kruth, Austin, TX, USA (2011).
Please cite this article in press as: B. Qian, et al., Monitoring of temperalumina ceramics, J. Asian Ceram. Soc. (2014), http://dx.doi.org/10.10
10] I. Yadroitsev, P.H. Bertrand and I. Smurov, Appl. Surf. Sci., 253, 8064–8069(2007).
11] Y. Chivel and I. Smurov, Phys. Procedia, 5, 515–521 (2010).12] M. Doubenskaia, M. Pavlov, S. Grigoriev, E. Tikhonova and I. Smurov, J. Laser
Micro Nanoeng., 7, 236–243 (2012).
[
[
ic Societies xxx (2014) xxx–xxx 9
13] J.P. Kruth, P. Mercelis, J. Van Vaerenbergh and T. Craeghs, Proceedings of the14th International Symposium on Electromachining (ISEM XIV), (2007) p. 2.
14] G. Dongdong and S. Yifu, Mater. Des., 30, 2903–2910 (2009).15] Y. Chivel, Phys. Procedia, 897–903 (2013).
ature profiles and surface morphologies during laser sintering of16/j.jascer.2014.01.009
16] P. Lotta, H. Schleifenbauma, W. Meinersa, K. Wissenbacha, C. Hinkeb and J.Bültmannc, Phys. Procedia, 2, 683–690 (2011).
17] H. Krauss, C. Eschey and M.F. Zaeh, Proceedings of the 22nd AnnualInternational Solid Freeform Fabrication Symposium, Austin, USA, (2012)pp. 999–1014.
485
486
487
488
489