
Monitoring and analysis of an absorption air-conditioning system
11
Energy and Buildings 36 (2004) 933–943 Monitoring and analysis of an absorption air-conditioning system M. Pérez de Viñaspre a , M. Bourouis a,∗ , A. Coronas a , A. Garc´ ıa b , V. Soto b , J.M. Pinazo b,1 a Centro de Innovación Tecnológica en Revalorización Energética y Refrigeración (CREVER), Universitat Rovira i Virgili, 43006 Tarragona, Spain b E.T.S. Ingenieros Industriales, Universidad Politécnica de Valencia, 46022 Valencia, Spain Received 30 December 2003; received in revised form 25 February 2004; accepted 2 March 2004 Abstract In the last few years, high-energy consumption due to air-conditioning has led to a growing interest in the efficient use of energy in buildings. Although simulation programs have always been the main tools for analyzing energy in buildings, the reliability of their results is often compromised by a lack of certainty to reflect real conditions. The aim of this work is to monitorize and analyze the thermal behavior of an absorption-based air-conditioning installation of a university building in Tarragona, Spain. The existing monitoring system of the installation has been improved by implementing additional sensors and flow meters. The data has been stored during summer 2002 and used to assess the energy balance of the air-conditioning installation and the operational regime of the absorption chiller. © 2004 Elsevier B.V. All rights reserved. Keywords: Air-conditioning; Absorption chiller; Energy management in buildings; Monitoring 1. Introduction The growing interest in the efficient use of energy in buildings has highlighted the need for new configurations and strategies for heating, ventilation and air-conditioning systems (HVAC). This is because in the European Union, buildings absorb approximately 36.7% of total energy con- sumption, and the systems of heating and air-conditioning are responsible for the most of this consumption [1]. To reduce this level of consumption and to optimize re- sources, numerous simulation tools have been developed in the last few years for managing energy in buildings. These are, for example, DOE2, TRNSYS, BLAST, TRACE, and ESP-r [2–5]. The rate and cost of energy consumption in buildings depend on the complex interaction between a large number of variables such as running time of the machines, combustible consumption, occupation, etc. These variables can only be evaluated using energy simulation tools [6]. Current studies for analyzing the use of energy in build- ings continue to rely on the development of simulation tools that allow simulating energy management in buildings. How- ever, these simulations are not always validated with ex- perimental data. The cost and effort required to collect and ∗ Corresponding author. Tel.: +34-977-540205; fax: +34-977-542272. E-mail addresses: [email protected] (M. Bourouis), [email protected] (J.M. Pinazo). 1 Tel.: +34-963-877322; fax: +34-963-877329. monitor real operational data of air-conditioning installa- tions make it difficult to analyze real situations. Nowadays, there exist many air-conditioning installations in which temperatures, flows, pressures, valves, etc. are mea- sured and stored for control purposes but rarely for calcu- lating the energy efficiency of the system or the real energy consumption of buildings. It is necessary to carry out and implement this second option for energy saving, detecting possible deviations on previous calculations, etc. The intel- ligent air-conditioning systems are also becoming more and more used in new buildings. There are some cases where the users can interact with these systems, by means of dial- ing telephone numbers or sending messages by cell phones. Nevertheless, in most cases this communication is unidirec- tional, that is to say, the user gives the order but it’s not known if this order is well-executed or not. For this reason, the interest of remote visualization of air-conditioning sys- tems in buildings is increasing. In the last years, due to the environmental concern origi- nated by the CFCs refrigerants and the increase of the overall temperature of the planet and the electricity demand, the in- terest in using absorption chillers/heaters in air-conditioning installations has increased. Moreover, the integration of this clean technology of air-conditioning in buildings is nowa- days a research area of great interest. Dynamic models are required for simulating the real be- havior of absorption chillers/heaters and their integration in buildings. However, experience and transitory-related 0378-7788/$ – see front matter © 2004 Elsevier B.V. All rights reserved. doi:10.1016/j.enbuild.2004.03.005
Transcript of Monitoring and analysis of an absorption air-conditioning system
Energy and Buildings 36 (2004) 933–943
Monitoring and analysis of an absorption air-conditioning system
M. Pérez de Viñasprea, M. Bourouisa,∗, A. Coronasa, A. Garcıab, V. Sotob, J.M. Pinazob,1
a Centro de Innovación Tecnológica en Revalorización Energética y Refrigeración (CREVER), Universitat Rovira i Virgili, 43006 Tarragona, Spainb E.T.S. Ingenieros Industriales, Universidad Politécnica de Valencia, 46022 Valencia, Spain
Received 30 December 2003; received in revised form 25 February 2004; accepted 2 March 2004
Abstract
In the last few years, high-energy consumption due to air-conditioning has led to a growing interest in the efficient use of energy inbuildings. Although simulation programs have always been the main tools for analyzing energy in buildings, the reliability of their resultsis often compromised by a lack of certainty to reflect real conditions.
The aim of this work is to monitorize and analyze the thermal behavior of an absorption-based air-conditioning installation of a universitybuilding in Tarragona, Spain. The existing monitoring system of the installation has been improved by implementing additional sensorsand flow meters. The data has been stored during summer 2002 and used to assess the energy balance of the air-conditioning installationand the operational regime of the absorption chiller.© 2004 Elsevier B.V. All rights reserved.
Keywords:Air-conditioning; Absorption chiller; Energy management in buildings; Monitoring
1. Introduction
The growing interest in the efficient use of energy inbuildings has highlighted the need for new configurationsand strategies for heating, ventilation and air-conditioningsystems (HVAC). This is because in the European Union,buildings absorb approximately 36.7% of total energy con-sumption, and the systems of heating and air-conditioningare responsible for the most of this consumption[1].
To reduce this level of consumption and to optimize re-sources, numerous simulation tools have been developed inthe last few years for managing energy in buildings. Theseare, for example, DOE2, TRNSYS, BLAST, TRACE, andESP-r [2–5]. The rate and cost of energy consumption inbuildings depend on the complex interaction between a largenumber of variables such as running time of the machines,combustible consumption, occupation, etc. These variablescan only be evaluated using energy simulation tools[6].
Current studies for analyzing the use of energy in build-ings continue to rely on the development of simulation toolsthat allow simulating energy management in buildings. How-ever, these simulations are not always validated with ex-perimental data. The cost and effort required to collect and
∗ Corresponding author. Tel.:+34-977-540205; fax:+34-977-542272.E-mail addresses:[email protected] (M. Bourouis),[email protected] (J.M. Pinazo).
1 Tel.: +34-963-877322; fax:+34-963-877329.
monitor real operational data of air-conditioning installa-tions make it difficult to analyze real situations.
Nowadays, there exist many air-conditioning installationsin which temperatures, flows, pressures, valves, etc. are mea-sured and stored for control purposes but rarely for calcu-lating the energy efficiency of the system or the real energyconsumption of buildings. It is necessary to carry out andimplement this second option for energy saving, detectingpossible deviations on previous calculations, etc. The intel-ligent air-conditioning systems are also becoming more andmore used in new buildings. There are some cases wherethe users can interact with these systems, by means of dial-ing telephone numbers or sending messages by cell phones.Nevertheless, in most cases this communication is unidirec-tional, that is to say, the user gives the order but it’s notknown if this order is well-executed or not. For this reason,the interest of remote visualization of air-conditioning sys-tems in buildings is increasing.
In the last years, due to the environmental concern origi-nated by the CFCs refrigerants and the increase of the overalltemperature of the planet and the electricity demand, the in-terest in using absorption chillers/heaters in air-conditioninginstallations has increased. Moreover, the integration of thisclean technology of air-conditioning in buildings is nowa-days a research area of great interest.
Dynamic models are required for simulating the real be-havior of absorption chillers/heaters and their integrationin buildings. However, experience and transitory-related
0378-7788/$ – see front matter © 2004 Elsevier B.V. All rights reserved.doi:10.1016/j.enbuild.2004.03.005
934 M. Perez de Viñaspre et al. / Energy and Buildings 36 (2004) 933–943
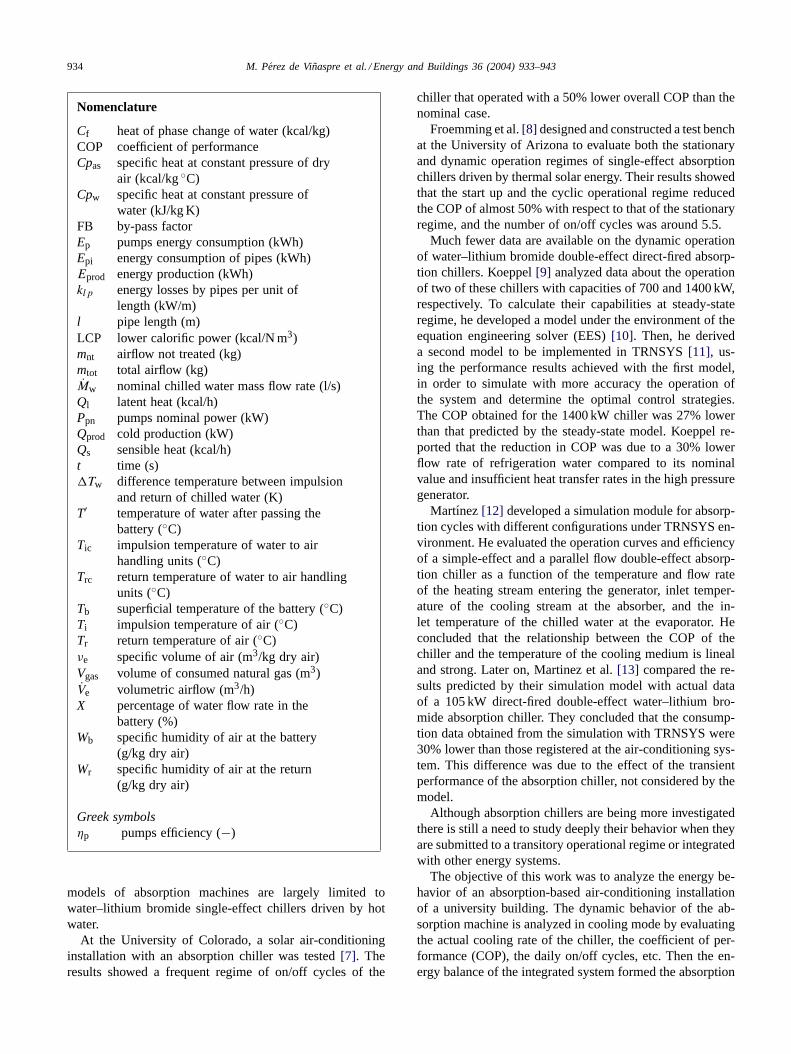
Nomenclature
Cf heat of phase change of water (kcal/kg)COP coefficient of performanceCpas specific heat at constant pressure of dry
air (kcal/kg◦C)Cpw specific heat at constant pressure of
water (kJ/kg K)FB by-pass factorEp pumps energy consumption (kWh)Epi energy consumption of pipes (kWh)Eprod energy production (kWh)klp energy losses by pipes per unit of
length (kW/m)l pipe length (m)LCP lower calorific power (kcal/N m3)mnt airflow not treated (kg)mtot total airflow (kg)Mw nominal chilled water mass flow rate (l/s)Ql latent heat (kcal/h)Ppn pumps nominal power (kW)Qprod cold production (kW)Qs sensible heat (kcal/h)t time (s)�Tw difference temperature between impulsion
and return of chilled water (K)T′ temperature of water after passing the
battery (◦C)Tic impulsion temperature of water to air
handling units (◦C)Trc return temperature of water to air handling
units (◦C)Tb superficial temperature of the battery (◦C)Ti impulsion temperature of air (◦C)Tr return temperature of air (◦C)νe specific volume of air (m3/kg dry air)Vgas volume of consumed natural gas (m3)Ve volumetric airflow (m3/h)X percentage of water flow rate in the
battery (%)Wb specific humidity of air at the battery
(g/kg dry air)Wr specific humidity of air at the return
(g/kg dry air)
Greek symbolsηp pumps efficiency (−)
models of absorption machines are largely limited towater–lithium bromide single-effect chillers driven by hotwater.
At the University of Colorado, a solar air-conditioninginstallation with an absorption chiller was tested[7]. Theresults showed a frequent regime of on/off cycles of the
chiller that operated with a 50% lower overall COP than thenominal case.
Froemming et al.[8] designed and constructed a test benchat the University of Arizona to evaluate both the stationaryand dynamic operation regimes of single-effect absorptionchillers driven by thermal solar energy. Their results showedthat the start up and the cyclic operational regime reducedthe COP of almost 50% with respect to that of the stationaryregime, and the number of on/off cycles was around 5.5.
Much fewer data are available on the dynamic operationof water–lithium bromide double-effect direct-fired absorp-tion chillers. Koeppel[9] analyzed data about the operationof two of these chillers with capacities of 700 and 1400 kW,respectively. To calculate their capabilities at steady-stateregime, he developed a model under the environment of theequation engineering solver (EES)[10]. Then, he deriveda second model to be implemented in TRNSYS[11], us-ing the performance results achieved with the first model,in order to simulate with more accuracy the operation ofthe system and determine the optimal control strategies.The COP obtained for the 1400 kW chiller was 27% lowerthan that predicted by the steady-state model. Koeppel re-ported that the reduction in COP was due to a 30% lowerflow rate of refrigeration water compared to its nominalvalue and insufficient heat transfer rates in the high pressuregenerator.
Martınez[12] developed a simulation module for absorp-tion cycles with different configurations under TRNSYS en-vironment. He evaluated the operation curves and efficiencyof a simple-effect and a parallel flow double-effect absorp-tion chiller as a function of the temperature and flow rateof the heating stream entering the generator, inlet temper-ature of the cooling stream at the absorber, and the in-let temperature of the chilled water at the evaporator. Heconcluded that the relationship between the COP of thechiller and the temperature of the cooling medium is linealand strong. Later on, Martinez et al.[13] compared the re-sults predicted by their simulation model with actual dataof a 105 kW direct-fired double-effect water–lithium bro-mide absorption chiller. They concluded that the consump-tion data obtained from the simulation with TRNSYS were30% lower than those registered at the air-conditioning sys-tem. This difference was due to the effect of the transientperformance of the absorption chiller, not considered by themodel.
Although absorption chillers are being more investigatedthere is still a need to study deeply their behavior when theyare submitted to a transitory operational regime or integratedwith other energy systems.
The objective of this work was to analyze the energy be-havior of an absorption-based air-conditioning installationof a university building. The dynamic behavior of the ab-sorption machine is analyzed in cooling mode by evaluatingthe actual cooling rate of the chiller, the coefficient of per-formance (COP), the daily on/off cycles, etc. Then the en-ergy balance of the integrated system formed the absorption
M. Perez de Viñaspre et al. / Energy and Buildings 36 (2004) 933–943 935
chiller, the distribution circuits, and the terminal units (airhandling units and fan coils) is carried out.
The installation has a monitoring system that registers inreal time the measured variables by the sensors of tempera-ture, relative humidity, water flow meters, valves, etc. imple-mented in the machine room, distribution circuits and ter-minal units. The existing instrumentation was not enough tocarry out the energy balances of the installation, that’s whywe have implemented additional instrumentation such as gasmeter and chilled/hot water flow meter of the absorptionmachine. The operational parameters of the air-conditioninginstallation were monitorised and stored with a frequency of1 min during summer of 2002.
2. Description of the building and its air-conditioningsystem
The building considered in this study belongs to the Uni-versity Rovira i Virgili (URV) of Tarragona in Spain. Thearea of the building is 7252 m2 (90 m long and 14.2 m wide)with six floors, and it is divided into areas of classrooms (onthree floors), services, library, conference and study roomsin the ground, first and second floors. Cooling and heatingfor air-conditioning is supplied to 2490 m2 that represent thefirst and second floors and part of the ground floor, thus rep-resenting 34% of the total area. The rest of the building hasa water heating installation.
The air-conditioning installation consists of a water–water centralized system with a water–lithium bromidedouble-effect direct-fired Yazaki CH-V100 absorption ma-chine with a cooling capacity of 352 kW condensed bywater of a refrigeration tower TEVA TVC 611. The systemgenerates chilled or hot water, depending on the seasonaloperating cycle, to cool or heat the air-conditioning circuits.The terminal units consist of six air handling units AirventCL models A-E with constant volume of air and five Hori-zontal Fan Coils Elyte Clivet model FOI. As a support sys-tem, it also has two high efficient gas boilers Adisa Duplex360 for heating. The air-conditioning installation has alsotemperature, relative humidity and solar radiation sensors,as well as gas, water and electricity flow meters.Table 1
Table 1Sensors implemented in the air-conditioning installation of the building
Location Measured parameters
Outdoor Outdoor temperatureOutdoor relative humiditySolar radiation
Air handling units Return temperature and relative humidityImpulsion temperature
Fancoils Return temperatureAbsorption chiller Impulsion and return temperatures of the
absorption chiller and cooling towerTemperatures of chilled water to/from thesecondary circuits of air-conditioning
shows the location of the sensors and the parameters theymeasure.
2.1. Control and monitoring system
The control and monitoring system of the air-conditioninginstallation consists basically of a local supervisor that mon-itors the different parts of the system and displays the in-formation from the controllers. Also, we have developed anapplication which permits the transmission of data with afrequency of 1 minute and its storage in a data base MySQLimplemented in a remote computer[14–16]. This tool en-ables us to perform a follow-up study of the behavior ofthe system, find any equipment failure, visualize the state ofcomfort in the various areas of the building, and store thereal data of the system for subsequent treatment.
2.1.1. The local supervisorThe local supervisor provides a complete interface of
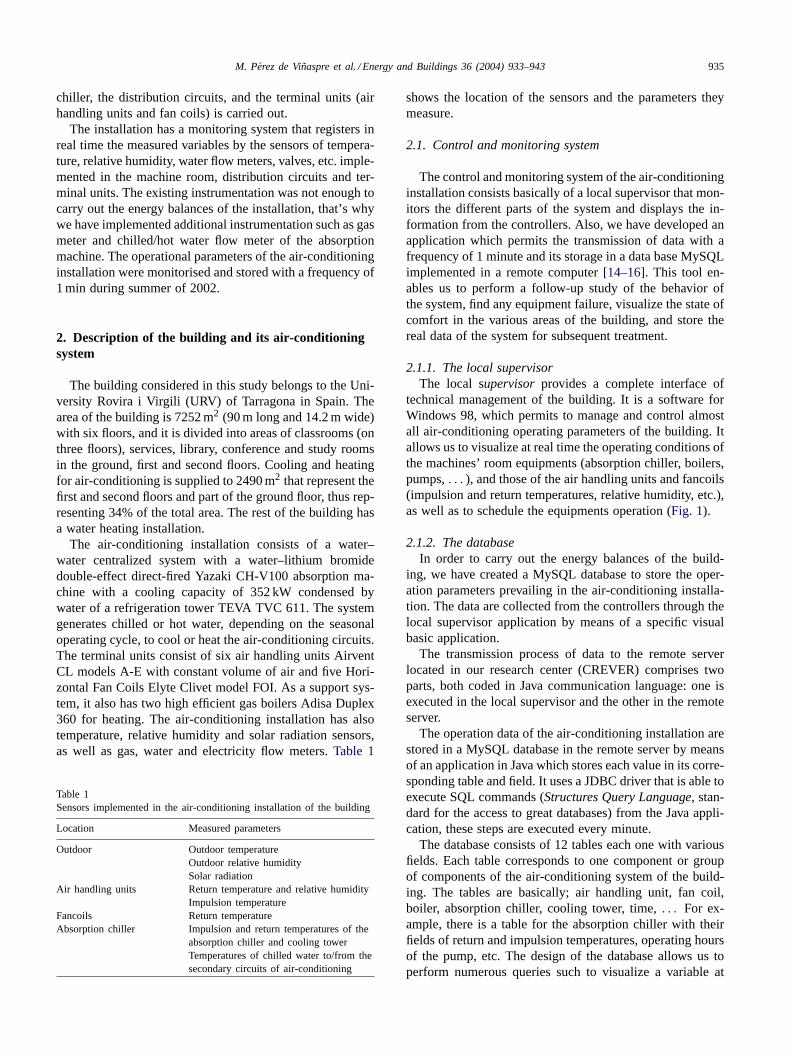
technical management of the building. It is a software forWindows 98, which permits to manage and control almostall air-conditioning operating parameters of the building. Itallows us to visualize at real time the operating conditions ofthe machines’ room equipments (absorption chiller, boilers,pumps,. . . ), and those of the air handling units and fancoils(impulsion and return temperatures, relative humidity, etc.),as well as to schedule the equipments operation (Fig. 1).
2.1.2. The databaseIn order to carry out the energy balances of the build-
ing, we have created a MySQL database to store the oper-ation parameters prevailing in the air-conditioning installa-tion. The data are collected from the controllers through thelocal supervisor application by means of a specific visualbasic application.
The transmission process of data to the remote serverlocated in our research center (CREVER) comprises twoparts, both coded in Java communication language: one isexecuted in the local supervisor and the other in the remoteserver.
The operation data of the air-conditioning installation arestored in a MySQL database in the remote server by meansof an application in Java which stores each value in its corre-sponding table and field. It uses a JDBC driver that is able toexecute SQL commands (Structures Query Language, stan-dard for the access to great databases) from the Java appli-cation, these steps are executed every minute.
The database consists of 12 tables each one with variousfields. Each table corresponds to one component or groupof components of the air-conditioning system of the build-ing. The tables are basically; air handling unit, fan coil,boiler, absorption chiller, cooling tower, time,. . . For ex-ample, there is a table for the absorption chiller with theirfields of return and impulsion temperatures, operating hoursof the pump, etc. The design of the database allows us toperform numerous queries such to visualize a variable at
936 M. Perez de Viñaspre et al. / Energy and Buildings 36 (2004) 933–943
Fig. 1. Scheme of the Yazaki absorption chiller in the local supervisor.
a concrete time, to consult the last value of one variable,etc.
3. Energy balance of the air-conditioning system
One of our main objectives in this study was to ac-quire and analyze operational data of an absorption-basedair-conditioning installation of a university building. Thisinformation is essential for establishing design criteria thatallow the absorption machines to operate while makingmaximum use of their capabilities in order to improve theoverall energy efficiency of the system and therefore thatof the building. The equations of the energy balance in theabsorption unit are herein summarized.
3.1. Absorption chiller Yazaki CH-V100
The absorption chiller/heater installed in the building con-sidered in this study is aYazaki CH-V100double-effect gasfired that uses water–lithium bromide as working fluid. Thesystem for regulating the capacity of the machine is on/offand comprises a thermostat located in the water stream com-
ing from the terminal units (air handling units and fan coils).This thermostat starts the burner when the temperature ofthis stream exceeds a certain value due to an increase of thebuilding thermal load. The nominal operating conditions ofthe absorption chiller/heater are reported inTable 2. The in-stantaneous cooling capacity of the chiller is obtained bymultiplying the flow rate of chilled water of the primary cir-
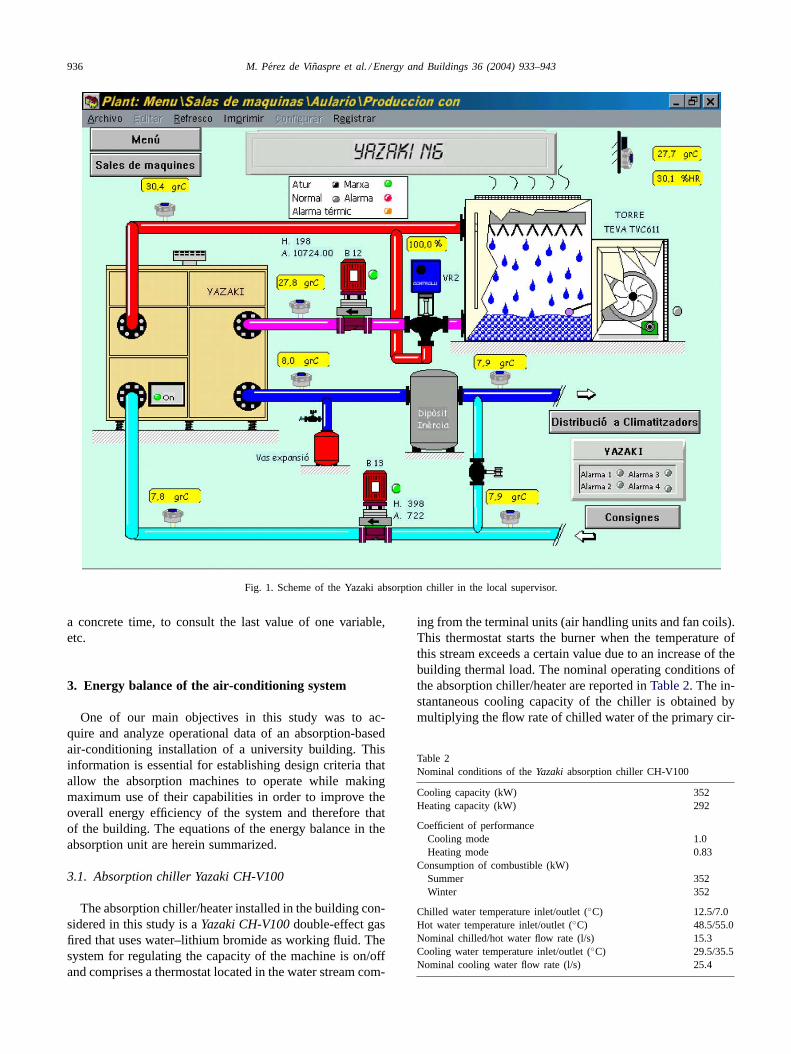
Table 2Nominal conditions of theYazakiabsorption chiller CH-V100
Cooling capacity (kW) 352Heating capacity (kW) 292
Coefficient of performanceCooling mode 1.0Heating mode 0.83
Consumption of combustible (kW)Summer 352Winter 352
Chilled water temperature inlet/outlet (◦C) 12.5/7.0Hot water temperature inlet/outlet (◦C) 48.5/55.0Nominal chilled/hot water flow rate (l/s) 15.3Cooling water temperature inlet/outlet (◦C) 29.5/35.5Nominal cooling water flow rate (l/s) 25.4
M. Perez de Viñaspre et al. / Energy and Buildings 36 (2004) 933–943 937
Table 3Nominal conditions of the air handling units Airvent CL
CL-A CL-B CL-C CL-D CL-E
Dimensions (mm) 900× 1200×3950
1200× 1600×5000
1400× 1700×5450
1400× 1700×5000
1150× 1600×4700
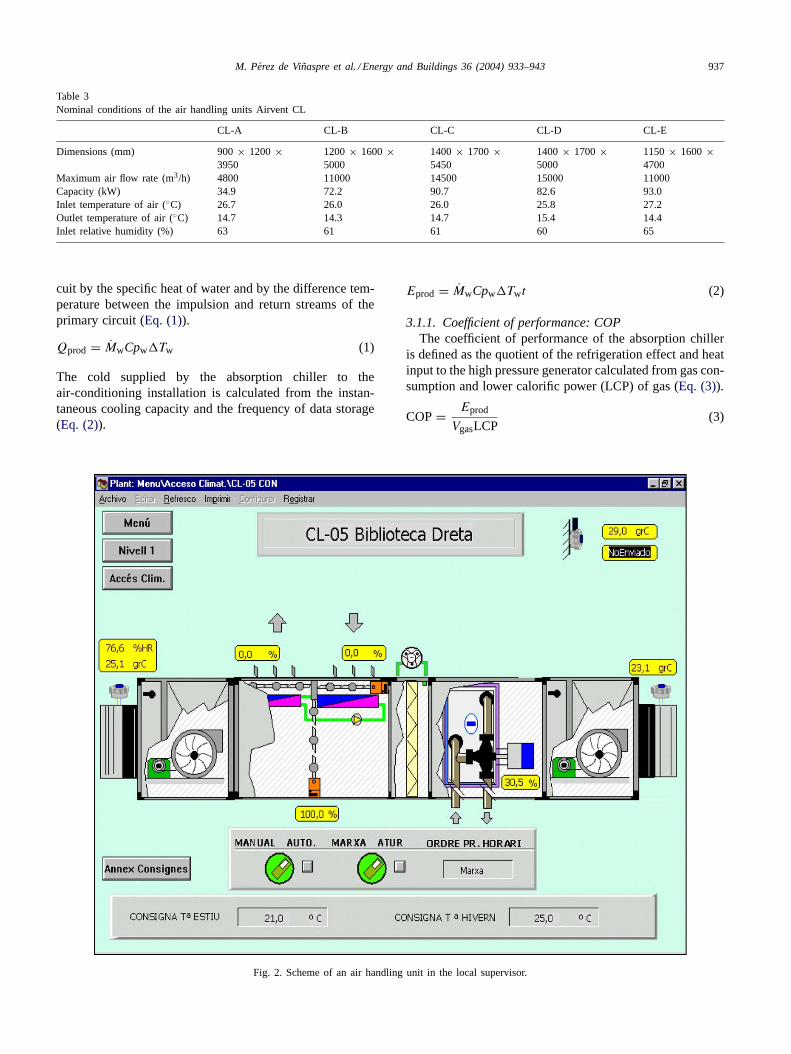
Maximum air flow rate (m3/h) 4800 11000 14500 15000 11000Capacity (kW) 34.9 72.2 90.7 82.6 93.0Inlet temperature of air (◦C) 26.7 26.0 26.0 25.8 27.2Outlet temperature of air (◦C) 14.7 14.3 14.7 15.4 14.4Inlet relative humidity (%) 63 61 61 60 65
cuit by the specific heat of water and by the difference tem-perature between the impulsion and return streams of theprimary circuit (Eq. (1)).
Qprod = MwCpw�Tw (1)
The cold supplied by the absorption chiller to theair-conditioning installation is calculated from the instan-taneous cooling capacity and the frequency of data storage(Eq. (2)).
Fig. 2. Scheme of an air handling unit in the local supervisor.
Eprod = MwCpw�Twt (2)
3.1.1. Coefficient of performance: COPThe coefficient of performance of the absorption chiller
is defined as the quotient of the refrigeration effect and heatinput to the high pressure generator calculated from gas con-sumption and lower calorific power (LCP) of gas (Eq. (3)).
COP= Eprod
VgasLCP(3)
938 M. Perez de Viñaspre et al. / Energy and Buildings 36 (2004) 933–943
3.2. Distribution and terminal units
3.2.1. Air handling unitsThe building considered in this study has six air han-
dling units which are installed in the services area, the li-brary, study room, and two classrooms. There are five dif-ferent models (A–E) having nominal capacities in the range34–93 kW (Table 3).
From these units we have measured with a frequency of1 min the impulsion and return temperatures of air, returnrelative humidity, percentage of opening valve controllingthe mass flow rate of chilled water entering the cooling bat-tery, and percentage of opening sluices of exterior air con-trolling the free cooling.
The operation mode of the air handling units consistsof passing air through a battery in which chilled/hot wa-
0
5
10
15
20
25
30
35
40
45
50
55
60
16-ju
l
18-ju
l
22-ju
l
24-ju
l
26-ju
l
30-ju
l
01-a
go
05-a
go
07-a
go
09-a
go
13-a
go
15-a
go
20-a
go
22-a
go
26-a
go
28-a
go
30-a
go
03-s
ep
05-s
ep
09-s
ep
12-s
ep
16-s
ep
18-s
ep
20-s
ep
25-s
ep
27-s
ep
01-o
ct
03-o
ct
07-o
ct
09-o
ct
11-o
ct
15-o
ct
17-o
ct
21-o
ct
23-o
ct
25-o
ct
29-o
ct
Date
Nu
mb
er o
f o
n/o
ff c
ycle
s
-2
1
4
7
10
13
16
19
22
25
28
31
34
37
40
43
46
49
52
55
58
61
64
67
70
Op
erat
ing
tim
e o
f th
e ab
sorp
tio
n c
hill
er (
%)
cycles on/off Functioning time ratio (%)
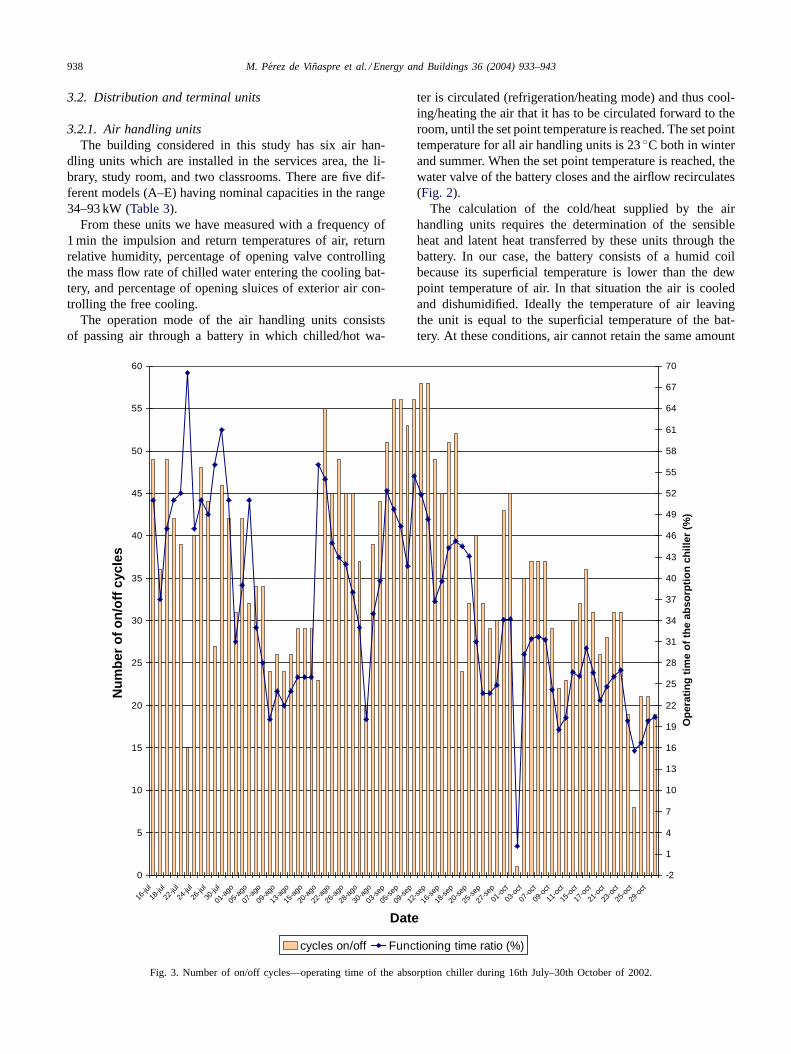
Fig. 3. Number of on/off cycles—operating time of the absorption chiller during 16th July–30th October of 2002.
ter is circulated (refrigeration/heating mode) and thus cool-ing/heating the air that it has to be circulated forward to theroom, until the set point temperature is reached. The set pointtemperature for all air handling units is 23◦C both in winterand summer. When the set point temperature is reached, thewater valve of the battery closes and the airflow recirculates(Fig. 2).
The calculation of the cold/heat supplied by the airhandling units requires the determination of the sensibleheat and latent heat transferred by these units through thebattery. In our case, the battery consists of a humid coilbecause its superficial temperature is lower than the dewpoint temperature of air. In that situation the air is cooledand dishumidified. Ideally the temperature of air leavingthe unit is equal to the superficial temperature of the bat-tery. At these conditions, air cannot retain the same amount
M. Perez de Viñaspre et al. / Energy and Buildings 36 (2004) 933–943 939
of steam as at the entrance even at saturated conditions[17].
Looking at the psychometric chart the equivalent dewpoint temperature can be determined from the return tem-perature and relative humidity. Then, the superficial temper-ature of the battery and the latent heat can be calculated.The temperature of the battery has to be equal or lower thanthe dew point temperature to take off the latent heat. More-over, a positive value of the latent heat means that there isno latent heat in the process as it is not possible to supplyhumidity to the ambient.
The sensible heat is obtained by multiplying the nomi-nal airflow rate by the temperature difference between theimpulsion and return streams (Eq. (4)).
Qs = Ve
νeCpas(Ti − Tr) (4)
Regarding the calculation of latent heat (Eq. (8)), we haveto determine previously the superficial temperature of thebattery considering the impulsion and return water temper-atures of the air handling units and the opening percentageof the valve (Eqs. (5) and (6)). Then we obtain the by-passfactor, that is, the rate of dry air no treated with respect tothe total dry air (Eq. (7)).
XT′ + (100− X)Tic = 100Trc (5)
Tb = 1 + Tic + T ′
2(6)
FB = mnt
mtot= Ti − Tb
Tr − Tb(7)
Ql = Ve
νeCf (1 − FB)(Wb − Wr) (8)
3.2.2. FancoilsThe fancoils units installed in the building are Clivet type
FOI (horizontal fancoil without cabinet) and there are twodifferent models of 3.5 and 4.5 kW of power, respectively.In this case, the return air temperature (room temperature)and the percentage of opening valve controlling the rate ofchilled water entering the battery were monitored.
3.2.3. Ducts and distribution pumpsAn energy balance of the distribution circuits of the
air-conditioning installation can be assessed including theenergy consumption of the pumps and energy losses inpipes.
The air-conditioning installation has three distributionpumps for chilled/hot water of the Yazaki absorption ma-chine, cooling water of refrigeration tower, and distributioncircuit to the air handling units and fancoils. The power ofthese pumps are 7.5, 7.5 and 4 kW, respectively, while theefficiency is 0.7 according to the operation curve providedby the manufacturer.
The daily energy consumption is obtained multiplying thenominal power of the pumps by the efficiency and the dailyworking period (Eq. (9)).
Ep = ηpt
3∑
i=1
Ppn (9)
The heat losses in the circuit pipes are calculated usingthe pipes length and the characteristics of isolating material(Eq. (10)).
Epi = klplt (10)
4. Results and discussion
In this paragraph, the collected operational data of theair-conditioning installation were analyzed by evaluating theoperation of the Yazaki absorption machine in cooling mode,and by assessing the energy balance of the integrated systemconsisting of the chiller, the distribution circuits, and theterminal units (air handling units and fan coils).
4.1. Evaluation of the operation of the absorption chiller
Fig. 3shows the number of sudden starts and stops (on/offcycles) of the absorption chiller throughout the day. The av-erage number of cycles was 36, which is fairly high con-sidering that this corresponds to about three to four startsof the chiller every hour. This is because the chiller is over-sized and the demand for air-conditioning is low. This figurealso shows the time-relation in which the chiller produceschilled water. 41% of the time the absorption chiller is run-ning, and during the remaining time it is in stand-by waitingfor a higher air-conditioning demand.
The operation sequence of the absorption chiller con-sists of; a start up early in the morning followed by anoperation cycle of 15–30 min, and a stop when the chilledwater temperature reaches 7◦C, and then successive startup/operation/stop cycles to maintain the return temperatureof the primary circuit in the range 7–10◦C. As the demandfor air-conditioning of the building is low in relation to thecooling capacity of the chiller, the on/off cycles are frequentand short (between 4 and 9 min). Also, there were feweron/off cycles in the first fortnight of August than in the sec-ond fortnight of July. This was because the average exter-nal temperature was higher in July than in August and thechiller had to start and stop more often to reach the targetthermal conditions of chilled water.
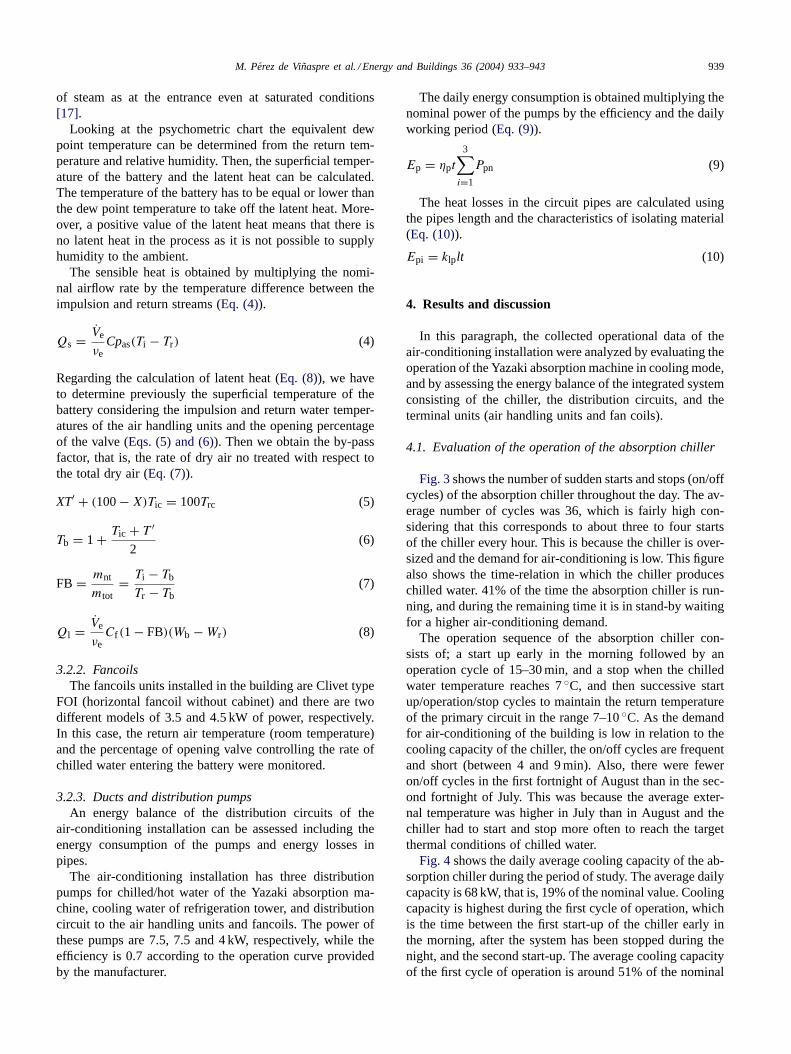
Fig. 4shows the daily average cooling capacity of the ab-sorption chiller during the period of study. The average dailycapacity is 68 kW, that is, 19% of the nominal value. Coolingcapacity is highest during the first cycle of operation, whichis the time between the first start-up of the chiller early inthe morning, after the system has been stopped during thenight, and the second start-up. The average cooling capacityof the first cycle of operation is around 51% of the nominal
940 M. Perez de Viñaspre et al. / Energy and Buildings 36 (2004) 933–943
0
50
100
150
200
250
300
350
16/0
7/02
23/0
7/02
30/0
7/02
06/0
8/02
13/0
8/02
20/0
8/02
27/0
8/02
03/0
9/02
10/0
9/02
17/0
9/02
24/0
9/02
01/1
0/02
08/1
0/02
15/1
0/02
22/1
0/02
29/1
0/02
Date
Co
olin
g C
apac
ity
(kW
)
Nominal cooling capacity Daily cooling capacity 1st.Cycle cooling capacity
Fig. 4. Daily and first cycle cooling capacity of the absorption chiller during 16th July–30th October of 2002.
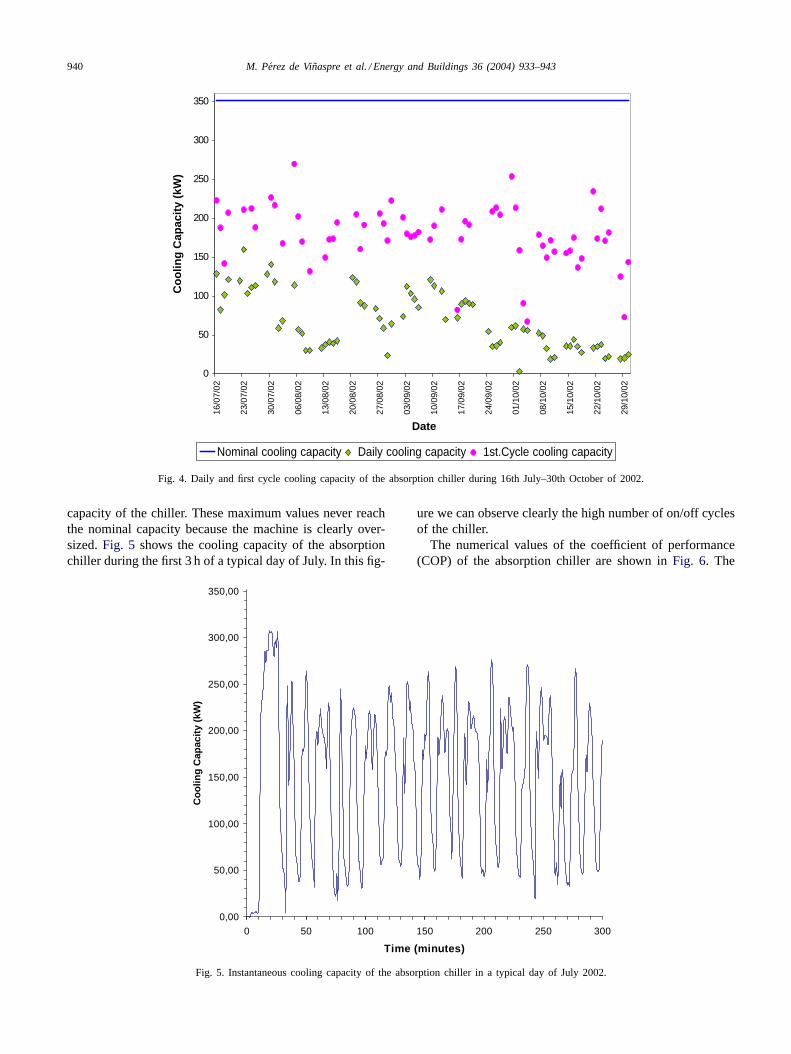
capacity of the chiller. These maximum values never reachthe nominal capacity because the machine is clearly over-sized.Fig. 5 shows the cooling capacity of the absorptionchiller during the first 3 h of a typical day of July. In this fig-
0,00
50,00
100,00
150,00
200,00
250,00
300,00
350,00
0 50 100 150 200 250 300
Time (minutes)
Co
olin
g C
apac
ity
(kW
)
Fig. 5. Instantaneous cooling capacity of the absorption chiller in a typical day of July 2002.
ure we can observe clearly the high number of on/off cyclesof the chiller.
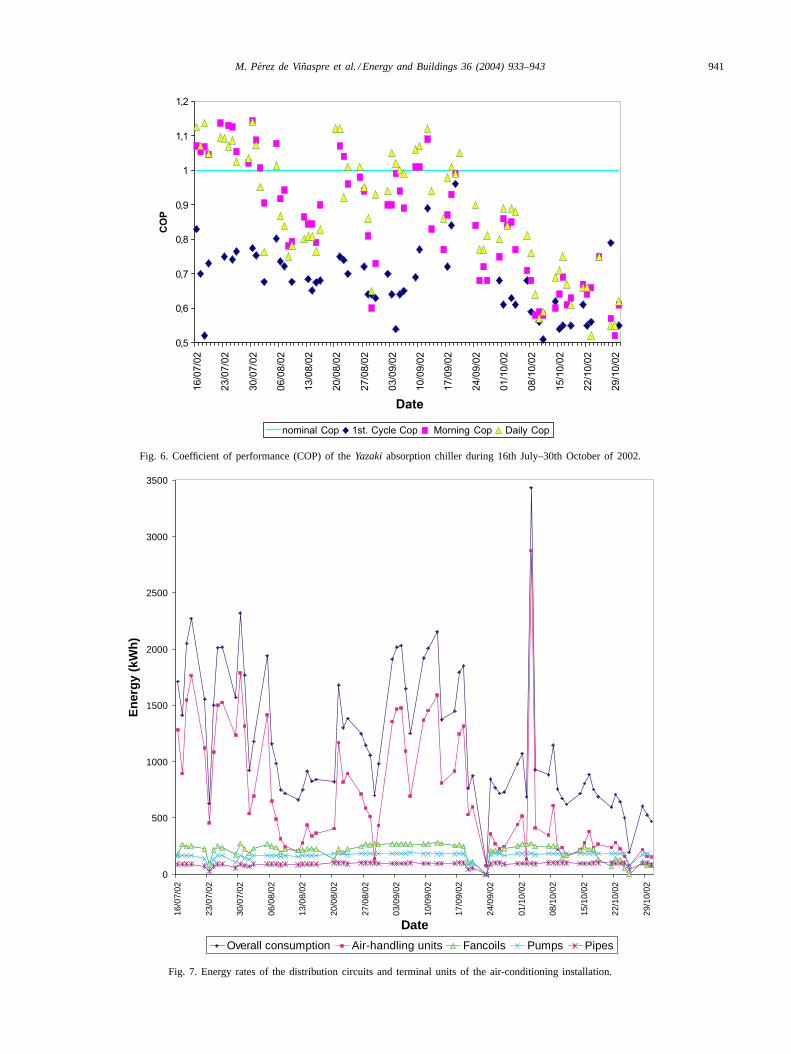
The numerical values of the coefficient of performance(COP) of the absorption chiller are shown inFig. 6. The
M. Perez de Viñaspre et al. / Energy and Buildings 36 (2004) 933–943 941
0,5
0,6
0,7
0,8
0,9
1
1,1
1,2
16/0
7/0
2
23/0
7/0
2
30/0
7/0
2
06/0
8/0
2
13/0
8/0
2
20/0
8/0
2
27/0
8/0
2
03/0
9/0
2
10/0
9/0
2
17/0
9/0
2
24/0
9/0
2
01/1
0/0
2
08/1
0/0
2
15/1
0/0
2
22/1
0/0
2
29/1
0/0
2
Date
COP
nominal Cop 1st. Cycle Cop Morning Cop Daily Cop
Fig. 6. Coefficient of performance (COP) of theYazakiabsorption chiller during 16th July–30th October of 2002.
0
500
1000
1500
2000
2500
3000
3500
16/0
7/02
23/0
7/02
30/0
7/02
06/0
8/02
13/0
8/02
20/0
8/02
27/0
8/02
03/0
9/02
10/0
9/02
17/0
9/02
24/0
9/02
01/1
0/02
08/1
0/02
15/1
0/02
22/1
0/02
29/1
0/02
Date
En
erg
y (k
Wh
)
Overall consumption Air-handling units Fancoils Pumps Pipes
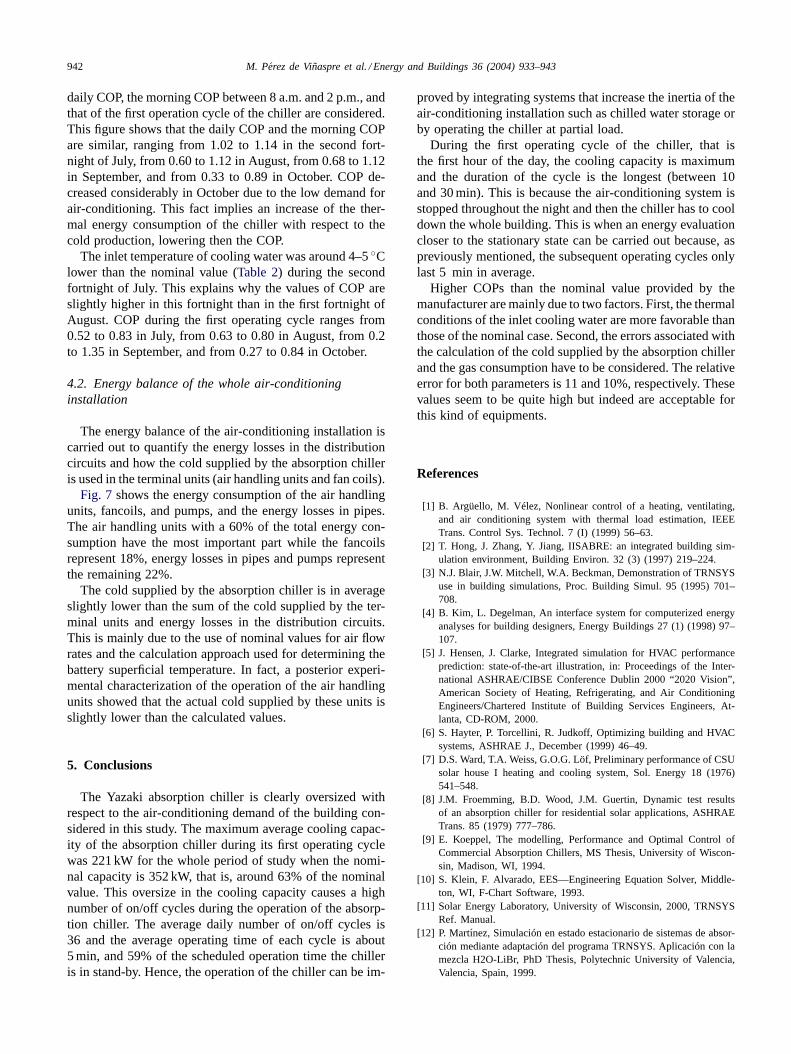
Fig. 7. Energy rates of the distribution circuits and terminal units of the air-conditioning installation.
942 M. Perez de Viñaspre et al. / Energy and Buildings 36 (2004) 933–943
daily COP, the morning COP between 8 a.m. and 2 p.m., andthat of the first operation cycle of the chiller are considered.This figure shows that the daily COP and the morning COPare similar, ranging from 1.02 to 1.14 in the second fort-night of July, from 0.60 to 1.12 in August, from 0.68 to 1.12in September, and from 0.33 to 0.89 in October. COP de-creased considerably in October due to the low demand forair-conditioning. This fact implies an increase of the ther-mal energy consumption of the chiller with respect to thecold production, lowering then the COP.
The inlet temperature of cooling water was around 4–5◦Clower than the nominal value (Table 2) during the secondfortnight of July. This explains why the values of COP areslightly higher in this fortnight than in the first fortnight ofAugust. COP during the first operating cycle ranges from0.52 to 0.83 in July, from 0.63 to 0.80 in August, from 0.2to 1.35 in September, and from 0.27 to 0.84 in October.
4.2. Energy balance of the whole air-conditioninginstallation
The energy balance of the air-conditioning installation iscarried out to quantify the energy losses in the distributioncircuits and how the cold supplied by the absorption chilleris used in the terminal units (air handling units and fan coils).
Fig. 7 shows the energy consumption of the air handlingunits, fancoils, and pumps, and the energy losses in pipes.The air handling units with a 60% of the total energy con-sumption have the most important part while the fancoilsrepresent 18%, energy losses in pipes and pumps representthe remaining 22%.
The cold supplied by the absorption chiller is in averageslightly lower than the sum of the cold supplied by the ter-minal units and energy losses in the distribution circuits.This is mainly due to the use of nominal values for air flowrates and the calculation approach used for determining thebattery superficial temperature. In fact, a posterior experi-mental characterization of the operation of the air handlingunits showed that the actual cold supplied by these units isslightly lower than the calculated values.
5. Conclusions
The Yazaki absorption chiller is clearly oversized withrespect to the air-conditioning demand of the building con-sidered in this study. The maximum average cooling capac-ity of the absorption chiller during its first operating cyclewas 221 kW for the whole period of study when the nomi-nal capacity is 352 kW, that is, around 63% of the nominalvalue. This oversize in the cooling capacity causes a highnumber of on/off cycles during the operation of the absorp-tion chiller. The average daily number of on/off cycles is36 and the average operating time of each cycle is about5 min, and 59% of the scheduled operation time the chilleris in stand-by. Hence, the operation of the chiller can be im-
proved by integrating systems that increase the inertia of theair-conditioning installation such as chilled water storage orby operating the chiller at partial load.
During the first operating cycle of the chiller, that isthe first hour of the day, the cooling capacity is maximumand the duration of the cycle is the longest (between 10and 30 min). This is because the air-conditioning system isstopped throughout the night and then the chiller has to cooldown the whole building. This is when an energy evaluationcloser to the stationary state can be carried out because, aspreviously mentioned, the subsequent operating cycles onlylast 5 min in average.
Higher COPs than the nominal value provided by themanufacturer are mainly due to two factors. First, the thermalconditions of the inlet cooling water are more favorable thanthose of the nominal case. Second, the errors associated withthe calculation of the cold supplied by the absorption chillerand the gas consumption have to be considered. The relativeerror for both parameters is 11 and 10%, respectively. Thesevalues seem to be quite high but indeed are acceptable forthis kind of equipments.
References
[1] B. Argüello, M. Vélez, Nonlinear control of a heating, ventilating,and air conditioning system with thermal load estimation, IEEETrans. Control Sys. Technol. 7 (I) (1999) 56–63.
[2] T. Hong, J. Zhang, Y. Jiang, IISABRE: an integrated building sim-ulation environment, Building Environ. 32 (3) (1997) 219–224.
[3] N.J. Blair, J.W. Mitchell, W.A. Beckman, Demonstration of TRNSYSuse in building simulations, Proc. Building Simul. 95 (1995) 701–708.
[4] B. Kim, L. Degelman, An interface system for computerized energyanalyses for building designers, Energy Buildings 27 (1) (1998) 97–107.
[5] J. Hensen, J. Clarke, Integrated simulation for HVAC performanceprediction: state-of-the-art illustration, in: Proceedings of the Inter-national ASHRAE/CIBSE Conference Dublin 2000 “2020 Vision”,American Society of Heating, Refrigerating, and Air ConditioningEngineers/Chartered Institute of Building Services Engineers, At-lanta, CD-ROM, 2000.
[6] S. Hayter, P. Torcellini, R. Judkoff, Optimizing building and HVACsystems, ASHRAE J., December (1999) 46–49.
[7] D.S. Ward, T.A. Weiss, G.O.G. Löf, Preliminary performance of CSUsolar house I heating and cooling system, Sol. Energy 18 (1976)541–548.
[8] J.M. Froemming, B.D. Wood, J.M. Guertin, Dynamic test resultsof an absorption chiller for residential solar applications, ASHRAETrans. 85 (1979) 777–786.
[9] E. Koeppel, The modelling, Performance and Optimal Control ofCommercial Absorption Chillers, MS Thesis, University of Wiscon-sin, Madison, WI, 1994.
[10] S. Klein, F. Alvarado, EES—Engineering Equation Solver, Middle-ton, WI, F-Chart Software, 1993.
[11] Solar Energy Laboratory, University of Wisconsin, 2000, TRNSYSRef. Manual.
[12] P. Martınez, Simulación en estado estacionario de sistemas de absor-ción mediante adaptación del programa TRNSYS. Aplicación con lamezcla H2O-LiBr, PhD Thesis, Polytechnic University of Valencia,Valencia, Spain, 1999.

M. Perez de Viñaspre et al. / Energy and Buildings 36 (2004) 933–943 943
[13] P.J. Martınez, A. Garcıa, J.M. Pinazo, Performance analysis of anair conditioning system driven by natural gas, Energy Buildings 35(2003) 669–674.
[14] M. Pérez de Viñaspre, Estudio de los sistemas de producción deenergıa térmica por absorción en la gestión energética de un edificiouniversitario, MS Thesis, University Rovira i Virgili, Tarragona,Spain, 2002.
[15] M. Pérez de Viñaspre, M. Bourouis, J. Montornés, A. Coronas, A.Garcıa Laespada, V. Soto, J. Pinazo, Evaluación energética del sis-tema de calefacción y climatización por absorción de un edificio uni-
versitario, in: Proceedings of the First Spanish Congress of Sciencesand Technologies of Refrigeration, CYTEF, Cartagena, Spain, 2002.
[16] J. Montornés, M. Bourouis, M. Pérez de Viñaspre, A. Coronas, C.Dıaz de Argandoña, J. Domingo, Supervisión del estado de clima-tización de edificios universitarios a través de la Web, in: Proceed-ings of the XV Spanish Congress of Mechanical Engineering, Cádiz,Spain, 2002.
[17] J. Pinazo, Manual de Climatización Tomo I: Transformacionessicrométricas, Servicio de Publicaciones Universidad Politécnica deValencia SPUPV-95.819 (1995).