Monitored natural attenuation of manufactured gas plant tar mono- and polycyclic aromatic...
11
Copyright © 2009 The Author(s) Journal compilation © 2009 National Ground Water Association. 66 Ground Water Monitoring & Remediation 29, no. 3/ Summer 2009/pages 66–76 NGWA.org Monitored Natural Attenuation of Manufactured Gas Plant Tar Mono- and Polycyclic Aromatic Hydrocarbons in Ground Water: A 14-Year Field Study by Edward F. Neuhauser, John A. Ripp, Nicholas A. Azzolina, Eugene L . Madsen, David M. Mauro, and Terry Taylor Abstract Site 24 was the subject of a 14-year (5110-day) study of a ground water plume created by the disposal of manufactured gas plant (MGP) tar into a shallow sandy aquifer approximately 25 years prior to the study. The ground water plume in 1988 extended from a well-defined source area to a distance of approximately 400 m down gradient. A system of monitoring wells was installed along six transects that ran perpendicular to the longitudinal axis of the plume centerline. The MGP tar source was removed from the site in 1991 and a 14-year ground water monitored natural attenuation (MNA) study commenced. The program measured the dissolved mono- and polycyclic aromatic hydrocarbons (MAHs and PAHs) periodically over time, which decreased significantly over the 14-year period. Naphthalene decreased to less than 99% of the original dissolved mass, with mass degradation rates of 0.30 per year (half-life 2.3 years). Bulk attenuation rate constants for plume centerline concentrations over time ranged from 0.33 ± 0.09 per year (half-life 2.3 ± 0.8 years) for toluene and 0.45 ± 0.06 per year (half-life 1.6 ± 0.2 years) for naphthalene. The hydrogeologic setting at Site 24, having a sandy aquifer, shallow water table, clay confining layer, and aerobic conditions, was ideal for demonstrating MNA. However, these results demonstrate that MNA is a viable remedial strategy for ground water at sites impacted by MAHs and PAHs after the original source is removed, stabilized, or contained. Introduction Currently in the United States, there is a broad-based effort lead by the gas and electric utility industry to address legacy contamination from the operations of former manu- factured gas plants (MGPs) that supplied gas for lighting, cooking, and heating. It was estimated that more than 1500 MGP facilities operated in the United States between the years 1890 and 1950 (Rhodes 1984). With the additional in- dustry research since 1984, the actual number of MGP sites is likely closer to 2000. The vast majority of MGPs ceased operation by the 1950s and most of the properties were con- verted to other commercial or industrial uses. The cost to address the contamination at these sites can range from $1 million to well over $10 million per site (Ripp 2007). Re- cently it was reported that more than 1000 former MGP sites are currently being investigated and remediated within the United States (Ripp 2007). Many of these sites have ground water that has been impacted by MGP tars present as dense nonaqueous phase liquids (DNAPLs). Historical remedial experiences on Superfund sites have shown that large ground water pump and treat systems are ineffective in removing the entire mass of dissolved phase contamination for sites that contained DNAPLs (Mackay and Cherry 1989). In 1993, the U.S. Environmental Pro- tection Agency (U.S. EPA) issued their guidance document on determining the technical impracticability of ground water remediation at sites containing DNAPLs (U.S. EPA 1993). As a result, there has been a focus within the utility industry to start MGP remedial actions with the removal, stabilization, or containment of the primary source areas of contamination and allow for monitored natural attenu- ation (MNA) of the impacted ground water. MGP source areas typically include locations where process by-products (i.e., coal and water gas tars) were stored and potentially released into the environment, and are often associated with former unit MGP operations such as relief gas holders, tar separators, or tar wells. For this study, we define MNA as a remediation approach that relies on the combination of
-
Upload
independent -
Category
Documents
-
view
3 -
download
0
Transcript of Monitored natural attenuation of manufactured gas plant tar mono- and polycyclic aromatic...
Copyright © 2009 The Author(s)Journal compilation © 2009 National Ground Water Association.
66 Ground Water Monitoring & Remediation 29, no. 3/ Summer 2009/pages 66–76 NGWA.org
Monitored Natural Attenuation of Manufactured Gas Plant Tar Mono- and
Polycyclic Aromatic Hydrocarbons in Ground Water: A 14-Year Field Study
by Edward F. Neuhauser, John A. Ripp, Nicholas A. Azzolina, Eugene L . Madsen, David M. Mauro, and Terry Taylor
AbstractSite 24 was the subject of a 14-year (5110-day) study of a ground water plume created by the disposal of manufactured
gas plant (MGP) tar into a shallow sandy aquifer approximately 25 years prior to the study. The ground water plume in 1988 extended from a well-defined source area to a distance of approximately 400 m down gradient. A system of monitoring wells was installed along six transects that ran perpendicular to the longitudinal axis of the plume centerline. The MGP tar source was removed from the site in 1991 and a 14-year ground water monitored natural attenuation (MNA) study commenced. The program measured the dissolved mono- and polycyclic aromatic hydrocarbons (MAHs and PAHs) periodically over time, which decreased significantly over the 14-year period. Naphthalene decreased to less than 99% of the original dissolved mass, with mass degradation rates of 0.30 per year (half-life 2.3 years). Bulk attenuation rate constants for plume centerline concentrations over time ranged from 0.33 ± 0.09 per year (half-life 2.3 ± 0.8 years) for toluene and 0.45 ± 0.06 per year (half-life 1.6 ± 0.2 years) for naphthalene. The hydrogeologic setting at Site 24, having a sandy aquifer, shallow water table, clay confining layer, and aerobic conditions, was ideal for demonstrating MNA. However, these results demonstrate that MNA is a viable remedial strategy for ground water at sites impacted by MAHs and PAHs after the original source is removed, stabilized, or contained.
IntroductionCurrently in the United States, there is a broad-based
effort lead by the gas and electric utility industry to address legacy contamination from the operations of former manu-factured gas plants (MGPs) that supplied gas for lighting, cooking, and heating. It was estimated that more than 1500 MGP facilities operated in the United States between the years 1890 and 1950 (Rhodes 1984). With the additional in-dustry research since 1984, the actual number of MGP sites is likely closer to 2000. The vast majority of MGPs ceased operation by the 1950s and most of the properties were con-verted to other commercial or industrial uses. The cost to address the contamination at these sites can range from $1 million to well over $10 million per site (Ripp 2007). Re-cently it was reported that more than 1000 former MGP sites are currently being investigated and remediated within the United States (Ripp 2007). Many of these sites have ground
water that has been impacted by MGP tars present as dense nonaqueous phase liquids (DNAPLs).
Historical remedial experiences on Superfund sites have shown that large ground water pump and treat systems are ineffective in removing the entire mass of dissolved phase contamination for sites that contained DNAPLs (Mackay and Cherry 1989). In 1993, the U.S. Environmental Pro-tection Agency (U.S. EPA) issued their guidance document on determining the technical impracticability of ground water remediation at sites containing DNAPLs (U.S. EPA 1993). As a result, there has been a focus within the utility industry to start MGP remedial actions with the removal, stabilization, or containment of the primary source areas of contamination and allow for monitored natural attenu-ation (MNA) of the impacted ground water. MGP source areas typically include locations where process by-products (i.e., coal and water gas tars) were stored and potentially released into the environment, and are often associated with former unit MGP operations such as relief gas holders, tar separators, or tar wells. For this study, we define MNA as a remediation approach that relies on the combination of
gwmr1244.indd 66gwmr1244.indd 66 7/25/09 6:37:50 PM7/25/09 6:37:50 PM
NGWA.org E.F. Neuhauser et al./ Ground Water Monitoring & Remediation 29, no. 3: 66–76 67
natural biological, chemical, and physical processes that act without human intervention to reduce the mass, mobility, volume, and concentration of the contaminant (NRC 1993, 2000, U.S. EPA 1999; Alvarez and Illman 2006).
The concept of MNA has gained a scientific basis and regulatory acceptance over the last two decades. In the late 1990s, the U.S. EPA published its guidance for MNA as applied to chlorinated compounds (U.S. EPA 1998) and petroleum hydrocarbons (U.S. EPA 1999). However, while detailed studies have been conducted for groundwa-ter impacted with monoaromatic hydrocarbons (MAHs), specifically benzene, toluene, ethylbenzene, and xylenes (BTEX), few studies have been completed which evalu-ate MNA for polycyclic aromatic hydrocarbons (PAHs) in groundwater. Owing to the large number of MGP sites cur-rently being addressed, in addition to thousands of other sites with MAH and PAH ground water contamination, it is important to have documented cases of MNA for these compounds so that predictions can be made and enhance-ments considered regarding the recovery time following source control. Researchers at the Electric Power Research Institute (EPRI) and Niagara Mohawk Power Corporation (now National Grid) understood this in 1989 when the de-cision was made to conduct a long-term study of natural attenuation of PAH-impacted ground water after the tar source was removed. Yet even today, after almost 20 years, only a handful of field studies of natural attenuation of PAH-impacted ground water have been reported in the lit-erature (Boggs et al. 1992; Fowler et al. 1994; Landmeyer et al. 1998; King and Barker 1999; King et al. 1999; Ong et al. 2001). Two of these studies, Boggs et al. (1992) and King and Barker (1999), report on field research sites that were not former MGP sites, but were controlled experi-ments where contaminant mixtures containing MAH and PAH compounds were injected into the subsurface and monitored for at least 3 years. Other natural attenuation studies, such as Landmeyer et al. (1998) and Ong et al. (2001), lasted only for a few years.
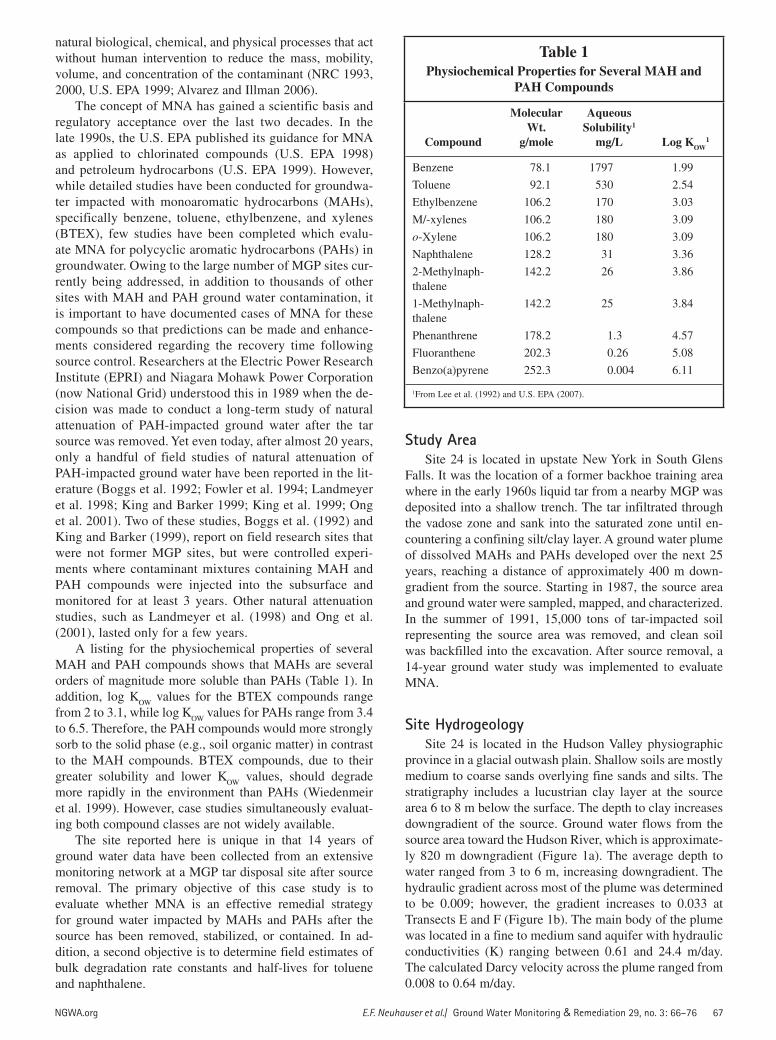
A listing for the physiochemical properties of several MAH and PAH compounds shows that MAHs are several orders of magnitude more soluble than PAHs (Table 1). In addition, log K
OW values for the BTEX compounds range
from 2 to 3.1, while log KOW
values for PAHs range from 3.4 to 6.5. Therefore, the PAH compounds would more strongly sorb to the solid phase (e.g., soil organic matter) in contrast to the MAH compounds. BTEX compounds, due to their greater solubility and lower K
OW values, should degrade
more rapidly in the environment than PAHs (Wiedenmeir et al. 1999). However, case studies simultaneously evaluat-ing both compound classes are not widely available.
The site reported here is unique in that 14 years of ground water data have been collected from an extensive monitoring network at a MGP tar disposal site after source removal. The primary objective of this case study is to evaluate whether MNA is an effective remedial strategy for ground water impacted by MAHs and PAHs after the source has been removed, stabilized, or contained. In ad-dition, a second objective is to determine field estimates of bulk degradation rate constants and half-lives for toluene and naphthalene.
Study AreaSite 24 is located in upstate New York in South Glens
Falls. It was the location of a former backhoe training area where in the early 1960s liquid tar from a nearby MGP was deposited into a shallow trench. The tar infiltrated through the vadose zone and sank into the saturated zone until en-countering a confining silt/clay layer. A ground water plume of dissolved MAHs and PAHs developed over the next 25 years, reaching a distance of approximately 400 m down-gradient from the source. Starting in 1987, the source area and ground water were sampled, mapped, and characterized. In the summer of 1991, 15,000 tons of tar-impacted soil representing the source area was removed, and clean soil was backfilled into the excavation. After source removal, a 14-year ground water study was implemented to evaluate MNA.
Site HydrogeologySite 24 is located in the Hudson Valley physiographic
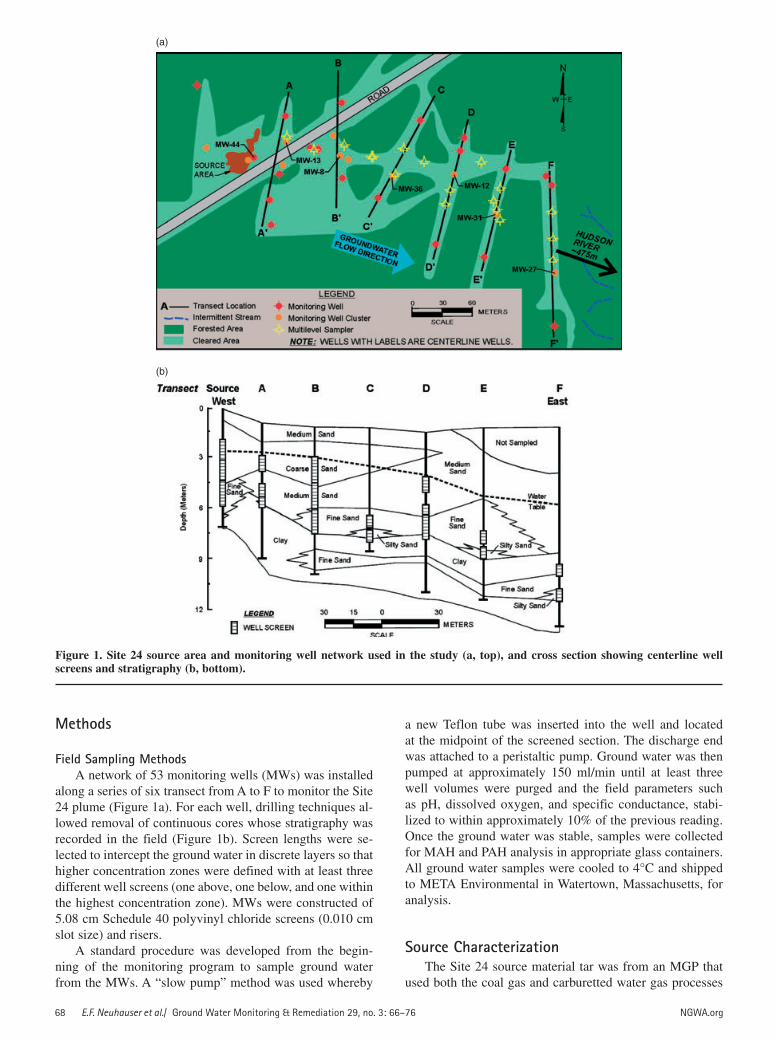
province in a glacial outwash plain. Shallow soils are mostly medium to coarse sands overlying fine sands and silts. The stratigraphy includes a lucustrian clay layer at the source area 6 to 8 m below the surface. The depth to clay increases downgradient of the source. Ground water flows from the source area toward the Hudson River, which is approximate-ly 820 m downgradient (Figure 1a). The average depth to water ranged from 3 to 6 m, increasing downgradient. The hydraulic gradient across most of the plume was determined to be 0.009; however, the gradient increases to 0.033 at Transects E and F (Figure 1b). The main body of the plume was located in a fine to medium sand aquifer with hydraulic conductivities (K) ranging between 0.61 and 24.4 m/day. The calculated Darcy velocity across the plume ranged from 0.008 to 0.64 m/day.
Table 1Physiochemical Properties for Several MAH and
PAH Compounds
Compound
Molecular Wt.
g/mole
Aqueous Solubility1
mg/L Log KOW1
Benzene 78.1 1797 1.99
Toluene 92.1 530 2.54
Ethylbenzene 106.2 170 3.03
M/-xylenes 106.2 180 3.09
o-Xylene 106.2 180 3.09
Naphthalene 128.2 31 3.36
2-Methylnaph-thalene
142.2 26 3.86
1-Methylnaph-thalene
142.2 25 3.84
Phenanthrene 178.2 1.3 4.57
Fluoranthene 202.3 0.26 5.08
Benzo(a)pyrene 252.3 0.004 6.11
1From Lee et al. (1992) and U.S. EPA (2007).
gwmr1244.indd 67gwmr1244.indd 67 7/25/09 6:37:51 PM7/25/09 6:37:51 PM
68 E.F. Neuhauser et al./ Ground Water Monitoring & Remediation 29, no. 3: 66–76 NGWA.org
Methods
Field Sampling MethodsA network of 53 monitoring wells (MWs) was installed
along a series of six transect from A to F to monitor the Site 24 plume (Figure 1a). For each well, drilling techniques al-lowed removal of continuous cores whose stratigraphy was recorded in the field (Figure 1b). Screen lengths were se-lected to intercept the ground water in discrete layers so that higher concentration zones were defined with at least three different well screens (one above, one below, and one within the highest concentration zone). MWs were constructed of 5.08 cm Schedule 40 polyvinyl chloride screens (0.010 cm slot size) and risers.
A standard procedure was developed from the begin-ning of the monitoring program to sample ground water from the MWs. A “slow pump” method was used whereby
a new Teflon tube was inserted into the well and located at the midpoint of the screened section. The discharge end was attached to a peristaltic pump. Ground water was then pumped at approximately 150 ml/min until at least three well volumes were purged and the field parameters such as pH, dissolved oxygen, and specific conductance, stabi-lized to within approximately 10% of the previous reading. Once the ground water was stable, samples were collected for MAH and PAH analysis in appropriate glass containers. All ground water samples were cooled to 4°C and shipped to META Environmental in Watertown, Massachusetts, for analysis.
Source CharacterizationThe Site 24 source material tar was from an MGP that
used both the coal gas and carburetted water gas processes
(a)
(b)
Figure 1. Site 24 source area and monitoring well network used in the study (a, top), and cross section showing centerline well screens and stratigraphy (b, bottom).
gwmr1244.indd 68gwmr1244.indd 68 7/25/09 6:37:52 PM7/25/09 6:37:52 PM
NGWA.org E.F. Neuhauser et al./ Ground Water Monitoring & Remediation 29, no. 3: 66–76 69
(Harkins et al. 1988). The source area was determined to be approximately 576 m2 (Figure 1a). Recovery wells were placed within the source and DNAPL tar was obtained from sumps placed at the bottom of each well. Pure tar was ex-tracted from these sumps and analyzed for chemical and physical characteristics.
The extraction of source material and ground water MAHs and PAHs was performed using microscale solvent extraction (MSE), and the chemical analysis was done using gas chromatography with flame ionization detection. This method was developed by the project team to allow a 1-h extraction time versus the standard 24-h Soxhlet extrac-tion method. This rapid method of extraction and analysis, which provided analytical results within hours of sampling, is now published as U.S. EPA methods 3570 (2002) and 3571 (2007). The average molecular weight of the coal tar was measured using vapor phase osmometry (Chunga et al. 1979).
Leachate CharacterizationMW-44 was installed adjacent to the downgradient side
of the source area and intercepted ground water with the highest concentrations of MAHs and PAHs without visible NAPL present (Figure 1a). Therefore, ground water obtained from MW-44 represented the dissolved phase leachate.
An estimated aqueous-phase leachate concentration was generated from the source characterization using a form of Raoult’s law, shown in Equation 1 (Shiu et al. 1988; EPRI 1992, 1996; Lee et al. 1992; King and Barker 1999).
Caq
= (Mi)(MW
ct)(Sl)(10-3) (1)
where Caq
is predicted aqueous concentration of MAH or PAH (mg/L), M
i is concentration of MAH or PAH of in-
terest in tar (mg/kg), MWct is average molecular weight
of tar (g/mole), Sl is supercooled or pure liquid solubility of MAH or PAH (moles/L), and 10–3 is conversion factor (kg/g).
Supercooled and pure liquid solubility for MAHs and PAHs were taken from Lee et al. (1992) and Mackay et al. (2006).
Ground Water CharacterizationStarting in 1987, ground water was sampled from 53
MWs and analyzed for MAHs and PAHs using MSE meth-ods. After the 1991 source removal, a series of ground water sampling events were implemented through 2005.
Ground Water Data AnalysisGround water data for all the collection points were
plotted on a base map and chemical isopleth maps were developed by interpolation between data points for visual interpretation of the areal extent of the plume. Three pri-mary data analysis methods were also used to evaluate the ground water data. First, a Kruskal–Wallis nonparametric test was used to evaluate whether seasonality affected the
data. Concentration trends over time were then evaluated using the nonparametric Mann–Kendall test (Helsel and Hirsch 2002). All analyses were done using Minitab version 14.20 (Minitab Inc.) and the “mktrend” macro.
The second data analysis method evaluated concentra-tion trends over time using a mass-depletion method, which uses multiple data sets to estimate change in concentration (or mass) across an area. The steps used in the mass-deple-tion method are as follows.
1. A geologic cross section with boundary points was developed for each transect.
2. Twenty-fi ve square foot cells were superimposed on each cross section.
3. Ground water concentrations at each cell were estimated using measured values and interpolated values between wells or multilevel samplers.
4. The mass (using a thickness of 1 foot) of naphthalene was calculated for each cell.
M = (A)(b)(n)(F)(C)(10–6) (2)
where M is mass of naphthalene in grams (g), A is area of cell in square feet, b is thickness of each cell = 1 foot, n is porosity (assumed an average porosity of 0.35), F is unit conversion of cubic feet to liters (1 foot3 = 28.32 L), C is estimated concentration within each cell in µg/L, and 10–6 is unit conversion of µg to g.
5. The mass of each of the cells was summed to determine the total mass of naphthalene in a specifi c transect.
6. Steps 1 through 5 were repeated for each time period (sample round) to estimate mass depletion over time.
Third, calculations of first-order bulk attenuation rate constants were assessed using ground water concentration versus time for individual centerline wells (Newell et al. 2002). For all calculations, ground water concentrations were transformed using the natural logarithm, and nondetect data were substituted with the minimum detection limit.
Results
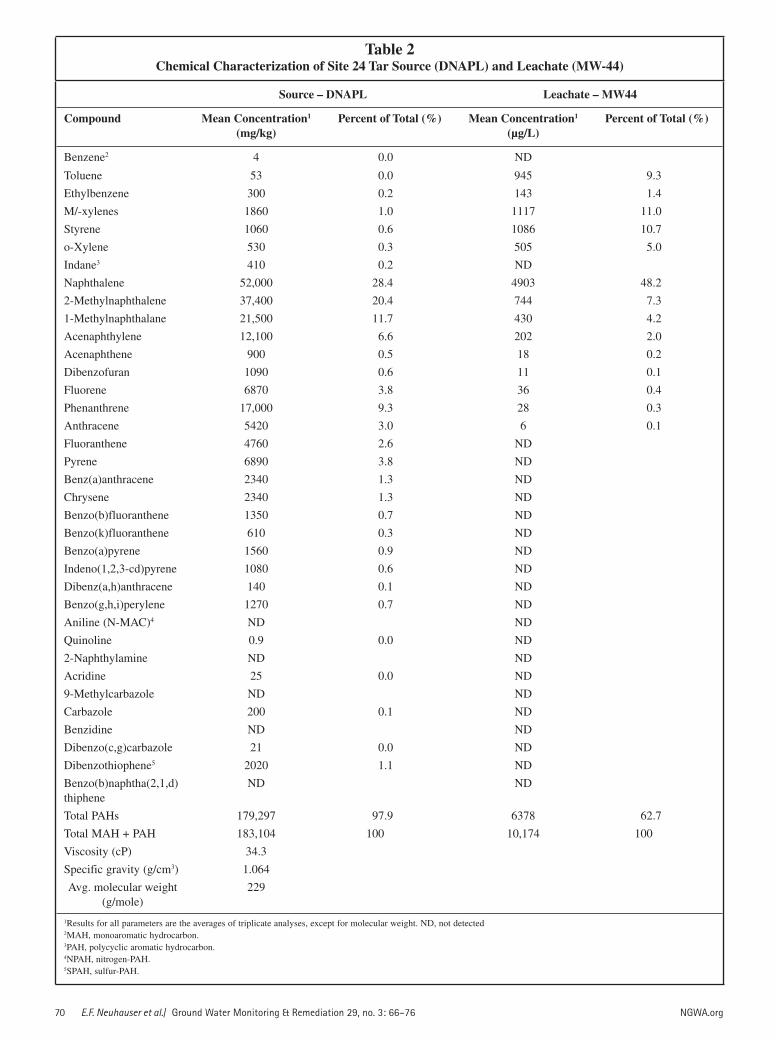
Source CharacterizationThe tar source had a greater density (1.064 g/cm3) than
water and similar viscosity (34.3 cP) to lightweight motor oil, which explains why the source migrated as a DNAPL, sank to the confining unit, and spread throughout the satu-rated zone (Table 2). At the time of source characteriza-tion, the MAHs and PAHs represented approximately 2% and 98% of the hydrocarbon mass in the tar, respectively. Naphthalene, 1-, and 2-methynaphthalene comprised ap-proximately 61% of the tar (Table 2).
Leachate CharacterizationIn contrast to the tar characterization, MAHs and PAHs
in MW-44 comprised approximately 37% and 63% of the leachate, respectively. The MAHs mostly comprised toluene, xylenes, and styrene. Naphthalene, 1-, and 2-
gwmr1244.indd 69gwmr1244.indd 69 7/25/09 6:37:53 PM7/25/09 6:37:53 PM
70 E.F. Neuhauser et al./ Ground Water Monitoring & Remediation 29, no. 3: 66–76 NGWA.org
Table 2Chemical Characterization of Site 24 Tar Source (DNAPL) and Leachate (MW-44)
Source – DNAPL Leachate – MW44
Compound Mean Concentration1
(mg/kg)Percent of Total (%) Mean Concentration1
(µg/L)Percent of Total (%)
Benzene2 4 0.0 ND
Toluene 53 0.0 945 9.3
Ethylbenzene 300 0.2 143 1.4
M/-xylenes 1860 1.0 1117 11.0
Styrene 1060 0.6 1086 10.7
o-Xylene 530 0.3 505 5.0
Indane3 410 0.2 ND
Naphthalene 52,000 28.4 4903 48.2
2-Methylnaphthalene 37,400 20.4 744 7.3
1-Methylnaphthalane 21,500 11.7 430 4.2
Acenaphthylene 12,100 6.6 202 2.0
Acenaphthene 900 0.5 18 0.2
Dibenzofuran 1090 0.6 11 0.1
Fluorene 6870 3.8 36 0.4
Phenanthrene 17,000 9.3 28 0.3
Anthracene 5420 3.0 6 0.1
Fluoranthene 4760 2.6 ND
Pyrene 6890 3.8 ND
Benz(a)anthracene 2340 1.3 ND
Chrysene 2340 1.3 ND
Benzo(b)fluoranthene 1350 0.7 ND
Benzo(k)fluoranthene 610 0.3 ND
Benzo(a)pyrene 1560 0.9 ND
Indeno(1,2,3-cd)pyrene 1080 0.6 ND
Dibenz(a,h)anthracene 140 0.1 ND
Benzo(g,h,i)perylene 1270 0.7 ND
Aniline (N-MAC)4 ND ND
Quinoline 0.9 0.0 ND
2-Naphthylamine ND ND
Acridine 25 0.0 ND
9-Methylcarbazole ND ND
Carbazole 200 0.1 ND
Benzidine ND ND
Dibenzo(c,g)carbazole 21 0.0 ND
Dibenzothiophene5 2020 1.1 ND
Benzo(b)naphtha(2,1,d)thiphene
ND ND
Total PAHs 179,297 97.9 6378 62.7
Total MAH + PAH 183,104 100 10,174 100
Viscosity (cP) 34.3
Specific gravity (g/cm3) 1.064
Avg. molecular weight (g/mole)
229
1Results for all parameters are the averages of triplicate analyses, except for molecular weight. ND, not detected2MAH, monoaromatic hydrocarbon.3PAH, polycyclic aromatic hydrocarbon.4NPAH, nitrogen-PAH.5SPAH, sulfur-PAH.
gwmr1244.indd 70gwmr1244.indd 70 7/25/09 6:37:54 PM7/25/09 6:37:54 PM
NGWA.org E.F. Neuhauser et al./ Ground Water Monitoring & Remediation 29, no. 3: 66–76 71
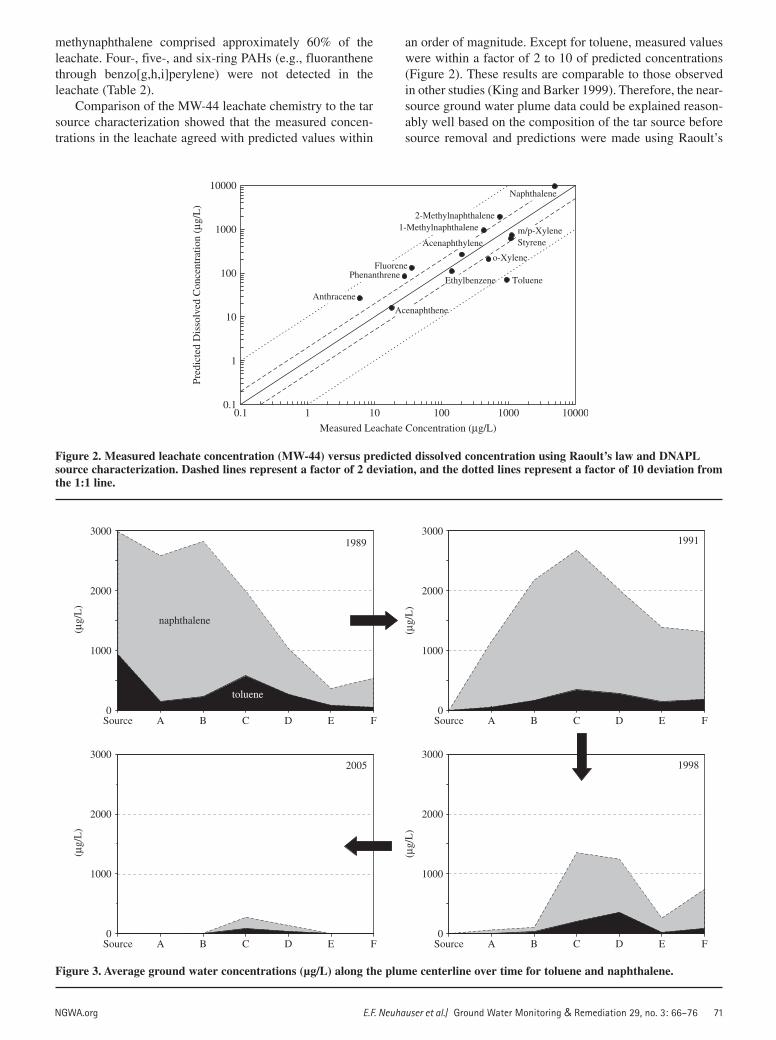
methynaphthalene comprised approximately 60% of the leachate. Four-, five-, and six-ring PAHs (e.g., fluoranthene through benzo[g,h,i]perylene) were not detected in the leachate (Table 2).
Comparison of the MW-44 leachate chemistry to the tar source characterization showed that the measured concen-trations in the leachate agreed with predicted values within
an order of magnitude. Except for toluene, measured values were within a factor of 2 to 10 of predicted concentrations (Figure 2). These results are comparable to those observed in other studies (King and Barker 1999). Therefore, the near-source ground water plume data could be explained reason-ably well based on the composition of the tar source before source removal and predictions were made using Raoult’s
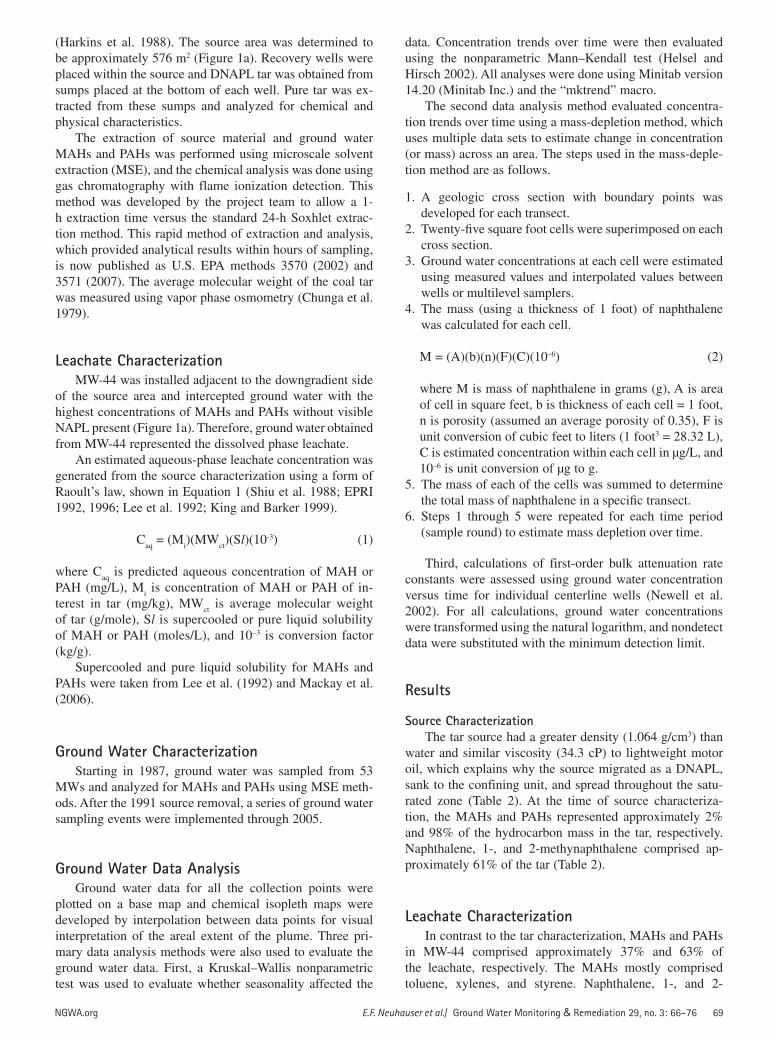
Figure 3. Average ground water concentrations (µg/L) along the plume centerline over time for toluene and naphthalene.
naphthalene
toluene
1989 1991
0
1000
2000
3000
(μg/
L)
Source A CB D E F0
1000
2000
3000
(μg/
L)
Source A CB D E F
2005 1998
0
1000
2000
3000
(μg/
L)
Source A CB D E F0
1000
2000
3000
(μg/
L)
Source A CB D E F
Figure 2. Measured leachate concentration (MW-44) versus predicted dissolved concentration using Raoult’s law and DNAPL source characterization. Dashed lines represent a factor of 2 deviation, and the dotted lines represent a factor of 10 deviation from the 1:1 line.
TolueneEthylbenzene
m/p-XyleneStyrene
o-Xylene
Naphthalene
2-Methylnaphthalene1-Methylnaphthalene
Acenaphthylene
Acenaphthene
FluorenePhenanthrene
Anthracene
0.1
1
10
100
1000
10000
0.1 1 10 100 1000 10000
Measured Leachate Concentration (μg/L)
Pred
icte
d D
isso
lved
Con
cent
ratio
n (μ
g/L
)
gwmr1244.indd 71gwmr1244.indd 71 7/25/09 6:37:55 PM7/25/09 6:37:55 PM
72 E.F. Neuhauser et al./ Ground Water Monitoring & Remediation 29, no. 3: 66–76 NGWA.org
Law. Subsequent results and discussion are based on the ground water monitoring data after source removal.
Ground Water Plume CharacterizationThe distribution of dissolved MAH and PAH constitu-
ents in the plume showed that toluene for the MAH frac-tion and naphthalene for the PAH fraction had the highest concentrations in ground water. Average concentrations of naphthalene in ground water along the plume centerline decreased over time, from a high of nearly 3000 µg/L in the source area in 1989 to a low of 190 µg/L at Transect C in 2005. Detectable concentrations of both toluene and naphthalene in ground water persisted at Transects C and D through 2005 (Figure 3).
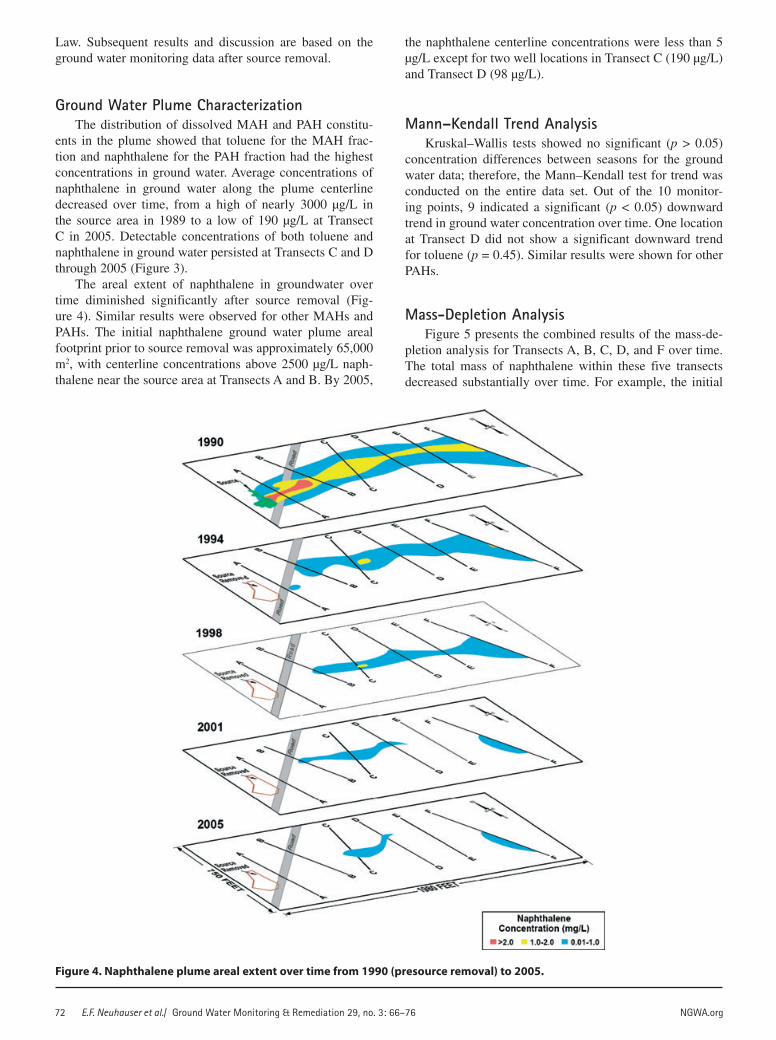
The areal extent of naphthalene in groundwater over time diminished significantly after source removal (Fig-ure 4). Similar results were observed for other MAHs and PAHs. The initial naphthalene ground water plume areal footprint prior to source removal was approximately 65,000 m2, with centerline concentrations above 2500 µg/L naph-thalene near the source area at Transects A and B. By 2005,
the naphthalene centerline concentrations were less than 5 µg/L except for two well locations in Transect C (190 µg/L) and Transect D (98 µg/L).
Mann–Kendall Trend AnalysisKruskal–Wallis tests showed no significant (p > 0.05)
concentration differences between seasons for the ground water data; therefore, the Mann–Kendall test for trend was conducted on the entire data set. Out of the 10 monitor-ing points, 9 indicated a significant (p < 0.05) downward trend in ground water concentration over time. One location at Transect D did not show a significant downward trend for toluene (p = 0.45). Similar results were shown for other PAHs.
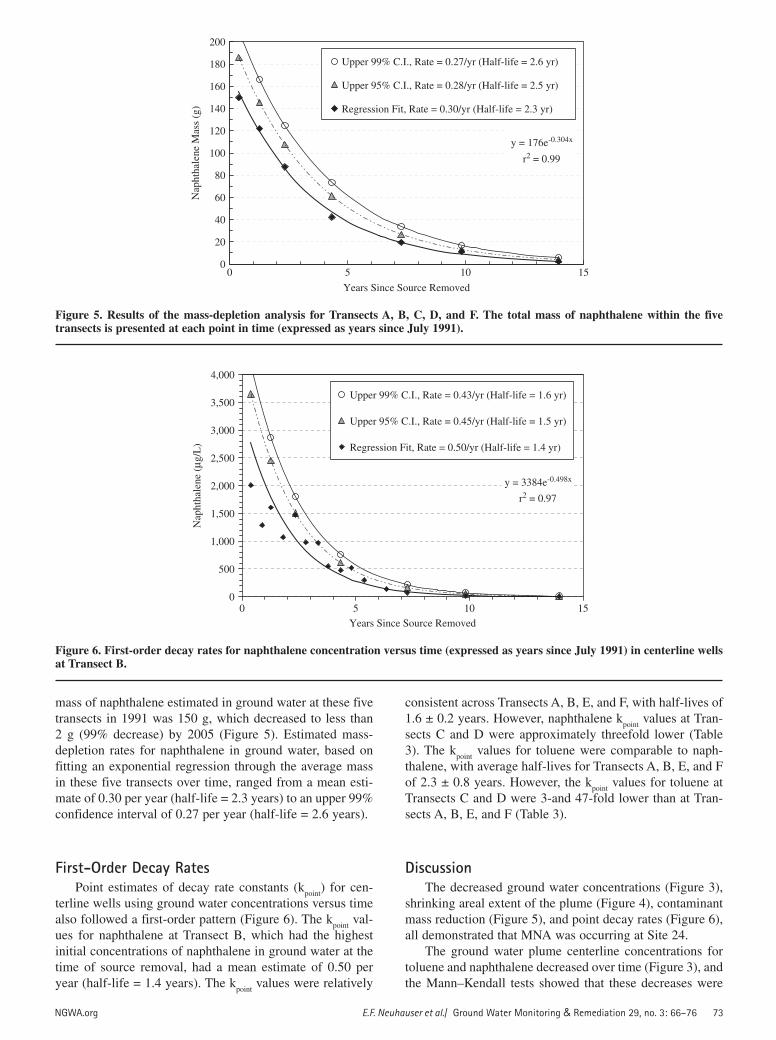
Mass-Depletion AnalysisFigure 5 presents the combined results of the mass-de-
pletion analysis for Transects A, B, C, D, and F over time. The total mass of naphthalene within these five transects decreased substantially over time. For example, the initial
Figure 4. Naphthalene plume areal extent over time from 1990 (presource removal) to 2005.
gwmr1244.indd 72gwmr1244.indd 72 7/25/09 6:37:55 PM7/25/09 6:37:55 PM
NGWA.org E.F. Neuhauser et al./ Ground Water Monitoring & Remediation 29, no. 3: 66–76 73
Figure 5. Results of the mass-depletion analysis for Transects A, B, C, D, and F. The total mass of naphthalene within the five transects is presented at each point in time (expressed as years since July 1991).
0
20
40
60
80
100
120
140
160
180
200
0 10 15
Years Since Source Removed
Nap
htha
lene
Mas
s (g
)
Upper 99% C.I., Rate = 0.27/yr (Half-life = 2.6 yr)
Upper 95% C.I., Rate = 0.28/yr (Half-life = 2.5 yr)
Regression Fit, Rate = 0.30/yr (Half-life = 2.3 yr)
5
y = 176e-0.304x
r2 = 0.99
Figure 6. First-order decay rates for naphthalene concentration versus time (expressed as years since July 1991) in centerline wells at Transect B.
0
500
1,000
1,500
2,000
2,500
3,000
3,500
4,000
0 10 15Years Since Source Removed
Nap
htha
lene
(μg
/L)
Upper 99% C.I., Rate = 0.43/yr (Half-life = 1.6 yr)
Upper 95% C.I., Rate = 0.45/yr (Half-life = 1.5 yr)
Regression Fit, Rate = 0.50/yr (Half-life = 1.4 yr)
5
y = 3384e-0.498x
r2 = 0.97
mass of naphthalene estimated in ground water at these five transects in 1991 was 150 g, which decreased to less than 2 g (99% decrease) by 2005 (Figure 5). Estimated mass-depletion rates for naphthalene in ground water, based on fitting an exponential regression through the average mass in these five transects over time, ranged from a mean esti-mate of 0.30 per year (half-life = 2.3 years) to an upper 99% confidence interval of 0.27 per year (half-life = 2.6 years).
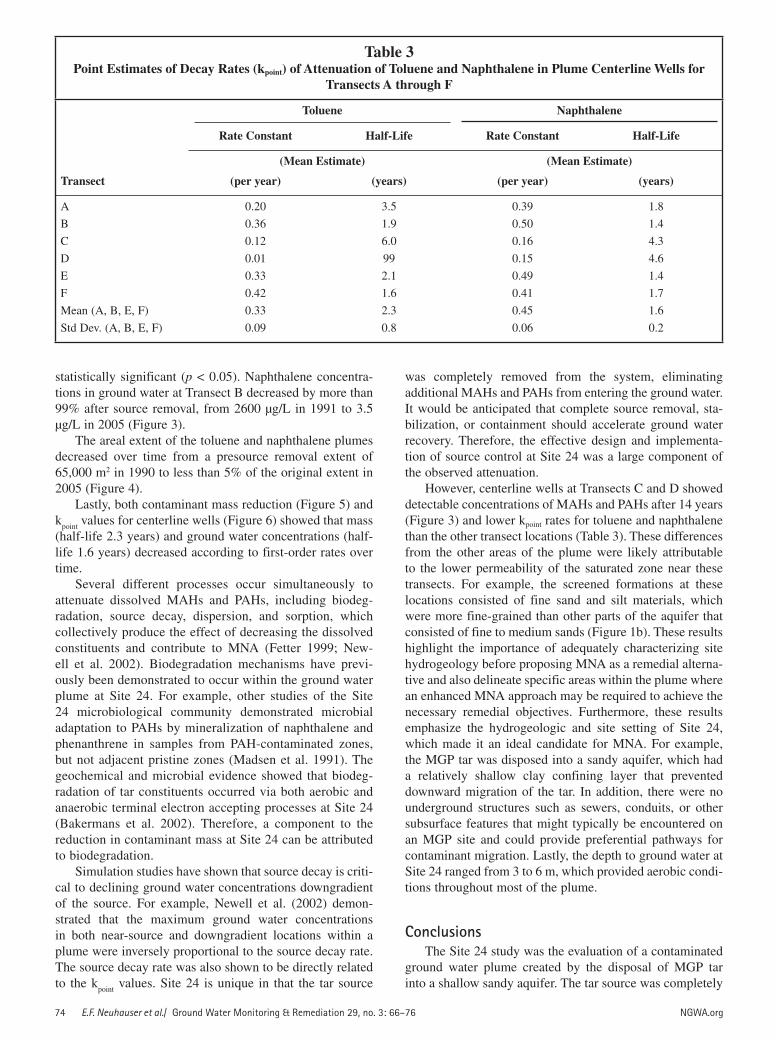
First-Order Decay RatesPoint estimates of decay rate constants (k
point) for cen-
terline wells using ground water concentrations versus time also followed a first-order pattern (Figure 6). The k
point val-
ues for naphthalene at Transect B, which had the highest initial concentrations of naphthalene in ground water at the time of source removal, had a mean estimate of 0.50 per year (half-life = 1.4 years). The k
point values were relatively
consistent across Transects A, B, E, and F, with half-lives of 1.6 ± 0.2 years. However, naphthalene k
point values at Tran-
sects C and D were approximately threefold lower (Table 3). The k
point values for toluene were comparable to naph-
thalene, with average half-lives for Transects A, B, E, and F of 2.3 ± 0.8 years. However, the k
point values for toluene at
Transects C and D were 3-and 47-fold lower than at Tran-sects A, B, E, and F (Table 3).
DiscussionThe decreased ground water concentrations (Figure 3),
shrinking areal extent of the plume (Figure 4), contaminant mass reduction (Figure 5), and point decay rates (Figure 6), all demonstrated that MNA was occurring at Site 24.
The ground water plume centerline concentrations for toluene and naphthalene decreased over time (Figure 3), and the Mann–Kendall tests showed that these decreases were
gwmr1244.indd 73gwmr1244.indd 73 7/25/09 6:37:56 PM7/25/09 6:37:56 PM
74 E.F. Neuhauser et al./ Ground Water Monitoring & Remediation 29, no. 3: 66–76 NGWA.org
statistically significant (p < 0.05). Naphthalene concentra-tions in ground water at Transect B decreased by more than 99% after source removal, from 2600 µg/L in 1991 to 3.5 µg/L in 2005 (Figure 3).
The areal extent of the toluene and naphthalene plumes decreased over time from a presource removal extent of 65,000 m2 in 1990 to less than 5% of the original extent in 2005 (Figure 4).
Lastly, both contaminant mass reduction (Figure 5) and k
point values for centerline wells (Figure 6) showed that mass
(half-life 2.3 years) and ground water concentrations (half-life 1.6 years) decreased according to first-order rates over time.
Several different processes occur simultaneously to attenuate dissolved MAHs and PAHs, including biodeg-radation, source decay, dispersion, and sorption, which collectively produce the effect of decreasing the dissolved constituents and contribute to MNA (Fetter 1999; New-ell et al. 2002). Biodegradation mechanisms have previ-ously been demonstrated to occur within the ground water plume at Site 24. For example, other studies of the Site 24 microbiological community demonstrated microbial adaptation to PAHs by mineralization of naphthalene and phenanthrene in samples from PAH-contaminated zones, but not adjacent pristine zones (Madsen et al. 1991). The geochemical and microbial evidence showed that biodeg-radation of tar constituents occurred via both aerobic and anaerobic terminal electron accepting processes at Site 24 (Bakermans et al. 2002). Therefore, a component to the reduction in contaminant mass at Site 24 can be attributed to biodegradation.
Simulation studies have shown that source decay is criti-cal to declining ground water concentrations downgradient of the source. For example, Newell et al. (2002) demon-strated that the maximum ground water concentrations in both near-source and downgradient locations within a plume were inversely proportional to the source decay rate. The source decay rate was also shown to be directly related to the k
point values. Site 24 is unique in that the tar source
was completely removed from the system, eliminating additional MAHs and PAHs from entering the ground water. It would be anticipated that complete source removal, sta-bilization, or containment should accelerate ground water recovery. Therefore, the effective design and implementa-tion of source control at Site 24 was a large component of the observed attenuation.
However, centerline wells at Transects C and D showed detectable concentrations of MAHs and PAHs after 14 years (Figure 3) and lower kpoint rates for toluene and naphthalene than the other transect locations (Table 3). These differences from the other areas of the plume were likely attributable to the lower permeability of the saturated zone near these transects. For example, the screened formations at these locations consisted of fine sand and silt materials, which were more fine-grained than other parts of the aquifer that consisted of fine to medium sands (Figure 1b). These results highlight the importance of adequately characterizing site hydrogeology before proposing MNA as a remedial alterna-tive and also delineate specific areas within the plume where an enhanced MNA approach may be required to achieve the necessary remedial objectives. Furthermore, these results emphasize the hydrogeologic and site setting of Site 24, which made it an ideal candidate for MNA. For example, the MGP tar was disposed into a sandy aquifer, which had a relatively shallow clay confining layer that prevented downward migration of the tar. In addition, there were no underground structures such as sewers, conduits, or other subsurface features that might typically be encountered on an MGP site and could provide preferential pathways for contaminant migration. Lastly, the depth to ground water at Site 24 ranged from 3 to 6 m, which provided aerobic condi-tions throughout most of the plume.
ConclusionsThe Site 24 study was the evaluation of a contaminated
ground water plume created by the disposal of MGP tar into a shallow sandy aquifer. The tar source was completely
Table 3 Point Estimates of Decay Rates (kpoint) of Attenuation of Toluene and Naphthalene in Plume Centerline Wells for
Transects A through F
Transect
Toluene Naphthalene
Rate Constant Half-Life Rate Constant Half-Life
(Mean Estimate) (Mean Estimate)
(per year) (years) (per year) (years)
A 0.20 3.5 0.39 1.8
B 0.36 1.9 0.50 1.4
C 0.12 6.0 0.16 4.3
D 0.01 99 0.15 4.6
E 0.33 2.1 0.49 1.4
F 0.42 1.6 0.41 1.7
Mean (A, B, E, F) 0.33 2.3 0.45 1.6
Std Dev. (A, B, E, F) 0.09 0.8 0.06 0.2
gwmr1244.indd 74gwmr1244.indd 74 7/25/09 6:37:57 PM7/25/09 6:37:57 PM
NGWA.org E.F. Neuhauser et al./ Ground Water Monitoring & Remediation 29, no. 3: 66–76 75
removed from the site at the initiation of a 14-year (5110-day) ground water MNA study.
The combined weight of evidence of decreased ground-water concentrations, shrinking areal extent of the plume, contaminant mass reduction, and point decay rates convinc-ingly demonstrates that MNA is a viable remedial strategy once the source area is controlled. In addition, this study demonstrates that source removal, stabilization, or contain-ment will accelerate ground water recovery. Despite the lower solubility and higher K
OW values of PAHs relative to
MAHs, ground water PAH concentrations can decrease sig-nificantly over time in the absence of human intervention, that is, naturally attenuate.
AcknowledgmentsThe authors acknowledge the financial support of the
EPRI for the initial 5 years of this study.
ReferencesAlvarez, P.J.J., and W.A. Illman. 2006. Bioremediation and Natural
Attenuation: Process Fundamentals and Mathematical Models, 609. Hoboken, New Jersey: John Wiley and Sons.
Bakermans, C., A.M. Hohnstock-Ashe, S. Padmanabhan, P. Padmanabhan, and E.L. Madsen. 2002. Geochemical and physiological evidence for mixed aerobic and anaerobic fi eld biodegradation of coal tar waste by subsurface microbial com-munities. Microbial Ecology 44, no. 2: 107–117.
Boggs, J.M., S.C. Young, and L.M. Beard. 1992. Field Study of dispersion in a homogeneous aquifer. I: Overview and site description. Water Resources Research 28, no. 12: 3281–3291.
Chunga, K.E., L.L. Anderson, and W.H. Wiser. 1979. New proce-dure for molecular-weight determination by vapour-phase os-mometry. Fuel 58, no. 12: 847–852.
EPRI (Electric Power Research Institute). 1996. Characterization and monitoring before and after source removal at a former manufactured gas plant (MGP) Disposal Site. EPRI TR-105921. Palo Alto, California: EPRI.
EPRI (Electric Power Research Institute). 1992. Estimating release of polycyclic aromatic hydrocarbons from coal tar at manufac-tured gas plant sites. EPRI TR-101060. Palo Alto, California: EPRI.
Fetter, C.W. 1999. Contaminant Hydrology, 2nd ed. Upper Saddle River, New Jersey: Prentice Hall.
Fowler, M.G., P.W. Brooks, M. Northcott, M.W.G. King, J.F. Bark-er, and L.R. Snowdon. 1994. Preliminary results from a fi eld experiment investigating the fate of some creosote components in a natural aquifer. Advances in Organic Geochemistry 22, no. 3–5: 64–649.
Harkins, S.M., R.S. Truesdale, R. Hill, P. Hoffman, and S. Winters. 1988. U.S. production of manufactured gases: Assessment of past disposal practices. EPA/600/2-88/012. Washington, D.C.: U.S. EPA.
Helsel, D.R., and R.M. Hirsch. 2002. Techniques of Water-Re-sources Investigations of the United States Geological Sur-vey, Book 4, Hydrologic Analysis and Interpretation, Chapter A3, Statistical methods in water resources. Reston, Virginia: USGS.
King, M.W.G., and J.F. Barker. 1999. Migration and natural fate of a coal tar ceosote plume. 1. Overview and plume development. Journal of Contaminant Hydrology 39: 249–279.
King, M.W.G., J.F. Barker, J.F. Devlin, and B.J. Butler. 1999. Mi-gration and natural fate of a coal tar creosote plume. 2. Mass balance and biodegradation indicators. Journal of Contaminant Hydrology 39: 281–307.
Landmeyer, J.E., F.H. Chapelle, M.D. Petkewich, and P.M. Brad-ley. 1998. Assessment of natural attenuation of aromatic hydrocarbons in groundwater near a former manufactured-gas plant, South Carolina, USA. Environmental Geology 34, no. 4: 279–292.
Lee, L.S., P.S.C. Rao, and I. Okuda. 1992. Equilibrium partitioning of polycyclic aromatic hydrocarbons from coal tar into water. Environmental Science and Technology 26: 2110–2115.
Mackay, D., W.Y. Shiu, K.C. Ma, and S.C. Lee. 2006. Physical-Chemical Properties and Environmental Fate for Organic Chemicals. Volume I: Introduction and Hydrocarbons. Boca Raton, Florida: CRC Press.
Mackay, M.D., and J.A. Cherry. 1989. Groundwater contamina-tion: pump-and-treat remediation. Environmental Science and Technology 23, no. 6: 630–636.
Madsen, E.L., J.L. Sinclair, and W.C. Ghiorse. 1991. In situ bio-degradation: Microbiological patterns in a contaminated aqui-fer. Science 252, no. 5007: 830–833.
Newell, C.J., H.S. Rifai, J.T. Wilson, J.A. Connor, J.A. Aziz, and M.P. Suarez. 2002. Calculations and use of fi rst-order rate con-stants for monitored natural attenuation studies. EPA/540/S-02/500. Washington, D.C.: U.S. EPA.
NRC. 2000. Natural Attenuation for Groundwater Remediation. Washington, D.C.: National Academic Press, National Re-search Council.
NRC. 1993. In Situ Bioremediation: When Does It Work? Washington, D.C.: National Academy Press, National Research Council.
Ong, S.K., B.H. Kjartanson, G.A. Stenback, J. Golchin, S.W. Rog-ers, and N. Miller. 2001. Assessment of natural attenuation at a former manufactured gas plant site. In Proceedings, 6th Inter-national In Situ and on Site Bioremediation Conference, San Diego, California.
Rhodes, W. 1984. Survey of tar waste disposal and locations of town gas producers. EPA/68/02/3137. Washington, D.C.: U.S. Environmental Protection Agency.
Ripp, J.A. 2007. EPRI MGP 2007 Symposium: Advances and In-novation in MGP Site Remediation, Atlanta, Georgia.
Shiu, W.Y., A. Maijanen, A.L.Y. Ng, and D. Mackay. 1988. Prepa-ration of aqueous solutions of sparingly soluble organic sub-stances. II. Multicomponent systems – hydrocarbon mixtures and petroleum products. Environmental Toxicology and Chem-istry 7: 125–137.
U.S. EPA. 2007. Estimation Programs Interface Suite™ for Micro-soft® Windows, v 3.20. Washington, D.C.: U.S. Environmental Protection Agency. http://www.epa.gov/oppt/exposure/pubs/episuite.htm.
U.S. EPA. 1999. Use of Monitored Natural Attenuation at Super-fund, RCRA Corrective Action, and Underground Storage Tank Sites: Washington, D.C.: U.S. Environmental Protection Agen-cy, Offi ce of Solid Waste and Emergency Response (OSWER).
U.S. EPA. 1998. Technical Protocol for Evaluating Natural Attenu-ation of Chlorinated Solvents in Groundwater, EPA/600/R/128. Washington, D.C.: U.S. Environmental Protection Agency.
U.S. EPA. 1993. Guidance for Evaluating the Technical Impracti-cability of Groundwater Restoration, Interim Final. Washington, D.C.: U.S. Environmental Protection Agency, Offi ce of Solid Waste and Emergency Response.
Wiedenmeir, T.H., H.S. Rifai, C.J. Newell, and J.T. Wilson. 1999. Natural Attenuation of Fuel Hydrocarbons and Chlorinated Solvents in the Subsurface. New York: John Wiley and Sons.
gwmr1244.indd 75gwmr1244.indd 75 7/25/09 6:37:57 PM7/25/09 6:37:57 PM

76 E.F. Neuhauser et al./ Ground Water Monitoring & Remediation 29, no. 3: 66–76 NGWA.org
Biological SketchesE.F. Neuhauser is at National Grid, 300 Erie Blvd. W., Syra-
cuse, NY 13202. J.A. Ripp is at GEI Consultants Inc., 455 Winding Brook
Drive, Glastonbury, CT 06033.N.A. Azzolina, corresponding author, is at Foth Infrastructure
and Environment, LLC, 2737 S. Ridge Road, Green Bay, WI 54307-2326; (920) 496-6783; (920) 497-8516; [email protected].
E.L. Madsen is at Department of Microbiology, B57A Wing Hall, Cornell University, Ithaca, NY 14850.
D.M. Mauro is at META Environmental Inc., 49 Clarendon Street, Watertown, MA 02472.
T. Taylor is at GEI Consultants Inc., 455 Winding Brook Drive, Glastonbury, CT 06033.
gwmr1244.indd 76gwmr1244.indd 76 7/25/09 6:37:58 PM7/25/09 6:37:58 PM