Molecular recognition imaging using tuning fork-based transverse dynamic force microscopy
7
Molecular recognition imaging using tuning fork-based transverse dynamic force microscopy Manuel Hofer a , Stefan Adamsmaier a , Thomas S. van Zanten b , Lilia A. Chtcheglova a , Carlo Manzo b , Memed Duman a , Barbara Mayer e , Andreas Ebner a,e , Manuel Moertelmaier d , Gerald Kada d , Maria F. Garcia-Parajo b,c , Peter Hinterdorfer a,e,n , Ferry Kienberger d a University of Linz, Institute for Biophysics, Altenbergerstr. 69, 4040 Linz, Austria b IBEC-Institute for Bioengineering of Catalonia and CIBER-Bbn, Baldiri i Reixac 15-21, Barcelona 08028, Spain c ICREA-Institucio ´ Catalana de Recerca i Estudis Avanc - ats, 08010 Barcelona, Spain d Agilent Technologies Austria GmbH, Aubrunnerweg 11, 4040 Linz, Austria e Christian Doppler Laboratory for Nanoscopic Methods in Biophysics, Institute for Biophysics, University of Linz, Altenbergerstr. 69, 4040 Linz, Austria article info Keywords: Tuning fork Atomic force microscopy Shear-force microscopy Molecular recognition Avidin–biotin abstract We demonstrate simultaneous transverse dynamic force microscopy and molecular recognition imaging using tuning forks as piezoelectric sensors. Tapered aluminum-coated glass fibers were chemically functionalized with biotin and anti-lysozyme molecules and attached to one of the prongs of a 32 kHz tuning fork. The lateral oscillation amplitude of the tuning fork was used as feedback signal for topographical imaging of avidin aggregates and lysozyme molecules on mica substrate. The phase difference between the excitation and detection signals of the tuning fork provided molecular recognition between avidin/biotin or lysozyme/anti-lysozyme. Aggregates of avidin and lysozyme molecules appeared as features with heights of 1–4 nm in the topographic images, consistent with single molecule atomic force microscopy imaging. Recognition events between avidin/biotin or lysozyme/anti-lysozyme were detected in the phase image at high signal-to-noise ratio with phase shifts of 1–21. Because tapered glass fibers and shear-force microscopy based on tuning forks are commonly used for near-field scanning optical microscopy (NSOM), these results open the door to the exciting possibility of combining optical, topographic and biochemical recognition at the nanometer scale in a single measurement and in liquid conditions. & 2010 Elsevier B.V. All rights reserved. 1. Introduction The distribution of molecules on the cell membrane and the membrane morphology provide important insights into cell physiology. Optical microscopy techniques are frequently used to detect molecular organization and investigate structure– function relationships in biological samples. However, in optical microscopy the lateral and axial resolution is typically limited by the diffraction limit of light [1], i.e., typically 300 nm in the lateral direction and 800 nm in the axial direction. The achievement of higher resolution requires the use of other techniques such as atomic force microscopy (AFM) [2,3], near-field scanning optical microscopy (NSOM) [4,5] or Forster resonance energy transfer (FRET) [6]. Among these, NSOM is the only technique that allows simultaneous topographical and high-resolution fluorescence imaging with a lateral resolution of less than 90 nm [7]. This enhanced resolution is essentially given by the size of the sub- wavelength aperture probe used and its distance away from the sample surface. In a typical NSOM experiment, the probe is raster scanned in close proximity to the sample surface. For this reason, tip–sample distance regulation is crucial and non-contact mode scanning is achieved using a feedback system based on shear force detection [8]. Shear force detection or transverse dynamic force microscopy (TDFM) is typically obtained by laterally oscillating the tip with respect to the sample surface. The latter is realized by using tuning forks as piezoelectric sensing elements. Indeed, they are used for detecting small changes in either the amplitude of the oscillating tip, or in the phase difference between the driving and the detected signals [9]. A feedback system on either the amplitude signal or the phase [10] is then used to keep the non-contact mode conditions providing a map of surface topography. Tuning fork-based imaging of biological samples in liquid [11–13] has been successfully used to obtain nanoscale topographic resolution [14], with molecular recognition ARTICLE IN PRESS Contents lists available at ScienceDirect journal homepage: www.elsevier.com/locate/ultramic Ultramicroscopy 0304-3991/$ - see front matter & 2010 Elsevier B.V. All rights reserved. doi:10.1016/j.ultramic.2010.02.019 n Corresponding author at: Christian Doppler Laboratory for Nanoscopic Methods in Biophysics, Institute for Biophysics, University of Linz, Altenbergerstr. 69, 4040 Linz, Austria. Tel.: + 43 732 2468 9265; fax: + 43 732 2468 9270. E-mail address: [email protected] (P. Hinterdorfer). Ultramicroscopy 110 (2010) 605–611
Transcript of Molecular recognition imaging using tuning fork-based transverse dynamic force microscopy
ARTICLE IN PRESS
Ultramicroscopy 110 (2010) 605–611
Contents lists available at ScienceDirect
Ultramicroscopy
0304-39
doi:10.1
n Corr
Method
69, 404
E-m
journal homepage: www.elsevier.com/locate/ultramic
Molecular recognition imaging using tuning fork-based transverse dynamicforce microscopy
Manuel Hofer a, Stefan Adamsmaier a, Thomas S. van Zanten b, Lilia A. Chtcheglova a, Carlo Manzo b,Memed Duman a, Barbara Mayer e, Andreas Ebner a,e, Manuel Moertelmaier d, Gerald Kada d,Maria F. Garcia-Parajo b,c, Peter Hinterdorfer a,e,n, Ferry Kienberger d
a University of Linz, Institute for Biophysics, Altenbergerstr. 69, 4040 Linz, Austriab IBEC-Institute for Bioengineering of Catalonia and CIBER-Bbn, Baldiri i Reixac 15-21, Barcelona 08028, Spainc ICREA-Institucio Catalana de Recerca i Estudis Avanc-ats, 08010 Barcelona, Spaind Agilent Technologies Austria GmbH, Aubrunnerweg 11, 4040 Linz, Austriae Christian Doppler Laboratory for Nanoscopic Methods in Biophysics, Institute for Biophysics, University of Linz, Altenbergerstr. 69, 4040 Linz, Austria
a r t i c l e i n f o
Keywords:
Tuning fork
Atomic force microscopy
Shear-force microscopy
Molecular recognition
Avidin–biotin
91/$ - see front matter & 2010 Elsevier B.V. A
016/j.ultramic.2010.02.019
esponding author at: Christian Doppler
s in Biophysics, Institute for Biophysics, Univ
0 Linz, Austria. Tel.: +43 732 2468 9265; fax:
ail address: [email protected] (P. Hint
a b s t r a c t
We demonstrate simultaneous transverse dynamic force microscopy and molecular recognition
imaging using tuning forks as piezoelectric sensors. Tapered aluminum-coated glass fibers were
chemically functionalized with biotin and anti-lysozyme molecules and attached to one of the prongs of
a 32 kHz tuning fork. The lateral oscillation amplitude of the tuning fork was used as feedback signal for
topographical imaging of avidin aggregates and lysozyme molecules on mica substrate. The phase
difference between the excitation and detection signals of the tuning fork provided molecular
recognition between avidin/biotin or lysozyme/anti-lysozyme. Aggregates of avidin and lysozyme
molecules appeared as features with heights of 1–4 nm in the topographic images, consistent with
single molecule atomic force microscopy imaging. Recognition events between avidin/biotin or
lysozyme/anti-lysozyme were detected in the phase image at high signal-to-noise ratio with phase
shifts of 1–21. Because tapered glass fibers and shear-force microscopy based on tuning forks are
commonly used for near-field scanning optical microscopy (NSOM), these results open the door to the
exciting possibility of combining optical, topographic and biochemical recognition at the nanometer
scale in a single measurement and in liquid conditions.
& 2010 Elsevier B.V. All rights reserved.
1. Introduction
The distribution of molecules on the cell membrane and themembrane morphology provide important insights into cellphysiology. Optical microscopy techniques are frequently usedto detect molecular organization and investigate structure–function relationships in biological samples. However, in opticalmicroscopy the lateral and axial resolution is typically limited bythe diffraction limit of light [1], i.e., typically 300 nm in the lateraldirection and 800 nm in the axial direction. The achievement ofhigher resolution requires the use of other techniques such asatomic force microscopy (AFM) [2,3], near-field scanning opticalmicroscopy (NSOM) [4,5] or Forster resonance energy transfer(FRET) [6]. Among these, NSOM is the only technique that allowssimultaneous topographical and high-resolution fluorescence
ll rights reserved.
Laboratory for Nanoscopic
ersity of Linz, Altenbergerstr.
+43 732 2468 9270.
erdorfer).
imaging with a lateral resolution of less than 90 nm [7]. Thisenhanced resolution is essentially given by the size of the sub-wavelength aperture probe used and its distance away from thesample surface.
In a typical NSOM experiment, the probe is raster scanned inclose proximity to the sample surface. For this reason, tip–sampledistance regulation is crucial and non-contact mode scanning isachieved using a feedback system based on shear force detection[8]. Shear force detection or transverse dynamic force microscopy(TDFM) is typically obtained by laterally oscillating the tip withrespect to the sample surface. The latter is realized by usingtuning forks as piezoelectric sensing elements. Indeed, they areused for detecting small changes in either the amplitude of theoscillating tip, or in the phase difference between the driving andthe detected signals [9]. A feedback system on either theamplitude signal or the phase [10] is then used to keep thenon-contact mode conditions providing a map of surfacetopography. Tuning fork-based imaging of biological samples inliquid [11–13] has been successfully used to obtain nanoscaletopographic resolution [14], with molecular recognition
ARTICLE IN PRESS
M. Hofer et al. / Ultramicroscopy 110 (2010) 605–611606
specificity being achieved by the use of fluorescence markers, andconsequently fluorescence detection [15,16].
Complementary to fluorescence labeling, a powerful way toobtain label-free specificity in scanning probe techniques hasbeen recently demonstrated for AFM [17]. Indeed, it has beenshown that AFM can simultaneously sense topography andrecognize receptor binding sites on cell surfaces underphysiological conditions [18] by attaching a ligand for a particularreceptor to the AFM tip. In this way, the AFM tip becomes achemically selective nanosensor for the detection of specificreceptor sites on the cell membrane. The operating principle ofsimultaneous topography and recognition imaging (TREC) isbased on a dynamic AFM scanning mode in which the tip isvertically oscillated close to its resonance frequency usingmagnetically driven cantilevers (MAC mode). Topographicalfeatures reduce the downswing of the sinusoidal oscillation whilerecognition events reduce the upswing of the oscillation. Byseparating the signals coming from the upper part and the lowerpart, two independent maps of topography and recognition aregenerated. Recognition events reduce the oscillation amplitudeand therefore result in dark spots in the recognition image [19].
In this paper, we demonstrate that molecular recognition canbe successfully obtained with transverse dynamic forcemicroscopy (TDFM) in liquid condition. We first perform thoroughcalibration and validation of tuning fork-based TDFM usingaluminum-coated fibers for topographical imaging. Then, weillustrate the simultaneous capability of tuning fork-basedmolecular recognition imaging on two different molecules byfunctionalizing NSOM probes with their specific ligands.
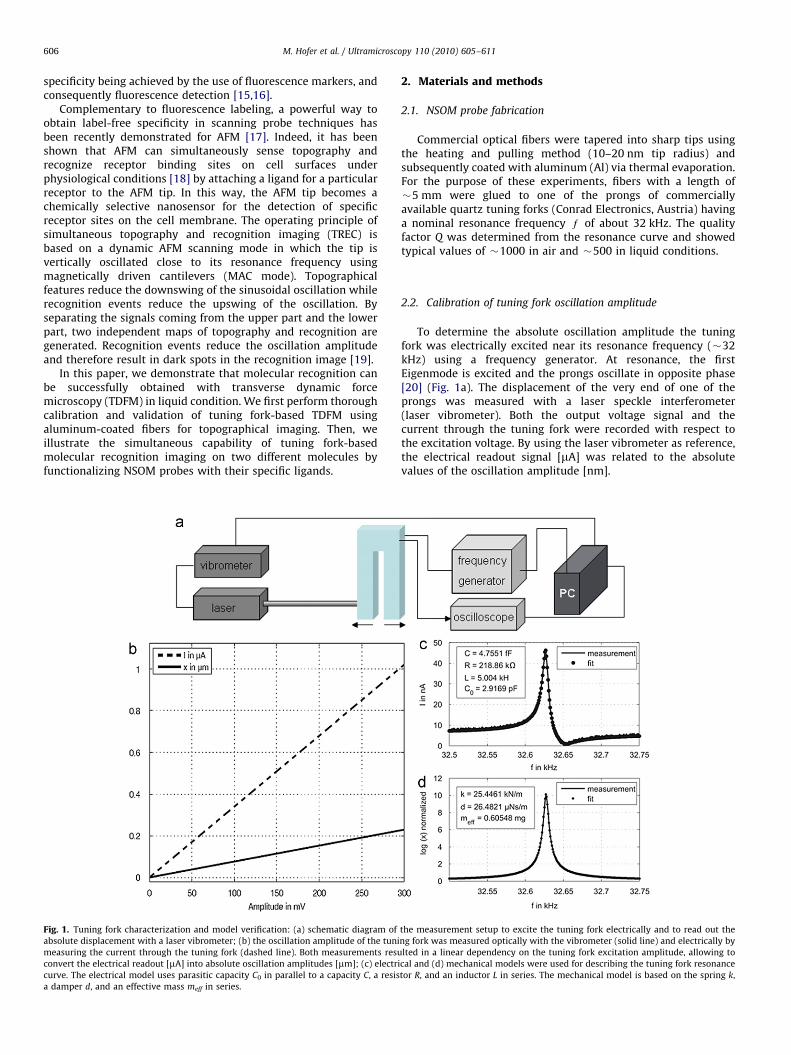
Fig. 1. Tuning fork characterization and model verification: (a) schematic diagram of
absolute displacement with a laser vibrometer; (b) the oscillation amplitude of the tuni
measuring the current through the tuning fork (dashed line). Both measurements resu
convert the electrical readout [mA] into absolute oscillation amplitudes [mm]; (c) electri
curve. The electrical model uses parasitic capacity C0 in parallel to a capacity C, a resis
a damper d, and an effective mass meff in series.
2. Materials and methods
2.1. NSOM probe fabrication
Commercial optical fibers were tapered into sharp tips usingthe heating and pulling method (10–20 nm tip radius) andsubsequently coated with aluminum (Al) via thermal evaporation.For the purpose of these experiments, fibers with a length of�5 mm were glued to one of the prongs of commerciallyavailable quartz tuning forks (Conrad Electronics, Austria) havinga nominal resonance frequency e of about 32 kHz. The qualityfactor Q was determined from the resonance curve and showedtypical values of �1000 in air and �500 in liquid conditions.
2.2. Calibration of tuning fork oscillation amplitude
To determine the absolute oscillation amplitude the tuningfork was electrically excited near its resonance frequency (�32kHz) using a frequency generator. At resonance, the firstEigenmode is excited and the prongs oscillate in opposite phase[20] (Fig. 1a). The displacement of the very end of one of theprongs was measured with a laser speckle interferometer(laser vibrometer). Both the output voltage signal and thecurrent through the tuning fork were recorded with respect tothe excitation voltage. By using the laser vibrometer as reference,the electrical readout signal [mA] was related to the absolutevalues of the oscillation amplitude [nm].
the measurement setup to excite the tuning fork electrically and to read out the
ng fork was measured optically with the vibrometer (solid line) and electrically by
lted in a linear dependency on the tuning fork excitation amplitude, allowing to
cal and (d) mechanical models were used for describing the tuning fork resonance
tor R, and an inductor L in series. The mechanical model is based on the spring k,
ARTICLE IN PRESS
M. Hofer et al. / Ultramicroscopy 110 (2010) 605–611 607
2.3. Mechanical and electrical model for the tuning fork oscillation
Mechanical model: As a first approximation, the two prongs canbe modeled as decoupled and damped spring-mass-oscillators,composed by a damper, a spring, and a mass in series. The 2ndorder differential equation of this system is
meffd2x
dt2þd
dx
dtþkx¼ F ð1Þ
with the effective mass meff of one prong modeled as a point mass,the damping factor d, the spring constant k, and the excitationforce F, which in this case corresponds to the appliedvoltage u [21].
Electrical model: In general, piezoelectric oscillators can also bemodeled as an electrical equivalent circuit [20] with a capacitorC0, accounting for the parasitic capacitance of the cables andelectrodes, in parallel to an RLC-oscillator, composed by aninductor L, a resistor R, and a capacitance C in series. This is theso-called Butterworth–Van Dyke circuit. The 2nd order differen-tial equation for the electric charge q¼
Ridt and the applied
voltage u is
LC0d2u
dt2þRC0
du
dtþ 1þ
C0
C
� �u¼ L
d2q
dt2þR
dq
dtþ
1
Cq ð2Þ
2.4. Transverse dynamic force microscopy imaging
TDFM imaging based on tuning forks was performed on anAgilent 5500 AFM platform (Agilent Technologies, AZ, USA) with ahomebuilt prototype of a transverse tuning fork nose cone. A MACIII box (Agilent Technologies) was used to drive the tuning forkwith the desired set frequency and to simultaneously detect theamplitude changes by means of integrated lock-in amplifiers.Since the tuning fork oscillation amplitude was used as a feedbacksignal for the topographical imaging, the phase differencebetween the excitation signal and the actual oscillation signalfrom the tuning fork was used to monitor molecular recognitionevents. All images were recorded with a large-scan size scanner(100 mm�100 mm) in PBS buffer at room temperature. Theamplitude set-point, integral and proportional feedback gainswere adjusted to optimize imaging conditions. Before startingtopographical imaging, the resonance curve and Q factor of the tipwere measured and the probe was then approached to the samplesurface. After reaching the sample surface, amplitude–distancecycles were acquired and the imaging amplitude (�1 nm) waschosen by adjusting the imaging set-point (PicoView1.6 software;Agilent Technologies).
2.4.1. Amino-functionalization of Al-coated fibers
Aluminum-coated glass fibers were functionalized either withbiotin or anti-lysozyme antibody-HyHEL5. The first step of thefunctionalization was the formation of amino groups on Al-coatedfibers by aminopropyl-triethoxysilane (APTES) gas phasesilanization or ethanolamine esterification methods [22]. ForAPTES functionalization, the fibers were first washed thoroughlywith chloroform, ethanol, and water. Two small plastic trays wereplaced inside argon gas flooded desiccators (5 l). 30 ml APTES and10 ml triethylamine were separately pipetted into two trays, thefibers were placed nearby on a clean inert surface (e.g. Teflon),and the desiccator was closed. Trays were removed 2 h later andthe desiccator filled again with argon gas. The fibers were keptinside for 2 days to cure the APTES coating. For the generation ofamino groups using ethanolamine, 3.3 g ethanolamine hydro-chloride was dissolved in 6.6 ml DMSO by gentle heating to�70 1C and subsequently, 10% (v/v) of molecular sieves (4 A)
were added. The solution was allowed to cool to roomtemperature. Dissolved air was removed by degassing in adesiccator at aspirator vacuum for 30 min. The fibers wereincubated in this solution overnight, washed in DMSO (3� ) andethanol (3� ), and dried with a gentle gas stream of nitrogen.Unused amino-functionalized fibers were stored in a desiccatorunder argon atmosphere to avoid oxidation. All surface aminogroup counting assay were done as described elsewhere [23,24].
2.4.2. Coupling of biotin-PEG-NHS to the fibers
Amino-functionalized fibers were attached to the tuning forksand biotin-PEG-NHS coupled onto them. For this, 1 mgbiotin-PEG-NHS was dissolved in 1 ml chloroform and 10 mltriethylamine. Amino-functionalized fibers were immersed in thissolution for 2 h while the tuning fork prongs were kept in air.Afterwards, the fibers were washed three times with chloroformand dried with a gentle flow of nitrogen.
2.4.3. Coupling of anti-lysozyme antibody-HyHEL5 to fibers
Attachment of aldehyde-PEG-NHS to the amino-functionalizedfibers was performed by incubating the fibers for 2 h in 0.5 ml ofchloroform containing 3.3 mg of aldehyde-PEG-NHS and 30 ml oftriethylamine [23,25] while the tuning fork prongs were kept inair. Fibers were rinsed with chloroform and dried with nitrogen.Subsequently, they were incubated with 100 ml anti-lysozymeantibody-HyHEL5 (0.15 mg/ml) and 2 ml of NaCNBH3 (freshlyprepared by dissolving 32 mg of NaCNBH3 in 50 ml of 100 mMNaOH in 450 ml MQ water) for 1 h. Once the ligand coupling stepswere completed, 5 ml of 1 M ethanolamine hydrochloride wasadded to the solution in order to inactivate the remainingaldehyde groups. After 10 min reaction time the fibers werefinally washed with PBS buffer (three times for 5 min) and storedin PBS buffer at 4 1C.
2.5. Immobilization of avidin and lysozyme molecules onto a mica
surface
For recognition imaging of avidin molecules, a freshly cleavedmica surface was incubated with 1 mg/ml avidin solution (indiluted PBS buffer with 15 mM NaCl; ‘‘1/10 PBS’’) for 20–30 min.Electrostatic adsorption of positively charged avidin molecules onthe negatively charged mica surface resulted in a uniform andtight immobilization [26]. To remove unbound avidin molecules,the mica surface was extensively washed with 1/10 PBS. Forrecognition imaging of lysozyme molecules, 0.1 mg/ml lysozymemolecules in 1 mM NaCl was incubated onto the freshly cleavedmica surface for 10 min. Subsequently, the sample was washed 50times with the NaCl solution and PBS buffer to remove unboundlysozyme molecules [27].
3. Results and discussion
For calibration of the absolute oscillation amplitude the tuningfork was driven by electrical excitation with a frequencygenerator near the resonance frequency at 32 kHz. The displace-ment of the very end of the prong of the tuning fork wasmeasured at different values of excitation amplitudes with a laserspeckle interferometer and via the current through the tuningfork (Fig. 1a). Both readout methods resulted in a lineardependence on the excitation amplitude (Fig. 1b). By using thelaser interferometer as reference we converted the electricalreadout signals [mA] into absolute oscillation amplitudes [mm],allowing to calibrate the tuning fork oscillation amplitude. Anelectrical model (Section 2) was established to depict the tuning
ARTICLE IN PRESS
M. Hofer et al. / Ultramicroscopy 110 (2010) 605–611608
fork resonance curve, taken into consideration capacitance,resistance, and inductance parameters (Fig. 1c). Similarly, amechanical model was used for describing the tuning forkresonance curve in terms of spring constant and effective massof the resonator (Fig. 1d). The two models properly described theresonance curve with fit parameters (e.g. spring constant k¼25kN/m; Fig. 1d) in accordance to published values [20].
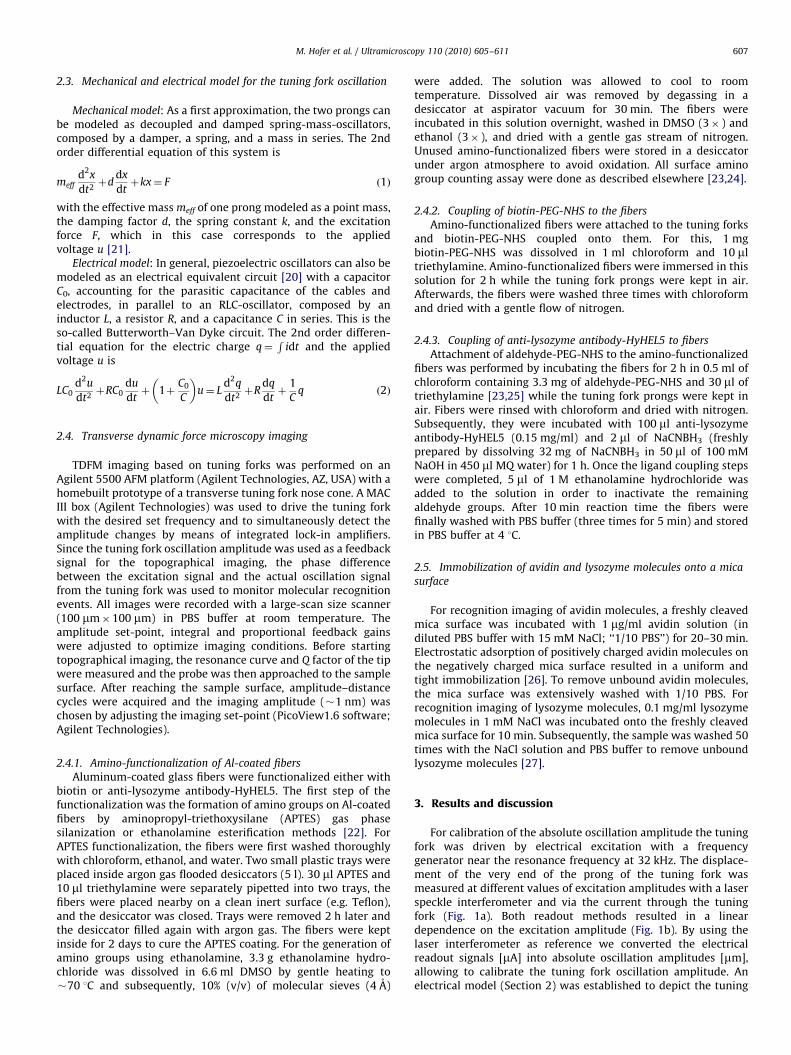
For TDFM imaging, both excitation and readout of the tuningfork signals were carried out electrically, with proper pre-amplification of the readout signal using a home-designedelectronic board with optimized resistance and capacitancecomponents. Such an electrical readout of the tuning forkamplitude allowed to measure oscillation amplitudes down to0.3 nm with high signal-to-noise ratio of S/N�10. (Fig. 2a, redcurve), as verified with the laser speckle interferometer (Fig. 2a,green curve). The pre-amplification board was inserted into thenose cone and, to allow for high-resolution topographicalimaging, an Al-coated fiber with 10–20 nm tip diameter wasattached to one of the two prongs of the tuning fork. Imagingcapabilities were tested on red blood cells (RBCs). For this, theresonance curve of the tuning fork and the attached fiber wasmeasured in buffer conditions, with only part of the fiberimmersed into the liquid (Fig. 2b). Typically, we obtainedquality factors Q of 200–500 in liquid with an overall resonancefrequency slightly below 32 kHz. After recording the resonanceresponse, the fiber was automatically approached to the samplesurface and amplitude–distance cycles were acquired (Fig. 2c). Inthe approach curve, the lateral oscillation amplitude dropssignificantly when the tip contacts the surface. From theamplitude–distance cycles the overall amplitude of oscillationwas estimated and the set-point for optimal imaging conditions
Fig. 2. Imaging conditions for transverse dynamic force microscopy imaging: (a) reson
measured electrically (green) and with the laser vibrometer (red); the blue line repres
attached to a tuning fork in liquid conditions; (c) amplitude–distance cycle of an Al-coat
in red and retraction curve in blue. The dashed line corresponds to the set-point adjustm
scanned with an Al-coated glass fiber attached to a tuning fork. (For interpretation of the
of this article.)
adjusted (Fig. 2c, dashed line); typical imaging amplitudes rangedfrom 0.5 to 1.5 nm. Fig. 2d shows a transverse dynamic forcemicroscopy image of red blood cells immobilized onto a glassslide. The donut shaped structure of red blood cells can be seen intopographical image with diameter of 7–8 mm. The dimensions ofRBCs from TDFM measurements are comparable with thepublished data on RBCs, measured by interference microscopy[28].
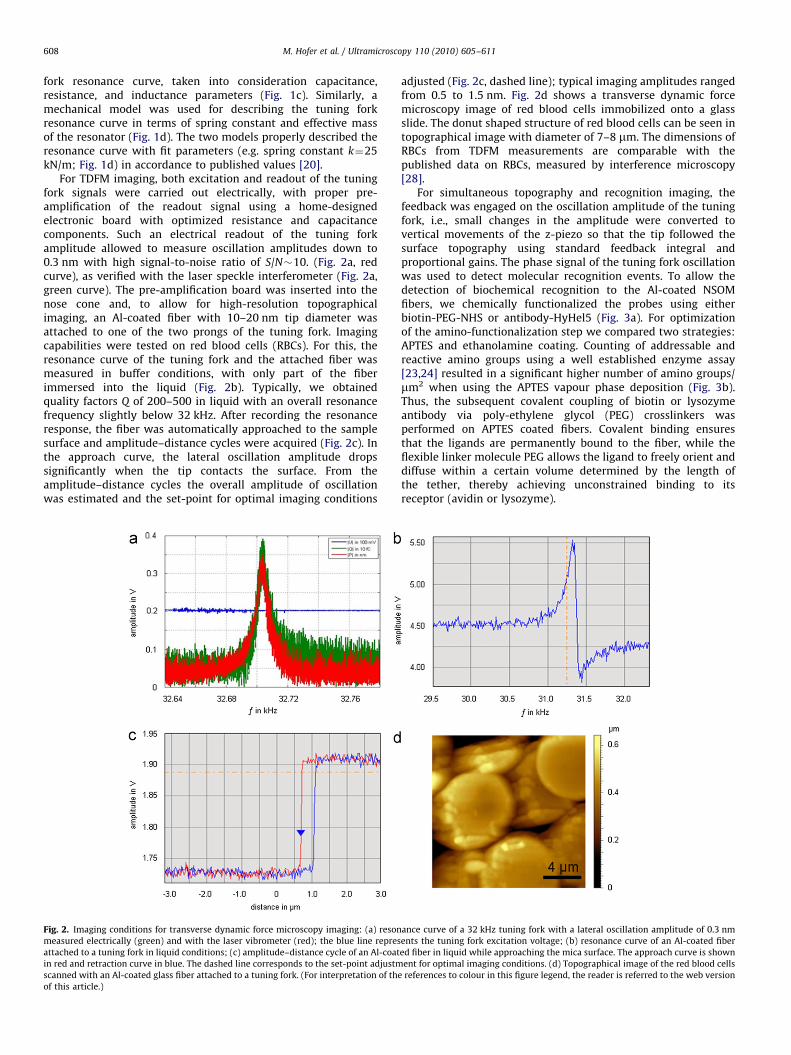
For simultaneous topography and recognition imaging, thefeedback was engaged on the oscillation amplitude of the tuningfork, i.e., small changes in the amplitude were converted tovertical movements of the z-piezo so that the tip followed thesurface topography using standard feedback integral andproportional gains. The phase signal of the tuning fork oscillationwas used to detect molecular recognition events. To allow thedetection of biochemical recognition to the Al-coated NSOMfibers, we chemically functionalized the probes using eitherbiotin-PEG-NHS or antibody-HyHel5 (Fig. 3a). For optimizationof the amino-functionalization step we compared two strategies:APTES and ethanolamine coating. Counting of addressable andreactive amino groups using a well established enzyme assay[23,24] resulted in a significant higher number of amino groups/mm2 when using the APTES vapour phase deposition (Fig. 3b).Thus, the subsequent covalent coupling of biotin or lysozymeantibody via poly-ethylene glycol (PEG) crosslinkers wasperformed on APTES coated fibers. Covalent binding ensuresthat the ligands are permanently bound to the fiber, while theflexible linker molecule PEG allows the ligand to freely orient anddiffuse within a certain volume determined by the length ofthe tether, thereby achieving unconstrained binding to itsreceptor (avidin or lysozyme).
ance curve of a 32 kHz tuning fork with a lateral oscillation amplitude of 0.3 nm
ents the tuning fork excitation voltage; (b) resonance curve of an Al-coated fiber
ed fiber in liquid while approaching the mica surface. The approach curve is shown
ent for optimal imaging conditions. (d) Topographical image of the red blood cells
references to colour in this figure legend, the reader is referred to the web version
ARTICLE IN PRESS
Fig. 3. Chemical functionalization of aluminum-coated glass fibers: (a) schematic representation of Al-coated fiber functionalization with biotin-PEG-NHS (left) and
antibody-HyHel5 (right) for avidin and lysozyme recognition, respectively; (b) comparison of APTES and ethanolamine amino-functionalization. The number of the
resulting reactive and addressable amino groups after amino-functionalization was determined using an enzyme surface assay. APTES resulted in a higher amino-group
density (3547101 amino groups/mm2) than ethanolamine (164720 amino groups/mm2). In addition, the specificity proof experiment showed no unspecific interaction
(1377 and 59717, respectively).
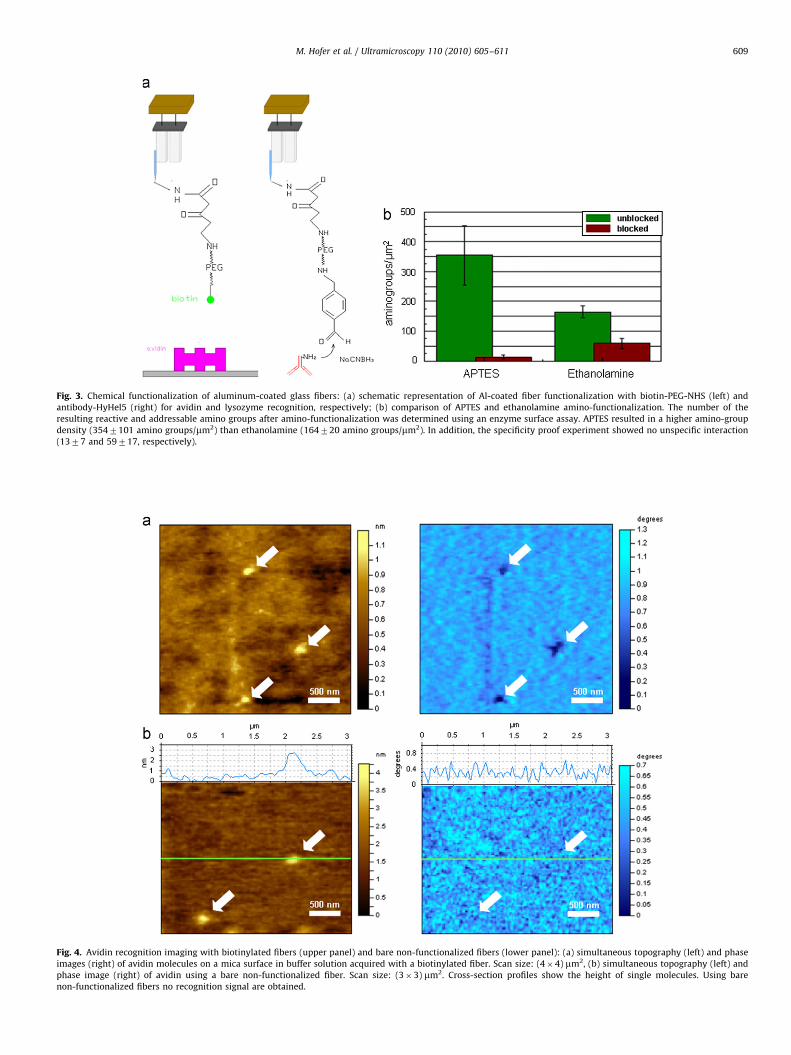
Fig. 4. Avidin recognition imaging with biotinylated fibers (upper panel) and bare non-functionalized fibers (lower panel): (a) simultaneous topography (left) and phase
images (right) of avidin molecules on a mica surface in buffer solution acquired with a biotinylated fiber. Scan size: (4�4) mm2, (b) simultaneous topography (left) and
phase image (right) of avidin using a bare non-functionalized fiber. Scan size: (3�3) mm2. Cross-section profiles show the height of single molecules. Using bare
non-functionalized fibers no recognition signal are obtained.
M. Hofer et al. / Ultramicroscopy 110 (2010) 605–611 609

ARTICLE IN PRESS
M. Hofer et al. / Ultramicroscopy 110 (2010) 605–611610
Fig. 4a illustrates simultaneously acquired topographical andphase images of avidin aggregates on a mica substrate in buffersolution, acquired with biotin functionalized fibers in TDFMmode. During imaging, the set-point was continuously adjusted tominimize the influence of the fiber on the avidin sample.Aggregates of avidin molecules appeared as features withheights of 1–3 nm and apparent diameters of �200 nm, thelatter significantly influenced by the scanning tip convolution. Inthe phase images, however, recognition signals could be observedat high signal-to-noise ratio with phase shifts of 1–21 (Fig. 4a,arrows). Recognition signals were only detected at the placeswhere avidin aggregates were observed in the correspondingtopography image. Furthermore, recognition signals could only beobserved when biotinylated fibers were used. Indeed, whenimaging the same sample with bare non-functionalized fibers(Fig. 4b, arrows), the topography image shows again aggregates ofavidin molecules, whereas the phase image lacks any recognitioncontrast. This demonstrates that the recognition signals in thephase image are indeed due to specific avidin–biotin interactions.Similarly, Fig. 5a shows simultaneously acquired topographicalimages and phase images of lysozyme molecules on a micasubstrate in buffer solution, acquired with anti-lysozymefunctionalized fibers in TDFM mode. The lysozyme moleculesare 1–4 nm in height, with the recognition signal clearly presentin the phase image with high signal-to-noise ratio (Fig. 5a,arrows). Recognition signals were not observed when bare non-functionalized fibers were used for imaging the same sample(Fig. 5b, arrows).
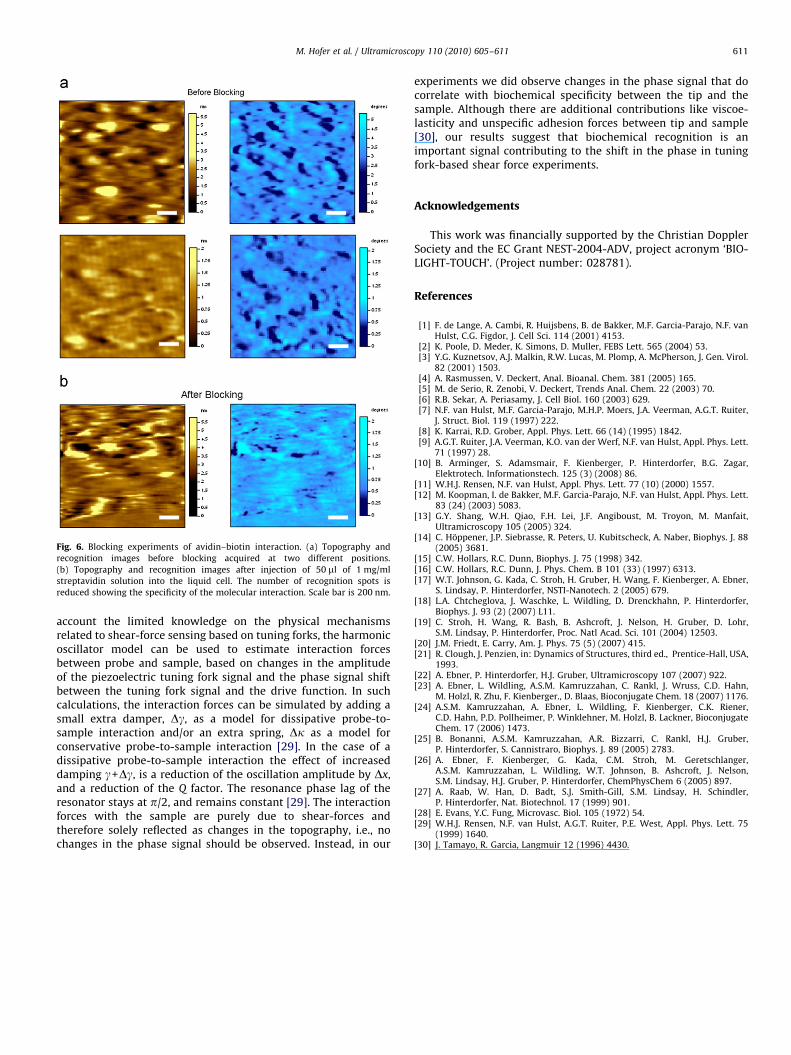
In Fig. 6, additional blocking experiments were done to furtherinvestigate the contrast mechanism in the phase images. Besidesusing bare non-functionalized fibers to demonstrate specificity,
Fig. 5. Lysozyme recognition imaging with lysozyme antibody functionalized fibers (
topography (left) and phase images (right) of individual lysozyme molecules on a mica
Scan size: (3�3) mm2, (b) simultaneous topography (left) and phase image (right) of
(2�2) mm2. Cross-section profiles show the height of single molecules. No recognition
we also blocked the biotin on the tuning fork glass fiber byinjecting free streptavidin molecules into the liquid cell. Fig. 6shows topography and recognition images of avidin on micabefore (Fig. 6a) and after injection of free streptavidin molecules(Fig. 6b). The addition of streptavidin molecules blocked thebiotin molecules on the tuning fork glass fiber and resulted in areduction of the number of recognition spots in the phase image.This further corroborates that the recognition signals in the phaseimage are indeed due to molecular avidin–biotin interaction.However, as observed from the phase images after blocking,several dark spots in the phase image remained (Fig. 6b). Wecontribute those additional signals in the phase image to visco-elastic effects and non-specific tip–surface interactions. However,more studies are necessary to further investigate the individualcontributions to the phase imaging contrast.
4. Conclusions
We have successfully combined tuning fork-based transversedynamic force microscopy (TDFM) imaging and molecularrecognition detection. The phase signal of the tuning forkoscillation was used to detect single molecular recognition events,while changes in the lateral amplitude were used as feedbackparameter for topographical imaging. The combination of tuningfork imaging and molecular recognition detection opens thepossibility to apply this method to NSOM imaging. In this waytopography, molecular recognition, and increased opticalresolution could potentially be recorded simultaneously in asingle scan, thus providing more insights to the nanoscaleorganization of biological membranes and cells. Taking into
upper panel) and bare non-functionalized fibers (lower panel): (a) simultaneous
surface in buffer solution acquired with an antibody-HyHel5 functionalized fiber.
individual lysozyme molecules using a bare non-functionalized fiber. Scan size:
signals can be obtained with bare non-functionalized fibers.
ARTICLE IN PRESS
Fig. 6. Blocking experiments of avidin–biotin interaction. (a) Topography and
recognition images before blocking acquired at two different positions.
(b) Topography and recognition images after injection of 50 ml of 1 mg/ml
streptavidin solution into the liquid cell. The number of recognition spots is
reduced showing the specificity of the molecular interaction. Scale bar is 200 nm.
M. Hofer et al. / Ultramicroscopy 110 (2010) 605–611 611
account the limited knowledge on the physical mechanismsrelated to shear-force sensing based on tuning forks, the harmonicoscillator model can be used to estimate interaction forcesbetween probe and sample, based on changes in the amplitudeof the piezoelectric tuning fork signal and the phase signal shiftbetween the tuning fork signal and the drive function. In suchcalculations, the interaction forces can be simulated by adding asmall extra damper, Dg, as a model for dissipative probe-to-sample interaction and/or an extra spring, Dk as a model forconservative probe-to-sample interaction [29]. In the case of adissipative probe-to-sample interaction the effect of increaseddamping g+Dg, is a reduction of the oscillation amplitude by Dx,and a reduction of the Q factor. The resonance phase lag of theresonator stays at p/2, and remains constant [29]. The interactionforces with the sample are purely due to shear-forces andtherefore solely reflected as changes in the topography, i.e., nochanges in the phase signal should be observed. Instead, in our
experiments we did observe changes in the phase signal that docorrelate with biochemical specificity between the tip and thesample. Although there are additional contributions like viscoe-lasticity and unspecific adhesion forces between tip and sample[30], our results suggest that biochemical recognition is animportant signal contributing to the shift in the phase in tuningfork-based shear force experiments.
Acknowledgements
This work was financially supported by the Christian DopplerSociety and the EC Grant NEST-2004-ADV, project acronym ‘BIO-LIGHT-TOUCH’. (Project number: 028781).
References
[1] F. de Lange, A. Cambi, R. Huijsbens, B. de Bakker, M.F. Garcia-Parajo, N.F. vanHulst, C.G. Figdor, J. Cell Sci. 114 (2001) 4153.
[2] K. Poole, D. Meder, K. Simons, D. Muller, FEBS Lett. 565 (2004) 53.[3] Y.G. Kuznetsov, A.J. Malkin, R.W. Lucas, M. Plomp, A. McPherson, J. Gen. Virol.
82 (2001) 1503.[4] A. Rasmussen, V. Deckert, Anal. Bioanal. Chem. 381 (2005) 165.[5] M. de Serio, R. Zenobi, V. Deckert, Trends Anal. Chem. 22 (2003) 70.[6] R.B. Sekar, A. Periasamy, J. Cell Biol. 160 (2003) 629.[7] N.F. van Hulst, M.F. Garcia-Parajo, M.H.P. Moers, J.A. Veerman, A.G.T. Ruiter,
J. Struct. Biol. 119 (1997) 222.[8] K. Karrai, R.D. Grober, Appl. Phys. Lett. 66 (14) (1995) 1842.[9] A.G.T. Ruiter, J.A. Veerman, K.O. van der Werf, N.F. van Hulst, Appl. Phys. Lett.
71 (1997) 28.[10] B. Arminger, S. Adamsmair, F. Kienberger, P. Hinterdorfer, B.G. Zagar,
Elektrotech. Informationstech. 125 (3) (2008) 86.[11] W.H.J. Rensen, N.F. van Hulst, Appl. Phys. Lett. 77 (10) (2000) 1557.[12] M. Koopman, I. de Bakker, M.F. Garcia-Parajo, N.F. van Hulst, Appl. Phys. Lett.
83 (24) (2003) 5083.[13] G.Y. Shang, W.H. Qiao, F.H. Lei, J.F. Angiboust, M. Troyon, M. Manfait,
Ultramicroscopy 105 (2005) 324.[14] C. Hoppener, J.P. Siebrasse, R. Peters, U. Kubitscheck, A. Naber, Biophys. J. 88
(2005) 3681.[15] C.W. Hollars, R.C. Dunn, Biophys. J. 75 (1998) 342.[16] C.W. Hollars, R.C. Dunn, J. Phys. Chem. B 101 (33) (1997) 6313.[17] W.T. Johnson, G. Kada, C. Stroh, H. Gruber, H. Wang, F. Kienberger, A. Ebner,
S. Lindsay, P. Hinterdorfer, NSTI-Nanotech. 2 (2005) 679.[18] L.A. Chtcheglova, J. Waschke, L. Wildling, D. Drenckhahn, P. Hinterdorfer,
Biophys. J. 93 (2) (2007) L11.[19] C. Stroh, H. Wang, R. Bash, B. Ashcroft, J. Nelson, H. Gruber, D. Lohr,
S.M. Lindsay, P. Hinterdorfer, Proc. Natl Acad. Sci. 101 (2004) 12503.[20] J.M. Friedt, E. Carry, Am. J. Phys. 75 (5) (2007) 415.[21] R. Clough, J. Penzien, in: Dynamics of Structures, third ed., Prentice-Hall, USA,
1993.[22] A. Ebner, P. Hinterdorfer, H.J. Gruber, Ultramicroscopy 107 (2007) 922.[23] A. Ebner, L. Wildling, A.S.M. Kamruzzahan, C. Rankl, J. Wruss, C.D. Hahn,
M. Holzl, R. Zhu, F. Kienberger., D. Blaas, Bioconjugate Chem. 18 (2007) 1176.[24] A.S.M. Kamruzzahan, A. Ebner, L. Wildling, F. Kienberger, C.K. Riener,
C.D. Hahn, P.D. Pollheimer, P. Winklehner, M. Holzl, B. Lackner, BioconjugateChem. 17 (2006) 1473.
[25] B. Bonanni, A.S.M. Kamruzzahan, A.R. Bizzarri, C. Rankl, H.J. Gruber,P. Hinterdorfer, S. Cannistraro, Biophys. J. 89 (2005) 2783.
[26] A. Ebner, F. Kienberger, G. Kada, C.M. Stroh, M. Geretschlanger,A.S.M. Kamruzzahan, L. Wildling, W.T. Johnson, B. Ashcroft, J. Nelson,S.M. Lindsay, H.J. Gruber, P. Hinterdorfer, ChemPhysChem 6 (2005) 897.
[27] A. Raab, W. Han, D. Badt, S.J. Smith-Gill, S.M. Lindsay, H. Schindler,P. Hinterdorfer, Nat. Biotechnol. 17 (1999) 901.
[28] E. Evans, Y.C. Fung, Microvasc. Biol. 105 (1972) 54.[29] W.H.J. Rensen, N.F. van Hulst, A.G.T. Ruiter, P.E. West, Appl. Phys. Lett. 75
(1999) 1640.[30] J. Tamayo, R. Garcia, Langmuir 12 (1996) 4430.