Molecular Mechanisms Involved in Insulin- and Leptin - TSpace
200
Molecular Mechanisms Involved in Insulin- and Leptin- mediated Regulation of Hypothalamic Proglucagon Gene Expression and Action of Glucagon-like Peptides on Hypothalamic Neuropeptides by Prasad S. Dalvi A thesis submitted in conformity with the requirements for the degree of Doctor of Philosophy Graduate Department of Physiology University of Toronto © Copyright by Prasad S. Dalvi 2012
-
Upload
khangminh22 -
Category
Documents
-
view
0 -
download
0
Transcript of Molecular Mechanisms Involved in Insulin- and Leptin - TSpace

Molecular Mechanisms Involved in Insulin- and Leptin-
mediated Regulation of Hypothalamic Proglucagon Gene
Expression and Action of Glucagon-like Peptides on
Hypothalamic Neuropeptides
by
Prasad S. Dalvi
A thesis submitted in conformity with the requirements
for the degree of Doctor of Philosophy
Graduate Department of Physiology
University of Toronto
© Copyright by Prasad S. Dalvi 2012

ii
Molecular Mechanisms Involved in Insulin- and Leptin-mediated
Regulation of Hypothalamic Proglucagon Gene Expression and Action
of Glucagon-like Peptides on Hypothalamic Neuropeptides
Prasad S. Dalvi
Doctor of Philosophy
Department of Physiology
University of Toronto
2012
Abstract
The hypothalamus is a central regulator of energy homeostasis. Recently, proglucagon-
derived peptides have emerged as potential appetite regulators. The proglucagon gene is
expressed in the periphery and also in selective hypothalamic neurons. The regulation of
hypothalamic proglucagon by two key regulators of energy balance, insulin and leptin, remains
unstudied. Central glucagon-like peptide (GLP)-1 receptor (GLP-1R) activation by exendin-4, a
long-acting GLP-1R agonist, induces anorexia; however, the specific hypothalamic neuronal
populations activated by exendin-4 remain largely unknown. The role of GLP-2 as a central
appetite regulator is poorly understood. In this thesis, using murine hypothalamic cell lines and
mice as experimental models, mechanisms involved in the direct regulation of proglucagon gene
by insulin and leptin were studied, and the actions of exendin-4 and GLP-2 on hypothalamic
neuropeptides were determined.
It was found that insulin and leptin regulate hypothalamic proglucagon mRNA by
activating Akt and signal transducer and activator of transcription 3, respectively. Insulin and
leptin did not regulate human proglucagon promoter regions, but affected proglucagon mRNA
stability. In mice, intracerebroventricular exendin-4 and GLP-2 induced anorexia, activated
proopiomelanocortin- and neuropeptide Y-expressing neurons in the arcuate nucleus and

iii
neurotensin- and ghrelin-expressing neurons in major hypothalamic appetite-regulating regions.
In the hypothalamic neuronal models, exendin-4 and GLP-2 activated cAMP-response element-
binding protein/activating transcription factor-1, and regulated neurotensin and ghrelin mRNA
levels via a protein kinase A-dependent mechanism. Overall, the in vivo and in vitro findings
suggest that these neuropeptides may serve as potential downstream mediators of exendin-4 and
GLP-2 action.
This research demonstrates direct regulation of hypothalamic proglucagon by insulin and
leptin in vitro, and reports a previously unrecognized link between central GLP-1R and GLP-2R
activation and regulation of hypothalamic neuropeptides. A better understanding of the
regulation of hypothalamic proglucagon and central GLP-1R and GLP-2R activation is important
to further expand our knowledge of feeding circuits.

iv
This thesis is dedicated
to
my mother, Jayanti, and father, Shridhar,
my sisters, Shailaja and Ranjana, and brothers-in-law, Bapu and Anant
my mother-in-law, Leena, and late father-in-law, Ramchandra
my daughter, Sanika, and son, Ojus,
& my wife, Pooja
for their endless love, support and encouragement
v
Preface
This thesis is submitted for the degree of Doctor of Philosophy at the University of
Toronto. The research described herein was conducted between January 2007 and April 2012
under the supervision of Dr. Denise D. Belsham in the Department of Physiology, University of
Toronto, ON, Canada. Financial stipend was provided by Banting and Best Diabetes Centre,
Ontario Government, Natural Sciences and Engineering Research Council of Canada and Dr.
Denise D. Belsham.
This research is, to the best of my knowledge, original, except where acknowledgements
and references are made to previous work. This research has been presented in the following
publications:
Prasad S. Dalvi, Frederick D. Erbiceanu, David M. Irwin, Denise D. Belsham. Direct
Regulation of the Proglucagon Gene by Insulin, Leptin and cAMP in Embryonic versus Adult
Hypothalamic Neurons. Molecular Endocrinology (2012) 26:1339-1355
Prasad S. Dalvi, Anaies Nazarians-Armavil, Matthew J. Purser and Denise D. Belsham.
Glucagon-like peptide-1 receptor agonist, Exendin-4, regulates feeding-associated neuropeptides
in hypothalamic neurons in vivo and in vitro. Endocrinology (2012) 153:2208-2222
Prasad S. Dalvi and Denise D. Belsham. Glucagon-like peptide-2 regulates
hypothalamic neurons expressing neuropeptides linked to appetite control in vivo and in vitro.
Endocrinology (2012) 153:2385-2397
.

vi
Acknowledgments
First and foremost, my heart-felt gratitude goes to my supervisor, Dr. Denise D. Belsham,
who hired me as a Master’s student at a very critical period in my life and has ever since guided
me through my doctorate degree. I am grateful to her for her time, constant support and
guidance. Her enthusiasm and encouragement were a strong motivational force throughout the
course of my graduate studies. The past five and a half years in the lab have been thoroughly
enjoyable and an amazing learning experience that has been profoundly rewarding and has truly
played an important part in shaping me as a cellular biology researcher.
I also sincerely thank Dr. Patricia Brubaker, Dr. Tianru Jin and Dr. Allen Volchuk for
being a part of my supervisory committee and for their invaluable insight towards the project. I
am also grateful to Dr. Martin Ralph, Dr. David Irwin and their teams for the great collaborative
efforts. I also greatly appreciate the support from the Department of Physiology, Banting and
Best Diabetes Centre, Ontario Government, Natural Sciences and Engineering Research Council
of Canada and other funding agencies for supporting my research.
My deepest appreciation goes towards the past and present members of the Belsham Lab
for their invaluable technical help at the bench and helping me orient to the Canadian way of life.
I am forever grateful to Jennifer Chalmers, Margaret Koletar and Luisa Centeno for teaching me
the ABCs of many scientific methods. It has been a great pleasure working with all.
Last but definitely not least, this work would not have been possible without my
incredibly supportive family, in-laws, teachers, mentors, friends and well-wishers spread across
the globe. Their endless love, teachings, support and encouragement have meant the world to me
and I thank them from the bottom of my heart for their endless love, support and encouragement!

vii
Table of Contents
List of Figures........................................................................................................................ xi
List of Abbreviations............................................................................................................. xiv
Chapter 1: Background and Significance........................................................................... 1
1.1 Introduction........................................................................................................... 3
1.2 Regulation of Energy Homeostasis........................................................................ 4
1.2.1 Hypothalamus......................................................................................... 5
1.2.1.1 Arcuate nucleus............................................................................... 5
1.2.1.2 Paraventricular nucleus................................................................... 7
1.2.1.3 Ventromedial hypothalamic nucleus............................................... 9
1.2.1.4 Dorsomedial hypothalamic nucleus................................................ 9
1.2.1.5 Lateral hypothalamus..................................................................... 9
1.2.2 The Hypothalamic Neuropeptides.......................................................... 10
1.2.2.1 Neuropeptide Y……….....................................................................
1.2.2.2 Pro-opiomelanocortin......................................................................
1.2.2.3 Neurotensin.....................................................................................
10
11
12
1.2.2.4 Ghrelin............................................................................................. 13
1.3 Proglucagon-derived peptides (PGDPs)............................................................... 15
1.3.1 Biosynthesis............................................................................................ 15
1.3.2 Role of PGDPs as appetite regulators.................................................... 17
1.3.3 Expression of PGDPs and their receptors in the hypothalamus............. 18
1.3.4 Signaling pathways activated by GLP-1R and GLP-2R stimulation...... 20
1.4 Insulin and insulin receptor signaling...................................................................
1.4.1 Insulin......................................................................................................
1.4.2 Insulin receptor signaling........................................................................
1.4.3 Insulin regulation of proglucagon...........................................................
1.5 Leptin and leptin receptor signaling......................................................................
1.5.1 Leptin......................................................................................................
1.5.2 Leptin receptor signaling.........................................................................
23
23
23
24
25
25
26

viii
1.5.3 Leptin regulation of proglucagon............................................................
1.6 Hypothalamic Neuronal Cell Models....................................................................
27
28
1.6.1 Generation of immortalized hypothalamic cell lines..............................
1.6.2 Immortalized embryonic hypothalamic cell lines, mHypoE-XX...........
28
29
1.6.3 Immortalized adult hypothalamic cell lines, mHypoA-XX.................... 30
1.7 Rationale, Hypotheses and Specific Aims..............................................................
1.7.1 Rationale.................................................................................................
1.7.2 Hypotheses..............................................................................................
1.7.3 Specific aims...........................................................................................
30
30
32
32
Chapter 2: Materials and Methods......................................................................................
2.1 Cell culture and reagents.......................................................................................
2.2 One-step reverse transcriptase-polymerase chain reaction..................................
2.3 Radioimmunoassay for adenosine 3’,5’-cyclic monophosphate...........................
2.4 Quantitative reverse transcription-polymerase chain reaction.............................
2.5 SDS-polyacrylamide gel electrophoresis and western blot analysis....................
2.6 Reporter gene plasmids.........................................................................................
2.7 Transient transfections..........................................................................................
2.8 Animal (mouse) experiments..................................................................................
2.9 Intracerebroventricular (i.c.v.) microinjections for feeding study........................
2.10 Assessment of neuronal activation by c-Fos immunohistochemistry………..........
2.11 Experimental normalization..................................................................................
2.12 Statistical analysis.................................................................................................
35
36
36
37
38
39
40
41
41
42
43
44
45
Chapter 3: Regulation of the Proglucagon mRNA levels by Insulin and Leptin in
Embryonic versus Adult Hypothalamic Neurons...............................................................
3.1 Abstract..................................................................................................................
46
48
3.2 Introduction........................................................................................................... 48

ix
3.3 Results....................................................................................................................
3.3.1 Characterization of the expression profile of the hypothalamic cell
lines.................................................................................................................
3.3.2 Activation of signaling pathways by insulin and leptin in the
hypothalamic neuronal cells............................................................................
3.3.3 Regulation of proglucagon mRNA transcript expression by insulin
and leptin..........................................................................................................
3.3.4 Reversal of insulin-mediated regulation of proglucagon mRNA
expression by PI3K inhibitors..........................................................................
3.3.5 Reversal of leptin-mediated regulation of proglucagon mRNA
expression by JAK2/STAT3 inhibitors............................................................
3.3.6 Regulation of human or rat proglucagon 5’ flanking promoter
constructs by insulin and leptin.......................................................................
3.3.7 Regulation of mRNA stability by insulin and leptin in mHypoA-2/10
and mHypoE-39 neuronal cells........................................................................
3.3.8 In silico analysis of murine proglucagon mRNA sequence for
microRNA binding sites and RNA-binding protein sites................................
3.4 Discussion..............................................................................................................
50
50
52
54
54
58
61
62
66
67
Chapter 4: Glucagon-like Peptide-1 Receptor Agonist, Exendin-4, Regulates Feeding-
associated Neuropeptides in Hypothalamic Neurons in vivo and in vitro.........................
4.1 Abstract..................................................................................................................
4.2 Introduction...........................................................................................................
4.3 Results....................................................................................................................
4.3.1 Effect of i.c.v. exendin-4 on food and water intake, and animal weight
4.3.2 Effect of i.c.v. exendin-4 on activation of hypothalamic nuclei and
neuropeptidergic neurons.................................................................................
4.3.3 Expression of GLP-1R and appetite-regulating neuropeptides in adult
mHypoA-2/30 and embryonic mHypoE-36/1 neurons....................................
4.3.4 Activation of CREB/ATF-1 and c-Fos by exendin-4 in the
hypothalamic neuronal cells.............................................................................
74
76
77
78
78
80
85
88

x
4.3.5 Regulation of neurotensin and ghrelin mRNA transcript expression by
exendin-4.........................................................................................................
4.3.6 Reversal of exendin-4 regulation of neurotensin and ghrelin by PKA
inhibitors..........................................................................................................
4.4 Discussion..............................................................................................................
Chapter 5: Glucagon-like Peptide-2 Regulates Hypothalamic Neurons Expressing
Neuropeptides Linked to Appetite Control in vivo and in vitro.........................................
5.1 Abstract..................................................................................................................
5.2 Introduction...........................................................................................................
5.3 Results....................................................................................................................
5.3.1 Effect of i.c.v. h(Gly2)GLP-2 on food and water intake, and animal
weight..............................................................................................................
5.3.2 Effect of h(Gly2)GLP-2 on activation of hypothalamic nuclei and
neuropeptidergic neurons.................................................................................
5.3.3 Expression of GLP-2R and appetite-regulating neuropeptides in
adult mHypoA-2/30 cells.................................................................................
5.3.4 Activation of CREB/ATF-1 and c-Fos by h(Gly2)GLP-2 in the
hypothalamic neuronal cells.............................................................................
5.3.5 Regulation of neurotensin and ghrelin mRNA transcript expression by
h(Gly2)GLP-2 ..................................................................................................
5.3.6 PKA inhibitors reverse the h(Gly2)GLP-2-induced up-regulation of
neurotensin and ghrelin mRNA transcript levels………..................................
5.4 Discussion..............................................................................................................
Chapter 6: Discussion............................................................................................................
6.1 Overall conclusions...............................................................................................
6.2 Limitations.............................................................................................................
6.3 Future directions....................................................................................................
Chapter 7: References...........................................................................................................
91
93
95
102
104
104
106
106
108
113
115
115
118
119
125
126
136
142
146

xi
List of Figures
Figure 1. Schematic diagrams of the hypothalamic and brainstem regions that express
neuropeptides involved in energy homeostasis (coronal sections) ........................
8
Figure 2. The products of preproglucagon cleavage. Schematic diagrams of the central
regions showing gene expression of proglucagon and GLP-1R and GLP-2R.....
19
Figure 3. Summary of GLP-1R signaling............................................................................... 21
Figure 4. Summary of GLP-2R signaling............................................................................... 22
Figure 5. Schematic of the proposed regulation of proglucagon-expressing neurons by
insulin and leptin in the hypothalamus...................................................................
33
Figure 6. Summary of the proposed signal transduction mechanisms triggered by GLP-1R
and GLP-2R activation in the hypothalamus.........................................................
34
Figure 7. Characterization of the expression profile of the proglucagon-expressing
hypothalamic cell lines............................................................................................
51
Figure 8. Insulin activates Akt and leptin activates STAT3 in the hypothalamic neuronal
cells.........................................................................................................................
53
Figure 9. Insulin and leptin regulate proglucagon mRNA expression in the hypothalamic
neuronal cells...........................................................................................................
55
Figure 10. Regulation of proglucagon mRNA expression by insulin via activation of the
PI3K/Akt pathway..................................................................................................
56
Figure 11. Regulation of proglucagon mRNA expression by leptin via activation of the
JAK2/STAT3 pathway...........................................................................................
Figure 12. Insulin and leptin do not affect the transcription of proglucagon promoter
constructs, but regulate mRNA stability.................................................................
Figure 13. In silico analysis of murine proglucagon mRNA sequence for miRNA binding
sites and RNA-binding protein sites.......................................................................
Figure 14. Intracerebroventricular injection of exendin-4 was effective to reduce food and
water intake, and body weight in mice....................................................................
Figure 15. Exendin-4 activates hypothalamic neurons...........................................................
Figure 16. Acute exendin-4 treatment increases the number of hypothalamic neurons co-
expressing c-Fos-immunoreactivity (ir) with α-MSH-, NPY-, neurotensin- or
ghrelin-ir..................................................................................................................
59
63
68
79
81
83

xii
Figure 17. Graphical representation showing the number of neurons expressing c-Fos and
neuropeptide-immunoreactivity in the ARC, VMH, DMH, PVN, LH, PeV,
and the internuclear space between the VMH and DMH of the saline- or
exendin-4-treated mouse hypothalamus..................................................................
Figure 18. Expression profile of GLP-1 receptor and appetite-regulating neuropeptides
in the hypothalamic neuronal cell lines..................................................................
Figure 19. Exendin-4 induces c-Fos activation and CREB/ATF-1 phosphorylation in the
hypothalamic neuronal cell lines.............................................................................
Figure 20. Regulation of neurotensin and ghrelin mRNA expression by exendin-4 in the
mHypoA-2/30 and mHypoE36/1 neuronal cell lines..............................................
Figure 21. Regulation of neurotensin and ghrelin mRNA expression via activation of the
protein kinase A pathway........................................................................................
Figure 22. Intracerebroventricular injection of h(Gly2)GLP-2 inhibits food and
water intake, and induces weight loss in a dose-dependent manner in mice..........
Figure 23. Acute h(Gly2)GLP-2 treatment activates hypothalamic appetite-regulating
nuclei.......................................................................................................................
Figure 24. Acute h(Gly2)GLP-2 treatment induces c-Fos-immunoreactivity (ir) in the
hypothalamic neurons expressing α-MSH-, NPY-, neurotensin- or ghrelin-ir.......
Figure 25. Acute h(Gly2)GLP-2 treatment induces c-Fos-immunoreactivity in the
hypothalamic neurons expressing NPY-, neurotensin- or ghrelin-ir......................
Figure 26. Graphical representation of neurons expressing c-Fos- and neuropeptide-
immunoreactivity in the ARC, VMH, DMH, PVN, LH and internuclear space
between the DMH and LH of the saline- or h(Gly2)GLP-2-treated mouse
hypothalamus..........................................................................................................
Figure 27. Expression profile of GLP-2R and appetite-regulating neuropeptides in the
hypothalamic neuronal cell lines.............................................................................
Figure 28. Acute h(Gly2)GLP-2 treatment induces c-Fos activation and CREB/ATF-1
phosphorylation in the hypothalamic GLP-2R-positive mHypoA-2/30 neuronal
cells.........................................................................................................................
Figure 29. Regulation of neurotensin and ghrelin mRNA expression by h(Gly2)GLP-2 in
the mHypoA-2/30 neuronal cell line in protein kinase A-dependent manner…....
84
86
89
92
94
107
109
110
111
112
114
116
117

xiii
Figure 30. Summary of the mechanisms activated by insulin and leptin to regulate
proglucagon gene expression in the mHypoA-2/10 and mHypoE-39 neuronal
cells.........................................................................................................................
Figure 31. Summary of the mechanisms activated by exendin-4 to regulate neurotensin
and ghrelin gene expression in the mHypoA-2/30 and mHypoE-36/1 neuronal
cells.........................................................................................................................
Figure 32. Summary of the mechanisms activated by GLP-2 to regulate neurotensin and
ghrelin gene expression in the mHypoE-36/1 neuronal cells..................................
128
130
132
xiv
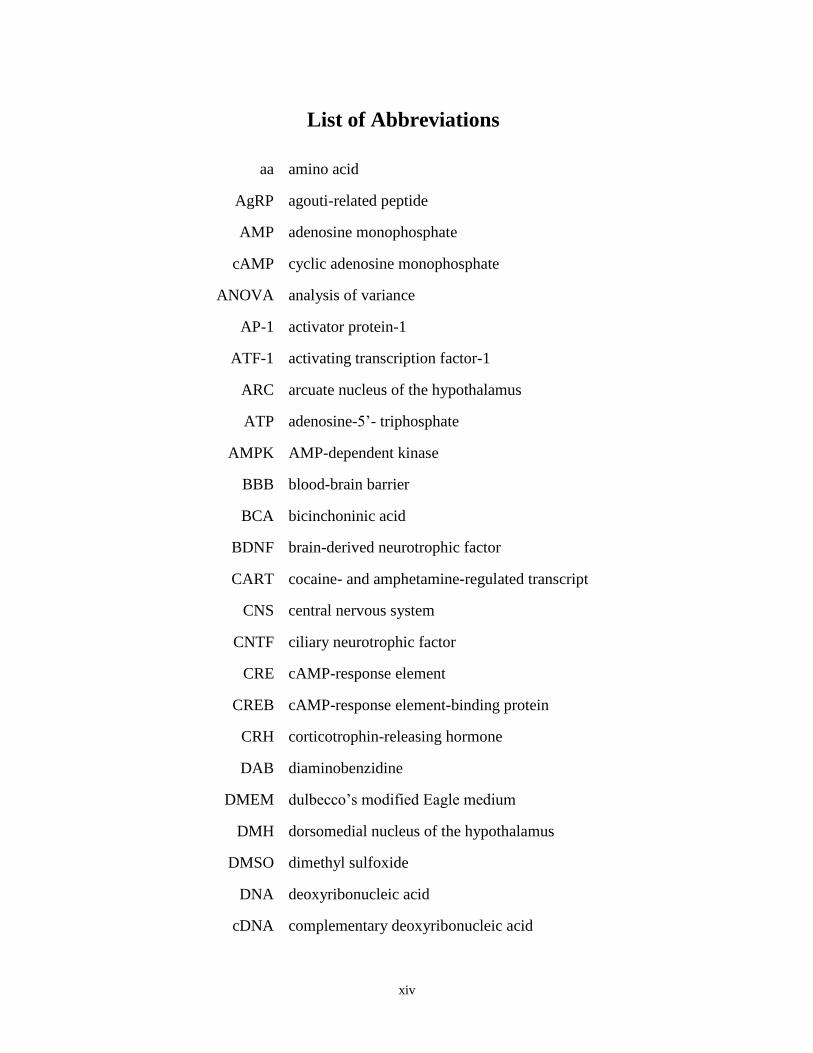
List of Abbreviations
aa
AgRP
AMP
cAMP
ANOVA
AP-1
ATF-1
ARC
ATP
AMPK
BBB
BCA
BDNF
CART
CNS
CNTF
CRE
CREB
CRH
DAB
DMEM
DMH
DMSO
DNA
cDNA
amino acid
agouti-related peptide
adenosine monophosphate
cyclic adenosine monophosphate
analysis of variance
activator protein-1
activating transcription factor-1
arcuate nucleus of the hypothalamus
adenosine-5’- triphosphate
AMP-dependent kinase
blood-brain barrier
bicinchoninic acid
brain-derived neurotrophic factor
cocaine- and amphetamine-regulated transcript
central nervous system
ciliary neurotrophic factor
cAMP-response element
cAMP-response element-binding protein
corticotrophin-releasing hormone
diaminobenzidine
dulbecco’s modified Eagle medium
dorsomedial nucleus of the hypothalamus
dimethyl sulfoxide
deoxyribonucleic acid
complementary deoxyribonucleic acid

xv
DPP-4
DRB
Epac
ERK
FBS
GABA
Gβ
GHS-R
Ghrl−/−
GLPs
GLP-1
GLP-1R
GLP-2
GLP-2R
GnRH
GRPP
h(Gly2)GLP-2
GUE
HPA
i.c.v.
IGF-1
IP
-ir
IBMX
IHC
IR
IRS
dipeptidyl peptidase-4
5, 6-Dichlorobenzimidazole 1-β-D-ribofuranoside
exchange protein activated by cAMP
extracellular signal-regulated kinases
fetal bovine serum
-aminobutyric acid
G protein beta subunit
ghrelin receptor (growth hormone secretagogue receptor)
ghrelin-deficient
glucagon-like peptides
glucagon-like peptide-1
GLP-1 receptor
glucagon-like peptide-2
GLP-2 receptor
gonadotropin-releasing hormone
glicentin-related pancreatic peptide
human (Gly2)GLP-2(1-33)
proglucagon gene upstream enhancer element
hypothalamic-pituitary-adrenal axis
intracerebroventricular
insulin-like growth factor-1
intervening peptide
-immunoreactive
3-isobutyl -1-methylxanthine
immunohistochemistry
insulin receptor
insulin receptor substrate
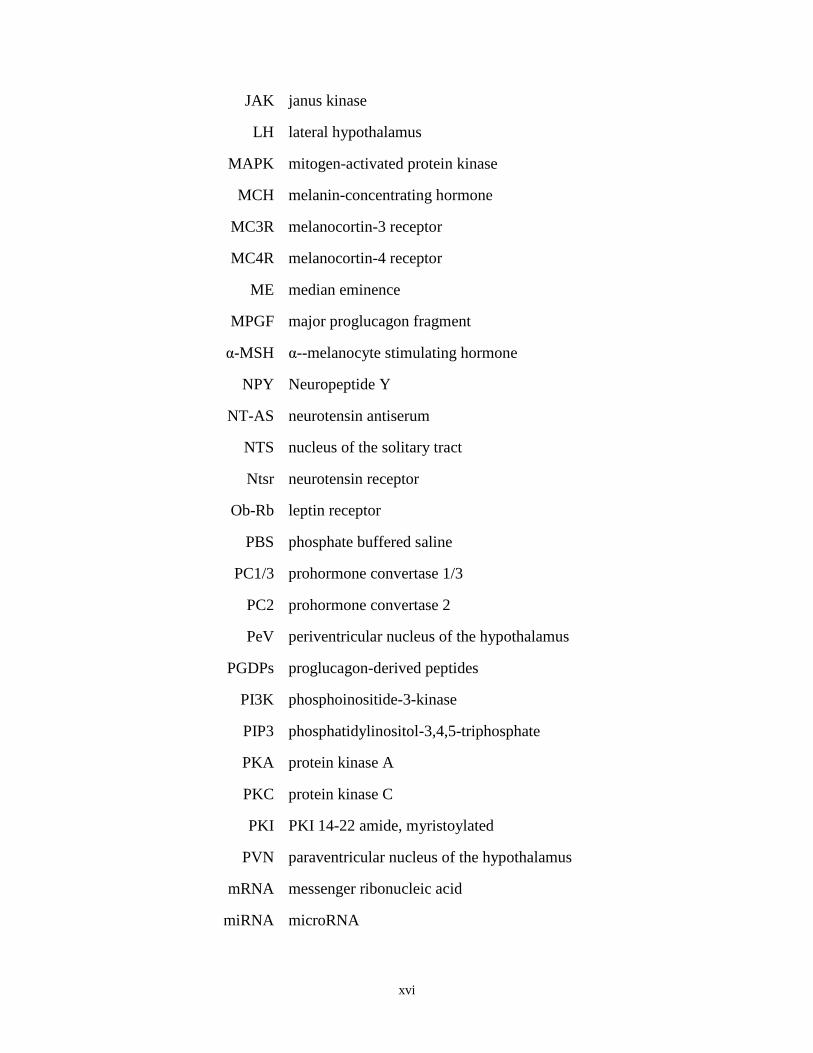
xvi
JAK
LH
MAPK
MCH
MC3R
MC4R
ME
MPGF
α-MSH
NPY
NT-AS
NTS
Ntsr
Ob-Rb
PBS
PC1/3
PC2
PeV
PGDPs
PI3K
PIP3
PKA
PKC
PKI
PVN
mRNA
miRNA
janus kinase
lateral hypothalamus
mitogen-activated protein kinase
melanin-concentrating hormone
melanocortin-3 receptor
melanocortin-4 receptor
median eminence
major proglucagon fragment
α--melanocyte stimulating hormone
Neuropeptide Y
neurotensin antiserum
nucleus of the solitary tract
neurotensin receptor
leptin receptor
phosphate buffered saline
prohormone convertase 1/3
prohormone convertase 2
periventricular nucleus of the hypothalamus
proglucagon-derived peptides
phosphoinositide-3-kinase
phosphatidylinositol-3,4,5-triphosphate
protein kinase A
protein kinase C
PKI 14-22 amide, myristoylated
paraventricular nucleus of the hypothalamus
messenger ribonucleic acid
microRNA

xvii
siRNA
RBPDB
RT-PCR
qRT-PCR
SDS-PAGE
STAT
SV
TRH
VMH
WHO
small interfering RNA
RNA-binding protein database
reverse transcription-polymerase chain reaction
quantitative reverse transcription-polymerase chain reaction
sodium dodecyl sulfate polyacrylamide gel electrophoresis
signal transducer and activator of transcription
simian virus
thyrotropin-releasing hormone
ventromedial nucleus of the hypothalamus
World Health Organization

1
Chapter 1
Background and Significance

2
Published figure:
Figure 1. Schematic diagrams of the hypothalamic and brainstem regions that express
neuropeptides involved in energy homeostasis (coronal sections).
Prasad S. Dalvi, Anaies Nazarians-Armavil, Stephanie Tung, and Denise D. Belsham.
Immortalized neurons for the study of hypothalamic function. Am J Physiol Regul Integr Comp
Physiol (2011) 300:R1030-1052.
Permissions were obtained to reproduce the copyrighted material.

3
1 Background and Significance
1.1 Introduction
Over the past two decades, an escalating pandemic of obesity has affected millions of
people worldwide (1, 2). According to Statistics Canada, more than half of Canadians are
overweight or obese, with almost 23% of the population falling in the category of "obese".
Obesity leads to numerous complications, such as type 2 diabetes, hypertension, stroke and heart
disease, that contribute to the increase in global burden of morbidity and mortality among all age
groups of human population (3). Increased appetite, indiscriminate and enhanced high calorie
consumption coupled with sedentary and stressful life-styles, and significant contributions of
genetic factors are responsible for dysregulation of energy balance that leads to the development
of obesity (4, 5). Since dieting alone is unable to control body weight in obese individuals, more
research is focused on the development of appetite-regulating drugs for which it is imperative to
understand mechanisms underlying central regulation of appetite and energy balance. The long-
term objective of this research project is to find new insights into the control mechanisms that are
critical to understand regulation of appetite and energy homeostasis. The main control centre of
appetite and energy homeostasis in the brain is the hypothalamus, which is comprised of multiple
neuronal subtypes expressing either appetite-stimulating (orexigenic) or appetite-suppressing
(anorexigenic) neuropeptides. Among them, the proglucagon-derived peptides (PGDPs) have
emerged as potential regulators of feeding behavior, particularly glucagon-like peptide (GLP)-1
and GLP-2, which induce anorexigenic effects via stimulation of GLP-1 receptor (GLP-1R) and
GLP-2R, respectively (6, 7). Two key anorexigenic hormones, insulin, and leptin, are known as
adiposity signals and maintain energy homeostasis through the regulation of hypothalamic
neurons (8-10). Several key studies have demonstrated the importance of central insulin actions
in regulating energy homeostasis (11-14). Similarly, leptin, an adipocyte-derived hormone acts in
the hypothalamus to reduce feeding and body weight (15-17). Insulin and leptin regulation of the
hypothalamic proglucagon gene expression, and also the cellular mechanisms triggered by GLP-
1 and GLP-2 in the process of appetite regulation are poorly understood, mainly due to
complexity of the in vivo architecture of the hypothalamus and the lack of representative
neuronal cell models required for these studies. Recently, our laboratory has generated an

4
extensive collection of immortalized, clonal hypothalamic neuronal cell lines that can be used to
determine the effects of hormones and neuropeptides on specific neuroendocrine cell types (18,
19). Some of these cell models express the proglucagon gene and can be used to study
mechanisms involved in proglucagon gene regulation. Importantly, we have the first
hypothalamic cell lines that endogenously express GLP-1R and GLP-2R, and can be used to
study hormone-responsiveness, at the level of the individual neuropeptide gene and through
analysis of signal transduction events. Using these cells as in vitro models and mice as in vivo
models in these studies, the short-term objectives of this research project were to study
regulation of proglucagon gene expression in the hypothalamic neurons, to assess the effect of
long-acting GLP-1R agonist exendin-4 and GLP-2R agonist h(Gly2)GLP-2[1-33] on modulation
of hypothalamic appetite-regulating neuropeptides and to dissect the mechanisms involved in
this process. First, using the hypothalamic cell models, potential action of insulin and leptin, two
key regulators of food intake and energy balance, on proglucagon mRNA transcript levels in the
hypothalamic cell models was investigated. Second, the transcriptional mechanisms involved in
the regulation of proglucagon gene expression were defined. Finally, the action of exendin-4 and
h(Gly2)GLP-2[1-33] on the hypothalamic neuropeptides neurotensin and ghrelin, and the
signaling mechanisms involved were investigated.
1.2 Regulation of energy homeostasis
The central nervous system (CNS) regulates energy balance via an evolutionarily
conserved homeostatic system. Over the last two decades, extensive research has been conducted
to investigate neuronal pathways, neuropeptides, neurotransmitters and modulators, and signal
transduction mechanisms involved in appetite regulation and energy balance. In the CNS, the
hypothalamus is a primary control site that regulates central neuroendocrine functions including
but not limited to thermoregulation, fluid and electrolyte balance, reproduction, circadian
regulation, stress response, and energy homeostasis (20). Afferent signals from the periphery are
integrated in the neuroendocrine hypothalamus and processed into efferent signals to modulate
food intake and energy expenditure in order to maintain energy balance (21). Dysregulation of
this homeostatic system in favor of increased energy intake may lead to metabolic disorders that
further result in obesity and related complications such as type 2 diabetes (22).

5
1.2.1 Hypothalamus
The hypothalamus plays a vital role in maintaining the energy homeostasis (23). It
comprises of several nuclei that regulate energy intake and expenditure. The main nuclei
involved in appetite regulation are the arcuate nucleus (ARC), paraventricular nucleus (PVN),
ventromedial nucleus (VMH), dorsomedial nucleus (DMH), and lateral hypothalamus (LH)
(Figure 1). The ARC, PVN, and DMH are the most important hypothalamic nuclei involved in
the regulation of energy balance, and the hypothalamic VMH and LH are involved in the control
satiety and hunger, respectively (24, 25). These hypothalamic nuclei contain specific neuronal
phenotypes to form a complex network of orexigenic and anorexigenic circuits that regulate
energy homeostasis (20). Numerous neuropeptides, including but not limited to neuropeptide Y
(NPY), agouti-related peptide (AgRP), melanin-concentrating hormone (MCH), α-melanocyte
stimulating hormone (α-MSH)/pro-opiomelanocortin (POMC), corticotrophin-releasing hormone
(CRH), cocaine- and amphetamine-regulated transcript (CART), brain-derived neurotrophic
factor (BDNF), orexin A and B, glucagon-like peptides (GLPs), galanin, ghrelin, and neurotensin
mediate orexigenic and anorexigenic processes in the hypothalamus (6). Recently, the PGDPs,
specifically, glucagon-like peptide-1 (GLP-1), glucagon-like peptide-2 (GLP-2) and
oxyntomodulin, have been investigated as potential regulators of feeding behavior (6). Several
studies have shown that central administration of PGDPs controls satiety and reduces food intake
(26-28), however further research is warranted to dissect the mechanism(s) utilized by PGDPs to
induce anorectic signals and their exact role in appetite regulation (7).
1.2.1.1 Arcuate nucleus
The ARC encloses the third ventricle and lies immediately above the median eminence
(ME). The ARC-ME area represents an important region because the lack of blood-brain barrier
(BBB) in ME permits the interplay between peripheral organs and the brain to take place in this
small area (29). Due to its multitude of neuropeptidergic neurons, it is a key hypothalamic
nucleus in the regulation of appetite. The two major neuronal populations in the ARC implicated
in the regulation of feeding are orexigenic NPY and AgRP and anorexigenic POMC. NPY is a
powerful central appetite-stimulant and acts upon its own receptors, Y1, Y2, Y4, Y5 (30), but
exerts its orexigenic effect predominantly via the Y1 and Y5 receptors. The majority of the

6
hypothalamic NPY neurons found within ARC also co-express AgRP (31, 32). AgRP is part of
the melanocortin system and is an antagonist to the melanocortin-3 receptor (MC3R) and
melanocortin-4 receptor (MC4R) (33). Thus, when the NPY/AgRP neuron is activated, NPY
stimulates orexigenic pathways and AgRP inhibits the anorexigenic melanocortin pathway.
Hypothalamic POMC neurons are primarily located in the lateral ARC region (34, 35).
Cleavage of POMC by endoproteases yields active peptides including melanocortins that are
essential for normal energy homeostasis (10). Feeding stimulates hypothalamic POMC mRNA
expression, and mice that are obese due to leptin deficiency or insensitivity exhibit decreased
hypothalamic POMC mRNA expression (35-37). Mice and humans entirely lacking POMC
develop hyperphagia and severe early-onset obesity (38). Thus, hypothalamic POMC neurons
mediate catabolic responses such as decreased food intake and increased energy expenditure. In
fact, the POMC peptide product α-MSH has been observed to have significant catabolic effects
through its action on MC4R (39, 40). The majority of POMC neurons in the ARC also co-
express CART mRNA. Animal studies have shown that central administration of CART inhibits
food intake, whereas central injection of CART antiserum increases food intake (41).
The analysis of the hormonal control of NPY/AgRP and POMC neurons has progressed
immensely. Both neuronal populations express insulin and leptin receptors and are targeted by
the respective hormones (12, 42, 43). A large body of evidence has revealed an important role
for leptin-activated STAT3 signaling in the arcuate POMC/AgRP neurons in control of energy
homeostasis. Disruption of neuron-specific STAT3 results in hyperphagia, obesity, diabetes and
infertility (44). Further, it was demonstrated that insulin- and leptin-evoked phosphoinositide-3-
kinase (PI3K) activation resulted in Akt-mediated disinhibition of POMC transcription (45, 46).
The projections from the “first order” NPY/AgRP and POMC neurons extensively
communicate with the “second-order” neurons, located in other hypothalamic areas involved in
appetite regulation, such as the PVN, VMH, DMH, LH, and the nucleus of the solitary tract
(NTS) in the brainstem (47). The axons of these neurons project to CRH-, thyrotropin-releasing
hormone (TRH)- and oxytocin-expressing neurons located in the PVN, and MCH- and
orexin/hypocretin-expressing neurons of the LH and perifornical area. The ARC is the chief
hypothalamic area involved in the control of food intake, therefore, when satiety or adiposity

7
signals reach the ARC, anorexigenic peptides are released which activate a catabolic circuit to
suppress feeding. In contrast, when satiety or adiposity signals are low in the brain, the activation
of anabolic pathway leads to the release of orexigenic peptides indicating the urgency to
replenish fuel stores by stimulating food intake.
1.2.1.2 Paraventricular nucleus
The PVN is located on either side of the superior part of the third ventricle in the anterior
hypothalamus. The PVN is a highly vascularised region of the hypothalamus and is protected by
the BBB, although its neuroendocrine neurons extend to ME and the posterior pituitary which
lack the BBB. It contains a dense cluster of heterogeneous neurons that are activated by various
stimuli including stress and physiological changes (48, 49). The magnocellular neurosecretory
neurons of the PVN project directly to the neurohypophysis (posterior pituitary) where they
release oxytocin or vasopressin into the general circulation (50, 51). The parvocellular
neurosecretory neurons of the PVN project to the ME and transmit CRH, TRH, gonadotropin-
releasing hormone (GnRH), growth hormone-releasing hormone, somatostatin and dopamine
into the portal blood vessels of the adenohypophysis (anterior pituitary) (52). There are other
PVN neurons that express neuropeptides such as ghrelin, CART, nociceptin and neurotensin (53-
56), which may be involved in the hypothalamic regulation of appetite and autonomic functions
in the brainstem and spinal cord. Evidence from many experiments suggests that the PVN is a
crucial site for the action of many peptides involved in appetite regulation including but not
limited to NPY, ghrelin, orexin-A, leptin, GLP-1 (57). It has been shown that microinjection of
CRH and leptin in the PVN attenuated fasting-induced feeding (58, 59). The NPY/AgRP neurons
of the ARC innervate TRH neurons in the PVN and inhibit pro-TRH gene expression, whereas
α-MSH/POMC projections stimulate TRH (60-62). Thus by integrating numerous neuronal
pathways implicated in energy balance such as projections from the NPY/AgRP and POMC
neurons of the ARC as well as projections from the suprachiasmatic nucleus and the NTS the
PVN plays an important role in the integration of nutritional signals with the hypothalamo-
pituitary axis and other downstream endocrine glands (49, 63).

8
Figure 1. Schematic diagrams of the hypothalamic and brainstem regions that express
neuropeptides involved in energy homeostasis (coronal sections). AgRP, agouti-related
peptide; ARC, arcuate nucleus; AP, area postrema; BBB, blood-brain barrier; CART, cocaine
and amphetamine-regulated transcript; CB1, endocannabinoid receptor 1; CRH corticotropin-
releasing factor; DMH, dorsomedial hypothalamic nucleus; GLP-1, glucagon-like peptide-1;
GLP-2, glucagon-like peptide-2; LH, lateral hypothalamus; MCH, melanin-concentrating
hormone; ME, median eminence; NPY, NPY; NT, neurotensin; NTS, nucleus tractus solitarius;
ObRb, leptin receptor; OC, optic chiasm; OXM, oxyntomodulin; OXY, oxytocin; Pit, pituitary
gland; POMC, pro-opiomelanocortin; PVN, paraventricular nucleus; SCN, suprachiasmatic
nucleus; 3V, third cerebral ventricle; TRH, thyrotropin-releasing hormone; VMH, ventromedial
hypothalamic nucleus. Orange arrows point to the coronal sections of the corresponding brain
regions. Dashed arrows indicate the central sites of action for regulating factors.

9
1.2.1.3 Ventromedial hypothalamic nucleus
The VMH of the hypothalamus, located adjacent to the ARC, receives NPY, AgRP, β-
endorphin and POMC/CART projections from the ARC (41, 64-67), and sends efferent
projections to the DMH, PVN and brain stem regions such as NTS. The neurons in the VMH
have long been hypothesized to play a major role in metabolic regulation since bilateral VMH
lesions cause hyperphagia and obesity (68-70). The VMH contains a large population of
glucoresponsive neurons which show increased activity during oral hyperglycemia (71, 72).
Recent work has demonstrated that BDNF is highly expressed in the VMH and central
administration of BDNF reduces feeding and causes loss of body weight (73). The VMH BDNF
neurons are regulated by food deprivation (74) and ARC POMC neurons via MC4R activate
them to decrease food intake (74). It has been found that the VMH expresses receptors to several
signalling molecules including leptin, which is a potent anorexigenic signal to inhibit appetite
and feeding and stimulate energy expenditure and weight reduction (75).
1.2.1.4 Dorsomedial hypothalamic nucleus
The DMH receives a high level of ARC NPY and α-MSH/POMC neuronal terminals (32,
76), whereas it sends projections to communicate with VMH, PVN and LH to integrate and
process information from these regions (15, 77). It has been shown that the electrolytic
destruction of the DMH disrupts feeding causing hyperphagia and obesity that suggests a role for
DMH in appetite regulation (78). Other findings have confirmed that DMH may act as a site of
action for leptin and interaction between NPY and leptin (79, 80). Normally, the DMH contains a
few NPY neurons (81, 82), however in diet-induced obese, in genetic obese mice and during
suckling-induced hyperphagia NPY gene expression is increased in the DMH (15, 83-85).
1.2.1.5 Lateral hypothalamus
The LH extends rostrally from the mesencephalic tegmentum to the lateral preoptic area
in dorsal and lateral aspect to VMH (77). It contains sparsely distributed subpopulation of
neurons expressing orexigenic MCH and orexins (orexin A and B or hypocretin-1 and -2) (86,
87) which are extensively synapsed by projections from NPY/AgRP and α-MSH/POMC neurons
from the ARC. MCH-immunopositive fibers further project to the cortex, brainstem and spinal

10
cord (88), and orexin/hypocretin neurons exert their effects via extensive communication with
the ARC, PVN and NTS (86, 89). The mechanism by which MCH and orexin/hypocretin
neurons regulate energy homeostasis is yet unclear. Apart from these neurons, large number of
glucose-sensing neurons are present in the LH that may integrate peripheral signals and mediate
the marked hyperphagia which is normally induced by hypoglycemia (24).
1.2.2 The Hypothalamic Neuropeptides
1.2.2.1 Neuropeptide Y
NPY is a 36-amino acid (aa) peptide and is one of the most potent neuropeptides known
to induce feeding in animals. NPY is one of the most abundant peptides found in the brain and
NPY-expressing neurons are widely distrubuted throughout the CNS. In the hypothalamus, NPY
is abundantly synthesized by the NPY-expressing neurons of the ARC and are known as the key
orexigenic neurons (90). These arcuate NPY neurons send projections towards the PVN as well
as the DMH (91). The widespread distribution of NPY facilitates functional diversity, including
cardiovascular regulation, seizure and cognition, stress, modulation of neuroendocrine systems
and appetite regulation. NPY mediates its biological actions through a portfolio of G-protein
coupled receptors, Y1-Y6 and second messenger systems in different downstream effector
neuronal types (30, 92, 93). Several studies suggest that the Y1 and Y5 receptors are important in
mediating the orexigenic effects of NPY in rats (94).
Negative energy states such as fasting, starvation, food deprivation, diet restriction or
hunger induce an increase in NPY neurons in the hypothalamus and NPY mRNA expression in
various brain nuclei (77, 95-101), whereas positive energy state following refeeding normalizes
both NPY secretion and NPY mRNA levels (102). NPY neurons are regulated by numerous
metabolic factors such as glucose, free fatty acids, insulin, leptin, ghrelin and other hormones
such as glucocorticoids (103-107). It has been shown that the satiety hormones insulin and leptin
decrease NPY expression (103, 104), and acute exposure to glucose inhibits NPY neurons (122).
In contrast, the orexigenic hormone ghrelin directly stimulates glucose-sensitive ARC NPY
neurons (103, 105-107). Glucocorticoid receptors are found on almost all NPY neurons in the
ARC (108), and glucocorticoids upregulate NPY expression in the hypothalamus (109).

11
In the genetically obese Zucker rats, NPY mRNA is increased in the ARC nucleus
causing hyperphagia in these rats (110). Similarly, hypothalamic NPY gene expression is
upregulated and peptide content in the ARC nucleus is significantly increased in the obese leptin-
deficient ob/ob mice (102, 111). Importantly, in adult rats central administration of NPY
stimulates food intake, whereas ablation of NPY/AgRP neurons in young mice reduces food
intake and causes severe starvation highlighting the importance of these neurons to energy
balance (112-114). However, neonatal NPY/AgRP ablation does not elicit any changes in
feeding behavior (112). Similarly, the phenotype of NPY knockout mice does not alter from that
of wild-type mice (115). The absence of any evident effect of NPY deletion on phenotype of
NPY knockout mouse model can be attributed to the compensatory adaptive mechanisms that
may develop during early developmental stages. Nevertheless, it has been demonstrated that
NPY ablation in ob/ob mice attenuates obesity through decreased feeding and weight gain
suggesting that the NPY neurons play a crucial role in the development of obesity (116).
1.2.2.2 Pro-opiomelanocortin
POMC neurons are expressed in the ARC of the hypothalamus and the anterior and
intermediate lobes of the pituitary gland. POMC is a precursor polypeptide that undergoes
extensive, tissue-specific, post-translational processing via cleavage by enzymes, such as
prohormone convertases, carboxypeptidase E, peptidyl α-amidating monooxygenase, N-
acetyltransferase, and prolycarboxypeptidase. The POMC-derived peptides have important roles
in the regulation of appetite and energy homeostasis (117, 118). Mutations in the POMC gene in
humans have been associated with hyperphagia and early onset obesity (119-121), and POMC-
deficient mice are severely obese (38, 122).
In the hypothalamus, enzymatic cleavage of POMC produces melanocortin peptides
including α-MSH which exert their effects via melanocortin receptors. The melanocortin
receptors MC3R and MC4R are expressed in the brain, but the MC4R is highly expressed in the
hypothalamus, particularly the PVN (123). It is now clear that the α-MSH released from ARC
POMC neurons activates downstream MC4Rs to inhibit food intake (124), whereas AgRP from
the ARC, being the endogenous inverse agonist and antagonist of the MC3R and MC4R,
reverses the α-MSH-mediated inhibition of feeding and stimulates food intake and a lower

12
metabolic rate (31). The physiological role of POMC-derived peptides in the brain is of
particular interest in obesity research as it has been shown that α-MSH together with the MC3R
and MC4R is central to the regulation of appetite and energy homeostasis. In vivo studies have
shown that POMC-derived peptides have potent anorexigenic effects, but α-MSH has the most
potent anorexigenic effects as it induces severe hypophagia and causes the greatest reduction in
body weight when administered to POMC-null mice (125). These findings highlight the
importance of this precursor polypeptide in the homeostatic regulation of feeding and body
weight (125). Further, mutations in the MC4R cause obesity, while agonists of the receptor
function suppress feeding (126-128). The MC4R-deficient patients are hyperphagic and up to 6%
of early-onset morbidly obese patients in British Caucasians were found to have MC4R
mutations (129, 130).
Recently, it was found that POMC is colocalized with GLP-1R in ARC neurons, and
another recent study indicates that the GLP-1R activation in the ARC POMC neurons is involved
in regulation of glucose homeostasis, but not feeding (131). Whether GLP-1 has any direct effect
on POMC expression or secretion of POMC-derived peptides is yet to be determined.
1.2.2.3 Neurotensin
The coordinated regulation of food intake and energy expenditure takes place in the
hypothalamus. Among the multitude of central signaling pathways and neuropeptides involved in
appetite regulation, hypothalamic neurotensin inhibits feeding due to its anorexigenic action
(132, 133). Neurotensin-expressing neurons are located mainly in the parvocellular portion of the
PVN, in the ARC, PeV, and LH. Moderate numbers of cell bodies containing neurotensin-like
immunoreactivity can also be found in the anterior hypothalamus, the DMH, and the posterior
hypothalamus (56). Neurotensin mediates its effect through neurotensin receptors (Ntsr) (134),
which are expressed in the hypothalamic ARC and DMH nuclei (135-138). Ntsr deficiency
moderately increases food intake and body weight, and blocks neurotensin-induced anorexia in
mice, implicating neurotensin-Ntsr signaling pathway in feeding and body weight regulation
(139).
Leptin is one of the most important adipose-derived hormones that reduces appetite by
regulating several central and peripheral signaling pathways involved in the regulation of energy
13
homeostasis (140). Recently, it was found that leptin directly stimulates neurotensin gene
expression in the hypothalamic cell lines that express both leptin receptor and neurotensin (141).
Furthermore, it has been suggested that leptin’s inhibitory regulation on feeding is mediated at
least partly through neurotensin-Ntsr signaling pathway (142, 143). All these findings confirm
that leptin targets neurotensin neurons to mediate its effect on appetite regulation. Interestingly,
in another study, it was found that when GLP-1R activation was blocked by exendin-(9-39),
leptin’s anorectic action was abolished (144). Further, exendin-4 treatment decreased food intake
and body weight in leptin-deficient ob/ob mice and fatty Zucker rats, indicating that leptin
deficiency is overcome by GLP-1R activation to induce leptin’s anorectic effect (145). Based on
these findings it can be strongly suggested that leptin may interact with intermediate proglucagon
neurons that subsequently excite downstream negative energy balance by stimulating
anorexigenic neurons to induce appetite suppression; neurotensin neurons can be the potential
downstream targets for the action of central GLPs. As yet, no studies have been performed to
link hypothalamic GLPs or their receptors with neurotensin.
1.2.2.4 Ghrelin
Ghrelin is a potent orexigenic hormone that strongly influences generation of hunger and
therefore is known as the “hunger hormone”. Its plasma concentrations increase before meals
and during fasting, and decrease after ingestion of food. Ghrelin is predominantly produced in
the stomach and stimulates appetite by its action on the ARC of the hypothalamus via activation
of growth hormone secretagogue receptor (GHS-R). Two isoforms of ghrelin have been
identified: active (acyl ghrelin) and inactive (des-acyl ghrelin). The enzyme ghrelin O-
acyltransferase converts proghrelin peptide into active acyl ghrelin (146, 147). Des-acyl ghrelin
does not bind to the GHS-R, and its biological roles are uncertain in the absence of an identified
equivalent receptor (148). Apart from the production of mature ghrelin, the proghrelin peptide is
also post-translationally processed in the stomach to generate an entirely different peptide,
obestatin, that apparently activates an orphan G-protein-coupled receptor, GPR39 (149).
However, the physiological function of obestatin and its receptor remains unclear. Although,
initial research demonstrated that obestatin had a potent anorectic effect in mice and rats (149),
subsequently these findings were disputed (150, 151).
14
Human and animal studies have demonstrated that the activation of the GHS-R results in
increased food intake and increased adiposity (152-154). Peripheral and central administration of
ghrelin increases feeding and promotes weight gain (153, 154). It is reported that endogenous
centrally released ghrelin is also involved in the regulation of food intake and body weight (153,
155). Existence of ghrelin-expressing neurons in the hypothalamus is debated, however, ghrelin-
expressing neurons have been shown to be present in the internuclear spaces between the PVN,
ARC, VMH, and DMH hypothalamic nuclei, the perifornical region, and the ependymal layer of
the third ventricle (105). These neurons interact with key hypothalamic neurons involved in
appetite regulation, mainly the NPY/AgRP and POMC neurons of the ARC suggesting that
hypothalamic ghrelin may stimulate orexigenic or inhibit anorexigenic neuropeptides (105, 156).
Although a series of pharmacological and clinical studies suggested that ghrelin was an
endogenous regulator of energy balance, recent genetic studies using adult ghrelin-deficient
(Ghrl−/−) mice resulting from targeted ghrelin gene disruption fail to demonstrate any significant
defects in normal energy balance, food intake, and adiposity on a standard diet (157, 158). Such
lack of a metabolic phenotype may be attributed to compensatory processes during early
developmental phases or existence of redundant pathways controlling energy balance.
Nevertheless, absence of ghrelin in Ghrl−/− mice protects them from the early-onset obesity
induced by early exposure to a high-fat diet (159). Importantly, simultaneous deletion of ghrelin
and its receptor leads to decreased body weight, increased energy expenditure, and increased
motor activity on a standard diet demonstrating that ghrelin has a physiological role in the
regulation of energy homeostasis (160). Another finding that the mice lacking GHS-R are
resistant to the development of diet-induced obesity demonstrates the importance of GHS-R in
the regulation of energy expenditure and body weight (161).
Regulation of ghrelin-expressing neurons in the hypothalamus is not well studied.
Although it has been shown that GLP-1 inhibited ghrelin-induced feeding and exendin-4 reduced
plasma levels of peripheral ghrelin (162, 163), whether hypothalamic ghrelin expression is
regulated by GLP-1R or -2R activation is not known. It can be speculated that the anorexigenic
action of the centrally-originated GLPs is mediated via inhibition of hypothalamic ghrelin
neurons; however, no studies have been conducted to elucidate this mechanism. Further
investigation is needed to explore the possibility of this interaction because inhibition of the
15
ghrelin-expressing neurons may lead to reduced food intake, and consequently to reductions in
body weight and adiposity. Therapeutic intervention by inhibiting ghrelin/GHS-R pathway may
be used to prevent or treat obesity (164).
1.3 Proglucagon-derived peptides
1.3.1 Biosynthesis and regulation
The proglucagon gene was isolated from rodents and humans in the early 1980s (165-
170). The proglucagon gene is expressed in the pancreatic α-cells, intestinal L-cells and a small
number of neurons in the CNS, specifically the hypothalamus and the brain stem, and a single
copy of proglucagon gene generates the PGDPs (166, 168, 171, 172). Identical preproglucagon
mRNA transcripts are expressed in these cells, however, the tissue- or cell-specific post-
translational processing of proglucagon leads to the biosynthesis of diverse PGDPs (173, 174)
(Figure 2A). Glicentin, oxyntomodulin, GLP-1, GLP-2, intervening peptide (IP)-1 and IP-2 are
synthesized in the intestinal endocrine L-cells which are located mainly in the distal ileum and
colon, whereas glucagon, glicentin-related pancreatic peptide (GRPP), major proglucagon
fragment (MPGF) and IP-1 are predominantly produced by pancreatic α-cells (171, 173-176).
This diversification is achieved through proteolytic processing by cell- or tissue-specific
prohormone convertases (174, 177-179). Currently, there are 9 known mammalian prohormone
convertases, all of which are thought to be responsible for the cleavage of many prohormones
and proneuropeptides to generate shorter forms by targeting the carboxyl terminus of a single or
paired basic residues of these prohormones and proneuropeptides (177). In the case of precursor
proglucagon, each PGDP is flanked by pairs of basic residues that present canonical
prohoromone cleavage sites for different prohormone convertases to exert their catalytic
functions (171).
The tissue-specific expression of the different convertases is responsible for the unique
protein profile of PGDPs. Prohormone convertase 2 (PC2) is the most abundant convertase in the
pancreatic α-cells and co-localizes with glucagon in the islet secretory granules (180). In
contrast, intestinal L-cells highly express prohormone convertase 1/3 (PC1/3) that is responsible
for the generation of the intestinal PGDPs including GLP-1 and GLP-2 (174, 180-182). Both

16
PC2 and PC1/3 are capable of cleaving proglucagon to generate the N-terminal intermediate
glicentin and C-terminal intermediate MPGF (181); however PC2 is required for additional
processing of glicentin to GRPP, glucagon and IP-1 (173, 181), and PC1/3 is required to produce
GLP-1 and GLP-2 from MPGF (173, 174, 180-182). The post-translational processing of
proglucagon in the CNS is mostly similar to that observed in the intestinal L-cells (183). Original
studies investigating expression pattern of hypothalamic PGDPs showed that glicentin,
oxyntomodulin and glucagon are abundantly present in fetal rat hypothalamus, whereas in adult
rat hypothalamus glicentin and oxyntomodulin are present in greater amounts than glucagon and
GLP-1 suggesting that the processing of proglucagon in the hypothalamus varies with the brain
development (183, 184).
Regulation of proglucagon gene expression in the pancreas and intestine has been
extensively studied (185). Extensive investigations of mechanisms underlying proglucagon gene
transcription have led to the identification of a minimum promoter region (G1) and four enhancer
elements (G2–G5) in the proglucagon gene promoter (186, 187). Transgenic mouse studies have
indicated that approximately 1.3 kb of rat proglucagon gene 5’flanking sequences are sufficient
to direct pancreatic α-cell- and brain-specific rat proglucagon gene expression (188). In contrast,
similar studies suggest that a much larger region (2.3 kb) of rat proglucagon 5’-flanking
sequences is required for proglucagon gene expression in the intestine (189), indicating that
DNA sequences located between -2.3 and -1.3 kb in the rat proglucagon promoter contain
specific elements required for intestinal proglucagon gene expression. These sequences situated
between -2.3 and -1.3 kb have been designated as the proglucagon gene upstream enhancer
element (GUE) that is composed of multiple positive and negative cis-acting DNA regulatory
elements involved in regulating tissue-specific proglucagon gene transcription (190). A
combination of cell transfection and transgenic reporter studies have reported that approximately
1.6 kb of human proglucagon gene 5’-flanking sequences can direct proglucagon gene
transcription to the brain and intestine, but for pancreas-specific proglucagon gene expression the
sequences within the first 6 kb of the human proglucagon gene 5’-flanking region are required
(191). These studies indicate that specific trans- and cis-regulatory elements are required for
tissue-specific proglucagon gene transcription in rodents and humans.

17
Several studies have demonstrated that proglucagon gene transcription can be regulated
by cyclic adenosine monophosphate (cAMP), amino acids, and a number of homeodomain
protein transcription factors such as isl-1, cdx-2/3, pax-6, HNF-3α, HNF-3β, and brn 4 (185,
192-196). Further, FoxO1 has been identified as a critical regulator of proglucagon gene
expression by insulin in pancreatic αTC1-9 cells (197). Recently, the Wnt/TCF-4 pathway was
shown to be involved in the regulation of proglucagon gene expression by insulin in
enteroendocrine cells (198). Furthermore, pathological levels of insulin were found to stimulate
intestinal proglucagon mRNA and GLP-1 production (199), in contrast to insulin’s known
inhibitory effect on proglucagon gene expression in pancreatic α-cells (200, 201). Although it is
known that the activators of cAMP/protein kinase A (PKA) pathway stimulate synthesis and
secretion of the PGDPs in the hypothalamus (202), and excitatory amino acid glutamate
stimulates PGDP secretion through a protein kinase C-dependent pathway (203), other internal
as well as external factors involved in regulating these neurons are not fully identified. At
present, the mechanisms involved in hypothalamic proglucagon gene regulation remain largely
unknown.
1.3.2 Role of PGDPs as appetite regulators
The appetite-related effects of PGDPs are well documented; particularly GLP-1, GLP-2
and oxyntomodulin are involved in inhibition of food intake (26, 204, 205). The actions of GLP-
1, GLP-2 and oxyntomodulin are exerted through receptors that belong to the family of 7-
transmembrane-spanning G-protein-coupled receptors, members of glucagon receptor
superfamily. GLP-1 and oxyntomodulin act via the GLP-1R, and GLP-2 specifically activates
the GLP-2R (206, 207).
GLP-1, GLP-2 and oxyntomodulin are mainly released from intestinal epithelial
endocrine L-cells in response to food intake. GLP-1 is inactivated by the ubiquitous enzyme
dipeptidyl peptidase-4 (DPP-4) in less than 2 minutes. Therefore, the long acting DPP-4 resistant
GLP-1R agonist exendin-4 has been developed (208). Acute administration of GLP-1 or
exendin-4 suppresses food intake inducing satiety, and chronic administration results in weight
loss (26, 209-211). GLP-2, similar to GLP-1, is also inactivated by DPP-4 thereby having a
relatively short biological half-life of approximately 7 minutes. Consequently, a degradation-

18
resistant analog (Gly2)GLP-2 (Teduglutide) is used in biomedical research (212). GLP-2
administration results in inhibition of gastric emptying and reduced intestinal motility (204).
Oxyntomodulin also reduces gastro-intestinal motiliy contributing to the “ileal brake” effect.
Acute central administration of oxyntomodulin inhibits food intake and reduces body weight in
rodents (205). Thus, it can be concluded that central GLP-1R and GLP-2R agonism constitutes a
potential pharmacological tool to reduce food intake and enhance energy expenditure.
1.3.3 Expression of PGDPs and their receptors in the hypothalamus
In the brain, proglucagon neurons are localized in the NTS and the hypothalamus (Figure
2B). The NTS preproglucagon neurons that process proglucagon to GLP-1, GLP-2 and
oxyntomodulin, project mainly to the two hypothalamic nuclei involved in appetite regulation -
the PVN and the DMH (213, 214). GLP-1-immunoreactive (ir) nerve fibres are densely located
in the ARC, PVN and DMH (215), whereas GLP-2-ir nerve fibers are found mainly in the
ventral part of the DMH and also in the ARC and PVN (214). The GLP-1R is widely expressed
in all hypothalamic areas receiving GLP-1-ir fibers i.e. the ARC, PVN and DMH nuclei and also
the VMH and LH (216, 217), but GLP-2R expression in the hypothalamus is much more limited
and confined to the DMH and VMH nuclei (214, 218). Thus, the localization of proglucagon-
neurons as well as GLP-1R- and GLP-2R-expressing neurons in the hypothalamus is very well
defined (Figure 2B); however, it is not yet completely known which PGDPs, whether centrally-
or peripherally-derived PGDPs, activate GLP-1R and GLP-2R in the hypothalamic nuclei that
regulate energy homeostasis. It has been demonstrated that GLP-1 and long-acting GLP-1R
agonist exendin-4, can cross BBB (219, 220), and it is possible that similar to GLP-1, GLP-2 can
also gain access to the brain from the periphery. However, it is a possibility that due to their
rapid inactivation by DPP-4, gut-derived GLP-1 and GLP-2 may not even cross the BBB, and
therefore only centrally-derived GLP-1 and GLP-2 are involved in their action on the
hypothalamus. Also it is yet to be confirmed whether differential distribution of GLP-1R and
GLP-2R in the hypothalamus is responsible for different roles played by central GLP-1 and
GLP-2 in appetite regulation and energy homeostasis.

19
A
B
3V
3V
LH LH
GLP-1R GLP-2R
ARC
VMH
DMH
PVN
LH
VMH
DMH
Proglucagon
Hypothalamus
NTS
Figure 2. A: The products of preproglucagon cleavage. GLP-1 and GLP-2, glucagon-like
peptides 1 and 2; GRPP, glicentin-related pancreatic peptide; IP-1 and IP-2, intervening peptides
1 and 2; MPGF, major proglucagon fragment; PC, prohormone convertase. B: Schematic
diagrams of the central regions showing gene expression of proglucagon and GLP-1
receptor (GLP-1R) and GLP-2R. ARC, arcuate nucleus; AP, area postrema; DMH,
dorsomedial hypothalamic nucleus; LH, lateral hypothalamus; NTS, nucleus tractus solitarius;
Pit, pituitary gland; PVN, paraventricular nucleus; 3V, third cerebral ventricle; VMH,
ventromedial hypothalamic nucleus.
20
1.3.4 Signaling pathways activated by GLP-1R and GLP-2R stimulation
The GLP-1R is expressed in GLP-1 responsive tissues, including pancreatic β-cells, the
gastrointestinal tract and the brain. GLP-1R is activated not only by GLP-1, but also by
oxyntomodulin to mediate its anorexigenic actions (221). GLP-1R activation is inhibited by
exendin-9–39, a known GLP-1R antagonist that blocks actions of GLP-1 and oxyntomodulin.
The signaling pathways triggered by GLP-1R activation in peripheral tissues have been
extensively studied (Figure 3). In the pancreatic β-cells, GLP-1R stimulation by GLP-1 activated
cAMP/PKA, exchange protein activated by cAMP (Epac), PI3K and mitogen-activated protein
kinase (MAPK) pathways (222-227). Oxyntomodulin also mimics many of the actions of GLP-1
on the islet β-cells. Similar to GLP-1, oxyntomodulin, via functional GLP-1R, activates cAMP
formation in murine islets and INS-1 cells (228).
GLP-2R expression is restricted to the gastrointestinal tract and the CNS, with limited
expression in other peripheral organs (229). GLP-2R recognizes specifically GLP-2 and is
inhibited by GLP-2(3-33). Complete information about GLP-2R activation is not available due to
the lack of cell models that endogenously express GLP-2R (230). In heterologous cell lines
transfected with rat or human GLP-2R, cAMP-dependent pathways are activated by GLP-2 (207,
231) (Figure 4). Recently GLP-2 has been shown to activate Akt in the intestinal epithelium
(232) and also the wnt/β-catenin signaling pathway in the intestinal crypt cells (233).
The signaling pathways activated by GLP-1R and GLP-2R stimulation in the CNS,
particularly in the hypothalamus are not well studied. The available majority of the data
highlighting the effects of GLP-1R and GLP-2R stimulation is based on studies performed in cell
lines derived from peripheral tissues. Until now, it is due to the lack of representative neuronal
cell models that the signal transduction pathways activated by GLP-1R and GLP-2R stimulation
in the hypothalamic neurons have not been studied completely. To address this issue, for the first
time, clonal, immortalized, hypothalamic, neuronal cell lines that endogenously express GLP-1R
and GLP-2R will be used as research models (18, 19, 234, 235). Recently, using these cell lines,
it was shown that GLP-1 regulates expression of hypothalamic insulin (234), however, regulation
of other neuropeptides by PGDPs remains largely unknown.
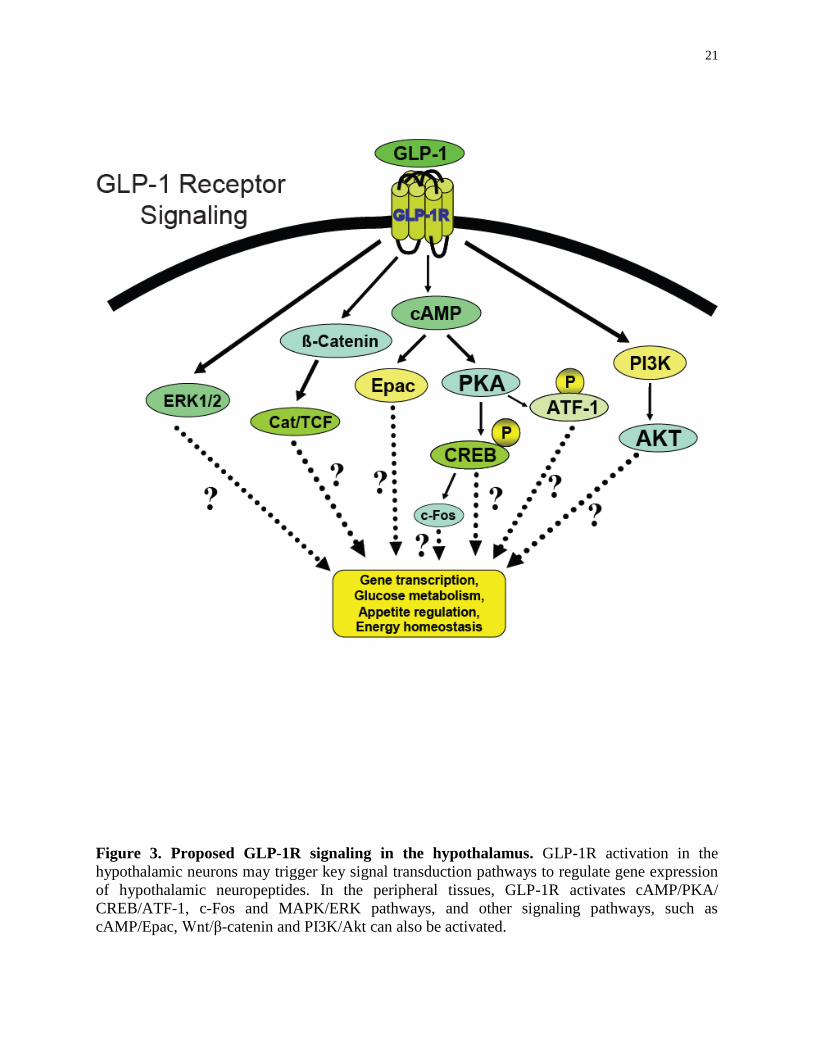
21
Figure 3. Proposed GLP-1R signaling in the hypothalamus. GLP-1R activation in the
hypothalamic neurons may trigger key signal transduction pathways to regulate gene expression
of hypothalamic neuropeptides. In the peripheral tissues, GLP-1R activates cAMP/PKA/
CREB/ATF-1, c-Fos and MAPK/ERK pathways, and other signaling pathways, such as
cAMP/Epac, Wnt/β-catenin and PI3K/Akt can also be activated.

22
Figure 4. Proposed GLP-2R signaling in the hypothalamus. GLP-2R activation in the
hypothalamic neurons may trigger key signal transduction pathways to regulate gene expression
of hypothalamic neuropeptides. In the peripheral tissues, GLP-2R activates cAMP/PKA/CREB
pathway, and other signaling pathways, such as Wnt/β-catenin, c-Fos and PI3K/Akt can also be
activated.
23
1.4 Insulin and insulin receptor signaling
1.4.1 Insulin
The discovery and isolation of insulin at the University of Toronto by Banting, Best,
Collip, and McLeod in the last century was one of the greatest events in the history of medicine.
Since then insulin has become the life-saving therapy for patients suffering from type 1 diabetes
and certain patients with type 2 diabetes (236). Insulin is a polypeptide hormone produced within
the β-cells of the islets of Langerhans. Insulin is generated from a 110-aa single chain
preprohormone, that is initially processed to proinsulin, through removal of 24 aa, then to the
mature 51 aa insulin and C-peptide through enzymatic cleavage by the prohormone convertases
PC1/3 and PC2, and carboxypeptidase E (237). Once mature insulin is synthesized, it is
packaged into granules that are secreted in response to glucose entry into β-cells. Higher glucose
metabolism in the β-cells increases cellular ATP that causes closing of ATP-sensitive potassium
channels, preventing potassium ion outflow, leading to membrane depolarization and calcium
influx via voltage dependent calcium channels (238). The increased cytosolic calcium leads to
exocytosis of the secretory granules, releasing insulin into circulation (239). The liver, skeletal
muscle and adipose tissue express insulin receptor (IR) and are the key peripheral targets of
insulin that mediate its anabolic actions (238).
1.4.2 Insulin receptor signaling
The key actions of insulin in peripheral tissues include increased glucose and amino acid
uptake, fatty acid synthesis, glycogen synthesis; and also decreased lipolysis, proteolysis, and
gluconeogenesis (238). Insulin action is mediated by a membrane receptor that belongs to the
tyrosine kinase receptor superfamily (240, 241). The IR protein is a heterotetrameric protein
composed of two 135 kDa alpha subunits that bind insulin and two 95 kDa beta subunits
containing the transmembrane and tyrosine kinase domains linked by disulfide bonds (242, 243).
Through alternative splicing of the primary transcript, the IR protein has two isoforms known as
the A and B isoforms (240, 241, 244). Isoform A lacks exon 11, which codes for a 12-aa
fragment near the C-terminal end of the α-chain (245), and differential expression of the two

24
isoforms allows for preferential activation of either the IR or insulin-like growth factor-1
receptor pathways (246). Only the IR isoform A is found in the brain (247).
It is well established that IRs are located in the hypothalamus (248, 249), and central
injection of insulin potently reduces food intake and body weight (250). Insulin exerts its central
effects predominantly through the PI3K pathway. The IR remains in an inactive dimerized state
when insulin is not bound (243). Insulin binding to the receptor causes autophosphorylation of
the tyrosine residues that allow docking of the insulin receptor substrate (IRS) family of proteins,
which mediate the IR signaling (251, 252). The IRS proteins are then activated through tyrosine
phosphorylation and can recruit PI3K to the cell membrane for its activation (253). Activation of
PI3K leads to the phosphorylation of membrane bound phosphatidylinositol-3,4-bisphosphate to
generate phosphatidylinositol-3,4,5-triphosphate (PIP3). The binding of PIP3 to the N-terminus
pleckstrin homology domain anchors Akt to the plasma membrane and allows its
phosphorylation and activation by phosphoinositide-dependent kinase-1. Activation of Akt can
then regulate numerous downstream signaling molecules in the periphery as well as in the CNS
(254, 255). Insulin action in the CNS is mediated via modulation of neuropeptide transcription
and release (256). Although IRS1 and IRS2, are often linked to the PI3K-Akt pathway, which is
responsible for the most of the metabolic actions of insulin, the MAPK pathway, works in
conjunction with the PI3K pathway to control cell proliferation, apoptosis and differentiation
(257, 258). Among multiple signalling pathways activated by insulin, the PI3K-Akt pathway
remains the main focus in central nervous system studies. Several investigations have
demonstrated that insulin activates PI3K in neurons (259, 260), and that PI3K inhibitors can
block the ability of insulin to regulate food intake (260).
1.4.3 Insulin regulation of proglucagon
The regulatory mechanisms underlying the differential and opposite actions of insulin on
the pancreatic and intestinal proglucagon gene expression have been extensively investigated
(185). It was demonstrated that insulin inhibited islet proglucagon gene expression via regulation
of gene transcription (200, 201), but another study found that proglucagon gene expression was
insensitive to changes in plasma glucose and insulin concentrations, however, hyperinsulinemia
in the presence of hyperglycemia lowered glucagon secretion from pancreatic α-cells (261).

25
Further, it was found that Akt was sufficient to mimic the inhibitory effect of insulin on
proglucagon expression in the pancreatic α-cells (262). Insulin may inhibit pancreatic
proglucagon by causing exit of FoxO1 from the nucleus to the cytoplasm (197). The repression
of proglucagon is physiologically important because it may result in decreased production of
glucagon, the major counter-regulatory hormone of insulin secreted by islet α-cells. In contrast to
inhibitory effect of insulin on proglucagon expression in pancreatic α-cells (200, 201),
pathological levels of insulin stimulate intestinal proglucagon mRNA and GLP-1 production via
activation of the bipartite transcription factor β-catenin/T cell factor, the major effector of the
canonical Wnt signaling pathway (199). Additionally, in the MKR mice, a non-obese model of
chronic insulin resistance and hyperinsulinemia, intestinal proglucagon mRNA expression and
GLP-1 content were found to be significantly increased (199). A recent finding indicated that
insulin stimulated GLP-1 secretion from the intestinal L-cells in a glucose-dependent manner
(263). Furthermore, similar to the proglucagon gene transcription in pancreatic α-cells, insulin
was demonstrated to utilize the same cis- and trans-regulatory elements in stimulating intestinal
proglucagon expression in the intestinal L-cells, supporting the existence of crosstalk between
insulin and Wnt signaling pathways (199). In the pancreatic α-cells, the repressive effect of
insulin on proglucagon gene expression relies on Akt activity (262), however, in the intestinal L
cells, it is likely that the Wnt signaling pathway, but not the Akt pathway (Akt-independent
mechanism), is involved in insulin-stimulated proglucagon promoter transcription (199).
Recently, it was found that Epac is involved in cAMP-stimulated proglucagon expression and
hormone production in pancreatic and intestinal endocrine cells thus demonstrating the PKA-
independent regulation of proglucagon in the peripheral tissues (264, 265). Currently, no studies
have been conducted to elucidate how insulin regulates hypothalamic proglucagon and the
underlying mechanisms.
1.5 Leptin and leptin receptor signaling
1.5.1 Leptin
Leptin is secreted by adipocytes and was cloned from the ob (leptin) gene in 1994 by
Friedman and his colleagues (17). Leptin is essential to maintain physiological energy
homeostasis. Knockout mice with mutations in the ob gene or db (leptin receptor) gene are

26
morbidly obese. Further, congenital leptin deficiency is associated with severe early-onset
obesity in humans (266). Administration of leptin to leptin deficient ob/ob mice and humans
normalizes body weight and neuroendocrine status (39, 267, 268), indicating the importance of
leptin in energy homeostasis. Leptin plasma concentrations are directly proportional to adiposity
levels and therefore it is known as an adiposity signal (269, 270). Although leptin does not exert
any demonstrable effect on energy metabolism in non-obese humans (271), recent studies
involving leptin administration to humans support its critical role in regulating neuroendocrine
and immune functions as well as insulin resistance in states of energy deficit (272).
The gene for the leptin receptor (Ob-R) is encoded by the db gene and is spliced into
several receptor isoforms. There is one long leptin receptor isoform: Ob-Rb, and several shorter
isoforms spliced at the C-terminal coding region: Ob-Ra, Ob-Rc, Ob-Rd, Ob-Re and Ob-Rf
(273-278). All of the leptin receptor isoforms have an extracellular leptin-binding domain, but
only Ob-Rb has a full-length intracellular domain required for signal transduction (269, 276). It
is well established that leptin receptors are located in the CNS, and within the rodent and human
hypothalamus, Ob-Rb, is highly expressed in the ARC, DMH, VMH, and is also detected in the
hypothalamic PeV, LH and PVN (273-275, 279). In the ARC, Ob-Rb is predominately expressed
in the NPY/AgRP and POMC neurons (43, 273, 280). Leptin gains access to the brain by
crossing the BBB via a saturable transport mechanism (281). It is known that leptin regulates
feeding and energy balance through interaction with complex neuronal circuits comprised of
anorexigenic and orexigenic neuropeptides. Central administration of leptin potently reduces
food intake and body weight in rhesus macaque (282). Lack of functional leptin receptors or
signaling in mice results in severe obesity (283, 284), while brain administration of leptin to
ob/ob mice can overturn the obese phenotype (37, 39, 267). These and other findings indicate
that leptin action within the hypothalamus via NPY/AgRP and POMC neurons is integral to the
maintenance of energy homeostasis (37, 285, 286).
1.5.2 Leptin receptor signaling
Leptin receptors belong to the class 1 cytokine receptor family that utilizes several
cytosolic signaling proteins to induce changes in gene transcription and metabolism (287).
Leptin activation of Ob-Rb predominantly triggers the janus kinase 2 (JAK2)/signal transducer
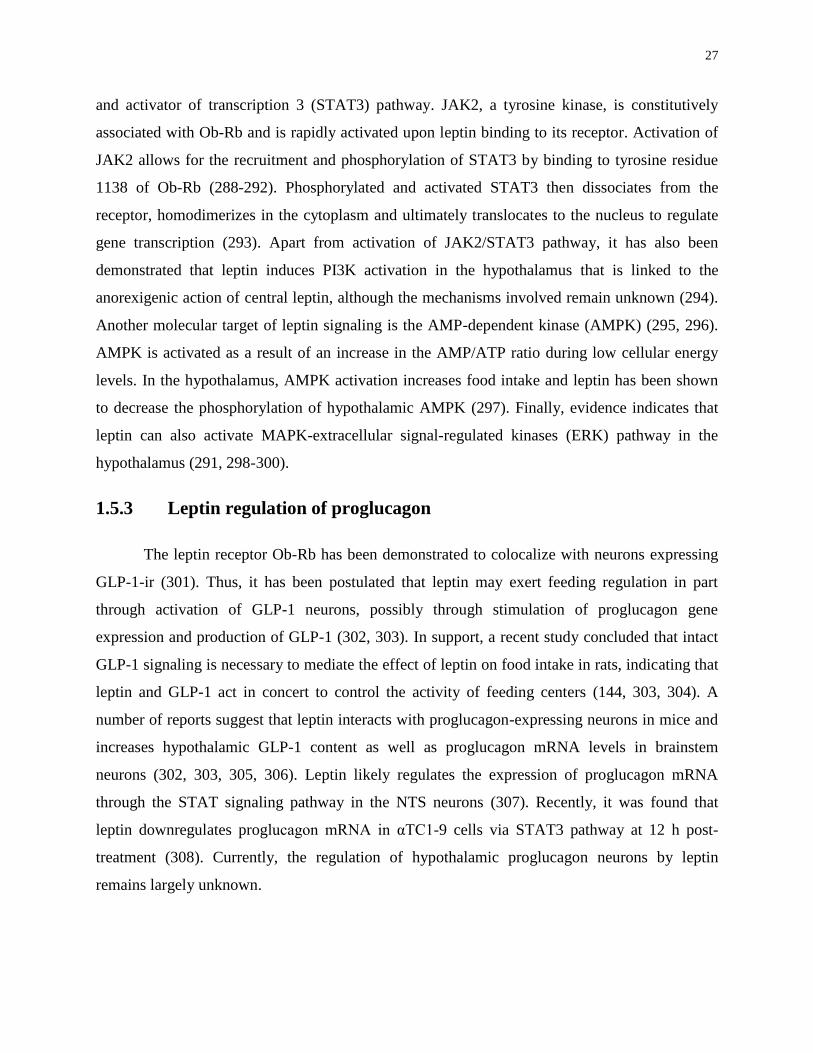
27
and activator of transcription 3 (STAT3) pathway. JAK2, a tyrosine kinase, is constitutively
associated with Ob-Rb and is rapidly activated upon leptin binding to its receptor. Activation of
JAK2 allows for the recruitment and phosphorylation of STAT3 by binding to tyrosine residue
1138 of Ob-Rb (288-292). Phosphorylated and activated STAT3 then dissociates from the
receptor, homodimerizes in the cytoplasm and ultimately translocates to the nucleus to regulate
gene transcription (293). Apart from activation of JAK2/STAT3 pathway, it has also been
demonstrated that leptin induces PI3K activation in the hypothalamus that is linked to the
anorexigenic action of central leptin, although the mechanisms involved remain unknown (294).
Another molecular target of leptin signaling is the AMP-dependent kinase (AMPK) (295, 296).
AMPK is activated as a result of an increase in the AMP/ATP ratio during low cellular energy
levels. In the hypothalamus, AMPK activation increases food intake and leptin has been shown
to decrease the phosphorylation of hypothalamic AMPK (297). Finally, evidence indicates that
leptin can also activate MAPK-extracellular signal-regulated kinases (ERK) pathway in the
hypothalamus (291, 298-300).
1.5.3 Leptin regulation of proglucagon
The leptin receptor Ob-Rb has been demonstrated to colocalize with neurons expressing
GLP-1-ir (301). Thus, it has been postulated that leptin may exert feeding regulation in part
through activation of GLP-1 neurons, possibly through stimulation of proglucagon gene
expression and production of GLP-1 (302, 303). In support, a recent study concluded that intact
GLP-1 signaling is necessary to mediate the effect of leptin on food intake in rats, indicating that
leptin and GLP-1 act in concert to control the activity of feeding centers (144, 303, 304). A
number of reports suggest that leptin interacts with proglucagon-expressing neurons in mice and
increases hypothalamic GLP-1 content as well as proglucagon mRNA levels in brainstem
neurons (302, 303, 305, 306). Leptin likely regulates the expression of proglucagon mRNA
through the STAT signaling pathway in the NTS neurons (307). Recently, it was found that
leptin downregulates proglucagon mRNA in αTC1-9 cells via STAT3 pathway at 12 h post-
treatment (308). Currently, the regulation of hypothalamic proglucagon neurons by leptin
remains largely unknown.
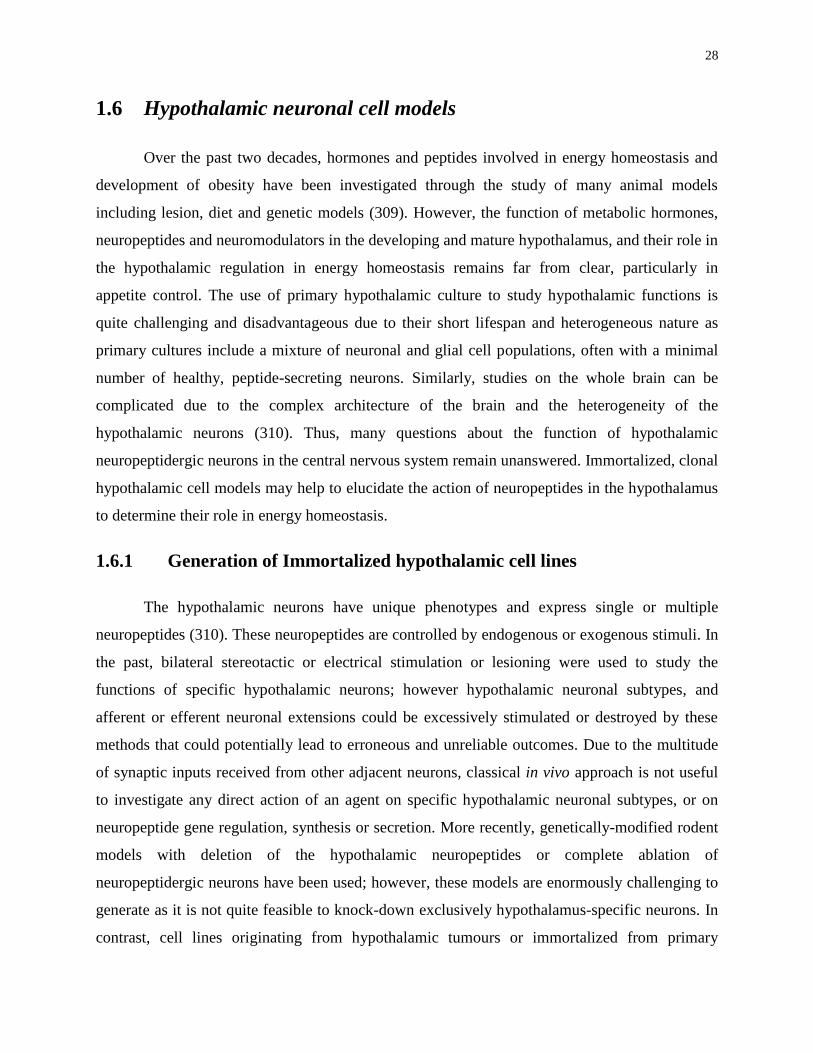
28
1.6 Hypothalamic neuronal cell models
Over the past two decades, hormones and peptides involved in energy homeostasis and
development of obesity have been investigated through the study of many animal models
including lesion, diet and genetic models (309). However, the function of metabolic hormones,
neuropeptides and neuromodulators in the developing and mature hypothalamus, and their role in
the hypothalamic regulation in energy homeostasis remains far from clear, particularly in
appetite control. The use of primary hypothalamic culture to study hypothalamic functions is
quite challenging and disadvantageous due to their short lifespan and heterogeneous nature as
primary cultures include a mixture of neuronal and glial cell populations, often with a minimal
number of healthy, peptide-secreting neurons. Similarly, studies on the whole brain can be
complicated due to the complex architecture of the brain and the heterogeneity of the
hypothalamic neurons (310). Thus, many questions about the function of hypothalamic
neuropeptidergic neurons in the central nervous system remain unanswered. Immortalized, clonal
hypothalamic cell models may help to elucidate the action of neuropeptides in the hypothalamus
to determine their role in energy homeostasis.
1.6.1 Generation of Immortalized hypothalamic cell lines
The hypothalamic neurons have unique phenotypes and express single or multiple
neuropeptides (310). These neuropeptides are controlled by endogenous or exogenous stimuli. In
the past, bilateral stereotactic or electrical stimulation or lesioning were used to study the
functions of specific hypothalamic neurons; however hypothalamic neuronal subtypes, and
afferent or efferent neuronal extensions could be excessively stimulated or destroyed by these
methods that could potentially lead to erroneous and unreliable outcomes. Due to the multitude
of synaptic inputs received from other adjacent neurons, classical in vivo approach is not useful
to investigate any direct action of an agent on specific hypothalamic neuronal subtypes, or on
neuropeptide gene regulation, synthesis or secretion. More recently, genetically-modified rodent
models with deletion of the hypothalamic neuropeptides or complete ablation of
neuropeptidergic neurons have been used; however, these models are enormously challenging to
generate as it is not quite feasible to knock-down exclusively hypothalamus-specific neurons. In
contrast, cell lines originating from hypothalamic tumours or immortalized from primary
29
hypothalamic cultures, represent a simpler model that lacks the complex network of neuronal
inputs, multitude of connections and signalling, and makes it feasible to investigate those areas
found to be challenging to investigate in vivo.
Immortalized cell lines can be homogeneous, clonal population of specific neuronal
subtypes and can be maintained in a regulated environment with fewer unregulated variables
present in animal models that may interfere with the direct action of the chemicals under
investigation. Cell models can therefore be used to investigate regulation of specific genes or
proteins, which is challenging to perform in vivo due to the numerous neuronal phenotypes
present in a given hypothalamic area. To circumvent challenging issues with the contemporary
experimental models, scientists have tried to generate immortalized cell models with moderate
success (311-313). Using the retroviral transfer of simian virus (SV) 40-T-Antigen (18, 313), our
laboratory has successfully generated an array of immortalized cell models from the mouse
hypothalamus (18, 313). Many of these clonal cell models express specific neuropeptides and
receptors, and have been extensively used in biomedical research [reviewed in (235, 314-316)].
1.6.2 Immortalized embryonic hypothalamic cell lines, mHypoE-XX
Historically, there have been unsuccessful attempts to generate hypothalamic cell lines
(317, 318). The lack of representative neuronal cell models encouraged our research laboratory
to generate embryonic, clonal hypothalamic mouse cell lines (18). We utilized the retroviral
SV40-T-Antigen transfer technique to immortalize primary hypothalamic cultures obtained from
fetal mice on E15, E17 and E18 and generated a heterogeneous mixed population of neurons.
These mixed neuronal cultures were further subcloned to obtain several single, homogeneous,
clonal cell populations. These cell models are designated as mHypoE-‘clone number’ (mouse,
hypothalamic, embryonic – ‘clone number’) to distinguish them from other newly created cell
lines and to avoid any confusion. Each cell line, out of over 60 cell models, exhibits a distinct
neuronal phenotype, although all of the cell models commonly express mature neuronal markers
such as neuron-specific enolase and neurofilament, but not neuroglia-specific glial fibrillary
acidic protein. The cells also possess markers of the neurosecretory machinery, such as syntaxin,
a large number of neurosecretory granules and exhibit an intracellular calcium response after
depolarization by potassium chloride (18). These cell lines endogenously express hormone
30
receptors and neuropeptides involved in many hypothalamic functions. These cell lines have
been used as representative neuronal models to dissect complex cellular signaling mechanisms
involved in hypothalamic control of physiological processes [reviewed in (235, 314-316) ].
1.6.3 Immortalized adult hypothalamic cell lines, mHypoA-XX
The embryonic hypothalamic models provide a useful tool in understanding cellular
biology of specific neuroendocrine neurons, however, it is imperative to known how the
embryonic neurons differ from the adult neurons in their functions under normal and
pathological circumstances. Historically, immortalization of adult hypothalamic neurons
appeared to be impossible due to their fully differentiated, non-proliferating nature. Thus, only
proliferating cells such as embryonic neurons could be immortalized using SV40-T-antigen
transfer (312, 313). Recent findings indicate that neurogenesis occurs throughout the
hypothalamus at low levels and is not restricted to a specific neuronal phenotype or nuclei in the
CNS (319-324). A significant finding by Kokoeva et al. that ciliary neurotrophic factor (CNTF)
induces de novo neurogenesis in the hypothalamus enabled us to devise a novel method to
immortalize primary hypothalamic culture (19). Our laboratory used CNTF to induce adult
neuronal proliferation and successfully immortalized adult mouse hypothalamic neurons (235,
314, 315, 319). So far, we have generated over 50 cell lines from adult mice and labelled them as
mHypoA-‘clone number’ (mouse, hypothalamic, adult-‘clone number’).
1.7 Rationale, Hypotheses and Specific Aims
1.7.1 Rationale
At present, the mechanisms underlying proglucagon gene expression in pancreas and
intestine have been extensively studied (185), however the regulation of the hypothalamic
proglucagon by insulin or leptin remains unstudied (Figure 5). It has been demonstrated that in
the periphery as well as in the CNS, insulin mainly acts via classic PI3K/Akt pathway and leptin
activates classic JAK2/STAT3 pathway. Currently, it remains unknown, whether both hormones
utilize the same or different signaling pathways to regulate proglucagon mRNA levels in the
hypothalamic neurons. Therefore, in the first part of the present thesis, we investigated whether

31
hypothalamic proglucagon mRNA transcript expression is regulated by insulin in an Akt-
dependent manner, and by leptin via activation of JAK2/STAT3 pathway.
The exact mechanisms of action of GLP-1 and GLP-2 in the hypothalamus are not
completely clear; particularly regulation of hypothalamic neuropeptides by GLP-1R and GLP-2R
activation needs further attention (Figure 6). Even more importantly, this area needs to be
thoroughly investigated as drugs preventing GLP-1 inactivation and agonists of GLP-1R or GLP-
2R are already approved for clinical use or undergoing clinical trials for metabolic or
inflammatory disorders (325, 326). It is known that GLP-1R and GLP-2R agonists activate
classic cAMP/PKA pathway among several other pathways in the periphery and in the brainstem
neurons (Figures 3 and 4) (327), however, the signaling pathways activated by GLP-1R and
GLP-2R agonists in the hypothalamic neuropeptidergic neurons remain unknown. Therefore, in
the second part of this thesis, we investigated whether hypothalamic neuropeptides are regulated
by GLP-1R and GLP-2R agonists via activation of cAMP/PKA pathway. We focused on the
regulation of hypothalamic neurotensin and ghrelin, because, in contrast to the extensively
investigated NPY- and POMC-mediated regulation of energy homeostasis, these neuropeptides
have received relatively little attention, despite their potential role in the hypothalamic regulation
of feeding and energy homeostasis (6, 139, 141-143, 153, 155).
Many questions about the regulation and action of GLPs in the CNS remain unanswered
due to the lack of representative neuronal experimental models. Recently generated embryonic
and adult immortalized, clonal, hypothalamic mouse cell lines, endogenously expressing
proglucagon and functional GLP-1R and GLP-2R, will serve as relevant neuronal models to
investigate regulation and potential action of GLPs in the hypothalamus. Initially, using these
novel murine hypothalamic cell models, insulin- and leptin-mediated regulation of the
hypothalamic proglucagon-expressing neurons was studied. Subsequently, the effects of
exendin-4 and h(Gly2)GLP-2[1-33] on the hypothalamic neuropeptides that have remained
elusive until now were investigated. Dissecting the mechanisms underlying proglucagon gene
regulation and the effects of GLP-1R and GLP-2R activation on hypothalamic neuropeptides,
such as neurotensin and ghrelin, will lead to a better understanding of the role of proglucagon
gene and GLPs in hypothalamic control of many vital functions, including appetite regulation

32
and energy homeostasis. In the long run, these findings should facilitate the development of safe
and effective drugs for the treatment of metabolic or inflammatory disorders, including obesity.
1.7.2 Hypotheses
The first hypothesis is that hypothalamic proglucagon mRNA transcript expression is
upregulated by insulin in an Akt-dependent manner, and by leptin via activation of JAK2/STAT3
pathway in the hypothalamic proglucagon-expressing neuronal cell models (Figure 5).
The second hypothesis is that long-acting GLP-1R agonist exendin-4 and GLP-2R
agonist h(Gly2)GLP-2[1-33] upregulate hypothalamic anorexigenic neurotensin and
downregulate orexigenic ghrelin mRNA expression in a PKA-dependent manner in the
hypothalamic GLP-1R and -2R-expressing neuronal cell models (Figure 6).
1.7.3 Specific aims
The hypotheses were examined in three aims:
Aim 1: To study the regulation of proglucagon mRNA expression by insulin and leptin using
hypothalamic proglucagon-, IR- and ObRb-expressing neuronal cell models.
Western blot analysis was performed to study activation of signal-transduction pathways,
real-time qRT-PCR to detect changes in mRNA expression, and transfection of proglucagon
promoter-reporter constructs to determine regulation of gene transcription.
Aim 2: To determine potential neuropeptidergic neurons activated by exendin-4 in the mouse
hypothalamus [by immunohistochemistry (IHC)] and to investigate downstream signal
transduction pathways activated by exendin-4 to regulate neurotensin and ghrelin mRNA
expression in the hypothalamic GLP-1R-expressing neuronal cell models (by Western blot and
real-time qRT-PCR analysis).
Aim 3: To study the actions of h(Gly2)GLP-2 on potential downstream neuropeptidergic neurons
in vivo using mouse model (by IHC) and investigate downstream signal transduction pathways
involved in regulation of neurotensin and ghrelin mRNA in the hypothalamic GLP-2R-
expressing neuronal cell model (by Western blot and real-time qRT-PCR analysis).

33
Figure 5. Schematic of the proposed regulation of proglucagon-expressing (GLU) neurons
by insulin and leptin in the hypothalamus. The first hypothesis is that insulin and leptin
directly, via activation of specific signaling pathways, regulate proglucagon-expressing neurons
located in the hypothalamic nuclei involved in energy homeostasis. This regulation itself, as well
as further activation of second-order neurons via GLP-1 or GLP-2 action may lead to a decrease
in food intake and an increase in energy expenditure.
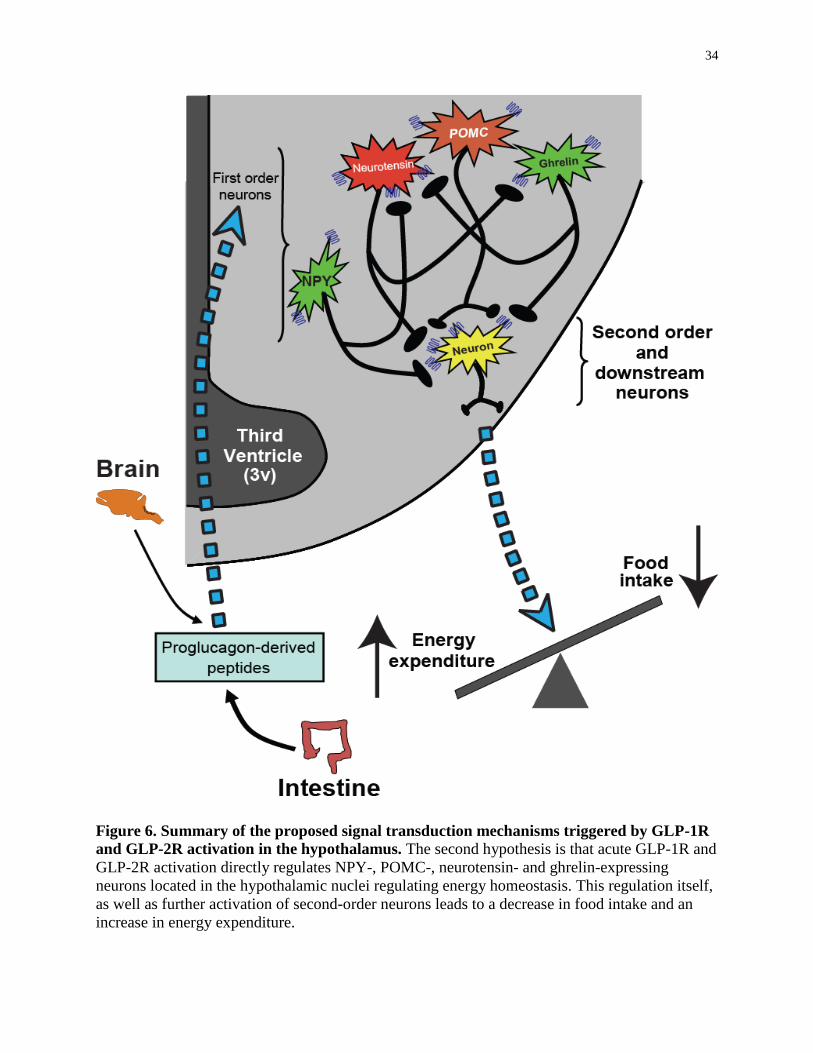
34
Figure 6. Summary of the proposed signal transduction mechanisms triggered by GLP-1R
and GLP-2R activation in the hypothalamus. The second hypothesis is that acute GLP-1R and
GLP-2R activation directly regulates NPY-, POMC-, neurotensin- and ghrelin-expressing
neurons located in the hypothalamic nuclei regulating energy homeostasis. This regulation itself,
as well as further activation of second-order neurons leads to a decrease in food intake and an
increase in energy expenditure.

35
Chapter 2
Materials and Methods

36
2 Materials and Methods
2.1 Cell culture and reagents
Immortalized neuronal cells (mHypoA-2/10, mHypoA-2/30, mHypoE-36/1, and
mHypoE-39) were grown in monolayer in Dulbecco’s modified Eagle medium (DMEM, Sigma,
Canada), supplemented with 4.5 mg/ml glucose, 5% fetal bovine serum (Hyclone Laboratories,
USA), and 1% penicillin/streptomycin (Gibco, Canada), and maintained at 37°C in an
atmosphere of 5% CO2 (18). For the mRNA expression study, cell culture medium was replaced
with DMEM containing 0.5% fetal bovine serum (FBS) and 1% penicillin/streptomycin for a
minimum of 12 h prior to treatments. For the protein expression study, cell culture medium was
replaced with FBS-free DMEM containing 1% penicillin/streptomycin for a minimum of 12 h
prior to treatments. Insulin was a generous gift from Novo Nordisk Canada Inc. (Mississauga,
ON, Canada). Recombinant murine leptin was obtained from Dr. A. F. Parlow, National
Hormone and Peptide Program, Torrance, CA. Exendin-4, GLP-2(1-33) and h(Gly2)GLP-2 were
purchased from American Peptide, USA. 3-isobutyl -1-methylxanthine (IBMX), actinomycin D,
wortmannin, LY 294002 hydrochloride, cucurbitacin I and SD 1008 were obtained from Tocris
Bioscience, USA. Forskolin and 5, 6-Dichlorobenzimidazole 1-β-D-ribofuranoside (DRB), an
inhibitor of transcription, were purchased from Sigma-Aldrich, Canada. The protein kinase A
(PKA) inhibitor H89 was the product of Calbiochem (EMD Biosciences), San Diego, CA or
Tocris Bioscience, USA. Expression vectors pGL2 and pRL-CMV were purchased from
Promega (Madison, WI). The G protein beta (Gβ) antibody was purchased from Santa Cruz
Biotechnology (Santa Cruz, CA). Antibodies against total Akt, phospho-Akt, total STAT3,
phospho-STAT3, total CREB, phospho CREB/ATF-1, c-Fos (for Western blot analysis) and
secondary antibodies were obtained from Cell Signaling Technology Inc. (Danvers, MA, USA).
2.2 One-step reverse transcriptase-polymerase chain reaction (RT-
PCR)
One-step RT-PCR was carried out to screen the cells for proglucagon, ghrelin,
neurotensin, NPY, POMC, IR, ObRb, GLP-1R and GLP-2R mRNA transcripts using One-Step

37
RT-PCR Kit (Qiagen, Mississauga, ON). The primer pairs used for the RT-PCR were designed
using mouse sequences in GenBank to span introns to minimize the possibility of genomic DNA
contamination. The primer pairs used are as follows: IR-F: 5’-gtgataccagagcataggag-3’, IR-R:
5’-ctgttcggaacctgatgac-3’; Ob-Rb-F: 5’-atgacgcagtgtactgctg-3’, Ob-Rb-R: 5’-
gtggcgagtcaagtgaacct-3’, NPY-F: 5’-taggtaacaagcgaatgggg-3’, NPY-R: 5’-acatggaagggtcttcaagc-
3’, -actin-F: 5’-gctccggcatgtgca-3’, -actin-R: 5’-aggatcttcatgaggtagt-3’, Proglucagon-F: 5’-
tgaagaccatttactttgtggct-3’, Proglucagon-R: 5’-tggtggcaagattgtccagaat-3’ (328), Ghrelin-F: 5’-
agcatgctctggatggacatg-3’, Ghrelin-R: 5’-aggcctgtccgtggttacttgt-3’, Neurotensin-F: 5’-
ataggaatgaaccttcagctg-3’, Neurotensin-R: 5’-gtaggaggccctcttgagtat-3’, POMC-F: 5’-
atgccgagattctgctacagtcg-3’, POMC-R: 5’-ttcatctccgttgccaggaaacac-3’, GLP-1R-F: 5’-
tttgatgactatgcctgctgg-3’, GLP-1R-R: 5’-agcccatcccactggtgtt-3’, GLP-2R-S: 5’-
tgctggtttccatcaagcaa-3’, GLP-2R-AS: 5’- atcagctgcaaggtggacaa-3’, Histone-F: 5’-
gcaagagtgcgccctctactg-3’, Histone-R: 5’-ggcctcacttgcctcgtgcaa-3’.
Total RNA was isolated from the immortalized hypothalamic cells, 3T3, α-TC and
GluTag cells using the guanidinium thiocyanate phenol chloroform extraction method (329). One
step RT-PCR was performed using the one step RT-PCR kit. Briefly, total 200 ng of RNA was
used from all samples with 1X one step RT-PCR buffer, one step enzyme mix, 0.4 mM dNTPs,
0.6 mM of sense primer and 0.6 mM of anti-sense primer in a final volume of 25 μL. The RT
protocol used for all genes was 50°C for 30 min, 95°C for 15 min, followed by amplification at
95°C for 15 s, 60°C for 15 s and 72°C for 1 min for 40 cycles with final incubation for 7 min at
72°C. All PCR-amplified products were visualized on 2% agarose gel containing ethidium
bromide under ultraviolet light with the Kodak IS2000 digital imaging centre. The PCR
amplicons were verified by purification and sequencing (The Centre for Applied Genomics,
Toronto, Canada).
2.3 Radioimmunoassay for cAMP analysis
The mHypoA-2/30 and mHypoE-36/1 cells were split into 24-well plates until 80% to
90% confluent. After overnight incubation in serum-free DMEM, cells were washed twice with
1X phosphate buffered saline (PBS) and pretreated for 5 minutes with vehicle, 1 µM exendin-9-
39 (a GLP-1R antagonist) or GLP-2 (3-33) (a GLP-2R antagonist) alone prior to a 10-minute

38
treatment with vehicle, forskolin (1 or 10 µM), exendin-4 (10 or 50 nM), GLP-2 (10 or 50 nM)
or h(Gly2)GLP-2 (10 nM) and incubated at 37 °C.
All drugs including vehicle were diluted in OptiMEM (Invitrogen Life Technologies,
ON) containing 100 mM IBMX, a competitive nonselective phosphodiesterase inhibitor that
promotes accumulation of intracellular cAMP. Forskolin was used as a positive control. After
incubation at 37 °C, 1 ml anhydrous ethanol at -20°C (final concentration, 77% ethanol) was
added to the cells to terminate the reaction. The plates were allowed to sit at -20°C for 24 hours.
The extracts were collected, centrifuged and the supernatant was analyzed for cAMP content by
using cAMP-RIA kit (Biomedical Technologies Inc., USA). cAMP levels were calculated
relative to total amount of protein, as determined by the bicinchoninic acid (BCA) protein assay
kit (Thermo Scientific, IL, USA).
2.4 Quantitative reverse transcription-polymerase chain reaction
(qRT-PCR)
The mHypoA-2/10 and mHypoE-39 cells were treated with vehicle, insulin (10 nM) or
leptin (10 nM), and harvested at the indicated time points. The mHypoA-2/30 and mHypoE-36/1
cells were harvested at the indicated time points following treatment with vehicle, exendin-4 (10
nM) or h(Gly2)GLP-2 (10 nM) over 24 h time period. For the regulation of gene expression
study, long-acting GLP-2, h(Gly2)GLP-2, was used. The EC50 of h(Gly
2)GLP-2 for mouse GLP-
2R is identical to that of rat GLP-2 for both the rat GLP-2R and hGLP-2R, suggesting a high
degree of similarity between their biological actions in different species (328). For the
experiments using inhibitors, the cells were pre-treated with either 25 µM LY294002, 1 µM
wortmannin, 5 µM cucurbitacin I, 10 µM SD1008, 1 μM PKI 14-22 amide, 5 μM H89, 10 µg/ml
actinomycin D, 60 µM DRB or dimethyl sulfoxide (DMSO) vehicle for 45 min to 1 h, and then
treated with either insulin (10 nM), leptin (10 nM), exendin-4 (10 nM) or h(Gly2)GLP-2 (10
nM) prior to total RNA isolation at the indicated time points.
Total RNA from the cells was isolated using guanidinium thiocyanate-phenol-chloroform
extraction method (329), and real-time qRT-PCR was performed with 2.0 µg of total RNA using
using SuperScript II and random primer as described in the Superscript II cDNA Synthesis Kit

39
(Invitrogen). Real-time qRT-PCR was performed with SYBR green PCR master mix according
to the manufacturer’s instructions (Applied Biosystems Inc., Streetsville, Ontario, Canada), and
run on the Applied Biosystems Prism 7000 real-time PCR machine (19). Total 200 ng of
template was used in total 10 µl reaction mixture containing 0.3X SYBR green dye, 1X ROX,
1X buffer, 3 mM MgCl2, 0.2 mM dNTP, and 0.5U Platinum Taq (all from Invitrogen Life
Technologies, Burlington, ON). The real-time qRT-PCR conditions for all genes were as
follows: 45 cycles, 15 sec at 95°C and 1 min at 65°C.
The gene primer sequences were purchased from Integrated DNA Technologies
(Coralville, IA) and are as follows: -actin-SYBR-F: 5'-cttccccacgccatcttg-3', -actin-SYBR-R:
5'-cccgttcagtcaggatcttcat-3', proglucagon-SYBR-F: 5’-gaggagaaccccagatcattcc-3’, proglucagon-
SYBR-R: 5’-gtggcgtttgtcttcattcatc-3’, ghrelin-SYBR-F: 5’-ggaggagctggagatcaggtt-3’, ghrelin-
SYBR-R: 5’-ggcccggccatgctgct-3’ (Primer Express software, Applied Biosystems). TaqMan
Gene Expression assay containing neurotensin-specific primers and probe (Applied Biosystems)
was used to determine neurotensin mRNA expression levels.
Data were represented as Ct values, defined as the threshold cycle of PCR at which
amplified product was first detected, and analyzed using ABI Prism 7000 SDS software package
(Applied Biosystems). Samples were run in triplicate and average Ct was analyzed. Copy
number of amplified proglucagon, ghrelin or neurotensin gene was standardized to -actin using
the standard curve method (ABI Prism 7000 Users Bulletin). The final fold differences in
mRNA expression were relative to the corresponding time-matched control.
2.5 SDS-polyacrylamide gel electrophoresis and western blot analysis
The hypothalamic cells were grown to 80-90% confluency and serum-starved overnight.
The mHypoA-2/10 and mHypoE-39 cells were treated with either vehicle, insulin (10 nM),
leptin (10 nM) over a 60 minute time course. The mHypoA-2/30 and mHypoE-36/1 cells were
treated with either vehicle, exendin-4 (10 nM) or h(Gly2)GLP-2 (10 nM) over a 6 h time course.
The cells were harvested at the indicated time points, and total protein was isolated using a 1X
lysis buffer [20 mM Tris-HCl (pH 7.5), 150 mM NaCl, 1 mM Na2EDTA, 1 mM EGTA, 1%
Triton, 2.5 mM sodium pyrophosphate, 1 mM β-glycerophosphate, 1 mM Na3VO4, 1 μg/ml

40
leupeptin] supplemented with 1mM PMSF as described previously (141). Protein concentration
was determined using the BCA protein assay kit (Thermo Scientific, IL, USA). Total protein (20
µg) was resolved on 8% SDS-PAGE gels and blotted onto Immun-Blot polyvinyl difluoride
membrane (Bio-Rad, CA, USA). The blots were blocked with 5% bovine serum albumin in tris-
buffered saline with 0.1% Tween-20 for 1 h, and then incubated overnight at 4ºC with rabbit
polyclonal anti-mouse primary antibodies against phospho-Akt (Ser473, 1:1000), phospho-
STAT3 (Tyr705, 1:1000), total Akt (1:1000), total STAT3 (1:1000), Phospho-CREB (Ser133,
1:500), total CREB (1:500), c-Fos (1:500) and Gβ (1:1000). Following incubation with
horseradish peroxidase-labeled secondary goat anti-rabbit IgG at a 1:5000 dilution for 1 h,
enhanced chemiluminescence (ECL Advance kit; GE Healthcare, USA) was added and the
immunoreactive bands were visualized using Kodak IS2000 digital imaging system. The
intensity of bands was quantified by densitometry analysis using Kodak 1D Image Analysis
Software 3.6 (Eastman Kodak Company, Rochester, NY, USA). For the inhibitor experiments,
the mHypoA-2/10 and mHypoE-39 cells were pre-treated with either 25 µM LY294002, 1 µM
wortmannin, 5 µM cucurbitacin I, 10 µM SD1008, or DMSO for 1 h, and then treated with 10
nM insulin or leptin for 15 min.
2.6 Reporter gene plasmids
Reporter constructs based on the pGL2 vector were constructed by transferring the inserts
from the reporter gene plasmids based on the pGL3 vector containing 312 and 476 bases of the
rat proglucagon promoter and human proglucagon promoter constructs containing 332 and 602
bases that have previously been described (330). Human proglucagon promoter construct
containing 829 bases of promoter was generated using a PCR based strategy as previously
described (330), for which the following human proglucagon gene primers were used (the
numbers in the names of primers identify the location of the 5' end of each primer relative to the
mRNA start site): -829F: 5’-gcgggtaccgcctgtgtgtccagtcacaaaac-3’, and +58R: 5’-
gcaagcttagagcaagccctctttgggaac-3’.

41
2.7 Transient transfections
The mouse hypothalamic mHypoE-39 and mhypoE-20/2 cell lines were grown in 24-well
plates in DMEM without antibiotics and supplemented with 4.5 mg/ml glucose and 5% fetal
bovine serum to 70-80% confluency. Prior to the transfection, the medium was changed to
medium with reduced serum (OptiMEM). The luciferase reporter gene constructs were
transfected into the cell lines using Lipofectamine 2000 (Invitrogen) as per the manufacturer’s
protocol, with 0.8 µg of DNA per well in a 24-well plate. All luciferase assays were performed
in triplicate. Using three different passages of the cell lines, at least three separate transfections
per plasmid were performed. For each transfection experiment, individual plasmids were
transfected in three separate wells. The cells were incubated for 4-6 h with DNA-Lipofectamine
2000 complex, and then washed and incubated in fresh media for 18 h before being treated with
vehicle, insulin (10 nM), leptin (10 nM), or forskolin/IBMX (10 µM). The cells were harvested
at 12 h post-treatment, and luciferase assay was performed to detect luciferase activity using
Firefly & Renilla Luciferase Assay Kit (Biotum, Inc., USA) and a Lumat LB 9501 luminometer
(EG&G Berthold, wellesley, MA). Protein concentrations were determined using the BCA
Protein Assay Kit (Thermo Scientific, Rockford, IL). Controls for transfections included the
promoterless pGL2 basic vector (Promega), and the internal control reporter pRL-CMV vector
(containing enhancer to express Renilla luciferase; Promega).
2.8 Animal (mouse) experiments
Adult male C57BL/6 (8-10 wk old, 25-30 g) mice were housed in individual
polycarbonate cages in a temperature-controlled vivarium on a 12:12 hour light:dark cycle. All
animals were given ad libitum access to standard rodent chow and water at all times. Using flat-
skull coordinates from bregma (antero-posterior -0.825 mm, medio-lateral 0 mm, dorso-ventral -
4.8 mm) a 26-gauge stainless steel guide cannula (Plastics One, Roanoake, VA) projecting into
the third cerebral ventricle was implanted into each mouse. Correct cannula placement and the
patency were verified 1 wk after surgery by intracerebroventricular (i.c.v.) injection of 250 ng of
angiotensin II in 0.5 μl 0.9% saline (19). Angiotensin II induces a drinking a response and only
mice with positive drinking responses were included in subsequent analyses. After allowing the
mice to recover for 7-14 days, they were handled daily for at least one week before beginning the
42
experiments. All procedures and manipulations were conducted in accordance with the protocols
and guidelines approved by the University of Toronto Animal Care Committee.
2.9 Intracerebroventricular microinjections for feeding study
Exendin-4 was obtained from American Peptide, USA. For the animal treatment,
exendin-4 was dissolved in 0.9% saline on the day of treatment and microinjections were
administered one hour prior to onset of the dark phase. The dose of exendin-4 used to induce
anorexia was based on a previous report (221). Each ad libitum-fed mouse received either
exendin-4 or 0.9% saline in a total volume of 2 μl by slow infusion over 10-15 minutes into the
third ventricle using a 30-gauge injector attached by polyethylene tubing to a 2 μl glass syringe
(Hamilton, Reno, NV). The mice were returned to their home cages with free access to a
premeasured amount of chow and water, and the effect of i.c.v. exendin-4 on feeding was
determined (4 mice per treatment group). Changes in food and water intake were measured at 2,
4, 18 and 24 h post-treatment, and change in animal body weight was recorded at 24 h post-
treatment.
The degradation-resistant human analog of GLP-2, h(Gly2)GLP-2, was purchased from
American Peptide Company, USA. For the animal treatment, h(Gly2)GLP-2 was dissolved in
0.9% saline on the day of treatment, and microinjections were administered 1 h prior to onset of
the dark phase. In order to determine the effective dose of h(Gly2)GLP-2 to study mouse
hypothalamic neuronal activation, a peptide dose-response feeding study using a range of doses
of h(Gly2)GLP-2 (100 ng, 1µg, 5 µg per mouse) was conducted. Each ad libitum-fed mouse
received either different doses of h(Gly2)GLP-2 or 0.9% saline in a total volume of 2 μl by slow
infusion into the third ventricle (4 mice per treatment group). Upon returning to their home
cages, the mice were allowed to freely access premeasured amounts of chow and water. The
effect of i.c.v. h(Gly2)GLP-2 on feeding was determined by measuring changes in food and
water intake and animal weight at 1 and 2 h post-treatment.

43
2.10 Assessment of neuronal activation by c-Fos immunohisto-
chemistry
To study the effect of acute stimulation of central GLP-1R by exendin-4 and GLP-2R by
h(Gly2)GLP-2 on the activation of hypothalamic neuropeptidergic neurons, ad libitum fed mice
(4 mice per treatment group) were treated with either i.c.v. exendin-4, h(Gly2)GLP-2 or 0.9%
saline as described above for the feeding study. 2h following i.c.v. injections, mice were
anesthetized using CO2 and perfused transcardially with ice-cold 0.1 M PBS followed by freshly
prepared 4% paraformaldehyde solution. Brains were removed immediately, post-fixed in 4%
paraformaldehyde, serially cryoprotected in 15% and 30% sucrose solution, snap-frozen in a pre-
chilled dry ice-isopentane bath, and stored at -80°C. For subsequent immunohistochemical
analysis, frozen brains were cut with a cryostat (Leica CM1510S, Leica Microsystems, Canada)
in a rostral to caudal direction in the coronal plane into 20 μm sections, and serial sections were
stored at -20°C in a cryoprotectant solution (19).
The number of c-Fos-, α-MSH/POMC-, NPY-, neurotensin-, or ghrelin-ir neurons in
specific hypothalamic regions were quantitatively assessed. For the immunohistological analysis,
every other section at 20 μm intervals through the hypothalamus was selected throughout the
hypothalamic nuclei. The sections were allocated rostral to caudal to visualize the distribution of
neuropeptide- or c-Fos-ir neurons on each hemisphere throughout these nuclei. Evenly spaced
sections covering the region -0.70 mm to -1.94 mm from bregma were defined according to the
Mouse Brain Atlas of Paxinos and Franklin (331).
The specific primary rabbit anti-mouse antibodies and their concentration used for
detection of immunoreactivity are as follows: anti-c-Fos (1:25,000; Calbiochem, Canada), anti-
neurotensin (1:5000; Immunostar, USA), anti-ghrelin (1:1000; Phoenix Pharmaceuticals, Catalog
No. H-031-31; anti-ghrelin antibody to n-octanoyl ghrelin), anti-α-MSH (1:200; Phoenix
Pharmaceuticals, Catalog No. H-043-01), and anti-NPY (1:1000; Phoenix Pharmaceuticals,
Catalog No. H-049-03). The detection of c-Fos, α-MSH, NPY, neurotensin or ghrelin
immunoreactivity was performed by conventional avidin-biotin-immunoperoxidase method
using biotinylated goat anti-rabbit IgG secondary antibody and diaminobenzidine (DAB) as
chromogen (Vectastain ABC Elite Kit; Vector Laboratories, Canada) (301). The brain sections
44
were processed for immunohistochemical staining by Tyramide Signal Amplification method
(TSA; PerkinElmer). The IHC for c-Fos was performed with DAB to yield a brown nuclear
reaction product, whereas the IHC for α-MSH/POMC, NPY, neurotensin and ghrelin was
performed using DAB with Metal Enhancer (cobalt chloride), yielding a more intense blue/black
cytoplasmic reaction product (Sigma, Catalog No. D0426).
Immunostained sections were examined under a Zeiss Axioplan 2 microscope outfitted
with an AxioCam HRc camera and AXIOVISION 4.2 imaging software. For the quantification
of cells, every other section throughout the ARC, PVN, DMH and VMH was taken to visualize
the distribution of α-MSH/POMC, NPY, neurotensin or ghrelin neurons throughout these nuclei
(total 3-4 sections/mouse). For each of the ARC, PVN, DMH and VMH from both sides, an
image was captured in a single plane of focus at X40 magnification and a 0.2 mm2 box was
placed in the center of the selected hypothalamic regions. Cells with brown nuclear staining were
considered c-Fos-ir, whereas cells with dark blue/black cytoplasmic staining were considered α-
MSH/POMC-, NPY-, neurotensin- or ghrelin-positive. The immunoreactive neuronal cells from
both hemispheres of 4 to 6 sections per each animal were counted in a blind manner, and in each
group the mean value of the cell counts per section of an individual animal was used for
statistical analysis. The results were expressed as the ratio of cells co-expressing c-Fos with
either α-MSH/POMC, NPY, neurotensin or ghrelin to the total number of respective
neuropeptide-ir cells per 0.2 mm2 area of the ARC, PVN, DMH, VMH, PeV or the internuclear
regions.
2.11 Experimental normalization
For the analysis of the protein expression, phospho-Akt expression was normalized to
total Akt, phospho-STAT3 expression was normalized to total STAT3, and phospho-CREB and
phospho-ATF-1 expression was normalized to total CREB (300); only c-Fos was normalized to
Gβ. Primary antibody against Gβ was used as an internal loading control for all protein
expression assays. For the real time and semi-quantitative qRT-PCR experiments, the sample
mRNA expression values were divided by the expression values of the housekeeping gene -
actin to obtain sample/housekeeping ratio. These values represented relative mRNA expression
of the sample gene and were utilized for statistical analysis.

45
2.12 Statistical analysis
Data are presented as the mean ± the standard error of the mean (SEM) from at least three
independent experiments. Data were analyzed using GraphPad Prism software (GraphPad
Software, Inc., USA) or SigmaPlot (Systat Software Inc., USA). Statistical analysis was
performed using one-way or two-way analysis of variance (ANOVA), and statistical significance
was determined by post hoc analysis using Bonferroni test or Student’s t-test with P < 0.05.

46
Chapter 3
Regulation of the Proglucagon mRNA Levels by
Insulin and Leptin in Embryonic versus Adult
Hypothalamic Neurons

47
Publication:
Prasad S. Dalvi, Frederick D. Erbiceanu, David M. Irwin, and Denise D. Belsham. Direct
Regulation of the Proglucagon Gene by Insulin, Leptin and cAMP in Embryonic versus Adult
Hypothalamic Neurons. Molecular Endocrinology (2012) 26:1339-1355
F.D.E. was a graduate student under the supervision of D.M.I. and performed the study on the
cAMP regulation of proglucagon gene expression included in this manuscript for his M.Sc.
thesis research. All other experiments included in the manuscript and presented in this thesis
were designed by P.S.D. and D.D.B. P.S.D. executed all the experiments included in this thesis,
analyzed all data, designed and created all figures, wrote and revised the manuscript under the
supervision of D.D.B. D.M.I. provided the human and rat proglucagon promoters and revised
the manuscript.
Published figures:
Figure 7. Characterization of the expression profile of the proglucagon-expressing hypothalamic cell
lines.
Figure 8. Insulin activates Akt and leptin activates STAT3 in the hypothalamic neuronal cells.
Figure 9. Insulin and leptin regulate proglucagon mRNA expression in the hypothalamic neuronal cells.
Figure 10. Regulation of proglucagon mRNA expression by insulin via activation of the PI3K/Akt
pathway.
Figure 11. Regulation of proglucagon mRNA expression by leptin via activation of the JAK2/STAT3
pathway.
Figure 12. Insulin and leptin do not affect the transcription of proglucagon promoter constructs, but
regulate mRNA stability.
Figure 13. In silico analysis of murine proglucagon mRNA sequence for miRNA binding sites and
RNA-binding protein sites.
Permissions were obtained to reproduce the copyrighted material.

48
3 Regulation of the Proglucagon mRNA Levels by Insulin and
Leptin in Embryonic versus Adult Hypothalamic Neurons
3.1 Abstract
The proglucagon gene is expressed not only in the pancreas and intestine, but also in the
hypothalamus. PGDPs have emerged as potential regulators of energy homeostasis. Whether
insulin or leptin activation controls proglucagon gene expression in the hypothalamus is not
known. A key reason for this has been the inaccessibility of hypothalamic proglucagon-
expressing neurons and the lack of suitable neuronal cell lines. Herein, the mechanisms involved
in the direct regulation of the proglucagon gene by insulin and leptin in hypothalamic cell
models are described. Insulin, through an Akt-dependent manner, significantly increased
proglucagon mRNA levels by 70% in adult-derived mHypoA-2/10 neurons, while significantly
suppressing them by 45% in embryonic-derived mHypoE-39 neurons. Leptin, via the
JAK2/STAT3 pathway, caused an initial increase by 66% and 43% at 1 h followed by a decrease
by 45% and 34% at 12 h in mHypoA-2/10 and mHypoE-39 cells, respectively. Transient
transfection analysis determined that human or rat proglucagon 5' flanking promoter regions
were not regulated by insulin and leptin in the mouse embryonic cell lines, whereas RNA
stability assay demonstrated that insulin and leptin increased proglucagon mRNA stability in the
mouse adult cell line at 4 h and 1 h post-treatment. These findings suggest that insulin and leptin
act directly, on specific hypothalamic neurons to regulate proglucagon mRNA expression. Since
PGDPs are potential regulators of energy homeostasis, an understanding of regulation of
hypothalamic proglucagon neurons is important to further expand our knowledge of alternative
feeding circuits.
3.2 Introduction
Among numerous appetite-regulating neuropeptides, the PGDPs, including glucagon,
GLP-1, GLP-2, and oxyntomodulin have emerged as potential regulators of feeding behavior (6).
Proglucagon is encoded by a single proglucagon gene and is expressed in pancreatic α-cells,
intestinal endocrine L-cells, brain stem neurons and the hypothalamus (172). PGDPs are

49
synthesized by post-translational processing of precursor proglucagon in cell-specific manner by
PC1/3 and PC2 (174). GLP-1, GLP-2, glicentin, and oxyntomodulin are synthesized in the
intestinal endocrine L-cells which are located mainly in the distal ileum and colon, whereas
glucagon is predominantly produced and secreted by pancreatic α-cells (174, 332). In the CNS,
proglucagon is expressed mainly in the caudal brainstem and in selective hypothalamic neurons,
and the processing of proglucagon in these neurons appears to mirror that of the intestine
yielding GLP-1, GLP-2, glicentin, and oxyntomodulin as major products (172, 183, 333).
Receptors for both GLPs have been found in several areas of the brain that regulate appetite and
energy homeostasis (332, 333).
The two key regulators of food intake and energy balance, insulin and leptin, are secreted
in proportion to body fat mass. Both, insulin and leptin, cross the BBB and interact with key
neurons in the hypothalamus that express both IR and ObRb (43, 248). Insulin is the main
metabolic hormone that regulates glucose homeostasis, and is secreted by pancreatic β-cells.
Peripheral actions of insulin are anabolic as it increases energy storage by increasing fatty acid
synthesis, whereas central actions are catabolic as it reduces food intake and body weight (334).
Neuron-specific insulin receptor knockout mice display an obese phenotype, indicating the
importance of the central actions of insulin (12). Leptin is secreted by adipocytes and was cloned
from the obese (ob) gene. Knockout mice with mutations in the ob gene or leptin receptor db
gene are morbidly obese, and administration of leptin to ob/ob mice normalizes body weight and
neuroendocrine status (39, 267), indicating the importance of leptin in energy homeostasis. It is
well established that IR and ObRb are located in the hypothalamus (43, 248, 249), and central
administration of insulin or leptin potently reduces food intake and body weight (250, 282). It is
known that insulin and leptin regulate feeding and energy balance through interaction with
complex neural circuits comprised of appetite repressing anorexigenic and appetite stimulating
orexigenic neuropeptides. It is now well established that insulin and leptin act in the
hypothalamus to regulate orexigenic NPY/AgRP and anorexigenic POMC expression (36, 335-
337).
In contrast to the well-studied hypothalamic NPY/AgRP and POMC regulation, the
regulation of hypothalamic proglucagon by insulin and leptin remains unknown. Few studies
have examined changes in the local regulation of proglucagon and production of the GLPs in the
50
brain, mainly due to a very small number of proglucagon-expressing neurons existing in the
brain. Further, the complexity of the in vivo architecture of the hypothalamus renders these
studies very challenging to perform in intact brain or whole animal models. Therefore, using
embryonic- and adult-derived immortalized, clonal, hypothalamic cell models generated in our
laboratory, whether insulin and leptin regulate hypothalamic proglucagon gene expression was
investigated. Also the signal transduction and transcriptional mechanisms involved in any such
regulation were studied.
3.3 Results
3.3.1 Characterization of the expression profile of the hypothalamic cell
lines
A series of hypothalamic cell lines has recently been developed which display a variety
of hypothalamic phenotypes, and a few of them were reported to express the proglucagon mRNA
(18, 19). To confirm these reports, RT-PCR was conducted to show that mHypoA-2/10,
mHypoE-39, and mHypoE-20/2 express both proglucagon mRNA (Figure 7A and B) and the
insulin and leptin receptors (Figure 7C). Another cell model mHypoE36/1 does not express the
proglucagon gene. Proglucagon-positive pancreatic α-TC cells and intestinal GLUTag L-cells
served as positive controls, and fibroblasts 3T3 cells served as a negative control. Further, the
expression of other hypothalamic neuropeptides involved in appetite regulation and hormone
receptors in these cell lines were analyzed (Figure 7C). All cell models express neurotensin, IR
and ObRb, whereas only mHypoE36/1 cell model expresses endogenous GLP-1R and GLP-2R.
Currently, there are no hypothalamic cell models reported with endogenous proglucagon
expression and receptors for insulin or leptin; therefore, based on their unique neuropeptide and
receptor profile, mHypoA-2/10 and mHypoE-39 cell models were selected to study insulin- and
leptin-mediated regulation of proglucagon mRNA.

51
Figure 7. Characterization of the expression profile of the proglucagon-expressing
hypothalamic cell lines. Expression of proglucagon mRNA transcripts in pancreatic α-TC cells,
intestinal GLUTag L-cells, hypothalamic neuroendocrine cell lines mHypoA-2/10, mHypoE-39,
mHypoE-20/2, mhypoE-36/1 and fibroblasts 3T3 cells. (A) RT-PCR using specific primers for
mouse proglucagon and -actin genes. Total RNA was isolated from the indicated cell lines and
used as template for RT-PCR using the One-Step RT-PCR kit. M, markers; NTC, non-template
control; +/− RT. (B) Graphical representation of relative proglucagon mRNA transcripts levels
quantified by densitometry. Proglucagon mRNA values were normalized to -actin levels. (C)
RT-PCR analysis results for the mRNA expression of neuropeptides and receptors in the
indicated hypothalamic cells. ‘+’ indicates that the gene is expressed; ‘−’ indicates that the gene
is weakly expressed or not expressed.

52
3.3.2 Activation of signaling pathways by insulin and leptin in the
hypothalamic neuronal cells
The key signaling pathway that insulin activates is the PI3K/Akt pathway. Thus, it was
investigated if this signaling pathway is activated by insulin in the hypothalamic adult and
embryonic cells. The neuronal cells were treated with 10 nM insulin, and activation of Akt was
analyzed over 60 minutes. By Western blot analysis, it was found that insulin induced
phosphorylation of Akt at Ser473 in both adult mHypoA-2/10 and embryonic mHypoE-39 cell
lines during the entire period of 60 minutes post-treatment (Figure 8). The maximum significant
increase in Akt phosphorylation by 179% was observed at the 5 min time point in the mHypoA-
2/10 cell model [pAkt/total Akt (5 min): vehicle (0.66 ± 0.05) versus 10 nM insulin (1.83 ±
0.21), P < 0.001]. Similarly, in the mHypoE-39 cells, the maximum activation of Akt was by
390% at 5 min post-treatment [pAkt/total Akt (5 min): vehicle (0.56 ± 0.06) versus 10 nM
insulin (2.74 ± 0.45), P < 0.001] (Figure 8A and B).
Further, leptin was found to significantly increase phosphorylation of STAT3 at Tyr705
by 60% at 15 min in the adult neuronal cells [pSTAT3/total STAT3 (15 min): vehicle (0.71 ±
0.06) versus 10 nM leptin (1.13 ± 0. 19), P < 0.05] (Figure 8C). Similarly, leptin significantly
increased phosphorylation of STAT3 at 5 min in the embryonic cells by 42% [pSTAT3/total
STAT3 (5 min): vehicle (0.72 ± 0.03) versus 10 nM leptin (0.99 ± 0. 08), P < 0.01] (Figure 8D).
Interestingly, these findings indicate a temporal difference in the activation of the two pathways,
as Akt is strongly and continuously activated by insulin over 60 min, while STAT3 is only
activated by leptin for 5 to 15 minutes.
Akt can be activated by its phosphorylation in a PI3K-dependent or -independent manner.
Activated Akt can then activate or deactivate its downstream substrates via its kinase activity
such as mammalian target of rapamycin or other signaling pathways to regulate effector genes.
Activated STAT3 forms homo- or heterodimers that translocate to the cell nucleus, where they
act as transcription activators and bind to STAT elements within the promoter region of
downstream target genes to regulate their expression. Overall, activation of Akt and STAT3 in
the neuronal cell models suggests that insulin and leptin could potentially regulate downstream
signaling proteins and target genes endogenously expressed in these neuronal cells.
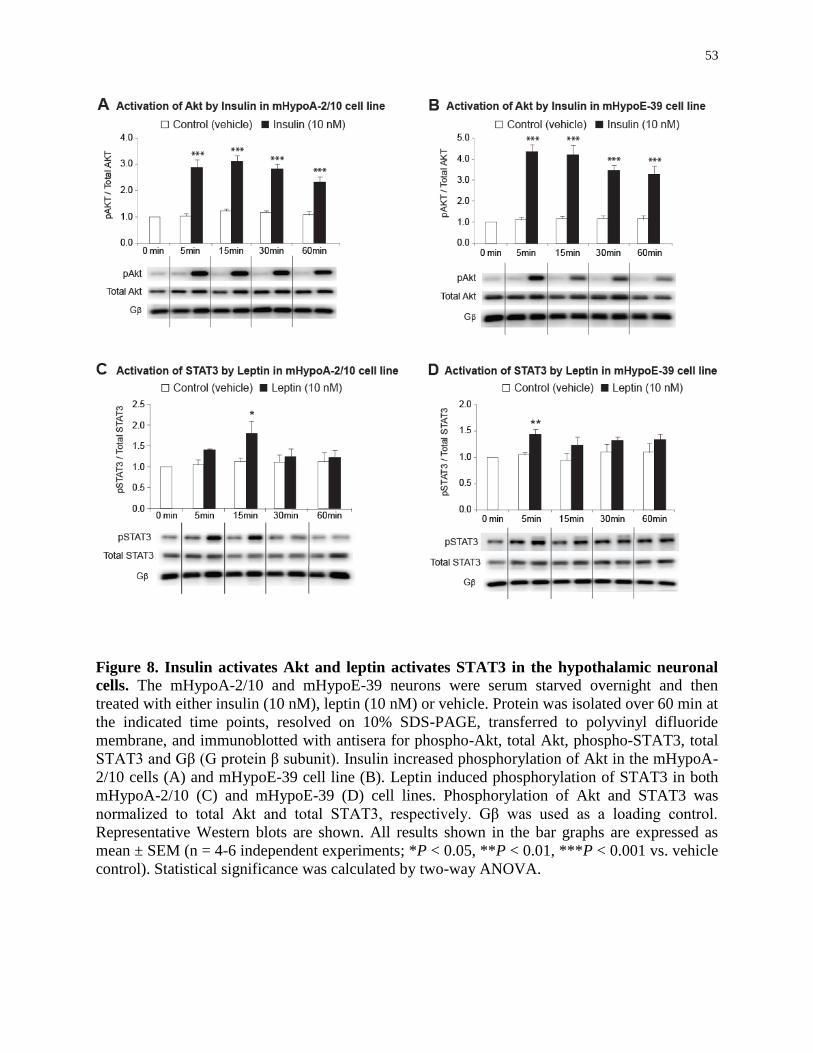
53
Figure 8. Insulin activates Akt and leptin activates STAT3 in the hypothalamic neuronal
cells. The mHypoA-2/10 and mHypoE-39 neurons were serum starved overnight and then
treated with either insulin (10 nM), leptin (10 nM) or vehicle. Protein was isolated over 60 min at
the indicated time points, resolved on 10% SDS-PAGE, transferred to polyvinyl difluoride
membrane, and immunoblotted with antisera for phospho-Akt, total Akt, phospho-STAT3, total
STAT3 and Gβ (G protein β subunit). Insulin increased phosphorylation of Akt in the mHypoA-
2/10 cells (A) and mHypoE-39 cell line (B). Leptin induced phosphorylation of STAT3 in both
mHypoA-2/10 (C) and mHypoE-39 (D) cell lines. Phosphorylation of Akt and STAT3 was
normalized to total Akt and total STAT3, respectively. Gβ was used as a loading control.
Representative Western blots are shown. All results shown in the bar graphs are expressed as
mean ± SEM (n = 4-6 independent experiments; *P < 0.05, **P < 0.01, ***P < 0.001 vs. vehicle
control). Statistical significance was calculated by two-way ANOVA.

54
3.3.3 Regulation of proglucagon mRNA transcript levels by insulin and
leptin
Next, direct regulation of proglucagon mRNA levels by insulin and leptin was
investigated. The adult and embryonic hypothalamic neuronal cells were exposed to 10 nM
insulin or leptin over a 24 h time course. Using real-time qRT-PCR, it was found that in the adult
mHypoA-2/10 neurons proglucagon mRNA levels were significantly upregulated by 70% by
insulin at 4 h post-treatment [vehicle (0.66 ± 0.07) versus 10 nM insulin (1.12 ± 0.11), P < 0.05]
(Figure 9A), whereas in the embryonic mHypoE-39 neurons insulin significantly suppressed the
mRNA expression by 45% and 43% at 4 h and 8 h post-treatment, respectively [4 h, vehicle
(1.04 ± 0.10) versus 10 nM insulin (0.57 ± 0.08), P < 0.05; 8 h, vehicle (1.00 ± 0.16) versus 10
nM insulin (0.57 ± 0.05), P < 0.05] (Figure 9B). With respect to the leptin action on proglucagon
mRNA expression in the adult mHypoA-2/10 cell line, it was found that leptin caused significant
upregulation of mRNA levels by 66% at 1 h post-treatment followed by downregulation by 45%
at 12 h [1 h, vehicle (1.00 ± 0.07) versus 10 nM leptin (1.66 ± 0.22), P < 0.05; 12 h, vehicle
(1.47 ± 0.15) versus 10 nM leptin (0.81 ± 0.07), P < 0.05] (Figure 9C). Leptin induced a similar
biphasic effect in the mHypoE-39 cell line by initially upregulating proglucagon mRNA by 43%
at 1 h, followed by its suppression by 34% at 12 h post-treatment [1 h, vehicle (1.15 ± 0.10)
versus 10 nM leptin (1.64 ± 0.22), P < 0.05; 12 h, vehicle (1.38 ± 0.10) versus 10 nM leptin
(0.91 ± 0.05), P < 0.05] (Figure 9D). These results clearly indicate that the proglucagon mRNA
levels are regulated by insulin and leptin in the hypothalamic neuronal cell models.
3.3.4 Reversal of insulin-mediated regulation of proglucagon mRNA levels
by PI3K inhibitors
To investigate involvement of Akt, a PI3K-dependent protein kinase, in the regulation of
proglucagon mRNA expression by insulin, pharmacological inhibitors of PI3K (LY294002 at 25
µM and wortmannin at 1 µM concentrations) were used (32). First, the efficacy and specificity
of each inhibitor was determined. The adult mHypoA-2/10 and embryonic mHypoE-39 cells
were pretreated for 1 h with either of the inhibitors before exposure to 10 nM insulin. Total
protein was isolated at 15 minutes after insulin treatment for the analysis using phospho-specific
antibody for Akt. DMSO was used as a vehicle control, as the inhibitors were dissolved in it.
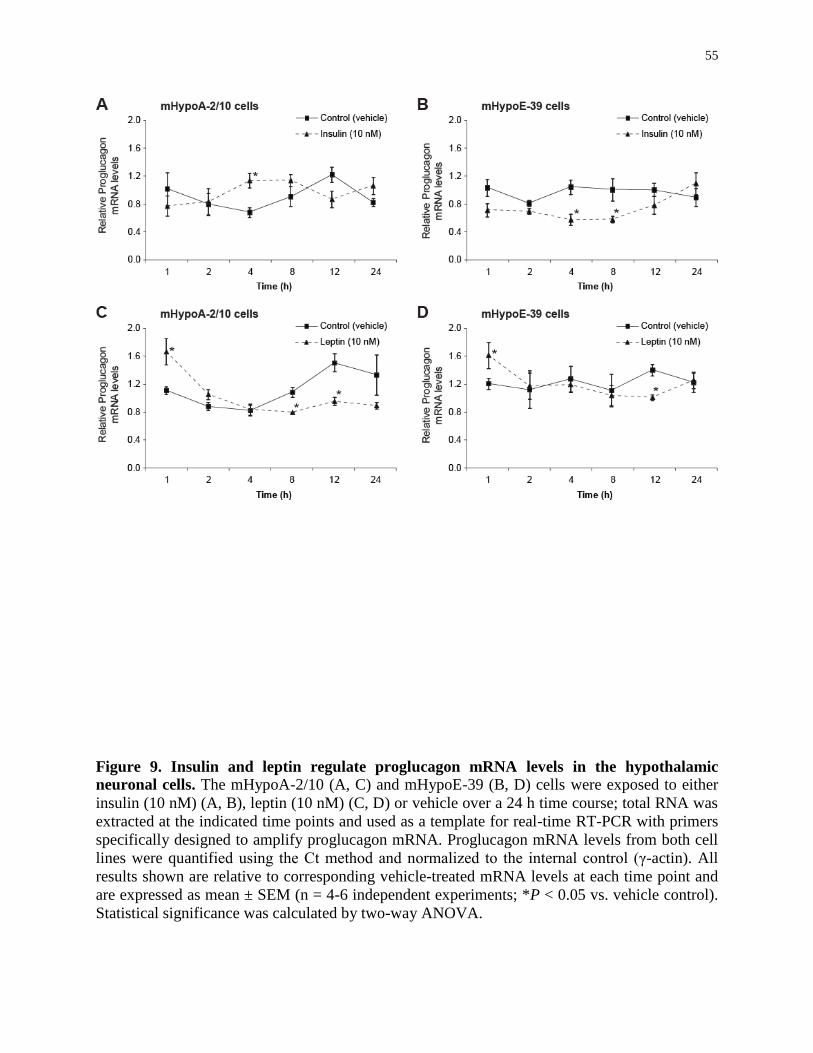
55
Figure 9. Insulin and leptin regulate proglucagon mRNA levels in the hypothalamic
neuronal cells. The mHypoA-2/10 (A, C) and mHypoE-39 (B, D) cells were exposed to either
insulin (10 nM) (A, B), leptin (10 nM) (C, D) or vehicle over a 24 h time course; total RNA was
extracted at the indicated time points and used as a template for real-time RT-PCR with primers
specifically designed to amplify proglucagon mRNA. Proglucagon mRNA levels from both cell
lines were quantified using the Ct method and normalized to the internal control (γ-actin). All
results shown are relative to corresponding vehicle-treated mRNA levels at each time point and
are expressed as mean ± SEM (n = 4-6 independent experiments; *P < 0.05 vs. vehicle control).
Statistical significance was calculated by two-way ANOVA.

56
Figure 10. Regulation of proglucagon mRNA levels by insulin via activation of the
PI3K/Akt pathway. mHypoA-2/10 (A, C) and mHypoE-39 (B, D) neuronal cells were pre-
treated with a PI3K inhibitor, either LY294002 (25 μM) or wortmannin (1 μM), for 1 h followed
by either vehicle (water or DMSO) or insulin (10 nM) treatment. To determine the efficacy and
specificity of the inhibitors, total protein was isolated at 15 min following insulin treatment and
analyzed using Western blot analysis with phospho-specific antibodies against Akt (A, B).
Phosphorylation of Akt was normalized to total Akt. Gβ was used as a loading control.
Representative Western blots are shown. To investigate involvement of PI3K/Akt pathway in
proglucagon mRNA regulation by insulin, cells were harvested for total RNA isolation at 4 h
following insulin exposure, and proglucagon mRNA levels were determined by real-time RT-
PCR (C, D). mRNA levels are shown relative to water only-treated mRNA levels (set to 1.0). All
results are expressed as mean ± SEM (n = 4 independent experiments; *P < 0.05). Statistical
significance was calculated by two-way ANOVA. White bars = control (water or DMSO with or
without PI3K inhibitor); black bars = treatment (insulin with or without PI3K inhibitor).

57
Using Western blot analysis, it was found that wortmannin and LY294002 inhibited the
phosphorylation of Akt by insulin in both cell models [mHypoA-2/10 cell line (15 min): DMSO
(0.55 ± 0.13) versus DMSO + 10 nM insulin (1.90 ± 0.31), P < 0.05; LY294002 (0.38 ± 0.18)
versus LY294002 + 10 nM insulin (0.34 ± 0.20), P > 0.05; wortmannin (0.36 ± 0.19) versus
wortmannin + 10 nM insulin (0.34 ± 0.20), P > 0.05; mHypoE-39 cell line (15 min): DMSO
(0.64 ± 0.27) versus DMSO + 10 nM insulin (2.16 ± 0.33), P < 0.05; LY294002 (0.37 ± 0.24)
versus LY294002 + 10 nM insulin (0.48 ± 0.23), P > 0.05; wortmannin (0.41 ± 0.26) versus
wortmannin + 10 nM insulin (0.53 ± 0.17), P > 0.05] (Figure 10A and B).
The next step was to analyze whether the PI3K/Akt pathway is involved in the regulation
of proglucagon by insulin. The adult mHypoA-2/10 and embryonic mHypoE-39 cells were pre-
treated with the inhibitors for 1 h, followed by insulin treatment. Total RNA was isolated at 4 h
after insulin treatment and analyzed using real-time qRT-PCR. As compared to the vehicle
treatment, insulin treatment alone significantly induced an increase in the proglucagon mRNA
levels in mHypoA-2/10 neuronal cells, whereas pretreatment with wortmannin or LY294002
attenuated insulin-induced increase in proglucagon mRNA expression [mHypoA-2/10 cell line (4
h): water (0.60 ± 0.13) versus 10 nM insulin (1.10 ± 0.15), P < 0.05; DMSO (0.60 ± 0.04) versus
DMSO + 10 nM insulin (1.02 ± 0.12), P < 0.05; LY294002 (1.10 ± 0.16) versus LY294002 + 10
nM insulin (0.87 ± 0.08), P > 0.05; wortmannin (1.30 ± 0.23) versus wortmannin + 10 nM
insulin (1.09 ± 0.22), P > 0.05] (Figure 10C). In the mHypoE-39 cells, pretreatment with PI3K
inhibitors attenuated insulin-mediated repression of proglucagon mRNA expression [mHypoE-
39 cell line (4 h): water (1.15 ± 0.14) versus 10 nM insulin (0.63 ± 0.11), P < 0.05; DMSO (1.02
± 0.07) versus DMSO + 10 nM insulin (0.50 ± 0.08), P < 0.05; LY294002 (1.33 ± 0.07) versus
LY294002 + 10 nM insulin (1.29 ± 0.16), P > 0.05; wortmannin (0.98 ± 0.16) versus
wortmannin + 10 nM insulin (0.91 ± 0.15), P > 0.05] (Figure 10D). These findings indicated that
the PI3K/Akt pathway is involved in the regulation of hypothalamic proglucagon mRNA levels
by insulin. It was also found that PI3K inhibitors increase basal proglucagon mRNA levels in the
adult cells, suggesting that the PI3K pathway may regulate basal proglucagon mRNA turnover,
probably by increasing the basal rate of mRNA degradation (Figure 10C).

58
3.3.5 Reversal of leptin-mediated regulation of proglucagon mRNA levels
by JAK2/STAT3 inhibitors
It was further investigated whether activation of STAT3 by leptin is involved in the
regulation of proglucagon mRNA levels, for which pharmacological inhibitors of JAK2/STAT3
(cucurbitacin I at 5 µM and SD1008 at 10 µM concentrations) were used (338, 339). In order to
determine the efficacy and specificity of each inhibitor, the adult mHypoA-2/10 and embryonic
mHypoE-39 cells were pretreated for 1 h with either of the inhibitors before treatment with 10
nM leptin. Total protein was isolated at 15 minutes after the leptin treatment and analyzed using
a phospho-specific antibody for STAT3. As the inhibitors were dissolved in DMSO, it was used
as a vehicle control. It was found that cucurbitacin I and SD1008 inhibited the phosphorylation
of STAT3 by leptin in both cell models [mHypoA-2/10 cell line (15 min): DMSO (0.19 ± 0.02)
versus DMSO + 10 nM leptin (0.38 ± 0.04), P < 0.05; cucurbitacin I (0.14 ± 0.06) versus
cucurbitacin I + 10 nM leptin (0.13 ± 0.06), P > 0.05; SD1008 (0.11 ± 0.08) versus SD1008 + 10
nM leptin (0.08 ± 0.05), P > 0.05; mHypoE-39 cell line (15 min): DMSO (0.17 ± 0.01) versus
DMSO + 10 nM leptin (0.29 ± 0.01), P < 0.05; cucurbitacin I (0.15 ± 0.03) versus cucurbitacin I
+ 10 nM leptin (0.18 ± 0.01), P > 0.05; SD1008 (0.11 ± 0.05) versus SD1008 + 10 nM leptin
(0.10 ± 0.04), P > 0.05] (Figure 11A and B).
Next, involvement of the JAK2/STAT3 pathway in the regulation of proglucagon mRNA
levels by leptin was investigated. The adult mHypoA-2/10 and embryonic mHypoE-39 cells
were pre-treated with the inhibitors for 1 h, followed by leptin treatment and total RNA was
isolated at 1 h and 12 h. Using real-time qRT-PCR, it was found that as compared to the vehicle
treatment, leptin treatment alone significantly upregulated proglucagon mRNA levels in both
mHypoA-2/10 and mHypoE-39 neuronal cells, whereas pretreatment with cucurbitacin I or
SD1008 attenuated the leptin-induced increase in proglucagon mRNA levels [mHypoA-2/10 cell
line (1 h): PBS (1.26 ± 0.10) versus 10 nM leptin (2.15 ± 0.07), P < 0.05; DMSO (0.88 ± 0.28)
versus DMSO + 10 nM leptin (1.83 ± 0.25), P < 0.05; cucurbitacin I (0.47 ± 0.10) versus
cucurbitacin I + 10 nM leptin (0.39 ± 0.11), P > 0.05; SD1008 (0.75 ± 0.28) versus SD1008 + 10
nM leptin (0.67 ± 0.23), P > 0.05; mHypoE-39 cell line (1 h): PBS (1.27 ± 0.15) versus 10 nM
leptin (1.88 ± 0.36), P < 0.05; DMSO (0.91 ± 0.17) versus DMSO + 10 nM leptin (1.61 ±
0.05), P < 0.05;

59
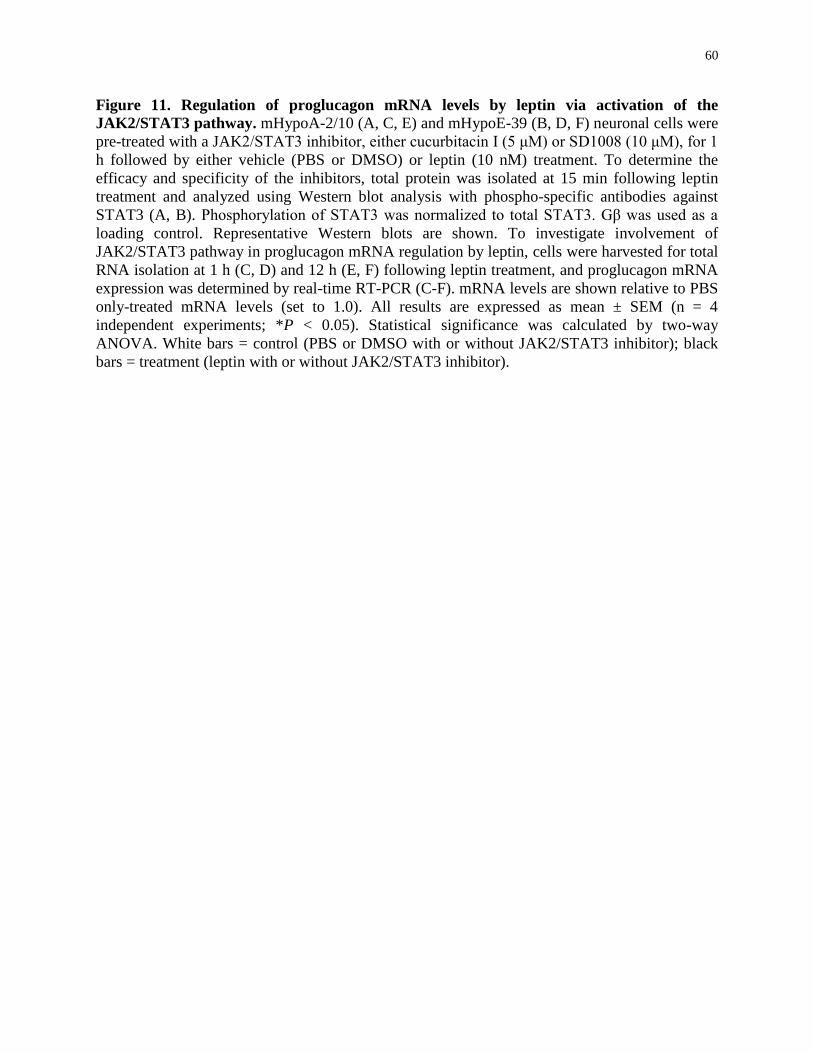
60
Figure 11. Regulation of proglucagon mRNA levels by leptin via activation of the
JAK2/STAT3 pathway. mHypoA-2/10 (A, C, E) and mHypoE-39 (B, D, F) neuronal cells were
pre-treated with a JAK2/STAT3 inhibitor, either cucurbitacin I (5 μM) or SD1008 (10 μM), for 1
h followed by either vehicle (PBS or DMSO) or leptin (10 nM) treatment. To determine the
efficacy and specificity of the inhibitors, total protein was isolated at 15 min following leptin
treatment and analyzed using Western blot analysis with phospho-specific antibodies against
STAT3 (A, B). Phosphorylation of STAT3 was normalized to total STAT3. Gβ was used as a
loading control. Representative Western blots are shown. To investigate involvement of
JAK2/STAT3 pathway in proglucagon mRNA regulation by leptin, cells were harvested for total
RNA isolation at 1 h (C, D) and 12 h (E, F) following leptin treatment, and proglucagon mRNA
expression was determined by real-time RT-PCR (C-F). mRNA levels are shown relative to PBS
only-treated mRNA levels (set to 1.0). All results are expressed as mean ± SEM (n = 4
independent experiments; *P < 0.05). Statistical significance was calculated by two-way
ANOVA. White bars = control (PBS or DMSO with or without JAK2/STAT3 inhibitor); black
bars = treatment (leptin with or without JAK2/STAT3 inhibitor).

61
cucurbitacin I (0.57 ± 0.08) versus cucurbitacin I + 10 nM leptin (0.79 ± 0.26), P > 0.05; SD1008
(0.72 ± 0.11) versus SD1008 + 10 nM leptin (0.80 ± 0.21), P > 0.05] (Figure 11C and D).
At 12 h post-treatment, it was found that the JAK2/STAT3 inhibitors reversed the
downregulation of proglucagon mRNA levels caused by leptin [mHypoA-2/10 cell line (12 h):
PBS (1.30 ± 0.27) versus 10 nM leptin (0.71 ± 0.11), P < 0.05; DMSO (0.88 ± 0.03) versus
DMSO + 10 nM leptin (0.47 ± 0.04), P < 0.05; cucurbitacin I (1.12 ± 0.15) versus cucurbitacin I
+ 10 nM leptin (0.87 ± 0.08), P > 0.05; SD1008 (0.84 ± 0.14) versus SD1008 + 10 nM leptin
(1.06 ± 0.32), P > 0.05; mHypoE-39 cell line (12 h): PBS (1.27 ± 0.19) versus 10 nM leptin
(0.68 ± 0.05), P < 0.05; DMSO (1.27 ± 0.13) versus DMSO + 10 nM leptin (0.84 ± 0.05), P <
0.05; cucurbitacin I (0.51 ± 0.09) versus cucurbitacin I + 10 nM leptin (0.51 ± 0.06), P > 0.05;
SD1008 (1.28 ± 0.10) versus SD1008 + 10 nM leptin (1.50 ± 0.16), P > 0.05] (Figure 11E and
F). These findings indicate that the JAK2/STAT3 pathway is involved in the regulation of
hypothalamic proglucagon mRNA levels by leptin. Further, it was found that JAK2/STAT3
inhibitors decrease basal proglucagon mRNA levels suggesting that JAK2/STAT3 pathway may
regulate basal proglucagon mRNA turnover, probably by decreasing the basal rate of mRNA
degradation (Figure 11F).
3.3.6 Regulation of human or rat proglucagon 5’ flanking promoter
constructs by insulin and leptin
In order to determine if insulin and leptin regulate proglucagon at the level of gene transcription,
proglucagon promoter reporter plasmids were transiently transfected into the mHypoA-2/10 and
mHypoE-39 cells. The human proglucagon constructs consisted of three lengths of human
proglucagon 5’ flanking region, −332 to +58, −602 to +58, and −829 to +58, inserted into
luciferase reporter vectors. The rat proglucagon constructs consisted of two lengths of rat
proglucagon 5’ flanking region, −312 to +58, and −476 to +58, inserted into luciferase reporter
vectors. The transfection efficiency in the adult hypothalamic cell model mHypoA-2/10 was less
than 10% in contrast to more than 70% observed in the mHypoE-39 cell line. Therefore, the
embryonic cell model was selected for the transient transfection analysis. 24 h after transfection,
the cells were treated with 10 nM of insulin or leptin and harvested at 12 h post-treatment as the
positive control forskolin/IBMX treatment was observed to increase proglucagon promoter

62
reporter activity at that time point. All three human proglucagon promoter constructs had basal
luciferase expression 22.51-fold, 18.15-fold, and 24.35-fold higher than the promoterless pGL2
plasmid (Figure 12A). However, the basal activity of rat proglucagon promoter constructs was
much lower than the basal activity of the human proglucagon plasmids as it was only 2.74-fold
and 2.66-fold higher than the promoterless pGL2 plasmid (Figure 12B).
Forskolin/IBMX treatment was used as a positive control as cAMP activation has been
demonstrated to modulate expression of proglucagon expression in islet and intestinal cells
(185). It was found that forskolin/IBMX treatment affected transcription of only one plasmid that
contained 829 bases of the human proglucagon promoter [human −332/+58: PBS (22.51 ± 5.42),
10 µM forskolin/IBMX (24.10 ± 0.43), P > 0.05; human −602/+58: PBS (18.15 ± 0.33), 10 µM
forskolin/IBMX (23.34 ± 1.71), P > 0.05; human −829/+58: PBS (24.36 ± 1.63), 10 µM
forskolin/IBMX (35.35 ± 2.49), P < 0.05] (Fig. 12A). Interestingly, insulin or leptin treatments
did not affect the human plasmid transcription [human −332/+58: PBS (22.51 ± 5.42), 10 nM
insulin (23.79 ± 0.49), 10 nM leptin (19.94 ± 1.43), P > 0.05 (PBS versus leptin or insulin);
human −602/+58: PBS (18.15 ± 0.33), 10 nM insulin (22.34 ± 1.32), 10 nM leptin (17.80 ±
0.41), P > 0.05 (PBS versus leptin or insulin); human −829/+58: PBS (24.36 ± 1.64), 10 nM
insulin (26.43 ± 2.28), 10 nM leptin (22.87 ± 1.02), P > 0.05 (PBS versus leptin or insulin)]
(Figure 12A), or the rat plasmid transcription [rat −312/+58: PBS (2.74 ± 0.33), 10 nM insulin
(2.20 ± 0.27), 10 nM leptin (2.42 ± 0.27), P > 0.05 (PBS versus leptin or insulin); rat −476/+58:
PBS (2.66 ± 0.21), 10 nM insulin (1.97 ± 0.19), 10 nM leptin (2.06 ± 0.16), P > 0.05 (PBS
versus leptin or insulin)] (Figure 12B). These results indicate that insulin and leptin do not affect
the transcription of the human or rat proglucagon 5’ flanking gene promoter regions in the mouse
mHypoE-39 cell line.
3.3.7 Regulation of mRNA stability by insulin and leptin in mHypoA-2/10
and mHypoE-39 neuronal cells
Due to the lack of changes in human proglucagon promoter activity in the mouse cell
lines, the regulation of proglucagon mRNA stability in the presence of insulin or leptin was
investigated using RNA polymerase II gene transcription inhibitors (actinomycin D at 10
µg/ml and DRB at 60 µM concentrations). The adult mHypoA-2/10 and embryonic mHypoE-39

63

64
Figure 12. Insulin and leptin do not affect the transcription of proglucagon promoter
constructs, but regulate mRNA stability. mHypoE-39 cells were transfected with proglucagon
5’ flanking plasmids or promoterless control plasmid pGL2 (A, B), incubated for 24 h, then
treated with either vehicle, insulin (10 nM), leptin (10 nM), or forskolin/IBMX (10 µM). Cells
were harvested 12 h after treatment and a luciferase assay was performed. Data were normalized
to protein concentration. To investigate regulation of mRNA stability by insulin (C, F) and leptin
(D, E, G, H), mHypoA-2/10 cells (C-E) and mHypoE-39 (F-H) were serum-starved overnight,
pre-treated with a RNA polymerase II gene transcription inhibitor, either actinomycin D (Act D)
(10 µg/ml) or DRB (60 µM), for 1 h followed by either vehicle (DMSO), insulin (10 nM) or
leptin (10 nM) treatment. Total RNA was isolated at 1 h (D, G), 4 h (C, F) and 12 h (E, H) post-
treatment, and proglucagon mRNA expression was determined by real-time RT-PCR. mRNA
expression data are shown relative to DMSO with or without RNA polymerase II gene
transcription inhibitor-treated mRNA levels (set to 1.0). All results are expressed as mean ± SEM
(n = 4 independent experiments; *P < 0.05). Statistical significance was calculated by two-way
ANOVA. (C-H) White bars = control (DMSO with or without RNA polymerase II gene
transcription inhibitor); black bars = treatment (insulin or leptin with or without RNA
polymerase II gene transcription inhibitor).

65
cells were pre-treated with the inhibitors for 1 h, followed by insulin or leptin treatment. It was
observed that actinomycin D was not tolerated well by embryonic mHypoE-39 cells, as this
RNA polymerase II gene transcription inhibitor caused significant cell death at the selected dose
within 12 h. Therefore, the embryonic mHypoE-39 cells were treated with DRB only, as it was
well tolerated by these cells up to 24 h. The mechanisms utilized by actinomycin D and DRB to
inhibit transcription are different and unlike DRB that induces slow and reversible inhibition of
transcription, actinomycin D induces fast and irreversible global transcription inhibition (340),
therefore, it seems that actinomycin D induces “transcriptional stress response” in the embryonic
cells that may result in their death post-treatment (341).
The mHypoA2/10 and mHypoE-39 cells were harvested for RNA isolation at 4 h after
insulin treatment and at 1 h and 12 h following leptin treatment. Total RNA was isolated and
analyzed using real-time qRT-PCR. As compared to the vehicle DMSO treatment, insulin
treatment alone significantly induced an increase in the proglucagon mRNA levels in mHypoA-
2/10 neuronal cells that was not attenuated by the pretreatment with either actinomycin D or
DRB [mHypoA-2/10 cell line (4 h): DMSO (0.23 ± 0.04) versus DMSO + 10 nM insulin (0.39 ±
0.06), P < 0.05; actinomycin D (0.19 ± 0.04) versus actinomycin D + 10 nM insulin (0.37 ±
0.06), P < 0.05; DRB (1.88 ± 0.13) versus DRB + 10 nM insulin (2.95 ± 0.12), P < 0.05] (Figure
12C). Similar effects were observed at 1 h post-treatment with leptin, as the pretreatment with
either RNA polymerase II gene transcription inhibitor did not suppress the leptin-induced
upregulation of proglucagon mRNA expression; however, the effect was significant only with
DRB pre-treatment [mHypoA-2/10 cell line (1 h): DMSO (0.23 ± 0.05) versus DMSO + 10 nM
leptin (0.60 ± 0.17), P < 0.05; actinomycin D (0.33 ± 0.07) versus actinomycin D + 10 nM leptin
(0.53 ± 0.09), P > 0.05; DRB (1.45 ± 0.17) versus DRB + 10 nM leptin (2.86 ± 0.26), P < 0.05]
(Figure 12D). In contrast, at 12 h post-treatment with leptin, the pretreatment with the RNA
polymerase II gene transcription inhibitors reversed the leptin-induced suppression of
proglucagon mRNA expression [mHypoA-2/10 cell line (12 h): DMSO (0.55 ± 0.13) versus
DMSO + 10 nM leptin (0.23 ± 0.06), P < 0.05; actinomycin D (0.24 ± 0.05) versus actinomycin
D + 10 nM leptin (0.28 ± 0.09), P > 0.05; DRB (2.39 ± 0.17) versus DRB + 10 nM leptin (2.32 ±
0.21), P > 0.05] (Figure 12E). These findings suggest that leptin and insulin increase
proglucagon mRNA stability in the adult cell line at 1 h and 4 h post-treatment, and that the
mRNA stability remains unaffected at a later period following leptin treatment. The raw data

66
indicates that DRB, but not actinomycin D, increases basal proglucagon mRNA levels in the
adult cells, suggesting that DRB may inhibit transcription of proglucagon gene suppressor
factors that could regulate basal proglucagon mRNA levels.
In the embryonic mHypoE-39 neuronal cells, as compared to the vehicle DMSO
treatment, insulin treatment alone significantly decreased proglucagon mRNA levels that was not
reversed by the pretreatment with DRB [mHypoE-39 cell line (4 h): DMSO (0.26 ± 0.04) versus
DMSO + 10 nM insulin (0.10 ± 0.03), P < 0.05; DRB (1.32 ± 0..47) versus DRB + 10 nM
insulin (2.32 ± 0.51), P > 0.05] (Figure 12F). At 1 h post-treatment with leptin, the pretreatment
with DRB suppressed the leptin-induced upregulation of proglucagon mRNA expression
[mHypoE-39 cell line (1 h): DMSO (0.49 ± 0.14) versus DMSO + 10 nM leptin (1.31 ± 0.31), P
< 0.05; DRB (1.38 ± 0.36) versus DRB + 10 nM leptin (0.82 ± 0.27), P > 0.05] (Figure 12G). At
12 h post-treatment with leptin, the pretreatment with DRB reversed the leptin-induced
suppression of proglucagon mRNA expression [mHypoE-39 cell line (12 h): DMSO (0.15 ±
0.04) versus DMSO + 10 nM leptin (0.04 ± 0.01), P < 0.05; DRB (1.82 ± 0.13) versus DRB + 10
nM leptin (1.99 ± 0.15), P > 0.05] (Figure 12H). These findings suggest that insulin and leptin do
not regulate proglucagon mRNA stability in the embryonic cell line.
3.3.8 In silico analysis of murine proglucagon mRNA sequence for
microRNA binding sites and RNA-binding protein sites
Since leptin and insulin affect mRNA stability in the adult hypothalamic cell model, we
decided to analyze proglucagon mRNA sequence for putative microRNA (miRNA) binding sites
and RNA-binding proteins. Putative miRNA binding sites on proglucagon mRNA template were
searched using a web tool MicroInspector that analyzed proglucagon mRNA sequence for the
occurrence of binding sites for known and registered mouse-specific miRNAs (342) (Figure 13A
and B). Next, using the RNA-binding protein database (RBPDB), proglucagon mRNA sequence
was scanned for putative mRNA-binding protein sites that may be involved in regulation of
proglucagon mRNA stability (343) (Figure 13C). The in silico analysis results indicate that there
are binding sites for several miRNAs and RNA-binding proteins in proglucagon mRNA
sequence, suggesting that stability of proglucagon mRNA and thereby increase or decrease in its
levels can be regulated via activation or inactivation of miRNAs or RNA-binding proteins.

67
Whether insulin or leptin utilize this mechanism to regulate proglucagon mRNA stability needs
to be investigated further, as it is likely that the regulation of miRNAs or RNA-binding proteins
by insulin and leptin may be involved in the rapid proglucagon mRNA stabilization observed in
the adult hypothalamic neuronal cell line (Figure 12C and D).
3.4 Discussion
It is unknown if insulin and leptin have any direct action on the hypothalamic
proglucagon neurons. The lack of knowledge in this area is mostly due to inaccessibility to the
hypothalamic proglucagon-expressing neurons. The previous studies on the regulation of
hypothalamic PGDPs were conducted using fetal rat hypothalamic primary cell cultures (183);
however, these cultures are quite challenging to generate and maintain. In order to circumvent
this issue, the novel cell lines generated from the embryonic and adult mouse hypothalamii that
endogenously express proglucagon mRNA, insulin and leptin receptors were used (18, 19).
Insulin-mediated proglucagon gene regulation in the pancreas and gut has been
extensively studied (185). This is the first study to demonstrate a direct role for insulin in the
control of hypothalamic proglucagon gene expression. It was demonstrated that insulin
upregulated proglucagon mRNA expression in the adult hypothalamic cell model in contrast to
its downregulating action in the embryonic cell model. This variable regulation of proglucagon
gene expression can be explained by the age-dependent differences in the expression profile of
PGDPs that are apparently inherent to the cell models generated and immortalized from adult
and embryonic hypothalamii. The developmental studies on the hypothalamic PGDPs found that
fetal rat hypothalamus predominantly expresses glicentin, oxyntomodulin and glucagon, whereas
adult rat hypothalamus expresses glicentin and oxyntomodulin in greater amounts than glucagon
and GLP-1; this suggests that processing of proglucagon in the hypothalamus is age-dependent
and changes with development (183, 184). Thus, the differential profile of PGDPs may underlie
the differential control of proglucagon gene expression by insulin in these neuronal cells and
further investigations are required to confirm this hypothesis. Furthermore, tissue-specific
variation in the regulation of proglucagon is quite possible, as insulin was demonstrated to
inhibit islet proglucagon gene expression via regulation of gene transcription (200), whereas in
GLUTag L-cells, a murine enteroendocrine cell line, insulin has been reported to stimulate

68
A Proglucagon mRNA-binding micro-RNAs
Name of miRNA Name of miRNA
mmu-miR-494* mmu-miR-3089-5p
mmu-miR-3070a mmu-miR-3080-5p
mmu-miR-5109 mmu-miR-3100-5p
mmu-miR-2182 mmu-miR-423-3p
mmu-miR-770-5p mmu-miR-5110
mmu-miR-3960 mmu-miR-221
mmu-miR-615-5p mmu-miR-1964-3p
mmu-miR-185* mmu-miR-3070b-3p
mmu-miR-770-3p mmu-miR-1224
mmu-miR-1956 mmu-miR-762
mmu-miR-329* mmu-miR-23b*
mmu-miR-669c mmu-miR-2861
mmu-miR-27a* mmu-miR-465c-5p
mmu-miR-3103* mmu-miR-574-5p
mmu-miR-187 mmu-miR-1934
mmu-miR-667* mmu-miR-146b*
mmu-miR-1198-5p mmu-miR-346
mmu-miR-465b-5p mmu-miR-344c*
mmu-miR-212-5p mmu-miR-547
mmu-miR-743a* mmu-miR-1188
mmu-miR-671-5p mmu-miR-5125
mmu-miR-705 mmu-miR-149*
mmu-miR-19b-2* mmu-miR-877
mmu-miR-328* mmu-miR-1946b
mmu-miR-678 mmu-miR-323-5p
mmu-miR-1932 mmu-miR-23a*
mmu-miR-341 mmu-miR-34a
mmu-miR-3067 mmu-miR-743b-5p
mmu-miR-365-1* mmu-miR-3104-5p
mmu-miR-1892 mmu-miR-128-2*
mmu-miR-1901 mmu-miR-3090*
mmu-miR-696 mmu-miR-19b-1*
mmu-miR-128-1* mmu-miR-342-5p
mmu-miR-1199 mmu-miR-3063*
mmu-miR-3102* mmu-miR-3092
C Proglucagon mRNA-binding proteins
Figure 13. In silico analysis of murine proglucagon mRNA sequence for miRNA binding
sites and RNA-binding protein sites. (A, B) Nucleotide sequences for the mouse proglucagon
mRNA were obtained from NCBI-GeneBank and analyzed using a web tool MicroInspector that
analyzed proglucagon mRNA sequence for the occurrence of binding sites for known and
registered mouse-specific (mmu) miRNAs. The diagram illustrates putative miRNA binding sites
on mouse proglucagon mRNA template (A). The chart lists potential miRNAs that may bind to
mouse proglucagon mRNA (B). (C) The mouse proglucagon mRNA-binding proteins were
obtained using the RNA-Binding Protein DataBase.

69
proglucagon gene expression (199). In the pancreatic α-cells, insulin represses proglucagon gene
expression via activation of Akt (262), however, in the intestinal L-cells, it is likely that insulin
utilizes the Wnt signaling pathway, but not the Akt pathway, to stimulate proglucagon promoter
activity (199). Recently, it was reported that the cAMP activator forskolin stimulated
proglucagon gene expression and hormone production in pancreatic and intestinal endocrine
cells via activation of Epac, suggesting a PKA-independent regulation of proglucagon (264,
265). Similarly, although we found that Akt activation is required for insulin to variably regulate
proglucagon mRNA levels in the hypothalamic adult and embryonic cell models, we do not rule
out involvement of other signaling pathways in the differential regulation of adult versus
embryonic hypothalamic proglucagon mRNA by insulin.
Among multiple signalling pathways activated by insulin, the PI3K-Akt pathway remains
the main focus in many studies on the CNS. Several investigations have demonstrated that
insulin activates PI3K in neurons (259, 260), and that PI3K inhibitors can block the ability of
insulin to regulate food intake (260). In the present study, it was confirmed that in the
proglucagon-expressing selective neuronal cell models insulin activates Akt, as evidenced by an
increase in the phosphorylation of Akt. Interestingly, treatment with the PI3K inhibitors reversed
the insulin-induced changes in proglucagon mRNA levels in both neuronal cell models. This
indicates that similar to peripheral tissues, insulin mediates its action via Akt activation in the
selective hypothalamic proglucagon neurons.
A number of reports suggest that leptin interacts with proglucagon-expressing neurons in
mice and increases hypothalamic GLP-1 content as well as proglucagon mRNA levels in
brainstem neurons through the STAT signaling pathway (302, 303, 305-307). Similar to these
findings, it was detected that leptin regulated proglucagon mRNA in a STAT3-dependent
manner in the hypothalamic neuronal cell models. It was found that leptin induced a rapid
increase at 1 h in the proglucagon mRNA followed by a decrease at later time points. The leptin-
mediated early proglucagon mRNA upregulation is consistent with the action of CNTF, a
cytokine that induced proglucagon mRNA in mHypoA-2/10 cells while simultaneously
activating the JAK2/STAT3 pathway (19). In contrast, leptin-mediated delayed downregulation
is in accordance with the suppressive effect of other pro-inflammatory cytokines on proglucagon
gene expression (344). The effect of leptin detected in this study is, however, difficult to interpret

70
in the physiological context, due to the biphasic regulation of proglucagon mRNA. This action
also warrants further investigation on the regulation of synthesis of PGDPs in the hypothalamic
neuronal cells that seems to be challenging at present, because the quantity of PGDPs,
particularly GLP-1 and GLP-2, synthesized or secreted by the hypothalamic neuronal cells
appears to be quite low, most probably in picomolar or femtomolar range, and currently available
detection assays, such as EIA, ELISA, RIA or Western blot analysis, are not sensitive enough for
these studies. Notwithstanding, changes observed at the proglucagon mRNA level are reflected
at the translational level (345); and therefore, the mRNA changes can be used as a reliable
indicator of changes in PGDP production. Thus, it can be hypothesized that leptin may increase
biosynthesis of PGDPs at early time points followed by their decrease at later time points as a
compensatory response in the hypothalamic neuronal cells, and future studies to examine this
possibility will be required.
The level of mRNA in a cell is determined by either changes in mRNA stability or the
direct regulation of gene transcription at the 5’ regulatory region. The regulation of mRNA half-
life, and the cis-regulatory sequences and trans-acting factors necessary for the expression and
regulation of the proglucagon gene have been determined in islet α-cells and intestinal L-cells
(185, 194, 332, 345-348). Most studies on the proglucagon promoter have focused on the rat
gene, although some studies with promoters from other species, including a few studies using the
human gene promoter have been conducted (191, 330, 349). To complement studies with cell
lines, transgenic mice have been generated which have largely been concordant with results
based on the cell lines (188, 191, 330). Yet, little is known about the sequences or factors
required for the proglucagon gene expression in select neurons of the hypothalamus (332, 346,
347). A key reason for this limited knowledge has been the lack of a suitable neuronal cell line.
Since the embryonic and adult hypothalamic cell lines express endogenous proglucagon gene,
the regulation of proglucagon gene expression in these neuronal models was studied by
transfecting available rat and human proglucagon promoter reporter genes due to the current
unavailability of mouse proglucagon promoter reporter plasmids. It was found that the
transfection efficiency in the adult hypothalamic cell model mHypoA-2/10 was very low when
compared to more than 70% in the mHypoE-39 cell line; thus the transient transfection analysis
was continued using the embryonic cell model.

71
Previous transfection of the reporter constructs containing 5’ flanking regions of the
human proglucagon gene demonstrated that a short 312-base rat proglucagon promoter region is
sufficient for activation by cAMP, CREB and other transcription factors (193, 350, 351). By
deletion analysis performed in this project, a novel area between bases -602 and -829 in human
proglucagon promoter was identified, which is required for the promoter-driven induction by
forskolin in the hypothalamic cell lines. Unlike forskolin, insulin and leptin did not directly
affect human or rat proglucagon gene transcription at the level of the promoter in the mouse
hypothalamic cell lines. There could be two possible reasons for the lack of an effect. First, there
could be low sequence similarity between the human, rat and mouse proglucagon 5’ regulatory
regions. However, it is unlikely as human proglucagon promoter transgenic mice show that the
human proglucagon promoters are expressed in mouse neurons (191, 330). Further, the proximal
promoter elements are highly conserved in the rodent and human proximal proglucagon
promoter sequences (191). The homology between human and rat proglucagon promoters shows
that they are highly related, however, there can be several differences in the nucleotide sequence
(191). The G1 promoter is highly conserved as compared to the less well conserved G2-G4
enhancer sequences. These elements have binding sites for several transcription factors including
isl-1, cdx-2/3, Brn-4, pax-6, CREB and AP-1 (185, 191). Although using transcription factor
search programs, STAT3 binding sequences within 4000 bp upstream of the transcription
initiation site were not found, further search and investigation into distal promoter regions is
required to detect STAT binding sequences and also other cis-elements for downstream
transcription factors activated by insulin and leptin.
A 300 bp sequence that contains G2, G3 and G4 enhancer elements of rat proglucagon
promoter is sufficient for proglucagon gene expression in the mouse pancreatic islet cells,
therefore, two reporter plasmids containing -476 to +58 and -312 to +58 from rat proglucagon
promoter were generated (191, 330). Previously, these promoter constructs were used to study
proglucagon gene expression in hamster islet cell line InR1-G9 and mouse islet cell line αTC-1
(330). As is evident from Figure 6A, B, transfection of embryonic hypothalamic cells with these
two rat proglucagon promoter constructs containing -476 to +58 and -312 to +58 bp sequences
from transcription initiation site resulted in a much lower basal activity of these plasmids than
the basal activity of the human proglucagon plasmids, and no significant changes were detected
in the activity of rat proglucagon promoter plasmids by insulin or leptin treatment. Again, the

72
low basal transcription activity of rat promoters in the mouse cell line could due to low sequence
similarity between the rat and mouse proglucagon 5’ regulatory regions. Second, the 5’ flanking
sequences used for the proglucagon constructs were only 312 and 476 bp long, and thus cis-
acting responsive elements in the neuronal proglucagon gene promoter could be located further
upstream of these regions. Previously, it was found that unlike the rat proximal proglucagon
promoter elements, the equivalent human proglucagon proximal promoter sequences containing
G2, G3 and G4 enhancer elements did not induce transcriptional activity in transfected mouse
islet or intestinal cells; therefore, plasmids containing additional elements up to -602 bp, -829 bp
or larger segments of human proglucagon gene promoter were generated (191). These larger
human reporter plasmids supported transcriptional activity in the mouse pancreatic islet or
intestinal cells, and also in selected neurons of transgenic mice that contained 602 bases of
human proglucagon 5’ flanking sequence (191, 330). Thus, the use of non-species specific
promoters can confound the analysis, and therefore, the lack of insulin or leptin transcriptional
effects using the rat or human promoter in the mouse hypothalamic cell lines does not
conclusively exclude transcriptional regulation of mouse hypothalamic proglucagon gene.
Generation of mouse proglucagon promoter plasmids is required to conduct further studies.
Because of the lack of changes in the activity of proglucagon reporter gene constructs,
the stability of the proglucagon mRNA in the presence of insulin and leptin was analyzed. Using
RNA polymerase II gene transcription inhibitors actinomycin D and DRB in the hypothalamic
neuronal cells, it was detected that the changes in mRNA expression at early time points induced
by both insulin and leptin were due to increased mRNA stability, whereas leptin-induced
changes in the mRNA expression at the later time point do not seem to be controlled by changes
in the rate of mRNA decay in the adult neuronal cells. The decrease in mRNA expression caused
by leptin treatment at 12 h may occur due to suppressed transcription, for which further
investigation of distal promoter regions for putative cis- and trans-elements is required.
Mechanisms involved in proglucagon mRNA stability in islet α-cells and intestinal L-cells are
known to some extent (194, 345), however, currently, no information is available upon
regulatory mechanisms for proglucagon mRNA stability in the hypothalamus.
Regulation of gene expression at the post-transcriptional level by mRNA transcript
stability is widespread in eukaryotes (352). Among several factors that regulate mRNA stability,

73
miRNA and mRNA-binding proteins play an important role is altered turnover of mRNA. For
example, for the rapid decay of TNF-α mRNA, which contains an adenylate-uridylate-rich
elements. miR16 is required alongwith RNA-binding proteins in HeLa cells (353). miRNAs are
small (22 nucleotide), noncoding RNAs that act as negative regulators of gene expression at a
post-transcriptional level (354). They regulate either the degradation of their specific target
mRNAs or the inhibition of mRNA translation (355, 356). In this thesis, as it was found that
insulin and leptin affected hypothalamic proglucagon mRNA stability, putative miRNA binding
sites on proglucagon mRNA template were searched. It was detected that there are binding sites
for several miRNAs including miRNA128, a brain-enriched microRNA, that downregulates
doublecortin gene expression by inducing degradation of doublecortin mRNA in neuroblastoma
cells (357), and miRNA494 that downregulates PTEN in the bronchial epithelial cells (358).
Because insulin and leptin have been shown to regulate miRNA expression (359, 360), it is
possible that they may regulate proglucagon mRNA stability as well via miRNA activation or
suppression. Next, using the RBPDB program, the proglucagon mRNA sequence was scanned
for putative mRNA-binding protein sites that may also regulate proglucagon mRNA stability.
Several RNA-binding proteins were detected, including nervous system-specific RNA-binding
protein ELAVL2 or QKI that have been found to regulate gene expression in the nervous system
(361-363). Further studies to determine role of insulin, leptin and RNA-binding proteins in
hypothalamic proglucagon mRNA regulation are warranted.
Taken together, these experiments indicate that insulin and leptin can act directly upon
proglucagon neuronal cells to regulate proglucagon mRNA levels. Insulin, through an Akt-
dependent mechanism, and leptin, through JAK2/STAT3 activation, regulate proglucagon
mRNA levels, although transfections with human proglucagon promoter reporter gene constructs
indicate that insulin or leptin may not act directly at the level of transcription, but may instead act
to increase the stability of proglucagon mRNA. The PGDPs are key regulators of feeding
behavior, thus a better understanding of the mechanisms through which insulin and leptin
regulate hypothalamic proglucagon neurons is important to further expand and challenge our
current knowledge of feeding circuits.
74
Chapter 4
Glucagon-like Peptide-1 Receptor Agonist, Exendin-4,
Regulates Feeding-associated Neuropeptides in
Hypothalamic Neurons in vivo and in vitro

75
Publication:
Prasad S. Dalvi, Anaies Nazarians-Armavil, Matthew J. Purser, and Denise D. Belsham.
Glucagon-like peptide-1 receptor agonist, Exendin-4, regulates feeding-associated neuropeptides
in hypothalamic neurons in vivo and in vitro. Endocrinology (2012) 153:2208-2222
A.N.A. was a graduate student in the D.D.B. lab and assisted in the treatment of cells and RNA
isolation in the inhibitor study included in the publication and presented in this thesis. M.J.P.
was a summer research and work-study student in the D.D.B. lab working directly under
supervision of P.S.D. and performed the immunohistological study on the hypothalamic sections
of ghrelin knockout mice included in the original publication, but not presented in this thesis. All
other experiments included in the publication and presented in this thesis were designed by
P.S.D. and D.D.B. P.S.D. executed all the experiments in this thesis, analyzed all data, designed
and created all figures, wrote and revised the manuscript under the supervision of D.D.B.
Published figures:
Figure 14. Intracerebroventricular injection of exendin-4 was effective to reduce food and water
intake, and body weight in mice.
Figure 15. Exendin-4 activates hypothalamic neurons.
Figure 16. Acute exendin-4 treatment increases the number of hypothalamic neurons co-
expressing c-Fos-ir with α-MSH-, NPY-, neurotensin- or ghrelin-ir.
Figure 17. Graphical representation showing the number of neurons expressing c-Fos and
neuropeptide-ir in the ARC, VMH, DMH, PVN, LH, PeV, and the internuclear space between
the VMH and DMH of the saline- or exendin-4-treated mouse hypothalamus.
Figure 18. Expression profile of GLP-1R and appetite-regulating neuropeptides in the
hypothalamic neuronal cell lines.
Figure 19. Exendin-4 induces c-Fos activation and CREB/ATF-1 phosphorylation in the
hypothalamic neuronal cell lines.
Figure 20. Regulation of neurotensin and ghrelin mRNA expression by exendin-4 in the
mHypoA-2/30 and mHypoE36/1 neuronal cell lines.
Figure 21. Regulation of neurotensin and ghrelin mRNA expression via activation of the PKA
pathway.
Permissions were obtained to reproduce the copyrighted material.

76
4 Glucagon-like Peptide-1 Receptor Agonist, Exendin-4,
Regulates Feeding-associated Neuropeptides in Hypothalamic
Neurons in vivo and in vitro
4.1 Abstract
Exendin-4, a long-acting GLP-1R agonist, is a potential regulator of feeding behavior
through its ability to inhibit gastric emptying, reduce food intake and induce satiety. GLP-1R
activation by exendin-4 induces anorexia; however, the specific populations of neuropeptidergic
neurons activated by exendin-4 within the hypothalamus, the central regulator of energy
homeostasis, remain unclear. This study determines whether exendin-4 regulates hypothalamic
neuropeptide expression and explores the signaling mechanisms involved. The distribution and
quantity of exendin-4-induced c-Fos immunoreactivity were evaluated to determine activation of
α-MSH/POMC, NPY, neurotensin and ghrelin neurons in hypothalamic nuclei during exendin-4-
induced anorexia in mice. Additionally, exendin-4 action on neurotensin and ghrelin transcript
regulation was examined in immortalized hypothalamic neurons. With anorexia induced by
intracerebroventricular exendin-4, α-MSH/POMC and NPY neurons were activated in the ARC,
with simultaneous activation of neurotensin-expressing neurons in the PVN, and ghrelin-
expressing neurons in the ARC, PVN and periventricular hypothalamus, suggesting that neurons
in one or more of these areas mediate the anorexic action of exendin-4. In the hypothalamic
neuronal cell models, exendin-4 increased cAMP, CREB/ATF-1 and c-Fos activation, and via a
PKA-dependent mechanism regulated neurotensin and ghrelin mRNA expression, indicating that
these neuropeptides may serve as downstream mediators of exendin-4 action. These findings
provide a previously unrecognized link between central GLP-1R activation by exendin-4 and the
regulation of hypothalamic neurotensin and ghrelin. Further understanding of this central GLP-
1R activation may lead to safe and effective therapeutics for the treatment of metabolic
disorders.
77
4.2 Introduction
The hypothalamus integrates peripheral and central signals to regulate appetite and
energy homeostasis. Recently, GLP-1 has emerged as a potential negative regulator of feeding
behavior (6). The GLP-1R is widely expressed in the hypothalamus (217). GLP-1 plays multiple
roles in metabolic homeostasis due to its glucoregulatory function and inhibitory action on food
and water intake (26, 364). Endogenous GLP-1 has a short plasma half-life because of its rapid
degradation by DPP-4, therefore longer-acting GLP-1 analogs, GLP-1R agonists or DPP-4
inhibitors are under investigation (365). Exendin-4 is a long-acting GLP-1R agonist peptide that
was originally isolated from the salivary gland of the Gila monster, Heloderma suspectum.
Currently, exendin-4 and several DPP-4 inhibitors that increase the concentration of intact
endogenous GLP-1 by preventing its degradation are used to treat type 2 diabetes. Exendin-4 has
been shown to induce weight loss in overweight patients, suggesting that it can regulate food
intake and body weight by either directly interacting with peripheral GLP-1R-expressing vagal
afferents to affect gastro-intestinal motility, or readily crossing the BBB to directly interact with
hypothalamic appetite-regulating centers (219, 366, 367). However, other clinical trials indicate
that DPP-4 inhibitors are weight neutral (368). These findings suggest that the hypothalamic
GLP-1R activation mediated by exendin-4 may differ from that mediated by increased
concentrations of intact endogenous GLP-1 achieved through DPP-4 inhibition. That is, while
both GLP-1 and exendin-4 act on the hypothalamus to modulate feeding behavior, key
differences exist between the anorectic actions of endogenous GLP-1 and exendin-4 (369).
Considering the widespread clinical use of exendin-4, further research is warranted to study the
mechanisms underlying the anorectic actions of exendin-4 within the hypothalamus (7).
The hypothalamus is subdivided into several nuclei consisting of groups of neurons with
specific functions. The ARC, PVN, VMH, DMH, LH, and PeV play an important role in the
regulation of energy intake and expenditure by integrating central and peripheral orexigenic and
anorexigenic signals. It is well established that there are two distinct neuronal populations in the
ARC: NPY and α-MSH/POMC neurons. Additionally, anorexigenic neurotensin is expressed
within the ARC (105, 106, 156), PVN, DMH and LH (56), whereas orexigenic ghrelin neurons
are present in the ARC, PVN, the internuclear spaces between hypothalamic nuclei, the
perifornical region, and the ependymal layer of the third ventricle (105).

78
Exendin-4 has been shown to activate neurons in the PVN via GLP-1R-dependent
networks (221). Compelling evidence demonstrates that the GLP-1Rs located in the PVN, but
not in the ARC, reduce food intake (131), implying that GLP-1Rs in specific hypothalamic
regions have discrete effects on appetite regulation. Furthermore, the finding that GLP-1Rs
expressed on the ARC POMC neurons do not induce anorexia raises the possibility that exendin-
4 may stimulate or inhibit other, yet to be identified downstream effectors within the
hypothalamus to mediate its anorectic effect (131), such as neurotensin and ghrelin neurons,
localized to similar regions as the GLP-1R (216). Importantly, neurotensin and ghrelin have been
shown to play a significant role in feeding and energy homeostasis (6). Whether exendin-4 exerts
its effect directly on neurotensin or ghrelin neurons via GLP-1R activation remains unknown.
The GLP-1R is a G-protein-coupled receptor acting through adenylate cyclase, cAMP
and PKA activation (370). Recently, exendin-4 was demonstrated to suppress appetite and
reduce body weight by PKA activation in brainstem GLP-1R-expressing neurons (327).
However, in the hypothalamus the exact neurons activated by exendin-4 to induce anorexia are
unknown, and whether appetite-regulating neuropeptide gene expression is altered within GLP-
1R-expressing hypothalamic neurons remains to be determined. The present study proposes that
hypothalamic GLP-1R activation by exendin-4 regulates feeding-related neurons, and modulates
neuropeptide expression via cAMP/PKA activation. Using in vivo and in vitro models, the
hypothalamic neuronal activation by exendin-4 was mapped, and the modulation of neurotensin
and ghrelin gene expression following exendin-4 treatment and the signaling mechanisms
involved were studied.
4.3 Results
4.3.1 Effect of i.c.v. exendin-4 on food and water intake, and animal
weight
In order to test the efficacy of the i.c.v. injections, a short-term analysis of exendin-4
effects on food and water intake was performed. The dose of exendin-4 (100 ng/mouse) used to
induce anorexia was based on a previous report (221). It was found that i.c.v. exendin-4
significantly reduced food in ad libitum-fed wild type mice, and this effect lasted for at least 24 h
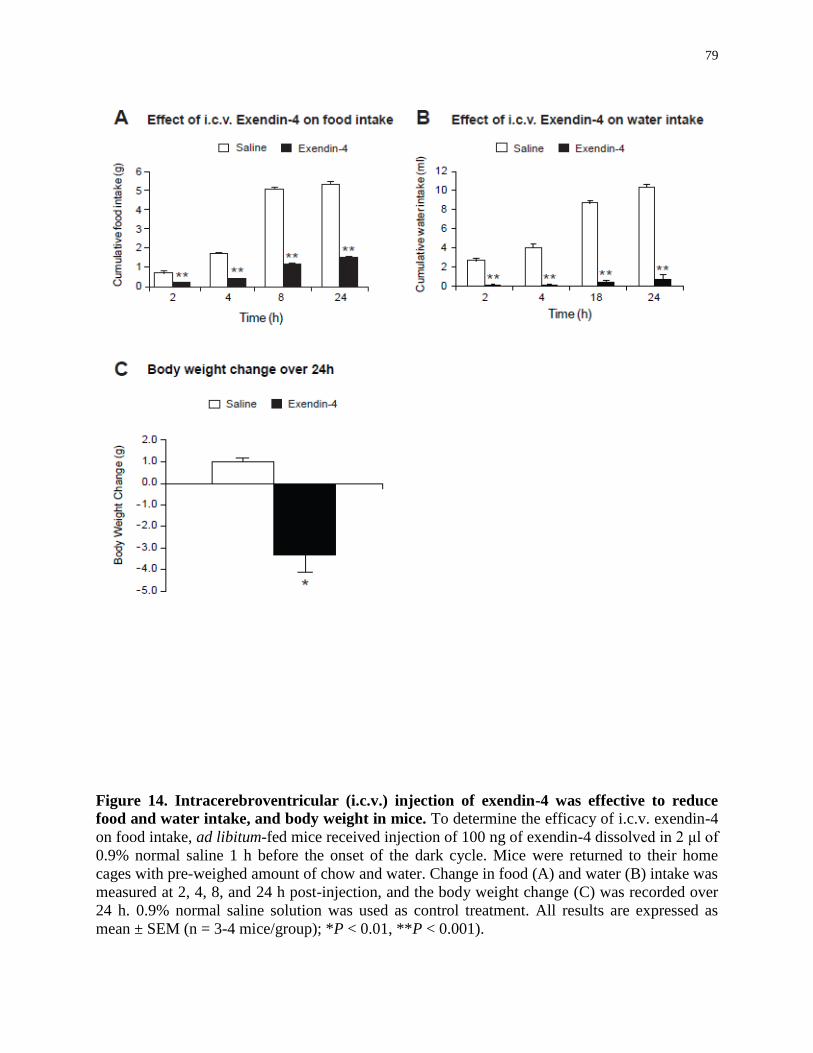
79
Figure 14. Intracerebroventricular (i.c.v.) injection of exendin-4 was effective to reduce
food and water intake, and body weight in mice. To determine the efficacy of i.c.v. exendin-4
on food intake, ad libitum-fed mice received injection of 100 ng of exendin-4 dissolved in 2 μl of
0.9% normal saline 1 h before the onset of the dark cycle. Mice were returned to their home
cages with pre-weighed amount of chow and water. Change in food (A) and water (B) intake was
measured at 2, 4, 8, and 24 h post-injection, and the body weight change (C) was recorded over
24 h. 0.9% normal saline solution was used as control treatment. All results are expressed as
mean ± SEM (n = 3-4 mice/group); *P < 0.01, **P < 0.001).

80
[cumulative food intake (g): 1 h, saline (0.67 ± 0.14) versus exendin-4 (0.13 ± 0.03), P < 0.01; 4
h, saline (1.67 ± 0.07) versus exendin-4 (0.50 ± 0.05), P < 0.01; 8 h, saline (4.63 ± 0.17) versus
exendin-4 (1.23 ± 0.07), P < 0.001; 24 h, saline (5.00 ± 0.25) versus exendin-4 (1.73 ± 0.11), P <
0.001] (Figure 14A). Similarly, water intake was found to be suppressed over 24 h time period
[cumulative water intake (ml): 1 h, saline (2.67 ± 0.27) versus exendin-4 (0.08 ± 0.07), P <
0.001; 4 h, saline (4.00 ± 0.47) versus exendin-4 (0.08 ± 0.07), P < 0.001; 8 h, saline (8.67 ±
0.27) versus exendin-4 (0.33 ± 0.27), P < 0.001; 24 h, saline (10.33 ± 0.27) versus exendin-4
(0.67 ± 0.54), P < 0.001] (Figure 14B). Furthermore, significant weight loss at 24 h in exendin-4-
treated mice compared with the saline-treated control mice was observed [change in body weight
(g): 24 h, saline 1.00 ± 0.17 versus exendin-4 -3.33 ± 0.79, P < 0.01] (Figure 14C). The dose of
exendin-4 used to induce anorexia was based on a previous report (221). Using an equivalent
central dose, Baggio et al. showed that the anorectic action of central exendin-4 was not simply a
nonspecific response, as anorexia was absent in GLP-1R knock-out mice, which lack functional
GLP-1R (371). This suggests that the anorexia induced by central exendin-4 may be mediated
via activation of GLP-1Rs expressed in hypothalamic appetite-regulating nuclei located in the
vicinity of the third ventricle. Nevertheless, as peptides delivered into the third cerebral ventricle
can access GLP-1Rs not only in the hypothalamus but also in the brainstem and the central
nucleus of the amygdala, any indirect activation of hypothalamic nuclei through activation of
these extra-hypothalamic regions that can also induce suppression of food and water intake by
their own mechanisms cannot be ruled out (209).
4.3.2 Effect of i.c.v. exendin-4 on activation of hypothalamic nuclei and
neuropeptidergic neurons
As assessed by IHC for c-Fos, a protein encoded by the immediate-early gene c-fos, a
distinctive pattern of neuronal activation was noted after the central injection of exendin-4 into
the third cerebral ventricle compared with the saline controls (Figure 15B, C, E, and F).
Significant increases in the number of c-Fos-positive neurons were detected in the hypothalamic
ARC (increase by 315%), DMH (increase by 214%), PVN (increase by 467%), and PeV
(increase by 1927%), but not in the LH and VMH [c-Fos-positive nuclei: ARC, saline (12.77 ±
1.55) versus exendin-4 (53.00 ± 5.35), P < 0.001; DMH, saline (13.62 ± 1.39) versus exendin-4

81
Figure 15. Exendin-4 activates hypothalamic neurons. Immunohistochemistry was performed
to assess neuronal activation by c-Fos-immunoreactivity (ir) in wild-type mice treated with saline
or exendin-4. A-F: Representative photomicrographs showing expression of c-Fos-ir in the
hypothalamic ARC (A-C), VMH (A-C), DMH (A-C), PVN (D-F), LH (D-F) and PeV (A-F)
regions in coronal sections of the mouse hypothalamii (as indicated on the images). Scale bar: 1
mm. Inset in each image represents a higher magnification of the boxed area. Scale bar: 100 μm.
A and D represent negative control images for the c-Fos antibody. DAB staining: nuclear brown
(c-Fos). 3V, third ventricle. G: Bar graph showing the number of c-Fos-ir neurons in the
hypothalamic regions at 2 h post-treatment. Data in the bar graph are expressed as mean ± SEM
(n = 3-4 animals/group; *P < 0.05, **P < 0.01, ***P < 0.001).

82
(42.78 ± 3.93), P < 0.001; PVN, saline (12.06 ± 1.97) versus exendin-4 (68.37 ± 13.37), P =
0.002; PeV, saline (2.37 ± 0.42) versus exendin-4 (48.03 ± 11.52), P = 0.017; LH, saline (4.25 ±
1.48) versus exendin-4 (9.52 ± 2.30), P = 0.082; VMH, saline (1.71 ± 0.45) versus exendin-4
(3.08 ± 0.94), P = 0.227] (Figure 15G). Activation of these hypothalamic regions was expected,
as these regions widely express GLP-1Rs (216). In this study, the potential activation of other
CNS areas known to express the GLP-1R, such as certain brainstem nuclei and the central
nucleus of the amygdala, was not studied as the main aim of this study was to investigate the
activation of hypothalamic nuclei involved in feeding regulation.
The next goal was to determine the neuropeptidergic neurons activated in these regions
by performing double-staining IHC for c-Fos and neuropeptide co-expression (Figs. 16 and 17).
It was found that exendin-4 significantly activated α-MSH/POMC-ir neurons (by 129%) in the
hypothalamic ARC [saline (12.51 ± 1.98) versus exendin-4 (28.69 ± 3.33), P = 0.002] (Figure
17B), and also robustly activated neurotensin neurons (by 488%) in the PVN [saline (6.62 ±
0.98) versus exendin-4 (38.92 ± 1.42), P < 0.001] (Figure 17F). Both α-MSH/POMC and
neurotensin neurons, being anorexigenic, are implicated in the inhibition of appetite.
Surprisingly, it was found that orexigenic NPY-ir neurons were significantly increased in the
ARC [saline (10.75 ± 2.35) versus exendin-4 (42.45 ± 5.91), P = 0.004] (Figure 17D), whereas
ghrelin-ir neurons were activated in the ARC, PVN and PeV of exendin-4-treated mice [ARC,
saline (6.15 ± 2.14) versus exendin-4 (22.48 ± 1.16), P = 0.005; PVN, saline (7.16 ± 0.90) versus
exendin-4 (22.52 ± 2.67), P = 0.011; PeV, saline (3.33 ± 0.53) versus exendin-4 (34.11 ± 8.51),
P = 0.042] (Figure 17H). Importantly, no changes were noticed in the number of neurons
expressing only neuropeptide-immunoreactivity in the hypothalamic regions of saline- or
exendin-4-treated animals (Figure 17A, C, E, and G). Since there is still some controversy
regarding the synthesis of ghrelin in the hypothalamus, the specificity of the ghrelin antibody
was confirmed by using the same antibody in ghrelin knockout mouse in another control
experiment (372). The antibody did not detect ghrelin-ir staining in the PVN of the ghrelin
knockout sections versus the litter-matched controls (372). These findings suggest that the
induced anorexia may be a function of complex interactions occurring between appetite-
regulating anorexigenic and orexigenic neurons in the hypothalamus.
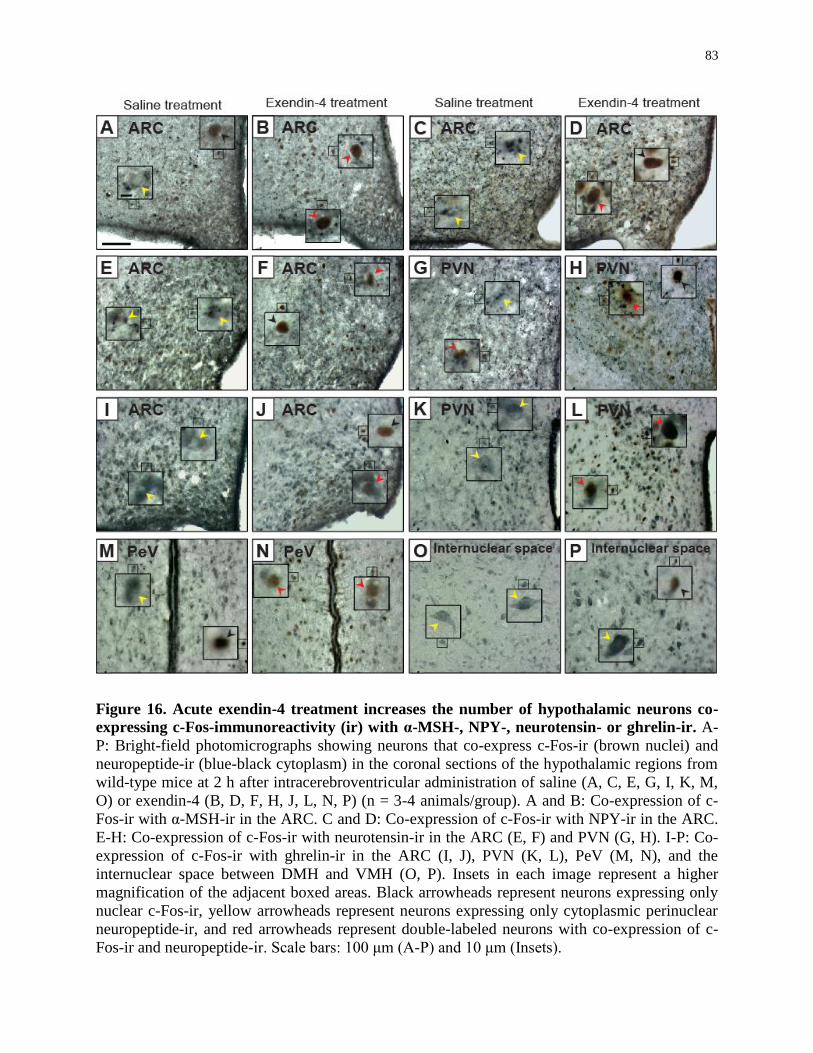
83
Figure 16. Acute exendin-4 treatment increases the number of hypothalamic neurons co-
expressing c-Fos-immunoreactivity (ir) with α-MSH-, NPY-, neurotensin- or ghrelin-ir. A-
P: Bright-field photomicrographs showing neurons that co-express c-Fos-ir (brown nuclei) and
neuropeptide-ir (blue-black cytoplasm) in the coronal sections of the hypothalamic regions from
wild-type mice at 2 h after intracerebroventricular administration of saline (A, C, E, G, I, K, M,
O) or exendin-4 (B, D, F, H, J, L, N, P) (n = 3-4 animals/group). A and B: Co-expression of c-
Fos-ir with α-MSH-ir in the ARC. C and D: Co-expression of c-Fos-ir with NPY-ir in the ARC.
E-H: Co-expression of c-Fos-ir with neurotensin-ir in the ARC (E, F) and PVN (G, H). I-P: Co-
expression of c-Fos-ir with ghrelin-ir in the ARC (I, J), PVN (K, L), PeV (M, N), and the
internuclear space between DMH and VMH (O, P). Insets in each image represent a higher
magnification of the adjacent boxed areas. Black arrowheads represent neurons expressing only
nuclear c-Fos-ir, yellow arrowheads represent neurons expressing only cytoplasmic perinuclear
neuropeptide-ir, and red arrowheads represent double-labeled neurons with co-expression of c-
Fos-ir and neuropeptide-ir. Scale bars: 100 μm (A-P) and 10 μm (Insets).

84
Figure 17. Graphical representation showing the number of neurons expressing c-Fos and
neuropeptide-immunoreactivity (ir) in the ARC, VMH, DMH, PVN, LH, PeV, and the
internuclear space between the VMH and DMH of the saline- or exendin-4-treated mouse
hypothalamus. Double-labeled immunohistochemistry for c-Fos-ir and α-MSH-ir (B), c-Fos-ir
and NPY-ir (D), c-Fos-ir and neurotensin-ir (F), or c-Fos-ir and ghrelin-ir (H) indicates that
intracerebroventricular exendin-4 activates hypothalamic neuropeptidergic neurons. Note that
there was no change in the number of neurons expressing only α-MSH-ir (A), NPY-ir (C),
Neurotensin-ir (E) or ghrelin-ir (G) in the hypothalamic regions of saline- or exendin-4-treated
animals. Data are represented as mean ± SEM (n = 3-4 mice/group); *P < 0.05, **P < 0.01,
***P < 0.001 vs. saline treatment. Statistical significance was calculated by two-tailed, unpaired
t-test.

85
4.3.3 Expression of GLP-1R and appetite-regulating neuropeptides in
adult mHypoA-2/30 and embryonic mHypoE-36/1 neurons
Based on the in vivo findings that exendin-4 activates neurotensin and ghrelin neurons in
the hypothalamus, direct regulation of hypothalamic neurotensin and ghrelin mRNA expression
by exendin-4 was investigated using hypothalamic cell models. Our lab has previously reported
the generation of embryonic and adult mouse hypothalamic cell lines (18, 19). Using RT-PCR,
the presence of GLP-1R mRNA in both adult mHypoA-2/30 and embryonic mHypoE-36/1
neuronal cell models was confirmed (Figure 18A). GLP-1R-positive mouse jejunal tissue served
as a positive control. Further, the expression of hypothalamic neuropeptides involved in appetite
regulation in these cell lines was analyzed. Both cell models express ghrelin and neurotensin, and
the adult mHypoA-2/30 cells express POMC as well (Figure 18B). Currently, there are no
hypothalamic cell models reported with a functional endogenous GLP-1R. Therefore, we sought
to determine if the GLP-1R was functionally active in the adult and embryonic neurons by
measuring GLP-1R-mediated cAMP activation following exendin-4 treatment. Forskolin was
used as a positive control. Using cAMP-RIA, it was found that exendin-4 increased cAMP levels
in mHypoA-2/30 neuronal cell line [cAMP content (pmol/µg protein): vehicle, 0.49 ± 0.08; 1
µM forskolin, 2.35 ± 0.17; 10 nM exendin-4, 0.79 ± 0.16; 50 nM exendin-4, 0.99 ± 0.07;
forskolin versus saline, P < 0.01; exendin-4 (10 nM and 50 nM) versus saline, P < 0.05] (Figure
18C). Also in mHypoE-36/1 neuronal cells exendin-4 significantly increased cAMP content
compared to vehicle control [cAMP content (pmol/µg protein): vehicle (0.54 ± 0.03), 1 µM
forskolin (2.02 ± 0.39), 10 nM exendin-4 (0. 90 ± 0.06), 50 nM exendin-4 (0.81 ± 0.06);
forskolin versus saline, P < 0.01; exendin-4 (10 nM and 50 nM) versus saline, P < 0.05, (Figure
18D)]. These data indicate that the GLP-1Rs in these cells are responsive to exendin-4. Further,
using exendin-9-39, a GLP-1R antagonist, we studied whether exendin-4 directly activates GLP-
1R to stimulate cAMP production [16]. It was found that 1 µM exendin-9-39 alone did not
stimulate cAMP production in both cell models, but completely attenuated the stimulatory effect
of exendin-4 on cAMP levels, suggesting that exendin-4 stimulates cAMP production via GLP-
1R activation in both cell lines [cAMP content (pmol/µg protein): mHypoA-2/30, vehicle, 0.49 ±
0.08; 10 µM forskolin, 10.29 ± 0.79; 10 nM exendin-4, 0.89 ± 0.14; 1 µM exendin-9-39, 0.41 ±
0.02; 1 µM exendin-9-39 + 10 nM exendin-4, 0.55 ± 0.02; mHypoE-36/1, vehicle, 0.38 ± 0.13;

86

87
Figure 18. Expression profile of GLP-1 receptor (GLP-1R) and appetite-regulating
neuropeptides in the hypothalamic neuronal cell lines. A: Expression of GLP-1R mRNA
transcript in jejunum and the mHypoA-2/30 and mHypoE-36/1 neuronal cell lines by RT-PCR
using specific primers for mouse GLP-1R gene. Total RNA, isolated from mouse jejunum and
the indicated cell lines, was used as template for RT-PCR using One-Step RT-PCR kit. Jejunal
RNA was used as a positive control for GLP-1R expression. M, markers; NTC, non-template
control. B: RT-PCR analysis results for the mRNA expression of neuropeptides in mHypoA-2/30
and mHypoE-36/1 cells. ‘+’ indicates that the gene is expressed; ‘-’ indicates that the gene is not
expressed. C and D: Expression of functional GLP-1R by cAMP-RIA. E and F: Exendin-4 (Ex-
4) stimulates cAMP production via the GLP-1R activation. cAMP is activated by Ex-4 in
mHypoA-2/30 (C, E) and mHypoE-36/1 (D, F) neuronal cells. The cells were pretreated for 5
minutes with 1 µM exendin (9-39) [Ex(9-39)] or vehicle alone prior to a 10-minute treatment
with vehicle, forskolin (1 or 10 µM) or Ex-4 (10 or 50 nM). The amount of intracellular cAMP
was determined in triplicate by RIA. Forskolin was used as a positive control. All results are
expressed as mean ± SEM (n = 4-6; *P < 0.05, **P < 0.01 vs. vehicle control).
88
10 µM forskolin, 8.69 ± 0.71; 10 nM exendin-4, 0.89 ± 0.14; 1 µM exendin-9-39, 0.35 ± 0.01; 1
µM exendin-9-39 + 10 nM exendin-4, 0.41 ± 0.01; forskolin versus saline, P < 0.01; exendin-4
(10 nM) versus vehicle, P < 0.05] (Fig 18E and F).
4.3.4 Activation of c-Fos and CREB/ATF-1 by exendin-4 in the
hypothalamic neuronal cells
The key signaling pathway that exendin-4 activates is the cAMP/PKA pathway.
Therefore, it was next determined if the downstream effectors of this pathway, such as
CREB/ATF-1 and c-Fos, are activated by exendin-4 in the hypothalamic adult and embryonic
cells. The neuronal cells were treated with 10 nM exendin-4, and activation of CREB/ATF-1 and
c-Fos was analyzed over 6 h. By Western blot analysis, exendin-4 significantly induced c-Fos
activation in the adult mHypoA-2/30 cell line from 30 min through 4 h post-treatment [c-Fos/Gβ
(30 min): vehicle (0.73 ± 0.10) versus 10 nM exendin-4 (1.14 ± 0.05), P < 0.01] (Figure 19A).
Further, exendin-4 significantly increased phosphorylation of CREB at Ser 133 at 15 and 30 min
in the adult neuronal cells, by 53% and 58%, respectively, [pCREB/total CREB: 15 min, vehicle
(0.74 ± 0.08) versus 10 nM exendin-4 (1.13 ± 0.08), P < 0.01; 30 min, vehicle (0.83 ± 0.05)
versus 10 nM exendin-4 (1.31 ± 0.22), P < 0.01] (Figure 19B). Similarly, exendin-4
significantly increased phosphorylation of CREB at 5min in the embryonic cells by 42%,
[pCREB/total CREB: 5 min, vehicle (0.74 ± 0.07) versus 10 nM exendin-4 (1.05 ± 0.15), P <
0.05] (Figure 19D). Simultaneously, exendin-4 induced phosphorylation of ATF-1 from 15 to 60
min in the adult neuronal cells with the maximal phosphorylation at 30 min [pATF-1/total
CREB: 30 min, vehicle (0.87 ± 0.08) versus 10 nM exendin-4 (1.34 ± 0.25), P < 0.01] (Figure
19C). In the embryonic cells, exendin-4 induced significant increase in ATF-1 phosphorylation
at 5 and 30 min [pATF-1/total CREB: 5 min, vehicle (1.05 ± 0.14) versus 10 nM exendin-4 (1.83
± 0.16), P < 0.05; 30 min, vehicle (1.84 ± 0.13) versus 10 nM exendin-4 (2.55 ± 0.11), P < 0.05]
(Figure 19E).
Activated CREB or ATF-1 bind to a cAMP response element (CRE) within the promoter
region of cAMP/CREB/ATF-1 downstream target genes. This leads to the recruitment of CREB
binding protein (CBP/p300), and possibly other nuclear co-activators, to enhance transcription of
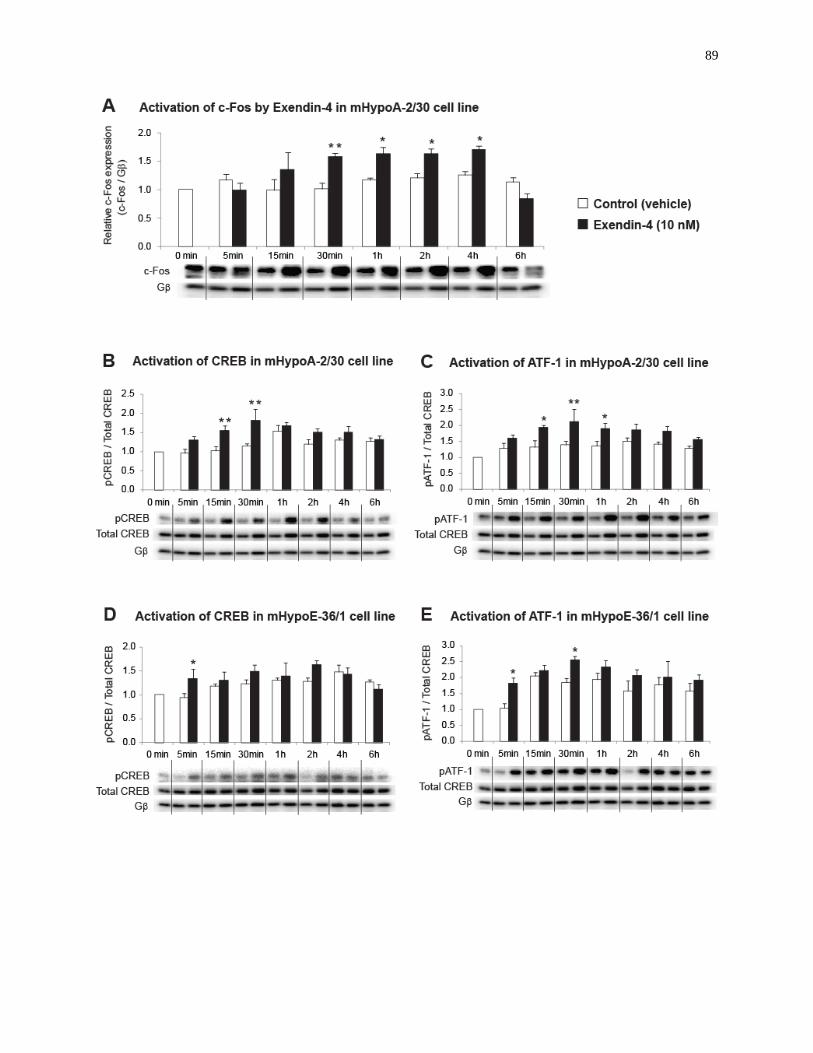
89

90
Figure 19. Exendin-4 induces c-Fos activation and CREB/ATF-1 phosphorylation in the
hypothalamic neuronal cell lines. The mHypoA-2/30 and mHypoE-36/1 cells were serum
starved overnight and then treated with exendin-4 (10 nM) or vehicle. Protein was isolated over 6
h at the indicated time points, resolved on 10% SDS-PAGE, transferred to nitrocellulose
membrane, and immunoblotted with antisera for c-Fos, phospho-CREB/ATF-1, total CREB and
Gβ (G-protein β subunit). Exendin-4 significantly increased c-Fos expression in the mHypoA-
2/30 cells (A), and induced phosphorylation of CREB (B, D) and ATF-1 (C, E) in both
mHypoA-2/30 (B, C) and mHypoE-36/1 (D, E) cell lines. c-Fos expression was normalized to
Gβ, and phosphorylation of CREB and ATF-1 was normalized to total CREB. Representative
Western blots are shown. All results shown in the bar graphs are expressed as mean ± SEM (n =
4 independent experiments; *P < 0.05, **P < 0.01 vs. vehicle control). Statistical significance
was calculated by two-way ANOVA.
91
immediate-early or late-response genes. Thus, phosphorylation of CREB may directly, via CRE,
activate c-Fos, which then heterodimerizes with members of the c-Jun, ATF and JDP families to
form activator protein-1 (AP-1), a transcription factor that in turn regulates target gene
expression. Overall, activation of CREB/ATF-1 and c-Fos in the neuronal cells suggests that
exendin-4 could potentially regulate downstream target genes that express cAMP-response
element or AP-1 consensus cis-elements in their promoter region.
4.3.5 Regulation of neurotensin and ghrelin mRNA transcript expression
by exendin-4
Next, regulation of neurotensin and ghrelin mRNA transcript levels by exendin-4 was
investigated. The adult and embryonic hypothalamic neuronal cells were exposed to 10 nM
exendin-4 over a 24 h time course. Using real-time qRT-PCR, it was found that in the adult
mHypoA-2/30 neurons neurotensin mRNA levels were significantly up-regulated by 52% at 4 h
post-treatment [vehicle (0.79 ± 0.07) versus 10 nM exendin-4 (1.20 ± 0.13), P < 0.05] (Figure
20A), whereas in the embryonic mHypoE-36/1 neurons the effect was more prominent as the
mRNA expression was increased by 64% at 6 h and remained significantly higher by 47% until
24 h [6 h, vehicle (0.80 ± 0.02) versus 10 nM exendin-4 (1.31 ± 0.06), P < 0.05; 24 h, vehicle
(0.79 ± 0.07) versus 10 nM exendin-4 (1.16 ± 0.07), P < 0.05] (Figure 20C). With respect to the
ghrelin mRNA expression, it was found that exendin-4 caused significant attenuation of mRNA
levels by 34% at 1 h post-treatment in the adult mHypoA-2/30 cell line [1 h, vehicle (1.56 ±
0.16) versus 10 nM exendin-4 (1.03 ± 0.08), P < 0.05] (Figure 20B). Similarly, exendin-4
suppressed ghrelin mRNA transcript levels by 29% at 4 h post-treatment in the embryonic
mHypoE-36/1 cell line [4 h, vehicle (1.12 ± 0.10) versus 10 nM exendin-4 (0.79 ± 0.08), P <
0.05] (Figure 20D). However, in the adult mHypoA-2/30 neurons, ghrelin mRNA levels were
significantly increased by 78% at the 24 h time point [vehicle (0.82 ± 0.20) versus 10 nM
exendin-4 (1.46 ± 0.31), P < 0.05] (Figure 20B). These results clearly indicate that neurotensin
and ghrelin mRNA levels are regulated by GLP-1R activation in the hypothalamic neuronal
models, and complement the in vivo findings. The regulation of POMC expression in the adult
mHypoA-2/30 neurons was not investigated due to failure of SYBR or TaqMan primers and
probe to detect the message by real-time qRT-PCR.

92
Figure 20. Regulation of neurotensin (NT) (A, C) and ghrelin (B, D) mRNA expression by
exendin-4 in the mHypoA-2/30 (A, B) and mHypoE36/1 (C, D) neuronal cell lines. The cells
were exposed to exendin-4 (10 nM) or vehicle over a 24 h time course; total RNA was extracted
at the indicated time points and used as a template for real-time RT-PCR with primers
specifically designed to amplify neuropeptide mRNA. NT (A, C) and ghrelin (B, D) mRNA
levels were quantified using the CT method, normalized to the internal control (γ-actin) and are
shown relative to vehicle only-treated mRNA levels set to 1.0 at 1 h time point. All results
shown are relative to corresponding control mRNA levels at each time point and are expressed as
mean ± SEM (n = 4 independent experiments; *P < 0.05 vs. vehicle control). Statistical
significance was calculated by two-way ANOVA.

93
4.3.6 Reversal of exendin-4 regulation of neurotensin and ghrelin by PKA
inhibitors
The next step was to investigate whether PKA, a cAMP-dependent protein kinase, was
involved in the regulation of neurotensin and ghrelin mRNA expression by exendin-4.
Pharmacological inhibitors of PKA (H-89 at 5 µM and PKI (14-22) amide at 1 µM
concentration) were used to pre-treat the adult and embryonic cells for 1 h before exposure to 10
nM exendin-4. PBS and DMSO were used as vehicle controls, as exendin-4 was dissolved in
PBS and PKA inhibitors were dissolved in DMSO. Total RNA was isolated at 1, 4 and 24 h after
the exendin-4 treatment and analyzed using real-time qRT-PCR. As compared to the vehicle
treatments, exendin-4 treatment significantly induced the neurotensin mRNA levels in mHypoA-
2/30 neuronal cells [4 h: PBS (0.66 ± 0.08) versus PBS + exendin-4 (1.22 ± 0.06), P < 0.05;
DMSO (0.85 ± 0.06) versus DMSO + exendin-4 (1.42 ± 0.15), P < 0.05] as well as in mHypoE-
36/1 neuronal cells [24 h: PBS (1.02 ± 0.08) versus PBS + exendin-4 (1.61 ± 0.09), P < 0.05;
DMSO (0.91 ± 0.04) versus DMSO + exendin-4 (1.27 ± 0.09), P < 0.05] (Figure 21A and C). In
contrast, exendin-4 treatment significantly decreased ghrelin mRNA levels in both cell lines
[mHypoA-2/30 cell line (1 h): PBS (1.52 ± 0.09) versus PBS + 10 nM exendin-4 (0.97 ± 0.13), P
< 0.05; DMSO (1.12 ± 0.05) versus DMSO + 10 nM exendin-4 (0.68 ± 0.10), P < 0.05;
mHypoE-36/1 cell line (4 h): PBS (1.13 ± 0.05) versus PBS + 10 nM exendin-4 (0.85 ± 0.07), P
< 0.05; DMSO (1.15 ± 0.16) versus DMSO + 10 nM exendin-4 (0.76 ± 0.05), P < 0.05] (Figure
21B and D). Further, it was found that both PKA inhibitors attenuated the exendin-4-induced
increase in neurotensin mRNA expression in both neuronal cells models [mHypoA-2/30 cell line
(4 h): PKI (0.99 ± 0.10) versus PKI + 10 exendin-4 (0.96 ± 0.08), P < 0.05; H89 (0.98 ± 0.09)
versus H89 + 10 nM exendin-4 (1.06 ± 0.01), P < 0.05; mHypoE-36/1 cell line (24 h): PKI (0.99
± 0.08) versus PKI + 10 nM exendin-4 (0.74 ± 0.07), P < 0.05; H89 (0.80 ± 0.04) versus H89 +
10 exendin-4 (0.66 ± 0.06), P > 0.05] (Figure 21A and C). On the other hand, PKA inhibition
reversed the attenuation of ghrelin mRNA transcripts caused by exendin-4 [mHypoA-2/30 cell
line (1 h): PKI (0.89 ± 0.06) versus PKI + 10 exendin-4 (0.91 ± 0.02), P < 0.05; H89 (0.98 ±
0.11) versus H89 + 10 nM exendin-4 (1.19 ± 0.07), P > 0.05; mHypoE-36/1 cell line (4 h):

94
Figure 21. Regulation of neurotensin (NT) (A, C) and ghrelin (B, D) mRNA expression via
activation of the protein kinase A (PKA) pathway. Following overnight serum starvation
mHypoA-2/30 (A, B) and mHypoE-36/1 (C, D) neuronal cells were pre-treated with PKA
inhibitors PKI 14-22 amide (1 μM) or H89 (5 μM) for 1 h followed by either vehicle (PBS or
DMSO) or exendin-4 (10 nM) treatment. At 1, 4 and 24 h following exendin-4 exposure, cells
were harvested for total RNA isolation, and NT (A, C) and ghrelin (B, D) mRNA expression was
determined by real-time RT-PCR. All results are relative to PBS only-treated mRNA levels (set
to 1.0) and are expressed as mean ± SEM (n = 4 independent experiments; *P < 0.05). Statistical
significance was calculated by two-way ANOVA. White bars = control (PBS or DMSO with or
without PKA inhibitor); black bars = treatment (exendin-4 with or without PKA inhibitor).
95
PKI (0.84 ± 0.17) versus PKI + 10 nM exendin-4 (0.90 ± 0.09), P > 0.05; H89 (0.98 ± 0.09)
versus H89 + 10 exendin-4 (1.39 ± 0.11), P < 0.05] (Figure 21B and D). It was also observed
that DMSO appears to regulate basal levels of ghrelin mRNA in the mHypoA-2/30 line, as
DMSO treatment alone resulted in attenuation of ghrelin mRNA levels as compared to PBS
treatment [PBS (1.52 ± 0.09) versus DMSO (1.12 ± 0.05), P < 0.05] (Figure 21B). Overall, these
results indicate that PKA activation is involved with the regulation of neurotensin and ghrelin
mRNA by exendin-4.
4.4 Discussion
Exendin-4 has been shown to regulate food intake and energy expenditure via GLP-1R-
dependent mechanisms (371). Using an equivalent central dose, Baggio et al. showed that the
anorectic action of central exendin-4 was not simply a nonspecific response, as anorexia was
absent in GLP-1R knock-out mice, which lack functional GLP-1R (371). In the present study,
using single-label IHC with c-Fos, a marker of neuronal activation, it was found that exendin-4,
at a dose that induced anorexia, activated hypothalamic ARC, PVN, DMH and PeV, regions that
widely express GLP-1Rs along with several neuropeptides involved in energy metabolism.
Furthermore, using double-label IHC, it was detected that central exendin-4 significantly
activated α-MSH/POMC and NPY neurons in the ARC, neurotensin-expressing neurons in the
PVN, and ghrelin-expressing neurons in the ARC, PVN and PeV. Finally, using the adult
mHypoA-2/30 and embryonic mHypoE-36/1 hypothalamic neuronal cell models, it was found
that exendin-4, in a PKA-dependent manner, increased neurotensin mRNA expression while
attenuating ghrelin mRNA levels. Overall, the in vivo findings suggest that complex interactions
may occur between satiety- and hunger-related neuropeptides in one or more hypothalamic
nuclei to mediate the overall anorexic action of exendin-4. The in vitro findings suggest that
regulation of hypothalamic neurotensin and ghrelin may lie downstream of exendin-4-mediated
GLP-1R activation. However, the present results must be interpreted with caution as these data
may not be relevant to endogenous GLP-1 action due to the distinct mechanisms of receptor
activation by endogenous GLP-1 and exendin-4, as exendin-4 is speculated to activate an
unknown receptor apart from GLP-1R activation (163, 369, 373). In support, both central and
peripheral administration of exendin-4 suppressed ghrelin levels, but the suppression of ghrelin
was neither mimicked by GLP-1 nor blocked by the GLP-1R antagonist exendin-9-39,

96
suggesting that ghrelin inhibition appears to correspond to an exendin-specific mechanism,
which might be independent of GLP-1R activation (163). Several other studies have provided
evidence that the actions of exendin-4 cannot be adequately explained by activation of the GLP-
1R, and therefore, presence of another unknown receptor is suggested. Indeed, exendin-4, but not
GLP-1, increases insulin sensitivity and glucose transport in cultured L6 myotubules in vitro
(374), and the effects of exendin-4 on cAMP levels in 3T3-L1 adipocytes are not mediated by
the GLP-1R (375). Significantly, unlike exendin-4, GLP-1 activation was unable to modify
energy expenditure in mice (221). Moreover, GLP-1 could not reproduce other endocrine effects
elicited by exendin-4, such as the reduction of thyrotropin secretion in rats (376). Thus, because
exendin-4 exerts some of its effects through a mechanism that may not involve the activation of
the GLP-1R, further investigations using GLP-1R inhibitors or GLP-1R knockout mice are
required to investigate endogenous GLP-1 action and distinguish GLP-1R-dependent and -
independent actions of exendin-4 on neuropeptidergic neuronal activation.
Recently, it was found that GLP-1R activation in the ARC does not induce anorexia via
α-MSH/POMC or NPY neurons (131), suggesting that other mediators, such as anorexigenic
neurotensin and orexigenic ghrelin neurons, may be involved. Despite their potential role in the
hypothalamic regulation of energy homeostasis (6, 139, 141-143, 153, 155), neurotensin and
ghrelin have received relatively little attention with respect to appetite regulation. While it is well
established that neurotensin-expressing neurons are expressed in the hypothalamus and exert an
anorexigenic action (56, 143), the existence of central ghrelin-expressing neurons is still
controversial and a general consensus does not exist concerning the source of central ghrelin
(377). Although ghrelin-positive neurons are located within the intact hypothalamus (105, 148,
378, 379), and display synaptic interactions with POMC, NPY and other ghrelin-containing
neurons (156, 380), at present the spectrum of functions and physiological role of ghrelin-
expressing neurons in the hypothalamus are yet to be fully elucidated. The present study found
that exendin-4 induced almost a 6-fold increase in neurotensin neuronal activation in the PVN,
compared to only less than a 2-fold increase in the ARC. This might explain why the PVN GLP-
1R system, but not that of the ARC, is predominant in mediating anorexia, as reported by
Sandoval et al. (131).

97
Although ghrelin neurons are orexigenic, it was observed that exendin-4 significantly
activated these neurons in the ARC, PVN and PeV. However, whether this neuronal activation
translates into stimulation or inhibition is not completely clear. It is possible that the activation of
hypothalamic ghrelin neurons may be complementary or compensatory to exert a function other
than appetite regulation. Exendin-4 has been shown to induce anti-inflammatory action in the
peripheral tissues (381). It also exerts neuroprotective effects on dopaminergic neurons by
inhibiting pro-inflammatory mediators (382). In this context, as ghrelin is found to exert anti-
inflammatory and neuroprotective effects (383), the ghrelin neuronal activation observed in this
study may be involved in mediating anti-inflammatory effects of exendin-4 (381). Interestingly,
both orexigenic ghrelin and anorexigenic neurotensin share a common characteristic: to stimulate
release of CRH (an anorexigenic and anxiogenic factor in the PVN) resulting in hypothalamic-
pituitary-adrenal axis (HPA) activation and stimulation of glucocorticoid release (384, 385). As
exendin-4 has been demonstrated to stimulate the HPA axis in rodents and humans (386), it is
important to explore the role of hypothalamic ghrelin and neurotensin in the HPA regulation by
GLP-1R agonists. This could elucidate possible reasons for why the GLP-1R knockout mice
exhibit paradoxically increased corticosterone responses to stress, even though they appear to
have a normal HPA axis (387). Activation of ARC and PeV neurons (particularly of ghrelin
neurons) suggests a possible involvement of ghrelin in glucoregulation and neurogenesis induced
by GLP-1R activation (19, 106, 107).
Additionally, significant activation of α-MSH/POMC and NPY neurons in the ARC was
detected. The finding that ARC α-MSH/POMC neurons are activated by exendin-4 agrees with
that reported by Sandoval et al. (131). However, it is not clear whether exendin-4-activated α-
MSH/POMC neurons actually induce anorexia, as measuring the changes in the α-MSH
synthesis and secretion or POMC mRNA levels in the ARC in vivo was beyond the scope of this
study. Nevertheless, given the fact that GLP-1R-expressing ARC POMC neurons are not
involved in appetite suppression, as reported by Sandoval et al. (131), it would be appropriate to
further investigate if these neurons play any role in mediating the central glucoregulatory action
of exendin-4 or native GLP-1 (131, 369).
Given that ARC NPY neurons do not express GLP-1Rs, the observed significant
activation of these neurons is quite intriguing. Absence of GLP-1R expression on ARC NPY

98
neurons excludes any direct action of exendin-4, suggesting their indirect activation by other
neurons, such as POMC neurons or -aminobutyric acid (GABA) cells in the ARC (388). As
neurotensin was demonstrated to inhibit feeding via Ntsr expressed in the hypothalamic ARC
(134), it is possible that the activated PVN neurotensin neurons regulate ARC NPY neurons to
ultimately inhibit them. However, whether ARC NPY neurons express Ntsr is not known.
Another possibility is that the activated ghrelin-immunopositive neurons in the ARC could
influence NPY neurons via synaptic transmission (156). Given that the ARC GLP-1R system
regulates glucose homeostasis (131), and that ARC NPY neurons are glucose-sensitive neurons
directly regulated by exogenous ghrelin (106, 107), the possible interaction between ARC NPY
and ghrelin neurons in exendin-4-mediated glucose regulation needs to be analyzed further.
A striking finding in this study was the absence of c-Fos activation in the VMH, the
nucleus involved in the control of satiety (25), and in the LH, the region known to control hunger
(24). However, the lack of c-Fos activation in the hypothalamic VMH was in accordance with
very low GLP-1R expression in this region (216). The lack of c-Fos expression in the LH
suggests that the LH is not activated by exendin-4, despite moderate expression of GLP-1R in
this region (216). This result may also indicate that orexigenic MCH and orexin/hypocretin
neurons in the LH are not activated by exendin-4. It has been demonstrated that leptin inhibits
LH indirectly via the activation of ARC POMC neurons, and that when leptin-mediated
suppression of LH neurons was reversed via ablation of the ARC, c-Fos expression was
increased in LH neurons (389). This suggests that the lack of c-Fos activation in the LH neurons
observed in this study could be due to inhibitory quiescence via exendin-4-activated ARC
POMC neurons. However, caution must be exercised in interpreting these results based on the
absence of c-Fos activation in these regions, for the c-Fos activation itself does not indicate
neuronal stimulation or inhibition unless advanced techniques, such as electrophysiological
methods or magnetic resonance imaging, are simultaneously employed.
The in vitro part of this study characterized the signaling pathways and changes in
neurotensin and ghrelin gene expression that occur as a direct result of exendin-4 action on the
hypothalamic adult mHypoA-2/30 and embryonic mHypoE-36/1 neuronal cell models (18, 19).
These cell models were used in the present study because it is speculated that they originate from
the PVN (given the co-expression of galanin and arginine-vasopressin) (18, 316, 390, 391).

99
Using both adult and embryonic neuronal cell lines, it was observed that mature neurons do not
differ from neurons of embryonic origin in the signaling mechanisms triggered by GLP-1R
activation.
The intracellular signaling pathways regulating hypothalamic neurotensin and ghrelin
gene expression following GLP-1R activation have not been previously established. In
pancreatic β-cells, GLP-1R activation stimulates adenylyl cyclase, thereby increasing cAMP, and
subsequently activating PKA. Similarly, GLP-1 is shown to activate adenylyl cyclase in rodent
brain (392), and in hypothalamic POMC neurons, GLP-1R activation stimulates cAMP/PKA
pathway to induce anorectic activity (393). In the present study, hypothalamic adult mHypoA-
2/30 and embryonic mHypoE-36/1 neuronal cell models were used because they are the only
hypothalamic cell models that express functional GLP-1R as well as neurotensin and ghrelin (18,
19). It was found that GLP-1R activation lead to up-regulation of intracellular cAMP in these
neuronal cell models, and that transcription factors CREB and ATF-1 were activated upon
exendin-4 stimulation. Furthermore, activation of c-Fos in the mHypoA-2/30 line suggests that
the in vivo activation of c-Fos found in the present study could be mediated through direct
activation of GLP-1R-expressing hypothalamic neurons. Further studies are required to
determine whether exendin-4 regulates gene expression at the promoter region of these genes.
The importance of cAMP/PKA activation in appetite regulation has been demonstrated in
several studies. Recently, hindbrain GLP-1R activation by exendin-4 was shown to induce
anorexia in a PKA-dependent manner (327). Hypothalamic activation of cAMP/PKA mediates
central regulation of satiety by inhibiting NPY-induced feeding (336). Furthermore, PKA and
CREB signaling have been shown to negatively regulate NPY gene expression (337), whereas
transcription of CART, a potent appetite-suppressing peptide, is upregulated by
cAMP/PKA/CREB activation (394). Overall, it appears that stimulation of cAMP/PKA activity
inhibits feeding behavior by increasing anorexigenic and decreasing orexigenic neuropeptide
expression. These studies are therefore consistent with the findings that exendin-4 induced
neurotensin and suppressed ghrelin expression via PKA activation. However, regulation of
hypothalamic neurotensin and ghrelin gene expression was shown to occur through other
pathways as well. Neurotensin gene expression was augmented by leptin via activation of
STAT3 and MAPK ERK1/2 (300), whereas ghrelin was repressed by insulin via both PI3K/Akt
100
and MAPK ERK1/2 pathways (395). The MAPK ERK1/2 plays an important role in food intake
control, and exendin-4 has recently been shown to induce anorexia partially by activation of
MAPK ERK1/2 in hindbrain GLP-1R neurons (327). Activation of MAPK ERK1/2 by exendin-4
in hypothalamic neurons has yet to be studied.
The induction of either PKA or CREB signaling normally serves to activate gene
transcription. Therefore, the upregulation of neurotensin mRNA expression by exendin-4 may
reflect stimulation of gene transcription at the promoter level. Neurotensin gene promoter
analysis indicates that synergistic activation of AP-1 and CRE elements is important in hormonal
regulation of neurotensin gene expression (396). Furthermore, it was demonstrated that leptin
upregulated neurotensin gene expression by activation of ATF-1 and c-Fos (300). However, it
cannot be ruled out that the increase in neurotensin mRNA was due to an increase in mRNA
stability, similar to GLP-1-induced increase in insulin mRNA stability to augment insulin mRNA
levels in β-cells (397). The suppression in ghrelin mRNA levels observed following GLP-1R
activation does not seem to be due to a decrease in transcription at the promoter level, at least in
the adult cell line, as the mRNA transcript levels decrease rapidly within 1 h post-treatment. This
down-regulation likely occurred due to destabilization of the ghrelin mRNA by activated PKA,
similar to the PKA-mediated increased decay of angiotensin II type 1 receptor mRNA (398). In
another study it was proposed that insulin-triggered changes in mRNA half-life could potentially
suppress orexigenic NPY and AgRP gene expression (399). Overall, further studies are required
to determine whether exendin-4 regulates neurotensin and ghrelin mRNA expression through the
AP-1 or CRE consensus sites, or through other cis-elements within the promoter or enhancer
region of these genes, or via specific molecular components induced by PKA that mediate
mRNA decay.
Recently, the ability of miRNAs to regulate mRNA has been addressed as a powerful
mechanism to control neuronal functions. In this context, it was demonstrated that CREB-
regulated miRNA132 regulates neuronal morphogenesis by decreasing mRNA transcript levels
of the GTPase-activating protein p250GAP (400). The induction phase of the miRNA132 is
rapid and parallels c-Fos induction (400), which raises the possibility for CREB-induced
miRNA132 to target ghrelin mRNA and rapidly suppress its expression, as seen in this study.
Whether the presence of a miR132 recognition element in ghrelin mRNA or lack of it in

101
neurotensin mRNA is responsible for differential regulation of these neuropeptide transcripts by
exendin-4 needs to be studied further.
In summary, the data presented here demonstrate that exendin-4 activates multiple
hypothalamic sites where complex interactions may occur between appetite-regulating
neuropeptidergic neurons to induce anorexia. The findings from the in vitro model of direct
action of exendin-4 on neurotensin and ghrelin mRNA regulation complement the in vivo
findings that neurotensin and ghrelin neurons, in addition to α-MSH/POMC and NPY neurons,
can be activated and regulated by central exendin-4. Ultimately, this study provides a previously
unrecognized link between exendin-4 action and neurotensin and ghrelin regulation.

102
Chapter 5
Glucagon-Like Peptide-2 Directly Regulates
Hypothalamic Neurons Expressing Neuropeptides
Linked to Appetite Control in vivo and in vitro

103
Publication:
Prasad S. Dalvi and Denise D. Belsham. Glucagon-like peptide-2 regulates hypothalamic
neurons expressing neuropeptides linked to appetite control in vivo and in vitro. Endocrinology
(2012) 153:2385-2397
All the experiments included in the publication and in this thesis were designed by P.S.D.
and D.D.B. P.S.D. executed all the experiments in this thesis, analyzed all data, designed and
created all figures, wrote and revised the manuscript under the supervision of D.D.B.
Published figures:
Figure 22. Intracerebroventricular (i.c.v.) injection of h(Gly2)GLP-2 inhibits food and water
intake, and induces weight loss in a dose-dependent manner in wild-type mice.
Figure 23. Acute h(Gly2)GLP-2 treatment activates hypothalamic appetite-regulating nuclei.
Figure 24. Acute h(Gly2)GLP-2 treatment induces c-Fos-immunoreactivity (ir) in the
hypothalamic neurons expressing α-MSH-, NPY-, neurotensin- or ghrelin-ir.
Figure 25. Acute h(Gly2)GLP-2 treatment induces c-Fos-immunoreactivity (ir) in the
hypothalamic neurons expressing NPY-, neurotensin- or ghrelin-ir.
Figure 26. Graphical representation showing the number of neurons expressing c-Fos- and
neuropeptide-immunoreactivity (ir) in the ARC, VMH, DMH, PVN, LH and internuclear space
between the DMH and LH of the saline- or h(Gly2)GLP-2-treated mouse hypothalamus.
Figure 27. Expression profile of GLP-2 receptor (GLP-2R) and appetite-regulating neuropeptides
in the hypothalamic neuronal cell lines.
Figure 28. Acute h(Gly2)GLP-2 treatment induces c-Fos activation and CREB/ATF-1
phosphorylation in the hypothalamic GLP-2R-positive mHypoA-2/30 neuronal cells.
Figure 29. Regulation of neurotensin (A, C) and ghrelin (B, D) mRNA expression by
h(Gly2)GLP-2 in the mHypoA-2/30 neuronal cell line in protein kinase A (PKA)-dependent
manner.
Permissions were obtained to reproduce the copyrighted material.

104
5 Glucagon-Like Peptide-2 Directly Regulates Hypothalamic
Neurons Expressing Neuropeptides Linked to Appetite Control
in vivo and in vitro
5.1 Abstract
GLP-2 has been postulated to affect appetite at the level of the hypothalamus. To gain
better insight into this process, a degradation-resistant GLP-2 analog, human (Gly2)GLP-2(1-33)
[h(Gly2)GLP-2] was intracerebroventricularly injected into mice to examine its action on food
and water intake and also activation of hypothalamic anorexigenic α-MSH/POMC, neurotensin,
and orexigenic NPY, and ghrelin neurons. Central h(Gly2)GLP-2 administration significantly
suppressed food and water intake with acute weight loss at 2 h. Further, central h(Gly2)GLP-2
robustly induced c-Fos activation in the hypothalamic ARC, DMH, VMH, PVN, and LH nuclei.
Differential colocalization of neuropeptides with c-Fos in specific regions of the hypothalamus
was observed. To assess whether hypothalamic neuropeptides are directly regulated by GLP-2 in
vitro, an adult-derived clonal, immortalized hypothalamic cell line, mHypoA-2/30, that
endogenously expresses functional GLP-2R and two of the feeding-related neuropeptides linked
to GLP-2R activation in vivo: neurotensin and ghrelin was used in the present study. Treatment
with h(Gly2)GLP-2 stimulated c-Fos expression and phosphorylation of CREB/ATF-1 in this
neuronal cell model. In addition, treatment with h(Gly2)GLP-2 significantly increased
neurotensin and ghrelin mRNA transcript levels by 50 and 95%, respectively, at 24 h after
treatment in a PKA-dependent manner. Taken together, these findings implicate the PKA
pathway as the means by which GLP-2 can upregulate hypothalamic neuropeptide mRNA levels
and provide an evidence for a link between central GLP-2R activation and specific hypothalamic
neuropeptides involved in appetite regulation.
5.2 Introduction
The glucagon gene encodes two homologous peptides, GLP-1 and GLP-2. These peptides
are generated by post-translational processing mainly in the enteroendocrine L cells of the
intestine, and specific neurons of the caudal brainstem (171, 172, 215, 401). Both GLPs play
105
important roles in energy homeostasis by regulating nutrient ingestion and disposal. GLP-2 is a
hormone that mainly stimulates crypt cell proliferation and inhibits apoptosis of the intestinal
epithelium to exert trophic effects (402-404). GLP-2 also regulates energy homeostasis by
regulating intestinal motility, permeability, nutrient ingestion and absorption (204, 405, 406). In
the CNS, GLP-1 and GLP-2 are synthesized in the caudal brainstem and hypothalamus (172,
215, 333, 401). The GLP-1/GLP-2-expressing preproglucagon neurons of the NTS send
extensive projections to the hypothalamic PVN and DMH nuclei, both regions known to be
involved in the regulation of feeding behavior (213). It has been speculated that GLP-2 also acts
as a neurotransmitter and exerts similar actions like GLP-1 in the CNS (214, 333).
The GLP-1 and GLP-2 mediate their actions via unique G protein-coupled receptors. The
GLP-1R is widely expressed in the hypothalamus as compared with the restricted expression of
the GLP-2R in the VMH and DMH nuclei (214, 216-218, 231). Thus, they may play distinct
roles in appetite regulation despite being synthesized in the same neurons (213). However, little
is known of GLP-2-mediated signaling in appetite-regulation. Tang-Christensen et al. discovered
that central administration of GLP-2 is involved in regulation of food intake in rats (214).
Similarly, pharmacological doses of central long-acting GLP-2 inhibited short-term food intake
in mice (218). Therefore, the mechanisms of central GLP-2R action to induce reduction in food
intake require further characterization.
The GLP-2R is predominantly expressed in the gastrointestinal tract and the CNS, with
limited expression in lung, cervix, vagal afferents and other peripheral organs (229). The
signaling mechanisms of the GLP-2R activation are not completely understood due to the lack of
cell models that endogenously express GLP-2R. Data collected from heterologous cell lines
transfected with GLP-2R have demonstrated that cAMP/PKA- and AP-1-dependent pathways
are activated by GLP-2 (231). Also fetal rat intestinal cell cultures treated with h[Gly2]-GLP-2
were shown to have increased cAMP concentration (407). Further, the PI3K/Akt pathway has
been shown to be implicated in the stimulatory effects of GLP-2 to enhance intestinal IGF-I
mRNA transcript levels in the intestinal subepithelial myofibroblasts (408). However, few
studies have addressed central GLP-2R activation and the target hypothalamic neurons largely
remain elusive. Thus, clonal, hypothalamic cell lines that endogenously express functional GLP-
2R were used. The present study investigated activation of hypothalamic α-MSH/POMC-,
106
neurotensin-, NPY-, and ghrelin-expressing neurons following GLP-2 exposure in vivo, and
determined potential signaling pathways involved in vitro.
5.3 Results
5.3.1 Effect of i.c.v. h(Gly2)GLP-2 on food/water intake, and animal weight
To establish the efficacy of the h(Gly2)GLP-2, the effect on food and water intake over a
short-term exposure was studied. For the dose-response study, the anorexigenic doses of
h(Gly2)GLP-2 (100 ng, 1 µg and 5 µg) were selected based on previously conducted studies in
rodents (214, 218). It was found that the cumulative food intake was significantly reduced by
66.67% by i.c.v. dose of 5 µg of h(Gly2)GLP-2, as compared with saline at 1 h post-treatment in
ad libitum-fed wild type mice [cumulative food intake 1 h (g): saline, 0.15 ± 0.03; 100 ng
h(Gly2)GLP-2, 0.15 ± 0.03; 1 µg h(Gly
2)GLP-2, 0.13 ± 0.03; 5 µg h(Gly
2)GLP-2, 0.05 ± 0.03; 5
µg h(Gly2)GLP-2, versus saline, P < 0.05] (Figure 22A). At 2 h post-treatment, no additional
food intake suppression was detected. On the contrary, the suppression of cumulative food intake
was attenuated and it did not differ across all treatment groups [food intake 2 h (g): saline, 0.37 ±
0.03; 100 ng h(Gly2)GLP-2, 0.33 ± 0.03; 1 µg h(Gly
2)GLP-2, 0.33 ± 0.03; 5 µg h(Gly
2)GLP-2,
0.28 ± 0.08] (Figure 22A). Further, it was found that different doses of h(Gly2)GLP-2 did not
have any significant effect on cumulative water intake at 1 h post-treatment [cumulative water
intake 1 h (ml): saline, 1.75 ± 0.25; 100 ng h(Gly2)GLP-2, 1.67 ± 0.29; 1 µg h(Gly
2)GLP-2, 1.33
± 0.29; 5 µg h(Gly2)GLP-2, 1.00 ± 0.58] (Figure 22B). In contrast, at 2h post-treatment,
cumulative water intake was significantly reduced by 41.75% and 43.75% by both i.c.v. doses of
1 and 5 µg of h(Gly2)GLP-2, respectively, as compared with saline treatment [cumulative water
intake 2 h (ml): saline, 4.00 ± 0.41; 100 ng h(Gly2)GLP-2, 3.00 ± 0.87; 1 µg h(Gly
2)GLP-2, 2.33
± 0.76; 5 µg h(Gly2)GLP-2, 2.25 ± 0.48; 1 and 5 µg h(Gly
2)GLP-2 versus saline, P < 0.05]
(Figure 22B). Based on the anorexia induced, the dose of 5 µg of h(Gly2)GLP-2 was selected to
determine its effect on body weight. It was found that the weight changes following single i.c.v.
dose of h(Gly2)GLP-2 were remarkable because the weight loss was significant within 1 and 2 h
[change in weight (g): saline (1h), -0.15 ± 0.01 versus 5 µg h(Gly2)GLP-2 (1h), -0.75 ± 0.18, P
< 0.05; saline (2h), -0.20 ± 0.16 versus 5 µg h(Gly2)GLP-2 (2h), -0.75 ± 0.06, P < 0.05] (Figure
22C). Further duration of these rapid weight losses and the recovery period were not studied.
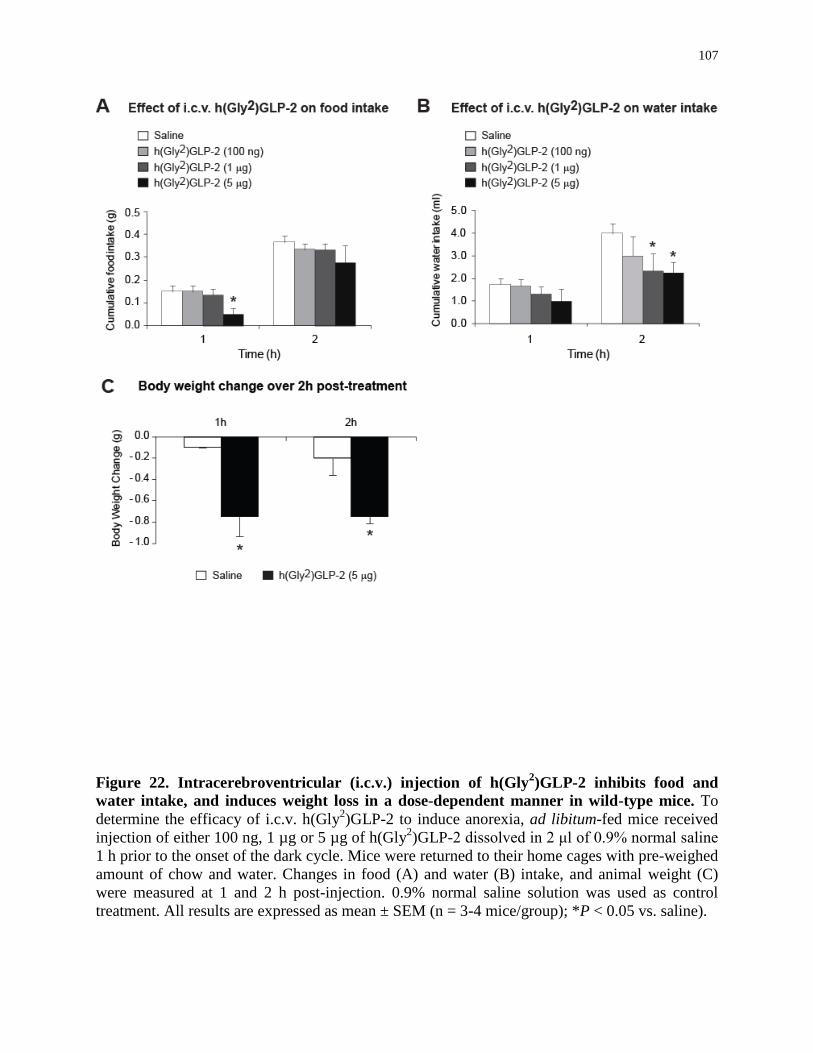
107
Figure 22. Intracerebroventricular (i.c.v.) injection of h(Gly2)GLP-2 inhibits food and
water intake, and induces weight loss in a dose-dependent manner in wild-type mice. To
determine the efficacy of i.c.v. h(Gly2)GLP-2 to induce anorexia, ad libitum-fed mice received
injection of either 100 ng, 1 µg or 5 µg of h(Gly2)GLP-2 dissolved in 2 μl of 0.9% normal saline
1 h prior to the onset of the dark cycle. Mice were returned to their home cages with pre-weighed
amount of chow and water. Changes in food (A) and water (B) intake, and animal weight (C)
were measured at 1 and 2 h post-injection. 0.9% normal saline solution was used as control
treatment. All results are expressed as mean ± SEM (n = 3-4 mice/group); *P < 0.05 vs. saline).

108
5.3.2 Effect of h(Gly2)GLP-2 on activation of hypothalamic nuclei and
neuropeptidergic neurons
As assessed by IHC for c-Fos expression, a distinctive pattern of neuronal activation was
noted after the central injection of h(Gly2)GLP-2 compared with the saline controls (Figure 23
A-F). Significant increases in the number of c-Fos-positive neurons were detected in the
hypothalamic ARC (increase by 152%), DMH (increase by 342%), VMH (increase by 99%), LH
(increase by 411%) and PVN (increase by 429%) [c-Fos-positive nuclei: ARC, saline, 14.77 ±
1.42 versus 5 µg h(Gly2)GLP-2, 37.25 ± 2.28, P < 0.001; DMH, saline, 12.89 ± 1.04 versus 5 µg
h(Gly2)GLP-2, 56.98 ± 4.83, P < 0.001; VMH, saline, 3.24 ± 0.85 versus 5 µg h(Gly
2)GLP-2,
6.45 ± 1.14, P = 0.046; LH, saline, 4.04 ± 0.81 versus 5 µg h(Gly2)GLP-2, 20.64 ± 2.61, P <
0.001; PVN, saline, 13.61 ± 1.50 versus 5 µg h(Gly2)GLP-2, 72.06 ± 10.44, P < 0.001] (Figure
23G).
The next goal was to determine the neuropeptidergic neurons activated in the
hypothalamic nuclei by performing double-staining IHC for c-Fos and neuropeptide co-
expression (Figs. 24 and 25). It was found that in the ARC, single dose of i.c.v. h(Gly2)GLP-2
significantly increased the number of c-Fos-expressing α-MSH/POMC neurons by 105% [saline,
12.76 ± 1.92 versus 5 µg h(Gly2)GLP-2, 26.22 ± 2.55, P < 0.001] (Figure 26B), NPY neurons by
140% [saline, 11.07 ± 2.53 versus 5 µg h(Gly2)GLP-2, 26.55 ± 4.69, P < 0.001] (Figure 26D),
neurotensin neurons by 332% [saline, 6.90 ± 2.59 versus 5 µg h(Gly2)GLP-2, 29.83 ± 1.67, P <
0.001] (Figure 26F) and ghrelin neurons by 87% [saline, 10.03 ± 1.72 versus 5 µg h(Gly2)GLP-
2, 18.71 ± 0.70, P = 0.003] (Figure 26H). Further, it was found that in the hypothalamic PVN,
h(Gly2)GLP-2 robustly increased the number of c-Fos-positive nuclei with neurotensin co-
expression by 504% [saline, 9.07 ± 2.85 versus 5 µg h(Gly2)GLP-2, 54.75 ± 8.67, P = 0.007]
(Figure 26F) and ghrelin co-expression by 233% [saline, 8.92 ± 1.66 versus 5 µg h(Gly2)GLP-2,
29.67 ± 0.96, P < 0.001] (Figure 26H). In the hypothalamic DMH, a significant increase in c-Fos
and neurotensin and NPY co-expressing neurons by 416% and 334%, respectively, was detected
[neurotensin: saline 9.10 ± 0.92 versus 5 µg h(Gly2)GLP-2, 46.94 ± 4.38, P= 0.003; NPY: saline
9.11 ± 1.22 versus 5 µg h(Gly2)GLP-2, 39.49 ± 7.45, P = 0.001] (Figure 26H).

109
Figure 23. Acute h(Gly2)GLP-2 treatment activates hypothalamic appetite-regulating
nuclei. Immunohistochemistry was performed to assess neuronal activation by c-Fos-
immunoreactivity (ir) in wild-type mice treated with intracerebroventricular (i.c.v.) saline or
h(Gly2)GLP-2 (hGLP-2). Representative photomicrographs showing expression of c-Fos-ir in the
hypothalamic ARC, DMH, VMH, LH, and PVN regions in coronal sections of the mouse
hypothalamii. A-F: low magnification (X50) images of the hypothalamic regions (scale bars, 1
mm). A’-F’: High magnification (X400) images representative of the regions indicated by arrows
in images A-F, respectively (scale bars, 100 μm). c-Fos–DAB-positive neurons are visible as
brown nuclei. G: Bar graph showing the number of c-Fos-ir neurons in the hypothalamic regions
at 2 h post-treatment. Data in the bar graph are expressed as mean ± SEM (n = 3-4
animals/group; *P < 0.05, **P < 0.001).

110
Figure 24. Acute h(Gly2)GLP-2 treatment induces c-Fos-immunoreactivity (ir) in the
hypothalamic neurons expressing α-MSH-, NPY-, neurotensin- or ghrelin-ir. A-L: Bright-
field photomicrographs showing neurons that coexpress c-Fos-ir (brown nuclei) and
neuropeptide-ir (blue-black cytoplasm) in the coronal sections of the hypothalamic arcuate
(ARC) and paraventricular (PVN) nuclei from wild-type mice at 2h after intracerebroventricular
administration of saline (A, C, E, G, I, K) or h(Gly2)GLP-2 (B, D, F, H, J, L). A and B:
Coexpression of c-Fos-ir with a-MSH-ir in the ARC. C and D: Coexpression of c-Fos-ir with
NPY-ir in the ARC. E-H: Coexpression of c-Fos-ir with neurotensin-ir in the ARC (E, F) and
PVN (G, H). I-L: Coexpression of c-Fos-ir with ghrelin-ir in the ARC (I, J) and PVN (K, L).
Black arrowheads represent neurons expressing only nuclear c-Fos-ir, white arrowheads
represent neurons expressing only cytoplasmic perineuclear neuropeptide-ir, and black arrows
represent double-labeled neurons with coexpression of c-Fos-ir and neuropeptide-ir. 3v, third
cerebral ventricle. Original magnification: X400, scale bar: 100 μm.

111
Figure 25. Acute h(Gly2)GLP-2 treatment induces c-Fos-immunoreactivity (ir) in the
hypothalamic neurons expressing NPY-, neurotensin- or ghrelin-ir. A-J: Bright-field
photomicrographs showing neurons that co-express c-Fos-ir (brown nuclei) and neuropeptide-ir
(blue-black cytoplasm) in the coronal sections of the hypothalamic dorsomedial (DMH),
ventromedial (VMH), lateral hypothalamic nucleus (LH) and internuclear space between DMH
and LH (INS), from wild-type mice at 2h after intracerebroventricular administration of saline
(A, C, E, G, I) or h(Gly2)GLP-2 (B, D, F, H, J). A and B: Coexpression of c-Fos-ir with NPY-ir
in the DMH. C and D: Coexpression of c-Fos-ir with NT-ir in the DMH. E and F: Coexpression
of c-Fos-ir with NT-ir in the VMH. G and H: Coexpression of c-Fos-ir with NT-ir in the LH. I
and J: Coexpression of c-Fos-ir with Ghr-ir in the INS. Black arrowheads represent neurons
expressing only nuclear c-Fos-ir, white arrowheads represent neurons expressing only
cytoplasmic perineuclear neuropeptide-ir, and black arrows represent double-labeled neurons
with coexpression of c-Fos-ir and neuropeptide-ir. f, fornix. Original magnification: X400, scale
bar: 100 μm.

112
Figure 26. Graphical representation of neurons expressing c-Fos- and neuropeptide-
immunoreactivity (ir) in the ARC, VMH, DMH, PVN, LH and internuclear space between
the DMH and LH of the saline- or h(Gly2)GLP-2-treated mouse hypothalamus. Double-
labeled immunohistochemistry for c-Fos-ir and α-MSH-ir (B), c-Fos-ir and NPY-ir (D), c-Fos-ir
and neurotensin-ir (F), or c-Fos-ir and ghrelin-ir (H) indicates that intracerebroventricular
h(Gly2)GLP-2 activates hypothalamic neuropeptidergic neurons. Note that there was no change
in the number of neurons expressing only α-MSH-ir (A), NPY-ir (C), neurotensin-ir (E) or
ghrelin-ir (G) in the hypothalamic regions of saline- or h(Gly2)GLP-2-treated animals. Data are
represented as mean ± SEM (n = 3-4 mice/group); *P < 0.05, ** P < 0.01, *** P < 0.001 vs.
saline treatment. Statistical significance was calculated by two-tailed, unpaired t-test.

113
The number of c-Fos-positive nuclei co-expressing neurotensin-immunoreactivity were
significantly increased by 404% in the VMH [saline 4.01 ± 1.67 versus 5 µg h(Gly2)GLP-2,
20.20 ± 5.02, P = 0.045], and by 535% in the LH [saline 4.01 ± 1.67 versus 5 µg h(Gly2)GLP-2,
20.20 ± 5.02, P = 0.031]. Also, the number of c-Fos-positive nuclei co-expressing ghrelin-
immunoreactivity were significantly increased by 242% in the internuclear space between DMH
and LH [saline 5.28 ± 1.76 versus 5 µg h(Gly2)GLP-2, 18.06 ± 2.09, P = 0.003]. The number of
neurons expressing only neuropeptide-immunoreactivity remained unchanged in these
hypothalamic regions of saline- or h(Gly2)GLP-2-treated animals (Figure 26A, C, E, and G).
5.3.3 Expression of GLP-2R and appetite-regulating neuropeptides in
adult mHypoA-2/30 cell line
Direct regulation of hypothalamic neurotensin and ghrelin mRNA expression by
h(Gly2)GLP-2 was studied using a clonal, immortalized hypothalamic neuronal cell model, adult
mHypoA-2/30 neuronal cell line. Prior to using this cell model, the presence of GLP-2R mRNA
in the mHypoA-2/30 neuronal cells was confirmed using RT-PCR (Figure 27A). In another cell
model, embryonic mHypoE-36/1 cell line, GLP-2R gene expression was not confirmed. GLP-
2R-positive mouse jejunal tissue mRNA was used as a positive control. Also, the expression of
hypothalamic neuropeptides involved in appetite regulation was analyzed and it was found that
neurotensin and ghrelin genes are expressed in this cell line (Figure 27B). Currently, there are no
hypothalamic cell models reported with a functional endogenous GLP-2R. Therefore, to
determine if the GLP-2R is functionally active in the adult mHypoA-2/30 neuronal cells,
activation of cAMP was measured by cAMP-RIA following GLP-2 treatment using two different
concentrations (10 and 50 nM). Forskolin (1µM) was used as a positive control for cAMP
activation. Using cAMP-RIA, it was found that both doses of GLP-2 significantly increased
cAMP levels in the neuronal cell line [cAMP content (pmol/µg protein): vehicle, 0.49 ± 0.08; 1
µM forskolin, 2.35 ± 0.17; 10 nM GLP-2, 0.79 ± 0.11; 50 nM GLP-2, 0.92 ± 0.06; forskolin
versus saline, P < 0.01; GLP-2 (10 nM and 50 nM) versus vehicle, P < 0.05] (Figure 27C).
Increases in the cAMP content indicate that the GLP-2R expressed in these cells is functional
and responsive to GLP-2. Further, using GLP-2(3-33), a GLP-2R antagonist, it was studied
whether h(Gly2)GLP-2 directly activates GLP-2R to stimulate cAMP production. It was

114
Figure 27. Expression profile of GLP-2R and appetite-regulating neuropeptides in the
hypothalamic neuronal cell lines. A: Expression of GLP-2R mRNA transcript in jejunum and
the hypothalamic neuronal cell lines mHypoA-2/30 and mHypoE-36/1 by RT-PCR using
specific primers for mouse GLP-2R gene. Total RNA, isolated from mouse jejunum and the
indicated cell lines, was used as template for RT-PCR using One-Step RT-PCR kit. Mouse
jejunal RNA was used as a positive control for GLP-2R expression. M, markers; NTC, no
template control. B: RT-PCR analysis results for the mRNA expression of neuropeptides in
mHypoA-2/30 neuronal cells. ‘+’ indicates that the gene is expressed; ‘-’ indicates that the gene
is not expressed. C: Expression of functional GLP-2R by cAMP-RIA in mHypoA-2/30 neuronal
cells. D: h(Gly2)GLP-2 (hGLP-2) stimulates cAMP production via the GLP-2R activation. The
cells were pretreated for 5 minutes with 1 µM GLP-2 (3-33) or vehicle alone prior to a 10-minute
treatment with vehicle, forskolin (1 or 10 µM), GLP-2 (10 or 50 nM) or hGLP-2 (10 nM). The
amount of intracellular cAMP was determined in triplicate by RIA. Forskolin was used as a
positive control. All results are expressed as mean ± SEM (n = 4; *P < 0.05, **P < 0.01 vs.
vehicle control).
115
found that 1 µM GLP-2(3-33) alone did not stimulate cAMP production, but completely
attenuated the stimulatory effect of h(Gly2)GLP-2, suggesting that h(Gly
2)GLP-2 stimulates
cAMP production via GLP-2R activation [cAMP content (pmol/µg protein): vehicle, 0.40 ±
0.02; 10 µM forskolin, 9.79 ± 0.28; 10 nM h(Gly2)GLP-2, 0.79 ± 0.17; 1 µM GLP-2(3-33), 0.41
± 0.01; 1 µM GLP-2(3-33) + 10 nM h(Gly2)GLP-2, 0.45 ± 0.01; forskolin versus saline, P <
0.01; h(Gly2)GLP-2 (10 nM) versus vehicle, P < 0.05] (Figure 27D).
5.3.4 Activation of CREB/ATF-1 and c-Fos by h(Gly2)GLP-2 in the
hypothalamic neuronal cells
The key signaling pathway that GLP-2 activates is the cAMP/PKA pathway. Therefore,
the next step was to determine downstream effectors of cAMP/PKA pathway activated by
h(Gly2)GLP-2 in the hypothalamic adult neuronal cells. Therefore, neuronal cells were treated
with 10 nM h(Gly2)GLP-2 and activation of CREB/ATF-1 and c-Fos was analyzed over 6 h. By
western blot analysis, it was found that h(Gly2)GLP-2 significantly induced c-Fos activation by
62% in the adult mHypoA-2/30 cell line at 2 h [c-Fos/Gβ: vehicle, 0.91 ± 0.07 versus 10 nM
h(Gly2)GLP-2, 1.69 ± 0.14, P < 0.05] (Figure 28A). Similarly, h(Gly
2)GLP-2 significantly
increased phosphorylation of CREB at Ser 133 at 15 min, 1 h and 2 h by 63%, 33% and 59%,
respectively, in the adult neuronal cells (Figure 28B). Simultaneously, h(Gly2)GLP-2 induced
significant increase in phosphorylation of ATF-1 from 5 min to 6 h and the maximum increase
was by 72% at 2 h post-treatment in these neuronal cells (Figure 28C).
5.3.5 Regulation of neurotensin and ghrelin mRNA transcript levels by
h(Gly2)GLP-2
Next, neurotensin and ghrelin mRNA transcript regulation by h(Gly2)GLP-2 was
investigated. The adult hypothalamic neuronal cells were exposed to 10 nM h(Gly2)GLP-2 over
a 24 h time course. Using real-time qRT-PCR, it was found that in the adult mHypoA-2/30
neurons, neurotensin mRNA levels were significantly up-regulated by 50% at 24h post-treatment
[neurotensin mRNA expression (fold change relative to -actin): vehicle, 1.02 ± 0.11 versus 10
nM h(Gly2)GLP-2, 1.53 ± 0.17, P < 0.05] (Figure 29A). Similarly, it was observed that
h(Gly2)GLP-2 significantly increased ghrelin mRNA levels by 95% at 24 h post-treatment

116
Figure 28. Acute h(Gly2)GLP-2 treatment induces c-Fos activation and CREB/ATF-1
phosphorylation in the hypothalamic GLP-2R-positive mHypoA-2/30 neuronal cells. The
mHypoA-2/30 neuronal cells were serum starved overnight and then treated with h(Gly2)GLP-2
(10 nM) or vehicle. Protein was isolated over 6 h at the indicated time points, resolved on 10%
SDS-PAGE, transferred to PVDF membrane, and immune-blotted with antisera for c-Fos,
phospho-CREB/ATF-1, total CREB and Gβ (G-protein β subunit). h(Gly2)GLP-2 significantly
increased c-Fos expression (A), and induced phosphorylation of CREB (B) and ATF-1 (C) in the
mHypoA-2/30 cells. c-Fos expression was normalized to Gβ, and phosphorylation of CREB and
ATF-1 was normalized to total CREB. Representative Western blots are shown. All results
shown in the bar graphs are expressed as mean + SEM (n = 4 independent experiments; *P <
0.05, **P < 0.01 vs. vehicle control). Statistical significance was calculated by two-way
ANOVA.

117
Figure 29. Regulation of neurotensin (A, C) and ghrelin (B, D) mRNA levels by
h(Gly2)GLP-2 in the mHypoA-2/30 neuronal cell line in protein kinase A (PKA)-dependent
manner. Following overnight incubation with DMEM containing 0.5% FBS, the cells were
exposed to h(Gly2)GLP-2 (10 nM) or vehicle over a 24h time course and at the indicated time
points RNA was isolated (A, B). For the use of PKA inhibitors, the neuronal cells were pre-
treated with PKA inhibitor PKI 14-22 (1 mM) or H89 (5 mM) for 1h followed by either vehicle
(PBS or DMSO) or h(Gly2)GLP-2 (10 nM) treatment and the RNA was isolated at 24h time
point (C, D). Total RNA was used as a template for real-time RT-PCR with primers specifically
designed to amplify neurotensin or ghrelin mRNA. Neurotensin (A, C) and Ghrelin (B, D)
mRNA levels were quantified using the standard curve method and normalized to the internal
control (γ-actin). All results shown are relative to corresponding control mRNA levels at each
time point (A, B) or to PBS only-treated mRNA levels (set to 1.0) (C, D), and are expressed as
mean ± SEM (n = 4 independent experiments; *P < 0.05, **P < 0.01). White bars (C, D)
represent vehicle (PBS or DMSO)-treated samples (with or without PKA inhibitor); black bars
represent h(Gly2)GLP-2-treated samples (with or without PKA inhibitor).

118
in the adult mHypoA-2/30 cell line [ghrelin mRNA levels (change relative to -actin): vehicle,
0.80 ± 0.19 versus 10 nM h(Gly2)GLP-2, 1.56 ± 0.28, P < 0.05] (Figure 29B). These results
clearly indicate that neurotensin and ghrelin mRNA levels are regulated by GLP-2R activation in
the hypothalamic neuronal models, and complement the findings within the in vivo setting.
5.3.6 PKA inhibitors reverse the h(Gly2)GLP-2-induced up-regulation of
neurotensin and ghrelin mRNA transcript levels
Further, the role of PKA in the regulation of neurotensin and ghrelin mRNA transcript
levels by h(Gly2)GLP-2 was determined. Pharmacological inhibitors of PKA (H-89 at 5 µM and
PKI (14-22) amide at 1 µM concentration) were used to pre-treat the adult neuronal cells for 1 h
before exposure to 10 nM h(Gly2)GLP-2. PBS and DMSO were used as vehicle controls, as
h(Gly2)GLP-2 was dissolved in PBS and PKA inhibitors were dissolved in DMSO. Total RNA
was isolated at 24 h after the h(Gly2)GLP-2 treatment and analyzed using real-time qRT-PCR.
As compared to the vehicle treatments, at 24 h, h(Gly2)GLP-2 treatment significantly induced
increase in the neurotensin mRNA levels [PBS, 0.91 ± 0.02 versus PBS + 10 nM h(Gly2)GLP-2,
1.61 ± 0.19, P < 0.05; DMSO, 0.68 ± 0.03 versus DMSO + 10 nM h(Gly2)GLP-2, 1.12 ± 0.12, P
< 0.05] (Figure 29C). Further, it was found that both PKA inhibitors did not affect the basal
neurotensin mRNA levels, but significantly attenuated the h(Gly2)GLP-2-induced increase in
neurotensin mRNA levels in the mHypoA-2/30 neuronal cell model [PKI, 0.98 ± 0.13 versus
PKI + 10 nM h(Gly2)GLP-2, 0.69 ± 0.10, P < 0.05; H89, 0.69 ± 0.10 versus H89 + 10 nM
h(Gly2)GLP-2, 0.50 ± 0.04, P < 0.05] (Figure 29C). Next, the role of PKA in the ghrelin mRNA
upregulation caused by h(Gly2)GLP-2 was investigated. At 24 h, h(Gly
2)GLP-2 significantly
increased ghrelin mRNA levels as compared to the vehicle treatment [PBS, 0.72 ± 0.10 versus
PBS + 10 nM h(Gly2)GLP-2, 1.42 ± 0.06, P < 0.05; DMSO, 0.72 ± 0.02 versus DMSO + 10 nM
h(Gly2)GLP-2, 1.09 ± 0.07, P < 0.05] (Figure 29D). Similar to the suppression of neurotensin
mRNA levels detected at 24 h, both PKA inhibitors attenuated the h(Gly2)GLP-2-induced up-
regulation in ghrelin mRNA levels [PKI, 0.98 ± 0.12 versus PKI + 10 nM h(Gly2)GLP-2, 1.13 ±
0.15; H89, 0.82 ± 0.06 versus H89 + 10 nM h(Gly2)GLP-2, 1.05 ± 0.16] (Figure 29D). Overall,
these results indicate that PKA activation is involved with the regulation of neurotensin and
ghrelin mRNA by h(Gly2)GLP-2.
119
5.4 Discussion
The proglucagon system plays an important role in the central regulation of energy
homeostasis (7, 333). Many studies have described the hypothalamic actions of GLP-1 on energy
homeostasis. However, the potential central effects of GLP-2 still remain largely unknown. The
hypothalamus is comprised of various nuclei, a subdivision of which are known to be involved in
the regulation of feeding behavior. Besides the well-documented NPY and POMC neurons, two
other major regulators of energy homeostasis, neurotensin and ghrelin neurons are also expressed
within the ARC (56, 105, 106, 156). The neurotensin system in the hypothalamus is extensive,
and strong neurotensin immunoreactivity is found in the ARC, PVN, DMH and LH, with low
immunoreactivity in the VMH (56, 409). Ghrelin neurons are also located in the PVN, the
perifornical region and the internuclear spaces between hypothalamic nuclei (105). At present,
the neuronal phenotypes expressing GLP-2R in the DMH and VMH are not clear. It was found
that h(Gly2)GLP-2 remarkably activated main hypothalamic regions involved in regulation of
energy homeostasis. Furthermore, it was detected that central h(Gly2)GLP-2 differentially
activated α-MSH/POMC, NPY, neurotensin, and ghrelin neurons in a number of these regions.
These findings indicate that GLP-2R activation involves complex interactions between several
hypothalamic nuclei, activation of feeding-related neuropeptidergic neurons, and transcriptional
regulation of downstream neuropeptides.
Central h(Gly2)GLP-2 administration activated several hypothalamic regions with a
distinct pattern of c-Fos expression in comparison with the long acting GLP-1R agonist, exendin-
4 (372). Not only the major nuclei that are located in the vicinity of the third ventricle were
activated, but also the lateral hypothalamus was activated. As the DMH and VMH have been
demonstrated to express GLP-2R, activation of c-Fos in these areas suggests direct action of the
h(Gly2)GLP-2, however activation of ARC, PVN and LH could be due to indirect activation, as
GLP-2R expression is not found in these regions (214, 218). Because these regions function
together to regulate energy balance (410), their indirect activation by GLP-2R-expressing
neurons is quite possible. Interestingly, except for the VMH, these hypothalamic regions highly
express GLP-1R (217). Thus, there is a remote possibility of cross-reactivity of h(Gly2)GLP-2
with GLP-1R at the pharmacological dose used in the present study. However, it has been
demonstrated that h(Gly2)GLP-2 activates only the GLP-2R-expressing cells, but not those

120
expressing GLP-1R (218). Moreover, the effects of h(Gly2)GLP-2 on food intake in GLP-1R
knockout mice were not attenuated by disruption of GLP-1R signaling, but rather potentiated,
suggesting that GLP-2 does not mediate its effects on feeding through GLP-1R (218). However,
based on the activation of several hypothalamic nuclei by pharmacological h(Gly2)GLP-2,
specificity of GLP-2 action in the hypothalamus needs to be investigated further using GLP-2R
antagonists or GLP-2R knock-down strategy.
The detection of significant activation of NPY and neurotensin neurons in the DMH and
neurotensin neurons in the VMH coordinates well with the expression of GLP-2R in these areas.
However, whether NPY or neurotensin neurons express GLP-2R in vivo is not known. The
significant increase in the number c-Fos-immunopositive α-MSH/POMC, NPY, neurotensin and
ghrelin neurons in those areas that do not express GLP-2R is intriguing. c-Fos immunostaining
may have arisen from activation of projections from the GLP-2R-expressing neurons of the
DMH or VMH, or from activation of brainstem GLP-2R-expressing neurons by h(Gly2)GLP-2
carried from the third to the fourth ventricle. These findings suggest that during the central GLP-
2R-induced anorexia not only anorexigenic neurons, but also orexigenic neurons are activated in
multiple hypothalamic nuclei. Furthermore, activation of all these areas by h(Gly2)GLP-2
implies a complex interaction between these nuclei and neurons that ultimately enhances the
perception of satiety and thereby facilitates anorexia and decreased body weight.
It is not quite clear whether endogenous GLP-2 or peripherally administered
h(Gly2)GLP-2 cross the BBB. Because GLP-2 and GLP-1 have nearly 50% sequence homology
and are secreted in parallel from intestinal L-cells (411), and also because GLP-1, glucagon and
oxyntomodulin cross the BBB (219, 412, 413), it is likely that GLP-2 can also cross the BBB.
Therefore, as the long acting GLP-2, teduglutide, is currently undergoing clinical trials for short
bowel syndrome, careful consideration should be given to the novel findings on the central
action of GLP-2. It must be noted that although recent studies in humans found no effect of
intravenous GLP-2 on food intake (414), it was found that GLP-2 decreases fat mass and
increases lean mass in short-bowel patients (415). The present data show that pharmacological
dose of h(Gly2)GLP-2 decreases food and water intake, and induces body weight loss within 2 h
post-i.c.v. administration. It is possible that the body weight loss could be entirely due to
significant water intake suppression due to GLP-2 action on the central angiotensin II receptors

121
or vasopressin-expressing neurons that were not examined in the present study (416). On the
other hand, the fact that GLP-2 reduces food intake yet increases the CNS ghrelin levels suggests
a role for ghrelin signaling to decrease water intake (417). Further, it can be speculated that the
weight loss was due to the stimulation of diuresis or defecation that also needs further attention.
Apart from appetite regulation, other potential actions from the pharmacological
activation of central GLP-2R have yet to be fully delineated. GLP-2 has been shown to reduce
glutamate-induced cell death in cultured murine hippocampal and cortical cells (418). Similarly,
ghrelin is also found to exert neuroprotective effects by its anti-inflammatory action in the CNS
(383). Thus, ghrelin may potentially mediate anti-inflammatory action and thereby
neuroprotective effects of central GLP-2R action (418). Further, GLP-2 has been shown to
stimulate proliferation of cultured rat astrocytes (419). A synthetic neurotensin agonist was
found to induce an increase in the proliferation of the astrocytic cell lines (420), whereas ghrelin
was demonstrated to promote neurogenesis (421, 422). Whether neurotensin and ghrelin act as
downstream effectors of GLP-2 action in cell proliferation is not known and requires further
study. Furthermore, GLP-2-mediated regulation of murine hippocampal neurons by increasing
glucose uptake implicates an important role for GLP-2 in neurotransmitter release and hormone
secretion from GLP-2R-positive neurons and endocrine cells (423). As hypothalamic α-
MSH/POMC, NPY and ghrelin neurons are implicated in glucose regulation (106, 107, 131),
whether GLP-2-mediated activation plays any role in peripheral glucose metabolism needs to be
explored further. This study focused exclusively on the action of GLP-2 in the hypothalamus, but
extrahypothalamic action of GLP-2 also needs to be investigated.
The direct action of GLP-2 on the regulation of hypothalamic neuropeptides remains
unstudied due to the lack of endogenous GLP-2R-expressing neuronal cells. Thus, the adult
mouse-derived hypothalamic mHypoA-2/30 neuronal cell model that expresses functional GLP-
2R was used in the current study. The hypothalamic cell model represents a clonal, homogeneous
population of a single neuron, and provides a useful tool to perform gene regulation and
mechanistic studies that are quite challenging to perform in vivo (19). GLP-2 stimulates cAMP
production and activates PKA to exert its CNS actions (392, 418, 423). Therefore, the present
study focused on the cAMP/PKA pathway in the regulation of hypothalamic neurotensin and
ghrelin mRNA expression. Direct GLP-2R activation lead to an increase in intracellular cAMP,
122
and activation of transcription factors CREB and ATF-1. Furthermore, the observed increase in
c-Fos expression in these neuronal cells correlates well with the in vivo c-Fos activation found in
the GLP-2R-expressing DMH and VMH regions, suggesting that the DMH and VMH neurons
could be directly activated by central h(Gly2)GLP-2. Similarly, GLP-2 was found to up-regulate
c-Fos mRNA in BHK-GLP-2R cells as well as in astrocytes to promote cellular proliferation
(231, 419), again pointing to the involvement of GLP-2 in cell proliferation.
Neurotensin and Ntsr are widely expressed in the CNS controlling a number of
physiological functions, such as regulation of circadian rhythm, anti-psychotic action, analgesia,
thermoregulation, regulation of HPA axis, and neuromodulation of dopamine neurotransmission.
Particularly, hypothalamic neurotensin neurons are known to regulate feeding behavior (143).
Ntsr deficiency moderately increases food intake and body weight, and blocks neurotensin-
induced anorexia in mice, implicating neurotensin-Ntsr signaling pathway in feeding and body
weight regulation (139). The observed increase in neurotensin transcript levels in the present
study suggests that GLP-2 may activate neurotensin in favor of anorexigenic action quite similar
to other satiety-inducing neuropeptides and hormones.
Central ghrelin-expressing neurons are the main source of ghrelin in the CNS (105, 424).
Apart from the peripheral ghrelin, it is reported that central ghrelin is also involved in the
regulation of food intake and body weight (153, 155). In the hypothalamic neuronal cell model, a
stimulatory effect on ghrelin mRNA expression was observed. Recently, it was found that GLP-
1R activation by exendin-4 induced a decrease in the ghrelin mRNA levels in agreement with the
anorexigenic action of GLP-1R agonism (372). Also, insulin, a satiety factor and adiposity
signal, was shown to directly inhibit ghrelin expression in another hypothalamic cell model
(395). Similar to the exendin-4 or insulin action, negative regulation of ghrelin mRNA levels by
GLP-2 was expected due to its orexigenic characteristics. The positive regulation may suggest
that ghrelin could play a role in the promotion of hypothalamic neuronal survival, as ghrelin is
known to exert anti-inflammatory and neuroprotective effects in rat brain (383). Although,
ghrelin and neurotensin exert opposite effects on food intake and energy homeostasis, they exert
comparable actions in improving memory and learning, as is evident from decreased ghrelin and
neurotensin mRNA transcript expression in the brains of patients suffering from Alzheimer's
123
disease (425). Thus, it is possible that GLP-2-activated hypothalamic ghrelin and also
neurotensin neurons may potentially exert other functions unrelated to appetite regulation.
The cAMP/PKA pathway has been demonstrated to play an important role in appetite
regulation. Hypothalamic activation of cAMP/PKA mediates central regulation of satiety by
inhibiting NPY-induced feeding (336). Recently, it was shown that exendin-4 activated
hindbrain GLP-1R to induce anorexia in a PKA-dependent manner (327). Furthermore,
cAMP/PKA/CREB signaling upregulates transcription of CART, a potent appetite-suppressing
peptide (394), but PKA and CREB have been shown to negatively regulate NPY gene expression
(337). Thus, it appears that stimulation of cAMP/PKA activity inhibits feeding behavior by
increasing anorexigenic and decreasing orexigenic neuropeptide expression. This agrees with the
finding that the h(Gly2)GLP-2 induced anorexigenic neurotensin mRNA transcript levels via
PKA activation, but does not correlate with the increase in the orexigenic ghrelin mRNA
transcript levels. In fact, at present, the exact role of ghrelin expression in the hypothalamus is
not clear. In addition to mature ghrelin, the ghrelin gene also encodes an entirely different
peptide, obestatin (149). Although the physiological relevance of obestatin remains unclear,
initially it was found to exert anorectic effect that was subsequently disputed (149, 150).
Further, circulating ghrelin exists in two forms, acylated ghrelin and des-acyl ghrelin. Acylated
ghrelin acts as an orexigenic peptide to increase food intake, whereas des-acyl ghrelin, although
its function is not quite clear, has been shown to decrease food intake and gastric emptying
(426). Thus, further investigation is needed to ascertain the correlation between GLP-2-mediated
PKA-dependent stimulation of ghrelin mRNA transcript levels and post-translational processing
of the hypothalamic precursor polypeptide proghrelin.
Apart from cAMP/PKA pathway, regulation of hypothalamic neurotensin and ghrelin
gene expression can occur through alternative pathways. Neurotensin gene expression may be
augmented by leptin via activation of STAT3 and MAPK ERK1/2 (300), whereas ghrelin gene
expression can be repressed by insulin via both PI3-K/Akt and MAPK ERK1/2 pathways (395).
In a similar fashion, GLP-2 has been shown to activate other pathways to mediate intestinal cell
survival and proliferative actions i.e. Akt in the intestinal epithelium (232), and the wnt/β-catenin
signaling pathway in the intestinal crypt cells through an indirect mechanism requiring IGF-
1R/IGF-1 signaling (233). As well, h(Gly2)GLP-2 was found to stimulate IGF-1 mRNA through

124
PI3K/Akt pathway in intestinal subepithelial fibroblasts (408). Likewise, whether GLP-2R
activates MAPK ERK1/2 and PI3K/Akt pathways in hypothalamic neurons remains to be
investigated.
It is normally observed that the activation of PKA or CREB induces gene transcription.
Therefore, the h(Gly2)GLP-2-induced increase in neurotensin and ghrelin mRNA transcript
levels could suggest stimulation of 5’ regulatory promoter elements, such as CRE, to induce gene
transcription. Previous neurotensin gene promoter analysis study indicates that AP-1 site and
CRE element are involved in hormonal regulation of this gene (396). Recently, it was
demonstrated that neurotensin gene expression was induced by leptin via activation of
transcription factors ATF-1 and c-Fos (300). However, it is also possible that the increase in
neurotensin mRNA could be due to an increase in mRNA stability. Contrary to neurotensin gene
promoter region, mouse ghrelin promoter region is not well characterized; whether it contains
regulatory AP-1 site and CRE element remains unknown. Although human ghrelin promoter
does not have AP-1 site or CRE element, glucagon and its second messenger cAMP enhanced
the ghrelin promoter activity, suggesting that ghrelin gene transcription may be regulated by
some cell-specific transcription factors and cofactors to integrate cAMP stimulation to activate
ghrelin gene transcription (427). Thus, further studies are required to determine whether GLP-2
regulates hypothalamic neurotensin and ghrelin mRNA transcript levels through the AP-1 or
CRE consensus sites or through other cis-elements within the promoter or enhancer region of
these genes, or via specific molecular components induced by PKA to increase mRNA stability.
In summary, the results of the present study demonstrate that pharmacological action of
central GLP-2 results in activation of multiple hypothalamic regions to trigger complex
interactions between appetite-regulating neuropeptidergic neurons to induce transient
anorexigenic effect. Using a novel GLP-2R-positive hypothalamic cell line, it was found that
h(Gly2)GLP-2, in a PKA-dependent manner, directly regulates mRNA transcript levels of
feeding-related neuropeptides neurotensin and ghrelin. Overall, these findings suggest that
central GLP-2R may serve as a potential target for pharmacological intervention to modulate
neuropeptides involved in appetite regulation.

125
Chapter 6
Discussion
126
6 Discussion
6.1 Overall conclusions
The PGDPs are generated from a single common proglucagon precursor expressed in
pancreatic islet α-cells, gut enteroendocrine L-cells, and in selective brainstem and hypothalamic
neurons. Until now, the vast majority of research has focused only on the regulation of peripheral
proglucagon gene expression; therefore, much remains unknown about the regulation of
hypothalamic proglucagon gene expression. Specifically, the mechanisms by which two major
hormones, insulin and leptin, regulate proglucagon-expressing hypothalamic neurons have not
been elucidated. For over last two decades, a wealth of data has widened our understanding of
the role of PGDPs in the periphery and the CNS. The GLPs serve important roles in the control
of energy balance, gastro-intestinal motility, nutrient absorption and glucose homeostasis.
Particularly, GLP-1 has been well established as a central regulator of physiological functions
ranging from energy homeostasis, fluid homeostasis, memory and neuronal regeneration.
However, we are still far from having clear knowledge of potential central actions of other
PGPDs including GLP-2. Although PGDPs have emerged as potential regulators of feeding
behavior (1), the exact mechanisms of action of GLP-1R and GLP-2R stimulation in the
hypothalamus are not completely clear; particularly how GLP-1R and GLP-2R stimulation
regulates hypothalamic appetite-regulating neuropeptides has not been investigated. In this
thesis, the hypothalamic control mechanisms at the level of proglucagon-specific neurons were
defined; specifically, the molecular mechanisms utilized by insulin and leptin to regulate
expression of proglucagon in the hypothalamic neurons were studied using novel neuronal cell
models. Further, the actions of long-acting GLP-1R and GLP-2R agonists on mRNA transcript
levels of appetite-regulating hypothalamic neuropeptides that have remained elusive until now
were investigated (372, 428).
Central actions of insulin and leptin are critical in the control of appetite regulation and
maintenance of energy homeostasis. Insulin and leptin activate catabolic POMC neurons (36,
335), while inhibiting anabolic NPY/AgRP neurons in the hypothalamus (429, 430). Apart from
these neuronal circuits that have been well established as critical appetite regulators, PGDPs also
play important roles in regulation of feeding behavior (6). Similar to insulin and leptin, glucagon

127
plays an important role in energy homeostasis, and its central administration suppresses food
intake in rats and chicks (431, 432). The available data suggest that centrally administered GLP-
1 acts on the hypothalamus to regulate food intake and body weight (26, 209, 210). Although
GLP-2 has intestinotrophic activity in rodents, it also functions as a hormonal ileal brake since it
was demonstrated that GLP-2 dose-dependently inhibited centrally-induced antral motility in
pigs (204). Further, central administration of GLP-2 is involved in regulation of food intake in
rats and mice (214, 218). Acute central or peripheral administration of another PGDP,
oxyntomodulin, inhibits food intake in rodents, whereas chronic administration reduces body
weight (205, 433). Thus, it is evident that exogenous PGDPs act as central regulators of appetite,
and hence it is imperative to study the regulation of hypothalamic proglucagon-expressing
neurons and action of hypothalamic PGDPs. At present, it is not known whether central,
peripheral, or a combination of both sources of PGDPs signal hypothalamic nuclei to regulate
energy homeostasis. For example, it is possible that due to its very short plasma half-life, gut-
derived GLP-1 may not even reach the hypothalamus or other parts of the central nervous
system. Therefore, only centrally-derived GLP-1 may be functional in these central regions or
peripheral GLP-1 may act only on the circumventricular regions of the brain which have an
incomplete BBB, such as ME or area postrema. The ambiguity and lack of knowledge is mostly
due to inaccessibility to the hypothalamic proglucagon-, GLP-1R- or -2R-expressing neurons.
Previous studies on the regulation of hypothalamic PGDPs were conducted on fetal rat
hypothalamic primary cell cultures (183, 202); however, these cultures are quite challenging to
generate and maintain. In order to circumvent this technical issue, the present research used
phenotypically distinct cell lines generated from embryonic and adult mouse hypothalamii that
endogenously express proglucagon mRNA, insulin and leptin receptors, and receptor signaling
proteins (18, 19).
At present, it is unknown if insulin and leptin have any direct action on the hypothalamic
proglucagon neurons, and the regulatory mechanisms utilized by these molecules remain
unstudied. This thesis research characterized the signaling pathways and changes in proglucagon
mRNA levels that occur as a direct result of insulin and leptin administration to adult and
embryonic hypothalamic, clonal cell lines (Figure 30). A new evidence that insulin and leptin
can act directly upon proglucagon neurons to regulate proglucagon mRNA levels was
demonstrated. It was found that insulin activates an Akt-dependent pathway and leptin triggers

128
Figure 30. Summary of the mechanisms activated by insulin and leptin to regulate
proglucagon mRNA transcript levels in the mHypoA-2/10 and mHypoE-39 neuronal cells. Exposure of insulin and leptin leads to the activation of classic signal transduction pathways in
the novel hypothalamic proglucagon-expressing neurons: induction of Akt by insulin and
JAK2/STAT3 by leptin to regulate proglucagon mRNA levels. Insulin and leptin regulate
proglucagon mRNA stability through unidentified mechanisms and/or may trigger yet unknown
transcriptional mechanisms to modulate proglucagon mRNA levels in the hypothalamic neuronal
cells. TF, transcription factor; upward pointing solid green arrows represent upregulation and
downward pointing red arrows represent downregulation of mRNA levels or stability; solid blue
arrows represent interactions by known mechanisms, whereas dashed blue arrows and question
marks represent yet to be identified mechanisms.

129
activation of STAT3 to regulate hypothalamic proglucagon mRNA levels in adult and embryonic
cell models models. It was further determined that insulin and leptin do not regulate activity of
the transfected human or rat proglucagon promoter reporter constructs in the mouse embryonic
cells, but rather affect proglucagon mRNA stability. Overall, these findings suggest that insulin
and leptin can act directly on specific hypothalamic neurons to regulate proglucagon mRNA
levels. A better understanding of the mechanisms through which insulin and leptin regulate
hypothalamic proglucagon neurons will further enable us to understand roles of PGDPs in
energy homeostasis.
GLP-1R activation by exendin-4 has been shown to regulate food intake and energy
expenditure (371). The widespread clinical use of exendin-4 as an anti-diabetic drug warrants
further research on the mechanisms underlying the anorectic actions of exendin-4 within the
hypothalamus (7). The present study identified hypothalamic neuropeptidergic neurons
responsive to central GLP-1R activation in vivo, and elucidated the direct action of exendin-4 on
neurotensin and ghrelin mRNA transcript regulation in vitro (Figure 31). It was found that
exendin-4 activated hypothalamic ARC, PVN, DMH and PeV, regions that widely express GLP-
1R along with several neuropeptides involved in energy metabolism. Furthermore, it was
detected that central exendin-4 significantly activated α-MSH/POMC and NPY neurons in the
ARC, neurotensin-expressing neurons in the PVN, and ghrelin-expressing neurons in the ARC,
PVN and PeV. Overall, the in vivo findings suggest that complex interactions may occur between
satiety- and hunger-related neuropeptides in one or more hypothalamic nuclei to mediate the
overall anorexic action of exendin-4. Finally, using the hypothalamic neuronal cell models, it
was found that exendin-4, in a PKA-dependent manner, increased neurotensin mRNA levels
while attenuating ghrelin mRNA levels. These in vitro findings complement the in vivo findings
and suggest that regulation of hypothalamic neurotensin and ghrelin may lie downstream of
exendin-4 GLP-1R activation. Given that central exendin-4 induces net inhibition of both
drinking and feeding that results in significant weight loss, it is likely that hypothalamic
anorexigenic neurotensin neurons are stimulated and orexigenic ghrelin neurons are inhibited in
vivo. Ultimately, this study provides a previously unrecognized link between exendin-4 action
and neurotensin and ghrelin regulation.

130
Figure 31. Summary of the mechanisms activated by exendin-4 to regulate neurotensin and
ghrelin mRNA transcript levels in the mHypoA-2/30 and mHypoE-36/1 neuronal cells.
Exendin-4 activates classic cAMP-PKA signal transduction pathway in the novel hypothalamic
GLP-1R-expressing neuronal cells to regulate neurotensin and ghrelin mRNA levels. Exendin-4
may trigger yet unknown transcriptional mechanisms and/or modify mRNA stability through
unidentified mechanisms to regulate neurotensin and ghrelin mRNA levels in the hypothalamic
neuronal cells. NT, neurotensin; upward pointing solid green, yellow and black arrows represent
upregulation and downward pointing red arrows represent downregulation of mRNA levels or
stability; solid blue arrows represent interactions by known mechanisms, whereas dashed blue
arrows and question marks represent yet to be identified mechanisms.

131
In the periphery, following nutrient ingestion, GLP-1 and GLP-2 are secreted in
equimolar quantities from intestinal L-cells (7, 434, 435). The circulating biologically active
GLP-1 is degraded within two minutes (436), whereas GLP-2 is more stable, with plasma half-
life of about seven minutes (437, 438). Inactivation of these peptides by DDP-4 is responsible for
their relatively short plasma half-lives. In the CNS, GLP-1 and GLP-2 are synthesized in the
caudal brainstem and the hypothalamus, and the expression pattern of the central proglucagon
neurons appears to be well conserved across mammalian species (172, 215, 333, 401). The GLP-
1/GLP-2-expressing proglucagon neurons of the NTS send extensive projections to the
hypothalamic PVN and DMH, both regions known to be involved in the regulation of feeding
behavior (213). Because GLP-2 is co-localized with GLP-1 in the NTS region and is likely co-
secreted with GLP-1, it has been speculated that GLP-2 also acts as a neurotransmitter and exerts
similar actions like GLP-1 in the CNS (214, 333). Only a few studies have addressed the
signaling mechanisms triggered by central GLP-2R activation in the CNS. Unlike GLP-1, GLP-2
is not a potent appetite regulator, as peripheral GLP-2, at physiological plasma concentration,
does not contribute significantly to regulate appetite in humans (414, 439, 440). Nevertheless,
Tang-Christensen et al. discovered that central administration of high amounts of GLP-2 is
involved in regulation of food intake in rats (214). Similarly, pharmacological doses of central
long-acting GLP-2 inhibited short-term food intake in mice (218). These studies demonstrate that
pharmacological intervention with the central GLP-2R potentially results in appetite suppression.
Therefore, the mechanisms of central GLP-2R action to induce reduction in food intake require
further characterization. Using in vivo and in vitro models, the present thesis investigated
activation of hypothalamic anorexigenic α-MSH/POMC and neurotensin, and orexigenic NPY
and ghrelin neurons following central administration of long-acting GLP-2, and determined
possible signal transduction pathways involved in this regulation (Figure 32).
To evaluate the response to acute central GLP-2R stimulation, a degradation-resistant
GLP-2, h(Gly2)GLP-2, was infused into the third cerebral ventricle of adult mice to induce
transient anorexigenic effects similar to previous reports (214, 218). During this period of
transient anorexia, it was found that h(Gly2)GLP-2 remarkably activated hypothalamic ARC,
DMH, VMH, PVN and LH (as indicated by increased c-Fos-immunoreactivity in these nuclei),
the main hypothalamic regions involved in regulation of energy homeostasis. Furthermore, it was
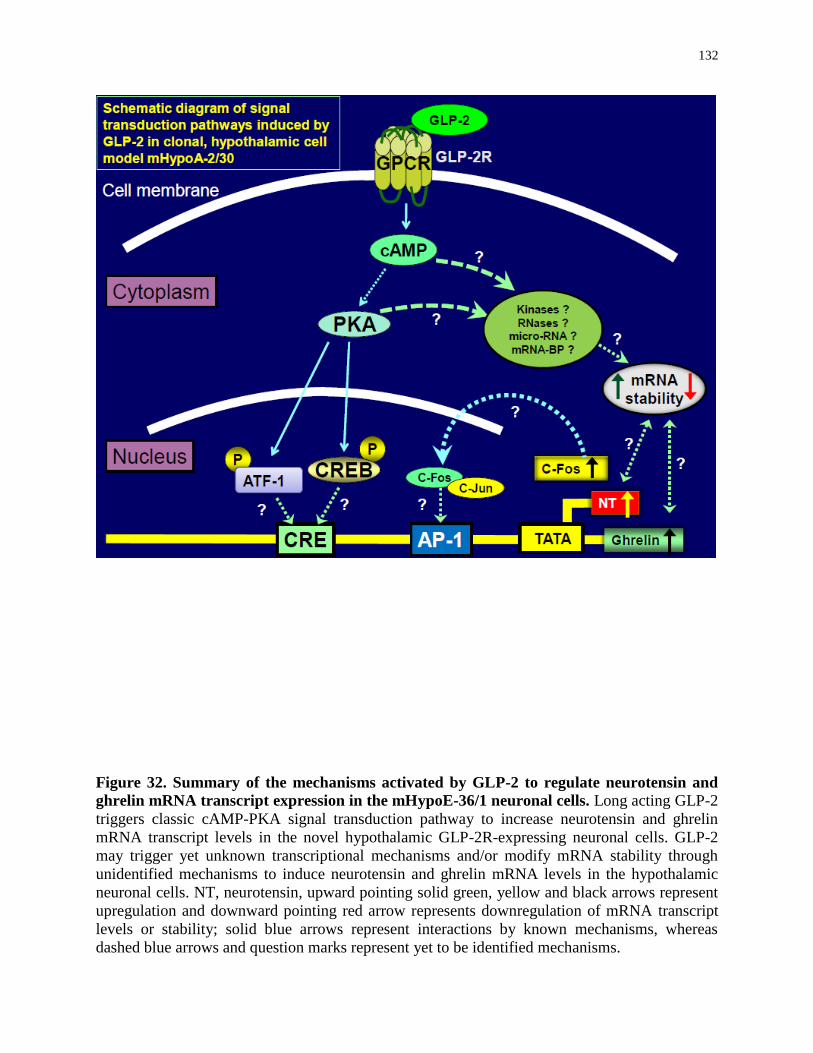
132
Figure 32. Summary of the mechanisms activated by GLP-2 to regulate neurotensin and
ghrelin mRNA transcript expression in the mHypoE-36/1 neuronal cells. Long acting GLP-2
triggers classic cAMP-PKA signal transduction pathway to increase neurotensin and ghrelin
mRNA transcript levels in the novel hypothalamic GLP-2R-expressing neuronal cells. GLP-2
may trigger yet unknown transcriptional mechanisms and/or modify mRNA stability through
unidentified mechanisms to induce neurotensin and ghrelin mRNA levels in the hypothalamic
neuronal cells. NT, neurotensin, upward pointing solid green, yellow and black arrows represent
upregulation and downward pointing red arrow represents downregulation of mRNA transcript
levels or stability; solid blue arrows represent interactions by known mechanisms, whereas
dashed blue arrows and question marks represent yet to be identified mechanisms.

133
detected that central h(Gly2)GLP-2 significantly activated α-MSH/POMC neurons in the ARC,
NPY neurons in the ARC and DMH, neurotensin neurons in the ARC, DMH, VMH, PVN and
LH, and ghrelin neurons in the ARC, PVN and internuclear space between DMH and LH.
Ultimately, to investigate the direct effect of increased GLP-2R signaling on hypothalamic
neuropeptides, recently immortalized GLP-2R-positive adult mHypoA-2/30 hypothalamic
neuronal cell model was used. It was found that h(Gly2)GLP-2 significantly increased
neurotensin and ghrelin mRNA expression via PKA activation. Collectively, these novel findings
indicate that the transient anorexia induced by central GLP-2R activation involves complex
interactions between several hypothalamic nuclei, activation of feeding-related neuropeptidergic
neurons, and regulation of mRNA transcript levels of downstream mediators such as neurotensin
and ghrelin.
The findings from the first part of this thesis indicate that insulin and leptin regulate
proglucagon mRNA levels in both adult and embryonic hypothalamic neuronal cell models.
Indeed, this regulation may play an important role in appetite control, most probably in
mediating anorexigenic action of both hormones that act as adiposity signals in living organisms.
However, the differential regulation of proglucagon mRNA levels by insulin in adult versus
embryonic cells indicates that it may occur due to differential post-translational processing of
precursor polypeptide proglucagon that results in the generation of distinct PGDPs in adult and
embryonic hypothalamic neurons. As glucagon is one of the main PGDPs synthesized in the
embryonic hypothalamus (183, 184), the observed downregulation of proglucagon mRNA
transcript levels by insulin in the embryonic neuronal cells can be related to the counter-
regulatory actions of insulin on glucagon synthesis in embryonic hypothalamus quite similar to
the insulin-mediated downregulation of proglucagon gene expression and glucagon synthesis in
pancreatic α-cells (200, 201). Further, GLP-1, GLP-2 and oxyntomodulin are the main PGDPs
synthesized in the adult hypothalamus (172, 183, 333), therefore, the upregulation of
hypothalamic proglucagon mRNA by insulin in the adult hypothalamic neuronal cells reflects
similar regulation of proglucagon mRNA by insulin in enteroendocrine L-cells (199, 263). This
differential regulation of hypothalamic proglucagon in adult versus embryonic neurons must be
physiologically important. As the peripheral GLP-1 and GLP-2 play important roles in nutrient
absorption, metabolism, cyto- and entero-protection, the upregulation of hypothalamic
proglucagon mRNA transcripts by insulin and leptin could be involved in similar functions in the

134
CNS, such as central feeding regulation, neuroprotection and neuronal regeneration that need to
be investigated further. To partially address this issue, in the second part of this thesis, action of
GLP-1R and GLP-2R agonists on anorexia and activation of hypothalamic neuropeptidergic
neurons in mice were investigated. Both GLP-R agonists activate specific neuronal populations
in the hypothalamus during suppression of feeding. Furthermore, it was found that both GLP-R
agonists suppressed not only feeding but also water intake. In this context, it must be noted that
both GLP-R agonists activated the PVN, an important region of the hypothalamus that
synthesizes and secrets several major hormones involved in energy homeostasis such as CRH,
TRH, or vasopressin into the general circulation (50-52). Previously it was found that GLP-1
increased vasopressin and CRH levels in rats (441), however, it remains unknown whether these
PVN neurons were affected by both GLP-R agonists in mice used in the present study.
Another important finding is the differential regulation of grhelin by exendin-4 and
h(Gly2)GLP-2 during early time period post-treatment in the hypothalamic adult neurons.
Although both GLP-R agonists activate similar signaling proteins, it was found that only
exendin-4 suppressed ghrelin mRNA levels. A possible explanation for this differential action
can be the specific properties possessed by the GLP-1R. Unlike GLP-2R, the GLP-1R is
promiscuous, in that it has been shown to couple to multiple G proteins, activating multiple
signalling pathways. Although the GLP-1R is known to preferentially couple to Gαs, it can also
couple to Gαq proteins resulting in activation of phospholipase C, protein kinase C (PKC) and
mobilisation of intracellular Ca2+
(375, 442, 443). Thus, these findings indicate that
hypothalamic GLP-1R and GLP-2R activation can lead to differential regulation of hypothalamic
neuropeptides due to unique characteristics of these receptors.
It was found that at pharmacological concentrations, both GLP-1R and GLP-2R agonists
activate hypothalamic specific neuronal populations during anorexia. However, it is noteworthy
that the dose of h(Gly2)GLP-2 (5 µg/mouse) used to induce suppression of food intake in mice
was 50 times higher than the dose of exendin-4 (100 ng/mouse) to induce similar anorexigenic
action. This difference in the effectiveness of exendin-4 and h(Gly2)GLP-2 indicates that
although pharmacological intervention with the central GLP-2R potentially results in appetite
suppression, h(Gly2)GLP-2 does not appear to have potent anorexigenic properties that exendin-
4 possesses. Further, as both GLP-1 and GLP-2 are co-secreted in equimolar concentrations

135
under physiological conditions, based on our findings, it can be speculated that unlike GLP-1,
the contribution of GLP-2 to induce anorexia could be minimal or even negligible. However,
similar to the h(Gly2)GLP-2-activated hypothalamic neuronal phenotypes detected in this
research project, it is possible that endogenous GLP-2 also activates these neurons under normal
physiological conditions. Thus, it can be speculated that similar to its intestinotrophic actions in
the periphery, the central GLP-2 may exert neurotrophic functions in the CNS, such as neuronal
protection, regeneration, plasticity and memory formation via activation of neurotensin- and
ghrelin-expressing neurons, and therefore, further investigation in this area is warranted.
Currently, much remains unknown about the central mechanisms behind the anorectic
effects of GLP-1 and -2. It is known that food intake is regulated by two complementary central
drives: the homeostatic and hedonic pathways. The homeostatic pathway controls energy balance
by increasing the motivation to eat following depletion of energy reserves. In contrast, hedonic
or reward-based regulation can override the homeostatic pathway during periods of relative
energy abundance by increasing the desire to consume foods that are highly palatable. The
present research has focused primarily on the impact of GLP-1 and -2 on the homeostatic brain
circuits that include well established areas involved in metabolic control in the hypothalamus.
However, it is also possible that these receptors regulate mesolimbic reward system to control
food intake. Importantly, GLP-1R and -2R are expressed in key brain areas controlling reward
and motivated behaviors that include the ventral tegmental area (VTA) and the nucleus
accumbens (NAc) (216). The role of GLP-1R and -2R within these brain areas, however,
remains largely unstudied. Given the rapid and widespread use of the GLP-1R agonist exendin-4,
and its potential to cross the BBB and gain access to brain parenchyma (219), it is of
considerable interest to determine the function of GLP-1R as well as GLP-2R agonists in central
areas involved in hedonic feeding in addition to those involved in homeostatic and metabolic
control. Given that the CNS control of food intake involves cross communication between
classic homeostatic feeding (e.g. NTS, hypothalamus) and higher-order/hedonic nuclei (e.g.
VTA, NAc), it is possible that the intake suppression by GLP-1R and -2R agonists involves
action in homeostatic centers as well as modulation of the rewarding value of food via direct
interaction with the mesolimbic reward system.

136
Recently, it was found that the exendin-4-mediated inhibition of food reward could be
driven from VTA and NAc without inducing concurrent visceral sickness, malaise or locomotor
impairment (444). The findings that the activation of central GLP-1Rs suppresses food reward by
interacting with the mesolimbic reward system indicate an entirely novel mechanism by which
the GLP-1R stimulation affects feeding-oriented behavior (444). Further, it was found that the
brainstem GLP-1-producing proglucagon neurons send projections to both VTA and NAc, and
potentially contribute to the regulation of reward behavior (445, 446). Thus, these novel findings
suggest that central GLP-1Rs exert an impact on the mesolimbic reward system and play an
important role in reward-based food regulation. This novel mechanism by which the GLP-1R
stimulation affects feeding-oriented behavior, and also the mechanisms triggered by GLP-2R
activation in the regulation of hedonic feeding need to be investigated further.
To summarize, this thesis attempts to provide information on some of the unknown
mechanisms underlying hypothalamic proglucagon gene regulation and the action of GLP-1R
and GLP-2R activation on hypothalamic neuropeptides, such as neurotensin and ghrelin,
involved in homeostatic feeding regulation. Elucidation of the control mechanisms regulating
proglucagon gene expression and action of GLPs in the hypothalamus is critical to the
understanding of how energy homeostasis is regulated. Further, regulation of hypothalamic
proglucagon, neurotensin and ghrelin may play an important role in the regulation of reward-
based behavior and hedonic feeding that needs to be investigated further.
6.2 Limitations
Within this thesis, the mechanisms utilized by insulin and leptin to regulate hypothalamic
proglucagon, and by exendin-4 and h(Gly2)GLP-2 to regulate hypothalamic neuropeptides have
been investigated; however, the experimental models used in this thesis have several advantages
and limitations that must not be overlooked in order to avoid overstatement of conclusions that
may be drawn from these findings.
The current experimental models range widely in complexity from clonal, single cell
lines to complex animals. It is expected that the selection of experimental models should be
based on the aim of the experiment and careful consideration of the limitations of each model.

137
The use of immortalized cell lines is advantageous because they are easy to culture and maintain
indefinitely or at least for over several passages. Moreover, they are inexpensive relative to other
experimental models, and largely generate highly reproducible results. For example, ample
amounts of protein or mRNA for analysis of second messenger or gene expression can be readily
obtained, particularly when compared to primary cultures or animal models. Furthermore,
hypothalamic clonal, neuronal cell lines are derived from a single cell type, so there is no danger
of contamination by other confounding non-neuronal cell types. Another great advantage is that
the cell culture offers a controlled physiochemical environment to study specific cellular and
molecular mechanisms, ease of experimental designs and procedures, as well as shortened
experimental timescales that economizes time and other resources. In addition, smaller quantities
of reagents are needed for cell culture experiments that drastically reduce the cost of compounds
for experiments when compared to in vivo research. In the study of hypothalamic gene
regulation, clonal cell models are critical for gaining an understanding of direct hormone and
neuromodulator action on specific neuronal subpopulations and of the molecular events
underlying these actions. Despite all these advantages, cell lines have several limitations that
must be acknowledged to accurately interpret experimental results and avoid drawing premature
conclusions. There is no doubt that in vivo or ex vivo analysis is necessary in supplementation
with in vitro analysis, however, as it is inherent to any technique, in vivo or ex vivo
manipulations, such as bilateral stereotactic or electrical stimulation or lesioning, central
injections or analysis of brain slices could typically stimulate or destroy a wide range of
hypothalamic neuronal subtypes as well as activate or disrupt afferent or efferent neuronal
terminals, thereby producing erroneous results and contributing to the faulty findings. Also,
classical in vivo approaches may not be feasible to investigate any direct effect of an agent on
specific hypothalamic neuronal subtypes, or on neuropeptide gene transcription, synthesis, or
secretion, largely due to limited number of neurons belonging to a particular neuronal phenotype
and also due to the multitude of synaptic inputs received from other adjacent neurons. Although
rodent genetic models have recently been used to examine the consequences of eliminating
neuropeptides or ablating neurons that endogenously express these neuropeptides, these models
have limitations due to the challenges in creating hypothalamus-specific knockouts.
Wherever possible, we tried to use at least two cell models. We used adult and embryonic
mouse-derived hypothalamic cell models. We found that insulin exerted opposite actions in adult
138
versus embryonic neuronal cells. Compared to adult neuronal cells that exhibit the characteristics
of mature neurons, our embryonic neuronal models may not accurately represent fully-
differentiated neurons due to physiological and developmental differences. As the embryonic
cells were generated from primary hypothalamic cultures obtained from fetal mice on E15, E17
and E18, the signaling mechanisms may not be fully functional or the enzymes required for post-
translational processing may not be active. It is noteworthy that prenatal development in rodents
corresponds to the first and second trimesters of human pregnancy, whereas the first week of
neonatal life in rodents corresponds to the third trimester of human pregnancy (447, 448).
Therefore, care must be exercised when interpreting the results of studies that have used both
types of cell models. Further, to confirm our findings from the embryonic neuronal cells,
complementary investigations into a more physiologically relevant cellular context using mouse
embryos is required that, of course, remains very challenging at present.
Another critical issue is that the biological response of one neuronal cell type may differ
from that of another as functionally unique neuronal subpopulations are present in the
hypothalamus and have been identified for both NPY- and GnRH-expressing neurons (449-451).
Thus findings may differ between cell models although they may have derived from the same
organ. Furthermore, removing neurons from their native physiological environment places
obvious limitations on these cell models. Because these cells lack the synaptic afferent and
efferent connections that are critical to neuronal function in intact brain, it is also likely that they
adapt to the artificial neurochemical environment in which they are grown. These adaptations
may cause changes in their gene expression or metabolic profile, and thus overall phenotype,
especially after several passages. For this reason, experiments were conducted at a low passage
and within a narrow passage range.
Another important issue is that genomic incorporation of the SV40 T-antigen oncogene
may also alter the phenotype of immortalized cells. Utilizing short-hairpin RNA to acutely
knockdown T-antigen, preliminary work in the Belsham laboratory has demonstrated that T-
antigen enhances the basal activity of phospho-proteins, including Akt, JAK2, STAT3, and
AMPK, in several immortalized cell types. In immortalized hypothalamic neurons specifically,
an elevation in the endogenous expression of select neuropeptides, such as AgRP and oxytocin,
was observed (Belsham, unpublished data). To minimize the basal activity of these key signaling

139
proteins, a common practice in our laboratory has been to culture neurons in serum-free, low-
glucose medium for several hours prior to treatment. Nonetheless, further investigation needs to
be conducted in order to more fully elucidate the phenotypic changes induced by SV40T-antigen
incorporation and to minimize these effects for the accuracy of the data.
Within this thesis, inhibitors were used to analyze the role of specific signaling proteins
and pathways. The use of pharmacological antagonists is also associated with some important
considerations. Despite the specificity of the antagonists employed in this thesis, it is possible
that these pharmacological agents exert unintended or non-specific effects on the cells. For
example, LY294002 can potentially inhibit glycogen synthase kinase 3, polo-like kinase 1 and
casein kinase 2 at concentrations similar to those that inhibit PI3K and was recently shown to
bind a number of other ATP-binding proteins that are not protein kinases (452, 453). Thus, the
inhibitor studies do not fully rule out the involvement of other enzymes or proteins.
Nevertheless, wherever possible, at least two inhibitors with different mechanisms of action were
used in the inhibitor studies in order to minimize unintended and non-specific inhibition of other
proteins. Also use of two different inhibitors supports the final conclusions as it is less likely that
both would cause the same effect by chance. Future studies utilizing small interfering RNA
(siRNA) would assist in conclusively determining the role of the signaling proteins and pathways
studied in this thesis.
In this thesis, the embryonic hypothalamic cells were transfected with the presently
available human and rat proglucagon promoter constructs due to the current unavailability of
mouse proglucagon promoter reporter plasmids. The use of human or rat proglucagon promoter
constructs in this study can be justified by the fact that the proximal promoter elements are
highly conserved in the rodent and human proximal proglucagon promoter sequences (191). The
homology between human and rat proglucagon promoters shows that they are highly related,
however, there are several differences in the nucleotide sequence (191). The G1 promoter is
highly conserved as compared to the less well conserved G2-G4 enhancer sequences. These
elements have binding sites for several transcription factors including isl-1, cdx-2/3, Brn-4, pax-
6, CREB and AP-1, however putative STAT3 binding sites are not detected (185, 191). A 300 bp
sequence that contains G2, G3 and G4 enhancer elements of rat proglucagon promoter is
sufficient for proglucagon gene expression in the mouse pancreatic islet cells, therefore, two

140
reporter plasmids containing -476 to +58 and -312 to +58 from rat proglucagon promoter were
generated (191, 330). Previously, these promoter constructs were used to study proglucagon gene
expression in hamster islet cell line InR1-G9 and mouse islet cell line αTC-1 (330). As is evident
from Figure 12A, B, the basal activity of these plasmids was much lower than the basal activity
of the human proglucagon plasmids, and any significant activation of rat proglucagon promoter
plasmids by insulin or leptin was not detected. The low basal transcription activity of rat
promoters in the mouse cell line could be due to low sequence similarity between the rat and
mouse proglucagon 5’ regulatory regions. Second, the 5’ flanking sequences used for the
proglucagon constructs were only 312 and 476 bp long, and thus cis-acting responsive elements
in the neuronal proglucagon gene promoter could be located in the upstream GUE promoter
segment that is composed of multiple positive and negative cis-acting DNA regulatory elements
involved in regulating tissue-specific proglucagon gene transcription (190). Further, it should be
noted that although the CRE motif is 100% conserved among rodent species, in the human
proglucagon promoter this site is CAACGTCA instead of TGACGTCA (191), and it remains
unknown whether this motif in human proglucagon gene promoter is capable of interacting with
CREB. Furthermore, trans-activating elements, miRNAs and other factors necessary for gene
transcription could differ among these species or even cell types. Thus, the use of non-species-
specific promoters can confound the analysis, and the lack of insulin or leptin transcriptional
effects using the rat or human promoter in the mouse hypothalamic cell lines does not
conclusively exclude transcriptional regulation of mouse proglucagon gene. Generation of mouse
proglucagon promoter plasmids is required to conduct further studies.
In the in vivo studies of this thesis, only male mice were used for the in vivo experiments.
Further experiments using female mice must be conducted to rule out any sex-specific effects of
GLP-1R and -2R activation. Also it must be taken into consideration that there can be species-
specific differences in the activation of hypothalamic neuropeptides (454). Furthermore, the
present results must be interpreted with caution as these data may not be relevant to endogenous
GLP-1 action due to the distinct mechanisms of receptor activation by endogenous GLP-1 and
exendin-4 (163, 369, 373). The same may be true for endogenous and long-acting GLP-2
activation of the hypothalamic neurons. Finally, it should be recognized that co-expression of
activated c-Fos, neuropeptide, and GLP-1R or -2R in the hypothalamus could not be detected
due to the limitations of current in vivo methods of detection, such as multi-label
141
immunohistochemistry and in situ hybridization techniques. Another important issue is that the
detection of neuronal activity by c-Fos-ir does not provide information on neuronal stimulation
or inhibition, therefore, more advanced techniques such as magnetic resonance imaging (455), or
light-activated channels should be considered (456). Finally, this research project focused only
on the action of GLP-1R and -2R agonists on the hypothalamic neurons, however, as the post-
translational processing of a single precursor polypeptide proglucagon generates several related
peptides, similar experiments must be conducted to investigate action of other PGDPs, such as
glucagon, oxyntomodulin and glicentin, that have been shown to regulate gastric acid secretion
and gut motility (205, 457-459).
To detect neuronal activation by Exendin-4 and GLP-2 in mouse hypothalamus, we
investigated c-Fos activation as an established marker of neuronal activation. After stimulation,
c-Fos expression reaches its highest level within 60-90 min post-stimulation and persists for
about 2-4 hours (460). Thus, there is a very narrow period for the detection of activated
hypothalamic regions and neurons by using c-Fos-immunoreactivity as an indicator of neuronal
activation. This was the main reason for us to isolate the brains within 2 hours post-treatment,
but not over a longer time period.
While studying GLP-2 action on the hypothalamic neuropeptides, treatments over a 24 h
time course were performed using the GLP-2R-expressing cell model, however, significant
changes in mRNA expression at early time points were not observed as anticipated based on the
in vivo findings. Notwithstanding, many studies have found that changes or turnover in
hypothalamic neuropeptide mRNA may not necessarily be rapid and can take place over a longer
period of time. For example, leptin decreases food intake within one hour, but induces
neuropeptide mRNA changes in the rat hypothalamus at 48 h post-treatment (43). Another study
found that in gonadotropin-releasing hormone (GnRH)-expressing hypothalamic GT1-7 cells,
12-O-tetradecanoylphorbol-13-acetate, an activator of PKC, induces c-Fos mRNA within 30
minutes, stimulates robust and rapid secretion of GnRH within 2.5 minutes, and produces
changes in GnRH mRNA only by 16 h (461). Thus, there is a possibility that neuropeptide
synthesis and secretion may be affected at early time points in vivo or in vitro by GLP-2 that
needs to be investigated further by using sensitive detection methods.
142
Only a few previous studies have examined the effects of GLP-1 and -2 in the brain, and
therefore, the main aim of the present study was to map the mouse hypothalamic regions and
neuropeptidergic neurons activated by the anorexigenic dose of the long-acting GLP-1 and -2R
agonists, and accordingly to study the changes in the neuropeptide mRNA levels over a period of
24 hours in vitro using an endogenous GLP-1R and -2R expressing hypothalamic neuronal cell
models. These both in vivo and in vitro models are independent of each other and therefore there
does not seem to be a clear connection between the in vivo and in vitro experiments, however,
there may not actually be descrepencies between the findings from these two models based on
the c-Fos activation detected in both experimental models. Overall, the present study establishes
novel hypothalamic neuronal cell models and these findings will enhance further investigation of
the physiologic role of GLP-1 and -2 in the hypothalamus or other regions of the brain involved
in feeding regulation using complimentary in vivo and in vitro models.
6.3 Future directions
The first study presented in this thesis determined that insulin and leptin utilize the
PI3K/Akt and JAK2/STAT3 pathways to regulate proglucagon mRNA expression. In the same
study, the human 5’ regulatory regions containing ~ 829 bp sequences were utilized, and as
previously discussed, this may have excluded insulin or leptin regulatory regions in the distal
promoter. Utilizing luciferase reporter constructs with a larger sequence, upwards of 5000 bp of
the human, rat and mouse proglucagon 5’regulatory regions, might allow us to uncover specific
DNA binding sequences, where transcription factors activated by insulin and leptin could bind.
As it was found that insulin and leptin regulate mRNA stability, the possible role of
miRNA and mRNA-binding proteins in altered turnover of proglucagon mRNA needs to be
investigated further. Using in silico analysis, it was found that there are binding sites for several
miRNAs and mRNA-binding proteins (Figure 13). Some of the miRNAs, such as miRNA128, a
brain-enriched microRNA, and miRNA494, have been already found to act as negative
regulators of gene expression at post-transcriptional level. miRNAs regulate either the
degradation of their specific target mRNAs or the inhibition of mRNA translation (355, 356). To
confirm the role of miRNAs in insulin- and leptin-mediated regulation of mRNA stability,
miRNAs that have binding sites on proglucagon mRNA transcript must be studied to dissect
143
their role in proglucagon mRNA turnover. To this aim, it must be investigated whether miRNAs
are expressed in the hypothalamic cell models, and if expressed, whether their expression is
modulated by insulin and leptin, and also whether changes in their expression can be associated
with alteration in proglucagon mRNA levels. For example, miRNA128 or miRNA494
expression must be measured following insulin and leptin treatment of hypothalamic neuronal
cells, and also the expression of the predicted target proglucagon mRNA must be evaluated, in
search of a possible inverse correlation with miR-128 or miRNA494 expression. Ectopic
overexpression and knockdown of miRNA128 or miRNA494 also need to be performed, in order
to unequivocally assign the observed proglucagon mRNA variations solely to miRNA128 or
miRNA494 expression in hypothalamic cell models. Similar to miRNA study, it is necessary to
determine whether RNA-binding proteins are expressed in the hypothalamic cell models.
Further, using overexpression and knockdown strategy, role of RNA-binding proteins, such as
ELAVL2 or QKI that have been found to regulate gene expression in the nervous system (361-
363), can be investigated in insulin- or leptin-mediated regulation of proglucagon mRNA
stability in the hypothalamic cell models.
This study has shown that insulin regulates proglucagon through a PI3K/Akt-dependent
pathway. Using Western blot analysis with antibodies specific to signaling proteins downstream
of Akt, further study to determine insulin-activated downstream factors, such as ELK-1, c-fos, c-
Myc and Ets, that could be involved in proglucagon gene regulation needs to be conducted. Next,
the role of these insulin-induced signaling molecules in proglucagon regulation can be
determined using specific inhibitors or siRNA technology. By chromatin immunoprecipitation or
electrophoretic mobility shift assay, further research is required to identify proglucagon gene
promoter cis-regulatory elements for binding of stimulatory or inhibitory transcription factors
activated by insulin and leptin. Similar experiments can be designed for the promoter analysis
and detection of transcription factors that may be involved in the regulation of neurotensin and
ghrelin gene expression by GLP-1R and GLP-2R activation.
In the in vivo studies of this thesis, it was found that exendin-4 and h(Gly2)GLP-2
significantly activated hypothalamic neurons, particularly neurotensin- and ghrelin-expressing
neurons that may serve as potential hypothalamic targets of their anorexigenic action in vivo. As
there are a significant number of reports of the effects of exendin-4 that are apparently not GLP-
144
1R-mediated (163, 369, 373), it would be important to demonstrate that the effects of exendin-4
detected in this thesis can be blocked by a GLP-1 receptor antagonist. To address this issue, an
experiment can be designed using exendin-9-39, a GLP-1R antagonist, in wild-type mice, or
using the GLP-1R knockout mice to demonstrate that the activation of hypothalamic neurons is
exclusively via GLP-1R. Similarly, using the GLP-2R antagonist GLP-2(3-33) in vivo, or using
knock-down strategy it could demonstrated that h(Gly2)GLP-2 activates hypothalamic neurons
selectively via GLP-2R. Further, specificity of GLP-2 action via GLP-2R can be examined in
GLP-1R knockout mice or using exendin-9-39 to block GLP-1R activity.
There are some gaps between the data generated from the in vivo and in vitro experiments
presented in this thesis. Therefore these experiments need to be clearly tied together to fill in the
gaps. Specifically, although this thesis has identified hypothalamic neurons, particularly
neurotensin- and ghrelin-expressing neurons as potential hypothalamic targets of central GLP-1R
or GLP-2R activation, it is still not clear whether activation of these neuropeptide-expressing
neurons leads to significant changes in the neuropeptide synthesis and release that may be
necessary for mediating the downstream anorexigenic action of GLPs. Particularly, it remains
unknown whether activation (stimulation) of neurotensin neurons or inactivation (inhibition) of
ghrelin neurons, and thereby a possible increase in neurotensin or a decrease in ghrelin synthesis
and release, play any role in mediating the action of GLPs on feeding. To address these issues in
vivo, it is necessary to initially measure neurotensin and ghrelin mRNA levels or peptide
concentrations in the hypothalamus and cerebrospinal fluid or plasma to study how these
neuropeptides are affected by GLP-1R or GLP-2R stimulation in the intact hypothalamus. To
further examine the relative role of neurotensin or ghrelin in mediating central GLP-1/2R action,
a follow up experiment can be designed to study the effects of a neurotensin antiserum (NT-AS)
(462), Ntsr antagonist (SR48692) (463), or using a ghrelin knockout mouse model on the satiety
action of GLP-1R or GLP-2R activation (464). These experiments will confirm the role of
neurotensin and ghrelin as the potential downstream mediators of anorexigenic effect of GLP-1R
or GLP-2R stimulation that will lead to better understanding of the mechanisms of appetite
regulation.
It is possible that the anorexigenic action of centrally administered GLP-1R or GLP-2R
agonists in mice will be due to increased synthesis or secretion of hypothalamic neurotensin
145
and/or decreased synthesis or secretion of ghrelin. It is also anticipated that
immunoneutralization by NT-AS (i.c.v.) or Ntsr antagonism by SR 48692 (intraperitoneal) will
block the anorexigenic effect of the central GLP-1R or GLP-2R activation on feeding in mice.
These findings will confirm that neurotensin is involved in mediating anorexigenic action of
GLP-R activation, and further suggest that this neuropeptide is an important component of the
neural appetite-regulating circuitry directly involving central PGDPs, GLP-1R and GLP-2R.
Ghrelin may be linked to GLP-1R or GLP-2R action through the use of the ghrelin knockout
mouse model. Importantly, knockout mice often have secondary confounding characteristics that
may interfere with physiological function. The mice proposed above already have a neuronal
phenotype (involved in thermoregulation and sleep, and thus may not be optimal to use for this
study). Therefore, establishing the direct link to ghrelin may be more difficult than neurotensin,
since ghrelin mRNA expression is decreased by exendin-4. A similar strategy can be utilized to
investigate NPY/AgRP or POMC to link these neuropeptides directly to the anorexigenic action
of exendin-4 or h(Gly2)GLP-2 using inhibitors or knock-down strategy. As this thesis has
established GLP-1R- and GLP-2R-expressing neuronal cell models, similar cost-effective
experiments to quantify neuropeptide synthesis or secretion can be performed in vitro using the
hypothalamic cell models for which it is necessary to develop and establish ultra-sensitive
neuropeptide detection methods.
Since detection of c-Fos-ir is not well suited to investigate neuronal inhibition,
application of advanced techniques such as magnetic resonance imaging for direct and fast
detection of neuronal activation in the mouse brain (455), or more advanced techniques, such as
light-activated channels for studying brain function and circuitry, should be considered (456).
Together, these future experiments will confirm the downstream mediators of anorexigenic
action of central GLP-1R and GLP-2R activation. Understanding the mechanism of action of
PGDPs in the hypothalamus is important not only due to the use of long-acting GLP-1R and
GLP-2R agonists, and agents that prevent PGDP degradation as therapies for disease, but also to
more accurately target prevention and treatment strategies for obesity and ultimately prevent its
complications, such as type 2 diabetes.

146
Chapter 7
References

147
1. WHO 2012 World Health Statistics: A snapshot of global health. In: World Health
Organization
2. Haslam DW, James WP 2005 Obesity. Lancet 366:1197-1209
3. Freedman DM, Ron E, Ballard-Barbash R, Doody MM, Linet MS 2006 Body mass
index and all-cause mortality in a nationwide US cohort. Int J Obes (Lond) 30:822-829
4. Barsh GS, Farooqi IS, O'Rahilly S 2000 Genetics of body-weight regulation. Nature
404:644-651
5. Comuzzie AG 2002 The emerging pattern of the genetic contribution to human obesity.
Best Pract Res Clin Endocrinol Metab 16:611-621
6. Ahima RS, Osei SY 2001 Molecular regulation of eating behavior: new insights and
prospects for therapeutic strategies. Trends Mol Med 7:205-213
7. Drucker DJ 2002 Biological actions and therapeutic potential of the glucagon-like
peptides. Gastroenterology 122:531-544
8. Gelling RW, Morton GJ, Morrison CD, Niswender KD, Myers MG, Jr., Rhodes CJ,
Schwartz MW 2006 Insulin action in the brain contributes to glucose lowering during
insulin treatment of diabetes. Cell Metab 3:67-73
9. Morton GJ, Cummings DE, Baskin DG, Barsh GS, Schwartz MW 2006 Central
nervous system control of food intake and body weight. Nature 443:289-295
10. Schwartz MW, Woods SC, Porte D, Jr., Seeley RJ, Baskin DG 2000 Central nervous
system control of food intake. Nature 404:661-671
11. Woods SC, Lotter EC, McKay LD, Porte D, Jr. 1979 Chronic intracerebroventricular
infusion of insulin reduces food intake and body weight of baboons. Nature 282:503-505
12. Bruning JC, Gautam D, Burks DJ, Gillette J, Schubert M, Orban PC, Klein R,
Krone W, Muller-Wieland D, Kahn CR 2000 Role of brain insulin receptor in control
of body weight and reproduction. Science 289:2122-2125
13. Taguchi A, Wartschow LM, White MF 2007 Brain IRS2 signaling coordinates life
span and nutrient homeostasis. Science 317:369-372
14. Koch L, Wunderlich FT, Seibler J, Konner AC, Hampel B, Irlenbusch S, Brabant
G, Kahn CR, Schwenk F, Bruning JC 2008 Central insulin action regulates peripheral
glucose and fat metabolism in mice. J Clin Invest 118:2132-2147
15. Elmquist JK, Ahima RS, Elias CF, Flier JS, Saper CB 1998 Leptin activates distinct
projections from the dorsomedial and ventromedial hypothalamic nuclei. Proc Natl Acad
Sci U S A 95:741-746

148
16. Vaisse C, Halaas JL, Horvath CM, Darnell JE, Jr., Stoffel M, Friedman JM 1996
Leptin activation of Stat3 in the hypothalamus of wild-type and ob/ob mice but not db/db
mice. Nat Genet 14:95-97
17. Zhang Y, Proenca R, Maffei M, Barone M, Leopold L, Friedman JM 1994 Positional
cloning of the mouse obese gene and its human homologue. Nature 372:425-432
18. Belsham DD, Cai F, Cui H, Smukler SR, Salapatek AM, Shkreta L 2004 Generation
of a phenotypic array of hypothalamic neuronal cell models to study complex
neuroendocrine disorders. Endocrinology 145:393-400
19. Belsham DD, Fick LJ, Dalvi PS, Centeno ML, Chalmers JA, Lee PK, Wang Y,
Drucker DJ, Koletar MM 2009 Ciliary neurotrophic factor recruitment of glucagon-like
peptide-1 mediates neurogenesis, allowing immortalization of adult murine hypothalamic
neurons. Faseb J 23:4256-4265
20. Elmquist JK, Marcus JN 2003 Rethinking the central causes of diabetes. Nat Med
9:645-647
21. Woods SC, D'Alessio DA 2008 Central control of body weight and appetite. J Clin
Endocrinol Metab 93:S37-50
22. Kopelman PG 2000 Obesity as a medical problem. Nature 404:635-643
23. Nieuwenhuys R, Voogd J, Huijzen Cv 2008 The human central nervous system. 4th ed.
Berlin ; New York: Springer
24. Bernardis LL, Bellinger LL 1996 The lateral hypothalamic area revisited: ingestive
behavior. Neurosci Biobehav Rev 20:189-287
25. Gao Q, Horvath TL 2008 Neuronal control of energy homeostasis. FEBS Lett 582:132-
141
26. Turton MD, O'Shea D, Gunn I, Beak SA, Edwards CM, Meeran K, Choi SJ, Taylor
GM, Heath MM, Lambert PD, Wilding JP, Smith DM, Ghatei MA, Herbert J,
Bloom SR 1996 A role for glucagon-like peptide-1 in the central regulation of feeding.
Nature 379:69-72
27. Tang-Christensen M, Larsen PJ, Goke R, Fink-Jensen A, Jessop DS, Moller M,
Sheikh SP 1996 Central administration of GLP-1-(7-36) amide inhibits food and water
intake in rats. Am J Physiol 271:R848-856
28. Donahey JCK, van Dijk G, Woods SC, Seeley RJ 1998 Intraventricular GLP-1 reduces
short- but not long-term food intake or body weight in lean and obese rats. Brain
Research 779:75-83
29. Brightman MW, Broadwell RD 1976 The morphological approach to the study of
normal and abnormal brain permeability. Adv Exp Med Biol 69:41-54

149
30. Lindner D, Stichel J, Beck-Sickinger AG 2008 Molecular recognition of the NPY
hormone family by their receptors. Nutrition 24:907-917
31. Bagnol D, Lu XY, Kaelin CB, Day HE, Ollmann M, Gantz I, Akil H, Barsh GS,
Watson SJ 1999 Anatomy of an endogenous antagonist: relationship between Agouti-
related protein and proopiomelanocortin in brain. J Neurosci 19:RC26
32. Broberger C, Johansen J, Johansson C, Schalling M, Hokfelt T 1998 The
neuropeptide Y/agouti gene-related protein (AGRP) brain circuitry in normal, anorectic,
and monosodium glutamate-treated mice. Proc Natl Acad Sci U S A 95:15043-15048
33. Ollmann MM, Wilson BD, Yang YK, Kerns JA, Chen Y, Gantz I, Barsh GS 1997
Antagonism of central melanocortin receptors in vitro and in vivo by agouti-related
protein. Science 278:135-138
34. Gee CE, Chen CL, Roberts JL, Thompson R, Watson SJ 1983 Identification of
proopiomelanocortin neurones in rat hypothalamus by in situ cDNA-mRNA
hybridization. Nature 306:374-376
35. Mizuno TM, Kleopoulos SP, Bergen HT, Roberts JL, Priest CA, Mobbs CV 1998
Hypothalamic pro-opiomelanocortin mRNA is reduced by fasting in ob/ob and db/db
mice, but is stimulated by leptin. Diabetes 47:294-297
36. Schwartz MW, Seeley RJ, Woods SC, Weigle DS, Campfield LA, Burn P, Baskin
DG 1997 Leptin increases hypothalamic pro-opiomelanocortin mRNA expression in the
rostral arcuate nucleus. Diabetes 46:2119-2123
37. Thornton JE, Cheung CC, Clifton DK, Steiner RA 1997 Regulation of hypothalamic
proopiomelanocortin mRNA by leptin in ob/ob mice. Endocrinology 138:5063-5066
38. Coll AP, Farooqi IS, Challis BG, Yeo GS, O'Rahilly S 2004 Proopiomelanocortin and
energy balance: insights from human and murine genetics. J Clin Endocrinol Metab
89:2557-2562
39. Elmquist JK, Elias CF, Saper CB 1999 From lesions to leptin: hypothalamic control of
food intake and body weight. Neuron 22:221-232
40. Sawchenko PE 1998 Toward a new neurobiology of energy balance, appetite, and
obesity: the anatomists weigh in. J Comp Neurol 402:435-441
41. Kristensen P, Judge ME, Thim L, Ribel U, Christjansen KN, Wulff BS, Clausen JT,
Jensen PB, Madsen OD, Vrang N, Larsen PJ, Hastrup S 1998 Hypothalamic CART is
a new anorectic peptide regulated by leptin. Nature 393:72-76
42. van Houten M, Posner BI, Kopriwa BM, Brawer JR 1979 Insulin-binding sites in the
rat brain: in vivo localization to the circumventricular organs by quantitative
radioautography. Endocrinology 105:666-673

150
43. Schwartz MW, Seeley RJ, Campfield LA, Burn P, Baskin DG 1996 Identification of
targets of leptin action in rat hypothalamus. J Clin Invest 98:1101-1106
44. Gao Q, Wolfgang MJ, Neschen S, Morino K, Horvath TL, Shulman GI, Fu XY 2004
Disruption of neural signal transducer and activator of transcription 3 causes obesity,
diabetes, infertility, and thermal dysregulation. Proc Natl Acad Sci U S A 101:4661-4666
45. Kitamura T, Feng Y, Kitamura YI, Chua SC, Jr., Xu AW, Barsh GS, Rossetti L,
Accili D 2006 Forkhead protein FoxO1 mediates Agrp-dependent effects of leptin on
food intake. Nat Med 12:534-540
46. Belgardt BF, Husch A, Rother E, Ernst MB, Wunderlich FT, Hampel B, Klockener
T, Alessi D, Kloppenburg P, Bruning JC 2008 PDK1 deficiency in POMC-expressing
cells reveals FOXO1-dependent and -independent pathways in control of energy
homeostasis and stress response. Cell Metab 7:291-301
47. Bouret SG, Draper SJ, Simerly RB 2004 Formation of projection pathways from the
arcuate nucleus of the hypothalamus to hypothalamic regions implicated in the neural
control of feeding behavior in mice. J Neurosci 24:2797-2805
48. Sawchenko PE, Swanson LW 1983 The organization of forebrain afferents to the
paraventricular and supraoptic nuclei of the rat. J Comp Neurol 218:121-144
49. Swanson LW, Sawchenko PE 1983 Hypothalamic integration: organization of the
paraventricular and supraoptic nuclei. Annu Rev Neurosci 6:269-324
50. Guilleman R, Rosenberg, B. 1955 Humoral hypothalamic control of anterior pituitary: a
study with combined tissue cultures. Endocrinology 57:599-607
51. Saffran M, Schally, A.V. 1955 The release of corticotropin by anterior pituitary tissue in
vitro. Can J Biochem Physiol 33:408-415
52. Swanson LW 1986 Organization of mammalian neuroendocrine system. In: Bloom F ed.
Handbook of Physiology - The Nervous System. Baltimore: Waverly Press; 317-363
53. Hillebrand JJ, de Wied D, Adan RA 2002 Neuropeptides, food intake and body weight
regulation: a hypothalamic focus. Peptides 23:2283-2306
54. Leibowitz SF, Wortley KE 2004 Hypothalamic control of energy balance: different
peptides, different functions. Peptides 25:473-504
55. Olszewski PK, Levine AS 2004 Minireview: Characterization of influence of central
nociceptin/orphanin FQ on consummatory behavior. Endocrinology 145:2627-2632
56. Kahn D, Abrams GM, Zimmerman EA, Carraway R, Leeman SE 1980 Neurotensin
Neurons in the Rat Hypothalamus: An Immunocytochemical Study. Endocrinology
107:47-54

151
57. Wynne K, Stanley S, McGowan B, Bloom S 2005 Appetite control. J Endocrinol
184:291-318
58. Satoh N, Ogawa Y, Katsuura G, Hayase M, Tsuji T, Imagawa K, Yoshimasa Y,
Nishi S, Hosoda K, Nakao K 1997 The arcuate nucleus as a primary site of satiety effect
of leptin in rats. Neurosci Lett 224:149-152
59. Monnikes H, Heymann-Monnikes I, Tache Y 1992 CRF in the paraventricular nucleus
of the hypothalamus induces dose-related behavioral profile in rats. Brain Res 574:70-76
60. Legradi G, Lechan RM 1999 Agouti-Related Protein Containing Nerve Terminals
Innervate Thyrotropin-Releasing Hormone Neurons in the Hypothalamic Paraventricular
Nucleus. Endocrinology 140:3643-3652
61. Fekete C, Legradi G, Mihaly E, Huang Q-H, Tatro JB, Rand WM, Emerson CH,
Lechan RM 2000 alpha -Melanocyte-Stimulating Hormone Is Contained in Nerve
Terminals Innervating Thyrotropin-Releasing Hormone-Synthesizing Neurons in the
Hypothalamic Paraventricular Nucleus and Prevents Fasting-Induced Suppression of
Prothyrotropin-Releasing Hormone Gene Expression. J Neurosci 20:1550-1558
62. Fekete C, Sarkar S, Rand WM, Harney JW, Emerson CH, Bianco AC, Lechan RM
2002 Agouti-Related Protein (AGRP) Has a Central Inhibitory Action on the
Hypothalamic-Pituitary-Thyroid (HPT) Axis; Comparisons between the Effect of AGRP
and Neuropeptide Y on Energy Homeostasis and the HPT Axis. Endocrinology
143:3846-3853
63. Neary NM, Goldstone AP, Bloom SR 2004 Appetite regulation: from the gut to the
hypothalamus. Clin Endocrinol (Oxf) 60:153-160
64. Everitt BJ 1989 The coexistence of neuropeptide Y with other peptides and amines in
the central nervous system. In: Mutt V, Fuxe, K., Hokfelt, T., Lundberg, J. ed.
Neuropeptide Y. New York: Raven Press; 61-72
65. Finley JC, Lindstrom P, Petrusz P 1981 Immunocytochemical localization of beta-
endorphin-containing neurons in the rat brain. Neuroendocrinology 33:28-42
66. Khachaturian H, Lewis, M., E., Martin Schäfer M.,K.,H., Watson, S.,J. 1985
Anatomy of the CNS opioid systems. Trends in Neurosciences 8:111-119
67. Koylu EO, Couceyro PR, Lambert PD, Ling NC, DeSouza EB, Kuhar MJ 1997
Immunohistochemical localization of novel CART peptides in rat hypothalamus, pituitary
and adrenal gland. J Neuroendocrinol 9:823-833
68. Brobeck JR 1946 Mechanism of the development of obesity in animals with
hypothalamic lesions. Physiol Rev 26:541-559
69. Anand BK, Brobeck JR 1951 Hypothalamic control of food intake in rats and cats. Yale
J Biol Med 24:123-140

152
70. Powley TL, Opsahl, C.,H., Cox, J.,E., Weingarten, H.,P. 1980 The role of the
hypothalamus in energy homeostasis. In: Morgane PJ, Panksepp, J. ed. Handbook of the
Hypothalamus Part A: Behavioral Studies of the Hypothalamus. New York: Marcel
Dekker, Inc.; 211-298
71. Matsuda M, Liu Y, Mahankali S, Pu Y, Mahankali A, Wang J, DeFronzo RA, Fox
PT, Gao JH 1999 Altered hypothalamic function in response to glucose ingestion in
obese humans. Diabetes 48:1801-1806
72. Simpson KA, Martin NM, R. Bloom S 2009 Hypothalamic regulation of food intake
and clinical therapeutic applications. Arquivos Brasileiros de Endocrinologia &
Metabologia 53:120-128
73. Pelleymounter MA, Cullen MJ, Wellman CL 1995 Characteristics of BDNF-induced
weight loss. Experimental Neurology 131:229-238
74. Xu B, Goulding EH, Zang K, Cepoi D, Cone RD, Jones KR, Tecott LH, Reichardt
LF 2003 Brain-derived neurotrophic factor regulates energy balance downstream of
melanocortin-4 receptor. 6:736-742
75. Satoh N, Ogawa Y, Katsuura G, Tsuji T, Masuzaki H, Hiraoka J, Okazaki T,
Tamaki M, Hayase M, Yoshimasa Y, Nishi S, Hosoda K, Nakao K 1997
Pathophysiological significance of the obese gene product, leptin, in ventromedial
hypothalamus (VMH)-lesioned rats: evidence for loss of its satiety effect in VMH-
lesioned rats. Endocrinology 138:947-954
76. Jacobowitz DM, O'Donohue TL 1978 alpha-Melanocyte stimulating hormone:
immunohistochemical identification and mapping in neurons of rat brain. Proceedings of
the National Academy of Sciences of the United States of America 75:6300-6304
77. Kalra SP, Dube MG, Pu S, Xu B, Horvath TL, Kalra PS 1999 Interacting appetite-
regulating pathways in the hypothalamic regulation of body weight. Endocr Rev 20:68-
100
78. Bernardis LL, Bellinger LL 1987 The dorsomedial hypothalamic nucleus revisited:
1986 update. Brain Res 434:321-381
79. Elmquist JK, Ahima RS, Maratos-Flier E, Flier JS, Saper CB 1997 Leptin Activates
Neurons in Ventrobasal Hypothalamus and Brainstem. Endocrinology 138:839-842
80. Yokosuka M, Xu B, Pu S, Kalra PS, Kalra SP 1998 Neural substrates for leptin and
neuropeptide Y (NPY) interaction: hypothalamic sites associated with inhibition of NPY-
induced food intake. Physiology & Behavior 64:331-338
81. Kamegai J, Minami S, Sugihara H, Hasegawa O, Higuchi H, Wakabayashi I 1996
Growth hormone receptor gene is expressed in neuropeptide Y neurons in hypothalamic
arcuate nucleus of rats. Endocrinology 137:2109-2112
153
82. Chan Y, Steiner R, Clifton D 1996 Regulation of hypothalamic neuropeptide-Y neurons
by growth hormone in the rat. Endocrinology 137:1319-1325
83. Guan XM, Yu H, Trumbauer M, Frazier E, Van der Ploeg LH, Chen H 1998
Induction of neuropeptide Y expression in dorsomedial hypothalamus of diet-induced
obese mice. Neuroreport 9:3415-3419
84. Kesterson RA, Huszar D, Lynch CA, Simerly RB, Cone RD 1997 Induction of
Neuropeptide Y Gene Expression in the Dorsal Medial Hypothalamic Nucleus in Two
Models of the Agouti Obesity Syndrome. Mol Endocrinol 11:630-637
85. Li C, Chen P, Smith MS 1998 Neuropeptide Y (NPY) neurons in the arcuate nucleus
(ARH) and dorsomedial nucleus (DMH), areas activated during lactation, project to the
paraventricular nucleus of the hypothalamus (PVH). Regul Pept 75-76:93-100
86. de Lecea L, Kilduff TS, Peyron C, Gao X-B, Foye PE, Danielson PE, Fukuhara C,
Battenberg ELF, Gautvik VT, Bartlett FS, Frankel WN, van den Pol AN, Bloom FE,
Gautvik KM, Sutcliffe JG 1998 The hypocretins: Hypothalamus-specific peptides with
neuroexcitatory activity. Proceedings of the National Academy of Sciences of the United
States of America 95:322-327
87. Sakurai T, Amemiya A, Ishii M, Matsuzaki I, Chemelli RM, Tanaka H, Williams
SC, Richarson JA, Kozlowski GP, Wilson S, Arch JR, Buckingham RE, Haynes AC,
Carr SA, Annan RS, McNulty DE, Liu WS, Terrett JA, Elshourbagy NA, Bergsma
DJ, Yanagisawa M 1998 Orexins and orexin receptors: a family of hypothalamic
neuropeptides and G protein-coupled receptors that regulate feeding behavior. Cell 92:1
page following 696
88. Bittencourt JC, Presse F, Arias C, Peto C, Vaughan J, Nahon JL, Vale W,
Sawchenko PE 1992 The melanin-concentrating hormone system of the rat brain: an
immuno- and hybridization histochemical characterization. J Comp Neurol 319:218-245
89. Peyron C, Tighe DK, van den Pol AN, de Lecea L, Heller HC, Sutcliffe JG, Kilduff
TS 1998 Neurons Containing Hypocretin (Orexin) Project to Multiple Neuronal Systems.
J Neurosci 18:9996-10015
90. Chronwall BM, DiMaggio DA, Massari VJ, Pickel VM, Ruggiero DA, O'Donohue
TL 1985 The anatomy of neuropeptide-Y-containing neurons in rat brain. Neuroscience
15:1159-1181
91. Bai FL, Yamano M, Shiotani Y, Emson PC, Smith AD, Powell JF, Tohyama M 1985
An arcuato-paraventricular and -dorsomedial hypothalamic neuropeptide Y-containing
system which lacks noradrenaline in the rat. Brain Res 331:172-175
92. Herzog H, Hort YJ, Ball HJ, Hayes G, Shine J, Selbie LA 1992 Cloned human
neuropeptide Y receptor couples to two different second messenger systems. Proc Natl
Acad Sci U S A 89:5794-5798
154
93. Blomqvist AG, Herzog H 1997 Y-receptor subtypes--how many more? Trends Neurosci
20:294-298
94. Gehlert DR 1999 Role of hypothalamic neuropeptide Y in feeding and obesity.
Neuropeptides 33:329-338
95. Pesonen U, Huupponen R, Rouru J, Koulu M 1992 Hypothalamic neuropeptide
expression after food restriction in Zucker rats: evidence of persistent neuropeptide Y
gene activation. Brain Res Mol Brain Res 16:255-260
96. Malabu UH, McCarthy HD, McKibbin PE, Williams G 1992 Peripheral insulin
administration attenuates the increase in neuropeptide Y concentrations in the
hypothalamic arcuate nucleus of fasted rats. Peptides 13:1097-1102
97. Mizuno TM, Makimura H, Silverstein J, Roberts JL, Lopingco T, Mobbs CV 1999
Fasting regulates hypothalamic neuropeptide Y, agouti-related peptide, and
proopiomelanocortin in diabetic mice independent of changes in leptin or insulin.
Endocrinology 140:4551-4557
98. Beck B, Burlet A, Nicolas JP, Burlet C 1992 Unexpected regulation of hypothalamic
neuropeptide Y by food deprivation and refeeding in the Zucker rat. Life Sci 50:923-930
99. Brady LS, Smith MA, Gold PW, Herkenham M 1990 Altered expression of
hypothalamic neuropeptide mRNAs in food-restricted and food-deprived rats.
Neuroendocrinology 52:441-447
100. Sahu A, Sninsky CA, Phelps CP, Dube MG, Kalra PS, Kalra SP 1992 Neuropeptide
Y release from the paraventricular nucleus increases in association with hyperphagia in
streptozotocin-induced diabetic rats. Endocrinology 131:2979-2985
101. Kalra SP, Dube MG, Sahu A, Phelps CP, Kalra PS 1991 Neuropeptide Y secretion
increases in the paraventricular nucleus in association with increased appetite for food.
Proc Natl Acad Sci U S A 88:10931-10935
102. Jang M, Romsos DR 1998 Neuropeptide Y and corticotropin-releasing hormone
concentrations within specific hypothalamic regions of lean but not ob/ob mice respond
to food-deprivation and refeeding. J Nutr 128:2520-2525
103. Kalra SP, Kalra PS 2003 Neuropeptide Y: a physiological orexigen modulated by the
feedback action of ghrelin and leptin. Endocrine 22:49-56
104. Wang J, Leibowitz KL 1997 Central insulin inhibits hypothalamic galanin and
neuropeptide Y gene expression and peptide release in intact rats. Brain Res 777:231-236
105. Cowley MA, Smith RG, Diano S, Tschop M, Pronchuk N, Grove KL, Strasburger
CJ, Bidlingmaier M, Esterman M, Heiman ML, Garcia-Segura LM, Nillni EA,
Mendez P, Low MJ, Sotonyi P, Friedman JM, Liu H, Pinto S, Colmers WF, Cone
RD, Horvath TL 2003 The distribution and mechanism of action of ghrelin in the CNS

155
demonstrates a novel hypothalamic circuit regulating energy homeostasis. Neuron
37:649-661
106. Muroya S, Yada T, Shioda S, Takigawa M 1999 Glucose-sensitive neurons in the rat
arcuate nucleus contain neuropeptide Y. Neurosci Lett 264:113-116
107. Kohno D, Gao HZ, Muroya S, Kikuyama S, Yada T 2003 Ghrelin directly interacts
with neuropeptide-Y-containing neurons in the rat arcuate nucleus: Ca2+ signaling via
protein kinase A and N-type channel-dependent mechanisms and cross-talk with leptin
and orexin. Diabetes 52:948-956
108. Ceccatelli S, Cintra A, Hokfelt T, Fuxe K, Wikstrom AC, Gustafsson JA 1989
Coexistence of glucocorticoid receptor-like immunoreactivity with neuropeptides in the
hypothalamic paraventricular nucleus. Exp Brain Res 78:33-42
109. Larsen PJ, Jessop DS, Chowdrey HS, Lightman SL, Mikkelsen JD 1994 Chronic
administration of glucocorticoids directly upregulates prepro-neuropeptide Y and Y1-
receptor mRNA levels in the arcuate nucleus of the rat. J Neuroendocrinol 6:153-159
110. Sanacora G, Kershaw M, Finkelstein JA, White JD 1990 Increased hypothalamic
content of preproneuropeptide Y messenger ribonucleic acid in genetically obese Zucker
rats and its regulation by food deprivation. Endocrinology 127:730-737
111. Wilding JP, Gilbey SG, Bailey CJ, Batt RA, Williams G, Ghatei MA, Bloom SR
1993 Increased neuropeptide-Y messenger ribonucleic acid (mRNA) and decreased
neurotensin mRNA in the hypothalamus of the obese (ob/ob) mouse. Endocrinology
132:1939-1944
112. Luquet S, Perez FA, Hnasko TS, Palmiter RD 2005 NPY/AgRP neurons are essential
for feeding in adult mice but can be ablated in neonates. Science 310:683-685
113. Bewick GA, Gardiner JV, Dhillo WS, Kent AS, White NE, Webster Z, Ghatei MA,
Bloom SR 2005 Post-embryonic ablation of AgRP neurons in mice leads to a lean,
hypophagic phenotype. Faseb J 19:1680-1682
114. Clark JT, Kalra PS, Crowley WR, Kalra SP 1984 Neuropeptide Y and human
pancreatic polypeptide stimulate feeding behavior in rats. Endocrinology 115:427-429
115. Erickson JC, Clegg KE, Palmiter RD 1996 Sensitivity to leptin and susceptibility to
seizures of mice lacking neuropeptide Y. Nature 381:415-421
116. Erickson JC, Hollopeter G, Palmiter RD 1996 Attenuation of the obesity syndrome of
ob/ob mice by the loss of neuropeptide Y. Science 274:1704-1707
117. Coll AP, Loraine Tung YC 2009 Pro-opiomelanocortin (POMC)-derived peptides and
the regulation of energy homeostasis. Mol Cell Endocrinol 300:147-151

156
118. Ellacott KL, Cone RD 2004 The central melanocortin system and the integration of
short- and long-term regulators of energy homeostasis. Recent Prog Horm Res 59:395-
408
119. Krude H, Gruters A 2000 Implications of proopiomelanocortin (POMC) mutations in
humans: the POMC deficiency syndrome. Trends Endocrinol Metab 11:15-22
120. Krude H, Biebermann H, Luck W, Horn R, Brabant G, Gruters A 1998 Severe
early-onset obesity, adrenal insufficiency and red hair pigmentation caused by POMC
mutations in humans. Nat Genet 19:155-157
121. Krude H, Biebermann H, Schnabel D, Tansek MZ, Theunissen P, Mullis PE,
Gruters A 2003 Obesity due to proopiomelanocortin deficiency: three new cases and
treatment trials with thyroid hormone and ACTH4-10. J Clin Endocrinol Metab 88:4633-
4640
122. Yaswen L, Diehl N, Brennan MB, Hochgeschwender U 1999 Obesity in the mouse
model of pro-opiomelanocortin deficiency responds to peripheral melanocortin. Nat Med
5:1066-1070
123. Kishi T, Aschkenasi CJ, Lee CE, Mountjoy KG, Saper CB, Elmquist JK 2003
Expression of melanocortin 4 receptor mRNA in the central nervous system of the rat. J
Comp Neurol 457:213-235
124. Cone RD 2006 Studies on the physiological functions of the melanocortin system.
Endocr Rev 27:736-749
125. Tung YC, Piper SJ, Yeung D, O'Rahilly S, Coll AP 2006 A comparative study of the
central effects of specific proopiomelancortin (POMC)-derived melanocortin peptides on
food intake and body weight in pomc null mice. Endocrinology 147:5940-5947
126. Benoit SC, Schwartz MW, Lachey JL, Hagan MM, Rushing PA, Blake KA, Yagaloff
KA, Kurylko G, Franco L, Danhoo W, Seeley RJ 2000 A novel selective
melanocortin-4 receptor agonist reduces food intake in rats and mice without producing
aversive consequences. J Neurosci 20:3442-3448
127. Huszar D, Lynch CA, Fairchild-Huntress V, Dunmore JH, Fang Q, Berkemeier LR,
Gu W, Kesterson RA, Boston BA, Cone RD, Smith FJ, Campfield LA, Burn P, Lee
F 1997 Targeted disruption of the melanocortin-4 receptor results in obesity in mice. Cell
88:131-141
128. Yeo GS, Farooqi IS, Aminian S, Halsall DJ, Stanhope RG, O'Rahilly S 1998 A
frameshift mutation in MC4R associated with dominantly inherited human obesity. Nat
Genet 20:111-112
129. Farooqi IS, Keogh JM, Yeo GS, Lank EJ, Cheetham T, O'Rahilly S 2003 Clinical
spectrum of obesity and mutations in the melanocortin 4 receptor gene. N Engl J Med
348:1085-1095

157
130. Tao YX 2010 The melanocortin-4 receptor: physiology, pharmacology, and
pathophysiology. Endocr Rev 31:506-543
131. Sandoval DA, Bagnol D, Woods SC, D'Alessio DA, Seeley RJ 2008 Arcuate glucagon-
like peptide 1 receptors regulate glucose homeostasis but not food intake. Diabetes
57:2046-2054
132. Levine AS, Kneip J, Grace M, Morley JE 1983 Effect of centrally administered
neurotensin on multiple feeding paradigms. Pharmacol Biochem Behav 18:19-23
133. Luttinger D, King RA, Sheppard D, Strupp J, Nemeroff CB, Prange AJ, Jr. 1982
The effect of neurotensin on food consumption in the rat. Eur J Pharmacol 81:499-503
134. Dobner PR 2005 Multitasking with neurotensin in the central nervous system. Cell Mol
Life Sci 62:1946-1963
135. Alexander MJ, Leeman SE 1998 Widespread expression in adult rat forebrain of
mRNA encoding high-affinity neurotensin receptor. J Comp Neurol 402:475-500
136. Fassio A, Evans G, Grisshammer R, Bolam JP, Mimmack M, Emson PC 2000
Distribution of the neurotensin receptor NTS1 in the rat CNS studied using an amino-
terminal directed antibody. Neuropharmacology 39:1430-1442
137. Mazella J, Botto JM, Guillemare E, Coppola T, Sarret P, Vincent JP 1996 Structure,
functional expression, and cerebral localization of the levocabastine-sensitive
neurotensin/neuromedin N receptor from mouse brain. J Neurosci 16:5613-5620
138. Nicot A, Rostene W, Berod A 1994 Neurotensin receptor expression in the rat forebrain
and midbrain: a combined analysis by in situ hybridization and receptor autoradiography.
J Comp Neurol 341:407-419
139. Remaury A, Vita N, Gendreau S, Jung M, Arnone M, Poncelet M, Culouscou JM,
Le Fur G, Soubrie P, Caput D, Shire D, Kopf M, Ferrara P 2002 Targeted
inactivation of the neurotensin type 1 receptor reveals its role in body temperature control
and feeding behavior but not in analgesia. Brain Res 953:63-72
140. Ahima RS, Lazar MA 2008 Adipokines and the peripheral and neural control of energy
balance. Mol Endocrinol 22:1023-1031
141. Cui H, Cai F, Belsham DD 2005 Anorexigenic hormones leptin, insulin, and alpha-
melanocyte-stimulating hormone directly induce neurotensin (NT) gene expression in
novel NT-expressing cell models. J Neurosci 25:9497-9506
142. Kim ER, Leckstrom A, Mizuno TM 2008 Impaired anorectic effect of leptin in
neurotensin receptor 1-deficient mice. Behav Brain Res 194:66-71
143. Sahu A, Carraway RE, Wang YP 2001 Evidence that neurotensin mediates the central
effect of leptin on food intake in rat. Brain Res 888:343-347
158
144. Nowak A, Bojanowska E 2008 Effects of peripheral or central GLP-1 receptor blockade
on leptin-induced suppression of appetite. J Physiol Pharmacol 59:501-510
145. Young AA, Gedulin BR, Bhavsar S, Bodkin N, Jodka C, Hansen B, Denaro M 1999
Glucose-lowering and insulin-sensitizing actions of exendin-4: studies in obese diabetic
(ob/ob, db/db) mice, diabetic fatty Zucker rats, and diabetic rhesus monkeys (Macaca
mulatta). Diabetes 48:1026-1034
146. Gutierrez JA, Solenberg PJ, Perkins DR, Willency JA, Knierman MD, Jin Z,
Witcher DR, Luo S, Onyia JE, Hale JE 2008 Ghrelin octanoylation mediated by an
orphan lipid transferase. Proc Natl Acad Sci U S A 105:6320-6325
147. Yang J, Brown MS, Liang G, Grishin NV, Goldstein JL 2008 Identification of the
acyltransferase that octanoylates ghrelin, an appetite-stimulating peptide hormone. Cell
132:387-396
148. Kojima M, Hosoda H, Date Y, Nakazato M, Matsuo H, Kangawa K 1999 Ghrelin is a
growth-hormone-releasing acylated peptide from stomach. Nature 402:656-660
149. Zhang JV, Ren PG, Avsian-Kretchmer O, Luo CW, Rauch R, Klein C, Hsueh AJ
2005 Obestatin, a peptide encoded by the ghrelin gene, opposes ghrelin's effects on food
intake. Science 310:996-999
150. Nogueiras R, Pfluger P, Tovar S, Arnold M, Mitchell S, Morris A, Perez-Tilve D,
Vazquez MJ, Wiedmer P, Castaneda TR, DiMarchi R, Tschop M, Schurmann A,
Joost HG, Williams LM, Langhans W, Dieguez C 2007 Effects of obestatin on energy
balance and growth hormone secretion in rodents. Endocrinology 148:21-26
151. Holst B, Egerod KL, Schild E, Vickers SP, Cheetham S, Gerlach LO, Storjohann L,
Stidsen CE, Jones R, Beck-Sickinger AG, Schwartz TW 2007 GPR39 signaling is
stimulated by zinc ions but not by obestatin. Endocrinology 148:13-20
152. Nakazato M, Murakami N, Date Y, Kojima M, Matsuo H, Kangawa K, Matsukura
S 2001 A role for ghrelin in the central regulation of feeding. Nature 409:194-198
153. Wren AM, Small CJ, Ward HL, Murphy KG, Dakin CL, Taheri S, Kennedy AR,
Roberts GH, Morgan DG, Ghatei MA, Bloom SR 2000 The novel hypothalamic
peptide ghrelin stimulates food intake and growth hormone secretion. Endocrinology
141:4325-4328
154. Tschop M, Smiley DL, Heiman ML 2000 Ghrelin induces adiposity in rodents. Nature
407:908-913
155. Murakami N, Hayashida T, Kuroiwa T, Nakahara K, Ida T, Mondal MS, Nakazato
M, Kojima M, Kangawa K 2002 Role for central ghrelin in food intake and secretion
profile of stomach ghrelin in rats. J Endocrinol 174:283-288
159
156. Guan JL, Wang QP, Kageyama H, Takenoya F, Kita T, Matsuoka T, Funahashi H,
Shioda S 2003 Synaptic interactions between ghrelin- and neuropeptide Y-containing
neurons in the rat arcuate nucleus. Peptides 24:1921-1928
157. Sun Y, Ahmed S, Smith RG 2003 Deletion of ghrelin impairs neither growth nor
appetite. Mol Cell Biol 23:7973-7981
158. Wortley KE, Anderson KD, Garcia K, Murray JD, Malinova L, Liu R, Moncrieffe
M, Thabet K, Cox HJ, Yancopoulos GD, Wiegand SJ, Sleeman MW 2004 Genetic
deletion of ghrelin does not decrease food intake but influences metabolic fuel
preference. Proc Natl Acad Sci U S A 101:8227-8232
159. Wortley KE, del Rincon JP, Murray JD, Garcia K, Iida K, Thorner MO, Sleeman
MW 2005 Absence of ghrelin protects against early-onset obesity. J Clin Invest
115:3573-3578
160. Pfluger PT, Kirchner H, Gunnel S, Schrott B, Perez-Tilve D, Fu S, Benoit SC,
Horvath T, Joost HG, Wortley KE, Sleeman MW, Tschop MH 2008 Simultaneous
deletion of ghrelin and its receptor increases motor activity and energy expenditure. Am J
Physiol Gastrointest Liver Physiol 294:G610-618
161. Zigman JM, Nakano Y, Coppari R, Balthasar N, Marcus JN, Lee CE, Jones JE,
Deysher AE, Waxman AR, White RD, Williams TD, Lachey JL, Seeley RJ, Lowell
BB, Elmquist JK 2005 Mice lacking ghrelin receptors resist the development of diet-
induced obesity. J Clin Invest 115:3564-3572
162. Schusdziarra V, Zimmermann JP, Erdmann J, Bader U, Schick RR 2008
Differential inhibition of galanin- and ghrelin-induced food intake by i.c.v. GLP-1(7-36)-
amide. Regul Pept 147:29-32
163. Perez-Tilve D, Gonzalez-Matias L, Alvarez-Crespo M, Leiras R, Tovar S, Dieguez
C, Mallo F 2007 Exendin-4 potently decreases ghrelin levels in fasting rats. Diabetes
56:143-151
164. Soares JB, Roncon-Albuquerque R, Jr., Leite-Moreira A 2008 Ghrelin and ghrelin
receptor inhibitors: agents in the treatment of obesity. Expert Opin Ther Targets 12:1177-
1189
165. Bell GI, Sanchez-Pescador R, Laybourn PJ, Najarian RC 1983 Exon duplication and
divergence in the human preproglucagon gene. Nature 304:368-371
166. Bell GI, Santerre RF, Mullenbach GT 1983 Hamster preproglucagon contains the
sequence of glucagon and two related peptides. Nature 302:716-718
167. Lopez LC, Frazier ML, Su CJ, Kumar A, Saunders GF 1983 Mammalian pancreatic
preproglucagon contains three glucagon-related peptides. Proc Natl Acad Sci U S A
80:5485-5489
160
168. Heinrich G, Gros P, Habener JF 1984 Glucagon gene sequence. Four of six exons
encode separate functional domains of rat pre-proglucagon. J Biol Chem 259:14082-
14087
169. Irwin DM 2001 Molecular evolution of proglucagon. Regul Pept 98:1-12
170. Heinrich G, Gros P, Lund PK, Bentley RC, Habener JF 1984 Pre-proglucagon
messenger ribonucleic acid: nucleotide and encoded amino acid sequences of the rat
pancreatic complementary deoxyribonucleic acid. Endocrinology 115:2176-2181
171. Mojsov S, Heinrich G, Wilson IB, Ravazzola M, Orci L, Habener JF 1986
Preproglucagon gene expression in pancreas and intestine diversifies at the level of post-
translational processing. J Biol Chem 261:11880-11889
172. Drucker DJ, Asa S 1988 Glucagon gene expression in vertebrate brain. J Biol Chem
263:13475-13478
173. Rouille Y, Westermark G, Martin SK, Steiner DF 1994 Proglucagon is processed to
glucagon by prohormone convertase PC2 in alpha TC1-6 cells. Proc Natl Acad Sci U S A
91:3242-3246
174. Dhanvantari S, Seidah NG, Brubaker PL 1996 Role of prohormone convertases in the
tissue-specific processing of proglucagon. Mol Endocrinol 10:342-355
175. Brubaker PL, So DC, Drucker DJ 1989 Tissue-specific differences in the levels of
proglucagon-derived peptides in streptozotocin-induced diabetes. Endocrinology
124:3003-3009
176. Drucker DJ 2002 Gut adaptation and the glucagon-like peptides. Gut 50:428-435
177. Seidah NG, Chretien M 1999 Proprotein and prohormone convertases: a family of
subtilases generating diverse bioactive polypeptides. Brain Res 848:45-62
178. Canaff L, Bennett HP, Hendy GN 1999 Peptide hormone precursor processing: getting
sorted? Mol Cell Endocrinol 156:1-6
179. Van de Ven WJ, Roebroek AJ, Van Duijnhoven HL 1993 Structure and function of
eukaryotic proprotein processing enzymes of the subtilisin family of serine proteases. Crit
Rev Oncog 4:115-136
180. Rothenberg ME, Eilertson CD, Klein K, Zhou Y, Lindberg I, McDonald JK,
Mackin RB, Noe BD 1995 Processing of mouse proglucagon by recombinant
prohormone convertase 1 and immunopurified prohormone convertase 2 in vitro. J Biol
Chem 270:10136-10146
181. Rouille Y, Martin S, Steiner DF 1995 Differential processing of proglucagon by the
subtilisin-like prohormone convertases PC2 and PC3 to generate either glucagon or
glucagon-like peptide. J Biol Chem 270:26488-26496
161
182. Dhanvantari S, Brubaker PL 1998 Proglucagon processing in an islet cell line: effects
of PC1 overexpression and PC2 depletion. Endocrinology 139:1630-1637
183. Lui EY, Asa SL, Drucker DJ, Lee YC, Brubaker PL 1990 Glucagon and related
peptides in fetal rat hypothalamus in vivo and in vitro. Endocrinology 126:110-117
184. Lee YC, Brubaker PL, Drucker DJ 1990 Developmental and tissue-specific regulation
of proglucagon gene expression. Endocrinology 127:2217-2222
185. Jin T 2008 Mechanisms underlying proglucagon gene expression. J Endocrinol 198:17-
28
186. Philippe J, Drucker DJ, Chick WL, Habener JF 1987 Transcriptional regulation of
genes encoding insulin, glucagon, and angiotensinogen by sodium butyrate in a rat islet
cell line. Mol Cell Biol 7:560-563
187. Herzig S, Fuzesi L, Knepel W 2000 Heterodimeric Pbx-Prep1 homeodomain protein
binding to the glucagon gene restricting transcription in a cell type-dependent manner. J
Biol Chem 275:27989-27999
188. Efrat S, Teitelman G, Anwar M, Ruggiero D, Hanahan D 1988 Glucagon gene
regulatory region directs oncoprotein expression to neurons and pancreatic alpha cells.
Neuron 1:605-613
189. Lee YC, Asa SL, Drucker DJ 1992 Glucagon gene 5'-flanking sequences direct
expression of simian virus 40 large T antigen to the intestine, producing carcinoma of the
large bowel in transgenic mice. J Biol Chem 267:10705-10708
190. Jin T, Drucker DJ 1995 The proglucagon gene upstream enhancer contains positive and
negative domains important for tissue-specific proglucagon gene transcription. Mol
Endocrinol 9:1306-1320
191. Nian M, Drucker DJ, Irwin D 1999 Divergent regulation of human and rat proglucagon
gene promoters in vivo. Am J Physiol 277:G829-837
192. Baggio LL, Drucker DJ 2007 Biology of incretins: GLP-1 and GIP. Gastroenterology
132:2131-2157
193. Knepel W, Chafitz J, Habener JF 1990 Transcriptional activation of the rat glucagon
gene by the cyclic AMP-responsive element in pancreatic islet cells. Mol Cell Biol
10:6799-6804
194. Drucker DJ, Jin T, Asa SL, Young TA, Brubaker PL 1994 Activation of proglucagon
gene transcription by protein kinase-A in a novel mouse enteroendocrine cell line. Mol
Endocrinol 8:1646-1655

162
195. Jin T, Drucker DJ 1996 Activation of proglucagon gene transcription through a novel
promoter element by the caudal-related homeodomain protein cdx-2/3. Mol Cell Biol
16:19-28
196. Gevrey JC, Malapel M, Philippe J, Mithieux G, Chayvialle JA, Abello J, Cordier-
Bussat M 2004 Protein hydrolysates stimulate proglucagon gene transcription in
intestinal endocrine cells via two elements related to cyclic AMP response element.
Diabetologia 47:926-936
197. McKinnon CM, Ravier MA, Rutter GA 2006 FoxO1 is required for the regulation of
preproglucagon gene expression by insulin in pancreatic alphaTC1-9 cells. J Biol Chem
281:39358-39369
198. Yi F, Brubaker PL, Jin T 2005 TCF-4 mediates cell type-specific regulation of
proglucagon gene expression by beta-catenin and glycogen synthase kinase-3beta. J Biol
Chem 280:1457-1464
199. Yi F, Sun J, Lim GE, Fantus IG, Brubaker PL, Jin T 2008 Cross talk between the
insulin and Wnt signaling pathways: evidence from intestinal endocrine L cells.
Endocrinology 149:2341-2351
200. Philippe J 1989 Glucagon gene transcription is negatively regulated by insulin in a
hamster islet cell line. J Clin Invest 84:672-677
201. Philippe J 1991 Insulin regulation of the glucagon gene is mediated by an insulin-
responsive DNA element. Proc Natl Acad Sci U S A 88:7224-7227
202. Stobie-Hayes KM, Brubaker PL 1992 Control of proglucagon-derived peptide
synthesis and secretion in fetal rat hypothalamus. Neuroendocrinology 56:340-347
203. Stobie-Hayes KM, Brubaker PL 1995 Role of glutamate in regulating hypothalamic
proglucagon-derived peptide secretion in vitro. Life Sci 56:1325-1331
204. Wojdemann M, Wettergren A, Hartmann B, Holst JJ 1998 Glucagon-like peptide-2
inhibits centrally induced antral motility in pigs. Scand J Gastroenterol 33:828-832
205. Dakin CL, Gunn I, Small CJ, Edwards CM, Hay DL, Smith DM, Ghatei MA, Bloom
SR 2001 Oxyntomodulin inhibits food intake in the rat. Endocrinology 142:4244-4250
206. Druce MR, Bloom SR 2006 Oxyntomodulin : a novel potential treatment for obesity.
Treat Endocrinol 5:265-272
207. Munroe DG, Gupta AK, Kooshesh F, Vyas TB, Rizkalla G, Wang H, Demchyshyn
L, Yang ZJ, Kamboj RK, Chen H, McCallum K, Sumner-Smith M, Drucker DJ,
Crivici A 1999 Prototypic G protein-coupled receptor for the intestinotrophic factor
glucagon-like peptide 2. Proc Natl Acad Sci U S A 96:1569-1573

163
208. Eng J, Kleinman WA, Singh L, Singh G, Raufman JP 1992 Isolation and
characterization of exendin-4, an exendin-3 analogue, from Heloderma suspectum
venom. Further evidence for an exendin receptor on dispersed acini from guinea pig
pancreas. J Biol Chem 267:7402-7405
209. Kinzig KP, D'Alessio DA, Seeley RJ 2002 The diverse roles of specific GLP-1
receptors in the control of food intake and the response to visceral illness. J Neurosci
22:10470-10476
210. Meeran K, O'Shea D, Edwards CM, Turton MD, Heath MM, Gunn I, Abusnana S,
Rossi M, Small CJ, Goldstone AP, Taylor GM, Sunter D, Steere J, Choi SJ, Ghatei
MA, Bloom SR 1999 Repeated intracerebroventricular administration of glucagon-like
peptide-1-(7-36) amide or exendin-(9-39) alters body weight in the rat. Endocrinology
140:244-250
211. Brubaker PL 2006 The glucagon-like peptides: pleiotropic regulators of nutrient
homeostasis. Ann N Y Acad Sci 1070:10-26
212. Drucker DJ, Shi Q, Crivici A, Sumner-Smith M, Tavares W, Hill M, DeForest L,
Cooper S, Brubaker PL 1997 Regulation of the biological activity of glucagon-like
peptide 2 in vivo by dipeptidyl peptidase IV. Nat Biotechnol 15:673-677
213. Vrang N, Hansen M, Larsen PJ, Tang-Christensen M 2007 Characterization of
brainstem preproglucagon projections to the paraventricular and dorsomedial
hypothalamic nuclei. Brain Res 1149:118-126
214. Tang-Christensen M, Larsen PJ, Thulesen J, Romer J, Vrang N 2000 The
proglucagon-derived peptide, glucagon-like peptide-2, is a neurotransmitter involved in
the regulation of food intake. Nat Med 6:802-807
215. Larsen PJ, Tang-Christensen M, Holst JJ, Orskov C 1997 Distribution of glucagon-
like peptide-1 and other preproglucagon-derived peptides in the rat hypothalamus and
brainstem. Neuroscience 77:257-270
216. Merchenthaler I, Lane M, Shughrue P 1999 Distribution of pre-pro-glucagon and
glucagon-like peptide-1 receptor messenger RNAs in the rat central nervous system. J
Comp Neurol 403:261-280
217. Campos RV, Lee YC, Drucker DJ 1994 Divergent tissue-specific and developmental
expression of receptors for glucagon and glucagon-like peptide-1 in the mouse.
Endocrinology 134:2156-2164
218. Lovshin J, Estall J, Yusta B, Brown TJ, Drucker DJ 2001 Glucagon-like Peptide
(GLP)-2 Action in the Murine Central Nervous System Is Enhanced by Elimination of
GLP-1 Receptor Signaling. Journal of Biological Chemistry 276:21489-21499
219. Kastin AJ, Akerstrom V 2003 Entry of exendin-4 into brain is rapid but may be limited
at high doses. Int J Obes Relat Metab Disord 27:313-318

164
220. Kastin AJ, Akerstrom V, Pan W 2002 Interactions of glucagon-like peptide-1 (GLP-1)
with the blood-brain barrier. J Mol Neurosci 18:7-14
221. Baggio LL, Huang Q, Brown TJ, Drucker DJ 2004 Oxyntomodulin and glucagon-like
peptide-1 differentially regulate murine food intake and energy expenditure.
Gastroenterology 127:546-558
222. Buteau J, Roduit R, Susini S, Prentki M 1999 Glucagon-like peptide-1 promotes DNA
synthesis, activates phosphatidylinositol 3-kinase and increases transcription factor
pancreatic and duodenal homeobox gene 1 (PDX-1) DNA binding activity in beta (INS-
1)-cells. Diabetologia 42:856-864
223. Holz GG 2004 Epac: A new cAMP-binding protein in support of glucagon-like peptide-1
receptor-mediated signal transduction in the pancreatic beta-cell. Diabetes 53:5-13
224. Skoglund G, Hussain MA, Holz GG 2000 Glucagon-like peptide 1 stimulates insulin
gene promoter activity by protein kinase A-independent activation of the rat insulin I
gene cAMP response element. Diabetes 49:1156-1164
225. Bode HP, Moormann B, Dabew R, Goke B 1999 Glucagon-like peptide 1 elevates
cytosolic calcium in pancreatic beta-cells independently of protein kinase A.
Endocrinology 140:3919-3927
226. Gomez E, Pritchard C, Herbert TP 2002 cAMP-dependent protein kinase and Ca2+
influx through L-type voltage-gated calcium channels mediate Raf-independent
activation of extracellular regulated kinase in response to glucagon-like peptide-1 in
pancreatic beta-cells. J Biol Chem 277:48146-48151
227. Park S, Dong X, Fisher TL, Dunn S, Omer AK, Weir G, White MF 2006 Exendin-4
uses Irs2 signaling to mediate pancreatic beta cell growth and function. J Biol Chem
281:1159-1168
228. Maida A, Lovshin JA, Baggio LL, Drucker DJ 2008 The glucagon-like peptide-1
receptor agonist oxyntomodulin enhances beta-cell function but does not inhibit gastric
emptying in mice. Endocrinology 149:5670-5678
229. Dube PE, Brubaker PL 2007 Frontiers in glucagon-like peptide-2: multiple actions,
multiple mediators. Am J Physiol Endocrinol Metab 293:E460-465
230. Rowland KJ, Brubaker PL 2008 Life in the crypt: a role for glucagon-like peptide-2?
Mol Cell Endocrinol 288:63-70
231. Yusta B, Somwar R, Wang F, Munroe D, Grinstein S, Klip A, Drucker DJ 1999
Identification of glucagon-like peptide-2 (GLP-2)-activated signaling pathways in baby
hamster kidney fibroblasts expressing the rat GLP-2 receptor. J Biol Chem 274:30459-
30467

165
232. Burrin DG, Stoll B, Guan X, Cui L, Chang X, Hadsell D 2007 GLP-2 rapidly activates
divergent intracellular signaling pathways involved in intestinal cell survival and
proliferation in neonatal piglets. Am J Physiol Endocrinol Metab 292:E281-291
233. Dube PE, Rowland KJ, Brubaker PL 2008 Glucagon-like peptide-2 activates beta-
catenin signaling in the mouse intestinal crypt: role of insulin-like growth factor-I.
Endocrinology 149:291-301
234. Madadi G, Dalvi PS, Belsham DD 2008 Regulation of brain insulin mRNA by glucose
and glucagon-like peptide 1. Biochem Biophys Res Commun 376:694-699
235. Mayer CM, Fick LJ, Gingerich S, Belsham DD 2009 Hypothalamic cell lines to
investigate neuroendocrine control mechanisms. Front Neuroendocrinol 30:405-423
236. Banting FG, Best CH, Collip JB, Campbell WR, Fletcher AA 1991 Pancreatic
extracts in the treatment of diabetes mellitus: preliminary report. 1922. CMAJ 145:1281-
1286
237. Goodge KA, Hutton JC 2000 Translational regulation of proinsulin biosynthesis and
proinsulin conversion in the pancreatic beta-cell. Semin Cell Dev Biol 11:235-242
238. Wing SS 2008 The UPS in diabetes and obesity. BMC Biochem 9 Suppl 1:S6
239. Rorsman P, Renstrom E 2003 Insulin granule dynamics in pancreatic beta cells.
Diabetologia 46:1029-1045
240. Ullrich A, Bell JR, Chen EY, Herrera R, Petruzzelli LM, Dull TJ, Gray A, Coussens
L, Liao YC, Tsubokawa M, et al. 1985 Human insulin receptor and its relationship to
the tyrosine kinase family of oncogenes. Nature 313:756-761
241. Ebina Y, Ellis L, Jarnagin K, Edery M, Graf L, Clauser E, Ou JH, Masiarz F, Kan
YW, Goldfine ID, et al. 1985 The human insulin receptor cDNA: the structural basis for
hormone-activated transmembrane signalling. Cell 40:747-758
242. Czech MP 1985 The nature and regulation of the insulin receptor: structure and function.
Annu Rev Physiol 47:357-381
243. Ottensmeyer FP, Beniac DR, Luo RZ, Yip CC 2000 Mechanism of transmembrane
signaling: insulin binding and the insulin receptor. Biochemistry 39:12103-12112
244. Seino S, Seino M, Nishi S, Bell GI 1989 Structure of the human insulin receptor gene
and characterization of its promoter. Proc Natl Acad Sci U S A 86:114-118
245. Seino S, Bell GI 1989 Alternative splicing of human insulin receptor messenger RNA.
Biochem Biophys Res Commun 159:312-316

166
246. Pandini G, Frasca F, Mineo R, Sciacca L, Vigneri R, Belfiore A 2002 Insulin/insulin-
like growth factor I hybrid receptors have different biological characteristics depending
on the insulin receptor isoform involved. J Biol Chem 277:39684-39695
247. Belfiore A, Frasca F, Pandini G, Sciacca L, Vigneri R 2009 Insulin receptor isoforms
and insulin receptor/insulin-like growth factor receptor hybrids in physiology and
disease. Endocr Rev 30:586-623
248. Corp ES, Woods SC, Porte D, Jr., Dorsa DM, Figlewicz DP, Baskin DG 1986
Localization of 125I-insulin binding sites in the rat hypothalamus by quantitative
autoradiography. Neurosci Lett 70:17-22
249. Marks JL, Porte D, Jr., Stahl WL, Baskin DG 1990 Localization of insulin receptor
mRNA in rat brain by in situ hybridization. Endocrinology 127:3234-3236
250. Air EL, Benoit SC, Blake Smith KA, Clegg DJ, Woods SC 2002 Acute third
ventricular administration of insulin decreases food intake in two paradigms. Pharmacol
Biochem Behav 72:423-429
251. White MF, Maron R, Kahn CR 1985 Insulin rapidly stimulates tyrosine
phosphorylation of a Mr-185,000 protein in intact cells. Nature 318:183-186
252. Sun XJ, Rothenberg P, Kahn CR, Backer JM, Araki E, Wilden PA, Cahill DA,
Goldstein BJ, White MF 1991 Structure of the insulin receptor substrate IRS-1 defines a
unique signal transduction protein. Nature 352:73-77
253. Backer JM, Myers MG, Jr., Shoelson SE, Chin DJ, Sun XJ, Miralpeix M, Hu P,
Margolis B, Skolnik EY, Schlessinger J, et al. 1992 Phosphatidylinositol 3'-kinase is
activated by association with IRS-1 during insulin stimulation. EMBO J 11:3469-3479
254. Sarbassov DD, Guertin DA, Ali SM, Sabatini DM 2005 Phosphorylation and
regulation of Akt/PKB by the rictor-mTOR complex. Science 307:1098-1101
255. Iskandar K, Cao Y, Hayashi Y, Nakata M, Takano E, Yada T, Zhang C, Ogawa W,
Oki M, Chua S, Jr., Itoh H, Noda T, Kasuga M, Nakae J 2010 PDK-1/FoxO1
pathway in POMC neurons regulates Pomc expression and food intake. Am J Physiol
Endocrinol Metab 298:E787-798
256. Plum L, Belgardt BF, Bruning JC 2006 Central insulin action in energy and glucose
homeostasis. J Clin Invest 116:1761-1766
257. Pearson G, Robinson F, Beers Gibson T, Xu BE, Karandikar M, Berman K, Cobb
MH 2001 Mitogen-activated protein (MAP) kinase pathways: regulation and
physiological functions. Endocr Rev 22:153-183
258. Boulton TG, Nye SH, Robbins DJ, Ip NY, Radziejewska E, Morgenbesser SD,
DePinho RA, Panayotatos N, Cobb MH, Yancopoulos GD 1991 ERKs: a family of

167
protein-serine/threonine kinases that are activated and tyrosine phosphorylated in
response to insulin and NGF. Cell 65:663-675
259. Mirshamsi S, Laidlaw HA, Ning K, Anderson E, Burgess LA, Gray A, Sutherland
C, Ashford ML 2004 Leptin and insulin stimulation of signalling pathways in arcuate
nucleus neurones: PI3K dependent actin reorganization and KATP channel activation.
BMC Neurosci 5:54
260. Niswender KD, Morrison CD, Clegg DJ, Olson R, Baskin DG, Myers MG, Seeley
RJ, Schwartz MW 2003 Insulin Activation of Phosphatidylinositol 3-Kinase in the
Hypothalamic Arcuate Nucleus. Diabetes 52:227-231
261. Magnan C, Philippe J, Kassis N, Laury MC, Penicaud L, Gilbert M, Ktorza A 1995
In vivo effects of glucose and insulin on secretion and gene expression of glucagon in
rats. Endocrinology 136:5370-5376
262. Schinner S, Barthel A, Dellas C, Grzeskowiak R, Sharma SK, Oetjen E, Blume R,
Knepel W 2005 Protein kinase B activity is sufficient to mimic the effect of insulin on
glucagon gene transcription. J Biol Chem 280:7369-7376
263. Lim GE, Huang GJ, Flora N, LeRoith D, Rhodes CJ, Brubaker PL 2009 Insulin
regulates glucagon-like peptide-1 secretion from the enteroendocrine L cell.
Endocrinology 150:580-591
264. Islam D, Zhang N, Wang P, Li H, Brubaker PL, Gaisano HY, Wang Q, Jin T 2009
Epac is involved in cAMP-stimulated proglucagon expression and hormone production
but not hormone secretion in pancreatic alpha- and intestinal L-cell lines. Am J Physiol
Endocrinol Metab 296:E174-181
265. Lotfi S, Li Z, Sun J, Zuo Y, Lam PP, Kang Y, Rahimi M, Islam D, Wang P, Gaisano
HY, Jin T 2006 Role of the exchange protein directly activated by cyclic adenosine 5'-
monophosphate (Epac) pathway in regulating proglucagon gene expression in intestinal
endocrine L cells. Endocrinology 147:3727-3736
266. Montague CT, Farooqi IS, Whitehead JP, Soos MA, Rau H, Wareham NJ, Sewter
CP, Digby JE, Mohammed SN, Hurst JA, Cheetham CH, Earley AR, Barnett AH,
Prins JB, O'Rahilly S 1997 Congenital leptin deficiency is associated with severe early-
onset obesity in humans. Nature 387:903-908
267. Halaas JL, Gajiwala KS, Maffei M, Cohen SL, Chait BT, Rabinowitz D, Lallone
RL, Burley SK, Friedman JM 1995 Weight-reducing effects of the plasma protein
encoded by the obese gene. Science 269:543-546
268. Farooqi IS, Jebb SA, Langmack G, Lawrence E, Cheetham CH, Prentice AM,
Hughes IA, McCamish MA, O'Rahilly S 1999 Effects of recombinant leptin therapy in
a child with congenital leptin deficiency. N Engl J Med 341:879-884

168
269. Friedman JM 1998 Leptin, leptin receptors, and the control of body weight. Nutr Rev
56:s38-46; discussion s54-75
270. Considine RV, Sinha MK, Heiman ML, Kriauciunas A, Stephens TW, Nyce MR,
Ohannesian JP, Marco CC, McKee LJ, Bauer TL, et al. 1996 Serum immunoreactive-
leptin concentrations in normal-weight and obese humans. N Engl J Med 334:292-295
271. Mackintosh RM, Hirsch J 2001 The effects of leptin administration in non-obese
human subjects. Obes Res 9:462-469
272. Kelesidis T, Mantzoros CS 2006 The emerging role of leptin in humans. Pediatr
Endocrinol Rev 3:239-248
273. Bjorbaek C, Elmquist JK, Michl P, Ahima RS, van Bueren A, McCall AL, Flier JS
1998 Expression of leptin receptor isoforms in rat brain microvessels. Endocrinology
139:3485-3491
274. Fei H, Okano HJ, Li C, Lee GH, Zhao C, Darnell R, Friedman JM 1997 Anatomic
localization of alternatively spliced leptin receptors (Ob-R) in mouse brain and other
tissues. Proc Natl Acad Sci U S A 94:7001-7005
275. Mercer JG, Hoggard N, Williams LM, Lawrence CB, Hannah LT, Trayhurn P 1996
Localization of leptin receptor mRNA and the long form splice variant (Ob-Rb) in mouse
hypothalamus and adjacent brain regions by in situ hybridization. FEBS Lett 387:113-
116
276. Tartaglia LA 1997 The leptin receptor. J Biol Chem 272:6093-6096
277. Uotani S, Bjorbaek C, Tornoe J, Flier JS 1999 Functional properties of leptin receptor
isoforms: internalization and degradation of leptin and ligand-induced receptor
downregulation. Diabetes 48:279-286
278. Wang MY, Zhou YT, Newgard CB, Unger RH 1996 A novel leptin receptor isoform in
rat. FEBS Lett 392:87-90
279. Mercer JG, Hoggard N, Williams LM, Lawrence CB, Hannah LT, Morgan PJ,
Trayhurn P 1996 Coexpression of leptin receptor and preproneuropeptide Y mRNA in
arcuate nucleus of mouse hypothalamus. J Neuroendocrinol 8:733-735
280. Cowley MA, Smart JL, Rubinstein M, Cerdan MG, Diano S, Horvath TL, Cone RD,
Low MJ 2001 Leptin activates anorexigenic POMC neurons through a neural network in
the arcuate nucleus. Nature 411:480-484
281. Banks WA, Kastin AJ, Huang W, Jaspan JB, Maness LM 1996 Leptin enters the
brain by a saturable system independent of insulin. Peptides 17:305-311

169
282. Tang-Christensen M, Havel PJ, Jacobs RR, Larsen PJ, Cameron JL 1999 Central
administration of leptin inhibits food intake and activates the sympathetic nervous system
in rhesus macaques. J Clin Endocrinol Metab 84:711-717
283. Lee GH, Proenca R, Montez JM, Carroll KM, Darvishzadeh JG, Lee JI, Friedman
JM 1996 Abnormal splicing of the leptin receptor in diabetic mice. Nature 379:632-635
284. Margetic S, Gazzola C, Pegg GG, Hill RA 2002 Leptin: a review of its peripheral
actions and interactions. Int J Obes Relat Metab Disord 26:1407-1433
285. Balthasar N, Coppari R, McMinn J, Liu SM, Lee CE, Tang V, Kenny CD,
McGovern RA, Chua SC, Jr., Elmquist JK, Lowell BB 2004 Leptin receptor signaling
in POMC neurons is required for normal body weight homeostasis. Neuron 42:983-991
286. van de Wall E, Leshan R, Xu AW, Balthasar N, Coppari R, Liu SM, Jo YH,
MacKenzie RG, Allison DB, Dun NJ, Elmquist J, Lowell BB, Barsh GS, de Luca C,
Myers MG, Jr., Schwartz GJ, Chua SC, Jr. 2008 Collective and individual functions
of leptin receptor modulated neurons controlling metabolism and ingestion.
Endocrinology 149:1773-1785
287. Wilcke M, Walum E 2000 Characterization of leptin intracellular trafficking. Eur J
Histochem 44:325-334
288. Bjorbaek C, Uotani S, da Silva B, Flier JS 1997 Divergent signaling capacities of the
long and short isoforms of the leptin receptor. J Biol Chem 272:32686-32695
289. Li C, Friedman JM 1999 Leptin receptor activation of SH2 domain containing protein
tyrosine phosphatase 2 modulates Ob receptor signal transduction. Proc Natl Acad Sci U
S A 96:9677-9682
290. Friedman JM 1999 Leptin and the regulation of body weight. Harvey Lect 95:107-136
291. Banks AS, Davis SM, Bates SH, Myers MG, Jr. 2000 Activation of downstream
signals by the long form of the leptin receptor. J Biol Chem 275:14563-14572
292. Bates SH, Stearns WH, Dundon TA, Schubert M, Tso AW, Wang Y, Banks AS,
Lavery HJ, Haq AK, Maratos-Flier E, Neel BG, Schwartz MW, Myers MG, Jr. 2003
STAT3 signalling is required for leptin regulation of energy balance but not reproduction.
Nature 421:856-859
293. Bjorbaek C, Kahn BB 2004 Leptin signaling in the central nervous system and the
periphery. Recent Prog Horm Res 59:305-331
294. Niswender KD, Morton GJ, Stearns WH, Rhodes CJ, Myers MG, Jr., Schwartz
MW 2001 Intracellular signalling. Key enzyme in leptin-induced anorexia. Nature
413:794-795
170
295. Belgardt BF, Bruning JC 2010 CNS leptin and insulin action in the control of energy
homeostasis. Ann N Y Acad Sci 1212:97-113
296. Morris DL, Rui L 2009 Recent advances in understanding leptin signaling and leptin
resistance. Am J Physiol Endocrinol Metab 297:E1247-1259
297. Minokoshi Y, Alquier T, Furukawa N, Kim YB, Lee A, Xue B, Mu J, Foufelle F,
Ferre P, Birnbaum MJ, Stuck BJ, Kahn BB 2004 AMP-kinase regulates food intake
by responding to hormonal and nutrient signals in the hypothalamus. Nature 428:569-574
298. Bjorbaek C, Buchholz RM, Davis SM, Bates SH, Pierroz DD, Gu H, Neel BG, Myers
MG, Jr., Flier JS 2001 Divergent roles of SHP-2 in ERK activation by leptin receptors.
J Biol Chem 276:4747-4755
299. Rahmouni K, Sigmund CD, Haynes WG, Mark AL 2009 Hypothalamic ERK
mediates the anorectic and thermogenic sympathetic effects of leptin. Diabetes 58:536-
542
300. Cui H, Cai F, Belsham DD 2006 Leptin signaling in neurotensin neurons involves
STAT, MAP kinases ERK1/2, and p38 through c-Fos and ATF1. Faseb J 20:2654-2656
301. Elias CF, Kelly JF, Lee CE, Ahima RS, Drucker DJ, Saper CB, Elmquist JK 2000
Chemical characterization of leptin-activated neurons in the rat brain. J Comp Neurol
423:261-281
302. Goldstone AP, Morgan I, Mercer JG, Morgan DG, Moar KM, Ghatei MA, Bloom
SR 2000 Effect of leptin on hypothalamic GLP-1 peptide and brain-stem pre-
proglucagon mRNA. Biochem Biophys Res Commun 269:331-335
303. Goldstone AP, Mercer JG, Gunn I, Moar KM, Edwards CM, Rossi M, Howard JK,
Rasheed S, Turton MD, Small C, Heath MM, O'Shea D, Steere J, Meeran K, Ghatei
MA, Hoggard N, Bloom SR 1997 Leptin interacts with glucagon-like peptide-1 neurons
to reduce food intake and body weight in rodents. FEBS Lett 415:134-138
304. Bojanowska E, Nowak, A. 2007 Interactions between leptin and exendin-4, a glucagon-
like peptide-1 agonist, in the regulation of food intake in the rat. Journal of Physiology
and Pharmacology 58:349-360
305. Mercer JG, Moar KM, Findlay PA, Hoggard N, Adam CL 1998 Association of leptin
receptor (OB-Rb), NPY and GLP-1 gene expression in the ovine and murine brainstem.
Regul Pept 75-76:271-278
306. Vrang N, Larsen PJ, Jensen PB, Lykkegaard K, Artmann A, Larsen LK, Tang-
Christensen M 2008 Upregulation of the brainstem preproglucagon system in the obese
Zucker rat. Brain Res 1187:116-124

171
307. Huo L, Gamber KM, Grill HJ, Bjorbaek C 2008 Divergent leptin signaling in
proglucagon neurons of the nucleus of the solitary tract in mice and rats. Endocrinology
149:492-497
308. Marroqui L, Vieira E, Gonzalez A, Nadal A, Quesada I 2011 Leptin downregulates
expression of the gene encoding glucagon in alphaTC1-9 cells and mouse islets.
Diabetologia 54:843-851
309. Beck B 2000 Neuropeptides and obesity. Nutrition 16:916-923
310. Everitt BJ, Hokfelt T 1990 Neuroendocrine anatomy of the hypothalamus. Acta
Neurochir Suppl (Wien) 47:1-15
311. Cepko CL, Roberts BE, Mulligan RC 1984 Construction and applications of a highly
transmissible murine retrovirus shuttle vector. Cell 37:1053-1062
312. De Vitry F, Camier M, Czernichow P, Benda P, Cohen P, Tixier-Vidal A 1974
Establishment of a clone of mouse hypothalamic neurosecretory cells synthesizing
neurophysin and vasopressin. Proc Natl Acad Sci U S A 71:3575-3579
313. Cepko CL 1989 Immortalization of neural cells via retrovirus-mediated oncogene
transduction. Annu Rev Neurosci 12:47-65
314. Fick LJ, Belsham DD 2010 Nutrient sensing and insulin signaling in neuropeptide-
expressing immortalized, hypothalamic neurons: A cellular model of insulin resistance.
Cell Cycle 9:3186-3193
315. Belsham DD 2007 Hormonal regulation of clonal, immortalized hypothalamic neurons
expressing neuropeptides involved in reproduction and feeding. Mol Neurobiol 35:182-
194
316. Dalvi PS, Nazarians-Armavil A, Tung S, Belsham DD 2011 Immortalized neurons for
the study of hypothalamic function. Am J Physiol Regul Integr Comp Physiol
300:R1030-1052
317. Kasckow J, Mulchahey JJ, Aguilera G, Pisarska M, Nikodemova M, Chen HC,
Herman JP, Murphy EK, Liu Y, Rizvi TA, Dautzenberg FM, Sheriff S 2003
Corticotropin-releasing hormone (CRH) expression and protein kinase A mediated CRH
receptor signalling in an immortalized hypothalamic cell line. J Neuroendocrinol 15:521-
529
318. Rasmussen JE, Torres-Aleman I, MacLusky NJ, Naftolin F, Robbins RJ 1990 The
effects of estradiol on the growth patterns of estrogen receptor-positive hypothalamic cell
lines. Endocrinology 126:235-240
319. Kokoeva MV, Yin H, Flier JS 2005 Neurogenesis in the hypothalamus of adult mice:
potential role in energy balance. Science 310:679-683

172
320. Markakis EA, Palmer TD, Randolph-Moore L, Rakic P, Gage FH 2004 Novel
neuronal phenotypes from neural progenitor cells. J Neurosci 24:2886-2897
321. Pencea V, Bingaman KD, Wiegand SJ, Luskin MB 2001 Infusion of brain-derived
neurotrophic factor into the lateral ventricle of the adult rat leads to new neurons in the
parenchyma of the striatum, septum, thalamus, and hypothalamus. J Neurosci 21:6706-
6717
322. Kokoeva MV, Yin H, Flier JS 2007 Evidence for constitutive neural cell proliferation in
the adult murine hypothalamus. J Comp Neurol 505:209-220
323. Perez-Martin M, Cifuentes M, Grondona JM, Lopez-Avalos MD, Gomez-Pinedo U,
Garcia-Verdugo JM, Fernandez-Llebrez P 2010 IGF-I stimulates neurogenesis in the
hypothalamus of adult rats. Eur J Neurosci 31:1533-1548
324. Xu Y, Tamamaki N, Noda T, Kimura K, Itokazu Y, Matsumoto N, Dezawa M, Ide C
2005 Neurogenesis in the ependymal layer of the adult rat 3rd ventricle. Exp Neurol
192:251-264
325. Fineman MS, Bicsak TA, Shen LZ, Taylor K, Gaines E, Varns A, Kim D, Baron AD
2003 Effect on Glycemic Control of Exenatide (Synthetic Exendin-4) Additive to
Existing Metformin and/or Sulfonylurea Treatment in Patients With Type 2 Diabetes.
Diabetes Care 26:2370-2377
326. Jeppesen PB, Gilroy R, Pertkiewicz M, Allard JP, Messing B, O'Keefe SJ 2011
Randomised placebo-controlled trial of teduglutide in reducing parenteral nutrition and/or
intravenous fluid requirements in patients with short bowel syndrome. Gut
327. Hayes MR, Leichner TM, Zhao S, Lee GS, Chowansky A, Zimmer D, De Jonghe
BC, Kanoski SE, Grill HJ, Bence KK 2011 Intracellular signals mediating the food
intake-suppressive effects of hindbrain glucagon-like peptide-1 receptor activation. Cell
Metab 13:320-330
328. Shin ED, Estall JL, Izzo A, Drucker DJ, Brubaker PL 2005 Mucosal adaptation to
enteral nutrients is dependent on the physiologic actions of glucagon-like peptide-2 in
mice. Gastroenterology 128:1340-1353
329. Chomczynski P, Sacchi N 1987 Single-step method of RNA isolation by acid
guanidinium thiocyanate-phenol-chloroform extraction. Anal Biochem 162:156-159
330. Zhou L, Nian M, Gu J, Irwin DM 2006 Intron 1 sequences are required for pancreatic
expression of the human proglucagon gene. Am J Physiol Regul Integr Comp Physiol
290:R634-641
331. Paxinos G, Franklin KBJ 2003 The Mouse Brain in Stereotaxic Coordinates: Compact
Second Edition, Second Edition: Academic Press
332. Kieffer TJ, Habener JF 1999 The glucagon-like peptides. Endocr Rev 20:876-913
173
333. Vrang N, Larsen PJ 2010 Preproglucagon derived peptides GLP-1, GLP-2 and
oxyntomodulin in the CNS: role of peripherally secreted and centrally produced peptides.
Prog Neurobiol 92:442-462
334. Niswender KD, Baskin DG, Schwartz MW 2004 Insulin and its evolving partnership
with leptin in the hypothalamic control of energy homeostasis. Trends Endocrinol Metab
15:362-369
335. Benoit SC, Air EL, Coolen LM, Strauss R, Jackman A, Clegg DJ, Seeley RJ, Woods
SC 2002 The catabolic action of insulin in the brain is mediated by melanocortins. J
Neurosci 22:9048-9052
336. Sheriff S, Chance WT, Iqbal S, Rizvi TA, Xiao C, Kasckow JW, Balasubramaniam
A 2003 Hypothalamic administration of cAMP agonist/PKA activator inhibits both
schedule feeding and NPY-induced feeding in rats. Peptides 24:245-254
337. Hsieh Y-S, Yang S-F, Kuo D-Y 2007 Intracerebral administration of protein kinase A or
cAMP response element-binding protein antisense oligonucleotide can modulate
amphetamine-mediated appetite suppression in free-moving rats. American Journal of
Physiology - Endocrinology And Metabolism 292:E123-E131
338. Duan Z, Bradner J, Greenberg E, Mazitschek R, Foster R, Mahoney J, Seiden MV
2007 8-Benzyl-4-oxo-8-azabicyclo[3.2.1]oct-2-ene-6,7-dicarboxylic Acid (SD-1008), a
Novel Janus Kinase 2 Inhibitor, Increases Chemotherapy Sensitivity in Human Ovarian
Cancer Cells. Molecular Pharmacology 72:1137-1145
339. Blaskovich MA, Sun J, Cantor A, Turkson J, Jove R, Sebti SM 2003 Discovery of
JSI-124 (cucurbitacin I), a selective Janus kinase/signal transducer and activator of
transcription 3 signaling pathway inhibitor with potent antitumor activity against human
and murine cancer cells in mice. Cancer Res 63:1270-1279
340. Bensaude O 2011 Inhibiting eukaryotic transcription: Which compound to choose? How
to evaluate its activity? Transcription 2:103-108
341. Ljungman M 2007 The transcription stress response. Cell Cycle 6:2252-2257
342. Rusinov V, Baev V, Minkov IN, Tabler M 2005 MicroInspector: a web tool for
detection of miRNA binding sites in an RNA sequence. Nucleic Acids Res 33:W696-700
343. Cook KB, Kazan H, Zuberi K, Morris Q, Hughes TR 2011 RBPDB: a database of
RNA-binding specificities. Nucleic Acids Res 39:D301-308
344. Gonzalez M, Boer U, Dickel C, Quentin T, Cierny I, Oetjen E, Knepel W 2008 Loss
of insulin-induced inhibition of glucagon gene transcription in hamster pancreatic islet
alpha cells by long-term insulin exposure. Diabetologia 51:2012-2021
345. Philippe J, Drucker DJ, Habener JF 1987 Glucagon gene transcription in an islet cell
line is regulated via a protein kinase C-activated pathway. J Biol Chem 262:1823-1828

174
346. Philippe J 1991 Structure and pancreatic expression of the insulin and glucagon genes.
Endocr Rev 12:252-271
347. Drucker DJ 2003 Glucagon gene expression. In: Henry HL, Norman, AW, ed.
Encyclopedia of Hormones. San Diego, CA: Academic; 47-55
348. Brubaker PL, Schloos J, Drucker DJ 1998 Regulation of glucagon-like peptide-1
synthesis and secretion in the GLUTag enteroendocrine cell line. Endocrinology
139:4108-4114
349. Tsai B, Yue S, Irwin DM 2007 A novel element regulates expression of the proximal
human proglucagon promoter in islet cells. Gen Comp Endocrinol 151:230-239
350. Drucker DJ, Brubaker PL 1989 Proglucagon gene expression is regulated by a cyclic
AMP-dependent pathway in rat intestine. Proc Natl Acad Sci U S A 86:3953-3957
351. Wang J, Cao Y, Steiner DF 2003 Regulation of proglucagon transcription by activated
transcription factor (ATF) 3 and a novel isoform, ATF3b, through the cAMP-response
element/ATF site of the proglucagon gene promoter. J Biol Chem 278:32899-32904
352. Blencowe B, Brenner S, Hughes T, Morris Q 2009 Post-transcriptional gene
regulation: RNA-protein interactions, RNA processing, mRNA stability and localization.
Pac Symp Biocomput:545-548
353. Jing Q, Huang S, Guth S, Zarubin T, Motoyama A, Chen J, Di Padova F, Lin SC,
Gram H, Han J 2005 Involvement of microRNA in AU-rich element-mediated mRNA
instability. Cell 120:623-634
354. Kato M, Slack FJ 2008 microRNAs: small molecules with big roles - C. elegans to
human cancer. Biol Cell 100:71-81
355. Filipowicz W, Bhattacharyya SN, Sonenberg N 2008 Mechanisms of post-
transcriptional regulation by microRNAs: are the answers in sight? Nat Rev Genet 9:102-
114
356. Eulalio A, Huntzinger E, Izaurralde E 2008 Getting to the root of miRNA-mediated
gene silencing. Cell 132:9-14
357. Evangelisti C, Florian MC, Massimi I, Dominici C, Giannini G, Galardi S, Bue MC,
Massalini S, McDowell HP, Messi E, Gulino A, Farace MG, Ciafre SA 2009 MiR-128
up-regulation inhibits Reelin and DCX expression and reduces neuroblastoma cell
motility and invasiveness. Faseb J 23:4276-4287
358. Liu L, Jiang Y, Zhang H, Greenlee AR, Han Z 2010 Overexpressed miR-494 down-
regulates PTEN gene expression in cells transformed by anti-benzo(a)pyrene-trans-7,8-
dihydrodiol-9,10-epoxide. Life Sci 86:192-198

175
359. Granjon A, Gustin MP, Rieusset J, Lefai E, Meugnier E, Guller I, Cerutti C,
Paultre C, Disse E, Rabasa-Lhoret R, Laville M, Vidal H, Rome S 2009 The
microRNA signature in response to insulin reveals its implication in the transcriptional
action of insulin in human skeletal muscle and the role of a sterol regulatory element-
binding protein-1c/myocyte enhancer factor 2C pathway. Diabetes 58:2555-2564
360. Hamrick MW, Herberg S, Arounleut P, He HZ, Shiver A, Qi RQ, Zhou L, Isales
CM, Mi QS 2010 The adipokine leptin increases skeletal muscle mass and significantly
alters skeletal muscle miRNA expression profile in aged mice. Biochem Biophys Res
Commun 400:379-383
361. Aberg K, Saetre P, Jareborg N, Jazin E 2006 Human QKI, a potential regulator of
mRNA expression of human oligodendrocyte-related genes involved in schizophrenia.
Proc Natl Acad Sci U S A 103:7482-7487
362. Yano M, Okano HJ, Okano H 2005 Involvement of Hu and heterogeneous nuclear
ribonucleoprotein K in neuronal differentiation through p21 mRNA post-transcriptional
regulation. J Biol Chem 280:12690-12699
363. King PH, Levine TD, Fremeau RT, Jr., Keene JD 1994 Mammalian homologs of
Drosophila ELAV localized to a neuronal subset can bind in vitro to the 3' UTR of
mRNA encoding the Id transcriptional repressor. J Neurosci 14:1943-1952
364. Kreymann B, Williams G, Ghatei MA, Bloom SR 1987 Glucagon-like peptide-1 7-36:
a physiological incretin in man. Lancet 2:1300-1304
365. Drucker DJ 2001 Minireview: the glucagon-like peptides. Endocrinology 142:521-527
366. Kendall DM, Riddle MC, Rosenstock J, Zhuang D, Kim DD, Fineman MS, Baron
AD 2005 Effects of Exenatide (Exendin-4) on Glycemic Control Over 30 Weeks in
Patients With Type 2 Diabetes Treated With Metformin and a Sulfonylurea. Diabetes
Care 28:1083-1091
367. Kim D, MacConell L, Zhuang D, Kothare PA, Trautmann M, Fineman M, Taylor K
2007 Effects of once-weekly dosing of a long-acting release formulation of exenatide on
glucose control and body weight in subjects with type 2 diabetes. Diabetes Care 30:1487-
1493
368. Raz I, Hanefeld M, Xu L, Caria C, Williams-Herman D, Khatami H 2006 Efficacy
and safety of the dipeptidyl peptidase-4 inhibitor sitagliptin as monotherapy in patients
with type 2 diabetes mellitus. Diabetologia 49:2564-2571
369. Barrera JG, D'Alessio DA, Drucker DJ, Woods SC, Seeley RJ 2009 Differences in
the central anorectic effects of glucagon-like peptide-1 and exendin-4 in rats. Diabetes
58:2820-2827
370. Perfetti R, Merkel P 2000 Glucagon-like peptide-1: a major regulator of pancreatic
beta-cell function. Eur J Endocrinol 143:717-725

176
371. Baggio LL, Huang Q, Cao X, Drucker DJ 2008 An albumin-exendin-4 conjugate
engages central and peripheral circuits regulating murine energy and glucose
homeostasis. Gastroenterology 134:1137-1147
372. Dalvi PS, Nazarians-Armavil A, Purser MJ, Belsham DD 2012 Glucagon-Like
Peptide-1 Receptor Agonist, Exendin-4, Regulates Feeding-Associated Neuropeptides in
Hypothalamic Neurons in Vivo and in Vitro. Endocrinology 153:2208-2222
373. Nishizawa M, Nakabayashi H, Kawai K, Ito T, Kawakami S, Nakagawa A, Niijima
A, Uchida K 2000 The hepatic vagal reception of intraportal GLP-1 is via receptor
different from the pancreatic GLP-1 receptor. J Auton Nerv Syst 80:14-21
374. Yang H, Egan JM, Wang Y, Moyes CD, Roth J, Montrose MH, Montrose-Rafizadeh
C 1998 GLP-1 action in L6 myotubes is via a receptor different from the pancreatic GLP-
1 receptor. Am J Physiol 275:C675-683
375. Montrose-Rafizadeh C, Yang H, Wang Y, Roth J, Montrose MH, Adams LG 1997
Novel signal transduction and peptide specificity of glucagon-like peptide receptor in
3T3-L1 adipocytes. J Cell Physiol 172:275-283
376. Malendowicz LK, Nowak KW 2002 Preproglucagon derived peptides and thyrotropin
(TSH) secretion in the rat: robust and sustained lowering of blood TSH levels in exendin-
4 injected animals. Int J Mol Med 10:327-331
377. Ferrini F, Salio C, Lossi L, Merighi A 2009 Ghrelin in central neurons. Current
neuropharmacology 7:37-49
378. Lu S, Guan JL, Wang QP, Uehara K, Yamada S, Goto N, Date Y, Nakazato M,
Kojima M, Kangawa K, Shioda S 2002 Immunocytochemical observation of ghrelin-
containing neurons in the rat arcuate nucleus. Neurosci Lett 321:157-160
379. Sato T, Fukue Y, Teranishi H, Yoshida Y, Kojima M 2005 Molecular forms of
hypothalamic ghrelin and its regulation by fasting and 2-deoxy-d-glucose administration.
Endocrinology 146:2510-2516
380. Hori Y, Kageyama H, Guan JL, Kohno D, Yada T, Takenoya F, Nonaka N,
Kangawa K, Shioda S, Yoshida T 2008 Synaptic interaction between ghrelin- and
ghrelin-containing neurons in the rat hypothalamus. Regul Pept 145:122-127
381. Pugazhenthi U, Velmurugan K, Tran A, Mahaffey G, Pugazhenthi S 2010 Anti-
inflammatory action of exendin-4 in human islets is enhanced by phosphodiesterase
inhibitors: potential therapeutic benefits in diabetic patients. Diabetologia 53:2357-2368
382. Kim S, Moon M, Park S 2009 Exendin-4 protects dopaminergic neurons by inhibition
of microglial activation and matrix metalloproteinase-3 expression in an animal model of
Parkinson's disease. J Endocrinol 202:431-439

177
383. Ersahin M, Toklu HZ, Erzik C, Cetinel S, Akakin D, Velioglu-Ogunc A, Tetik S,
Ozdemir ZN, Sener G, Yegen BC 2010 The anti-inflammatory and neuroprotective
effects of ghrelin in subarachnoid hemorrhage-induced oxidative brain damage in rats. J
Neurotrauma 27:1143-1155
384. Kageyama K, Kumata Y, Akimoto K, Takayasu S, Tamasawa N, Suda T 2011
Ghrelin stimulates corticotropin-releasing factor and vasopressin gene expression in rat
hypothalamic 4B cells. Stress
385. Rowe W, Viau V, Meaney MJ, Quirion R 1992 Central Administration of Neurotensin
Stimulates Hypothalamic-Pituitary-Adrenal Activity. Annals of the New York Academy
of Sciences 668:365-367
386. Gil-Lozano M, Perez-Tilve D, Alvarez-Crespo M, Martis A, Fernandez AM,
Catalina PA, Gonzalez-Matias LC, Mallo F 2010 GLP-1(7-36)-amide and Exendin-4
stimulate the HPA axis in rodents and humans. Endocrinology 151:2629-2640
387. MacLusky NJ, Cook S, Scrocchi L, Shin J, Kim J, Vaccarino F, Asa SL, Drucker DJ
2000 Neuroendocrine function and response to stress in mice with complete disruption of
glucagon-like peptide-1 receptor signaling. Endocrinology 141:752-762
388. Fu LY, van den Pol AN 2010 Kisspeptin directly excites anorexigenic
proopiomelanocortin neurons but inhibits orexigenic neuropeptide Y cells by an indirect
synaptic mechanism. J Neurosci 30:10205-10219
389. Qi Y, Henry BA, Oldfield BJ, Clarke IJ 2010 The action of leptin on appetite-
regulating cells in the ovine hypothalamus: demonstration of direct action in the absence
of the arcuate nucleus. Endocrinology 151:2106-2116
390. Whitnall MH 1988 Distributions of pro-vasopressin expressing and pro-vasopressin
deficient CRH neurons in the paraventricular hypothalamic nucleus of colchicine-treated
normal and adrenalectomized rats. J Comp Neurol 275:13-28
391. Sawchenko PE, Pfeiffer SW 1988 Ultrastructural localization of neuropeptide Y and
galanin immunoreactivity in the paraventricular nucleus of the hypothalamus in the rat.
Brain Res 474:231-245
392. Hoosein NM, Gurd RS 1984 Human glucagon-like peptides 1 and 2 activate rat brain
adenylate cyclase. FEBS Lett 178:83-86
393. Ma X, Bruning J, Ashcroft FM 2007 Glucagon-like peptide 1 stimulates hypothalamic
proopiomelanocortin neurons. J Neurosci 27:7125-7129
394. Dominguez G, Kuhar MJ 2004 Transcriptional regulation of the CART promoter in
CATH.a cells. Brain Res Mol Brain Res 126:22-29

178
395. Fick LJ, Cai F, Belsham DD 2009 Hypothalamic preproghrelin gene expression is
repressed by insulin via both PI3-K/Akt and ERK1/2 MAPK pathways in immortalized,
hypothalamic neurons. Neuroendocrinology 89:267-275
396. Harrison RJ, McNeil GP, Dobner PR 1995 Synergistic activation of
neurotensin/neuromedin N gene expression by c-Jun and glucocorticoids: novel effects of
Fos family proteins. Mol Endocrinol 9:981-993
397. Doyle ME, Egan JM 2007 Mechanisms of action of glucagon-like peptide 1 in the
pancreas. Pharmacol Ther 113:546-593
398. Wang X, Murphy TJ 1998 Inhibition of cyclic AMP-dependent kinase by expression of
a protein kinase inhibitor/enhanced green fluorescent fusion protein attenuates
angiotensin II-induced type 1 AT1 receptor mRNA down-regulation in vascular smooth
muscle cells. Mol Pharmacol 54:514-524
399. Mayer CM, Belsham DD 2009 Insulin directly regulates NPY and AgRP gene
expression via the MAPK MEK/ERK signal transduction pathway in mHypoE-46
hypothalamic neurons. Mol Cell Endocrinol 307:99-108
400. Vo N, Klein ME, Varlamova O, Keller DM, Yamamoto T, Goodman RH, Impey S
2005 A cAMP-response element binding protein-induced microRNA regulates neuronal
morphogenesis. Proc Natl Acad Sci U S A 102:16426-16431
401. Han VK, Hynes MA, Jin C, Towle AC, Lauder JM, Lund PK 1986 Cellular
localization of proglucagon/glucagon-like peptide I messenger RNAs in rat brain. J
Neurosci Res 16:97-107
402. Drucker DJ, Erlich P, Asa SL, Brubaker PL 1996 Induction of intestinal epithelial
proliferation by glucagon-like peptide 2. Proc Natl Acad Sci U S A 93:7911-7916
403. Tsai CH, Hill M, Asa SL, Brubaker PL, Drucker DJ 1997 Intestinal growth-
promoting properties of glucagon-like peptide-2 in mice. Am J Physiol 273:E77-84
404. Tsai CH, Hill M, Drucker DJ 1997 Biological determinants of intestinotrophic
properties of GLP-2 in vivo. Am J Physiol 272:G662-668
405. Benjamin MA, McKay DM, Yang PC, Cameron H, Perdue MH 2000 Glucagon-like
peptide-2 enhances intestinal epithelial barrier function of both transcellular and
paracellular pathways in the mouse. Gut 47:112-119
406. Wojdemann M, Wettergren A, Hartmann B, Hilsted L, Holst JJ 1999 Inhibition of
sham feeding-stimulated human gastric acid secretion by glucagon-like peptide-2. J Clin
Endocrinol Metab 84:2513-2517
407. Dube PE, Forse CL, Bahrami J, Brubaker PL 2006 The essential role of insulin-like
growth factor-1 in the intestinal tropic effects of glucagon-like peptide-2 in mice.
Gastroenterology 131:589-605

179
408. Leen JL, Izzo A, Upadhyay C, Rowland KJ, Dube PE, Gu S, Heximer SP, Rhodes
CJ, Storm DR, Lund PK, Brubaker PL 2011 Mechanism of action of glucagon-like
peptide-2 to increase IGF-I mRNA in intestinal subepithelial fibroblasts. Endocrinology
152:436-446
409. Jennes L, Stumpf WE, Kalivas PW 1982 Neurotensin: topographical distribution in rat
brain by immunohistochemistry. J Comp Neurol 210:211-224
410. Williams G, Bing C, Cai XJ, Harrold JA, King PJ, Liu XH 2001 The hypothalamus
and the control of energy homeostasis: different circuits, different purposes. Physiol
Behav 74:683-701
411. Orskov C, Holst JJ, Knuhtsen S, Baldissera FG, Poulsen SS, Nielsen OV 1986
Glucagon-like peptides GLP-1 and GLP-2, predicted products of the glucagon gene, are
secreted separately from pig small intestine but not pancreas. Endocrinology 119:1467-
1475
412. Wynne K, Bloom SR 2006 The role of oxyntomodulin and peptide tyrosine-tyrosine
(PYY) in appetite control. Nat Clin Pract Endocrinol Metab 2:612-620
413. Dogrukol-Ak D, Tore F, Tuncel N 2004 Passage of VIP/PACAP/secretin family across
the blood-brain barrier: therapeutic effects. Curr Pharm Des 10:1325-1340
414. Schmidt PT, Naslund E, Gryback P, Jacobsson H, Hartmann B, Holst JJ, Hellstrom
PM 2003 Peripheral administration of GLP-2 to humans has no effect on gastric
emptying or satiety. Regul Pept 116:21-25
415. Jeppesen PB, Hartmann B, Thulesen J, Graff J, Lohmann J, Hansen BS, Tofteng F,
Poulsen SS, Madsen JL, Holst JJ, Mortensen PB 2001 Glucagon-like peptide 2
improves nutrient absorption and nutritional status in short-bowel patients with no colon.
Gastroenterology 120:806-815
416. Paul M, Poyan Mehr A, Kreutz R 2006 Physiology of local renin-angiotensin systems.
Physiol Rev 86:747-803
417. Mietlicki EG, Nowak EL, Daniels D 2009 The effect of ghrelin on water intake during
dipsogenic conditions. Physiol Behav 96:37-43
418. Lovshin JA, Huang Q, Seaberg R, Brubaker PL, Drucker DJ 2004
Extrahypothalamic expression of the glucagon-like peptide-2 receptor is coupled to
reduction of glutamate-induced cell death in cultured hippocampal cells. Endocrinology
145:3495-3506
419. Velazquez E, Ruiz-Albusac JM, Blazquez E 2003 Glucagon-like peptide-2 stimulates
the proliferation of cultured rat astrocytes. Eur J Biochem 270:3001-3009

180
420. Camby I, Salmon I, Bourdel E, Nagy N, Danguy A, Brotchi J, Pasteels JL, Martinez
J, Kiss R 1996 Neurotensin-mediated effects on astrocytic tumor cell proliferation.
Neuropeptides 30:133-139
421. Sato M, Nakahara K, Goto S, Kaiya H, Miyazato M, Date Y, Nakazato M, Kangawa
K, Murakami N 2006 Effects of ghrelin and des-acyl ghrelin on neurogenesis of the rat
fetal spinal cord. Biochem Biophys Res Commun 350:598-603
422. Zhang W, Lin TR, Hu Y, Fan Y, Zhao L, Stuenkel EL, Mulholland MW 2004
Ghrelin stimulates neurogenesis in the dorsal motor nucleus of the vagus. J Physiol
559:729-737
423. Wang Y, Guan X 2010 GLP-2 potentiates L-type Ca2+ channel activity associated with
stimulated glucose uptake in hippocampal neurons. Am J Physiol Endocrinol Metab
298:E156-166
424. Kageyama H, Takenoya F, Shiba K, Shioda S 2010 Neuronal circuits involving ghrelin
in the hypothalamus-mediated regulation of feeding. Neuropeptides 44:133-138
425. Gahete MD, Rubio A, Cordoba-Chacon J, Gracia-Navarro F, Kineman RD, Avila J,
Luque RM, Castano JP 2010 Expression of the ghrelin and neurotensin systems is
altered in the temporal lobe of Alzheimer's disease patients. J Alzheimers Dis 22:819-828
426. Asakawa A, Inui A, Fujimiya M, Sakamaki R, Shinfuku N, Ueta Y, Meguid MM,
Kasuga M 2005 Stomach regulates energy balance via acylated ghrelin and desacyl
ghrelin. Gut 54:18-24
427. Kishimoto M, Okimura Y, Nakata H, Kudo T, Iguchi G, Takahashi Y, Kaji H,
Chihara K 2003 Cloning and characterization of the 5(')-flanking region of the human
ghrelin gene. Biochem Biophys Res Commun 305:186-192
428. Dalvi PS, Belsham DD 2012 Glucagon-Like Peptide-2 Directly Regulates Hypothalamic
Neurons Expressing Neuropeptides Linked to Appetite Control in Vivo and in Vitro.
Endocrinology 153:2385-2397
429. Schwartz MW, Baskin DG, Bukowski TR, Kuijper JL, Foster D, Lasser G,
Prunkard DE, Porte D, Jr., Woods SC, Seeley RJ, Weigle DS 1996 Specificity of
leptin action on elevated blood glucose levels and hypothalamic neuropeptide Y gene
expression in ob/ob mice. Diabetes 45:531-535
430. Schwartz MW, Marks JL, Sipols AJ, Baskin DG, Woods SC, Kahn SE, Porte D, Jr.
1991 Central insulin administration reduces neuropeptide Y mRNA expression in the
arcuate nucleus of food-deprived lean (Fa/Fa) but not obese (fa/fa) Zucker rats.
Endocrinology 128:2645-2647
431. Inokuchi A, Oomura Y, Nishimura H 1984 Effect of intracerebroventricularly infused
glucagon on feeding behavior. Physiol Behav 33:397-400

181
432. Honda K, Kamisoyama H, Saito N, Kurose Y, Sugahara K, Hasegawa S 2007
Central administration of glucagon suppresses food intake in chicks. Neurosci Lett
416:198-201
433. Dakin CL, Small CJ, Batterham RL, Neary NM, Cohen MA, Patterson M, Ghatei
MA, Bloom SR 2004 Peripheral oxyntomodulin reduces food intake and body weight
gain in rats. Endocrinology 145:2687-2695
434. Ghatei MA, Uttenthal LO, Christofides ND, Bryant MG, Bloom SR 1983 Molecular
forms of human enteroglucagon in tissue and plasma: plasma responses to nutrient
stimuli in health and in disorders of the upper gastrointestinal tract. J Clin Endocrinol
Metab 57:488-495
435. Roberge JN, Brubaker PL 1991 Secretion of proglucagon-derived peptides in response
to intestinal luminal nutrients. Endocrinology 128:3169-3174
436. Kieffer TJ, McIntosh CH, Pederson RA 1995 Degradation of glucose-dependent
insulinotropic polypeptide and truncated glucagon-like peptide 1 in vitro and in vivo by
dipeptidyl peptidase IV. Endocrinology 136:3585-3596
437. Tavares W, Drucker DJ, Brubaker PL 2000 Enzymatic- and renal-dependent
catabolism of the intestinotropic hormone glucagon-like peptide-2 in rats. Am J Physiol
Endocrinol Metab 278:E134-139
438. Hartmann B, Harr MB, Jeppesen PB, Wojdemann M, Deacon CF, Mortensen PB,
Holst JJ 2000 In vivo and in vitro degradation of glucagon-like peptide-2 in humans. J
Clin Endocrinol Metab 85:2884-2888
439. Jasleen J, Ashley SW, Shimoda N, Zinner MJ, Whang EE 2002 Glucagon-like
peptide 2 stimulates intestinal epithelial proliferation in vitro. Dig Dis Sci 47:1135-1140
440. Sorensen LB, Flint A, Raben A, Hartmann B, Holst JJ, Astrup A 2003 No effect of
physiological concentrations of glucagon-like peptide-2 on appetite and energy intake in
normal weight subjects. Int J Obes Relat Metab Disord 27:450-456
441. Larsen PJ, Tang-Christensen M, Jessop DS 1997 Central administration of glucagon-
like peptide-1 activates hypothalamic neuroendocrine neurons in the rat. Endocrinology
138:4445-4455
442. Bavec A, Hallbrink M, Langel U, Zorko M 2003 Different role of intracellular loops of
glucagon-like peptide-1 receptor in G-protein coupling. Regul Pept 111:137-144
443. Koole C, Wootten D, Simms J, Valant C, Sridhar R, Woodman OL, Miller LJ,
Summers RJ, Christopoulos A, Sexton PM 2010 Allosteric ligands of the glucagon-
like peptide 1 receptor (GLP-1R) differentially modulate endogenous and exogenous
peptide responses in a pathway-selective manner: implications for drug screening. Mol
Pharmacol 78:456-465
182
444. Dickson SL, Shirazi RH, Hansson C, Bergquist F, Nissbrandt H, Skibicka KP 2012
The glucagon-like peptide 1 (GLP-1) analogue, exendin-4, decreases the rewarding value
of food: a new role for mesolimbic GLP-1 receptors. J Neurosci 32:4812-4820
445. Rinaman L 2010 Ascending projections from the caudal visceral nucleus of the solitary
tract to brain regions involved in food intake and energy expenditure. Brain Res 1350:18-
34
446. Alhadeff AL, Rupprecht LE, Hayes MR 2012 GLP-1 neurons in the nucleus of the
solitary tract project directly to the ventral tegmental area and nucleus accumbens to
control for food intake. Endocrinology 153:647-658
447. Clancy B, Darlington RB, Finlay BL 2001 Translating developmental time across
mammalian species. Neuroscience 105:7-17
448. Clancy B, Kersh B, Hyde J, Darlington RB, Anand KJ, Finlay BL 2007 Web-based
method for translating neurodevelopment from laboratory species to humans.
Neuroinformatics 5:79-94
449. Attardi B, Tsujii T, Friedman R, Zeng Z, Roberts JL, Dellovade T, Pfaff DW,
Chandran UR, Sullivan MW, DeFranco DB 1997 Glucocorticoid repression of
gonadotropin-releasing hormone gene expression and secretion in morphologically
distinct subpopulations of GT1-7 cells. Mol Cell Endocrinol 131:241-255
450. Northcutt RG, Muske LE 1994 Multiple embryonic origins of gonadotropin-releasing
hormone (GnRH) immunoreactive neurons. Brain Res Dev Brain Res 78:279-290
451. Chaillou E, Baumont R, Chilliard Y, Tillet Y 2002 Several subpopulations of
neuropeptide Y-containing neurons exist in the infundibular nucleus of sheep: an
immunohistochemical study of animals on different diets. J Comp Neurol 444:129-143
452. Bain J, Plater L, Elliott M, Shpiro N, Hastie CJ, McLauchlan H, Klevernic I,
Arthur JS, Alessi DR, Cohen P 2007 The selectivity of protein kinase inhibitors: a
further update. Biochem J 408:297-315
453. Gharbi SI, Zvelebil MJ, Shuttleworth SJ, Hancox T, Saghir N, Timms JF,
Waterfield MD 2007 Exploring the specificity of the PI3K family inhibitor LY294002.
Biochem J 404:15-21
454. Lachey JL, D'Alessio DA, Rinaman L, Elmquist JK, Drucker DJ, Seeley RJ 2005
The role of central glucagon-like peptide-1 in mediating the effects of visceral illness:
differential effects in rats and mice. Endocrinology 146:458-462
455. Le Bihan D, Urayama S, Aso T, Hanakawa T, Fukuyama H 2006 Direct and fast
detection of neuronal activation in the human brain with diffusion MRI. Proc Natl Acad
Sci U S A 103:8263-8268
456. 2008 Cell imaging: Light activated. Nature 456:826-827

183
457. Shibata C, Naito H, Jin XL, Ueno T, Funayama Y, Fukushima K, Hashimoto A,
Matsuno S, Sasaki I 2001 Effect of glucagon, glicentin, glucagon-like peptide-1 and -2
on interdigestive gastroduodenal motility in dogs with a vagally denervated gastric
pouch. Scand J Gastroenterol 36:1049-1055
458. Pellissier S, Sasaki K, Le-Nguyen D, Bataille D, Jarrousse C 2004 Oxyntomodulin
and glicentin are potent inhibitors of the fed motility pattern in small intestine.
Neurogastroenterol Motil 16:455-463
459. Day JW, Ottaway N, Patterson JT, Gelfanov V, Smiley D, Gidda J, Findeisen H,
Bruemmer D, Drucker DJ, Chaudhary N, Holland J, Hembree J, Abplanalp W,
Grant E, Ruehl J, Wilson H, Kirchner H, Lockie SH, Hofmann S, Woods SC,
Nogueiras R, Pfluger PT, Perez-Tilve D, DiMarchi R, Tschop MH 2009 A new
glucagon and GLP-1 co-agonist eliminates obesity in rodents. Nat Chem Biol 5:749-757
460. Hoffman GE, Smith MS, Fitzsimmons MD 1992 Detecting steroidal effects on
immediate early gene expression in the hypothalamus. Neuroprotocols 1:52-66
461. Wetsel WC, Eraly SA, Whyte DB, Mellon PL 1993 Regulation of gonadotropin-
releasing hormone by protein kinase-A and -C in immortalized hypothalamic neurons.
Endocrinology 132:2360-2370
462. Vijayan E, Carraway R, Leeman SE, McCann SM 1988 Use of antiserum to
neurotensin reveals a physiological role for the peptide in rat prolactin release. Proc Natl
Acad Sci U S A 85:9866-9869
463. Gully D, Canton M, Boigegrain R, Jeanjean F, Molimard JC, Poncelet M, Gueudet
C, Heaulme M, Leyris R, Brouard A, et al. 1993 Biochemical and pharmacological
profile of a potent and selective nonpeptide antagonist of the neurotensin receptor. Proc
Natl Acad Sci U S A 90:65-69
464. Szentirmai É, Kapás L, Sun Y, Smith RG, Krueger JM 2009 The preproghrelin gene
is required for the normal integration of thermoregulation and sleep in mice. Proceedings
of the National Academy of Sciences 106:14069-14074