Probing liquid surface waves, liquid properties and liquid films with light diffraction
High Temp. Mater. Proc., Vol. 30 (2011), xxx–xxx Copyright © 2011 De Gruyter. DOI 10.1515/HTMP.2011.048
Molecular Dynamics Modelling of Liquid Fe-C Alloys
David K. Belashchenko,1 Alexander Mirzoev2 andOleg Ostrovski3;�
1 Department of Physical Chemistry, Moscow Institute ofSteel and Alloys, Moscow, Russia
2 Department of Physics, South Ural State University,Chelyabinsk, Russia
3 School of Materials Science and Engineering, The Uni-versity of New South Wales, Sydney, Australia
Abstract. Properties and structure of liquid Fe-C alloyswith carbon concentration up to 20 at% at temperaturesup to 2500 K were calculated using molecular dynamicsmodelling. Interaction between Fe-Fe and Fe-C atoms wasdescribed using the embedded atom potential (EAM). TheMorse potential was chosen for Fe-C pair interaction, whileC-C pair interaction was presented in the form of the repul-sive potential. Parameters of potentials were adjusted usingexperimental data for density, internal energy, bulk modulusand distance between Fe and C atoms in liquid Fe-C alloysnear the liquidus temperature. Calculated density and molarvolume of Fe-C alloys at 1873 K decreased with increasingcarbon concentration; a temperature coefficient of densityof liquid alloys was, practically, independent of the carbonconcentration. Carbon content of the alloys had a negligibleeffect on the distance between Fe-Fe and Fe-C atoms and ona sum of coordination numbers Fe-Fe and Fe-C. Distribu-tion of atoms in the first coordination sphere in the Fe-Calloys was close to statistical.
Keywords. Molecular dynamics, embedded atom poten-tial, liquid alloys, Fe-C system.
PACS®(2010). 82.20.Wt, 82.60.Lf.
1 Introduction
Fe-C is a major system in steelmaking. Properties of Fe-Calloys are of significant interest; they have been intensivelystudied in both liquid and solid states. The Fe-C phase di-agram, properties of solid alloys and thermodynamic prop-erties of liquid Fe-C solutions are well established. Experi-mental data on physical properties of liquid alloys and theirstructure obtained by different researchers are scattered and
Corresponding author: Oleg Ostrovski, School of MaterialsScience and Engineering, The University of New South Wales,Kensington 2033, Sydney 2052, New South Wales, Australia;E-mail: [email protected].
Received: November 10, 2010. Accepted: April 15, 2011.
often inconsistent. Even difference in such fundamentalproperty as density of liquid Fe-C alloys, measured by dif-ferent researchers is significant [1–3]. Discrepancies in ex-perimental data were caused by difficulties of high temper-ature experiments and high reactivity of liquid Fe-C alloyswith respect to refractory materials and gases. Experimentaldata on properties and structure of liquid Fe-C alloys werereviewed in [4–7].
Vertman and Samarin [4] studied physical properties ofFe-C liquid alloys and concluded that liquid solutions withabove 9 at% C contain unstable colloid-type complexes. Inalloys, obtained by fast cooling of liquid Fe-C solutions (>9at% C), authors [8,9] observed cementite and austenite withthe carbon concentration less than 9 at%. On the basis ofthese data, authors [10] suggested that solutions with 9 at%to 22 at% C in the range of 1573 K to 1973 K consisted oftwo phases, which are cementite clusters and a Fe-C solu-tion with 9 at% C.
Baum et al. [5] analysing experimental data on structureand properties of liquid alloys concluded that their structurechanges at certain temperature. This fact was used for theso called temperature-time processing of liquid industrialalloys to improve their properties in the solid state [5].
Structure of the Fe-C liquid alloys was studied usingXRD in [11] and neutron diffraction in [12]. No anomaly instructural properties of the Fe-C solutions was reported inthese works.
The aim of this paper is to develop a molecular dynamics(MD) model of liquid Fe-C alloys to describe their proper-ties and structure in a broad range of concentrations (up to20 at% C) and temperatures (up to 2500 K).
The MD modeling depends on potentials which describeinteractions between Fe-Fe, Fe-C and C-C atoms in the so-lution. In this work, the embedded atom model was used forFe-Fe and Fe-C pairs, while C-C interaction was describedusing a repulsive potential.
In the embedded atom model (EAM), potential energyU of a system includes potentials of pair interactions �.rij )between atoms i and j and energy of individual atoms i ,which is expressed through the effective electron density �in the point of location of an atom i by function ˆ.�/.
U DX
i
ˆ.�i /CX
i<j
�.rij /: (1)
Effective electron density � is calculated by equation (2):
�i DX
j
.rij /; (2)
Brought to you by | Univ. New South Wales 1224220 (Univ. New South Wales 1224220)Authenticated | 172.16.1.226
Download Date | 3/22/12 5:04 AM
2 D. K. Belashchenko, A. Mirzoev and O. Ostrovski
where .rij / is a contribution to the electron density froman atom j . Functions ˆ.�/, �.r/ and .r/ are adjustedusing experimental properties of the system which is mod-elled. Total force acting on the atom i includes terms gen-erated by cooperative interactions (EAM term) and pair i -jinteractions.
The MD model and calculation procedure were pre-sented in [13] in application to the Fe-S system. To con-struct a model of the Fe-C solution which properties andstructure are close to the real system, potential parametersused in the MD modeling were adjusted using some experi-mental data for the solution. They included density, internalenergy of Fe-C alloys, bulk modulus and average distancebetween Fe-C atoms. Bulk modulus was determined fromthe speed of sound in liquid iron and two Fe-C alloys neareutectic temperature measured in [14,15]. Potential param-eters were varied in such a way to get the best fit of models’internal energy, bulk modulus and Fe-C distances to exper-imental data. These parameters were used in modelling ofFe-C alloys in broad range of carbon concentration and tem-perature to calculate alloys’ internal energy, bulk modulus,structure and self-diffusion coefficients of iron and carbon.
2 Properties of Liquid Fe-C Alloys Used forCalculation of the Model Potentials
Density of pure liquid iron is well established; at 1873 K,it is equal to 7:03 � 103 kg m�3 [16]. Data on the density ofliquid Fe-C alloys reported in literature have a significantscattering, although in some cases these data were obtainedusing the same method [3]. Density of Fe-C alloys in [1]was studied by the gamma penetration method, which ishighly sensitive to the density change and is more accurateat high temperatures [1]. Fe-C system was modelled usingdata from [1]. However, experimental data reported in [1]do not cover the whole range of temperatures and composi-tions studied in this work. To assess the density of differentalloys at the same temperature, the temperature coefficientof density of �0:87 � 10�4 K�1 was used. This temper-ature coefficient was established for the Fe-B liquid alloycontaining 3.3 mass % B, also by the gamma-penetrationmethod [1].
Thermodynamic properties of the liquid Fe-C alloyswere analysed in [17–22]. In the MD modelling, internalenergy of the system is calculated relative to monatomicmotionless gaseous components. Therefore, experimentalthermodynamic properties of the Fe-C liquid alloys shouldbe re-calculated for the standard states pure monatomicmotionless gaseous iron and carbon. Internal energy ofpure iron at 1873 K for this standard state is �315:92kJ mol�1 [22]. Enthalpy of atomisation of graphite (tran-sition to the monatomic gas) at 298 K is 716.68 kJ mol�1
[23]. Enthalpy change of graphite in the process of heatingfrom 298 K to 1873 K is 31.83 kJ mol�1, while enthalpy
change of monatomic gas in the same temperature intervalis 32.84 kJ mol�1 (ideal gas, �H D .5=2/R�T ). There-fore, the enthalpy of graphite atomization at 1873 K withrespect to monatomic gas at 1873 K is �H D 716:68 C
32:84 � 31:83 D 760:69 kJ mol�1. Then the internal en-ergy change for transfer of graphite to monatomic gas at1873 K is �U D �H �RT D 702:12 kJ mol�1.
Enthalpy of mixing of liquid iron with graphite at 1873 Kwas found in [19] from the thermodynamic modelling of theFe-C system and analysis of the Fe-C phase diagram. Ther-modynamic data for the Fe-C system reported in [20, 21]were established experimentally; the relative partial en-thalpy of carbon in the liquid Fe-C alloys at 1873 K ispresented in [20, 21] in the form of the following equation(standard states for iron and carbon in the solution are liquidiron and graphite at 1873 K):
�HC D 22 600C 24 330 � .1 �X2Fe/ (J mol�1): (3)
XFe in the above equation is a mole fraction of iron in thesolution. The relative partial enthalpy of iron can be foundusing the Gibbs-Duhem equation as follows:
�HFe D �24 330 �X2C (J mol�1); (4)
whereXC is the mole fraction of carbon. Then, the enthalpyof formation of a liquid Fe-C solution from liquid iron andgraphite can be calculated by equation (5):
�Hm D XFe�HFe CXC�HC D XC.46 930 � 24 330XFe/
(J mol�1): (5)
The enthalpy of formation of Fe-C liquid solution presentedin [18] is close to values calculated by equation (5).
To calculate the energy of formation of the Fe-C liq-uid solution from gaseous motionless monatomic ironand carbon at 1873 K, the internal energy of iron(�315:9 kJ mol�1) and graphite (�702:1 kJ mol�1) shouldbe taken into account. The atomisation energy of iron,315.9 kJ mol�1 was calculated with respect to motionlessgas, while the atomisation energy of carbon, 702.1 kJ mol�1
was calculated with respect to moving gas with energy.3=2/RT ; the energy of atomisation of graphite to motion-less gas at 1873 K is 702:1�23:4 D 678:7 kJ mol�1. There-fore, the energy of formation of the liquid Fe-C solutionfrom motionless gaseous iron and carbon can be calculatedusing equation (6):
U D �315:9 �XFe � 678:7 �XC C�Hm (kJ mol�1):(6)
The following values of energy for the Fe-C liquid alloyswere calculated at 1873 K:
C, at% 0 5 10 15 20
U , kJ mol�1 �315:9 �331:2 �348:1 �364:9 �381:6
Brought to you by | Univ. New South Wales 1224220 (Univ. New South Wales 1224220)Authenticated | 172.16.1.226
Download Date | 3/22/12 5:04 AM
Molecular Dynamics Modelling of Liquid Fe-C Alloys 3
Another property which was used for the construction ofthe MD model of the Fe-C liquid alloys is a bulk modulusKT. The bulk modulus for pure liquid iron at 1820 K wasfound in [14] to be equal to 69.9 GPa. Reference [15] re-ported data on the speed of sound (w) in the Fe-C liquidalloy, containing 14.4 at% C at 1600 K: w D 4000 m s�1.Speed of sound is related to the bulk modulus by the fol-lowing equation:
w D
sKT
d
Cp
CV; (7)
where Cp and CV are heat capacities at constant pressureand volume correspondingly; d is the alloy density. Thedensity of the Fe-C alloy with 14.4 at% C at 1820 K wasestimated as described above at 6:67 � 103 kg m�3. Heatcapacities Cp and CV were calculated by the MD method:Cp D 29:46 J mol�1 K�1 and CV D 26:19 J mol�1 K�1,Cp=CV D 1:125. This ratio depends very little on smallvariations of the potential. Using these data and equa-tion (7) KT is found equal to 94.8 GPa, and isothermal co-efficient of compressibility ˇT D K
�1T D 1:05 �10�11 Pa�1.
Reference [14] reports ˇT D 1:28 � 10�11 Pa�1; the differ-ence can be attributed to different values of alloy densityused in [14] and in this work. The bulk modulus for theFe-C liquid alloy with 11.8 at% C at 1600 K calculated us-ing the speed of sound from [14] at d D 6:79 � 103 kg m�3
gives KT D 112:5 GPa.Average Fe-C distances in Fe-C alloys were taken from
experimental neutron study of this system in [12].
3 Construction of Potentials for Liquid Fe-C Alloys
As mentioned above, functions ˆ.�/, �.r/ and .r/ defin-ing the EAM potentials (equation (1)) were adjusted usingexperimental properties of the Fe-C system. The functionsˆ.�/, �.r/ and .r/ for pure iron were suggested in [22]and for the Fe-S system in [13]. The ˆ.�/ and .r/ func-tions for the two-component system can be presented in thefollowing form [13, 22]:
k.r/ D pk1 exp.�pk2r/;
ˆk.�/ D ak1 C ak2.� � �k0/2 C ak3.� � �k0/
3
at � � 0:8�k0 ;
ˆk.�/ D ˛k�1=2 C ˇk� at � < 0:8�k0 ,
(8)
where subscript k is assigned to iron or carbon; pk1 , pk2 ,�k0 , ak1 , ak2 and ak3 are adjusted parameters. Coefficients˛ and ˇ can be expressed through parameters ak1 , ak2 andak3 because at � D 0:8�k0 the function ˆ.�/ and its firstderivative with respect to � are continuous. Therefore, theEAM potential of a pure component of the alloy is definedby 8 adjusted parameters.
The pair Fe-Fe potential �FeFe.r/ was calculated usingSchommers algorithm as described and tabulated in [22].Parameters defining the functions ˆ.�/ and .r/ for pureiron were found in [22] using the temperature dependenceof density as follows: pFe1 D 4:4176, pFe2 D 1:5860 Å�1,aFe1 D �1:7016 eV, aFe2 D 0:3188 eV, aFe3 D 0:3064 eV,�Fe0 D 1:000. The same parameters were used for iron inmodelling of liquid Fe-S solutions [13]. They will also beused for the modelling of liquid Fe-C alloys, assuming thatparameters of the EAM of iron do not change when iron isin the solution.
Functions ˆ.�/ and .r/ for the EAM of carbon wereconstructed in the form of equations (8) with the follow-ing parameters: pC1 D 2:600, pC2 D 1:3250 Å�1,aC1 D �3:3000 eV, aC2 D 2:0000 eV, aC3 D 0:0 eV,�C0 D 0:8500. These parameters were found by trials asdescribed in [13]. The pair Fe-C interaction �FeC.r/ wasdescribed by the Morse potential presented by equation (9):
�FeC.r/ D "FeCŒe�2˛. r
rFeC�1/� 2e
�˛. rrFeC
�1/�: (9)
Parameters "FeC, ˛ and rFeC for this potential were ad-justed to reproduce the density of liquid Fe-C alloys, av-erage distance between Fe and C atoms, energy of forma-tion of the Fe-C solution and bulk modulus. The follow-ing values of these parameters were obtained: ˛ D 4:2,"FeC D 0:5450 eV and rFeC D 2:23 Å.
Published data for the Fe-C liquid alloys are not suffi-cient for the construction of a multi-particle potential forpair C-C interactions. This potential was assumed to be re-pulsive as presented by equation (10). The same form ofpotential was used for the S-S pair in the MD modelling ofthe Fe-S system in [13].
�CC.r/ D "CC.rCC=r/6: (10)
Parameters of this potential were found as follows: "CC D
1:8767 eV and rCC D 2:236 Å.
4 Molecular Dynamics Modelling
Molecular dynamics models of the Fe-C liquid solutionswere built up with 998 and 2997 atoms in the basic cube us-ing the Verlet algorithm. A radius of the Verlet sphere was9.01 Å; the potentials were cut off at 8.60 Å for all pairs.MD modeling was carried with the time step �t equal to0:01 � t0, where t0 D 7:608 � 10�14 s. The duration of onerun was 5000 to 10 000 steps. NVE, NVT and NPT en-sembles were investigated. Temperature of the model wasmonitored via the atoms velocity; pressure was maintainedclose to ambient by adjusting the length of the basic cubeedge.
All potentials but �FeFe.r/ were defined analytically; the�FeFe.r/ potential was introduced in the form of a table with
Brought to you by | Univ. New South Wales 1224220 (Univ. New South Wales 1224220)Authenticated | 172.16.1.226
Download Date | 3/22/12 5:04 AM
4 D. K. Belashchenko, A. Mirzoev and O. Ostrovski
a step 0.05 Å and interpolated as a function of distance rwith a special computer program.
The bulk modulus was calculated using two MD mod-els with a slightly different edge length of a basic cube (by0.04 Å to 0.06 Å).
The potential parameters were adjusted by calculatingthe model pressure under condition that its absolute meanvalue should not exceed 0.05 GPa (the ambient pressure inreal experiment was about 0.0001 GPa), and comparing thecalculated internal energy, bulk modulus and distance be-tween Fe and C atoms with experimental data. Thermalpressure fluctuated in the range 0.3 GPa to 0.4 GPa.
5 Results and Discussion
5.1 Density
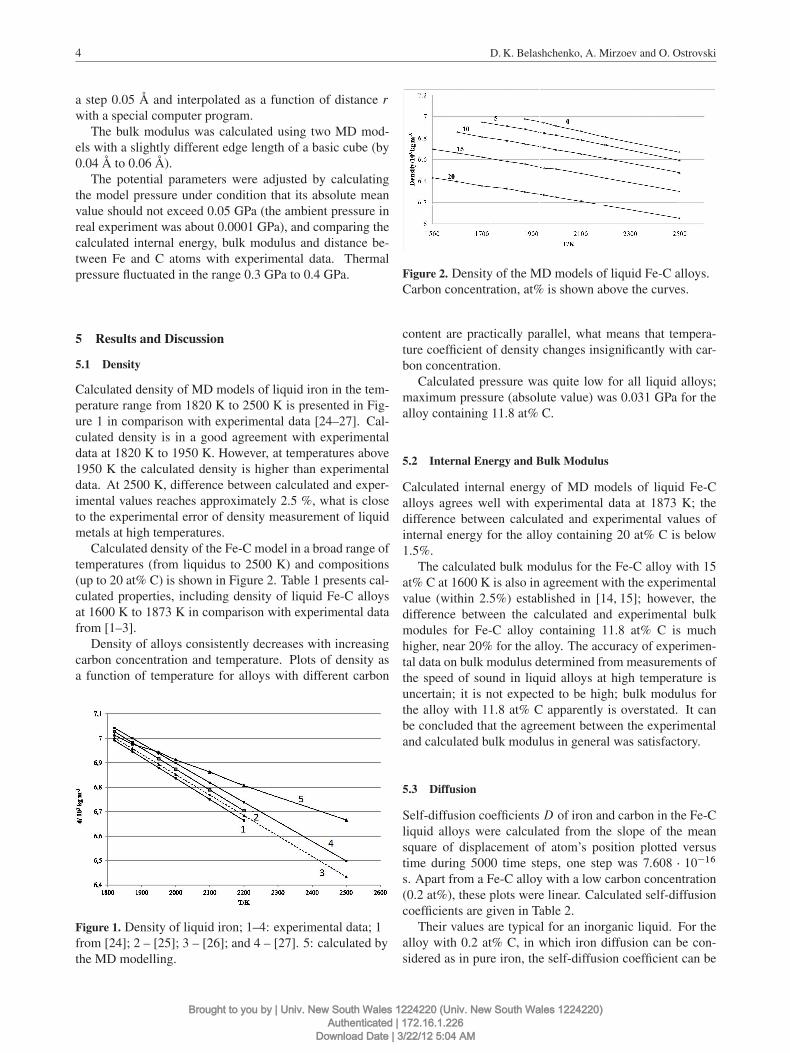
Calculated density of MD models of liquid iron in the tem-perature range from 1820 K to 2500 K is presented in Fig-ure 1 in comparison with experimental data [24–27]. Cal-culated density is in a good agreement with experimentaldata at 1820 K to 1950 K. However, at temperatures above1950 K the calculated density is higher than experimentaldata. At 2500 K, difference between calculated and exper-imental values reaches approximately 2.5 %, what is closeto the experimental error of density measurement of liquidmetals at high temperatures.
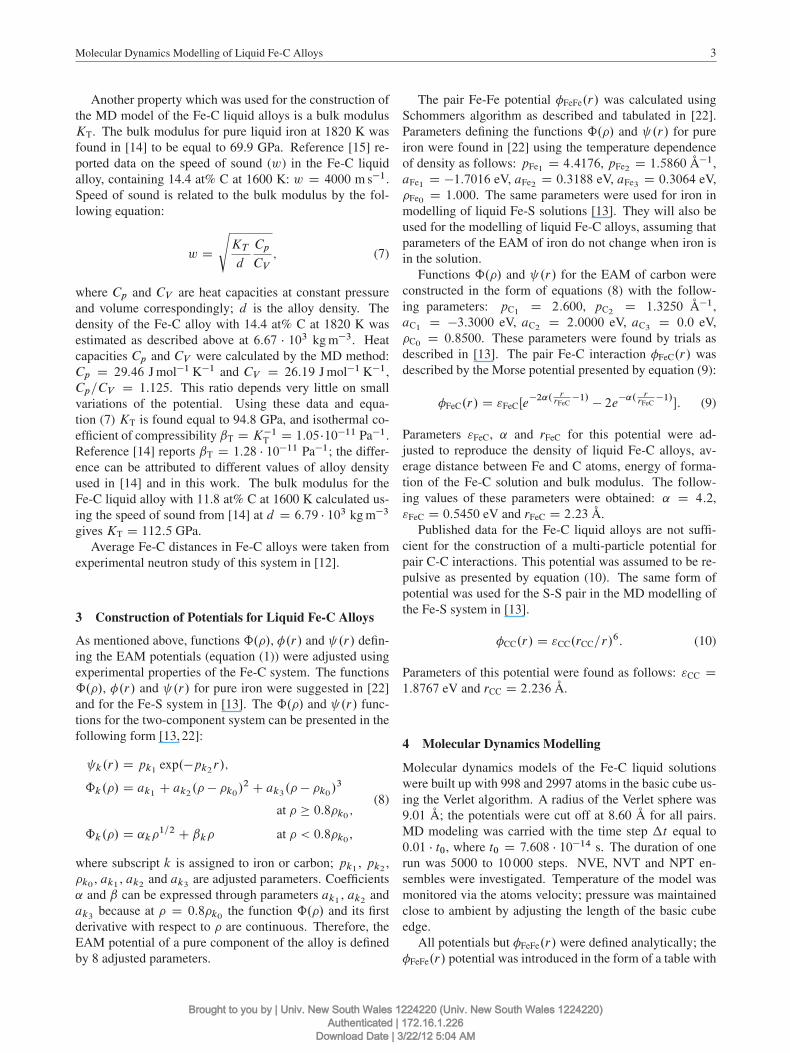
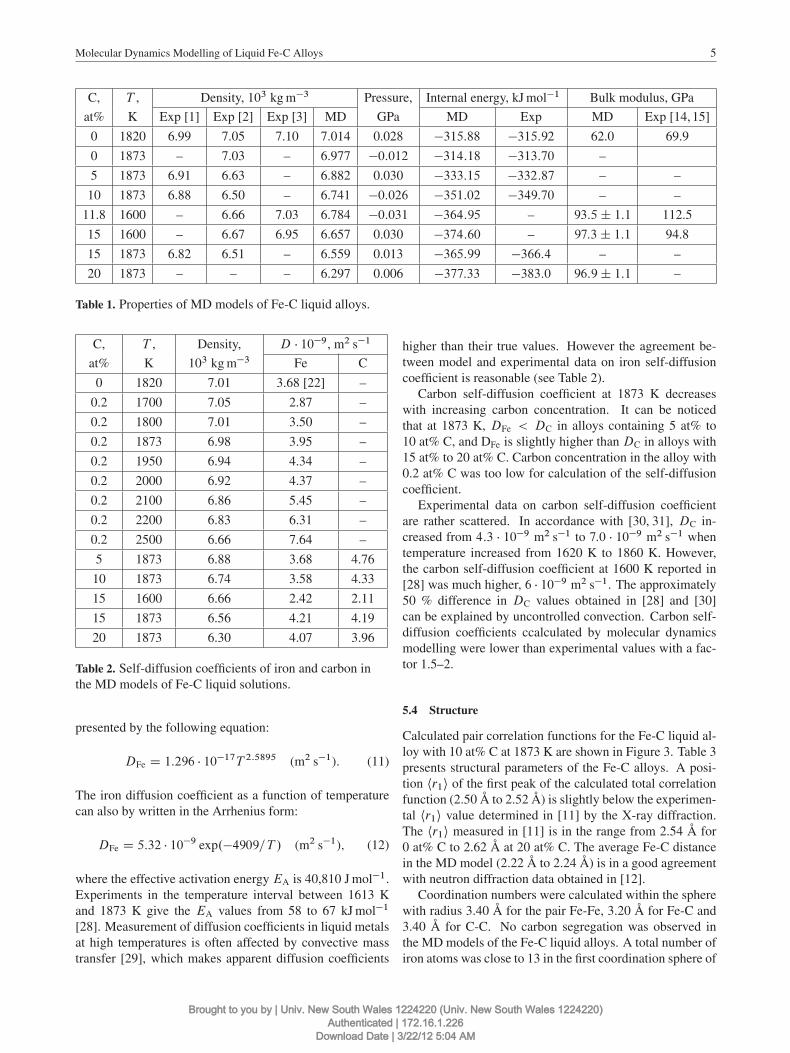
Calculated density of the Fe-C model in a broad range oftemperatures (from liquidus to 2500 K) and compositions(up to 20 at% C) is shown in Figure 2. Table 1 presents cal-culated properties, including density of liquid Fe-C alloysat 1600 K to 1873 K in comparison with experimental datafrom [1–3].
Density of alloys consistently decreases with increasingcarbon concentration and temperature. Plots of density asa function of temperature for alloys with different carbon
Figure 1. Density of liquid iron; 1–4: experimental data; 1from [24]; 2 – [25]; 3 – [26]; and 4 – [27]. 5: calculated bythe MD modelling.
Figure 2. Density of the MD models of liquid Fe-C alloys.Carbon concentration, at% is shown above the curves.
content are practically parallel, what means that tempera-ture coefficient of density changes insignificantly with car-bon concentration.
Calculated pressure was quite low for all liquid alloys;maximum pressure (absolute value) was 0.031 GPa for thealloy containing 11.8 at% C.
5.2 Internal Energy and Bulk Modulus
Calculated internal energy of MD models of liquid Fe-Calloys agrees well with experimental data at 1873 K; thedifference between calculated and experimental values ofinternal energy for the alloy containing 20 at% C is below1.5%.
The calculated bulk modulus for the Fe-C alloy with 15at% C at 1600 K is also in agreement with the experimentalvalue (within 2.5%) established in [14, 15]; however, thedifference between the calculated and experimental bulkmodules for Fe-C alloy containing 11.8 at% C is muchhigher, near 20% for the alloy. The accuracy of experimen-tal data on bulk modulus determined from measurements ofthe speed of sound in liquid alloys at high temperature isuncertain; it is not expected to be high; bulk modulus forthe alloy with 11.8 at% C apparently is overstated. It canbe concluded that the agreement between the experimentaland calculated bulk modulus in general was satisfactory.
5.3 Diffusion
Self-diffusion coefficientsD of iron and carbon in the Fe-Cliquid alloys were calculated from the slope of the meansquare of displacement of atom’s position plotted versustime during 5000 time steps, one step was 7:608 � 10�16
s. Apart from a Fe-C alloy with a low carbon concentration(0.2 at%), these plots were linear. Calculated self-diffusioncoefficients are given in Table 2.
Their values are typical for an inorganic liquid. For thealloy with 0.2 at% C, in which iron diffusion can be con-sidered as in pure iron, the self-diffusion coefficient can be
Brought to you by | Univ. New South Wales 1224220 (Univ. New South Wales 1224220)Authenticated | 172.16.1.226
Download Date | 3/22/12 5:04 AM
Molecular Dynamics Modelling of Liquid Fe-C Alloys 5
C, T , Density, 103 kg m�3 Pressure, Internal energy, kJ mol�1 Bulk modulus, GPa
at% K Exp [1] Exp [2] Exp [3] MD GPa MD Exp MD Exp [14, 15]
0 1820 6.99 7.05 7.10 7.014 0.028 �315:88 �315:92 62.0 69.9
0 1873 – 7.03 – 6.977 �0:012 �314:18 �313:70 –
5 1873 6.91 6.63 – 6.882 0.030 �333:15 �332:87 – –
10 1873 6.88 6.50 – 6.741 �0:026 �351:02 �349:70 – –
11.8 1600 – 6.66 7.03 6.784 �0:031 �364:95 – 93:5˙ 1:1 112.5
15 1600 – 6.67 6.95 6.657 0.030 �374:60 – 97:3˙ 1:1 94.8
15 1873 6.82 6.51 – 6.559 0.013 �365:99 �366:4 – –
20 1873 – – – 6.297 0.006 �377:33 �383:0 96:9˙ 1:1 –
Table 1. Properties of MD models of Fe-C liquid alloys.
C, T , Density, D � 10�9, m2 s�1
at% K 103 kg m�3 Fe C
0 1820 7.01 3.68 [22] –
0.2 1700 7.05 2.87 –
0.2 1800 7.01 3.50 –
0.2 1873 6.98 3.95 –
0.2 1950 6.94 4.34 –
0.2 2000 6.92 4.37 –
0.2 2100 6.86 5.45 –
0.2 2200 6.83 6.31 –
0.2 2500 6.66 7.64 –
5 1873 6.88 3.68 4.76
10 1873 6.74 3.58 4.33
15 1600 6.66 2.42 2.11
15 1873 6.56 4.21 4.19
20 1873 6.30 4.07 3.96
Table 2. Self-diffusion coefficients of iron and carbon inthe MD models of Fe-C liquid solutions.
presented by the following equation:
DFe D 1:296 � 10�17T 2:5895 (m2 s�1): (11)
The iron diffusion coefficient as a function of temperaturecan also by written in the Arrhenius form:
DFe D 5:32 � 10�9 exp.�4909=T / (m2 s�1); (12)
where the effective activation energy EA is 40,810 J mol�1.Experiments in the temperature interval between 1613 Kand 1873 K give the EA values from 58 to 67 kJ mol�1
[28]. Measurement of diffusion coefficients in liquid metalsat high temperatures is often affected by convective masstransfer [29], which makes apparent diffusion coefficients
higher than their true values. However the agreement be-tween model and experimental data on iron self-diffusioncoefficient is reasonable (see Table 2).
Carbon self-diffusion coefficient at 1873 K decreaseswith increasing carbon concentration. It can be noticedthat at 1873 K, DFe < DC in alloys containing 5 at% to10 at% C, and DFe is slightly higher than DC in alloys with15 at% to 20 at% C. Carbon concentration in the alloy with0.2 at% C was too low for calculation of the self-diffusioncoefficient.
Experimental data on carbon self-diffusion coefficientare rather scattered. In accordance with [30, 31], DC in-creased from 4:3 � 10�9 m2 s�1 to 7:0 � 10�9 m2 s�1 whentemperature increased from 1620 K to 1860 K. However,the carbon self-diffusion coefficient at 1600 K reported in[28] was much higher, 6 � 10�9 m2 s�1. The approximately50 % difference in DC values obtained in [28] and [30]can be explained by uncontrolled convection. Carbon self-diffusion coefficients ccalculated by molecular dynamicsmodelling were lower than experimental values with a fac-tor 1.5–2.
5.4 Structure
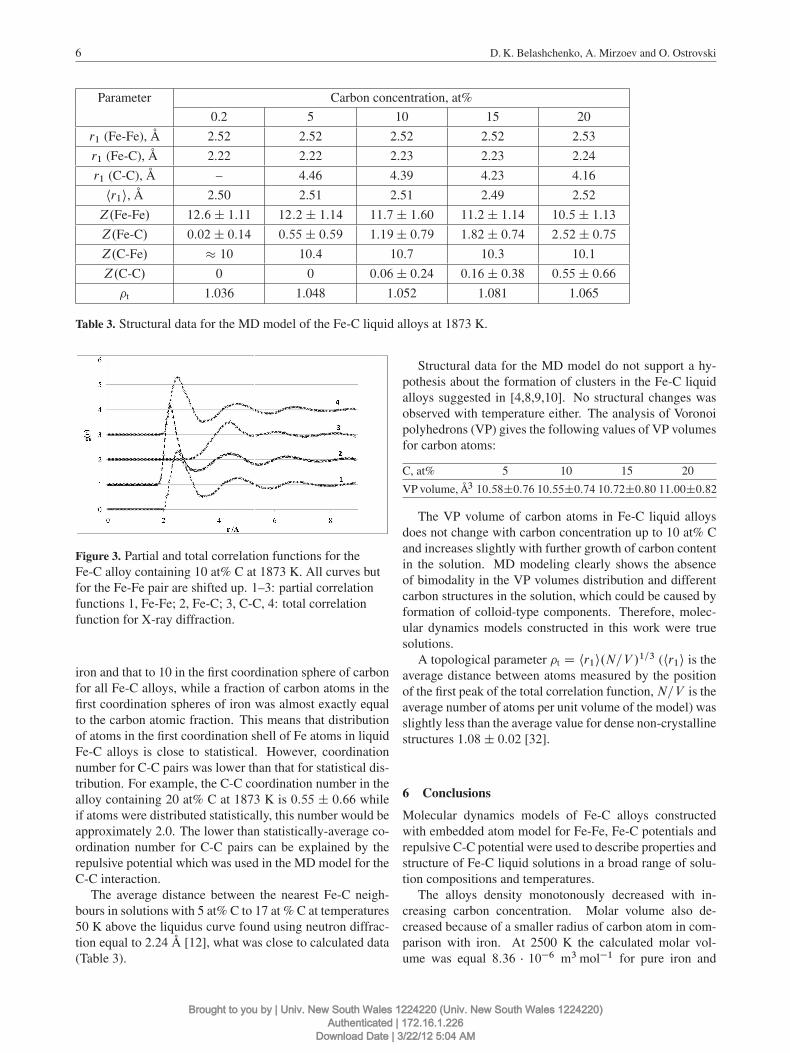
Calculated pair correlation functions for the Fe-C liquid al-loy with 10 at% C at 1873 K are shown in Figure 3. Table 3presents structural parameters of the Fe-C alloys. A posi-tion hr1i of the first peak of the calculated total correlationfunction (2.50 Å to 2.52 Å) is slightly below the experimen-tal hr1i value determined in [11] by the X-ray diffraction.The hr1i measured in [11] is in the range from 2.54 Å for0 at% C to 2.62 Å at 20 at% C. The average Fe-C distancein the MD model (2.22 Å to 2.24 Å) is in a good agreementwith neutron diffraction data obtained in [12].
Coordination numbers were calculated within the spherewith radius 3.40 Å for the pair Fe-Fe, 3.20 Å for Fe-C and3.40 Å for C-C. No carbon segregation was observed inthe MD models of the Fe-C liquid alloys. A total number ofiron atoms was close to 13 in the first coordination sphere of
Brought to you by | Univ. New South Wales 1224220 (Univ. New South Wales 1224220)Authenticated | 172.16.1.226
Download Date | 3/22/12 5:04 AM
6 D. K. Belashchenko, A. Mirzoev and O. Ostrovski
Parameter Carbon concentration, at%
0.2 5 10 15 20
r1 (Fe-Fe), Å 2.52 2.52 2.52 2.52 2.53
r1 (Fe-C), Å 2.22 2.22 2.23 2.23 2.24
r1 (C-C), Å – 4.46 4.39 4.23 4.16
hr1i, Å 2.50 2.51 2.51 2.49 2.52
Z.Fe-Fe/ 12:6˙ 1:11 12:2˙ 1:14 11:7˙ 1:60 11:2˙ 1:14 10:5˙ 1:13
Z.Fe-C/ 0:02˙ 0:14 0:55˙ 0:59 1:19˙ 0:79 1:82˙ 0:74 2:52˙ 0:75
Z.C-Fe/ � 10 10:4 10:7 10:3 10:1
Z.C-C/ 0 0 0:06˙ 0:24 0:16˙ 0:38 0:55˙ 0:66
�t 1.036 1.048 1.052 1.081 1.065
Table 3. Structural data for the MD model of the Fe-C liquid alloys at 1873 K.
Figure 3. Partial and total correlation functions for theFe-C alloy containing 10 at% C at 1873 K. All curves butfor the Fe-Fe pair are shifted up. 1–3: partial correlationfunctions 1, Fe-Fe; 2, Fe-C; 3, C-C, 4: total correlationfunction for X-ray diffraction.
iron and that to 10 in the first coordination sphere of carbonfor all Fe-C alloys, while a fraction of carbon atoms in thefirst coordination spheres of iron was almost exactly equalto the carbon atomic fraction. This means that distributionof atoms in the first coordination shell of Fe atoms in liquidFe-C alloys is close to statistical. However, coordinationnumber for C-C pairs was lower than that for statistical dis-tribution. For example, the C-C coordination number in thealloy containing 20 at% C at 1873 K is 0:55 ˙ 0:66 whileif atoms were distributed statistically, this number would beapproximately 2.0. The lower than statistically-average co-ordination number for C-C pairs can be explained by therepulsive potential which was used in the MD model for theC-C interaction.
The average distance between the nearest Fe-C neigh-bours in solutions with 5 at% C to 17 at % C at temperatures50 K above the liquidus curve found using neutron diffrac-tion equal to 2.24 Å [12], what was close to calculated data(Table 3).
Structural data for the MD model do not support a hy-pothesis about the formation of clusters in the Fe-C liquidalloys suggested in [4,8,9,10]. No structural changes wasobserved with temperature either. The analysis of Voronoipolyhedrons (VP) gives the following values of VP volumesfor carbon atoms:
C, at% 5 10 15 20
VP volume, Å3 10:58˙0:76 10:55˙0:74 10:72˙0:80 11:00˙0:82
The VP volume of carbon atoms in Fe-C liquid alloysdoes not change with carbon concentration up to 10 at% Cand increases slightly with further growth of carbon contentin the solution. MD modeling clearly shows the absenceof bimodality in the VP volumes distribution and differentcarbon structures in the solution, which could be caused byformation of colloid-type components. Therefore, molec-ular dynamics models constructed in this work were truesolutions.
A topological parameter �t D hr1i.N=V /1=3 (hr1i is the
average distance between atoms measured by the positionof the first peak of the total correlation function,N=V is theaverage number of atoms per unit volume of the model) wasslightly less than the average value for dense non-crystallinestructures 1:08˙ 0:02 [32].
6 Conclusions
Molecular dynamics models of Fe-C alloys constructedwith embedded atom model for Fe-Fe, Fe-C potentials andrepulsive C-C potential were used to describe properties andstructure of Fe-C liquid solutions in a broad range of solu-tion compositions and temperatures.
The alloys density monotonously decreased with in-creasing carbon concentration. Molar volume also de-creased because of a smaller radius of carbon atom in com-parison with iron. At 2500 K the calculated molar vol-ume was equal 8:36 � 10�6 m3 mol�1 for pure iron and
Brought to you by | Univ. New South Wales 1224220 (Univ. New South Wales 1224220)Authenticated | 172.16.1.226
Download Date | 3/22/12 5:04 AM
Molecular Dynamics Modelling of Liquid Fe-C Alloys 7
7:77 � 10�6 m3 mol�1 for a melt with 20 at% C. Calculatedmodel’s density at 1850 K to 1950 K laid between data ob-tained in [1, 3] and [2].
The MD model’s bulk modulus was in a reasonableagreement with experimental data determined from thespeed of sound in liquid Fe-C alloys.
Carbon self-diffusion coefficient in MD models of Fe-Calloys at 1873 K decreased with increasing carbon concen-tration. Calculated self-diffusion coefficient for iron in theFe-C alloy with 0.2 at% C agreed with experimental valuefor pure iron. Calculated self-diffusion coefficients for car-bon were lower than experimental data with a factor 1.5to 2, what can be attributed to convection in the measure-ment of diffusion.
A distance between Fe-Fe and Fe-C atoms and the sumof coordination numbers for pairs Fe-Fe and Fe-C changeinsignificantly with carbon concentration. The repulsive in-teraction between C-C atoms resulted in low C-C coordi-nation number. Properties and structure of the MD modelsof Fe-C liquid alloys were typical for true solutions with noindication on clustering.
Acknowledgments
Financial support for this work was provided by the Rus-sian fund of basic research (grants 09-03-00069-a, 09-03-00584-a).
References
[1] G. V. Tyagunov, P. S. Popel and N. S. Kosilov, IzvestiyaAcademii Nauk SSSR. Metaly, 5 (1981), 55–58 (in Russian).
[2] A. A. Kuprijanov and S. I. Filippov, Izvestiya Vuzov. Cher-naya Metallurgiya, 9 (1968), 10–15 (in Russian).
[3] I. Jimbo and A. W. Cramb, Metall. Mater. Trans. B, 24B(1993), 5–10.
[4] A. A. Vertman and A. M. Samarin, Properties of FerrousMetals Melts, Science, Moscow, 1969 (in Russian).
[5] B. A. Baum, G. A. Khasin, G. V. Tyagunov and E. A. Kli-menkov, Liquid Steel, Metallurgiya, Moscow, 1984 (in Rus-sian).
[6] T. Iida and R. I. L. Guthrie, The Physical Properties of LiquidMetals, Oxford Science Publications, I988.
[7] O. I. Ostrovski, V. A. Grigoryan and A. F. Vishkarev, Proper-ties of Liquid Metals, Metallurgiya, Moscow, 1988 (in Rus-sian).
[8] I. V. Salli, Physical Basics of the Formation of Alloys Struc-ture, Metallurgiya, Moscow, 1963 (in Russian).
[9] V. M. Zalkin and V. S. Kraposhin, Fizicheskaya Metallurgiyai Termicheskaya Obrabotka, 1 (2010), 15–18 (in Russian).
[10] A. S. Aronin, V. S. Kraposhin and K. V. Shakhlevich, FizikaMetalov, 12 (1990), 96–101 (in Russian).
[11] E. A. Pastukhov, N. A. Vatolin and V. L. Lisin, DiffractionStudy of Structure of High-Temperature Melts, Institute ofMetallurgy Ural Branch RAS, Yekaterinburg, 2003 (in Rus-sian).
[12] M. Weber and S. Steeb, Z. Naturforsch, 33a (1978), 799–807.
[13] D. K. Belashchenko, O. L. Kuskov and O. I. Ostrovski, Inor-ganic Materials, 43 (2007), 998–1009.
[14] S. I. Filippov, N. V. Kazakov and L. A. Pronin, Izvestiya Vu-zov. Chernaya Metallurgiya, 3 (1966), 8–14 (in Russian).
[15] L. A. Pronin, N. V. Kazakov and S. I. Filippov, Izvestiya Vu-zov. Chernaya Metallurgiya, 5 (1964), 12–16 (in Russian).
[16] P. P. Arsent’ev and L. A. Koledov, Metallic Melts and TheirProperties, Metallurgiya: Moscow, 1976 (in Russian).
[17] R. Hultgren, P. D. Desai, D. T. Hawkins, M. Gleiser andK. K. Kelley, Selected Values of the Thermodynamic Prop-erties of Binary Alloys, ASM Metals Park, Ohio, 1973.
[18] J. Chipman, Met. Transactions, 1 (1970), 2163–2168.[19] P. A. Gustafson, Scand. J. Metallurgy, 14, pp. 259–267
(1985).[20] J. F. Elliott, M. Gleiser and V. Ramakrishna, Thermochem-
istry for Steelmaking. Thermodynamic and Transport Prop-erties, Addison-Wesley Publ., NY, 1969.
[21] V. A. Grigoryan, L. N. Belyanchikov and A.Ya. Stomakhin,Theoretical Basis of the Electrical Steel Melting Processes,Metallurgiya, Moscow, 1987
[22] D. K. Belashchenko, Russ. J. Phys. Chem., 80 (2006), 758–768.
[23] www.webelements.com[24] F. N. Tavadze, I. A. Bairamashvili and D. V. Khantadze,
Surface Phenomena in Melts and Forming Solid Phases,Kabardino-Balkarsk Kniga, Nalchik, 1965, 376–382.
[25] T. Saito, J. Shiraishi and Y. Sakuma: Trans. Iron and SteelInst. Japan, 9 (1969), 118–126.
[26] T. Saito and Y. Sakuma, J. Japan Inst. Metals, 31 (1967),1140–1148.
[27] E. V. Krinochkin, K. T. Kurochkin and P. V. Umrikhin,Izvestiya Academii Nauk SSSR. Metaly, 5 (1971), 67–71 (inRussian).
[28] J. B. Edwards, E. E. Hucke and J. J. Martin, Metals andMater. V.2 Metallurg. Reviews, 120 (1968), 1–13.
[29] D. K. Belashchenko, Transport Phenomena in liquid Met-als and Semiconductors, Atomizdat, Moscow, 1970 (in Rus-sian).
[30] D. W. Morgan and J. A. Kitchener, Trans. Faraday Soc.,50 (1954), 51–60.
[31] M. Hillert and N. Lange, J. Iron and Steel Inst., 1965, 203(1965), 273–274.
[32] D. K. Belashchenko, Computer Modeling of Liquid andAmorphous Metals; Moscow Institute of Steel and Alloys,Moscow, 2005 (in Russian).
Brought to you by | Univ. New South Wales 1224220 (Univ. New South Wales 1224220)Authenticated | 172.16.1.226
Download Date | 3/22/12 5:04 AM
Copyright © 2022 FDOKUMEN