Molecular characterization and the effect of salinity on cyanobacterial diversity in the rice fields...
17
BioMed Central Page 1 of 17 (page number not for citation purposes) Saline Systems Open Access Research Molecular characterization and the effect of salinity on cyanobacterial diversity in the rice fields of Eastern Uttar Pradesh, India Ashish Kumar Srivastava 1 , Poonam Bhargava 2 , Arvind Kumar 2 , Lal Chand Rai* 2 and Brett A Neilan* 3 Address: 1 Department of Botany, School of Life Sciences, Mizoram University, Tanhril Campus, Aizawl-796009, India, 2 Molecular Biology Section, Center of Advanced Study in Botany, Banaras Hindu University, Varanasi-221005, India and 3 School of Biotechnology and Biomolecular Science, The University of New South Wales, Sydney, NSW 2052, Australia Email: Ashish Kumar Srivastava - [email protected]; Poonam Bhargava - [email protected]; Arvind Kumar - [email protected]; Lal Chand Rai* - [email protected]; Brett A Neilan* - [email protected] * Corresponding authors Abstract Background: Salinity is known to affect almost half of the world's irrigated lands, especially rice fields. Furthermore, cyanobacteria, one of the critical inhabitants of rice fields have been characterized at molecular level from many different geographical locations. This study, for the first time, has examined the molecular diversity of cyanobacteria inhabiting Indian rice fields which experience various levels of salinity. Results: Ten physicochemical parameters were analyzed for samples collected from twenty experimental sites. Electrical conductivity data were used to classify the soils and to investigate relationship between soil salinity and cyanobacterial diversity. The cyanobacterial communities were analyzed using semi-nested 16S rRNA gene PCR and denaturing gradient gel electrophoresis. Out of 51 DGGE bands selected for sequencing only 31 which showed difference in sequences were subjected to further analysis. BLAST analysis revealed highest similarity for twenty nine of the sequences with cyanobacteria, and the other two to plant plastids. Clusters obtained based on morphological and molecular attributes of cyanobacteria were correlated to soil salinity. Among six different clades, clades 1, 2, 4 and 6 contained cyanobacteria inhabiting normal or low saline (having EC < 4.0 ds m -1 ) to (high) saline soils (having EC > 4.0 ds m -1 ), however, clade 5 represented the cyanobacteria inhabiting only saline soils. Whilst, clade 3 contained cyanobacteria from normal soils. The presence of DGGE band corresponding to Aulosira strains were present in large number of soil indicating its wide distribution over a range of salinities, as were Nostoc, Anabaena, and Hapalosiphon although to a lesser extent in the sites studied. Conclusion: Low salinity favored the presence of heterocystous cyanobacteria, while very high salinity mainly supported the growth of non-heterocystous genera. High nitrogen content in the low salt soils is proposed to be a result of reduced ammonia volatilization compared to the high salt soils. Although many environmental factors could potentially determine the microbial community present in these multidimensional ecosystems, changes in the diversity of cyanobacteria in rice fields was correlated to salinity. Published: 6 April 2009 Saline Systems 2009, 5:4 doi:10.1186/1746-1448-5-4 Received: 13 January 2009 Accepted: 6 April 2009 This article is available from: http://www.salinesystems.org/content/5/1/4 © 2009 Srivastava et al; licensee BioMed Central Ltd. This is an Open Access article distributed under the terms of the Creative Commons Attribution License (http://creativecommons.org/licenses/by/2.0 ), which permits unrestricted use, distribution, and reproduction in any medium, provided the original work is properly cited.
-
Upload
independent -
Category
Documents
-
view
0 -
download
0
Transcript of Molecular characterization and the effect of salinity on cyanobacterial diversity in the rice fields...

BioMed CentralSaline Systems
ss
Open AcceResearchMolecular characterization and the effect of salinity on cyanobacterial diversity in the rice fields of Eastern Uttar Pradesh, IndiaAshish Kumar Srivastava1, Poonam Bhargava2, Arvind Kumar2, Lal Chand Rai*2 and Brett A Neilan*3Address: 1Department of Botany, School of Life Sciences, Mizoram University, Tanhril Campus, Aizawl-796009, India, 2Molecular Biology Section, Center of Advanced Study in Botany, Banaras Hindu University, Varanasi-221005, India and 3School of Biotechnology and Biomolecular Science, The University of New South Wales, Sydney, NSW 2052, Australia
Email: Ashish Kumar Srivastava - [email protected]; Poonam Bhargava - [email protected]; Arvind Kumar - [email protected]; Lal Chand Rai* - [email protected]; Brett A Neilan* - [email protected]
* Corresponding authors
AbstractBackground: Salinity is known to affect almost half of the world's irrigated lands, especially ricefields. Furthermore, cyanobacteria, one of the critical inhabitants of rice fields have beencharacterized at molecular level from many different geographical locations. This study, for the firsttime, has examined the molecular diversity of cyanobacteria inhabiting Indian rice fields whichexperience various levels of salinity.
Results: Ten physicochemical parameters were analyzed for samples collected from twentyexperimental sites. Electrical conductivity data were used to classify the soils and to investigaterelationship between soil salinity and cyanobacterial diversity. The cyanobacterial communitieswere analyzed using semi-nested 16S rRNA gene PCR and denaturing gradient gel electrophoresis.Out of 51 DGGE bands selected for sequencing only 31 which showed difference in sequenceswere subjected to further analysis. BLAST analysis revealed highest similarity for twenty nine of thesequences with cyanobacteria, and the other two to plant plastids. Clusters obtained based onmorphological and molecular attributes of cyanobacteria were correlated to soil salinity. Amongsix different clades, clades 1, 2, 4 and 6 contained cyanobacteria inhabiting normal or low saline(having EC < 4.0 ds m-1) to (high) saline soils (having EC > 4.0 ds m-1), however, clade 5 representedthe cyanobacteria inhabiting only saline soils. Whilst, clade 3 contained cyanobacteria from normalsoils. The presence of DGGE band corresponding to Aulosira strains were present in large numberof soil indicating its wide distribution over a range of salinities, as were Nostoc, Anabaena, andHapalosiphon although to a lesser extent in the sites studied.
Conclusion: Low salinity favored the presence of heterocystous cyanobacteria, while very highsalinity mainly supported the growth of non-heterocystous genera. High nitrogen content in thelow salt soils is proposed to be a result of reduced ammonia volatilization compared to the highsalt soils. Although many environmental factors could potentially determine the microbialcommunity present in these multidimensional ecosystems, changes in the diversity of cyanobacteriain rice fields was correlated to salinity.
Published: 6 April 2009
Saline Systems 2009, 5:4 doi:10.1186/1746-1448-5-4
Received: 13 January 2009Accepted: 6 April 2009
This article is available from: http://www.salinesystems.org/content/5/1/4
© 2009 Srivastava et al; licensee BioMed Central Ltd. This is an Open Access article distributed under the terms of the Creative Commons Attribution License (http://creativecommons.org/licenses/by/2.0), which permits unrestricted use, distribution, and reproduction in any medium, provided the original work is properly cited.
Page 1 of 17(page number not for citation purposes)
Saline Systems 2009, 5:4 http://www.salinesystems.org/content/5/1/4
BackgroundThe Indian agriculture is suffering with many man-madeproblems like canal irrigation, pesticide and chemical fer-tilization application. However, the former is responsiblefor salt accumulation in the soil which is further expand-ing due to water-logging in paddy fields. Salinization ispredicted to result in 30% of farmable land loss globallywithin the next 25 years, and up to 50% by the year 2050[1]. In developing countries like India and China, theproblem could be more serious due to the increasingdemand for rice as a staple food. If water-logged condi-tions prevail for lengthy durations salinization of the soiloccurs and, in India, this is commonly known as the for-mation of Usar land [2]. High salt concentrations lead toa decline in soil fertility by adversely affecting the soilmicrobial flora, including nitrogen-fixing cyanobacteriaand therefore further decreasing rice productivity.
Cyanobacteria, the ancient oxygen-evolving photoau-totrophs, are the dominant microbial inhabitants of ricefields. Members of the orders Nostocales and Stigonemat-ales assume a special significance in this environment [3].Salinity adversely affects photosynthesis and thereforeproductivity [4], the functioning of plasma membranes[5], ionic balance in the cells [6] and protein profiles [7,8]of some phototrophs including cyanobacteria. However,salinity does not affect all cyanobacteria to the sameextent due to their morphological and genomic diversity[9,10], and therefore the distribution of cyanobacterialcommunities in natural habitats is not uniform. The adap-tive ability of cyanobacteria to salinity makes them thesubject of intense biochemical and ecological investiga-tion [11].
The classical methods for cyanobacterial identificationand community assessment involve microscopic exami-nation [3,12,13]. This assessment has, however, been crit-icized on the grounds that morphology can varyconsiderably in response to fluctuations in environmentalconditions [14]. In addition, the perennating bodies ofcyanobacteria such as hormogonia, akinetes and hetero-cysts may be difficult to characterize by microscopy andthus the actual diversity can be underestimated [15]. Inview of the above, cyanobacterial diversity assessmentsand community analysis should be investigated by micro-scopic observation supplemented with a molecular taxon-omy. Therefore, cyanobacterial diversity assessmentsusing molecular tools have been widely applied [16]. Theapplication of denaturing gradient gel electrophoresis(DGGE) along with PCR for studying natural cyanobacte-rial assemblages has increased our understanding of theircomplexity in environmental samples [17]. Among thevarious gene sequences used to assess cyanobacterial bio-diversity, 16S rRNA gene has been applied most often[16].
Cyanobacterial diversity has been assessed from a varietyof geographical locations, including the Colorado plateau[18,19], exposed dolomite in central Switzerland [20], hotsprings [21], the McMurdo Ice Self [22], and Southern Bal-tic Sea [23] using a combination of 16S rRNA gene PCRand DGGE. A considerable number of studies have beendone on DGGE based identification and phylogeneticcharacterization of toxic cyanobacteria [24-26]. In con-trast to above, cyanobacteria have been characterized onlyat morphological level in rice fields of India [27,28],Bangladesh [29], Chile [30], Pakistan [31], Korea [32] andUruguay [33]. However, the work of Song et al. [34] con-stitutes the only known report on the biodiversity assess-ment of cyanobacteria in rice paddy fields (Fujian, China)during September 2001 to January 2002 using moleculartools.
Despite the considerable negative impact of salinity onphysiology of pure cultured cyanobacterium as observedunder laboratory conditions, nothing is known regardingits effect on the biodiversity of cyanobacteria in rice fieldshaving different salt levels. Thus there is a need to exam-ine how salinity-induced changes among other physico-chemical properties of soil affect the distribution ofcyanobacteria in paddy fields. In view of the reports byStal [35,10] that cyanobacteria have a remarkable yet var-ying flexibility to adapt to a wide range of environmentalconditions, we propose that the resilient physiologies ofcertain cyanobacteria, including exopolysaccharide pro-duction, afford resistance to higher salinity compared tostrains with relatively simpler morphologies. Further,high salinity inhibits ammonia volatilization [36], andthis would result in soils with high nitrogen content andfavor the proliferation of non-heterocystous cyanobacte-rial genera. This study was undertaken to provide firsthand data on cyanobacterial diversity using PCR-DGGE,and correlate it to different salt levels of soil to investigatesalinity-induced changes in the distribution of cyanobac-teria in Indian rice fields. Further, how far the salinityaffects the agriculturally important cyanobacteria was alsoexamined.
Results and discussionPhysicochemical analyses of soilEight different parameters, Na+, K+, Ca2+, Mg2+, Na+/K+
ratio, SAR, EC and pH were taken into consideration forthe measurement of salinity levels in soil. In addition tothis, available phosphorus and total nitrogen were alsoestimated to determine the nutritional status of the soil.PCA analysis was performed to correlate the soil proper-ties, especially those related to salinity, with the cyanobac-terial diversity. Soil properties change significantly due tosalinity in rice fields, which can ultimately determine bio-diversity and hence productivity. The PCA analysisrevealed two principal components (PC1 and PC2) with
Page 2 of 17(page number not for citation purposes)
Saline Systems 2009, 5:4 http://www.salinesystems.org/content/5/1/4
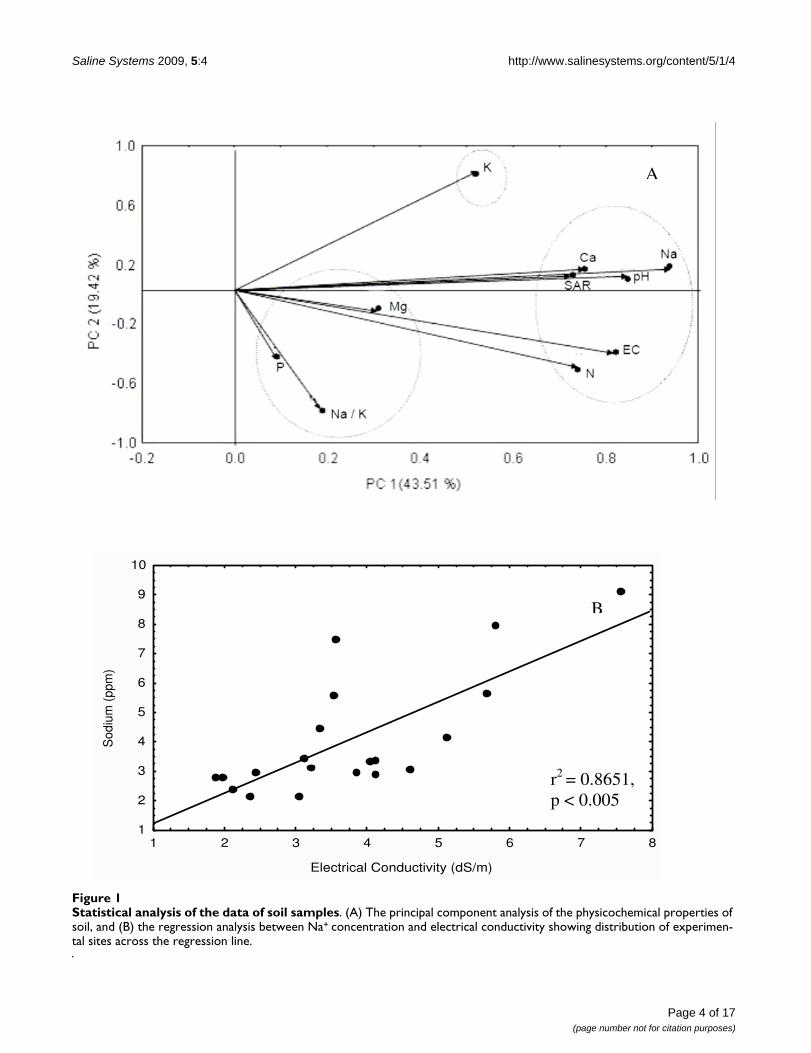
percentage variances of 43.51 and 19.42, respectively. Theabove-mentioned ten parameters distributed into threeclusters (Figure 1A): (i) phosphorus, Na+/K+ ratio andMg2+, (ii) K+ alone, and (iii) the remaining six parameters.This suggests that there are three major physicochemicalvariables that could significantly affect the cyanobacterialdiversity in these rice fields. Among the different cationsexamined, Na+, which constituted the largest fraction ofboth soluble and exchangeable ions in the soil, had themost obvious influence on cyanobacterial distribution(indicated by the longest distance from the point of originin the PCA plot) [37]. This result is reflected in the obser-vation of Onkware [38] who observed deleterious effectsof soil salinity (mainly Na+) on plant diversity and distri-bution in the Loburu delta of Kenya.
The sampling sites showed a wide range of Na+ concentra-tions (2.12 – 9.15 ppm) and EC (1.89 – 7.55 ds m-1),thereby indicating a saline-sodic nature of the soils [39].However, the highest EC (7.55 ds m-1) and Na+ (9.15ppm) were observed in the soil of Rauri. In contrast tothis, the soils of Madhopur and Parasurampur had thelowest EC (1.89 ds m-1) and Na+ (2.12 ppm) levels,respectively. The regression analysis between Na+ and EC(P < 0.05) also showed a wide distribution of soil samples(Figure 1B). Further, K+ content in saline soils was verylow; lowest in the Rajatalab soil samples. This probablycontributes to high Na+/K+ and thus the sparse populationof cyanobacteria observed since K+ is essential for mainte-nance of cellular homeostasis, cell turgor and protein syn-thesis [40]. K+ also plays a vital role in extremeenvironments, both as an extracellular signal and as anintracellular metabolic regulator [40] essential for growthand metabolism. Microscopically, the lower Na+/K+ ratiowas shown to support luxuriant growth of cyanobacterialmats. Although regression analysis revealed that cyano-bacterial diversity decreased with an increase in Na+/K+
ratio, a significant correlation between the number ofcyanobacterial phylotypes (in terms of DGGE bands) andNa+/K+ ratio was not confirmed. This result is in contrastto that reported by Parker et al. [41] who demonstrated K+
toxicity to Microcystis in natural ponds. The soil of Makaraalso had a low Na+/K+ ratio but was associated with asparse cyanobacterial population, however, this could beattributed to a high pH in this case.
A high SAR recorded for these soils (Table 1), ensues lim-itation of Ca2+ and Mg2+ due to Na+-induced displacementof these cations [42], which may be responsible for thincyanobacterial population in these soils [39]. A relativelylow concentration of Ca2+ and very high Mg2+ content ofthe soil from Jaddopur was due to the Mg2+ induced defi-ciency of Ca2+ [42]. In addition, the pH was found torange from neutral (Anei and Parsurampur, 7.40) tohighly alkaline (Rauri, 9.04). A significant negative corre-
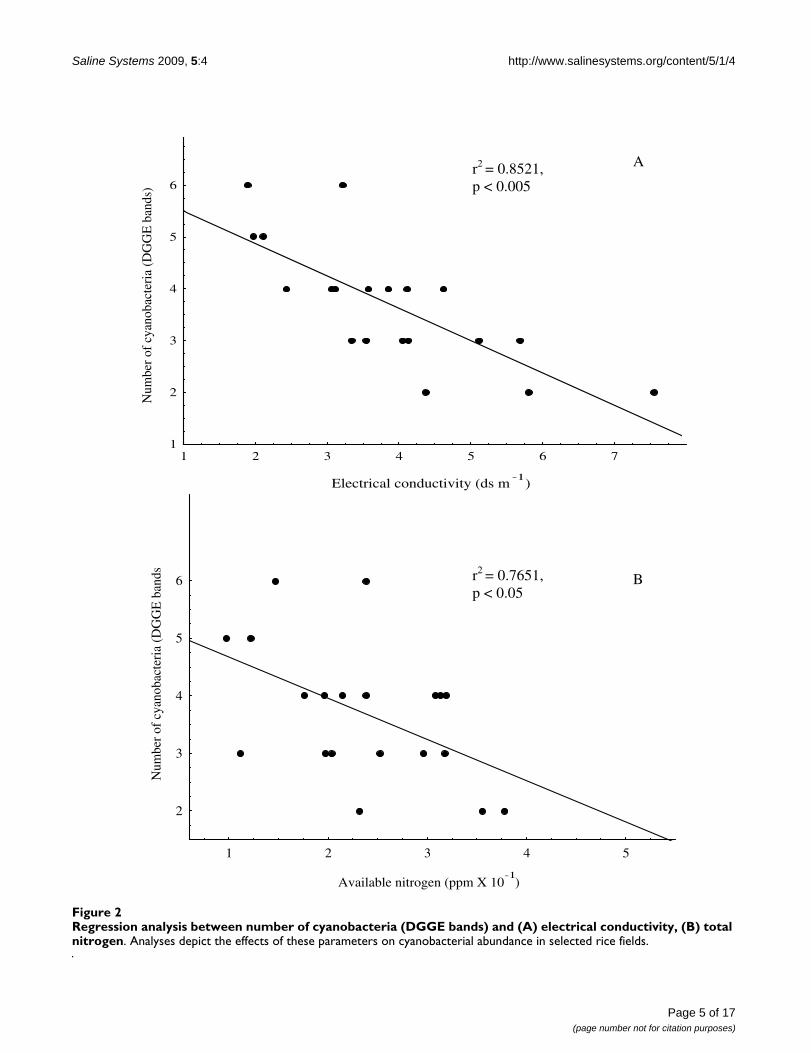
lation (P < 0.05) observed between pH and the number ofcyanobacteria in every soil sample, reflects the optimal pHfor cyanobacterial growth at 7.5. This is supported by thefact that most diverse cyanobacterial group of this study,Anabaena and Nostoc prefer neutral to slightly alkaline soil[27]. Further, the concentration of available phosphorusin the soils varied between 13.65 (Chauki) and 103.71ppm (Parsurampur). This fluctuation in the availability ofphosphorus may also be due to the relative presence ofmonovalent (Na+ and K+) and divalent (Ca2+ and Mg2+)cations since the former are responsible for soluble andthe latter for insoluble phosphorus. However, the regres-sion analysis between available phosphorus and cyano-bacterial populations does not demonstrate anysignificant relation. This can be due to the fact that 1.0ppm available phosphorus has been reported to be suffi-cient for the growth of plants [43,44]. In contrast to this,available nitrogen was found to be negatively correlated(P < 0.05) with number of cyanobacteria (Figure 2B). Thiscan be explained in the light of the observation of Fernán-dez-Valiente et al. [45] who demonstrated inhibitoryeffect of nitrogen fertilizers on the growth of nitrogen-fix-ing cyanobacteria in paddy fields. Since the studied paddyfields have high diversity and population of nitrogen-fix-ing cyanobacteria, salinity-induced increase in availablenitrogen [36] may eliminate their population. The posi-tive correlation between available nitrogen with EC, Na+
content, pH and SAR (P < 0.05) finds support with theobservation of El-Karim et al. [36] that nitrogen availabil-ity in saline soil depends on EC, Na+ and Ca2+ content vis-a-vis SAR and pH.
EC, the most appropriate parameter to characterize soilsalinity [46], was employed to classify the soil samplesinto two categories, normal (hereafter low) (< 4.0 ds m-1)and saline (hereafter high salinity) (> 4.0 ds m-1) soil [39].This classification divided the sample soils into the fol-lowing: (i) low salinity: Anei, Bardah, Bakesh, BHU, Jad-dopur, Kataka, Madhopur, Maharupur, Makara,Misirpura, and Phootia, and (ii) high salinity: Aswania,Bithwal, Chauki, Kartihan, Parsurampur, Rajatalab, Rauri,Sewapuri and Teduababa. The regression analysis showeda significant negative correlation (P < 0.05) between thecyanobacterial population and EC (Figure 2A). Further,the influence of EC on cyanobacterial population wasfound highest among other parameters as reflected by ahigh r value (0.75) in regression analysis.
Microscopic observation of cyanobacterial communityMicroscopic observation of the samples revealed the pres-ence of diverse forms of cyanobacteria with most belong-ing to the order Nostocales. Cyanobacterial communitiesof rice fields were composed of the morphologically-defined genera Anabaena, Nostoc, Aulosira, Cylindrosper-mum, Gloeotrichia, Rivularia and Tolypothrix of the order
Page 3 of 17(page number not for citation purposes)
Saline Systems 2009, 5:4 http://www.salinesystems.org/content/5/1/4
Page 4 of 17(page number not for citation purposes)
Statistical analysis of the data of soil samplesFigure 1Statistical analysis of the data of soil samples. (A) The principal component analysis of the physicochemical properties of soil, and (B) the regression analysis between Na+ concentration and electrical conductivity showing distribution of experimen-tal sites across the regression line.
A
Electrical Conductivity (dS/m)
Sod
ium
(pp
m)
1
2
3
4
5
6
7
8
9
10
1 2 3 4 5 6 7 8
r2 = 0.8651, p < 0.005
B
Saline Systems 2009, 5:4 http://www.salinesystems.org/content/5/1/4
Page 5 of 17(page number not for citation purposes)
Regression analysis between number of cyanobacteria (DGGE bands) and (A) electrical conductivity, (B) total nitrogenFigure 2Regression analysis between number of cyanobacteria (DGGE bands) and (A) electrical conductivity, (B) total nitrogen. Analyses depict the effects of these parameters on cyanobacterial abundance in selected rice fields.
Electrical conductivity (ds m-1
)
Num
ber
of c
yano
bact
eria
(D
GG
E b
ands
)
1
2
3
4
5
6
1 2 3 4 5 6 7
Ar2 = 0.8521, p < 0.005
Available nitrogen (ppm X 10-1
)
Num
ber
of c
yano
bact
eria
(D
GG
E b
ands
)
2
3
4
5
6
1 2 3 4 5
r2 = 0.7651, p < 0.05
B
Saline Systems 2009, 5:4 http://www.salinesystems.org/content/5/1/4
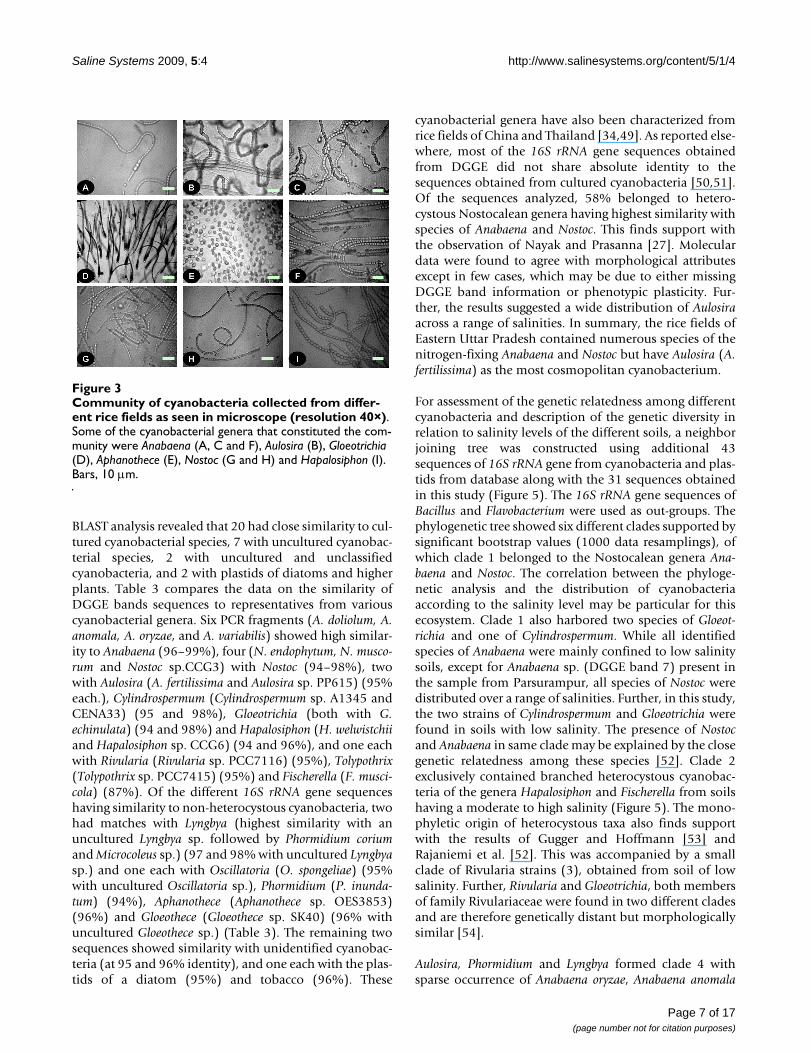
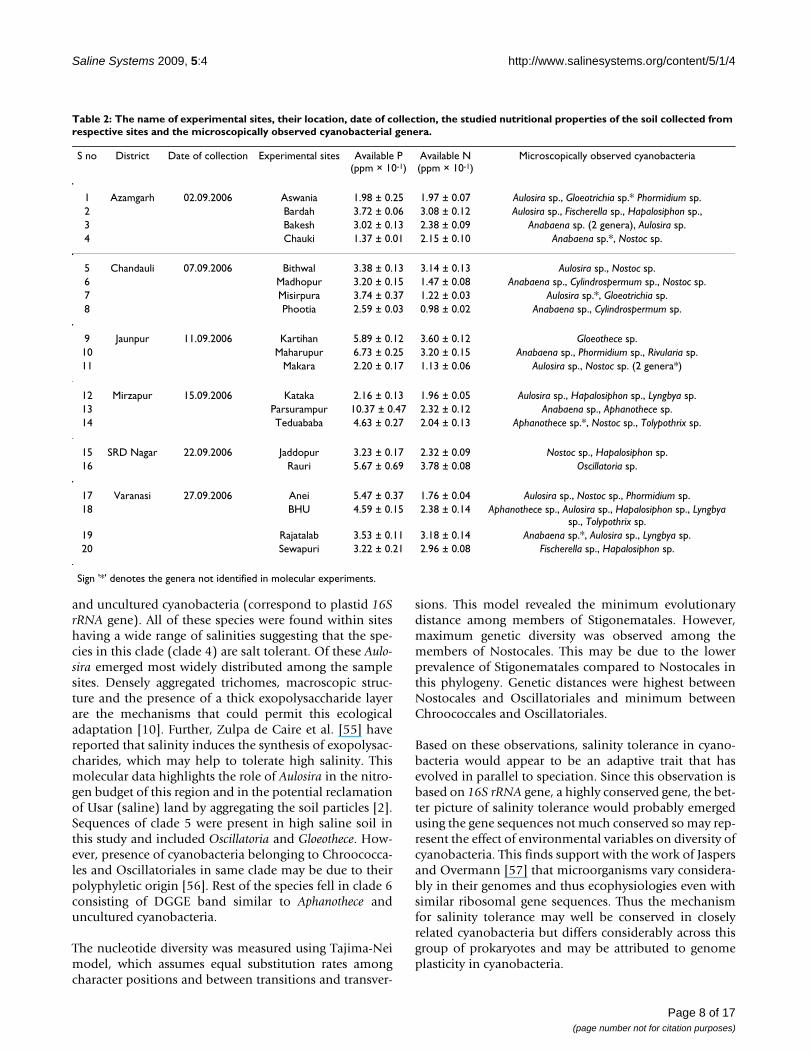
Nostocales; Oscillatoria, Lyngbya and Phormidium of theOscillatoriales; Fischerella and Hapalosiphon of Stigone-matales; and Aphanothece and Gloeothece of the Chroococ-cales (Figure 3). Details of the microscopic analysis, interms of cyanobacterial genera present at specific sites, areprovided in Table 2. This observation is supported by themicroscopic observations of Ali and Sandhu [31] andTiwari and Singh [28], who reported occurrence of thesecyanobacteria in saline soils of the Punjab, Pakistan andslightly acidic soil of rice fields of Manipur, India respec-tively. These cyanobacteria were previously characterizedfrom different soil types in India [47]. Further, Pereira etal. [30] reported occurrence of different species of Ana-baena, Nostoc, Cylindrospermum and Gloeotrichia in ricefields of Chile. In this study, the number of above-men-tioned genera varied considerably across different sam-ples. Samples from the hypersaline conditions alsogenerally contained non-heterocystous filamentous andunicellular genera. In contrast to this, the mesosaline sam-ples had a population with more heterocyst-formingcyanobacteria. The sample from BHU showed maximumcyanobacterial diversity with minimal diversity present atKartihan and Rauri, in terms of cyanobacterial generapresent. However, a general trend of a larger number ofcyanobacteria in low salinity soils than high salinity soilswas observed. In this study the presence of Aulosira in a
large number of samples was supported by the results ofSingh [2], who suggested it to be the dominant genus inIndian rice paddy fields.
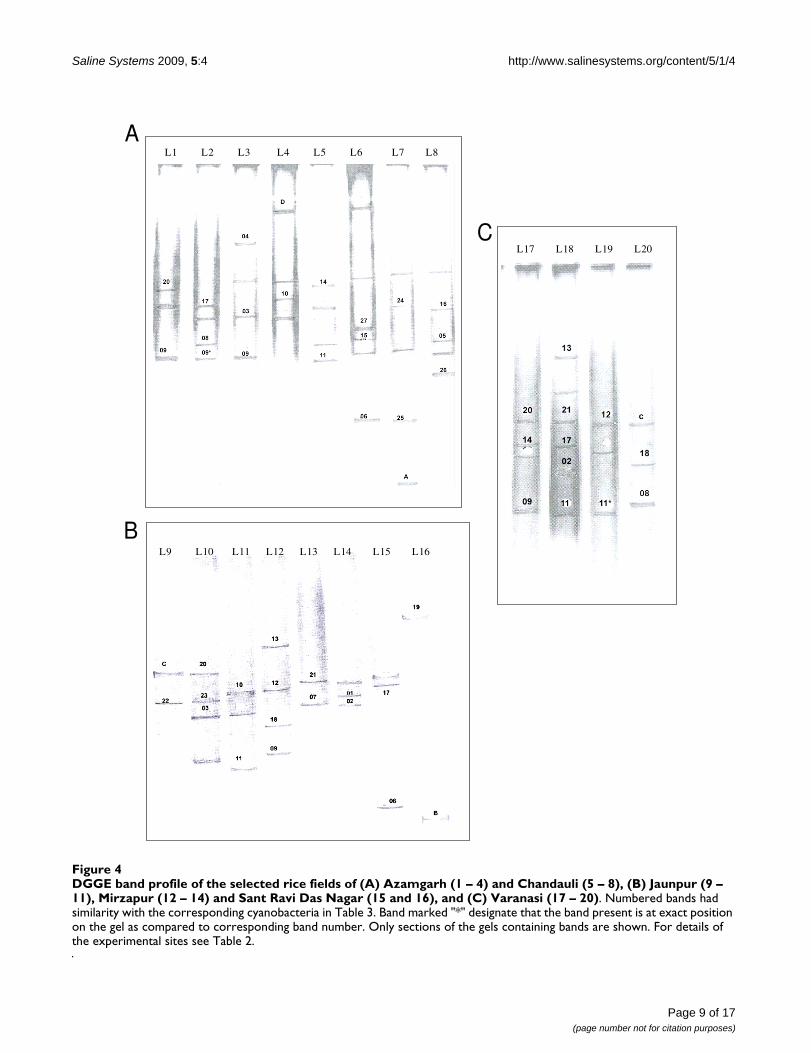
DGGE and molecular diversityMolecular identification was used to support the morpho-logical classification of cyanobacteria. This polyphasicapproach to rice field cyanobacterial systematics provideda basis for comparison with previously identified taxa andalso for future comparisons with taxa with similar physi-ologies. The characterization of cyanobacterial 16S rRNAgene by PCR-DGGE is shown in Figure 4. Different band-ing patterns for each soil sample were observed, with atotal of 73 delineated PCR products. Bands that showedsignificant reproducibility and minor changes in intensityafter triplicate analyses were selected for further assess-ment. A total of 51 bands was selected for sequencing onthe basis of their relative position on the gel and bandintensity. However, BLAST analysis showed that only 31DGGE bands had significant difference in their sequences.This may be due to that fact that DGGE is a very sensitivetechnique and can detect single nucleotide differences ina sequence [48], however, these differences may be insig-nificant in terms of percentage similarity across the entiremolecule.
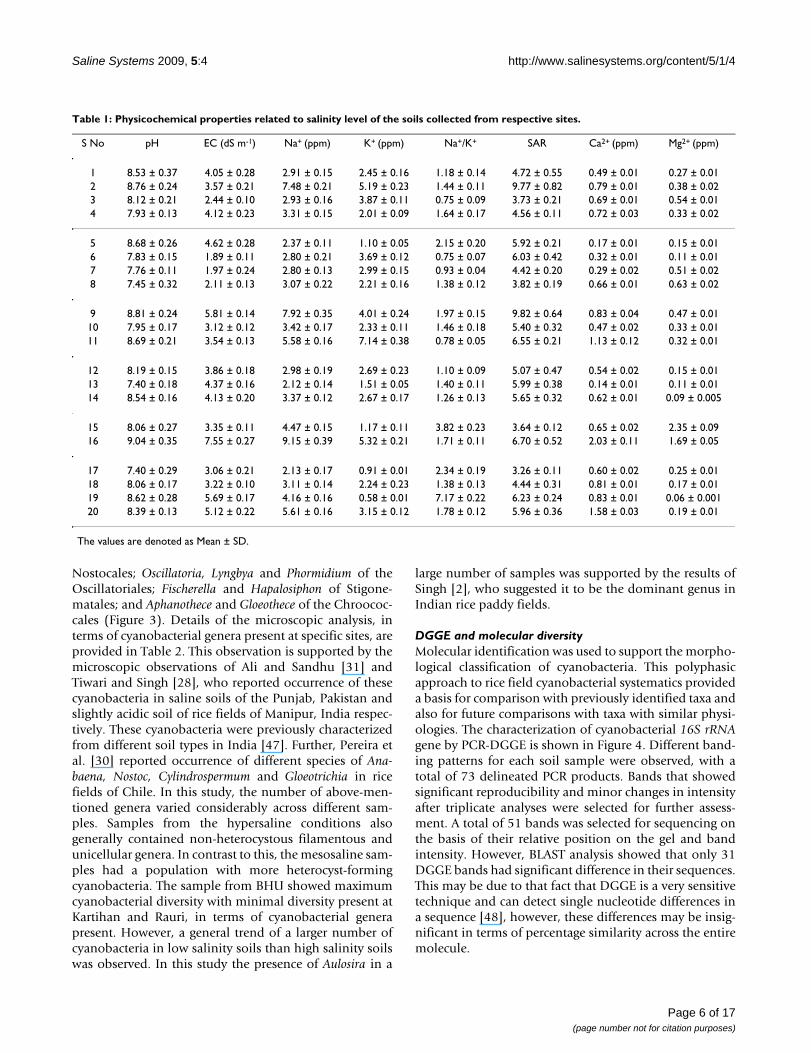
Table 1: Physicochemical properties related to salinity level of the soils collected from respective sites.
S No pH EC (dS m-1) Na+ (ppm) K+ (ppm) Na+/K+ SAR Ca2+ (ppm) Mg2+ (ppm)
1 8.53 ± 0.37 4.05 ± 0.28 2.91 ± 0.15 2.45 ± 0.16 1.18 ± 0.14 4.72 ± 0.55 0.49 ± 0.01 0.27 ± 0.012 8.76 ± 0.24 3.57 ± 0.21 7.48 ± 0.21 5.19 ± 0.23 1.44 ± 0.11 9.77 ± 0.82 0.79 ± 0.01 0.38 ± 0.023 8.12 ± 0.21 2.44 ± 0.10 2.93 ± 0.16 3.87 ± 0.11 0.75 ± 0.09 3.73 ± 0.21 0.69 ± 0.01 0.54 ± 0.014 7.93 ± 0.13 4.12 ± 0.23 3.31 ± 0.15 2.01 ± 0.09 1.64 ± 0.17 4.56 ± 0.11 0.72 ± 0.03 0.33 ± 0.02
5 8.68 ± 0.26 4.62 ± 0.28 2.37 ± 0.11 1.10 ± 0.05 2.15 ± 0.20 5.92 ± 0.21 0.17 ± 0.01 0.15 ± 0.016 7.83 ± 0.15 1.89 ± 0.11 2.80 ± 0.21 3.69 ± 0.12 0.75 ± 0.07 6.03 ± 0.42 0.32 ± 0.01 0.11 ± 0.017 7.76 ± 0.11 1.97 ± 0.24 2.80 ± 0.13 2.99 ± 0.15 0.93 ± 0.04 4.42 ± 0.20 0.29 ± 0.02 0.51 ± 0.028 7.45 ± 0.32 2.11 ± 0.13 3.07 ± 0.22 2.21 ± 0.16 1.38 ± 0.12 3.82 ± 0.19 0.66 ± 0.01 0.63 ± 0.02
9 8.81 ± 0.24 5.81 ± 0.14 7.92 ± 0.35 4.01 ± 0.24 1.97 ± 0.15 9.82 ± 0.64 0.83 ± 0.04 0.47 ± 0.0110 7.95 ± 0.17 3.12 ± 0.12 3.42 ± 0.17 2.33 ± 0.11 1.46 ± 0.18 5.40 ± 0.32 0.47 ± 0.02 0.33 ± 0.0111 8.69 ± 0.21 3.54 ± 0.13 5.58 ± 0.16 7.14 ± 0.38 0.78 ± 0.05 6.55 ± 0.21 1.13 ± 0.12 0.32 ± 0.01
12 8.19 ± 0.15 3.86 ± 0.18 2.98 ± 0.19 2.69 ± 0.23 1.10 ± 0.09 5.07 ± 0.47 0.54 ± 0.02 0.15 ± 0.0113 7.40 ± 0.18 4.37 ± 0.16 2.12 ± 0.14 1.51 ± 0.05 1.40 ± 0.11 5.99 ± 0.38 0.14 ± 0.01 0.11 ± 0.0114 8.54 ± 0.16 4.13 ± 0.20 3.37 ± 0.12 2.67 ± 0.17 1.26 ± 0.13 5.65 ± 0.32 0.62 ± 0.01 0.09 ± 0.005
15 8.06 ± 0.27 3.35 ± 0.11 4.47 ± 0.15 1.17 ± 0.11 3.82 ± 0.23 3.64 ± 0.12 0.65 ± 0.02 2.35 ± 0.0916 9.04 ± 0.35 7.55 ± 0.27 9.15 ± 0.39 5.32 ± 0.21 1.71 ± 0.11 6.70 ± 0.52 2.03 ± 0.11 1.69 ± 0.05
17 7.40 ± 0.29 3.06 ± 0.21 2.13 ± 0.17 0.91 ± 0.01 2.34 ± 0.19 3.26 ± 0.11 0.60 ± 0.02 0.25 ± 0.0118 8.06 ± 0.17 3.22 ± 0.10 3.11 ± 0.14 2.24 ± 0.23 1.38 ± 0.13 4.44 ± 0.31 0.81 ± 0.01 0.17 ± 0.0119 8.62 ± 0.28 5.69 ± 0.17 4.16 ± 0.16 0.58 ± 0.01 7.17 ± 0.22 6.23 ± 0.24 0.83 ± 0.01 0.06 ± 0.00120 8.39 ± 0.13 5.12 ± 0.22 5.61 ± 0.16 3.15 ± 0.12 1.78 ± 0.12 5.96 ± 0.36 1.58 ± 0.03 0.19 ± 0.01
The values are denoted as Mean ± SD.
Page 6 of 17(page number not for citation purposes)
Saline Systems 2009, 5:4 http://www.salinesystems.org/content/5/1/4
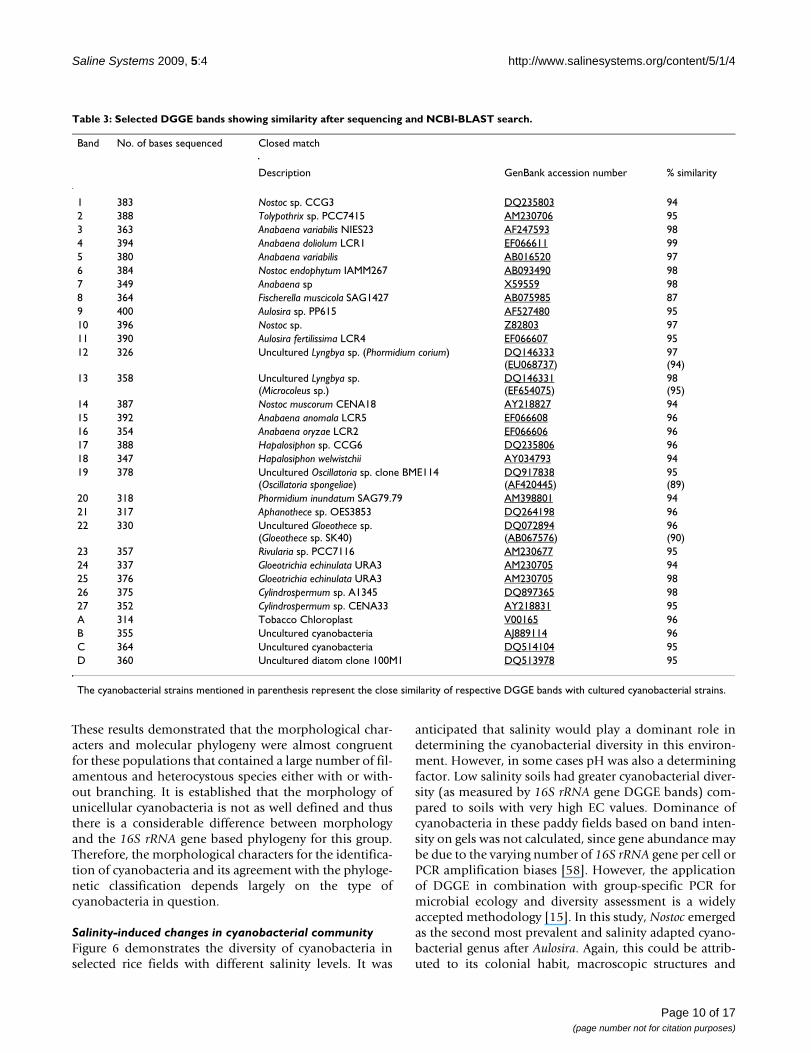
BLAST analysis revealed that 20 had close similarity to cul-tured cyanobacterial species, 7 with uncultured cyanobac-terial species, 2 with uncultured and unclassifiedcyanobacteria, and 2 with plastids of diatoms and higherplants. Table 3 compares the data on the similarity ofDGGE bands sequences to representatives from variouscyanobacterial genera. Six PCR fragments (A. doliolum, A.anomala, A. oryzae, and A. variabilis) showed high similar-ity to Anabaena (96–99%), four (N. endophytum, N. musco-rum and Nostoc sp.CCG3) with Nostoc (94–98%), twowith Aulosira (A. fertilissima and Aulosira sp. PP615) (95%each.), Cylindrospermum (Cylindrospermum sp. A1345 andCENA33) (95 and 98%), Gloeotrichia (both with G.echinulata) (94 and 98%) and Hapalosiphon (H. welwistchiiand Hapalosiphon sp. CCG6) (94 and 96%), and one eachwith Rivularia (Rivularia sp. PCC7116) (95%), Tolypothrix(Tolypothrix sp. PCC7415) (95%) and Fischerella (F. musci-cola) (87%). Of the different 16S rRNA gene sequenceshaving similarity to non-heterocystous cyanobacteria, twohad matches with Lyngbya (highest similarity with anuncultured Lyngbya sp. followed by Phormidium coriumand Microcoleus sp.) (97 and 98% with uncultured Lyngbyasp.) and one each with Oscillatoria (O. spongeliae) (95%with uncultured Oscillatoria sp.), Phormidium (P. inunda-tum) (94%), Aphanothece (Aphanothece sp. OES3853)(96%) and Gloeothece (Gloeothece sp. SK40) (96% withuncultured Gloeothece sp.) (Table 3). The remaining twosequences showed similarity with unidentified cyanobac-teria (at 95 and 96% identity), and one each with the plas-tids of a diatom (95%) and tobacco (96%). These
cyanobacterial genera have also been characterized fromrice fields of China and Thailand [34,49]. As reported else-where, most of the 16S rRNA gene sequences obtainedfrom DGGE did not share absolute identity to thesequences obtained from cultured cyanobacteria [50,51].Of the sequences analyzed, 58% belonged to hetero-cystous Nostocalean genera having highest similarity withspecies of Anabaena and Nostoc. This finds support withthe observation of Nayak and Prasanna [27]. Moleculardata were found to agree with morphological attributesexcept in few cases, which may be due to either missingDGGE band information or phenotypic plasticity. Fur-ther, the results suggested a wide distribution of Aulosiraacross a range of salinities. In summary, the rice fields ofEastern Uttar Pradesh contained numerous species of thenitrogen-fixing Anabaena and Nostoc but have Aulosira (A.fertilissima) as the most cosmopolitan cyanobacterium.
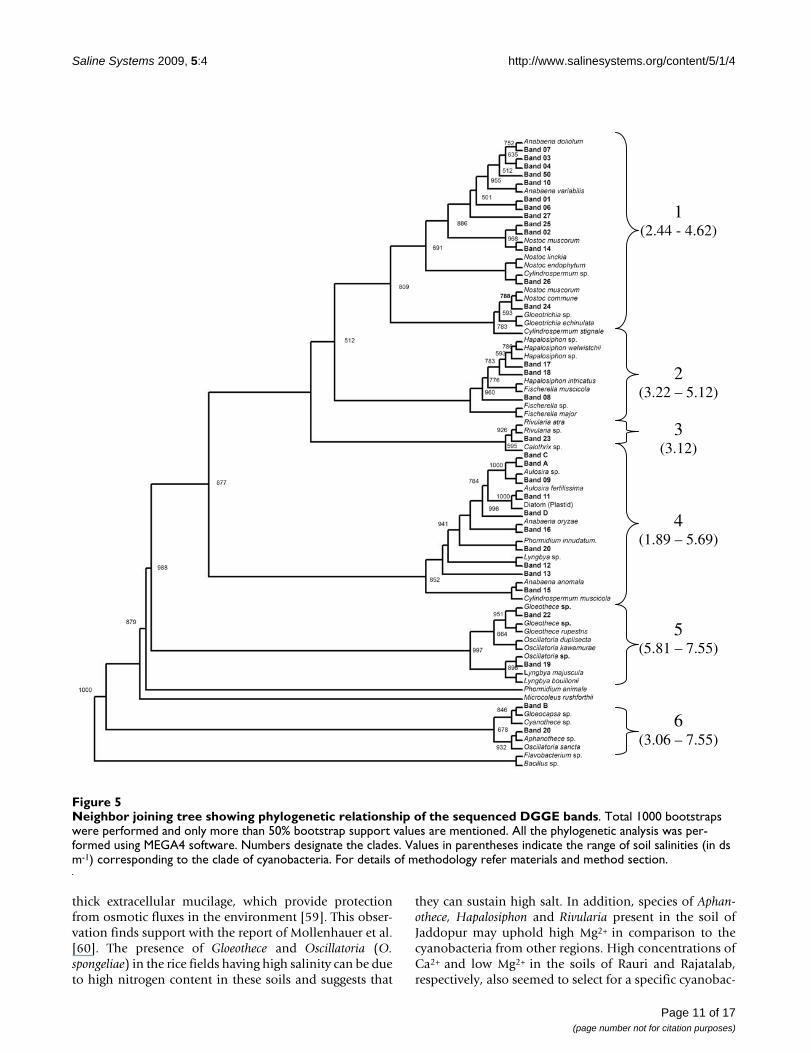
For assessment of the genetic relatedness among differentcyanobacteria and description of the genetic diversity inrelation to salinity levels of the different soils, a neighborjoining tree was constructed using additional 43sequences of 16S rRNA gene from cyanobacteria and plas-tids from database along with the 31 sequences obtainedin this study (Figure 5). The 16S rRNA gene sequences ofBacillus and Flavobacterium were used as out-groups. Thephylogenetic tree showed six different clades supported bysignificant bootstrap values (1000 data resamplings), ofwhich clade 1 belonged to the Nostocalean genera Ana-baena and Nostoc. The correlation between the phyloge-netic analysis and the distribution of cyanobacteriaaccording to the salinity level may be particular for thisecosystem. Clade 1 also harbored two species of Gloeot-richia and one of Cylindrospermum. While all identifiedspecies of Anabaena were mainly confined to low salinitysoils, except for Anabaena sp. (DGGE band 7) present inthe sample from Parsurampur, all species of Nostoc weredistributed over a range of salinities. Further, in this study,the two strains of Cylindrospermum and Gloeotrichia werefound in soils with low salinity. The presence of Nostocand Anabaena in same clade may be explained by the closegenetic relatedness among these species [52]. Clade 2exclusively contained branched heterocystous cyanobac-teria of the genera Hapalosiphon and Fischerella from soilshaving a moderate to high salinity (Figure 5). The mono-phyletic origin of heterocystous taxa also finds supportwith the results of Gugger and Hoffmann [53] andRajaniemi et al. [52]. This was accompanied by a smallclade of Rivularia strains (3), obtained from soil of lowsalinity. Further, Rivularia and Gloeotrichia, both membersof family Rivulariaceae were found in two different cladesand are therefore genetically distant but morphologicallysimilar [54].
Aulosira, Phormidium and Lyngbya formed clade 4 withsparse occurrence of Anabaena oryzae, Anabaena anomala
Community of cyanobacteria collected from different rice fields as seen in microscope (resolution 40×)Figure 3Community of cyanobacteria collected from differ-ent rice fields as seen in microscope (resolution 40×). Some of the cyanobacterial genera that constituted the com-munity were Anabaena (A, C and F), Aulosira (B), Gloeotrichia (D), Aphanothece (E), Nostoc (G and H) and Hapalosiphon (I). Bars, 10 μm.
Page 7 of 17(page number not for citation purposes)
Saline Systems 2009, 5:4 http://www.salinesystems.org/content/5/1/4
and uncultured cyanobacteria (correspond to plastid 16SrRNA gene). All of these species were found within siteshaving a wide range of salinities suggesting that the spe-cies in this clade (clade 4) are salt tolerant. Of these Aulo-sira emerged most widely distributed among the samplesites. Densely aggregated trichomes, macroscopic struc-ture and the presence of a thick exopolysaccharide layerare the mechanisms that could permit this ecologicaladaptation [10]. Further, Zulpa de Caire et al. [55] havereported that salinity induces the synthesis of exopolysac-charides, which may help to tolerate high salinity. Thismolecular data highlights the role of Aulosira in the nitro-gen budget of this region and in the potential reclamationof Usar (saline) land by aggregating the soil particles [2].Sequences of clade 5 were present in high saline soil inthis study and included Oscillatoria and Gloeothece. How-ever, presence of cyanobacteria belonging to Chroococca-les and Oscillatoriales in same clade may be due to theirpolyphyletic origin [56]. Rest of the species fell in clade 6consisting of DGGE band similar to Aphanothece anduncultured cyanobacteria.
The nucleotide diversity was measured using Tajima-Neimodel, which assumes equal substitution rates amongcharacter positions and between transitions and transver-
sions. This model revealed the minimum evolutionarydistance among members of Stigonematales. However,maximum genetic diversity was observed among themembers of Nostocales. This may be due to the lowerprevalence of Stigonematales compared to Nostocales inthis phylogeny. Genetic distances were highest betweenNostocales and Oscillatoriales and minimum betweenChroococcales and Oscillatoriales.
Based on these observations, salinity tolerance in cyano-bacteria would appear to be an adaptive trait that hasevolved in parallel to speciation. Since this observation isbased on 16S rRNA gene, a highly conserved gene, the bet-ter picture of salinity tolerance would probably emergedusing the gene sequences not much conserved so may rep-resent the effect of environmental variables on diversity ofcyanobacteria. This finds support with the work of Jaspersand Overmann [57] that microorganisms vary considera-bly in their genomes and thus ecophysiologies even withsimilar ribosomal gene sequences. Thus the mechanismfor salinity tolerance may well be conserved in closelyrelated cyanobacteria but differs considerably across thisgroup of prokaryotes and may be attributed to genomeplasticity in cyanobacteria.
Table 2: The name of experimental sites, their location, date of collection, the studied nutritional properties of the soil collected from respective sites and the microscopically observed cyanobacterial genera.
S no District Date of collection Experimental sites Available P(ppm × 10-1)
Available N(ppm × 10-1)
Microscopically observed cyanobacteria
1 Azamgarh 02.09.2006 Aswania 1.98 ± 0.25 1.97 ± 0.07 Aulosira sp., Gloeotrichia sp.* Phormidium sp.2 Bardah 3.72 ± 0.06 3.08 ± 0.12 Aulosira sp., Fischerella sp., Hapalosiphon sp.,3 Bakesh 3.02 ± 0.13 2.38 ± 0.09 Anabaena sp. (2 genera), Aulosira sp.4 Chauki 1.37 ± 0.01 2.15 ± 0.10 Anabaena sp.*, Nostoc sp.
5 Chandauli 07.09.2006 Bithwal 3.38 ± 0.13 3.14 ± 0.13 Aulosira sp., Nostoc sp.6 Madhopur 3.20 ± 0.15 1.47 ± 0.08 Anabaena sp., Cylindrospermum sp., Nostoc sp.7 Misirpura 3.74 ± 0.37 1.22 ± 0.03 Aulosira sp.*, Gloeotrichia sp.8 Phootia 2.59 ± 0.03 0.98 ± 0.02 Anabaena sp., Cylindrospermum sp.
9 Jaunpur 11.09.2006 Kartihan 5.89 ± 0.12 3.60 ± 0.12 Gloeothece sp.10 Maharupur 6.73 ± 0.25 3.20 ± 0.15 Anabaena sp., Phormidium sp., Rivularia sp.11 Makara 2.20 ± 0.17 1.13 ± 0.06 Aulosira sp., Nostoc sp. (2 genera*)
12 Mirzapur 15.09.2006 Kataka 2.16 ± 0.13 1.96 ± 0.05 Aulosira sp., Hapalosiphon sp., Lyngbya sp.13 Parsurampur 10.37 ± 0.47 2.32 ± 0.12 Anabaena sp., Aphanothece sp.14 Teduababa 4.63 ± 0.27 2.04 ± 0.13 Aphanothece sp.*, Nostoc sp., Tolypothrix sp.
15 SRD Nagar 22.09.2006 Jaddopur 3.23 ± 0.17 2.32 ± 0.09 Nostoc sp., Hapalosiphon sp.16 Rauri 5.67 ± 0.69 3.78 ± 0.08 Oscillatoria sp.
17 Varanasi 27.09.2006 Anei 5.47 ± 0.37 1.76 ± 0.04 Aulosira sp., Nostoc sp., Phormidium sp.18 BHU 4.59 ± 0.15 2.38 ± 0.14 Aphanothece sp., Aulosira sp., Hapalosiphon sp., Lyngbya
sp., Tolypothrix sp.19 Rajatalab 3.53 ± 0.11 3.18 ± 0.14 Anabaena sp.*, Aulosira sp., Lyngbya sp.20 Sewapuri 3.22 ± 0.21 2.96 ± 0.08 Fischerella sp., Hapalosiphon sp.
Sign '*' denotes the genera not identified in molecular experiments.
Page 8 of 17(page number not for citation purposes)
Saline Systems 2009, 5:4 http://www.salinesystems.org/content/5/1/4
Page 9 of 17(page number not for citation purposes)
DGGE band profile of the selected rice fields of (A) Azamgarh (1 – 4) and Chandauli (5 – 8), (B) Jaunpur (9 – 11), Mirzapur (12 – 14) and Sant Ravi Das Nagar (15 and 16), and (C) Varanasi (17 – 20)Figure 4DGGE band profile of the selected rice fields of (A) Azamgarh (1 – 4) and Chandauli (5 – 8), (B) Jaunpur (9 – 11), Mirzapur (12 – 14) and Sant Ravi Das Nagar (15 and 16), and (C) Varanasi (17 – 20). Numbered bands had similarity with the corresponding cyanobacteria in Table 3. Band marked "*" designate that the band present is at exact position on the gel as compared to corresponding band number. Only sections of the gels containing bands are shown. For details of the experimental sites see Table 2.
L1 L2 L3 L4 L5 L6 L7 L8
L9 L10 L11 L12 L13 L14 L15 L16
L17 L18 L19 L20
A
B
C
Saline Systems 2009, 5:4 http://www.salinesystems.org/content/5/1/4
These results demonstrated that the morphological char-acters and molecular phylogeny were almost congruentfor these populations that contained a large number of fil-amentous and heterocystous species either with or with-out branching. It is established that the morphology ofunicellular cyanobacteria is not as well defined and thusthere is a considerable difference between morphologyand the 16S rRNA gene based phylogeny for this group.Therefore, the morphological characters for the identifica-tion of cyanobacteria and its agreement with the phyloge-netic classification depends largely on the type ofcyanobacteria in question.
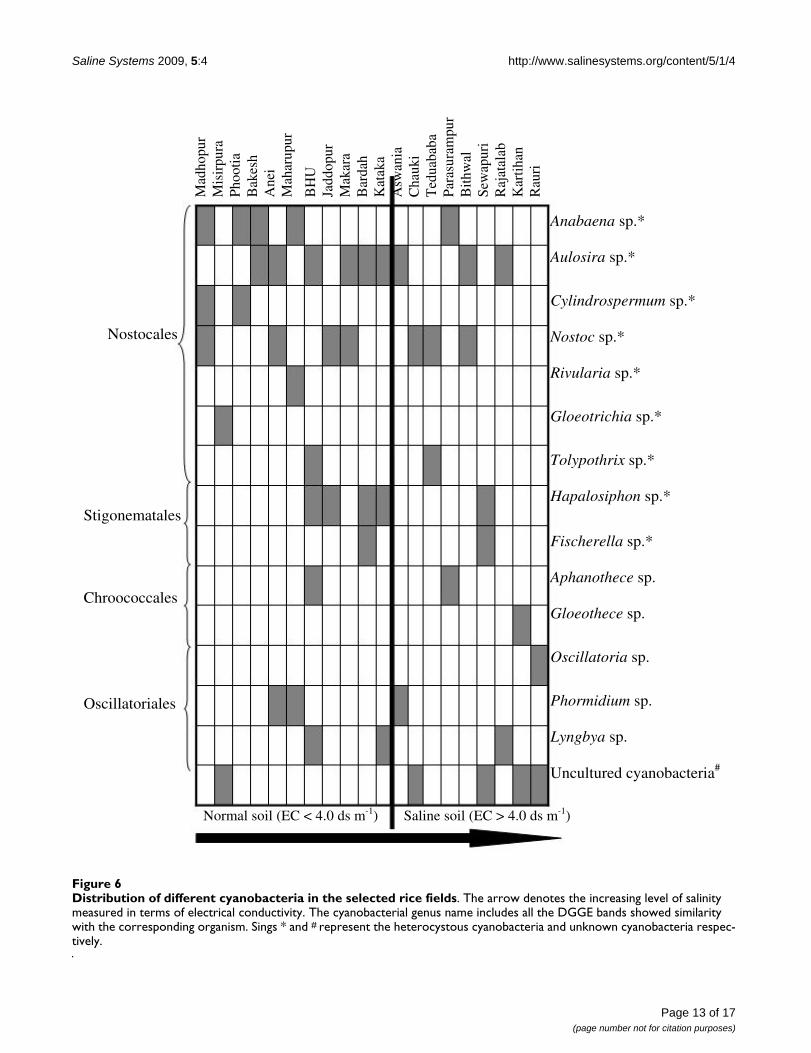
Salinity-induced changes in cyanobacterial communityFigure 6 demonstrates the diversity of cyanobacteria inselected rice fields with different salinity levels. It was
anticipated that salinity would play a dominant role indetermining the cyanobacterial diversity in this environ-ment. However, in some cases pH was also a determiningfactor. Low salinity soils had greater cyanobacterial diver-sity (as measured by 16S rRNA gene DGGE bands) com-pared to soils with very high EC values. Dominance ofcyanobacteria in these paddy fields based on band inten-sity on gels was not calculated, since gene abundance maybe due to the varying number of 16S rRNA gene per cell orPCR amplification biases [58]. However, the applicationof DGGE in combination with group-specific PCR formicrobial ecology and diversity assessment is a widelyaccepted methodology [15]. In this study, Nostoc emergedas the second most prevalent and salinity adapted cyano-bacterial genus after Aulosira. Again, this could be attrib-uted to its colonial habit, macroscopic structures and
Table 3: Selected DGGE bands showing similarity after sequencing and NCBI-BLAST search.
Band No. of bases sequenced Closed match
Description GenBank accession number % similarity
1 383 Nostoc sp. CCG3 DQ235803 942 388 Tolypothrix sp. PCC7415 AM230706 953 363 Anabaena variabilis NIES23 AF247593 984 394 Anabaena doliolum LCR1 EF066611 995 380 Anabaena variabilis AB016520 976 384 Nostoc endophytum IAMM267 AB093490 987 349 Anabaena sp X59559 988 364 Fischerella muscicola SAG1427 AB075985 879 400 Aulosira sp. PP615 AF527480 9510 396 Nostoc sp. Z82803 9711 390 Aulosira fertilissima LCR4 EF066607 9512 326 Uncultured Lyngbya sp. (Phormidium corium) DQ146333
(EU068737)97(94)
13 358 Uncultured Lyngbya sp.(Microcoleus sp.)
DQ146331(EF654075)
98(95)
14 387 Nostoc muscorum CENA18 AY218827 9415 392 Anabaena anomala LCR5 EF066608 9616 354 Anabaena oryzae LCR2 EF066606 9617 388 Hapalosiphon sp. CCG6 DQ235806 9618 347 Hapalosiphon welwistchii AY034793 9419 378 Uncultured Oscillatoria sp. clone BME114
(Oscillatoria spongeliae)DQ917838(AF420445)
95(89)
20 318 Phormidium inundatum SAG79.79 AM398801 9421 317 Aphanothece sp. OES3853 DQ264198 9622 330 Uncultured Gloeothece sp.
(Gloeothece sp. SK40)DQ072894(AB067576)
96(90)
23 357 Rivularia sp. PCC7116 AM230677 9524 337 Gloeotrichia echinulata URA3 AM230705 9425 376 Gloeotrichia echinulata URA3 AM230705 9826 375 Cylindrospermum sp. A1345 DQ897365 9827 352 Cylindrospermum sp. CENA33 AY218831 95A 314 Tobacco Chloroplast V00165 96B 355 Uncultured cyanobacteria AJ889114 96C 364 Uncultured cyanobacteria DQ514104 95D 360 Uncultured diatom clone 100M1 DQ513978 95
The cyanobacterial strains mentioned in parenthesis represent the close similarity of respective DGGE bands with cultured cyanobacterial strains.
Page 10 of 17(page number not for citation purposes)
Saline Systems 2009, 5:4 http://www.salinesystems.org/content/5/1/4
thick extracellular mucilage, which provide protectionfrom osmotic fluxes in the environment [59]. This obser-vation finds support with the report of Mollenhauer et al.[60]. The presence of Gloeothece and Oscillatoria (O.spongeliae) in the rice fields having high salinity can be dueto high nitrogen content in these soils and suggests that
they can sustain high salt. In addition, species of Aphan-othece, Hapalosiphon and Rivularia present in the soil ofJaddopur may uphold high Mg2+ in comparison to thecyanobacteria from other regions. High concentrations ofCa2+ and low Mg2+ in the soils of Rauri and Rajatalab,respectively, also seemed to select for a specific cyanobac-
Neighbor joining tree showing phylogenetic relationship of the sequenced DGGE bandsFigure 5Neighbor joining tree showing phylogenetic relationship of the sequenced DGGE bands. Total 1000 bootstraps were performed and only more than 50% bootstrap support values are mentioned. All the phylogenetic analysis was per-formed using MEGA4 software. Numbers designate the clades. Values in parentheses indicate the range of soil salinities (in ds m-1) corresponding to the clade of cyanobacteria. For details of methodology refer materials and method section.
1(2.44 - 4.62)
2(3.22 – 5.12)
3(3.12)
4(1.89 – 5.69)
5(5.81 – 7.55)
6(3.06 – 7.55)
Page 11 of 17(page number not for citation purposes)
Saline Systems 2009, 5:4 http://www.salinesystems.org/content/5/1/4
terial community. Finally, the most diverse population ofcyanobacteria (as revealed by DGGE) was from the ricefields of site with low salinity that was characterized ashaving neutral to slightly alkaline pH and low EC whilebeing phosphorus replete.
Relatively low salinity levels favored the growth of hetero-cystous cyanobacteria while high salinity (more than 4 dsm-1) appeared to select for non-heterocystous species (Fig-ure 6). Since high salinity reduces ammonia volatilization[36], the high nitrogen content in saline soil would be det-rimental for heterocystous cyanobacteria [45]. Likewise,Staal et al. [61] demonstrated that in less saline condi-tions, the glycolipid envelop of a heterocyst provides aselective advantage over non-heterocystous cyanobacte-ria. The distribution of phylogenetic relationships acrossenvironmental gradients is not well understood. How-ever, here we obtained a distinct relationship betweencyanobacterial occurrence and salinity levels using bothmorphological and molecular data. This ecosystem ischaracterized by numerous overlapping factors other thansalinity. Therefore, the community structure that wasdescribed here may vary with other environmental pertur-bations.
Soil salinity is one of the major determinants of cyanobac-terial distribution and diversity in the rice fields of EasternUttar Pradesh. This study has shown that salinity influ-ences cyanobacterial species distribution in rice fields,whereby high salinity soils selectively support the growthof non-heterocystous cyanobacterial populations. Threatsimposed by ever-increasing salinity have resulted in thincyanobacterial populations that lead to a reduction in bio-logical nitrogen fixation and increased demand of chemi-cal fertilizers in the paddy fields.
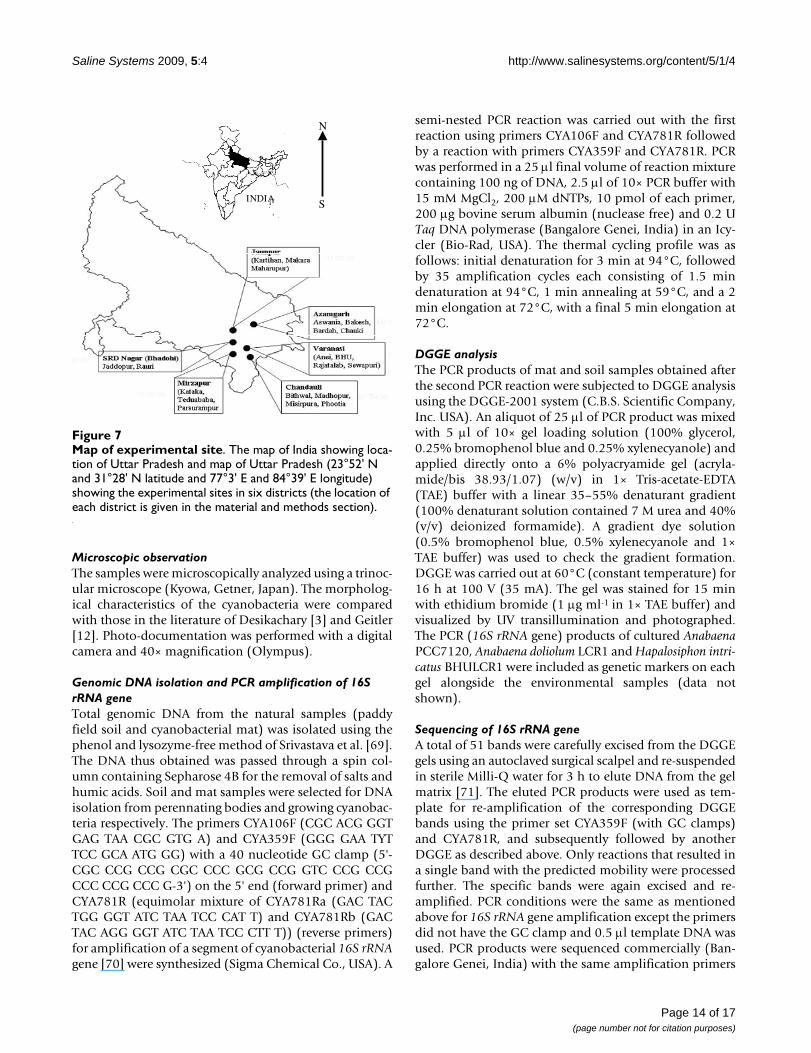
MethodsSampling sites, sampling and biochemicalsA total of 20 rice fields situated in six districts of EasternUttar Pradesh were selected for sampling (situated from24°56' to 26°06' N and 81°14' to 83°19' E). The namesof villages and dates of sampling are listed in Figure 7 andtranslated into sample numbers (see Table 2). The siteswere selected having consideration that (i) the samplingshould be random, and (ii) rice fields should not be muchdisturbed. The samples were collected during September2006, which is the monsoon season in this part of Indiaand considered the optimal period for cyanobacterialgrowth. Climatic factors such as light, humidity and rain-fall were uniform since all sites are located in the samegeographical region. Although, some reports state thatcyanobacterial diversity is better correlated with watercharacteristics in rice fields [62], others describe an affili-ation with soil properties [63]. In view of the presence ofcyanobacteria deep within the soil of rice fields [34], latter
proposal seems more feasible. The soil samples were col-lected on sunny days having temperatures between 27 to30°C and between the hours of 10.00 and 11.00 AM(IST). The collected samples were transported to the labo-ratory on ice and stored at -20°C. All experiments relatingto the physicochemical properties of soil and PCR-DGGEwere performed in triplicate and repeated at least twice toensure the reproducibility of the results. All biochemicalswere procured from the Sigma Chemical Co. USA unlessotherwise specified.
Chemical composition of soil samplesFor the analysis of pH and electrical conductivity (EC), 50ml of double-distilled deionized Milli-Q water was addedto 10 g of soil and homogenized. The suspension was sub-jected to centrifugation at 10,000 g for 10 min. The super-natant was used for the measurement of pH and EC usinga pH (Systronics, India) and EC (Hanna Instruments, Por-tugal) meters respectively.
For Na+, K+, Ca2+ and Mg2+ analysis, 5 g of soil was pre-digested with concentrated H2SO4. To this, H2O2 wasadded drop-wise until the solution became colorless. Thissolution was incubated on a hot plate at 70°C for 2 h andthe process was repeated thrice. When the solutionbecame dry, 10 ml of double-distilled deionized Milli-Qwater was added. The resulting solution was analyzedusing a Perkin Elmer 2380 atomic absorption spectropho-tometer [64]. The sodium absorption ratio (SAR) was cal-culated using the formula:
Available phosphorus was measured using the method ofOlsen et al. [65]. One gram of soil was mixed with 20 mlof 0.5 M NaHCO3 (pH 8.5) and 200 mg activated char-coal. This was shaken for 30 min at 200 g in an environ-mental shaker (Model-3597-ICOGMPR, USA)maintained at 25°C followed by filtration through What-mann No. 1 filter paper. The pH of extract was maintainedto 5.0 using concentrated H2SO4. The extract was thenquantified for phosphorus content using molybdophos-phoric acid [66].
Ammonia- and nitrate-nitrogen were measured by extract-ing 10 g of soil in 50 ml 2 M KCl and Morgan's Reagent(pH 4.8) respectively. In each sample 250 mg activatedcharcoal was added to obtain the clear supernatant. Thesewere subjected to filtration through Whatmann No. 1 fil-ter paper and used for ammonia-nitrogen measurementby phenate method [67] and nitrate-nitrogen estimationusing the procedure described by Jackson [68]. Data werepresented in terms of total nitrogen (combination ofammonia- and nitrate-nitrogen).
SAR Na [(Ca Mg= ++ + +/ ) / ]√ 2 2 2
Page 12 of 17(page number not for citation purposes)
Saline Systems 2009, 5:4 http://www.salinesystems.org/content/5/1/4
Page 13 of 17(page number not for citation purposes)
Distribution of different cyanobacteria in the selected rice fieldsFigure 6Distribution of different cyanobacteria in the selected rice fields. The arrow denotes the increasing level of salinity measured in terms of electrical conductivity. The cyanobacterial genus name includes all the DGGE bands showed similarity with the corresponding organism. Sings * and # represent the heterocystous cyanobacteria and unknown cyanobacteria respec-tively.
Mad
hopu
rM
isir
pura
Phoo
tiaB
akes
hA
nei
Mah
arup
ur
BH
UJa
ddop
urM
akar
aB
arda
hK
atak
aA
swan
iaC
hauk
iT
edua
baba
Para
sura
mpu
rB
ithw
alSe
wap
uri
Raj
atal
ab
Kar
tihan
Rau
ri
Anabaena sp.*
Aulosira sp.*
Cylindrospermum sp.*
Nostoc sp.*
Rivularia sp.*
Gloeotrichia sp.*
Tolypothrix sp.*
Hapalosiphon sp.*
Fischerella sp.*
Aphanothece sp.
Gloeothece sp.
Oscillatoria sp.
Phormidium sp.
Lyngbya sp.
Uncultured cyanobacteria#
Nostocales
Stigonematales
Chroococcales
Oscillatoriales
Normal soil (EC < 4.0 ds m-1) Saline soil (EC > 4.0 ds m-1)
Saline Systems 2009, 5:4 http://www.salinesystems.org/content/5/1/4
Microscopic observationThe samples were microscopically analyzed using a trinoc-ular microscope (Kyowa, Getner, Japan). The morpholog-ical characteristics of the cyanobacteria were comparedwith those in the literature of Desikachary [3] and Geitler[12]. Photo-documentation was performed with a digitalcamera and 40× magnification (Olympus).
Genomic DNA isolation and PCR amplification of 16S rRNA geneTotal genomic DNA from the natural samples (paddyfield soil and cyanobacterial mat) was isolated using thephenol and lysozyme-free method of Srivastava et al. [69].The DNA thus obtained was passed through a spin col-umn containing Sepharose 4B for the removal of salts andhumic acids. Soil and mat samples were selected for DNAisolation from perennating bodies and growing cyanobac-teria respectively. The primers CYA106F (CGC ACG GGTGAG TAA CGC GTG A) and CYA359F (GGG GAA TYTTCC GCA ATG GG) with a 40 nucleotide GC clamp (5'-CGC CCG CCG CGC CCC GCG CCG GTC CCG CCGCCC CCG CCC G-3') on the 5' end (forward primer) andCYA781R (equimolar mixture of CYA781Ra (GAC TACTGG GGT ATC TAA TCC CAT T) and CYA781Rb (GACTAC AGG GGT ATC TAA TCC CTT T)) (reverse primers)for amplification of a segment of cyanobacterial 16S rRNAgene [70] were synthesized (Sigma Chemical Co., USA). A
semi-nested PCR reaction was carried out with the firstreaction using primers CYA106F and CYA781R followedby a reaction with primers CYA359F and CYA781R. PCRwas performed in a 25 μl final volume of reaction mixturecontaining 100 ng of DNA, 2.5 μl of 10× PCR buffer with15 mM MgCl2, 200 μM dNTPs, 10 pmol of each primer,200 μg bovine serum albumin (nuclease free) and 0.2 UTaq DNA polymerase (Bangalore Genei, India) in an Icy-cler (Bio-Rad, USA). The thermal cycling profile was asfollows: initial denaturation for 3 min at 94°C, followedby 35 amplification cycles each consisting of 1.5 mindenaturation at 94°C, 1 min annealing at 59°C, and a 2min elongation at 72°C, with a final 5 min elongation at72°C.
DGGE analysisThe PCR products of mat and soil samples obtained afterthe second PCR reaction were subjected to DGGE analysisusing the DGGE-2001 system (C.B.S. Scientific Company,Inc. USA). An aliquot of 25 μl of PCR product was mixedwith 5 μl of 10× gel loading solution (100% glycerol,0.25% bromophenol blue and 0.25% xylenecyanole) andapplied directly onto a 6% polyacryamide gel (acryla-mide/bis 38.93/1.07) (w/v) in 1× Tris-acetate-EDTA(TAE) buffer with a linear 35–55% denaturant gradient(100% denaturant solution contained 7 M urea and 40%(v/v) deionized formamide). A gradient dye solution(0.5% bromophenol blue, 0.5% xylenecyanole and 1×TAE buffer) was used to check the gradient formation.DGGE was carried out at 60°C (constant temperature) for16 h at 100 V (35 mA). The gel was stained for 15 minwith ethidium bromide (1 μg ml-1 in 1× TAE buffer) andvisualized by UV transillumination and photographed.The PCR (16S rRNA gene) products of cultured AnabaenaPCC7120, Anabaena doliolum LCR1 and Hapalosiphon intri-catus BHULCR1 were included as genetic markers on eachgel alongside the environmental samples (data notshown).
Sequencing of 16S rRNA geneA total of 51 bands were carefully excised from the DGGEgels using an autoclaved surgical scalpel and re-suspendedin sterile Milli-Q water for 3 h to elute DNA from the gelmatrix [71]. The eluted PCR products were used as tem-plate for re-amplification of the corresponding DGGEbands using the primer set CYA359F (with GC clamps)and CYA781R, and subsequently followed by anotherDGGE as described above. Only reactions that resulted ina single band with the predicted mobility were processedfurther. The specific bands were again excised and re-amplified. PCR conditions were the same as mentionedabove for 16S rRNA gene amplification except the primersdid not have the GC clamp and 0.5 μl template DNA wasused. PCR products were sequenced commercially (Ban-galore Genei, India) with the same amplification primers
Map of experimental siteFigure 7Map of experimental site. The map of India showing loca-tion of Uttar Pradesh and map of Uttar Pradesh (23°52' N and 31°28' N latitude and 77°3' E and 84°39' E longitude) showing the experimental sites in six districts (the location of each district is given in the material and methods section).
N
SINDIA
Page 14 of 17(page number not for citation purposes)
Saline Systems 2009, 5:4 http://www.salinesystems.org/content/5/1/4
in separate reactions. However, only 31 DGGE bandswhich showed significant difference in their sequenceswere selected for further analysis.
Phylogenetic analysesA multiple alignment was produced using theCLUSTAL_X ver. 2 [72] and manually corrected usingJalView. Bands with identical mobility on DGGE gel wereconsidered to have identical sequences. Sequence similar-ity between the 31 different partial 16S rRNA genesequences resulting from DGGE analysis were depositedin GenBank and assessed by BLASTN [73] homologysearches using the nonredundant NCBI GenBank data-base. In addition to this, 43 16S rRNA gene sequencesfrom GenBank, which showed the closest similarity withthe different DGGE-PCR products, were also included inthe multiple alignment. Pair-wise distance matrices werecalculated using the Tajima-Nei method [74]. Characterpositions with gaps were deleted. The 16S rRNA genesequences of cyanobacteria were classified into phyloge-netic groups as proposed by Desikachary [3] for the deter-mination of genetic variability within and between thegroups. Phylogenetic trees were constructed using theneighbor-joining algorithm [75] provided in MEGA4[76]. One thousand bootstrap replicates of the alignmentdata were also performed and the consensus tree was con-structed.
Data analysesResults of the soil analysis were statistically analyzedusing one-way ANOVA followed by correlation coefficient(r) analysis using SPSS 10.0. Principal component analy-sis was performed using Statistica 8.0. For PCA analysis,the soil analysis data presented in Tables 1 and 2 wereconsidered. The clustering in the PCA was performed asper Coeyne et al. [77] using cluster analysis (similaritymeasure: Pearson or product-moment correlation coeffi-cient; clustering method: UPGMA). Further, to correlatecyanobacterial abundance and the physicochemical prop-erties of soil (EC and available nitrogen), each band on aDGGE gel was treated as an individual species. The totalnumber of bands present in any individual lane was con-sidered to be the cyanobacterial diversity in that soil sam-ple. Further, for accurate estimation of diversity,microscopic observations were also compared with themolecular data. Three independent variables were usedfor each experiment.
Nucleotide accession numbersThe 31 partial 16S rRNA gene sequences which showedsignificant difference in their sequence were analyzed andtaxonomically assigned using the BLAST program ofNCBI. The sequences were deposited in the databaseunder the accession numbers [GenBank: EF619446] to
[GenBank: EF619472] and [GenBank: EF624387] to[GenBank: EF624390].
Competing interestsThe authors declare that they have no competing interests.
Authors' contributionsAKS designed and conducted the experiments in consulta-tion with LCR, analyzed the data and drafted the manu-script. PB helped with the DGGE, phylogenetic analysisand drafting of the manuscript. AK carried out the phos-phate and nitrogen measurement experiments. BANassisted with the phylogenetic analysis, data interpreta-tion and drafting the manuscript.
Authors' informationAKS is Assistant Professor in Mizoram University, India.LCR and BAN are Professors in Banaras Hindu University,India and University of New South Wales, Australia,respectively.
AcknowledgementsFinancial support for this study was provided through megabiodiversity project of ICAR to LCR. AKS and PB are thankful to CSIR and UGC for senior research fellowships. BAN is supported by the Australian Research Council. AKS is thankful to Mizoram University, Aizawl. We are thankful to the Head and program coordinator, CAS in Botany, Banaras Hindu Univer-sity, Varanasi for facilities. The financial help of BAN for publication of the MS is also gratefully acknowledged.
References1. Zhu JK: Plant salt tolerance. Trends Plant Sci 2001, 6:66-71.2. Singh RN: Role of Blue-Green Algae in the Nitrogen Economy of Indian
Agriculture ICAR: New Delhi; 1961. 3. Desikachary TV: Cyanophyta ICAR: New Delhi; 1959. 4. Allakhverdiev SI, Sakamoto A, Nishiyama Y, Inaba M, Murata N: Ionic
and osmotic effects of NaCl induced inactivation of photo-system I and II in Synechococcus sp. Plant Physiol 2000,123:1047-1056.
5. Singh SC, Sinha RP, Häder DP: Role of lipids and fatty acids instress tolerance in cyanobacteria. Acta Protozool 2002,41:297-308.
6. Srivastava AK, Bhargava P, Rai LC: Salinity and copper-inducedoxidative damage and changes in antioxidative defense sys-tem of Anabaena doliolum. World J Microbiol Biotechnol 2005,22:1291-1298.
7. Fulda S, Huang F, Nilsson F, Hagemann M, Norling B: Proteomics ofSynechocystis sp. strain PCC 6803 Identification of periplas-mic proteins in cells grown at low and high salt concentra-tions. Eur J Biochem 2000, 267:5900-5907.
8. Srivastava AK, Bhargava P, Thapar R, Rai LC: A physiological andproteomic analysis of salinity induced changes in Anabaenadoliolum. Environ Exp Bot 2008, 64:49-57.
9. Golubic S: Halophily and halotolerance in cyanophytes. OriginLife 1980, 10:169-183.
10. Stal LJ: Cyanobacteria: Diversity and versatility, clues to life inextreme environment. In Algae and Cyanobacteria in Extreme Envi-ronment Edited by: Seckbach J. The Netherlands: Springer;2007:659-680.
11. Rejmánková E, Komárek J, Komárková J: Cyanobacteria – aneglected component of biodiversity: patterns of speciesdiversity in inland marshes of northern Belize (CentralAmerica). Diversity Distrib 2004, 10:189-199.
12. Gietler L: Cyanophyceae 14. In Kryptogamenflora von DeutschlandÖsterreich und der Schweiz by Rabenhorst L Leipzig. Akademische. Ver-lagsgesellschaft; 1932.
Page 15 of 17(page number not for citation purposes)
Saline Systems 2009, 5:4 http://www.salinesystems.org/content/5/1/4
13. Rippka R, Deruelles J, Waterbury JB, Herdman M, Stenier RY:Generic assignments, strain histories and properties of purecultures of cyanobacteria. J Gen Microbiol 1979, 111:1-61.
14. Anagnostidis K, Komárek J: Modern approach to the classifica-tion system of cyanophytes. 3. Oscillatoriales. Arch Hydrobiol1989, 80(Suppl):327-472.
15. Nübel U, Garcia-Pichel F, Clavero E, Muyzer G: Matching molecu-lar diversity and ecophysiology of benthic cyanobacteria anddiatoms in communities along a salinity gradient. EnvironMicrobiol 2000, 2:217-226.
16. Robertson BR, Tezuka N, Watanabe MM: Phylogenetic analysesof Synechococcus strains (cyanobacteria) using sequences of16S rDNA and part of the phycocyanin operon reveal multi-ple evolutionary lines and reflect phycobilin content. Int J SystEvol Microbiol 2001, 51:861-871.
17. Muyzer G, de Waal EC, Uitterlinden AG: Profiling of complexmicrobial populations by denaturing gradient gel electro-phoresis analysis of polymerase chain reaction-amplifiedgenes coding for 16S rRNA. Appl Environ Microbiol 1993,59:695-700.
18. Garcia-Pichel F, Cortes AL, Nübel U: Phylogenetic and morpho-logical diversity of cyanobacteria in soil desert crusts fromthe Colorado plateau. Appl Environ Microbiol 2001, 67:1902-1910.
19. Redfield E, Barns SM, Belnap J, Daane LL, Kuske CR: Comparativediversity of composition of cyanobacteria in three predomi-nant soil crusts of the Colorado Plateau. FEMS Microbiol Ecol2002, 40:55-63.
20. Sigler WB, Bachofen R, Zeyer J: Molecular characterization ofendolithic cyanobacteria inhabiting exposed dolomite incentral Switzerland. Environ Microbiol 2003, 5:618-627.
21. Papke RT, Ramsing NB, Bateson MM, Ward DM: Geographical iso-lation in hot spring cyanobacteria. Environ Microbiol 2003,5:650-659.
22. Jungblut AD, Hawes I, Mountfort D, Hitzfeld B, Dietrich DR, BurnsBP, Neilan BA: Diversity within cyanobacterial mat communi-ties in variable salinity meltwater ponds of McMurdo iceshelf, Antarctica. Environ Microbiol 2005, 7:519-529.
23. Geiß U, Selig U, Schumann R, Steinbruch R, Bastrop R, Hagemann M,Schoor A: Investigations on cyanobacterial diversity in a shal-low estuary (Southern Baltic Sea) including genes relevantto salinity resistance and iron starvation acclimation. EnvironMicrobiol 2004, 6:377-387.
24. Baker JA, Entsch B, Neilan BA, McKay DB: Monitoring changingtoxigenicity of a cyanobacterial bloom by molecular meth-ods. Appl Environ Microbiol 2002, 68:6070-6076.
25. Neilan BA, Jacobs D, Goodman AE: Genetic diversity and phylog-eny of toxic cyanobacteria determined by DNA polymor-phisms within the phycocyanin locus. Appl Environ Microbiol1995, 61:3875-3883.
26. Tillett D, Parker DL, Neilan BA: Detection of toxigenicity by aprobe for the microcystin synthetase a gene (mcya) of thecyanobacterial genus Microcystis: comparison of toxicitieswith 16S rRNA and phycocyanin operon (phycocyanin inter-genic spacer) phylogenies. Appl Environ Microbiol 2001,67:2810-2818.
27. Nayak S, Prasanna R: Soil pH and its role in cyanobacteria abun-dance and diversity in rice field soils. Appl Ecol Environ Res 2007,5:103-113.
28. Tiwari ON, Singh HT: Biodiversity of cyanobacteria in Loktaklake and rice fields of Manipur, India having acidic properties.Proc Natl Acad Sci India B Bio Sci 2005, 75:209-213.
29. Khan ZUM, Tahmida Begum ZN, Mandal R, Hossain M: Cyanobac-teria in rice soil. World J Microbiol Biotechnol 1994, 10:296-298.
30. Pereira I, Moya M, Reyes G, Kramm V: A survey of heterocystousnitrogen-fixing cyanobacteria in Chilean rice fields. GayanaBot 2005, 62:26-32.
31. Ali S, Sandhu GR: Blue-green algae of the saline soils of thePunjab. Oikos 1972, 23:268-272.
32. Kim JD, Lee CG: Diversity of heterocystous filamentous cyano-bacteria (blue-green algae) from rice paddy fields and theirdifferential susceptibility to ten fungicides used in Korea. JMicrobiol Biotechnol 2006, 16:240-246.
33. Irisarri P, Gonnet S, Monza J: Cyanobacteria in Uruguayan ricefields: diversity, nitrogen fixing ability and tolerance to her-bicides and combined nitrogen. J Biotechnol 2001, 91:95-103.
34. Song T, Mårtensson L, Ericsson T, Zheng W, Rasmussen U: Biodi-versity and seasonal variation of the cyanobacterial assem-blage in a rice paddy in Fujian, China. FEMS Microbiol Ecol 2005,54:131-140.
35. Stal LJ: The metabolic versatility of the mat-building cyano-bacteria Microcoleus chthonoplastes and Oscillatoria limosaand its ecological significance. Algol Studies 1991, 64:453-467.
36. El-Karim AHA, El-Mahi YE, El-Tilip AM: The influence of soil type,salinity and sodicity on ammonia volatilization in soil ferti-lized with urea. Ann Agri Sci (Cairo) 2004, 49:401-411.
37. Córdova-Kreyos AL, Cao Y, Green PG, Hwang HM, Kuivila KM, LaM-ontagne MG, Werfhorst LC Van De, Holden PA, Scow KM: Diver-sity, composition and geographical distribution of microbialcommunity in California salt marsh sediments. Appl EnvironMicrobiol 2006, 72:3357-3366.
38. Onkware AO: Effect of soil salinity on plant distribution andproduction at Loburu delta, Lake Bogoria national reserve,Kenya. Austral Ecol 2000, 25:140-149.
39. Tanji K: Agricultural Salinity Assessment and Management AmericanSociety of Civil Engineers; 1990.
40. Alahari A, Apte SK: Pleiotropic effects of potassium deficiencyin a heterocystous, nitrogen-fixing cyanobacterium, Ana-baena torulosa. Microbiology 1998, 144:1557-1563.
41. Parker DL, Kumar HD, Rai LC, Singh JB: Potassium salts inhibitgrowth of Microcystis sp in pond water and in defined media-Implication for control of microcystin producing aquaticblooms. Appl Environ Microbiol 1997, 63:2324-2329.
42. Kopittke PM, Menzies NW: Effect of pH on Na-induced Ca defi-ciency. Plant Soil 2005, 269:119-129.
43. Arora A, Saxena S: Phosphorus requirement of Azolla micro-phylla. Soil Nutrient Water Manag 2005, 30:25-26.
44. Rodríguez H, Fraga R: Phosphate solublizing bacteria and theirrole in plant growth promotion. Biotechnol Adv 1999,17:319-339.
45. Fernández Valiente E, Ucha A, Quesada A, Leganés F, Carreres R:Contribution of N2 fixing cyanobacteria to rice production:availability of nitrogen from 15N-labelled cyanobacteria andammonium sulphate to rice. Plant Soil 2000, 221:107-112.
46. Kefford BJ: Is salinity the only water quality parameter aff-fected when saline water is disposed in river? Int J Salt Lake Res1998, 7:285-300.
47. Tirkey J, Adhikary SP: Cyanobacteria in biological soil crusts ofIndia. Curr Sci 2005, 89:515-521.
48. Myers RM, Fischer SG, Lerman LS, Maniatis T: Nearly all singlebase substitutions in DNA fragments joined to a GC-clampcan be detected by denaturing gradient gel electrophoresis.Nucleic Acids Res 1985, 13:3131-3145.
49. Teaumroog N, Innok S, Chunleuchanon S, Boonkerd N: Diversity ofnitrogen fixing cyanobacteria under various ecosystems ofThailand: I morphology, physiology and genetic diversity.World J Microbiol Biotechnol 2002, 18:673-682.
50. Ferris MJ, Ruff-Roberts AL, Kopczynski ED, Bateson MM, Ward DM:Enrichment culture and microscopy conceal diverse ther-mophilic Synechococcus population in a single hot springmicrobial mat habitat. Appl Environ Microbiol 1996, 62:1045-1050.
51. Giovannoni SJ, Britschgi TB, Moyer CL, Field KG: Genetic diversityin Sargasso Sea bacterioplankton. Nature 1990, 345:60-63.
52. Rajaniemi P, Hrouzek P, Kastovšká K, Williame R, Ranata A, Hoff-mann L, Komárek J, Sivonen K: Phylogenetic and morphologicalevaluvation of the genera Anabaena, Aphanizomenon, Tri-chormus and Nostoc (Nostocales, Cyanobacteria). Int J Syst EvolMicrobiol 2005, 55:11-26.
53. Gugger MF, Hoffmann L: Polyphyly of true branching cyanobac-teria (Stigonematales). Int J Syst Evol Microbiol 2004, 54:349-357.
54. Sihvonen LM, Lyra C, Fewer DP, Rajaniemi-Wacklin P, Lehtimäki JM,Mahlsten M, Sivonen K: Strains of the cyanobacterial generaCalothrix and Rivularia isolated from the Baltic sea displaycryptic diversity and are distantly related to Gloeotrichia andTolypothrix. FEMS Microbiol Ecol 2007, 61:74-84.
55. Zulpa de Caire G, Storni de Cano M, Zaccaro de Mulé MC, Palma RM,Colombo K: Exopolysaccharide of Nostoc muscorum (Cyano-bacteria) in the aggregation of soil particles. J Appl Phycol 1997,9:249-253.
56. Litavaitis MK: A molecular test of cyanobacterial phylogeny:inferences from constraint analyses. Hydrobiologia 2002,468:135-145.
Page 16 of 17(page number not for citation purposes)
http://www.ncbi.nlm.nih.gov/entrez/query.fcgi?cmd=Retrieve&db=PubMed&dopt=Abstract&list_uids=7683183
http://www.ncbi.nlm.nih.gov/entrez/query.fcgi?cmd=Retrieve&db=PubMed&dopt=Abstract&list_uids=7683183
http://www.ncbi.nlm.nih.gov/entrez/query.fcgi?cmd=Retrieve&db=PubMed&dopt=Abstract&list_uids=7683183
http://www.ncbi.nlm.nih.gov/entrez/query.fcgi?cmd=Retrieve&db=PubMed&dopt=Abstract&list_uids=8526499
http://www.ncbi.nlm.nih.gov/entrez/query.fcgi?cmd=Retrieve&db=PubMed&dopt=Abstract&list_uids=8526499
http://www.ncbi.nlm.nih.gov/entrez/query.fcgi?cmd=Retrieve&db=PubMed&dopt=Abstract&list_uids=8526499
http://www.ncbi.nlm.nih.gov/entrez/query.fcgi?cmd=Retrieve&db=PubMed&dopt=Abstract&list_uids=9639926
http://www.ncbi.nlm.nih.gov/entrez/query.fcgi?cmd=Retrieve&db=PubMed&dopt=Abstract&list_uids=4000972
http://www.ncbi.nlm.nih.gov/entrez/query.fcgi?cmd=Retrieve&db=PubMed&dopt=Abstract&list_uids=4000972
http://www.ncbi.nlm.nih.gov/entrez/query.fcgi?cmd=Retrieve&db=PubMed&dopt=Abstract&list_uids=2330053
Saline Systems 2009, 5:4 http://www.salinesystems.org/content/5/1/4
Publish with BioMed Central and every scientist can read your work free of charge
"BioMed Central will be the most significant development for disseminating the results of biomedical research in our lifetime."
Sir Paul Nurse, Cancer Research UK
Your research papers will be:
available free of charge to the entire biomedical community
peer reviewed and published immediately upon acceptance
cited in PubMed and archived on PubMed Central
yours — you keep the copyright
Submit your manuscript here:http://www.biomedcentral.com/info/publishing_adv.asp
BioMedcentral
57. Jaspers E, Overmann J: Ecological significance of microdiversity:identical 16S rRNA gene sequences can be found in bacteriawith highly divergent genomes and ecophysiologies. Appl Envi-ron Microbiol 2004, 70:4831-4839.
58. Nübel U, Garcia-Pichel F, Kühl M, Muyzer G: Quantifying micro-bial diversity: morphophytes, 16S rRNA genes, and caroten-oids from oxygenic phototrophs in microbial mats. ApplEnviron Microbiol 1999, 65:422-430.
59. De Phillippis R, Vincenzini M: Extracellular polysaccharides fromcyanobacteria and their possible applications. FEMS MicrobiolRev 1998, 22:151-175.
60. Mollenhauer D, Bengtsson R, Lindstrøm EA: Macroscopic cyano-bacteria of the genus Nostoc : a neglected and endangeredconstituent of European inland aquatic biodiversity. Eur J Phy-col 1999, 34:349-360.
61. Staal M, Meysman FJR, Stal LJ: Temperature excludes N2-fixingheterocystous cyanobacteria in tropical oceans. Nature 2003,425:504-507.
62. Quesada A, Fernández-Valiente E: Relationship between abun-dance of N2-fixing cyanobacteria and environmental featuresof Spanish rice fields. Microb Ecol 1996, 32:59-71.
63. Roger PA, Santiago-Ardales S, Reddy PM, Watanabe I: The abun-dance of heterocystous blue-green algae in rice soils andinocula used for application in rice fields. Biol Fertil Soils 1987,5:98-105.
64. Anderson JM, Ingram JSI: Tropical Soil Biology and Fertility: A Hand Bookof Methods CAB International. Oxford; 1993.
65. Olsen SR, Cole CV, Watanabe FS, Dean LA: Estimation of availablephosphorus in soils by extraction with sodium bicarbonate USDA Circ 939.US Gov. Print. Office, Washington, DC; 1954.
66. American Public Health Association (APHA): Standard method forexamination of water and waste water 16th edition. Washington D.C:APHA; 1985.
67. American Public Health Association (APHA): Standard methods for theexamination of water and wastewater 19th edition. Washington DC:APHA; 1995.
68. Jackson ML: Soil Chemical Analysis New Delhi: Prentice-Hall of IndiaPrivate Limited; 1967:197-201.
69. Srivastava AK, Ara A, Bhargava P, Mishra Y, Rai SP, Rai LC: A rapidand cost effective method of genomic DNA isolation fromcyanobacterial mat and soil suitable for genomic fingerprint-ing and community analysis. J Appl Phycol 2007, 19:373-382.
70. Nübel U, Garcia-Pichel F, Muyzer G: PCR primers to amplify 16SrRNA genes from cyanobacteria. Appl Environ Microbiol 1997,63:3327-3332.
71. Boutte C, Grubisic S, Balthasart P, Wilmotte A: Testing of primersfor the study of cyanobacterial molecular diversity by DGGE.J Microbiol Methods 2005, 65:542-550.
72. Larkin MA, Blackshields G, Brown NP, Chenna R, McGettigan PA,McWilliam H, Valentin F, Wallace IM, Wilm A, Lopez R, ThompsonJD, Gibson TJ, Higgins DG: ClustalW and ClustalX version 2.0.Bioinformatics 2007, 23:2947-2948.
73. Altschul SF, Madden TL, Schaffer AA, Zhang J, Zhang Z, Miller W, Lip-man DJ: Gapped BLAST and PSI-BLAST: A new generation ofprotein database search programs. Nucl Acids Res 1997,25:3389-3402.
74. Tajima F, Nei M: Estimation of evolutionary distance betweennucleotide sequences. Mol Biol Evol 1984, 1:269-285.
75. Saitou N, Nei M: The neighbor-joining method: A new methodfor reconstructing phylogenetic trees. Mol Biol Evol 1987,4:406-425.
76. Tamura K, Dudley J, Nei M, Kumar S: MEGA4: Molecular Evolu-tionary Genetics Analysis (MEGA) software version 4.0. MolBiol Evol 2007, 24:1596-1599.
77. Coenye T, Falsen E, Hoste B, Ohlen M, Goris J, Govan JRW, Gillis M,Vandamme P: Description of Pandoraea gen. nov. with Pando-raea apista sp. nov., Pandoraea pulmonicola sp. nov., Pando-raea pnomenusa sp. nov., Pandoraea sputorum sp. nov. andPandoraea norimbergensis comb. nov. Int J Syst Evol Microbiol2000, 50:887-899.
Page 17 of 17(page number not for citation purposes)
http://www.ncbi.nlm.nih.gov/entrez/query.fcgi?cmd=Retrieve&db=PubMed&dopt=Abstract&list_uids=9925563
http://www.ncbi.nlm.nih.gov/entrez/query.fcgi?cmd=Retrieve&db=PubMed&dopt=Abstract&list_uids=9925563
http://www.ncbi.nlm.nih.gov/entrez/query.fcgi?cmd=Retrieve&db=PubMed&dopt=Abstract&list_uids=9925563
http://www.ncbi.nlm.nih.gov/entrez/query.fcgi?cmd=Retrieve&db=PubMed&dopt=Abstract&list_uids=8661537
http://www.ncbi.nlm.nih.gov/entrez/query.fcgi?cmd=Retrieve&db=PubMed&dopt=Abstract&list_uids=8661537
http://www.ncbi.nlm.nih.gov/entrez/query.fcgi?cmd=Retrieve&db=PubMed&dopt=Abstract&list_uids=9251225
http://www.ncbi.nlm.nih.gov/entrez/query.fcgi?cmd=Retrieve&db=PubMed&dopt=Abstract&list_uids=9251225
http://www.ncbi.nlm.nih.gov/entrez/query.fcgi?cmd=Retrieve&db=PubMed&dopt=Abstract&list_uids=9254694
http://www.ncbi.nlm.nih.gov/entrez/query.fcgi?cmd=Retrieve&db=PubMed&dopt=Abstract&list_uids=9254694
http://www.ncbi.nlm.nih.gov/entrez/query.fcgi?cmd=Retrieve&db=PubMed&dopt=Abstract&list_uids=6599968
http://www.ncbi.nlm.nih.gov/entrez/query.fcgi?cmd=Retrieve&db=PubMed&dopt=Abstract&list_uids=6599968
http://www.ncbi.nlm.nih.gov/entrez/query.fcgi?cmd=Retrieve&db=PubMed&dopt=Abstract&list_uids=3447015