district human development report uttar dinajpur - IM4Change
400
DISTRICT HUMAN DEVELOPMENT REPORT UTTAR DINAJPUR DEVELOPMENT & PLANNING DEPARTMENT GOVERNMENT OF WEST BENGAL
-
Upload
khangminh22 -
Category
Documents
-
view
1 -
download
0
Transcript of district human development report uttar dinajpur - IM4Change
DISTRICTHUMAN
DEVELOPMENTREPORT
UTTAR DINAJPUR
DEVELOPMENT & PLANNING DEPARTMENT
GOVERNMENT OF WEST BENGAL
District Human Development Report: Uttar Dinajpur
© Development and Planning DepartmentGovernment of West Bengal
First PublishedFebruary, 2010
All rights reserved. No part of this publication may be reproduced, stored or transmitted in anyform or by any means without the prior permission from the Publisher.
Front Cover Photograph: A Jute Cultivator.Back Cover Photograph: Tea Garden in Uttar Dinajpur
Published by :HDRCCDevelopment & Planning DepartmentGovernment of West Bengal
Setting and Design By:Saraswaty Press Ltd.(Government of West Bengal Enterprise)11 B.T. Road, Kolkata 700056
Printed by:Saraswaty Press Ltd.(Government of West Bengal Enterprise)11 B.T. Road, Kolkata 700056
While every care has been taken to reproduce the accurate data, oversights/errors may occur. Iffound, please convey it to the Development and Planning Department, Government of WestBengal.

For over three Decades, planning efforts in West Bengal have focused around an alternativemodel that seeks to bring about development equity through the reduction of disparities betweenthe State's rural and urban areas. The primary instruments for this have been the principles ofdevelopment, decentralisation, devolution, and participatory inclusion, which have fostered thepartnership between planning institutions and the people, reflected in the Panchayat experiencein West Bengal. As many independent studies have shown, the success of West Bengal insecuring livelihood stability, in uplifting rural literacy standards and in improving agriculturalproductivity is associated closely with the strength of this progressive partnership.
However, planners in the State have been aware that although these achievementsappear impressive in aggregate terms, they have sometimes been uneven at regional level,and that not all parts of the State have been able to share in equal measure in the fruits ofsuccess. Since the early 1990s, the State Government has had to function within a changingnational policy framework where public investment support for rural development planning hasdeclined considerably. While the advanced regions of West Bengal responded quickly to theearly successes, the development needs of regions that lagged behind have been inadequatelymet from within the limited means available to the State Government. With clearer understandingof regional dimensions in West Bengal being generated by subsequent development studies,it has become increasingly evident that the development strategies being applied to the Stateneed to be differentiated regionally, with full recognition of local factors such as climate,environment and infrastructural conditions. This approach has been inducted into thedevelopment policies of the State Government through the formation of regional boards to lookinto the specialised needs of the Sundarbans, the Paschimanchal and Uttarbanga regionsand the Darjeeling hill areas.
Integration of human development concepts into development planning in West Bengalcommenced with the preparation of the first West Bengal Human Development Report (WBHDR)which was published in 2004 by the Development & Planning Department, Government ofWest Bengal. The District Human Development Reports (DHDRs) now being prepared in WestBengal had their genesis in the tripartite agreement between the Planning Commission, theGovernment of West Bengal and the UNDP for strengthening human development planning
Minister-in-ChargeDepartment of Commerce & Industries, Industrial Reconstruction,
Public Enterprises, Development & Planning &Power Non-conventional Energy Sources
GOVERNMENT OF WEST BENGALE-mail : [email protected]
Foreword
Writers’ Buildings, Kolkata 700 001 Ph : 2214 5919/3475 Fax : 2214 49004, Abanindranath Tagore Sarani (Camac Street), 6th floor, Kolkata 700 016 Ph. : 2282 0770/2282 0771 Fax : 2282 0769
Poura Bhawan, FD-415A, Bidhannagar, 5th floor, Kolkata 700 106 Ph. : 2321 1113 Fax : 2321 1827
NIRUPAM SEN

Writers’ Buildings, Kolkata 700 001 Ph : 2214 5919/3475 Fax : 2214 49004, Abanindranath Tagore Sarani (Camac Street), 6th floor, Kolkata 700 016 Ph. : 2282 0770/2282 0771 Fax : 2282 0769
Poura Bhawan, FD-415A, Bidhannagar, 5th floor, Kolkata 700 106 Ph. : 2321 1113 Fax : 2321 1827
capabilities in the State Plan. For the State Government, this collaboration held the potentialof carrying forward its programme for decentralisation and devolution of development decision-making to local governance institutions, to ensure fuller and more meaningful participation ofthe people in the planning process. The selection of the backward districts of Malda andBankura for the initial DHDR exercises marks the resolve of the State Government to addresslocal factors that cause disparity and inhibit development, in regions where their impact hasbeen most severe, also vindicating the ability of the Human Development approach to redirectpolicy attention to areas where it is most needed. The DHDRs already published for threedistricts in West Bengal have been widely studied in other States, generating considerableinterest in the unfinished task of district level planning.
Some of the critical problems that West Bengal has had to face since 1947 arise fromits border location, which affects development patterns in ten West Bengal districts locatedalong the 2217 km Indo-Bangladesh border. Uttar Dinajpur is one among these, and itsbackwardness is directly related to its geographical situation. The Uttar Dinajpur District HumanDevelopment Report 2010 has been prepared by an interdisciplinary team of administrators,academicians and people's representative, through a consultative process led by ProfessorJeta Sankritayayana, Member, West Bengal State Planning Board. The Uttar Dinajpur DHDRpresents a vivid picture of the State of human development in the district, identifying thecomplexities of its regional and administrative history, its cultural and linguistic diversity, andtheir combined impact on its attainments in the sphere of livelihood, education and health. Irecord my deep appreciation of the painstaking effort put in by the team.
It is hoped that the DHDR will serve as a primary document for building a district visionand for assessing and redressing disparities within the district, and shall strengthen thecapabilities of the District planning system in meeting people's aspirations and needs.
Kolkata, (Nirumap Sen)February, 2010
Minister-in-ChargeDepartment of Commerce & Industries, Industrial Reconstruction,
Public Enterprises, Development & Planning &Power Non-conventional Energy Sources
GOVERNMENT OF WEST BENGALE-mail : [email protected]
NIRUPAM SEN

viivii
Uttar Dinajpur
Preface
The Uttar Dinajpur District Human Development Report [UDDHDR], 2010 is presented inthe second phase of studies undertaken to document regional human development in the state ofWest Bengal at district and sub-district level, as part of the project for Strengthening State Plans forHuman Development [SSPHD] sponsored by the UNDP, the Planning Commission and theGovernment of West Bengal. The principal objective in writing this report has been to inform,influence and transform district planning processes in Uttar Dinajpur by reviewing the state ofhuman development attainments in different parts of the district and identifying development issuesthat will need to be resolved so that human development in the district can become more inclusiveand holistic, touching the lives of all residents in Uttar Dinajpur. Despite statutory provisions underwhich a district and its constituent blocks are defined as basic planning units in India, districtplanning has so far been handicapped by the lack of planning documentation of adequate spatialand analytical depth. While bridging this gap in the case of Uttar Dinajpur, the UDDHDR, 2010also lays a foundation for integrated district planning that can ensure that development benefitspercolate to all sub-regions and all stake-holders in Uttar Dinajpur.
Uttar Dinajpur is placed among the least developed districts in West Bengal as well as inIndia, with high levels of illiteracy, low health-care and livelihood access and wide-spread ruralpoverty. Although it is a predominantly agricultural district, rapid population escalation restrictsthe absorption of new rural workers into farm-based employment, while low levels of urbanisationrestrain the growth of the non-farm sector. Medium and long range district planning strategy mustaccordingly focus on the diversification of economic activities by leveraging human developmentvariables like education and improved healthcare, so that the district can ascend the developmentladder through an alternative path. Identifying persisting roadblocks in different development blocksof Uttar Dinajpur through human development indexing, the UDDHDR, 2010 also outlines corestrategies for the road ahead which can be followed fruitfully by the panchayats, the block planningauthorities and the District Planning Committee [DPC] in prioritising development interventionswhile integrating sub-district level plans into a consolidated human development plan for UttarDinajpur. By encouraging the visualisation of current development processes and problems inUttar Dinajpur from village and block level perspectives, the UDDHDR, 2010 also seeks to facilitatethe evolution of a bottom-up approach which can strengthen convergence between administrativeauthorities, Panchayati Raj Institutions [PRIs] and other development stakeholders, thus holdingthe key to effective decentralised planning.
The Uttar Dinajpur DHDR examines the basic attributes of human development namely,educational attainments, health attainments and livelihood attainments, in the district of UttarDinajpur at the level of its constituent blocks, and occasionally also at Gram Panchayat level. Thisdisaggregated exercise was undertaken in order to capture regional disparities within the district,drawing focus to human development issues that assume significance at sub-district level. Having
Human Development Report 2010
viii
been reconstituted as a separate district in 1992 after the bifurcation of the erstwhile West Dinajpurdistrict, district planning in Uttar Dinajpur is still in its infancy, although the creation of the newdistrict has a long history behind it, stretching back to the 1947 Partition as well as the 1956transfer of territories from Bihar to West Bengal. The present human development problems ofUttar Dinajpur thus have an inherited nature, and are rooted in internal development disparitieswithin the district. Besides poor educational, health-care and economic attainments, the districtwitnesses pervasive poverty which is amplified by agro-climatic constraints, livelihood limitationsand population migration, creating a vicious circle where development interventions have alsobeen blunted by the unfinished process of administrative reorganisation. Along with the highlyparticipatory nature of the DHDR process entailing continuous interaction with multiplestakeholders, visual recall of the regional disparities that became evident within Uttar Dinajpurwhile travelling the length and breadth of the district, aided the initial conceptualisation of theseproblems.
Delineation of these human development problems in the UDDHDR required thecompilation of a strong statistical data-base for the district, drawing from the large online data-bases of the population Census, the Agricultural Census, the School Education survey, the RuralHousehold survey and MIS data from the DISE and NREGS systems, as well as the data compilationsregularly published by the Bureau of Applied Economics & Statistics [BAE&S], Government ofWest Bengal. These were supplemented by departmental data drawn from within the Governmentsystem, which were made available by the Office of the District Magistrate, the offices of the CMOHand ICDS, the DIC and the Sarva Siksha Mission, etc., as well as the Uttar Dinajpur Zilla Parishad[UDZP]. The responsibility of seeking out and compiling the UDDHDR data-base from thesemultiple data sources, and of subsequently maintaining, managing and tabulating the data hasrested from the outset on Prof. Jeta Sankrityayana. The UDDHDR data-base is a key resource forfuture human development planning in Uttar Dinajpur and will provide considerable support tothe District Administration and the DPC in discharging their statutory planning responsibilities.
The DHDR process was initiated at a lively inception workshop held at Raiganj in earlyJuly, 2007, where the focal issues to be addressed by the UDDHDR, 2010, were synthesisedthrough situational analysis and detailed discussion between a cross section of developmentstakeholders drawn from the District Administration and its departments, the UDZP and its multipletiers, as well as from civil society groups, community based organisations and academic researchersfrom local and regional institutions. The workshop was facilitated by the HDRC Centre of theDevelopment & Planning Department, Government of West Bengal, and the West Bengal StatePlanning Board. Besides, identifying and validating the existing data sources, the workshop providedinputs for formulation of the detailed UDDHDR Concept Note which was discussed and endorsedat a subsequent technical workshop held in early September, 2007, where cross-disciplinary workinggroups comprising technical experts, elected representatives and administrators, academicresearchers and community workers were constituted for each of the DHDR study componentsdelineated in the concept note.
ixix
Uttar Dinajpur
While the working groups undertook the preliminary task of etching out the UDDHDRchapters, overall coordination was maintained by the UDDHDR Core Committee, with theSabhadhipati of the Uttar Dinajpur Zilla Parishad [UDZP], Smt. Jyotsna Rani Singha, as itsChairperson and Shri Sukumar Bhattacharya, IAS, District Magistrate, Uttar Dinajpur, in overalladministrative charge. The DHDR Cell at the Uttar Dinajpur district headquarters and its designatedofficers coordinated the UDDHDR activities and technical studies at the organisational level,maintaining liaison between working groups and the line departments, which also cooperatedwholeheartedly in providing relevant data inputs. The District Administration was responsive at alltimes to the logistic needs of the UDDHDR exercise, helping the UDDHDR team immensely,while the UDZP and individual DPC members actively supported the working groups andconsiderably enriched the present report with their participation.
Presentations on the Uttar Dinajpur DHDR at three different stages of the UDDHDR exercisewere also made at Kolkata at the Development & Planning Department, Government of WestBengal, in the presence of the Empowered Committee for the SSPHD project, representatives fromthe UNDP and the Planning Commission, Government of India, and members of the West BengalState Planning Board. The audience at these presentations which were chaired by Shri NirupamSen, Hon'ble MIC, Departments of Commerce & Industries, Industrial Reconstruction & PublicEnterprises and Development & Planning, Government of West Bengal, and steered by Smt. JayaDas Gupta, IAS, Principal Secretary of the Development & Planning Department, also includedrepresentatives from other district teams engaged in similar DHDR exercises in the second phaseof SSPHD studies. The knowledgeable comments received from discussants at these presentationshave aided in refining the analytical focus of the present report.
Smt. Jaya Das Gupta, IAS, Principal Secretary of the Development & Planning Department,Government of West Bengal, has been at the helm of the second phase of DHDR exercises at theState level from start to finish, and has guided and facilitated all activities that have gone into thepreparation of the UDDHDR. Her support and appreciation of the pioneering nature of DHDRstudies has been invaluable in strengthening the quality of this report. Smt. Kalyani Sarkar, IAS,Director, EMM & Ex officio Special Secretary, Development & Planning Department, Governmentof West Bengal, and Nodal Officer at the HDRC Centre at the Development & Planning Department,kept the ball rolling through various stages of the exercise, with able organisational and technicalsupport being extended by Smt. Sayantani Ghosal, NUNV, HDRC, Smt. Gargi Ghosh, NUNV,HDRC, and Shri Subhronil Ganguly of the Gender Resource Cell at the HDRC Centre at theDevelopment & Planning Department.
The Uttar Dinajpur DHDR is the outcome of more than a year of consultations betweenlocal governance authorities, administrators, development agencies, research institutions, voluntaryorganisations and civil society, acting as stakeholders in the human development of Uttar Dinajpur.Shri P.K.Sengupta, IAS, the then holding charge as District Magistrate, Uttar Dinajpur, Smt. JyotsnaRani Singha, the then Sabhadhipati of the Uttar Dinajpur Zilla Parishad, and Shri Manoranjan Das,

Human Development Report 2010
x
Vice-Chairman of the District Planning Committee, Uttar Dinajpur, provided the initial impetus forthe initiation of the UDDHDR exercise at district level. Shri Sukumar Bhattacharya, IAS, whosubsequently assumed charge as District Magistrate, Uttar Dinajpur, maintained a keen interest inthe progress of the exercise and ensured that all administrative support was extended to the studiesundertaken by the UDDHDR team. Shri P.K. Dutta, Additional District Magistrate (Development),Uttar Dinajpur, and Shri Enaur Rahman, ADM (Land Revenue), Uttar Dinajpur, were instrumentalin maintaining coordination and in evening out the workflows from the start to the completion ofthe UDDHDR exercise. Shri Manoranjan Das, Vice-Chairperson, DPC, Uttar Dinajpur, drew freelyfrom his uncommonly deep understanding of development processes and problems in UttarDinajpur, thus making an important contribution to the medium and long range visioning of regionalexperiences and latent development potentials in Uttar Dinajpur. The contribution made by ShriSudip Mukherjee, Coordinator, NREGS, Uttar Dinajpur, in smoothening the UDDHDR exercisealso merits special mention because of the high level of capability he constantly demonstratedwhile organising and supervising liaison activities and providing logistic support to the UDDHDRteam.
The UDDHDR working group on Education, which included the DI (Primary Education)and the DI (Secondary Education), the DPO, Sarva Siksha Mission, Smt. Dola Ray, District NodalOfficer, SSK & MSK, and Shri Amitava Dutta, DYO, Uttar Dinajpur, as its members, was led by ShriPrasanta Basak, Headmaster, Chopra High School, who was also responsible for drafting the initialoutline of the chapter on Education in Uttar Dinajpur. Additional inputs on the proliferation ofeducation in Uttar Dinajpur, and the status of educational infrastructure and madrasah educationwere provided subsequently by Prof. Jeta Sankrityayana.
The UDDHDR working group on Health-care was led by Dr. Chandreyee Das of HijliINSPIRATION, and included the Executive Engineer, PHE, the District Coordinator, TSP, the DPO,ICDS, Shri Arup Sanyal from the Department of Economics, Surendranath College, Raiganj, ShriJagabandhu and Shri M.N. Ghosh from St. John's Ambulance, Shri Prosenjit Datta from the RedCross, Shri Jayanta Bhowmik from SRISTEE, and Dr. Prabir Chatterjee from UNICEF, as well as theCMOH, Uttar Dinajpur. The initial outline draft of the chapter on Healthcare in Uttar Dinajpur wasprepared by Dr. Chandreyee Das. Several additional inputs from Prof. Jeta Sankrityayana on diseaseincidence, health service norms and overall health-care performance in Uttar Dinajpur wereincorporated subsequently.
The UDDHDR working group on Economic Livelihoods was led by Dr. Nandadulal Banerjeefrom the Department of Economics of Raiganj University College, assisted by Shri Chandan Rayfrom the Department of Economics, Kaliaganj College, and included Shri Asim Sarker, ADO, Dr.Sajal Bhunia, Deputy Director, ARD, the District Fisheries Officer, the District Horticultural Officer,the General Manager, DIC, Shri D. Mallick, MD, Milk Union, Shri Manoj Mitra, District Coordinator,SRD, DRDC, and Shri Bhaskar Sarkar from SRISTEE as its members. The outline draft of the chapteron Economic Livelihoods in Uttar Dinajpur was prepared by Dr. Nandadulal Banerjee and Shri
xixi
Uttar Dinajpur
Chandan Ray. Additional inputs were incorporated by Shri Anjan Chakraborty, Lecturer inEconomics, St. Joseph's College, Darjeeling, Smt. Panchali Sengupta, Senior Research Fellow atthe Department of Economics, North Bengal University, and Shri Jaideep Sengupta and Smt. DebjaniChowdhury, researchers at the Department of Economics, North Bengal University. Dr. AbdulHannan, who was then with the Centre for Education & Communication [CEC], New Delhi,prepared a status report on the new tea plantations in Uttar Dinajpur. Dr. Sanchari Roy Mukherjeeesubsequently contributed the analysis of work participation rates, while Prof. Jeta Sankrityayanacontributed reviews of the agrarian situation, the proliferation of irrigation and the performance ofNREGS in Uttar Dinajpur.
The UDDHDR working group on Women in Uttar Dinajpur was led by Dr. Sanchari RoyMukherjee, Director, Centre for Women's Studies, North Bengal University, with Smt. RanjitaChakraborty, Senior Lecturer in Political Science, North Bengal University, and representativesfrom several Gram Panchayats and women's SHGs in Uttar Dinajpur as its members. The outlinedraft of the chapter on Women's Situations in Uttar Dinajpur was prepared by Dr. Sanchari RoyMukherjee, with inputs from Smt. Ranjita Chakraborty and additional contributions from Smt.Sudakshina Ray Dutta, Lecturer (Selection Grade) in Economics, North Bengal University, andSmt. Panchali Sengupta, Senior Research Fellow, Department of Economics, North BengalUniversity.
The UDDHDR working group on Migration and Resettlement in Uttar Dinajpur was led byDr. Sanjay Roy, Reader in Sociology, North Bengal University, who prepared the working outlinefor the chapter, while the detailed study of long-term migration patterns from Census data-baseswas contributed by Prof. Jeta Sankrityayana and Dr. Sanchari Roy Mukherjee.
While the introductory regional profile of Uttar Dinajpur district was prepared by Prof. JetaSankrityayana, the computation and analysis of HDI and HPI indexes for Uttar Dinajpur districtwas carried out jointly by Dr. Sanchari Roy Mukherjee and Prof. Jeta Sankrityayana on the basis ofthe methodology developed earlier for the Malda District Human Development Report, 2007, tomaintain parity with index computations for other West Bengal districts. The outline strategy forhuman development in Uttar Dinajpur was compiled from detailed discussions on the DraftUDDHDR, 2009 with the members of the District Planning Committee and other stakeholdergroups in Uttar Dinajpur district.
Compilation of the UDDHDR, 2010 into its present format was accomplished throughthree consecutive stages. At the initial stage, the UDDHDR working groups undertook thepreparation of interim reports on their assigned themes and presented these at an interim workshopwhere progress was reported, data duplications were identified and removed and persisting datagaps were assessed. Incorporating the feedback from the workshop, the UDDHDR working groupsexpanded on their work, compiling outline drafts of their assigned chapters which were forwardedto the Lead Coordinator. At the second stage, the outline drafts were structured and assembled into
Human Development Report 2010
xii
a working DHDR draft by the UDDHDR Lead Coordinator, Dr. Sanchari Roy Mukherjee, whoalso vetted the analytical coverage and data accuracy in the light of the concept note, removinganomalies where they occurred and assigning gap areas to the supplementary contributors. Theseadditional inputs were assimilated into the Draft UDDHDR, 2010 which was presented for detaileddiscussion before the DPC and the SSPHD Empowered Committee. At the third stage, the UDDHDR,2010 in its final manuscript form was prepared by the Lead Author, Prof. Jeta Sankrityayana, afterreediting, restructuring and rewriting the preliminary draft wherever necessary, and adding thegraphic and GIS content. Thus the first shape to the chapters was given by the UDDHDR LeadCoordinator, while the Lead Author has reshaped the UDDHDR, 2010 into its final publishedform.
The UDDHDR exercise marked a period of intensive interaction, consultation and mutuallearning within a very large team of development stakeholders, with the objective of synthesising acommon vision for future human development in Uttar Dinajpur. The Uttar Dinajpur District HumanDevelopment Report, 2010 in its final form documents this synthesis. Each participant in this processcontributed uniquely to the final outcome, including those mentioned above, as well as the manycitizens of the district whose voices and aspirations are reflected in the report even though theirnames remain individually unacknowledged. It is hoped that development agencies and districtplanners alike will draw substance and support from this report, while transforming this vision intopractice. The ultimate impact of the report will then be shared by the ordinary people of UttarDinajpur.
Jeta Sankrityayana Sanchari Roy MukherjeeMember, West Bengal State Planning Board & Lead Coordinator &Lead Author, UDDHDR, 2010 Co-Author, UDDHDR, 2010Professor of Economics Reader in EconomicsNorth Bengal University North Bengal UniversityFebruary, 2010
xiiixiii
Uttar Dinajpur
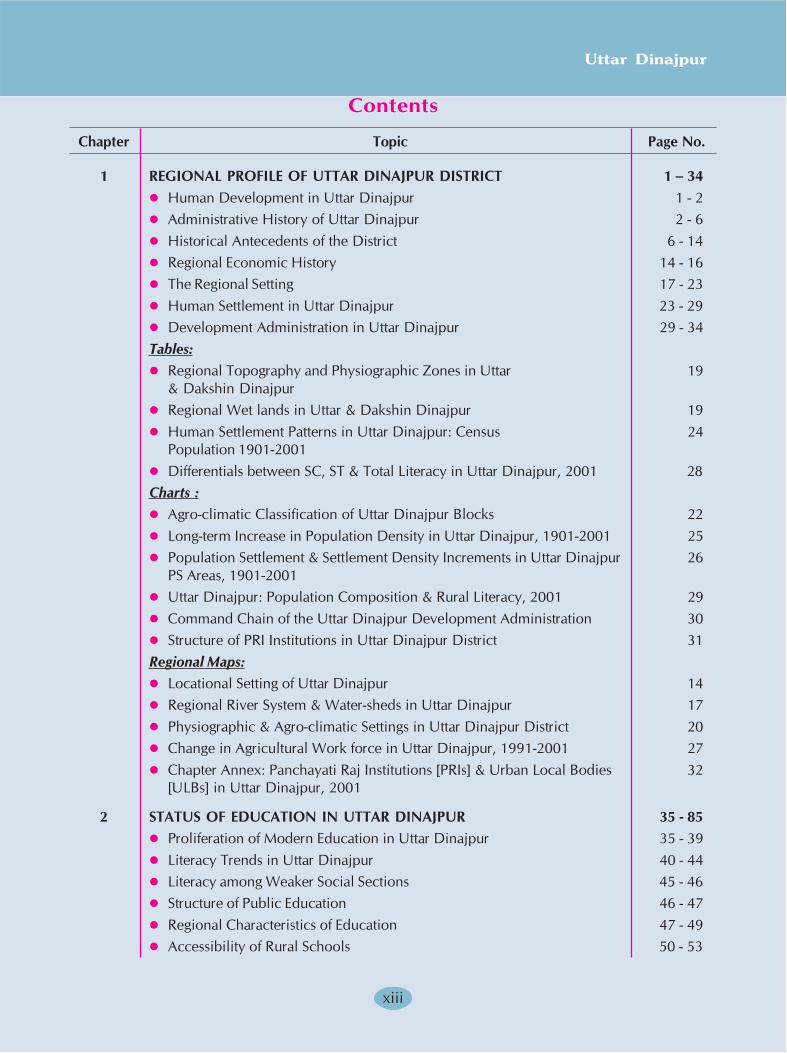
Contents
Chapter Topic Page No.
1 REGIONAL PROFILE OF UTTAR DINAJPUR DISTRICT 1 – 34
� Human Development in Uttar Dinajpur 1 - 2
� Administrative History of Uttar Dinajpur 2 - 6
� Historical Antecedents of the District 6 - 14
� Regional Economic History 14 - 16
� The Regional Setting 17 - 23
� Human Settlement in Uttar Dinajpur 23 - 29
� Development Administration in Uttar Dinajpur 29 - 34
Tables:
� Regional Topography and Physiographic Zones in Uttar 19
& Dakshin Dinajpur
� Regional Wet lands in Uttar & Dakshin Dinajpur 19
� Human Settlement Patterns in Uttar Dinajpur: Census 24
Population 1901-2001
� Differentials between SC, ST & Total Literacy in Uttar Dinajpur, 2001 28
Charts :
� Agro-climatic Classification of Uttar Dinajpur Blocks 22
� Long-term Increase in Population Density in Uttar Dinajpur, 1901-2001 25
� Population Settlement & Settlement Density Increments in Uttar Dinajpur 26
PS Areas, 1901-2001
� Uttar Dinajpur: Population Composition & Rural Literacy, 2001 29
� Command Chain of the Uttar Dinajpur Development Administration 30
� Structure of PRI Institutions in Uttar Dinajpur District 31
Regional Maps:
� Locational Setting of Uttar Dinajpur 14
� Regional River System & Water-sheds in Uttar Dinajpur 17
� Physiographic & Agro-climatic Settings in Uttar Dinajpur District 20
� Change in Agricultural Work force in Uttar Dinajpur, 1991-2001 27
� Chapter Annex: Panchayati Raj Institutions [PRIs] & Urban Local Bodies 32
[ULBs] in Uttar Dinajpur, 2001
2 STATUS OF EDUCATION IN UTTAR DINAJPUR 35 - 85
� Proliferation of Modern Education in Uttar Dinajpur 35 - 39
� Literacy Trends in Uttar Dinajpur 40 - 44
� Literacy among Weaker Social Sections 45 - 46
� Structure of Public Education 46 - 47
� Regional Characteristics of Education 47 - 49
� Accessibility of Rural Schools 50 - 53
Human Development Report 2010
xiv
Chapter Topic Page No.
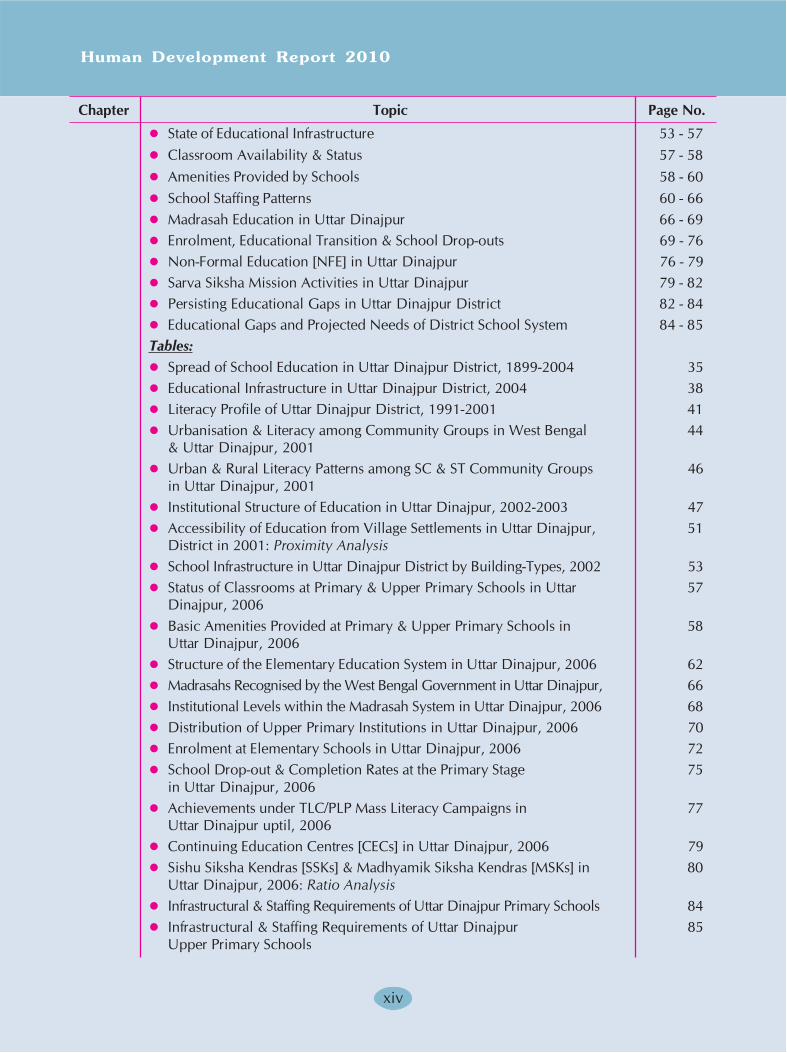
� State of Educational Infrastructure 53 - 57
� Classroom Availability & Status 57 - 58
� Amenities Provided by Schools 58 - 60
� School Staffing Patterns 60 - 66
� Madrasah Education in Uttar Dinajpur 66 - 69
� Enrolment, Educational Transition & School Drop-outs 69 - 76
� Non-Formal Education [NFE] in Uttar Dinajpur 76 - 79
� Sarva Siksha Mission Activities in Uttar Dinajpur 79 - 82
� Persisting Educational Gaps in Uttar Dinajpur District 82 - 84
� Educational Gaps and Projected Needs of District School System 84 - 85
Tables:
� Spread of School Education in Uttar Dinajpur District, 1899-2004 35
� Educational Infrastructure in Uttar Dinajpur District, 2004 38
� Literacy Profile of Uttar Dinajpur District, 1991-2001 41
� Urbanisation & Literacy among Community Groups in West Bengal 44
& Uttar Dinajpur, 2001
� Urban & Rural Literacy Patterns among SC & ST Community Groups 46
in Uttar Dinajpur, 2001
� Institutional Structure of Education in Uttar Dinajpur, 2002-2003 47
� Accessibility of Education from Village Settlements in Uttar Dinajpur, 51
District in 2001: Proximity Analysis
� School Infrastructure in Uttar Dinajpur District by Building-Types, 2002 53
� Status of Classrooms at Primary & Upper Primary Schools in Uttar 57
Dinajpur, 2006
� Basic Amenities Provided at Primary & Upper Primary Schools in 58
Uttar Dinajpur, 2006
� Structure of the Elementary Education System in Uttar Dinajpur, 2006 62
� Madrasahs Recognised by the West Bengal Government in Uttar Dinajpur, 66
� Institutional Levels within the Madrasah System in Uttar Dinajpur, 2006 68
� Distribution of Upper Primary Institutions in Uttar Dinajpur, 2006 70
� Enrolment at Elementary Schools in Uttar Dinajpur, 2006 72
� School Drop-out & Completion Rates at the Primary Stage 75
in Uttar Dinajpur, 2006
� Achievements under TLC/PLP Mass Literacy Campaigns in 77
Uttar Dinajpur uptil, 2006
� Continuing Education Centres [CECs] in Uttar Dinajpur, 2006 79
� Sishu Siksha Kendras [SSKs] & Madhyamik Siksha Kendras [MSKs] in 80
Uttar Dinajpur, 2006: Ratio Analysis
� Infrastructural & Staffing Requirements of Uttar Dinajpur Primary Schools 84
� Infrastructural & Staffing Requirements of Uttar Dinajpur 85
Upper Primary Schools
xvxv
Uttar Dinajpur
Chapter Topic Page No.
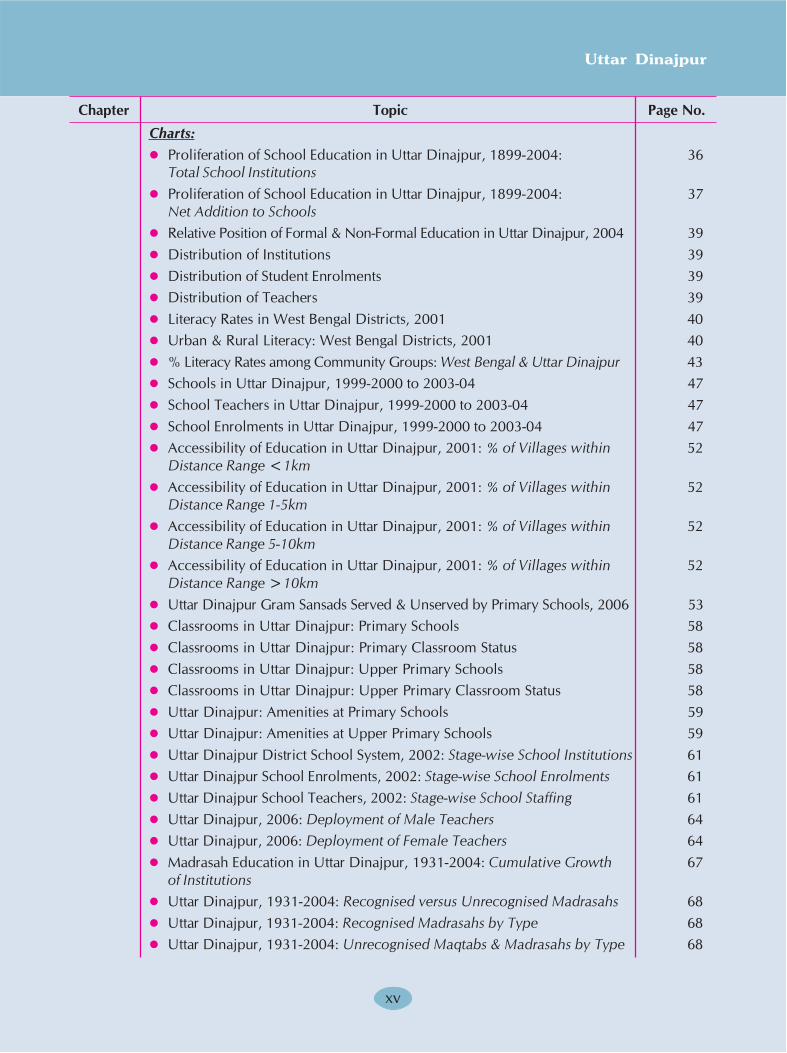
Charts:
� Proliferation of School Education in Uttar Dinajpur, 1899-2004: 36
Total School Institutions
� Proliferation of School Education in Uttar Dinajpur, 1899-2004: 37
Net Addition to Schools
� Relative Position of Formal & Non-Formal Education in Uttar Dinajpur, 2004 39
� Distribution of Institutions 39
� Distribution of Student Enrolments 39
� Distribution of Teachers 39
� Literacy Rates in West Bengal Districts, 2001 40
� Urban & Rural Literacy: West Bengal Districts, 2001 40
� % Literacy Rates among Community Groups: West Bengal & Uttar Dinajpur 43
� Schools in Uttar Dinajpur, 1999-2000 to 2003-04 47
� School Teachers in Uttar Dinajpur, 1999-2000 to 2003-04 47
� School Enrolments in Uttar Dinajpur, 1999-2000 to 2003-04 47
� Accessibility of Education in Uttar Dinajpur, 2001: % of Villages within 52
Distance Range <1km
� Accessibility of Education in Uttar Dinajpur, 2001: % of Villages within 52
Distance Range 1-5km
� Accessibility of Education in Uttar Dinajpur, 2001: % of Villages within 52
Distance Range 5-10km
� Accessibility of Education in Uttar Dinajpur, 2001: % of Villages within 52
Distance Range >10km
� Uttar Dinajpur Gram Sansads Served & Unserved by Primary Schools, 2006 53
� Classrooms in Uttar Dinajpur: Primary Schools 58
� Classrooms in Uttar Dinajpur: Primary Classroom Status 58
� Classrooms in Uttar Dinajpur: Upper Primary Schools 58
� Classrooms in Uttar Dinajpur: Upper Primary Classroom Status 58
� Uttar Dinajpur: Amenities at Primary Schools 59
� Uttar Dinajpur: Amenities at Upper Primary Schools 59
� Uttar Dinajpur District School System, 2002: Stage-wise School Institutions 61
� Uttar Dinajpur School Enrolments, 2002: Stage-wise School Enrolments 61
� Uttar Dinajpur School Teachers, 2002: Stage-wise School Staffing 61
� Uttar Dinajpur, 2006: Deployment of Male Teachers 64
� Uttar Dinajpur, 2006: Deployment of Female Teachers 64
� Madrasah Education in Uttar Dinajpur, 1931-2004: Cumulative Growth 67
of Institutions
� Uttar Dinajpur, 1931-2004: Recognised versus Unrecognised Madrasahs 68
� Uttar Dinajpur, 1931-2004: Recognised Madrasahs by Type 68
� Uttar Dinajpur, 1931-2004: Unrecognised Maqtabs & Madrasahs by Type 68
Human Development Report 2010
xvi
Chapter Topic Page No.
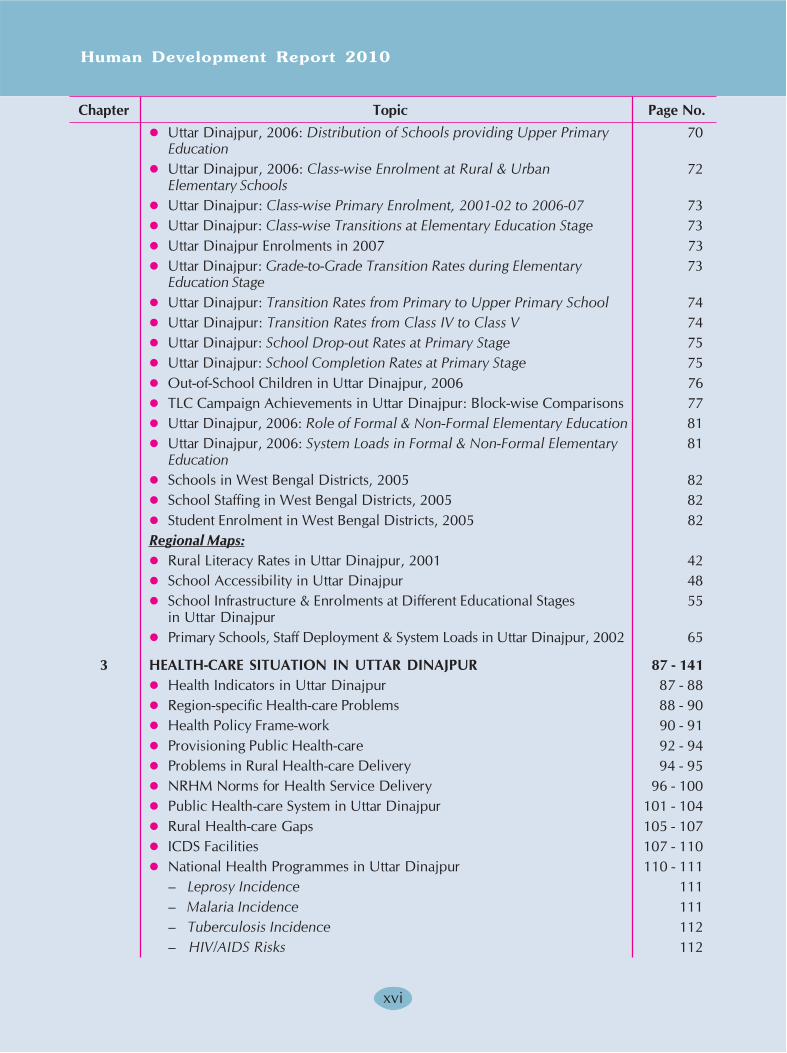
� Uttar Dinajpur, 2006: Distribution of Schools providing Upper Primary 70
Education
� Uttar Dinajpur, 2006: Class-wise Enrolment at Rural & Urban 72
Elementary Schools
� Uttar Dinajpur: Class-wise Primary Enrolment, 2001-02 to 2006-07 73
� Uttar Dinajpur: Class-wise Transitions at Elementary Education Stage 73
� Uttar Dinajpur Enrolments in 2007 73
� Uttar Dinajpur: Grade-to-Grade Transition Rates during Elementary 73
Education Stage
� Uttar Dinajpur: Transition Rates from Primary to Upper Primary School 74
� Uttar Dinajpur: Transition Rates from Class IV to Class V 74
� Uttar Dinajpur: School Drop-out Rates at Primary Stage 75
� Uttar Dinajpur: School Completion Rates at Primary Stage 75
� Out-of-School Children in Uttar Dinajpur, 2006 76
� TLC Campaign Achievements in Uttar Dinajpur: Block-wise Comparisons 77
� Uttar Dinajpur, 2006: Role of Formal & Non-Formal Elementary Education 81
� Uttar Dinajpur, 2006: System Loads in Formal & Non-Formal Elementary 81
Education
� Schools in West Bengal Districts, 2005 82
� School Staffing in West Bengal Districts, 2005 82
� Student Enrolment in West Bengal Districts, 2005 82
Regional Maps:
� Rural Literacy Rates in Uttar Dinajpur, 2001 42
� School Accessibility in Uttar Dinajpur 48
� School Infrastructure & Enrolments at Different Educational Stages 55
in Uttar Dinajpur
� Primary Schools, Staff Deployment & System Loads in Uttar Dinajpur, 2002 65
3 HEALTH-CARE SITUATION IN UTTAR DINAJPUR 87 - 141
� Health Indicators in Uttar Dinajpur 87 - 88
� Region-specific Health-care Problems 88 - 90
� Health Policy Frame-work 90 - 91
� Provisioning Public Health-care 92 - 94
� Problems in Rural Health-care Delivery 94 - 95
� NRHM Norms for Health Service Delivery 96 - 100
� Public Health-care System in Uttar Dinajpur 101 - 104
� Rural Health-care Gaps 105 - 107
� ICDS Facilities 107 - 110
� National Health Programmes in Uttar Dinajpur 110 - 111
– Leprosy Incidence 111
– Malaria Incidence 111
– Tuberculosis Incidence 112
– HIV/AIDS Risks 112
xviixvii
Uttar Dinajpur
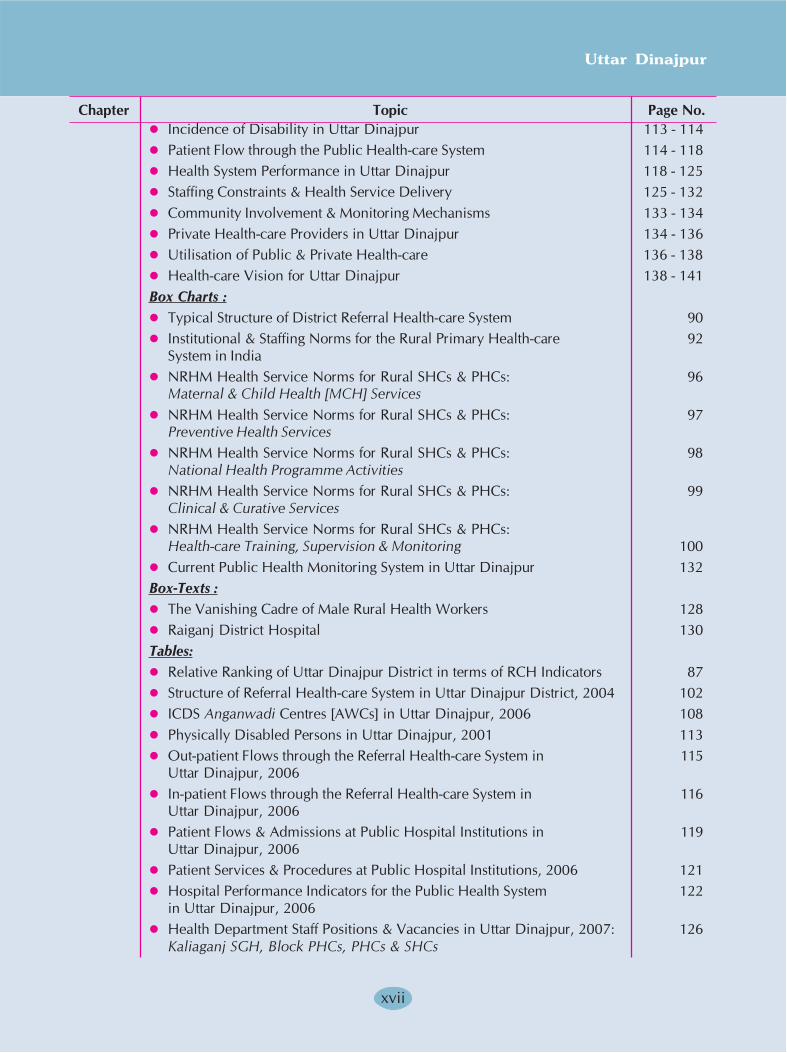
Chapter Topic Page No.
� Incidence of Disability in Uttar Dinajpur 113 - 114
� Patient Flow through the Public Health-care System 114 - 118
� Health System Performance in Uttar Dinajpur 118 - 125
� Staffing Constraints & Health Service Delivery 125 - 132
� Community Involvement & Monitoring Mechanisms 133 - 134
� Private Health-care Providers in Uttar Dinajpur 134 - 136
� Utilisation of Public & Private Health-care 136 - 138
� Health-care Vision for Uttar Dinajpur 138 - 141
Box Charts :
� Typical Structure of District Referral Health-care System 90
� Institutional & Staffing Norms for the Rural Primary Health-care 92
System in India
� NRHM Health Service Norms for Rural SHCs & PHCs: 96
Maternal & Child Health [MCH] Services
� NRHM Health Service Norms for Rural SHCs & PHCs: 97
Preventive Health Services
� NRHM Health Service Norms for Rural SHCs & PHCs: 98
National Health Programme Activities
� NRHM Health Service Norms for Rural SHCs & PHCs: 99
Clinical & Curative Services
� NRHM Health Service Norms for Rural SHCs & PHCs:
Health-care Training, Supervision & Monitoring 100
� Current Public Health Monitoring System in Uttar Dinajpur 132
Box-Texts :
� The Vanishing Cadre of Male Rural Health Workers 128
� Raiganj District Hospital 130
Tables:
� Relative Ranking of Uttar Dinajpur District in terms of RCH Indicators 87
� Structure of Referral Health-care System in Uttar Dinajpur District, 2004 102
� ICDS Anganwadi Centres [AWCs] in Uttar Dinajpur, 2006 108
� Physically Disabled Persons in Uttar Dinajpur, 2001 113
� Out-patient Flows through the Referral Health-care System in 115
Uttar Dinajpur, 2006
� In-patient Flows through the Referral Health-care System in 116
Uttar Dinajpur, 2006
� Patient Flows & Admissions at Public Hospital Institutions in 119
Uttar Dinajpur, 2006
� Patient Services & Procedures at Public Hospital Institutions, 2006 121
� Hospital Performance Indicators for the Public Health System 122
in Uttar Dinajpur, 2006
� Health Department Staff Positions & Vacancies in Uttar Dinajpur, 2007: 126
Kaliaganj SGH, Block PHCs, PHCs & SHCs
Human Development Report 2010
xviii
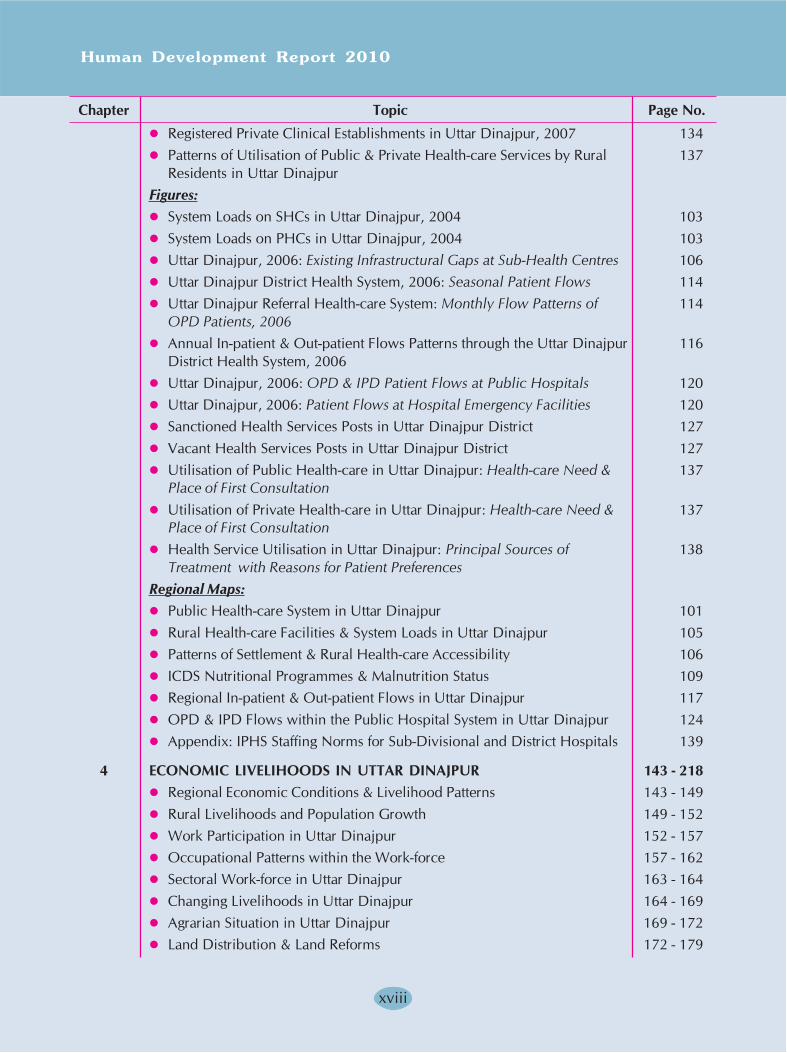
Chapter Topic Page No.
� Registered Private Clinical Establishments in Uttar Dinajpur, 2007 134
� Patterns of Utilisation of Public & Private Health-care Services by Rural 137
Residents in Uttar Dinajpur
Figures:
� System Loads on SHCs in Uttar Dinajpur, 2004 103
� System Loads on PHCs in Uttar Dinajpur, 2004 103
� Uttar Dinajpur, 2006: Existing Infrastructural Gaps at Sub-Health Centres 106
� Uttar Dinajpur District Health System, 2006: Seasonal Patient Flows 114
� Uttar Dinajpur Referral Health-care System: Monthly Flow Patterns of 114
OPD Patients, 2006
� Annual In-patient & Out-patient Flows Patterns through the Uttar Dinajpur 116
District Health System, 2006
� Uttar Dinajpur, 2006: OPD & IPD Patient Flows at Public Hospitals 120
� Uttar Dinajpur, 2006: Patient Flows at Hospital Emergency Facilities 120
� Sanctioned Health Services Posts in Uttar Dinajpur District 127
� Vacant Health Services Posts in Uttar Dinajpur District 127
� Utilisation of Public Health-care in Uttar Dinajpur: Health-care Need & 137
Place of First Consultation
� Utilisation of Private Health-care in Uttar Dinajpur: Health-care Need & 137
Place of First Consultation
� Health Service Utilisation in Uttar Dinajpur: Principal Sources of 138
Treatment with Reasons for Patient Preferences
Regional Maps:
� Public Health-care System in Uttar Dinajpur 101
� Rural Health-care Facilities & System Loads in Uttar Dinajpur 105
� Patterns of Settlement & Rural Health-care Accessibility 106
� ICDS Nutritional Programmes & Malnutrition Status 109
� Regional In-patient & Out-patient Flows in Uttar Dinajpur 117
� OPD & IPD Flows within the Public Hospital System in Uttar Dinajpur 124
� Appendix: IPHS Staffing Norms for Sub-Divisional and District Hospitals 139
4 ECONOMIC LIVELIHOODS IN UTTAR DINAJPUR 143 - 218
� Regional Economic Conditions & Livelihood Patterns 143 - 149
� Rural Livelihoods and Population Growth 149 - 152
� Work Participation in Uttar Dinajpur 152 - 157
� Occupational Patterns within the Work-force 157 - 162
� Sectoral Work-force in Uttar Dinajpur 163 - 164
� Changing Livelihoods in Uttar Dinajpur 164 - 169
� Agrarian Situation in Uttar Dinajpur 169 - 172
� Land Distribution & Land Reforms 172 - 179
xixxix
Uttar Dinajpur
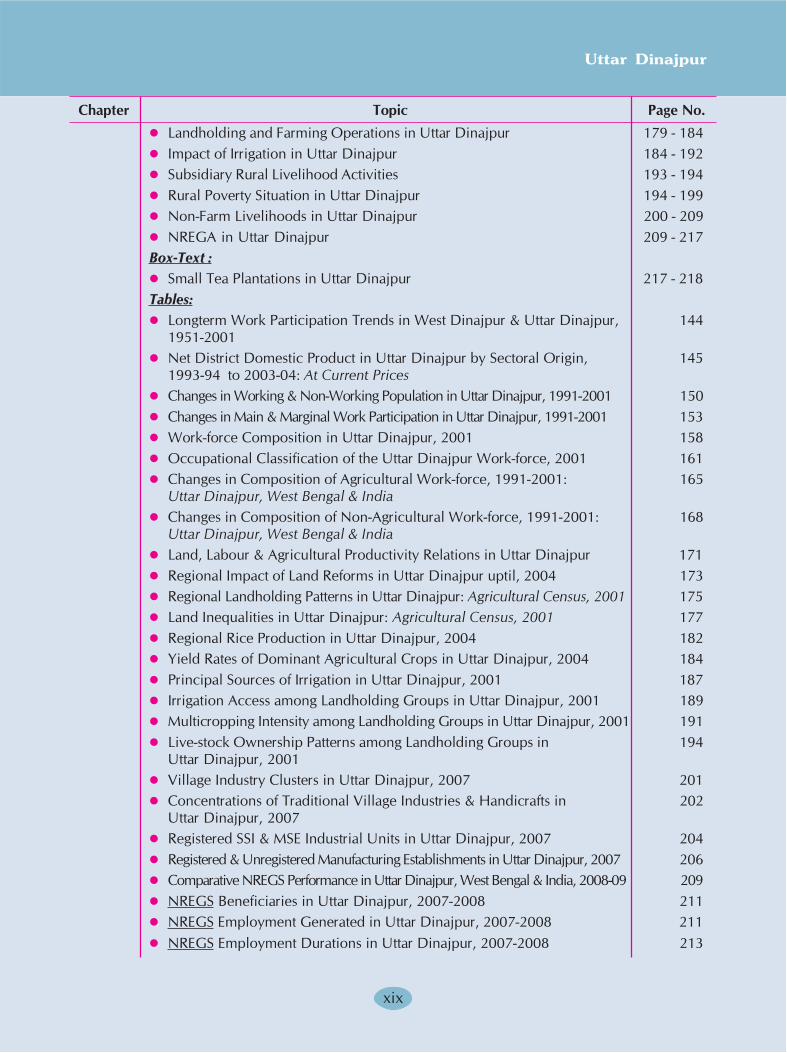
Chapter Topic Page No.
� Landholding and Farming Operations in Uttar Dinajpur 179 - 184
� Impact of Irrigation in Uttar Dinajpur 184 - 192
� Subsidiary Rural Livelihood Activities 193 - 194
� Rural Poverty Situation in Uttar Dinajpur 194 - 199
� Non-Farm Livelihoods in Uttar Dinajpur 200 - 209
� NREGA in Uttar Dinajpur 209 - 217
Box-Text :
� Small Tea Plantations in Uttar Dinajpur 217 - 218
Tables:
� Longterm Work Participation Trends in West Dinajpur & Uttar Dinajpur, 144
1951-2001
� Net District Domestic Product in Uttar Dinajpur by Sectoral Origin, 145
1993-94 to 2003-04: At Current Prices
� Changes in Working & Non-Working Population in Uttar Dinajpur, 1991-2001 150
� Changes in Main & Marginal Work Participation in Uttar Dinajpur, 1991-2001 153
� Work-force Composition in Uttar Dinajpur, 2001 158
� Occupational Classification of the Uttar Dinajpur Work-force, 2001 161
� Changes in Composition of Agricultural Work-force, 1991-2001: 165
Uttar Dinajpur, West Bengal & India
� Changes in Composition of Non-Agricultural Work-force, 1991-2001: 168
Uttar Dinajpur, West Bengal & India
� Land, Labour & Agricultural Productivity Relations in Uttar Dinajpur 171
� Regional Impact of Land Reforms in Uttar Dinajpur uptil, 2004 173
� Regional Landholding Patterns in Uttar Dinajpur: Agricultural Census, 2001 175
� Land Inequalities in Uttar Dinajpur: Agricultural Census, 2001 177
� Regional Rice Production in Uttar Dinajpur, 2004 182
� Yield Rates of Dominant Agricultural Crops in Uttar Dinajpur, 2004 184
� Principal Sources of Irrigation in Uttar Dinajpur, 2001 187
� Irrigation Access among Landholding Groups in Uttar Dinajpur, 2001 189
� Multicropping Intensity among Landholding Groups in Uttar Dinajpur, 2001 191
� Live-stock Ownership Patterns among Landholding Groups in 194
Uttar Dinajpur, 2001
� Village Industry Clusters in Uttar Dinajpur, 2007 201
� Concentrations of Traditional Village Industries & Handicrafts in 202
Uttar Dinajpur, 2007
� Registered SSI & MSE Industrial Units in Uttar Dinajpur, 2007 204
� Registered & Unregistered Manufacturing Establishments in Uttar Dinajpur, 2007 206
� Comparative NREGS Performance in Uttar Dinajpur, West Bengal & India, 2008-09 209
� NREGS Beneficiaries in Uttar Dinajpur, 2007-2008 211
� NREGS Employment Generated in Uttar Dinajpur, 2007-2008 211
� NREGS Employment Durations in Uttar Dinajpur, 2007-2008 213
Human Development Report 2010
xx
Chapter Topic Page No.
Figures:
� Changing Work Participation Trends in West Dinajpur & Uttar Dinajpur, 145
1951-2001
� Changing Sectoral Contribution to Uttar Dinajpur DDP, 1993-94 to 2003-04: 147
At Current Prices
� Sectoral Composition of Uttar Dinajpur District Domestic Product, 1993-94 147
� Sectoral Composition of Uttar Dinajpur District Domestic Product, 2003-04 147
� Growth of Per Capita SDP & DDP in West Bengal & Uttar Dinajpur 148
DDP, 1993-94 to 2003-04: At Current Prices
� Growth of NDDP per capita & NDDP in Uttar Dinajpur: At Current and 149
Constant, 1993-94 Prices
� Growth of NSDP per capita & NSDP in Uttar Dinajpur: At Current and 149
Constant, 1993-94 Prices
� Working & Non-working Population in Rural Uttar Dinajpur, 1991 & 2001 151
� Working & Non-working Population in Urban Uttar Dinajpur, 1991 & 2001 151
� Male & Female Working Population in Rural Uttar Dinajpur, 1991 & 2001 151
� Male & Female Working Population in Urban Uttar Dinajpur, 1991 & 2001 151
� Rural Work Participation in Uttar Dinajpur, 1991 & 2001 155
� Urban Work Participation in Uttar Dinajpur, 1991 & 2001 155
� Uttar Dinajpur: Total Main Workers, Male Main Workers & Female Main 159
Workers, 2001
� Uttar Dinajpur: Total Marginal Workers, Male Marginal Workers 159
& Female Marginal Workers, 2001
� Uttar Dinajpur, 2001: Gender Distribution of Main Work-force 162
� Uttar Dinajpur, 2001: Gender Distribution of Marginal Work-force 162
� Land Redistribution in Uttar Dinajpur 173
� Recording of Barga Rights in Uttar Dinajpur: Barga Lands Protected 173
� Recording of Barga Rights in Uttar Dinajpur: Bargadars Benefited 173
� Land Redistribution in Uttar Dinajpur: Progress till 2004 174
� Agricultural Land in Uttar Dinajpur, 2001: Distribution of Operational 176
Holdings by Size-Classes
� Agricultural Land in Uttar Dinajpur 2001: Distribution of Operational 176
Area by Size-classes
� Land Inequality in Uttar Dinajpur: Lorenz Curves for Islampur SD Blocks 178
� Land Inequality in Uttar Dinajpur: Lorenz Curves for Raiganj SD Blocks 178
� Irrigation Installations in Uttar Dinajpur: 3rd Minor Irrigation Census, 2000-01 187
� Irrigated Area in Uttar Dinajpur: 3rd Minor Irrigation Census, 2000-01 187
� Spread of Irrigation in Uttar Dinajpur District, 2001 188
� Distribution of Irrigated & Unirrigated Land in Uttar Dinajpur, 2001 190
� Uttar Dinajpur, 2001: Irrigation Access by Holding Size 190

xxixxi
Uttar Dinajpur
Chapter Topic Page No.
� Irrigation & Cropping Intensity in Uttar Dinajpur, 2001 192
� Small Farmer Efficiency in Uttar Dinajpur, 2001: Cropping Intensity 192
by Landholding Scale
� Growth of Micro & Small Enterprise [MSE] Units in Uttar Dinajpur, 1968-2007 205
� Household Work Demands under NREGS, 2007-2008 212
� Individual Work Demands under NREGS, 2007-2008 212
� Uttar Dinajpur, 2007-2008: NREGS Household Employment Duration 213
� Uttar Dinajpur, 2007-2008: Duration of Person-days Generated under NREGS 213
Regional Maps:
� Changes in Main & Marginal Work-force in Uttar Dinajpur District, 157
1991-2001
� Regional Distribution of Uttar Dinajpur Work-force by Occupations, 2001 160
� Sectoral Work-force in Uttar Dinajpur, 2001 164
� Changes in Main Agricultural Work-force in Uttar Dinajpur, 1991-2001 166
� Changes in Main Non-Agricultural Work-force in Uttar Dinajpur, 1991-2001 169
� Regional Landholding Inequalities in Uttar Dinajpur 178
� Land Distribution & Agricultural Diversification in Uttar Dinajpur 180
� Rice Economy in Uttar Dinajpur, 2004 181
� (a) Aus, Aman & Boro Paddy Area; (b) Aus, Aman & Boro Paddy Production 182
� Major Economic Crops in Uttar Dinajpur, 2004 183
� Regional Impact of Irrigation in Uttar Dinajpur 185
� Live-stock Economy in Uttar Dinajpur, 2004 193
� Rural Educational Attainments & Child Labour in Uttar Dinajpur, 2002 196
� Rural Poverty Markers & Patterns of Rural Indebtedness in 197
Uttar Dinajpur, 2002
� Work & Food Security in Uttar Dinajpur 198
� Access to Shelter & Clothing in Uttar Dinajpur 199
� Artisanal and SSI Industrial Clusters in Uttar Dinajpur 202
� NREGS in Uttar Dinajpur District 207
� Potential Nursery, Pond Excavation & Roadbuilding Works under 215
NREGS in Uttar Dinajpur
� Potential Building Construction & Other Works under NREGS 216
in Uttar Dinajpur
5 WOMEN'S SITUATIONS IN UTTAR DINAJPUR DISTRICT 219 - 291
� Gender Equity as a Human Development Strategy 219 - 220
� Gender Disparities in Uttar Dinajpur: An Overview 220 - 223
� Gender Gaps in Literacy 223 - 228
� Changing Fertility in Uttar Dinajpur 228 - 230
� Reproductive & Child Health-care [RCH] 230 - 238
Human Development Report 2010
xxii
� Safe Delivery Services, Maternal Mortality & Infant Mortality 238 - 243
� ICDS Coverage in Uttar Dinajpur 243 - 245
� WOMEN'S EMPOWERMENT IN UTTAR DINAJPUR 245 - 268
� Economic Role of Women in Uttar Dinajpur 245 - 254
� Sectoral Changes in Women's Employment 254 - 256
� Political Empowerment of Women in Uttar Dinajpur 257 - 263
� Women's Self-Help Group [SHG] Movement in Uttar Dinajpur 263 - 268
� WOMEN'S SECURITY IN UTTAR DINAJPUR 269 - 292
� Incidence of Marital Crimes 269 - 273
� Crimes against a Woman's Person 274 - 277
� Crimes involving Abduction & Coercion of Women 277 - 279
� Case Disposals and Legal Deterrence 280 - 282
� Offences involving Trafficking of Women 282 - 286
� Regional Incidence of Crimes against Women 286 - 291
Box-Text :
� Dowry Death in Uttar Dinajpur 272
� Gender Vulnerability & Trafficking 285
� Focus Group Discussion on Trafficking of Women & Children: 290
Raiganj/August 2005
Box-Chart :
� Indian Penal Code Provisions applicable to Crimes against Women 281
Tables:
� Gender Disparities in Uttar Dinajpur, West Bengal and India 220
� Gender Literacy Rates in Uttar Dinajpur, 1991-2001 225
� Birth Rates & Fertility Trends in Uttar Dinajpur, 1991-2001 229
� Rural & Urban Differentials in Fertility in Uttar Dinajpur, 1991-2001 229
� Status of Reproductive & Child Health Interventions in Uttar Dinajpur 234
� Provision of Antenatal & Postnatal Health-care Services 236
in Uttar Dinajpur, 2007
� Institutionalised & Attended Deliveries in Uttar Dinajpur, 2007 237
� Birth Projections & Estimation of Unrecorded Deliveries 239
in Uttar Dinajpur, 2006
� Maternal and Infant Mortality in Uttar Dinajpur, 2007 241
� Birth Order & Birth Weights of Infants in Uttar Dinajpur, 2007 242
� Coverage of Children, Adolescent Girls & Women by ICDS Schemes 245
in Uttar Dinajpur, 2006
� Gender Work Participation Rates in Uttar Dinajpur District, 2001 246
� Gender Participation in Main & Marginal Work in Uttar Dinajpur, 2001 248
� Growth of Work Participation among Rural Women 252
in Uttar Dinajpur, 1991-2001
Chapter Topic Page No.
xxiiixxiii
Uttar Dinajpur
� Patterns of PRI Representation in Uttar Dinajpur & West Bengal, 257
1993 & 2003
� Women's Representation in Municipal Bodies in Uttar Dinajpur 260
� Women in Leadership Roles in the Uttar Dinajpur Gram Panchayats, 2003 261
� Regional Spread of the SHG Network in Uttar Dinajpur District, 2007 265
� Graded Performance of SHGs in Uttar Dinajpur, 2007 266
� Crimes against Women [CaW] Registered in Uttar Dinajpur 269
District, 2005-2007: A: Marital & Dowry-related Crimes
� Dowry-related Police Cases Registered in Uttar Dinajpur 272
& North Bengal, 2003-2005
� Case Registrations & Arrests for Marital Offences in Uttar Dinajpur 273
& North Bengal, 2003-2005
� Crimes against Women [CaW] Registered in Uttar Dinajpur District, 275
2005-2007: B: Crimes against Women's Person
� Crimes against Women [CaW] Registered in Uttar Dinajpur District, 278
2005-2007: C: Crimes involving Coercion etc.
� Case Disposals relating to Crimes against Women [CaW] in 280
Uttar Dinajpur District: January 2005-August 2007
� Case Registrations & Arrests under ITPA in Uttar Dinajpur 284
& North Bengal, 2003-2004
� Case Registrations against All Trafficking-related Offences 284
in Uttar Dinajpur & North Bengal, 2003-2005
� Victims of Dowry Death in Uttar Dinajpur: January 2004-August 2005 286
� Regional Incidence of Crimes against Women [CaW] 288
in Uttar Dinajpur, 2003-2005
Figures:
� Uttar Dinajpur, 1991-2001: Regional Literacy Patterns 225
� Uttar Dinajpur, 1991-2001: Gender Literacy Patterns 225
� Uttar Dinajpur, 2001: Gender Distribution of Literate Population 226
� Uttar Dinajpur, 2002: Gender Distribution of School-going Children 226
� Comparative RCH Performance in Uttar Dinajpur 235
� IIPS All-India District Ranking of Uttar Dinajpur, 2006 235
� Recorded Deliveries in Uttar Dinajpur, 2006-07 238
� Recorded & Estimated Deliveries in Uttar Dinajpur, 2006-07 239
� Reported & Unreported Home Deliveries in Uttar Dinajpur, 2006-07 239
� Uttar Dinajpur, 2001: Distribution of Male Main Workers 248
� Uttar Dinajpur, 2001: Distribution of Male Marginal Workers 248
� Uttar Dinajpur, 2001: Distribution of Women Main Workers 249
� Uttar Dinajpur, 2001: Distribution of Women Marginal Workers 249
� Women's Work Participation in Rural Uttar Dinajpur, 1991 253
Chapter Topic Page No.
Human Development Report 2010
xxiv
� Women's Work Participation in Rural Uttar Dinajpur, 2001 253
� Uttar Dinajpur, 1991-2001: Change in Main Work Participation Rate 253
� Uttar Dinajpur, 1991-2001: Change in Marginal Work Participation Rate 253
� Gender Representation in Gram Panchayats, Panchayat Samitis 258 - 259
& Zilla Parishad, 1993 & 2003
� Women's Representation in Uttar Dinajpur Municipalities 260
� Uttar Dinajpur, 2003: Women's Representation among Gram Panchayat 261
Pradhans & Upa-Pradhans
� SHG Group Formation in Uttar Dinajpur uptil, 2007 265
� Performance Ratings of All SHG Groups, 2007 267
� Performance Ratings of Women's SHG Groups, 2007 267
� Crimes against Women in Uttar Dinajpur, 2005-2007: Marital 270
& Dowry-related Crimes
� Marital & Dowry-related Crimes against Women in Uttar Dinajpur, 270
2006-2007: Case Charge-sheets & Convictions
� Marital & Dowry-related Crimes against Women in Uttar Dinajpur 271
2006-2007: Persons Charged & Conviction
� Crimes against Women in Uttar Dinajpur, 2005-2007: Crimes against 276
Women's Person
� Crimes against Women's Person in Uttar Dinajpur, 2006-2007: 276
Case Charge-sheets & Convictions
� Crimes against Women's Person in Uttar Dinajpur, 2006-2007: 276
Persons Charged & Conviction
� Crimes against Women's Person in Uttar Dinajpur, 2006-2007: 279
Coercive Crimes
� Coercive Crimes against Women in Uttar Dinajpur, 2005-2007: 279
Case Chargesheets & Convictions
� Coercive Crimes against Women in Uttar Dinajpur, 2006-2007: 279
Persons Charged & Conviction
� Media Reportage on Trafficking Cases in North Bengal Districts, 2003-July 2005 283
� Uttar Dinajpur: Block-wise Breakup of Dowry Death Victims, 2004-August 2005 287
� Uttar Dinajpur: Block-wise Breakup of Dowry Death Victims by Community, 287
2004-August 2005
Regional Maps:
� Changes in Rural Literacy in Uttar Dinajpur, 1991-2001 223
� Gender Disparities in Literacy & School Enrolment 227
in Uttar Dinajpur District
� Regional Patterns of Fertility & Delivery of RCH Services in Uttar Dinajpur 242
� Gender & Work Participation in Uttar Dinajpur 251
� Regional Change in Women's Main Work Profiles in Uttar Dinajpur, 255
1991-2001
Chapter Topic Page No.
xxvxxv
Uttar Dinajpur
� Regional Proliferation of SHGs across Uttar Dinajpur Gram Panchayats, 2007 268
� Regional Incidence of Crimes against Women in Uttar Dinajpur, 2005-2007 287
� Trafficking & Disappearance of Women in Uttar Dinajpur, 2005-2007 289
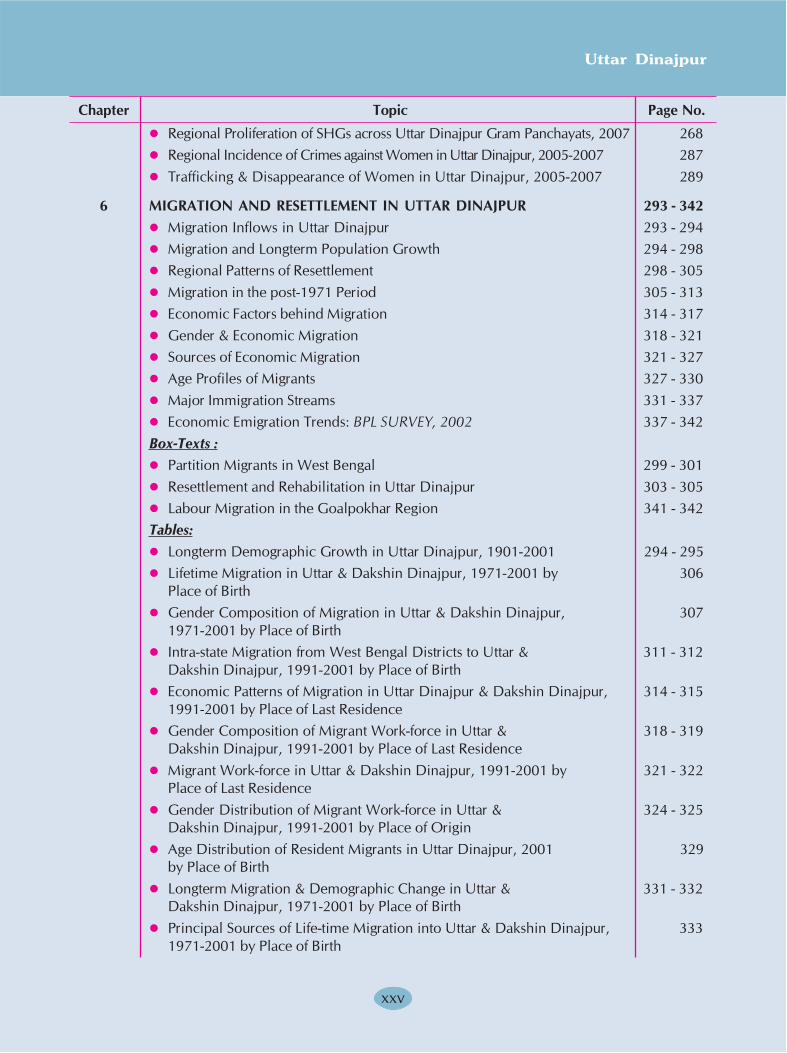
6 MIGRATION AND RESETTLEMENT IN UTTAR DINAJPUR 293 - 342
� Migration Inflows in Uttar Dinajpur 293 - 294
� Migration and Longterm Population Growth 294 - 298
� Regional Patterns of Resettlement 298 - 305
� Migration in the post-1971 Period 305 - 313
� Economic Factors behind Migration 314 - 317
� Gender & Economic Migration 318 - 321
� Sources of Economic Migration 321 - 327
� Age Profiles of Migrants 327 - 330
� Major Immigration Streams 331 - 337
� Economic Emigration Trends: BPL SURVEY, 2002 337 - 342
Box-Texts :
� Partition Migrants in West Bengal 299 - 301
� Resettlement and Rehabilitation in Uttar Dinajpur 303 - 305
� Labour Migration in the Goalpokhar Region 341 - 342
Tables:
� Longterm Demographic Growth in Uttar Dinajpur, 1901-2001 294 - 295
� Lifetime Migration in Uttar & Dakshin Dinajpur, 1971-2001 by 306
Place of Birth
� Gender Composition of Migration in Uttar & Dakshin Dinajpur, 307
1971-2001 by Place of Birth
� Intra-state Migration from West Bengal Districts to Uttar & 311 - 312
Dakshin Dinajpur, 1991-2001 by Place of Birth
� Economic Patterns of Migration in Uttar Dinajpur & Dakshin Dinajpur, 314 - 315
1991-2001 by Place of Last Residence
� Gender Composition of Migrant Work-force in Uttar & 318 - 319
Dakshin Dinajpur, 1991-2001 by Place of Last Residence
� Migrant Work-force in Uttar & Dakshin Dinajpur, 1991-2001 by 321 - 322
Place of Last Residence
� Gender Distribution of Migrant Work-force in Uttar & 324 - 325
Dakshin Dinajpur, 1991-2001 by Place of Origin
� Age Distribution of Resident Migrants in Uttar Dinajpur, 2001 329
by Place of Birth
� Longterm Migration & Demographic Change in Uttar & 331 - 332
Dakshin Dinajpur, 1971-2001 by Place of Birth
� Principal Sources of Life-time Migration into Uttar & Dakshin Dinajpur, 333
1971-2001 by Place of Birth
Chapter Topic Page No.
Human Development Report 2010
xxvi
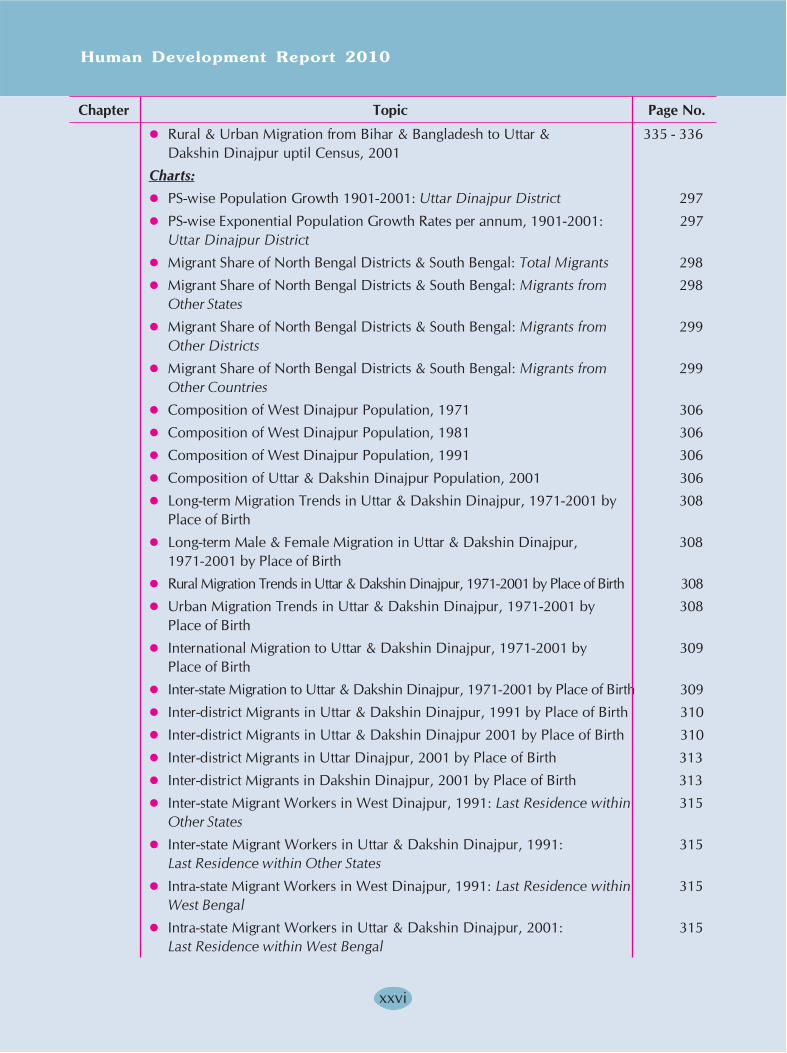
� Rural & Urban Migration from Bihar & Bangladesh to Uttar & 335 - 336
Dakshin Dinajpur uptil Census, 2001
Charts:
� PS-wise Population Growth 1901-2001: Uttar Dinajpur District 297
� PS-wise Exponential Population Growth Rates per annum, 1901-2001: 297
Uttar Dinajpur District
� Migrant Share of North Bengal Districts & South Bengal: Total Migrants 298
� Migrant Share of North Bengal Districts & South Bengal: Migrants from 298
Other States
� Migrant Share of North Bengal Districts & South Bengal: Migrants from 299
Other Districts
� Migrant Share of North Bengal Districts & South Bengal: Migrants from 299
Other Countries
� Composition of West Dinajpur Population, 1971 306
� Composition of West Dinajpur Population, 1981 306
� Composition of West Dinajpur Population, 1991 306
� Composition of Uttar & Dakshin Dinajpur Population, 2001 306
� Long-term Migration Trends in Uttar & Dakshin Dinajpur, 1971-2001 by 308
Place of Birth
� Long-term Male & Female Migration in Uttar & Dakshin Dinajpur, 308
1971-2001 by Place of Birth
� Rural Migration Trends in Uttar & Dakshin Dinajpur, 1971-2001 by Place of Birth 308
� Urban Migration Trends in Uttar & Dakshin Dinajpur, 1971-2001 by 308
Place of Birth
� International Migration to Uttar & Dakshin Dinajpur, 1971-2001 by 309
Place of Birth
� Inter-state Migration to Uttar & Dakshin Dinajpur, 1971-2001 by Place of Birth 309
� Inter-district Migrants in Uttar & Dakshin Dinajpur, 1991 by Place of Birth 310
� Inter-district Migrants in Uttar & Dakshin Dinajpur 2001 by Place of Birth 310
� Inter-district Migrants in Uttar Dinajpur, 2001 by Place of Birth 313
� Inter-district Migrants in Dakshin Dinajpur, 2001 by Place of Birth 313
� Inter-state Migrant Workers in West Dinajpur, 1991: Last Residence within 315
Other States
� Inter-state Migrant Workers in Uttar & Dakshin Dinajpur, 1991: 315
Last Residence within Other States
� Intra-state Migrant Workers in West Dinajpur, 1991: Last Residence within 315
West Bengal
� Intra-state Migrant Workers in Uttar & Dakshin Dinajpur, 2001: 315
Last Residence within West Bengal
Chapter Topic Page No.
xxviixxvii
Uttar Dinajpur
Chapter Topic Page No.
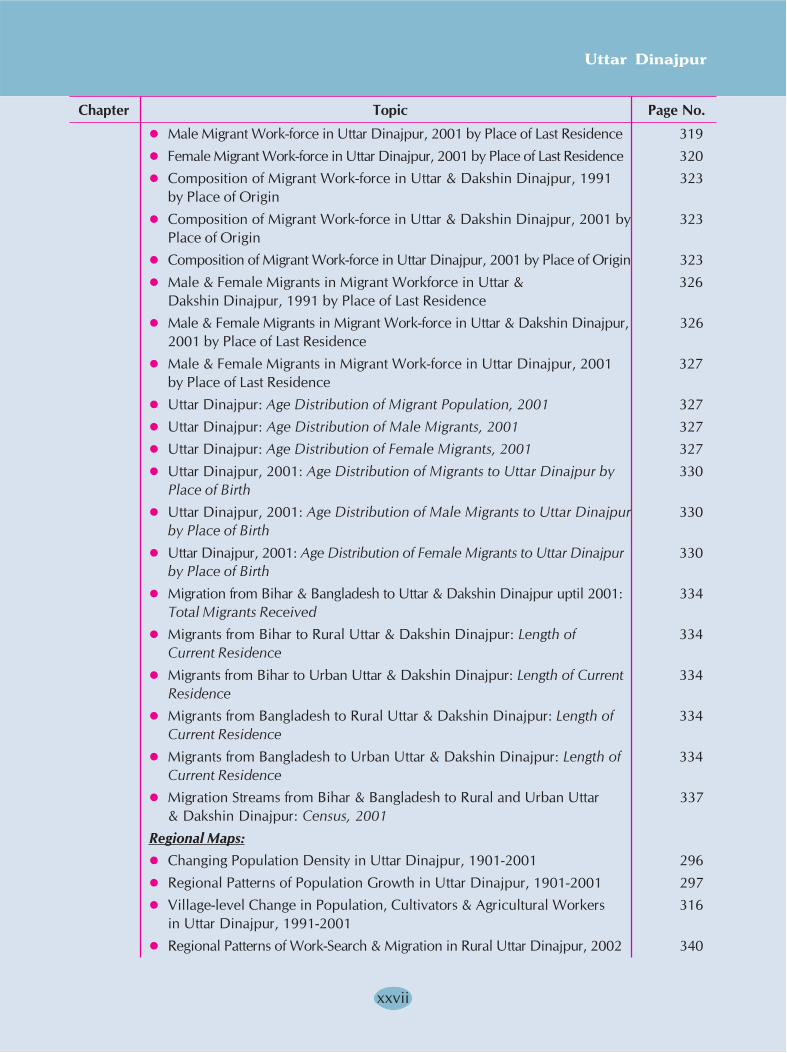
� Male Migrant Work-force in Uttar Dinajpur, 2001 by Place of Last Residence 319
� Female Migrant Work-force in Uttar Dinajpur, 2001 by Place of Last Residence 320
� Composition of Migrant Work-force in Uttar & Dakshin Dinajpur, 1991 323
by Place of Origin
� Composition of Migrant Work-force in Uttar & Dakshin Dinajpur, 2001 by 323
Place of Origin
� Composition of Migrant Work-force in Uttar Dinajpur, 2001 by Place of Origin 323
� Male & Female Migrants in Migrant Workforce in Uttar & 326
Dakshin Dinajpur, 1991 by Place of Last Residence
� Male & Female Migrants in Migrant Work-force in Uttar & Dakshin Dinajpur, 326
2001 by Place of Last Residence
� Male & Female Migrants in Migrant Work-force in Uttar Dinajpur, 2001 327
by Place of Last Residence
� Uttar Dinajpur: Age Distribution of Migrant Population, 2001 327
� Uttar Dinajpur: Age Distribution of Male Migrants, 2001 327
� Uttar Dinajpur: Age Distribution of Female Migrants, 2001 327
� Uttar Dinajpur, 2001: Age Distribution of Migrants to Uttar Dinajpur by 330
Place of Birth
� Uttar Dinajpur, 2001: Age Distribution of Male Migrants to Uttar Dinajpur 330
by Place of Birth
� Uttar Dinajpur, 2001: Age Distribution of Female Migrants to Uttar Dinajpur 330
by Place of Birth
� Migration from Bihar & Bangladesh to Uttar & Dakshin Dinajpur uptil 2001: 334
Total Migrants Received
� Migrants from Bihar to Rural Uttar & Dakshin Dinajpur: Length of 334
Current Residence
� Migrants from Bihar to Urban Uttar & Dakshin Dinajpur: Length of Current 334
Residence
� Migrants from Bangladesh to Rural Uttar & Dakshin Dinajpur: Length of 334
Current Residence
� Migrants from Bangladesh to Urban Uttar & Dakshin Dinajpur: Length of 334
Current Residence
� Migration Streams from Bihar & Bangladesh to Rural and Urban Uttar 337
& Dakshin Dinajpur: Census, 2001
Regional Maps:
� Changing Population Density in Uttar Dinajpur, 1901-2001 296
� Regional Patterns of Population Growth in Uttar Dinajpur, 1901-2001 297
� Village-level Change in Population, Cultivators & Agricultural Workers 316
in Uttar Dinajpur, 1991-2001
� Regional Patterns of Work-Search & Migration in Rural Uttar Dinajpur, 2002 340
Human Development Report 2010
xxviii
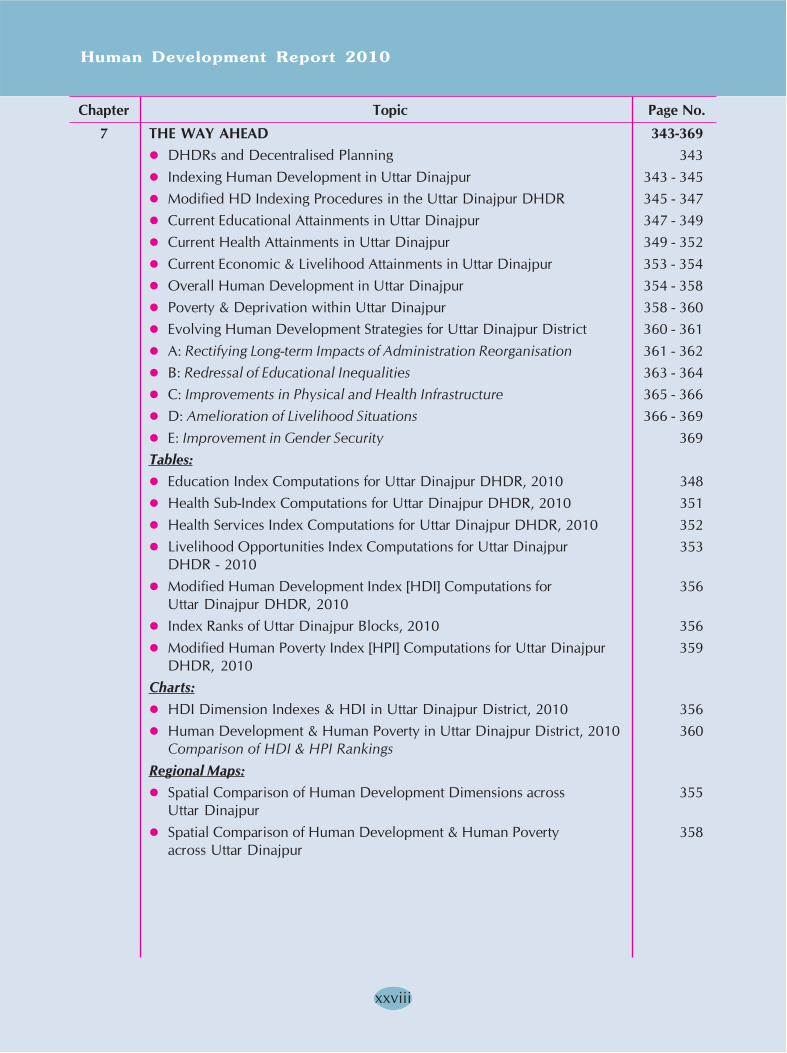
7 THE WAY AHEAD 343-369
� DHDRs and Decentralised Planning 343
� Indexing Human Development in Uttar Dinajpur 343 - 345
� Modified HD Indexing Procedures in the Uttar Dinajpur DHDR 345 - 347
� Current Educational Attainments in Uttar Dinajpur 347 - 349
� Current Health Attainments in Uttar Dinajpur 349 - 352
� Current Economic & Livelihood Attainments in Uttar Dinajpur 353 - 354
� Overall Human Development in Uttar Dinajpur 354 - 358
� Poverty & Deprivation within Uttar Dinajpur 358 - 360
� Evolving Human Development Strategies for Uttar Dinajpur District 360 - 361
� A: Rectifying Long-term Impacts of Administration Reorganisation 361 - 362
� B: Redressal of Educational Inequalities 363 - 364
� C: Improvements in Physical and Health Infrastructure 365 - 366
� D: Amelioration of Livelihood Situations 366 - 369
� E: Improvement in Gender Security 369
Tables:
� Education Index Computations for Uttar Dinajpur DHDR, 2010 348
� Health Sub-Index Computations for Uttar Dinajpur DHDR, 2010 351
� Health Services Index Computations for Uttar Dinajpur DHDR, 2010 352
� Livelihood Opportunities Index Computations for Uttar Dinajpur 353
DHDR - 2010
� Modified Human Development Index [HDI] Computations for 356
Uttar Dinajpur DHDR, 2010
� Index Ranks of Uttar Dinajpur Blocks, 2010 356
� Modified Human Poverty Index [HPI] Computations for Uttar Dinajpur 359
DHDR, 2010
Charts:
� HDI Dimension Indexes & HDI in Uttar Dinajpur District, 2010 356
� Human Development & Human Poverty in Uttar Dinajpur District, 2010 360
Comparison of HDI & HPI Rankings
Regional Maps:
� Spatial Comparison of Human Development Dimensions across 355
Uttar Dinajpur
� Spatial Comparison of Human Development & Human Poverty 358
across Uttar Dinajpur
Chapter Topic Page No.
Uttar Dinajpur
1
Chapter 1
REGIONAL PROFILE OF UTTAR DINAJPUR DISTRICT
Human Development in Uttar Dinajpur
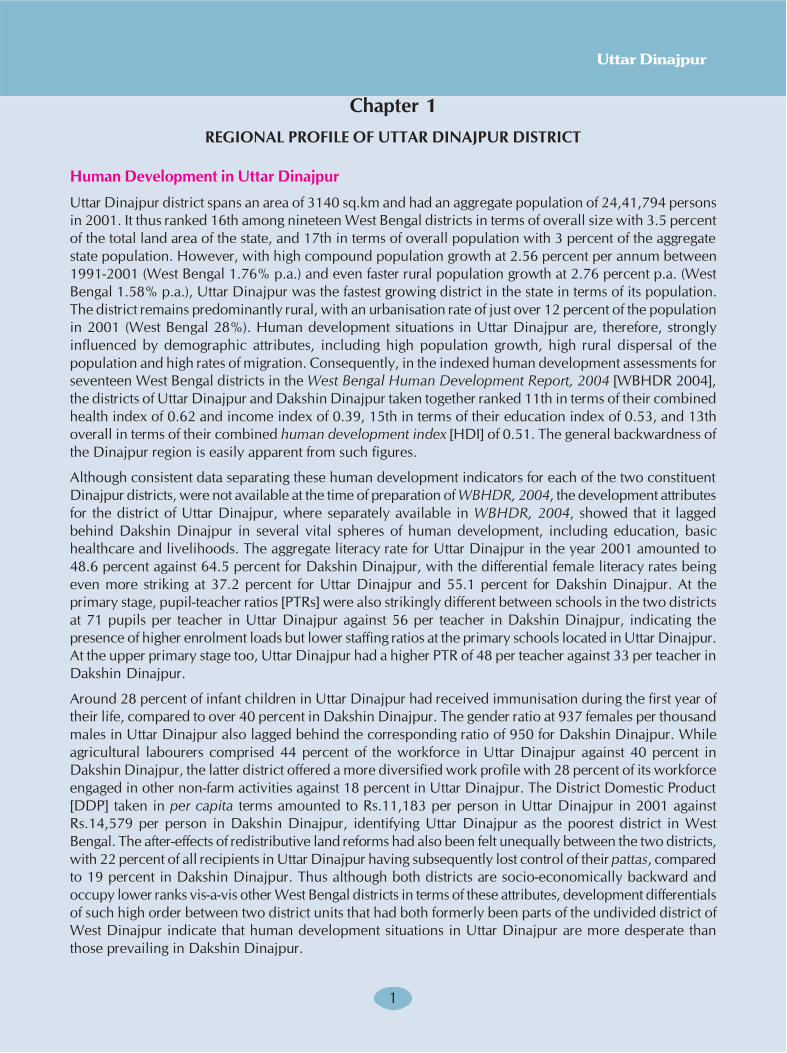
Uttar Dinajpur district spans an area of 3140 sq.km and had an aggregate population of 24,41,794 persons
in 2001. It thus ranked 16th among nineteen West Bengal districts in terms of overall size with 3.5 percent
of the total land area of the state, and 17th in terms of overall population with 3 percent of the aggregate
state population. However, with high compound population growth at 2.56 percent per annum between
1991-2001 (West Bengal 1.76% p.a.) and even faster rural population growth at 2.76 percent p.a. (West
Bengal 1.58% p.a.), Uttar Dinajpur was the fastest growing district in the state in terms of its population.
The district remains predominantly rural, with an urbanisation rate of just over 12 percent of the population
in 2001 (West Bengal 28%). Human development situations in Uttar Dinajpur are, therefore, strongly
influenced by demographic attributes, including high population growth, high rural dispersal of the
population and high rates of migration. Consequently, in the indexed human development assessments for
seventeen West Bengal districts in the West Bengal Human Development Report, 2004 [WBHDR 2004],
the districts of Uttar Dinajpur and Dakshin Dinajpur taken together ranked 11th in terms of their combined
health index of 0.62 and income index of 0.39, 15th in terms of their education index of 0.53, and 13th
overall in terms of their combined human development index [HDI] of 0.51. The general backwardness of
the Dinajpur region is easily apparent from such figures.
Although consistent data separating these human development indicators for each of the two constituent
Dinajpur districts, were not available at the time of preparation of WBHDR, 2004, the development attributes
for the district of Uttar Dinajpur, where separately available in WBHDR, 2004, showed that it lagged
behind Dakshin Dinajpur in several vital spheres of human development, including education, basic
healthcare and livelihoods. The aggregate literacy rate for Uttar Dinajpur in the year 2001 amounted to
48.6 percent against 64.5 percent for Dakshin Dinajpur, with the differential female literacy rates being
even more striking at 37.2 percent for Uttar Dinajpur and 55.1 percent for Dakshin Dinajpur. At the
primary stage, pupil-teacher ratios [PTRs] were also strikingly different between schools in the two districts
at 71 pupils per teacher in Uttar Dinajpur against 56 per teacher in Dakshin Dinajpur, indicating the
presence of higher enrolment loads but lower staffing ratios at the primary schools located in Uttar Dinajpur.
At the upper primary stage too, Uttar Dinajpur had a higher PTR of 48 per teacher against 33 per teacher in
Dakshin Dinajpur.
Around 28 percent of infant children in Uttar Dinajpur had received immunisation during the first year of
their life, compared to over 40 percent in Dakshin Dinajpur. The gender ratio at 937 females per thousand
males in Uttar Dinajpur also lagged behind the corresponding ratio of 950 for Dakshin Dinajpur. While
agricultural labourers comprised 44 percent of the workforce in Uttar Dinajpur against 40 percent in
Dakshin Dinajpur, the latter district offered a more diversified work profile with 28 percent of its workforce
engaged in other non-farm activities against 18 percent in Uttar Dinajpur. The District Domestic Product
[DDP] taken in per capita terms amounted to Rs.11,183 per person in Uttar Dinajpur in 2001 against
Rs.14,579 per person in Dakshin Dinajpur, identifying Uttar Dinajpur as the poorest district in West
Bengal. The after-effects of redistributive land reforms had also been felt unequally between the two districts,
with 22 percent of all recipients in Uttar Dinajpur having subsequently lost control of their pattas, compared
to 19 percent in Dakshin Dinajpur. Thus although both districts are socio-economically backward and
occupy lower ranks vis-a-vis other West Bengal districts in terms of these attributes, development differentials
of such high order between two district units that had both formerly been parts of the undivided district of
West Dinajpur indicate that human development situations in Uttar Dinajpur are more desperate than
those prevailing in Dakshin Dinajpur.
Human Development Report 2010
2
Given this backdrop, it becomes important to undertake a detailed study of human development in Uttar
Dinajpur in order to identify the specific socio-economic causes and human impacts of its prevailing
backwardness. The aim of this study is also directed at identifying specific subregions within the district
where the levels of regional backwardness are highest, so that targeted planning interventions by the State
and District authorities can ameliorate these differentials. The District Human Development Report [DHDR]
for Uttar Dinajpur seeks to reopen a dialogue between the people and the planners by drawing specific
focus to the life situations currently confronted by the people in different parts of Uttar Dinajpur. By
making the social costs and benefits of district planning efforts to improve education, healthcare and livelihood
opportunities clearly visible, the DHDR also seeks to promote common thinking among all development
stakeholders in Uttar Dinajpur. Since the DHDR analyses human development situations within a holistic
framework that cuts past narrow sectoral compartments and political constituencies, it encourages the
evolution of a complete and inclusive development perspective on Uttar Dinajpur that can augment core
district planning competencies and strengthen the concurrent monitoring of development programmes.
The foundation for such an exercise must be based on a comprehensive understanding of district development
processes in Uttar Dinajpur within their specific regional and institutional setting. Thus at the outset, the
DHDR assembles and analyses historical and spatial information for Uttar Dinajpur and its surrounding
regions in order to identify the longterm regional constraints within which the district presently operates.
Specific sectoral attention is then extended sequentially to human development situations and attainments
within the educational, healthcare and economic spheres in Uttar Dinajpur, with separate note also being
taken of underlying gender disparities within the district as well as specific women’s issues and situations.
As indicated by the short review above, the crux of general socioeconomic backwardness and many of the
current human development problems in Uttar Dinajpur appears to be rooted in rapid population growth
driven by high rates of migration into the district, as a joint consequence of which there is a constant
mismatch between the existing provision of basic physical and social infrastructure and the user-loads that
fall upon these facilities. The reasons for the phenomenon of high migration which lie in peculiar political
and administrative history of Uttar Dinajpur district, causing it to be sandwiched in a narrow band between
international and interstate frontiers, are also explored in a separate section of the DHDR. Finally, after
measuring and ranking the human development attainments of the constituent blocks of Uttar Dinajpur by
means of appropriate dimension indices and block level HDIs, the blocks where these overall constraints
appear most severe are identified along with the design of a feasible district strategy for human development
intervention.
The people of the district, the district planners and the local government institutions of Uttar Dinajpur are
all expected to benefit from the comprehensive exercise undertaken in the preparation of Uttar Dinajpur
DHDR. Despite being caught within a gamut of development challenges, both in its past and recent
present, Uttar Dinajpur has shown considerable resilience while attempting to surmount these existing
challenges. Better understanding of the human development problems of the district, through the DHDR,
will help these present impediments to be overcome.
Administrative History of Uttar Dinajpur
Uttar Dinajpur was reconstituted as a separate district within the state of West Bengal with effect from 1st
April, 1992 by notification of the Governor of West Bengal (no.177-L.R./6M-7/92) published in The Calcutta
Gazette Extraordinary on 28 February, 1992. This order separated the subdivisions of Islampur and Raiganj
Sadar, collectively comprising 9 police thanas of the erstwhile district of West Dinajpur, from the
headquarters subdivision of Balurghat comprising 8 other police thanas which were reconstituted separately
as the new district of Dakshin Dinajpur. Balurghat thus retained the principal administrative offices of the
erstwhile district, while the subdivisional facilities that pre-existed at the time at Raiganj subdivision [SD]
have been gradually upgraded with the establishment of the new Uttar Dinajpur District Administration,
Uttar Dinajpur
3
for which a new integrated administrative complex has been established on the Government estate at
Karnajora located on the outskirts of Raiganj. The transition of Uttar Dinajpur into a full-fledged administrative
district is thus a relatively recent event.
Nevertheless, the antecedents of Dinajpur as a specific territorial region within Bengal stretch back more
than 2000 years to the age of the Mauryas and Guptas, when the ruined city at Bangarh near Gangarampur
in Dakshin Dinajpur – then known as the city of Kotivarsa or Devikot - flourished as a major trading post
on the eastern fringes of their empires. The mythological associations of Uttar Dinajpur place it astride the
frontiers of the ancient territories of Anga and Pundra, as mentioned in the Mahabharata. The decline of
this important region of Bengal after it had risen to its zenith during the four-century reign of the Buddhist
Palas was as much the result of ecological change accompanying the migration of distributary rivers in the
Tista-Punarbhaba-Atrai system, as of the shift of political power away from the region during the subsequent
ascendancies of the Sena kings, the Turko-Afghan sultans and Mughals, the colonial empire of the British,
and India today.
The recent administrative history of the region is complex. The original district of Dinajpur was constituted
in 1786 by the British after the alienation of the large zamindari estates of Dinajpur Raj, from which parts
were also incorporated subsequently into adjoining Purnea (now in Bihar) and Malda districts, as well as
Rangpur and Rajshahi districts which now form part of Bangladesh. After the Bengal Boundary Commission
award partitioning Bengal had handed over the Sadar and Thakurgaon subdivisions of Dinajpur district to
East Pakistan in August 1947, the new international border between the two parts of Dinajpur was demarcated
by the Radcliffe line passing between (a) Raiganj thana and Haripur thana (in East Pakistan); between (b)
Hemtabad thana and the thanas of Ranisankail and Pirganj (in East Pakistan); between (c) Kaliaganj thana
and the thanas of Pirganj, Bochaganj and Biral (in East Pakistan); between (d) Kushmandi thana and Biral
thana (in East Pakistan); between (e) Gangarampur thana and the thanas of Biral and Dinajpur (in East
Pakistan); between (f) Kumarganj thana and the thanas of Dinajpur, Chirirbandar and Phulbari (in East
Pakistan); between (g) Balurghat thana and Phulbari thana (in East Pakistan) terminating at the point where
the Balurghat-Phulbari border met the Bengal Assam railway. Thereafter, the Radcliffe line turned southwards,
skirting the lands belonging to the railway, then following the border between (h) Balurghat thana and the
thanas of Panchbibi, Joypurhat and Dhamoirhat (in East Pakistan); and between (i) Tapan thana and the
thanas of Dhamoirhat, Patnitola and Porsha (in East Pakistan). At the time of Independence in 1947, what
has now become the northern border between Islampur SD in Uttar Dinajpur and Bangladesh was then
the border between Purnea district in Bihar and East Pakistan.
The Balurghat SD of old Dinajpur was then reconstituted (vide notification no.548 G.A.dated 23.2.48) as
West Dinajpur district within West Bengal, with the new Raiganj SD being formed (vide notification
no.2139 G.A.dated 14.7.48) from the thanas of Raiganj, Hemtabad, Kaliaganj and Itahar as well as the
adjacent thanas of Kushmandi and Banshihari which are now part of Dakshin Dinajpur. However, because
of the pressing need to restore territorial links between northern and southern West Bengal which had
been snapped by the act of Partition, the States Reorganisation Commission (SRC, 1953-55) subsequently
approved the remapping of interstate boundaries between West Bengal and Bihar. On its recommendation,
a portion of the erstwhile Kishanganj SD comprising Goalpokhar, Islampur and Chopra thanas and parts of
Thakurganj thana, along with adjacent parts of the erstwhile Gopalpur thana in Katihar SD were transferred
from Purnea district in Bihar to West Bengal in 1956, and were formally incorporated into Raiganj SD in
West Dinajpur under the Bihar & Bengal (Transfer of Territories) Act 1956. In terms of the SRC award
(which also transferred the tract constituting Purulia district from Bihar to West Bengal), the areas transferred
from Purnea district in Bihar that now form Islampur SD in Uttar Dinajpur district lay within 200 yards
[183m] to the west of the highway linking Siliguri to Dalkola through Chopra and Kishanganj and 200
yards to the south or southwest of the highway linking Dalkola through Karandighi to Raiganj. However,
since the new boundary line was not to intersect any town or village, the township of Kishanganj and its
entire municipal boundary remained within Bihar.
Human Development Report 2010
4
The transfer of territories from Purnea district in Bihar to West Dinajpur district in West Bengal, involving
a total area of approximately 1965.80 sq.km covering 906 revenue villages with a total census population
of 2.78 lakh in 1951, was accomplished through a series of sequential administrative orders. After an initial
notification (no.3858 G.A.dated 1.11.56) had transferred these territories from Bihar to Darjeeling district
in West Bengal, they were incorporated into West Dinajpur through a second notification (no.3875
G.A.dated 2.11.56). The new Chopra police station [PS] in West Dinajpur was reconstituted (vide notification
no.3859 G.A.dated 1.11.56) from the transferred portions of Chopra PS and Thakurganj PS under the
former jurisdiction of the erstwhile Islampur revenue thana of Kishanganj SD, which at the time also
included the areas subsequently retransferred to Kharibari PS in Darjeeling district. Other transferred areas
previously included in the Islampur revenue thana in Purnea district, were reconstituted (vide notification
no.3860 G.A.dated 1.11.56) into the new Islampur PS in West Dinajpur district. The new Goalpokhar PS
in West Dinajpur was similarly reconstituted (vide notification no.3861 G.A.dated 1.11.56) from the old
Goalpokhar PS of the Gopalpur revenue thana under Kishanganj SD and certain portions of the old
Kishanganj revenue thana excluding the Kishanganj municipal area. The new Karandighi PS in West Dinajpur
district was reconstituted (vide notification no.3862 G.A.dated 1.11.56) from the old Karandighi PS areas
formerly under Katihar SD in Purnea district. These four newly-added PS areas that had previously been
included in Bihar were then regrouped into the new Islampur SD of West Dinajpur. In March 1959, the
portion of Chopra PS lying to the north of the Mahananda river covering an area of approximately 148.7
sq.km, that now comprises Bidhannagar-1 GP, Bidhannagar-2 GP, Chathat-Bansgaon GP and the southern
half of Phansidewa-Bansgaon Kismat GP in Darjeeling district, was transferred from West Dinajpur (vide
notification no.1176 G.A.dated 20.3.59) to the jurisdiction of Phansidewa PS under Siliguri subdivision.
Thus after the original act of Partition in 1947 and subsequent transfers and retransfers of territory initiated
in 1956, the northern borders of Uttar Dinajpur district that exist today were only stabilised 12 years later
in 1959.
After the introduction of the Community Development Programme [CDP] in West Bengal in 1960-61, 6
CD blocks were constituted within Raiganj SD, which at the time also included Banshihari and Kushmandi
blocks in addition to Raiganj, Hemtabad, Kaliaganj and Itahar. Within the transferred areas, two CD blocks
were constituted from Islampur PS and Karandighi PS, while Chopra PS and Goalpokhar PS were included
jointly in a single development circle. Subsequently, Chopra PS was reconstituted as a separate CD block
while Goalpokhar PS was further bifurcated into Goalpokhar-1 block (i.e. the present Goalpokhar PS) and
Goalpokhar-2 block (i.e. Chakulia PS). At the time of the introduction of CDP, West Dinajpur was still a
relatively underdeveloped district, with Raiganj as its more developed subdivision. Under the block
classification system adopted for CDP from 1 April 1958, only Raiganj, Hemtabad and Kaliaganj blocks
(all of them in Raiganj SD) attained the Stage II development status entitling them to higher annual development
budget allocations. Islampur, Karandighi and Itahar blocks which are now in Uttar Dinajpur, as well as
Gangarampur, Kumarganj, Tapan which are now in Dakshin Dinajpur lagged behind them at the Stage I
development level, while Chopra, Goalpokhar-1, Goalpokhar-2 and Itahar blocks in Uttar Dinajpur and
Banshihari, Kushmandi, Kumarganj, Balurghat and Hili blocks in Dakshin Dinajpur were still at the
rudimentary pre-extension stage. Considerable development disparities therefore already persisted between
the more developed Raiganj SD region and the transferred areas of Islampur SD, which were inherited
subsequently by Uttar Dinajpur when it became a full-fledged district in 1992. Such disparities did not
merely reflect differences in development performance, but also revealed persisting disparities in the
associated administrative and delivery systems arising out of historical events such as partition and the
interstate transfer of territories, which had a profound development impact on the West Dinajpur region. A
large part of the state effort during the early years inevitably had to be expended on creating and adapting
administrative structures to ever-changing administrative boundaries, creating a development backlog that
still continues to affect Uttar Dinajpur and particularly the five CD blocks that constitute Islampur SD.

Uttar Dinajpur
5
The administrative impact of Partition on the areas that were reconstituted into West Dinajpur district was
felt in the immediate need to regenerate the economic and administrative structures required for the
governance of the new district. A lot of these initial needs were infrastructural in nature, since two-thirds of
the pre-1947 area along with district headquarters facilities of the pre-Partition Dinajpur district had gone
over to East Pakistan under the Radcliffe award. Although Raiganj by that time held more importance as a
market and commercial town, Balurghat was designated as the new district headquarters, since the basic
infrastructure for development administration was already present in this former subdivisional town. Raiganj
was declared a municipality on 19 July 1951 shortly after Balurghat became one on 24 May 1951, and
largely because of its economic importance, population growth rates in Raiganj over the period since
consistently surpassed those of Balurghat. Nevertheless, in the upgradation of district and subdivisional
amenities, entailing the construction of new administrative facilities and physical assets, such as, schools
and colleges, roads and communication routes, hospitals, etc., the investment requirements of the
headquarters region inevitably took precedence over the rest of the district.
The addition of new territories and the creation of the new sub-division of Islampur compounded such
problems by multiplying these infrastructural disparities and needs. Although a Government move was
made in 1958 to shift the district headquarters from Balurghat to Raiganj on account of its more central
location, the proposal had to be abandoned in the face of popular resistance. Meanwhile, under the transitory
provisions of the Bihar & Bengal (Transfer of Territories) Act 1956, new administrative complexities surfaced
because of the interstate reapportionment of administrative and judicial functions and personnel, tax
revenues, assets and liabilities, budgetary responsibilities and the sharing of public debt, and even of the
rights of representation in panchayats and legislative bodies of Bihar and West Bengal. The three West
Dinajpur sub-divisions were also governed under different legislative provisions for some time during the
transition. Thus, while the Bihar Land Reforms Act, 1950 and the Bihar Panchayati Raj Act, 1947 continued
to remain in force in the transferred areas in Islampur SD for some time, the West Bengal Estates Acquisition
Act, 1953 and the West Bengal Panchayat Act, 1957 were applicable in Raiganj SD and Balurghat SD.
Peculiarities consequently arose in local government and in the land revenue administration of the district.
After West Dinajpur was bifurcated into the separate districts of Uttar Dinajpur and Dakshin Dinajpur in
1992, further administrative readjustments and reallocations of territory were once more necessitated. By
the initial Gazette order (no.177-L.R./6M-7/92 dated 28 February 1992), Raiganj Sadar SD was reconstituted
after transferring Banshihari block (Harirampur PS and Banshihari PS) and Kushmandi block (Kushmandi
PS) to the jurisdiction of Gangarampur SD in Dakshin Dinajpur. On the principle of territorial contiguity,
readjustments of administrative jurisdiction between Itahar and Banshihari blocks was also necessitated,
leading at first to the bifurcation (vide notification no.136-RD(Block)/F/4/1C-J/91(95) dated 5 January 1996)
of the old Banshihari block in West Dinajpur into the reconstituted Harirampur and Banshihari blocks.
This also required the reconstitution of the Harirampur and Banshihari Panchayat Samitis in August 1996,
and subsequent alteration in the jurisdictions of Itahar PS (vide Home Department notification no.709-PL
dated 20 February 2006) and Harirampur PS (vide Home Department notification no.709-PL dated 20
February 2006).
The ensuing administrative process involved the interdistrict transfer of 56 revenue mouzas comprising
Gokarna GP, Saiyadpur GP and Chhaighara GP from the jurisdiction of the old Itahar PS to Harirampur PS,
accompanied by redrawing of the boundaries of Saiyadpur GP in Harirampur block in Dakshin Dinajpur
and the transfer of the mouzas of Bimlapara (JL No.101), Bhabanipur Bejpukur (JL No.102), Kurmanpur (JL
No.107) and Paschim Saiyadpur (JL No.253) to Patirajpur GP under Itahar block in Uttar Dinajpur. Although
appropriate notifications were issued soon afterwards of the transfer of the 10 mouzas of Chhaighara GP
from Uttar Dinajpur to Dakshin Dinajpur block (no.917/PN/O/I/IP-7/04 dated 21 February 2006 of the
Panchayat & Rural Development Department) and of 4 mouzas from Saiyadpur GP in Dakshin Dinajpur to
Patirajpur GP in Uttar Dinajpur (no.924/PN/O/I/IP-7/04 dated 21 February 2006), along with necessary
Human Development Report 2010
6
orders for reallocation of GP & Panchayat Samiti memberships, GP assets & liabilities and panchayat
funds, these could not been given effect to immediately because of a subsequent High Court stay on the
operation of these orders issued in connection with a writ petition filed by certain private individuals.
Finally, after the stay was vacated and the petition dismissed in March 2008, a new administrative order
(no.2442/PN/O/I/IP-7/04 dated 10 June 2008 of the Panchayat & Rural Development Department) was
issued after the completion of the 2008 Panchayat Elections, paving the way finally to give effect to these
territorial transfers, sixteen years after the bifurcation of Uttar Dinajpur and Dakshin Dinajpur had been
initially notified. Even so, the physical act of transfer is still not complete as of date.
As this survey of the administrative history of the district reveals, Uttar Dinajpur has taken an exceptionally
long time to achieve territorial stability. Besides administrative complexities, the process of reconstituting
the boundaries of the district after the initial act of Partition has involved huge intangible costs, both in
terms of time and in the slowing down of the development process. The latter cost has been largely borne
by the backward regions within the district, accounting for the high degree of regional disparity visible
within Uttar Dinajpur. The creation of the district through the initial remapping of territories involved a
sundering of its old regional linkages. The synthesis of new development linkages between the two sub-
regions with disparate origins and cultural histories that now constitute Uttar Dinajpur has posed considerable
challenges. This process of regional integration is not yet complete. The difficulties that have stood in the
way need to be understood now against the broader canvas of regional history.
Historical Antecedents of the District
Because of its administrative synthesis from sub-units that were originally parts of undivided Bengal and
Bihar, the antecedents of Uttar Dinajpur district are scattered and need to be explored contextually with
the local histories of regions to its east, west and south, to which its own regional history is inextricably
bound. These regions respectively span undivided Dinajpur on the Tista floodplain, the Purnea-Saharsa
region on the Kosi floodplain, and the Malda-Rajshahi region along the northern banks of the Ganga. On a
map, Uttar Dinajpur straddles the eastern catchment of the Mahananda river, identified in the Mahabharata
epic as the riverine boundary separating the ancient provinces of Anga and Pundra. Since the Mahananda
occupies a deeply faulted valley between the major conical fans formed by the Kosi and the Tista, its course
through history has been remarkably stable, unlike the latter rivers which have migrated considerably over
their alluvial fans. The location of present-day Uttar Dinajpur thus corresponds closely with the western
frontier of the ancient pradesa of Pundra with bordering Anga, which is associated mythologically with
Karna who played a key role in the Mahabharata war in alliance with the Kauravas. Such mythological
associations are also replayed in several regional place-names in Uttar Dinajpur like Karandighi and
Karnajora.
Mythological connections to the Mahabharata legend are also found for several other places within the
surrounding region, most prominently in the fortified ruins at Bangarh in neighbouring Dakshin Dinajpur
district. Local fable links this site with the legend of king Bana and his daughter Usha who eloped with
Aneerudha, the son of Krishna. Opposite the ruins of the city, located across the Brahmani river, is the
supposed site of the legendary battle in which Krishna is said to have killed the Bana Raja. Slightly northwest
of Uttar Dinajpur, near the city of Bhadrapur located in Jhapa district in the Nepal terai, is a site known as
Kichaka Vadh where Bhima is said to have slain Kichaka in revenge for colluding and dishonouring Draupadi
in association with the Kauravas, while the modern city of Biratnagar, located to the west in Morang
district in Nepal, is believed to commemorate the capital of the king Virata of Matsyadesa who had offered
the Pandavas shelter in the thirteenth year of their exile [Mahabharata Bk 4: Virataparva]. The riverport at
Ghoraghat on the Karatoya, now located in adjoining Dinajpur zila in Bangladesh, is fabled to have been
the site where Virata stabled his army’s cavalry horses. Mythical links to the legend of Kichaka are also
Uttar Dinajpur
7
often mentioned for the unexcavated historical sites at Asuragarh in Goalpokhar-2 block and the village of
Bairhatta in neighbouring Harirampur block, Dakshin Dinajpur, both reputedly sites of the ruined palace
of the vanquished Kichaka. A very ancient sami tree [Prosopsis spicigera] at Bairhatta is still venerated as
the site where Nakula concealed the weapons of the Pandavas before their attack on Kichaka.
While such local legends are obviously later suppositions which have overlaid the unwritten history of
Uttar Dinajpur and its surrounding regions, solid evidence of the importance of the area during Maurya
and Gupta times area has been found during excavations conducted at archaeological sites like Bangarh,
which as the major regional riverport and communications node also formed the administrative headquarters
for Kotivarsa visaya in Pundravardhana bhukti (cf. Damodarpur copperplates). The Karna legends and
appellations associated with the Uttar Dinajpur region possibly derive from a dynasty of Karnata kings
aligned to the later Sena dynasty who are known to have ruled parts of Bengal and Mithila intermittently
during the interregnum between the decline of the Gupta age and the rise of the Palas [8th century CE]. This
southern dynasty is also believed to have brought with it the system of tank-based irrigation which was
already widespread in southern India. The presence of such water storage tanks is found uptil the Karandighi
region, marking the northernmost spread of tank-based irrigation systems in Bengal. Uttar & Dakshin
Dinajpur collectively have over 29 thousand water tanks, most of which still continue to fulfil their ancient
function more than a thousand years after they were originally constructed. The very largest of these Pala or
post-Pala period irrigation tanks located at Tapan in Dakshin Dinajpur district covers an area of around
35ha excluding its banks, two more called Amrita and Jivat are in vicinity of Gangarampur, while three
others of considerable size known as Alta Dighi, Gaur Dighi and Malian Dighi are grouped around Bairhatta,
very close to Patirajpur in Itahar. Other than local legends however, no tradition survives about who
exactly constructed these magnificent works.
The ancient period of Indian history from the 12th century BCE till about 550 CE was marked by the
ascendancy of the Magadh region, rising to its ultimate zenith under the Mauryas (324-185 BCE) and the
imperial Guptas (240-550 CE). Of the 16 mega-settlements or mahajanapadas that demarcated India during
this ancient age, the Dinajpur region fell within Pundravardhana and was bordered to its south by Banga or
Vanga and to its west by Anga. Gradually extending its frontier northwards to the Himalayan borderlands
during the rule of Asoka (273-232 BCE), Magadh under the Mauryas had occupied all of Pundravardhana
from the Kosi to the Karatoya, setting up a chain of fortifications to defend its territory and communications
against the raids of hostile Kirata tribes from the northern hills. Prominent among these were Sikligarh fort
in the Saharsa region of Bihar where a stone pillar was placed by Asoka, and the still unexcavated earthen
fortresses at Barijangarh near Kishanganj and at Asuragarh (JL No.84 in Surjapur-1 GP, Goalpokhar-2
block) in Uttar Dinajpur. From its location and the palaeocourse of the Mahananda during Mauryan times,
it is apparent that Asuragarh must have defended a riverine traderoute serving the fringes of the Mauryan
empire. Historical structures and artefacts found at Asuragarh which include terracotta bricks and ringwells
of the Mauryan type, scattered stone fittings and panels, and fields full of shattered potsherds as well as
unidentifiable copper coinage, attest to the fact that this area was a flourishing settlement at the time, but
was probably abandoned and never reoccupied following the decline of Maurya power. Further evidence
of the Dinajpur region having been under the sway of the Mauryas is offered by the recurrence of pottery
artefacts of the Northern Black Polished Ware [NBPW] type at archaeological sites spread all over the
region.
During the interregnum when Shunga and Kushana rulers flourished in northwestern India, Pundravardhana
apparently lost its strategic importance, although its continuing trading relations during the period are
attested to by the recovery of Kushana gold coins and terracottas from archaeological sites like Bangarh.
The northern territories were probably overrun at the time by Kirata invaders, commemorated in the legend
of Kichaka. The Kichak and Asur tribes (probably alternate names for Kirati groups) are mentioned as being
resident in adjoining Rangpur in 19th century ethnographic writings by British observers such as James

Human Development Report 2010
8
Wise, and a village named Kichaktola (JL No.120) survives in Sahapur-2 GP in Goalpokhar-1 block in Uttar
Dinajpur. With the revival of regional fortunes commencing in the 4th century CE under the Guptas,
Kotivarsa or Bangarh once again rose to administrative importance and many of the lands under its control
were resettled through imperial landgrants such as those mentioned in the copperplate inscriptions of the
era.
The landscape bordering the Mahananda to the west, spanning parts of modern-day Purnea, Araria and
Kishanganj districts in Bihar and stretching on through Madhepura and Saharsa districts, was primarily a
level treeless expanse of sandy savannahs and grasslands bordering the eastern Nepal terai which had long
been dominated by the shifting courses of the Kosi and its many tributaries, offering little succour to
agricultural communities. In contrast, the northern portions of Uttar Dinajpur lying along the eastern banks
of the Mahananda valley which were wooded at the time attracted new settlement. Starting from the 4th
century CE onwards, the forested lands in the tract were gradually cleared and replaced by cultivated fields
and pasture lands. In later times, this process was accelerated through the evolution of gachh (literally,
‘tree’) tenancies, through which the land grantee in return for a nominal rent undertook to clear that land of
its forest cover and bring it into productive use. As established by present-day village names, such gachh
tenancies eventually spread widely over several parts of northern Uttar Dinajpur, including Sonapur, Majhiali,
Daspara, Haptiagachh, Chopra and Lakhipur GPs in Chopra block, Ramganj-1, Kamalagaon-Sujali,
Matikunda-2 and Agdimti-Khanti GPs in Islampur block, Jaingaon, Lodhan, Goti, Goagaon and Sahapur-1
GPs in Goalpokhar-1 block, and Sahapur-1 GP in Goalpokhar-2 block, as well as over adjoining areas in
Darjeeling, Kishanganj and Araria districts. However, the waning of Gupta power during the 6th century
CE was accompanied by another round of political uncertainty and population decline.
Journeying through the region to the court of Bhaskaravarman in Kamarupa in the 7th century CE during the
reign of Sasanka who ruled the kingdom of Gauda from Karnasuvarna, the Chinese pilgrim Hiuen Tsang
(Xuanzang) passed through Pundravardhana in 643 CE and left a written account of the tract, describing it
as a region full of Mahayana Buddhist viharas as well as of adherents to the Jain teachings. The important
Buddhist viharas of this period, which included Mahasthangarh (now in Bangladesh) and Raktamrittika (in
Murshidabad), were important centres for the transliteration of Buddhist texts into the Chinese and Tibetan
languages. The Jain acharya Bhadrabahu, preceptor to Chandragupta Maurya (40-298 BCE) who had founded
the Maurya dynasty, was also reputedly born in Pundravardhana and played an important role in spreading
the Jain teachings to southern India. The Jain or Natha sect also developed a large base in the Rarh region
of Bengal and the adjoining areas stretching on to Bhagalpur, probably through the influence of the Karnata
feudatories of the Gupta emperors who ruled that region. It is therefore presumed by certain sources that
an Adinatha temple had existed at the time at Pandua in Malda district, whose rubble was later used by
Sultan Sikandar Shah in constructing the Adina mosque at the site in 1375 CE.
Following the unsettled period known as matsyanyaya which followed the decline of the Gupta empire,
the foundation of the Pala dynasty of Bengal was laid by its first ruler Gopala in 750 CE. Gopala is known
to have been a native of Varendri – the classical name for the Dinajpur region – and is reputed to have risen
to kingship at the will of the people. The early Pala dynasty between 774-1027 CE saw Bengal establishing
dominance over much of northern India stretching on to Kanauj, under its major monarchs Dharmapala,
Devapala and Mahipala-I. Besides building major Buddhist viharas at Vikramshila, Nalanda and Odantapuri
in Bihar, the Pala rulers also built Somapura (Paharpur) vihara and Jagaddala vihara in the region adjoining
Dinajpur in Bangladesh. Mahipala-I in particular had a very close association with Uttar Dinajpur, with his
name being commemorated in place-names such as Mahipur village (JL No.32) and GP in Raiganj block,
Mahinagar village (JL No.23) under Anantapur GP in Kaliaganj block and Mahipaldighi (JL No.190) under
Udaypur GP in adjoining Banshihari block in Dakshin Dinajpur. Towards the end of his reign, Mahipala-
I suffered reverses, losing sway over the Rarh region to the southern Chola dynasty. Following a period of
Uttar Dinajpur
9
decline when Mahipala-II lost his life as well his control over the Varendri region during the Kaivarta revolt
led by Divya, the power of the Palas was briefly eclipsed. The Kaivarta revolt is viewed partly as a rebellion
against the suzerain power by a confederacy of minor rulers and partly as a revolt by the peasantry against
oppression by their rulers. Although by 1072 CE, Ramapala was able to defeat the Kaivartas and restore
Pala rule over Varendri, the empire had been substantially weakened by the revolt. Thus in 1096 CE,
Vijayasena who ruled Rarh as a former feudatory of the Palas was able to establish control over Bengal and
banish his erstwhile overlords into southern Bihar. The brief rule of this new dynasty saw the resurgence of
Vaishnavism, and over its duration, the Pundravardhana region lost its political primacy. Ruling from
Nadia, Vijayasena was succeeded by Ballalsena (1158-1179 CE) and then by Lakshmanasena who built his
new capital at Lakhsmanawati (Lakhnauti) or Gaur. In 1204 CE, the Sena rulers of Bengal were eclipsed by
Turko-Afghan invaders when the city of Gaur fell soon after the lightning onslaught on Nadia by Bakhtyar
Khilji, a general in the Mamluk force that had earlier occupied Delhi under Qutubuddin Aibak.
The early period of Muslim rule in Bengal till the mid-14th century CE saw frequent strife between the
Delhi Sultanate and its independent-minded governors, many of whom sought to establish their own fiefs
in the rich province they had just conquered. The warring factions chiefly comprised the Ghaznavids or
Khiljis and the Ghurids or Mamluks, both of Turkic origin, while the scene of their conflicts included
Malda, Dinajpur and Rangpur as well as the adjoining territories in Bihar. In order to re-establish swift
military communications in the region, which had been disrupted by the difficulty of riverine communications
following the shifting of regional rivers, the Khiljis had embarked on a program of building raised roads and
bridgeworks between Devikot and their southern domains in Gaur, remains of which can still be seen at
several places along the Tangan valley. The frontier citadel at Devikot or Kotivarsa, which was rebuilt
during this period, continued to play an important part in maintaining their administration in the region
even though its controlling hub shifted southwards to Lakhnauti (Lakshmanawati) or Gaur. In 1342 CE, the
independent Bengal sultanate acquired stability with the founding of the Ilyashahi dynasty, heralding a
period of architectural construction and growth. However, with Gaur having been abandoned temporarily
to the vagaries of the shifting Ganga by Alauddin Ali Shah in 1338 CE, the Ilyashahi capital was located
further up north in the older city of Pandua (Firuzabad), which was then situated more conveniently on the
bank of the Mahananda.
The region to the north and east of the Karatoya river had till this time remained under the control of the
Kamarupa rulers who gradually built a chain of mud forts along their frontier to ward off invasions from the
south. The area separating Uttar Dinajpur from Jalpaiguri district, which lies due east of Chopra block and
now forms Panchagarh zila in Bangladesh, held five of these major fortifications, namely Bhitargarh,
Hosaingarh, Mirgarh, Rajangarh and Devengarh. Among these, Bhitargarh on the Indo-Bangladesh border
is identified as the capital of the Kamarupi raja Prithu who is reputed to have attacked the retreating forces
of Bakhtyar Khilji in 1206 CE upon their return from their expedition into the Himalayan hills, after dismantling
an important bridge and cutting off their retreat across either the Tista or Karatoya. Now lying in Panchagarh
Sadar upazila in Bangladesh, Bhitargarh fort is ringed to its north, east and west by the villages of Satkhamar
(JL No.3, Bahadur GP) and Garalbari (JL No.9, Garalbari GP) in Jalpaiguri Sadar block and the village of
Kukurjan (JL No.29, Kukurjan GP). Buchanan Hamilton, visiting the site in 1809, described it as a series of
rectangular enclosures holding an outer city, an interior walled city, and a palace and citadel area located
near a large 47ha water tank. As local legend has it, the city was abandoned and destroyed sometime
during 13th century CE following a raid by the Kichak, i.e. Kiratas, indicating a period of turmoil when the
region neighbouring present-day Uttar Dinajpur was overrun by invasions from the north, coinciding with
the movement of the Ahom tribes into Assam. In his Tabaqat-i-Nasiri however, Minhaj records another
abortive Khilji invasion of Kamarupa under Ghiyasuddin Iwaz Shah in 1226 CE, followed ultimately by the
defeat of a similarly-named Kamarupa raja Bartuh or Britu at the hands of Nasiruddin Mahmud, governor
of Awadh, in 1228 CE shortly after the Mamluks had wrested control of Bengal from the Khiljis.
Human Development Report 2010
10
Dinajpur has been identified almost coterminously with the Varendri region of northern Bengal, which
was part of the administrative division known in ancient times as Pundravardhana. The name Dinajpur
came into general use in during early mediaeval times after the foundation of the city of Dinajpur (now in
Bangladesh) during early mediaeval times by a local ruler who held the position of Hakim (judge or governor)
of Dinaj or Danuj, but whose origins cannot be traced more precisely. It is most likely that this was Raja
Ganesha who also controlled the zamindari of Bhaturia (now in Haripur Upazila, Thakurgaon zila,
Bangladesh), located on the Kulik river just north of the border village of Kailadangi (JL No.38) in Bindol
GP, Raiganj block, and was one of the most influential feudatories of the Ilyashahi court. For four years
between 1410-1414 CE, Raja Ganesha managed to consolidate substantial power into his own hands, and
adopted the title of Danujmardandeva upon declaring himself ruler of Bengal in 1415 CE. Intervention by
the Jaunpur sultan Ibrahim Shah Sharqi in 1418 CE forced him to relinquish the throne to his son Jitmal or
Jadu, who converted to Islam and ruled subsequently as Sultan Jalaluddin Muhammad Shah. During the
first year of his reign, the Bengal capital was shifted back to Gaur from Pandua, which the Mahananda had
by then abandoned. The ascendancy of Raja Ganesha and these successors from his family was however
shortlived, and in 1435 CE, the Ilyashahi sultans were restored to power under Nasiruddin Mahmud Shah.
While the seat of political power in Bengal had shifted southwards from the Dinajpur region following the
advent of Turkic rule, Devikot or Damdamah as it came to be known later remained an important garrison
town, showing signs of continuous occupation over the period. The economic power of the independent
Bengal sultanate which was based on the developed agriculture of the Dinajpur region however triggered
frequent intrigues within the Ilyashahi court, and in 1487 CE, the last Ilyashahi sultan Jalaluddin Fateh Shah
was assassinated by an Abyssinian slave who usurped the throne as Shahzada Barbak-II. Following six
years of rule by a succession of Abyssinian sultans, a popular revolt saw the advent of the Hussainshahi
dynasty in 1494 CE under Alauddin Hussain Shah. The 44 years of Hussainshahi rule from 1494-1538 CE
are reputed to have marked the golden age of the Bengal Sultanate, during which successive victories
achieved over Kamarupa and the Khen kings at Kamata (identified with Gosanimari in Coochbehar district)
enabled the extension of its control over most of the Northern Bengal.
Over the first three and a half centuries of Turkic rule in Bengal, the Delhi Sultanate had in the meantime
witnessed internecine conflicts among the Turkic nobility, leading to displacement of the Mamluks by the
Khiljis in 1290 CE and then the displacement of the Khiljis by the Tughluq dynasty in 1321 CE. In 1324 CE,
Ghiyasuddin Tughluq had temporarily reestablished the writ of the Delhi Sultans over Bengal, before Ilyas
Shah asserted his independence in 1342 CE. In 1353 CE, Firuz Shah Tughluq led a punitive expedition to
Bengal, forcing Ilyas Shah to retreat from Pandua into the security of the Ekdala mud fort, which lay well-
protected between the Chhiramati and Balia rivers at the site now identified as Ekdala Bairhatta (JL No.39)
located in Birail GP, Kushmandi block, Dakshin Dinajpur, just north of Bairhatta and east of the border
with Patirajpur GP in Uttar Dinajpur. A long siege of the fort was mounted which proved inconclusive,
and the onset of rains compelled Firuz Shah to withdraw after both sultans had made commitments that
they would not meddle with each other’s territories. Ilyas Shah however annexed Sonargaon shortly before
he passed away, forcing Firuz Shah to make another march to Bengal in 1359 CE to confront the next
Ilyashahi sultan Sikandar Shah, who retreated once again into Ekdala. After another long siege where the
same sequence of events was played out, Firuz Shah turned his attention away from Bengal towards
Orissa. Meanwhile, the western borders of the Tughluq realms were coming under increasing attack from
the Mongols. After the sacking of Delhi in 1398 CE by Timur and his forces, the power of the later Turks
was decimated, while the Ilyashahi sultans continued to rule in Bengal for a considerable length of time,
except for the shortlived ascendancy of Raja Ganesh and his successors.
For a time, between 1414 CE and 1451 CE, effective power within the Delhi Sultanate passed from the
Turks into the hands of the Sayyid dynasty which was of Arabic origin. In Bengal, a similar transition did
not occur until 1494 CE, when Alauddin Hussain Shah laid the foundations of the Hussainshahi or Sayyid
Uttar Dinajpur
11
dynasty, also shifting his capital for a period from Gaur to the more impregnable Ekdala. In the meantime,
the Afghans who had first entered India as soldiers of fortune with the Turkic armies had made an ascent to
independent power when Bahlul Khan Lodi established the Lodi dynasty that ruled in Delhi till the decisive
victory of Babur over Ibrahim Lodi at Panipat in 1526 CE. The second Lodi sultan Sikandar Lodi had made
a foray with his army towards Bengal but had been forced to conclude a peace treaty after being stopped by
Hussain Shah’s opposing forces at the battle of Barh near Patna in 1495 CE. Closer to Bengal however,
Sher Shah of the Sur Afghan tribe, who had temporarily entered the service of Babur between 1527-1528
CE and had subsequently risen to the regency of Bihar and declared his independence from the Mughals in
1531 CE. Growing conflict between Sher Shah and the later Hussainshahi sultans led ultimately to the
defeat of Mahmud Shah by the Afghans at Kiul in 1534 CE and the ransacking of the city of Gaur in October
1537 CE. Under Sher Shah, the capital of Bengal was moved southwards from Gaur to Tandah. Extending
his rule to Delhi after decisive victories over Humayun at Chausa (1539 CE) and Kanauj (1540 CE), Sher
Shah founded the Suri dynasty which reigned in Delhi till the restoration of the Mughal throne under
Humayun in 1555 CE. Afghan rule in Bengal lasted much longer until 1576 CE, but its seat of power had
shifted decisively away by then from the Dinajpur-Malda region to the Rajmahal region across the Ganga.
Mughal rule was extended into Bengal in 1576 CE when Akbar defeated the Karranis consecutively at
Patna and Rajmahal, and incorporated Bengal into a province of the Mughal empire under the name Subah-
i-Bangal. Inheriting the system of centralised provincial administration devised by Sher Shah, the Mughals
made new settlements of land with the powerful Dinajpur zamindars. While the southern part of Varendri
located on the elevated lands of the Barind yielded a single annual rice crop, the wetter northern tracts
yielded two crops a year, thus generating an agricultural surplus large enough to export. The immense
economic and political might of the Palas as well as the Bengal sultans was founded on the high land
revenues that could be realised by the state from this agriculturally developed region, which also formed
the basis for the continuing regional dominance of Dinajpur throughout the early mediaeval period. According
to the Ain-i-Akbari by Abul Fazal, the revenue settlement made in 1582 CE by Raja Todarmal at the instance
of the emperor Akbar subdivided the subah of Bengal into 19 sarkars and 682 mahals or parganas, of
which the regions encompassing Purnea district in Bihar and small parts of Dinajpur and Malda districts in
undivided Bengal were included within the Sarkar Purneah (9 mahals) uptil the Mahananda river border,
the Sarkar Tajpur (29 mahals) including east Purnea and west Dinajpur, the Sarkar Panjrah (21 mahals)
primarily including the northern and central heartlands of old Dinajpur, the Sarkar Barbakabad (38 mahals)
including east Malda and east Dinajpur and major portions of Rajshahi and Bogra, and the Sarkar Lakhnauti
(66 mahals) including most of the Gaur areas as well as portions of Purnea and Bhagalpur. The Sarkar
Ghoraghat (88 mahals) included the remainder of Dinajpur. Along with the portion of Islampur subdivision
in modern Uttar Dinajpur district which then formed the separate pargana or mandal of Surjapur (Sujapur,
according to Ain-i-Akbari)) and was almost coterminous with the old Kishanganj subdivision of Purnea
district , the Bindol-Raiganj area was thus originally a part of the Tajpur Sarkar, while the old Pala period
settlements of Ramauti and Mahinagar were included in the Sarkar of Lakhnauti or Jannatabad, the new
title that had been given to Gaur by Humayun. The aggregate revenue assessment on this vast region of 251
mahals was valued at over 4.6 crore dams or Rs.11.41 lakh in the silver rupees of that time, amounting to
a third of its gross produce, thereby establishing the economic importance of this region to the treasury of
the Mughal durbar at Delhi.
Although Mughal dominion over the Dinajpur region lasted for nearly two centuries before the final battle
was lost at Palashi (Plassey) in 1757, the empire ruled the region indirectly through civil governors and
military faujdars, and had in the meantime shifted the seat of the regional administration to Jehangirnagar
(Dhaka) and subsequently to Murshidabad. Most of northern Purnea, including portions now transferred to
Uttar Dinajpur, was not included in the Mughal Sarkar of Purnea through most of this period, and was still
under the control of minor rulers in Nepal. It was not till after Murshid Quli Khan unified the functions of
subahdar and diwan thus establishing the autonomous Nawabi of Murshidabad, that the frontier expanded
Human Development Report 2010
12
towards the north. Thus the areas north of modern Purnea which today comprise Araria and Kishanganj
districts in Bihar, contiguous portions of Islampur SD in Uttar Dinajpur, and the southernmost portions of
Phansidewa block in Darjeeling district only became part of the Subah of Bengal in 1722 when Saif Khan,
the faujdar of the Purnea military garrison, extended the frontier substantially north of Jalalgarh fort into the
terai territories of Nepal.
The history of the northern tracts of present-day Uttar Dinajpur thus differs in radical ways from the history
of the rest of the district. The Morang or the eastern Nepal terai was heavily forested until the 19th century
and was inhabited sparsely by the so-called awalia (malaria-resisting) tribes such as the Tharus, Danuwars,
Meches and Dhimals who had either Kirati or Bodic origins. The Kichak raiders encountered in the early
history of the Dinajpur region probably formed one of these groups. While certain Rajput chieftains who
had migrated into the region in the 14th century while fleeing the invasions from the west had carved out
small independent fiefs along this forest frontier, much of the terai east of the Morang had been under the
sway of the Bodo Kachari or Mech rulers of Kamarupa and Kamata. The fall of the Bodo Kachari kingdoms
under repeated onslaughts from the Bengal sultans and the Koch and Ahoms generated periods of uncertainty,
which encouraged Bhutia expansion from the northern mountains onto the terai plains. Predatory incursions
from the north were also frequent, both from the Bhutias and from the Kirata tribes, and till the extension of
the Purnea frontier into the Morang by Saif Khan, the eastern Morang areas lying between the Kankai and
Mahananda rivers and stretching uptil Kishanganj slipped for a time into the control of Sikkim.
Meanwhile, changes kept occurring north of the Purnea frontier. By the late 18th century, when the unification
of Nepal created the impetus for eastward expansion of the Gorkhas into the territories previously held by
Sikkim, the East India Company [EIC], as successor to the diwani of Bengal, was already in control of the
northern territories of Bihar and Bengal. The Anglo-Gurkha Wars (1814-1816) finally stabilised the frontier
between Nepal and Sikkim and EIC-controlled territory in the Purnea and Rangpur terai through the Treaty
of Segoulee (Sugauli) on December 1815, while the subsequent Treaty of Titalya (Tentulia) between the
British EIC and Sikkim on 10 February 1817 restored the mountainous region between the Mechi and Tista
rivers that had been held for a while by the Gorkhas, to the sovereign possession of Sikkim. By this
combination of aggression and statecraft, the British also took formal possession of other Morang territories
vacated by Nepal, and acquired oversight over the Darjeeling terai between the Mahananda and the Mechi
as the suzerain power, through the sanad subsequently bestowed on 7 April 1817 by the EIC to Sikkim.
After the Darjeeling Grant by Sikkim on 1 February 1835 had transferred the hill territory enclaved by the
Balasan, Kail and little Rangit rivers, the Great Rangit river, and the Rongnu river, the Senchal hill-crest and
the Mahananda source region as a gift to the EIC, the territorial penalties imposed as a result of the brief
Anglo-Sikkim conflict of February 1850 gave the EIC de jure possession of the Darjeeling terai. On 8 May
1850, these annexed and acquired territories were unified under British administration, and the new position
was ratified by the Treaty of Tumlong with Sikkim on 28 March 1861, which supplanted all previous
treaties between the British and Sikkim, giving Darjeeling district a direct border with Purnea. The new
Terai subdivision of the district was formed in 1864, and was initially headquartered at Hansqua which
had been a garrison site during the Gorkha occupation. In 1884, the sudivisional headquarters were relocated,
when Siliguri was transferred to Darjeeling district from the newly reconstituted district of Jalpaiguri. Till
the award of Boda PS to East Pakistan in 1947 during Partition, the districts of Purnea and Jalpaiguri had a
common border, through which a road ran directly linking Jalpaiguri to Chopra.
In the early 18th century during the reign of Murshid Quli Khan, the land administration of Subah Bengal
had also been modified by subdividing its Mughal mahals into smaller revenue circles called chaklas, in
order to expand overall land revenue yields. While this encouraged territorial expansion and new settlement
in Bengal, it also gave the regional zamindars and faujdars greater autonomy in administering their estates
so long as overall revenue demands were met. Direct overlordship over Dinajpur thus remained in the
hands of the local zamindars who continued to wield considerable fiscal as well as judicial powers. It is
Uttar Dinajpur
13
believed traditionally that the old zamindari estate of Dinajpur Raj was founded after the lands acquired in
old Malda and Dinajpur by a court official Kasi Thakur while in the service of the Mughal governors of the
subah during the long reign of Akbar were inherited by his favoured son or successor Srimanta Dutta
Chaudhury. Since local legends assert that Kasi Thakur also had the social status of a mahant, there has
been some debate on whether this original estate comprised brahmottar or devottar lands, since the rules
of personal inheritance could not have applied in the case of the latter. An alternative derivation however
relates the Dinajpur zamindari family to the zamindari family of the Patuli Duttas of Rarh, whose common
ancestor Kabi Dutta is stated to have accumulated substantial holdings of land while in service under
Lakshmansena.
The honorific title of Raja was bestowed by Aurangzeb in 1677 upon the second Dinajpur zamindar
Sukdeb (1641-1681) who had by then successfully extended his estates eastwards and southwards to
include the Nawabganj and Ghoraghat areas in Dinajpur zila, the Badalgachhi area in Naogaon zila, the
Panchbibi and Khetlal areas in Joypurhat zila, and the Adamdighi and Shibganj areas of Bogra (Bagura) zila
in modern Bangladesh. To celebrate this event, Sukdeb excavated the tank of Sukhsagar near the town of
Dinajpur. Rising to its heyday under Prannath (1682-1733) and his successor and adoptive son Ramnath
(1733-1760), who endowed Dinajpur with the ornate Kantaji palace and the magnificent navaratna temple
at Kantanagar and also excavated the large watertanks at Pransagar (area 18.5ha, located near the village of
Sahara, JL No.144, in Gangarampur block, Dakshin Dinajpur) and Ramsagar (area 20.8ha, located in the
village of Tejpur southwards of Dinajpur town in Bangladesh), Dinajpur Raj was became one of the four
largest and wealthiest zamindaris in Bengal, encompassing a total area of over 10,300 sq.km and meeting
an annual revenue demand of over Rs. 19 lakh by the 1760s, amounting to nearly a tenth of the total
revenue assessment for Bengal. As such, its later scions including Prannath and Ramnath were well known
for their extravagances. However, the fortunes of the family changed very quickly after the accession of the
British East India Company [EIC] to the Mughal Diwani of Bengal in 1765 during the reign of Shah Alam II,
and its subsequent experiments at altering the rules of land tenure.
George Vansittart who had served as the EIC Supervisor in Dinajpur during 1770 had earlier noted the
keenness among the new Indian mercantile class to invest the profits it had secured through the EIC private
trade into lucrative revenue farming operations, also seeing in this the means to convince the older grantees
to utilise their fallows and wastelands more productively rather than risking their forfeiture to the EIC. The
new ijara system of 5-year revenue auctions that was instituted under Warren Hastings in 1772 substantially
raised the effective land revenues that were derived by the EIC under the Diwani but is acknowledged to
have triggered widespread famines in Bengal during the period. The parallel system of penalties instituted
in cases of delays in realisation or revenue defaults led to the dispossession of many old landlords and
resulting debate around the issue of proper land management versus ‘hereditary’ zamindari rights. In 1782,
during the minority of Radhanath, the adoptive heir of the Dinajpur Raj, Raja Devi Singh of Dilwarpur near
Murshidabad, who had been given additional control over the estates of Dinajpur, Rangpur and Idrakpur
on the recommendations of Hastings and the Murshidabad Nawab, proceeded to levy heavy revenue
demands on the peasantry, sparking off the long-drawn Fakir-Sanyasi revolt in northern Bengal in the late
18th and early 19th centuries. Partly as a consequence of this, Warren Hastings was ousted in 1784 and
his role in dispossessing the minor Dinajpur raja allegedly for private gain formed one of the counts for his
subsequent impeachment trial in London. Under his successor, Cornwallis, the revenue auction system
was abolished and the old zamindari families were reinstated. The control of Dinajpur Raj passed effectively
for a time into the hands of Janaki Ram Singh, brother of the dowager Rani Saraswati, who again resumed
the profligate lifestyle of the later Dinajpur zamindars, thus falling into desperate revenue arrears. Upon his
removal and confinement in 1787 on the orders of George Hatch, the new British Collector appointed to
the Dinajpur Raj , the zamindari was placed for some time with a family relative Ramakanta Roy, who had
also taken over the guardianship of Radhanath.
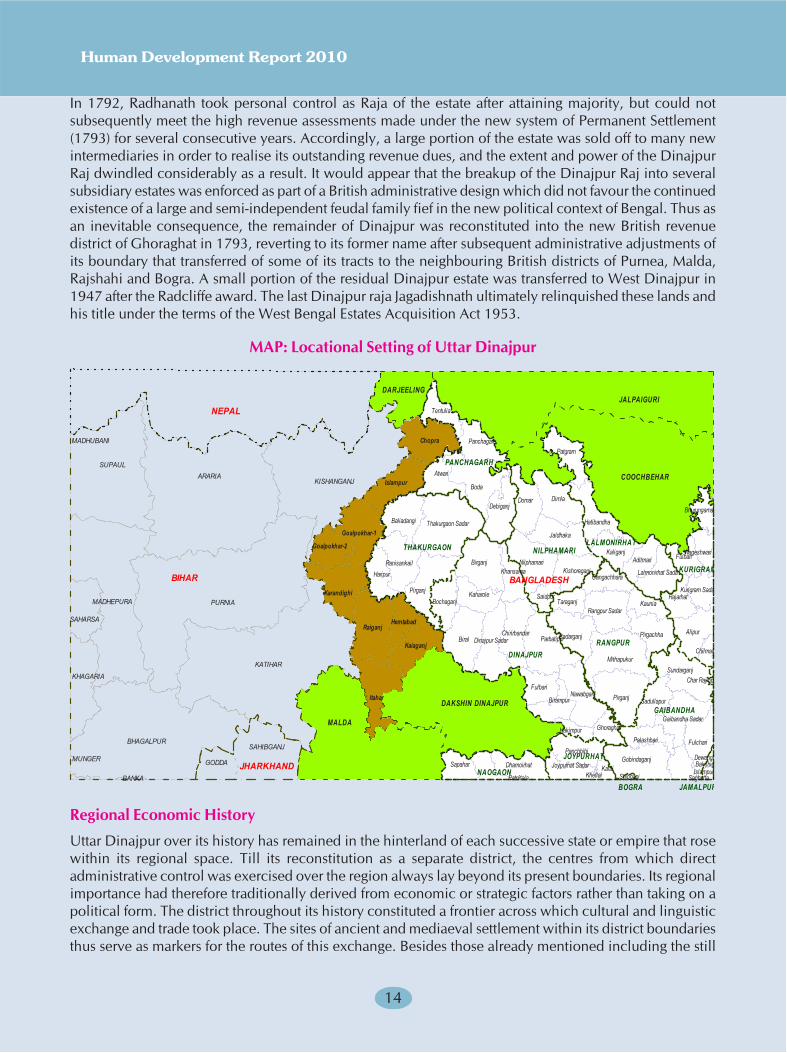
Human Development Report 2010
14
In 1792, Radhanath took personal control as Raja of the estate after attaining majority, but could notsubsequently meet the high revenue assessments made under the new system of Permanent Settlement(1793) for several consecutive years. Accordingly, a large portion of the estate was sold off to many newintermediaries in order to realise its outstanding revenue dues, and the extent and power of the DinajpurRaj dwindled considerably as a result. It would appear that the breakup of the Dinajpur Raj into severalsubsidiary estates was enforced as part of a British administrative design which did not favour the continuedexistence of a large and semi-independent feudal family fief in the new political context of Bengal. Thus asan inevitable consequence, the remainder of Dinajpur was reconstituted into the new British revenuedistrict of Ghoraghat in 1793, reverting to its former name after subsequent administrative adjustments ofits boundary that transferred of some of its tracts to the neighbouring British districts of Purnea, Malda,Rajshahi and Bogra. A small portion of the residual Dinajpur estate was transferred to West Dinajpur in1947 after the Radcliffe award. The last Dinajpur raja Jagadishnath ultimately relinquished these lands andhis title under the terms of the West Bengal Estates Acquisition Act 1953.
MAP: Locational Setting of Uttar Dinajpur
Regional Economic History
Uttar Dinajpur over its history has remained in the hinterland of each successive state or empire that rosewithin its regional space. Till its reconstitution as a separate district, the centres from which directadministrative control was exercised over the region always lay beyond its present boundaries. Its regionalimportance had therefore traditionally derived from economic or strategic factors rather than taking on apolitical form. The district throughout its history constituted a frontier across which cultural and linguisticexchange and trade took place. The sites of ancient and mediaeval settlement within its district boundariesthus serve as markers for the routes of this exchange. Besides those already mentioned including the still
DARJEELINGJALPAIGURI
COOCHBEHAR
IslampurBakshig
Char Rajibpu
Hatibandha
Patgram
JAMALPUR
LALMONIRHAT
DINAJPUR
NAOGAON
BOGRA
GAIBANDHA
KURIGRAM
NILPHAMARITHAKURGAON
BIHAR
JHARKHAND
KHAGARIA
MUNGER
MADHUBANI
BHAGALPUR
SAHARSA
DAKSHIN DINAJPUR
MALDA
Chopra
Islampur
Karandighi
Kaiaganj
RaiganjHemtabad
Goalpokhar-2
Goalpokhar-1
Itahar
Dewanga
Shibganj
Birampur
Birganj
Biral
Bochaganj
Chirirbandar
Fulbari
GhoraghatHakimpur
Kaharole
Khansama
Dinajpur Sadar
Nawabganj
Parbatipur
Fulchari
Gaibandha Sadar
Gobindaganj
Palashbari
Sadullapur
Saghatta
Sundarganj
Joypurhat Sadar KalaiKhetlal
Panchbibi
Bhurungamar
Chilmari
Fulbari
Kurigram SadarRajarhat
Alipur
AditmariKaliganj
Lalmonirhat Sada
Dhamoirhat
Patnitala
Sapahar
DimlaDomar
Jaldhaka
KishoreganjNilphamari
Saidpur
Debiganj
Panchagarh
Tentulia
Badarganj
Gangachhara
KauniaRangpur Sadar
Mithapukur
Pirgachha
Pirganj
Taraganj
Baliadangi
Haripur
Pirganj
Ranisankail
Thakurgaon Sadar
Nageshwari
Boda
AtwariPANCHAGARH
RANGPUR
JOYPURHATGODDA
SAHIBGANJ
ARARIA
BANKA
KATIHAR
KISHANGANJ
MADHEPURA PURNIA
SUPAUL
BANGLADESH
NEPAL
Uttar Dinajpur
15
unexplored fortress at Asuragarh in Goalpokhar-2 block, other places where archaeological remains, ancient
water tanks and unexplored mounds are found scattered widely within Uttar Dinajpur include Salampur
village (JL No.162) and the Karandighi water tank in Karandighi (JL No.168) both under Karandighi-2 GP in
Karandighi block; Baje Bindol (JL No.35) under Bindol GP, Kasba Mahasho (JL No.176) under Kamlabari-
1 GP and Fakirdighi near Mirual (JL No.174) under Kamlabari-2 GP, all of which are in Raiganj block;
Sonabandha (JL No.80) and Hemtabad (JL No.81) under Hemtabad GP in Hemtabad block; Ratan (JL
No.123) under Bhander GP and Kachna (JL No.142) under Baruna GP both in Kaliaganj block; as well as
Bhadrashila (JL No.85) and Porsha (JL No.110) villages under Itahar GP, Churaman (JL No.164) under
Kapasia GP, Patirajpur (JL No.56) under Patirajpur-2 GP in Itahar, and Amati near Baidara village (JL
No.247) under Joyhat GP, all in Itahar block. Their locations and the corresponding distribution of adjacent
archaeological sites at adjacent places like Bairhatta in Dakshin Dinajpur and Agradigun in adjoining
Bangladesh suggest ancient occupation of the region, with increasing density of larger urban settlements
that have left archaeological records in brick and stone to the south and the east of Uttar Dinajpur. The
northern villages in Islampur subdivision with their ancient fortifications, gachh tenancies and tribal
communities thus constituted the former frontier with the forests of the terai.
In the ancient and mediaeval past when strategic and commercial communications were performed mainly
by river, major settlements neighbouring Uttar Dinajpur such as Mahasthangarh and Devikot enjoyed the
locational advantage of being situated on principal rivers that at the time distributed the perennial snowfed
flows received from the Tista. Their river linkage to the Ganga was also critical. Both major empires that
flourished in the region during the ancient period developed from the outward extension of imperial power
originating from Magadh. The natural inroad made through the Uttar Dinajpur region by the Mahananda
linked it to them as an economic hinterland. The rise and decline of subsequent historical kingdoms was
thus affected by longterm change in these river courses. The changes around the 12th
century were profound,
when the Ganga began to shift from the Bhagirathi channel to its present course along the Padma,
accompanying the eastward shift of the Tista distributaries that had previously fed into the Punarbhava and
Atrai. These gigantic riverine realignments which are believed to have followed a major earthquake in the
east-central region of the Himalaya around 1100 CE, weakened the navigational link to earlier city settlements
like Devikot, and eventually also caused the shift of regional power to Gaur and Pandua, near the junction
of the Ganga with the Mahananda. Ultimately however, none of these ancient and mediaeval cities remained
under occupation after the locus of power shifted altogether from the vicinity of the region to newer
settlements that began to grow in places across the Ganga.
Along with the mounting threat of raids and conquest from the west, this overall regional decline was
bound also to inexorable environmental and climatic changes. While the massive scale of tank construction
and irrigation works commencing during the early mediaeval period reflect the gradual desiccation of a
land that had formerly had ample access to water, the construction of strategic roads across the region by
its mediaeval rulers reflect the need to maintain administrative communications and control through other
alternative means. Besides allowing the urban settlements to survive for some time after the rivers had
shifted, these measures sustained regional agriculture and increased the productivity of rice, turning Dinajpur
into the most important rice growing and exporting region of Bengal. Strong evidence of this agricultural
advancement is seen in the astonishing diversity in indigenous varieties of rice grown exclusively in the
region, indicating centuries of continuous evolution as well as high levels of microclimatic and topographic
adaptation in local rice farming practices. Over 75 distinct rice varieties are still named by Uttar & Dakshin
Dinajpur farmers as having once been grown on a commercial scale within the region, with good paddy
yields ranging from 2000 to 5000 kg/ha. In the deep river valleys subject to seasonal inundation, the local
varieties included gochi, boona, janroi, etc. as well as wild rice such as jhoro and ure, all of which could
float over standing water depths of upto 2m without injury. Other aman varieties such as dudhkalam,
dwarikasail, indrasail, jhingasail, katar, magursail and malsira or malsara and aus varieties such as dhaora,
katar and kashipanja flourished in drier microclimates on shallow lowlands and uplands. Early maturing
aman varieties like ashwinsail and kartiksail or mahipal with a very short growing period admirably supplied
Human Development Report 2010
16
food needs while the main rice crop was still on the field, Very late varieties which could still be sown after
failure of the initial rains included the fine aromatic tulaipanji and kataribhog. Besides table rice, many
varieties which were used almost exclusively for processed rice foods such as chira (beaten rice) or muri
(puffed rice), providing considerable household employment to women. Unfortunately, following the
increasing penetration of HYV rice as well as accompanying changes in agronomic practices and consumer
tastes, very few of these regional rice varieties have survived into the present, even in adjoining parts of
Dinajpur in Bangladesh.
Given this longterm historical specialisation in rice farming, the economic prosperity of the region lay in
the lucrative rice trade, which however had to find new export routes once the navigability of the old river
links over the winter months when the main rice crop came in had declined. The growth of new riverports
at Churamon on the junction of the Nagar and Mahananda serving the Itahar and Bairhatta-Ekdala settlement
region, and later at Raiganj, at the point uptil which the Kulik-Mahananda river route remains navigable
through the year, serving the more northwestern parts of the region, both illustrate the sustained importance
of riverine communications as well as the rice trade. Describing the system of riverine commerce he saw
while visiting the Uttar Dinajpur region at the turn of the 19th
century, Buchanan Hamilton noted the
importance of Raiganj and its Bandar area as an assembling station and export mart, to which rice was
carried either by draught animals or by smaller boats along the watercourses from places like Ranisankail.
Growing to great importance during the days of the Dinajpur Raj, Raiganj was served throughout the year
by larger boats capable of carrying upto 125 maunds (4.7mt) and had become the major market town of the
region, while Churamon served boats of upto 200 maund (7.5mt) capacity during all seasons.
Since ancient times, the Pundravardhana region had also grown substantial crops of sugarcane (paundraka
or ikshu) along its low river valleys), along with oilseed crops of til. By the late mediaeval and early modern
period, the rivertrade in rice and in these other commodities was carried down the Bhagirathi to newer
settlements like Murshidabad and Calcutta, where it yielded huge trading profits because it arrived near the
end of the agricultural season when prices were dear. Hamilton in fact made particular note of the greater
prosperity of peasants in the Barind regions which grew a single upland rice crop, compared to the peasants
who occupied better irrigated lands in the densely populated tracts that were capable of sustaining multiple
rice crops. He attributed this economic advantage to the proclivity of many Barind rice farmers to participate
in the trading and transportation of rice during the season of agricultural slack, thus reaping the dual
benefits of agriculture as well as enterprise. The strengthening of colonial power brought further economic
focus to Raiganj as a major rice exporting market when the East Bengal State Railway line was laid between
1874-1879, establishing direct railway links between Raiganj, Dinajpur, Parbatipur and Rangpur, and then
with the rest of Bengal after the Hardinge Bridge was built across the Padma in 1915. Besides considerably
speeding up the transportation of rice, railway communications stimulated the growth of commercial trade
in other agricultural commodities such as jute. Even after the decline of boat communications and river
trade during the modern age, Raiganj has held on to this locational advantage because of its situation on the
regional roadways network, and has continued to see phenomenal growth in population and commercial
activities in recent years.
The regional history of Dinajpur is therefore replete with evidence of cyclic settlement, strongly coinciding
with the degree of power and security provided by successive regimes, which encouraged phases of
agricultural extension and growth of trade. Combined by adverse natural changes such as river realignments
and physical calamities, the collapse of these regimes triggered long intervening phases of regional decline
and depopulation of settlements, during which the locus of state organisation and economic activity moved
from one part of the region to another. With the major political event of Partition, the fortunes of the region
changed substantively because of isolation from its old hinterlands. The present state of development in
Uttar Dinajpur and its future development prospects thus reflect new circumstances which have made it a
fully-fledged administrative district amidst the continuity of economic patterns that date from its ancient
past.
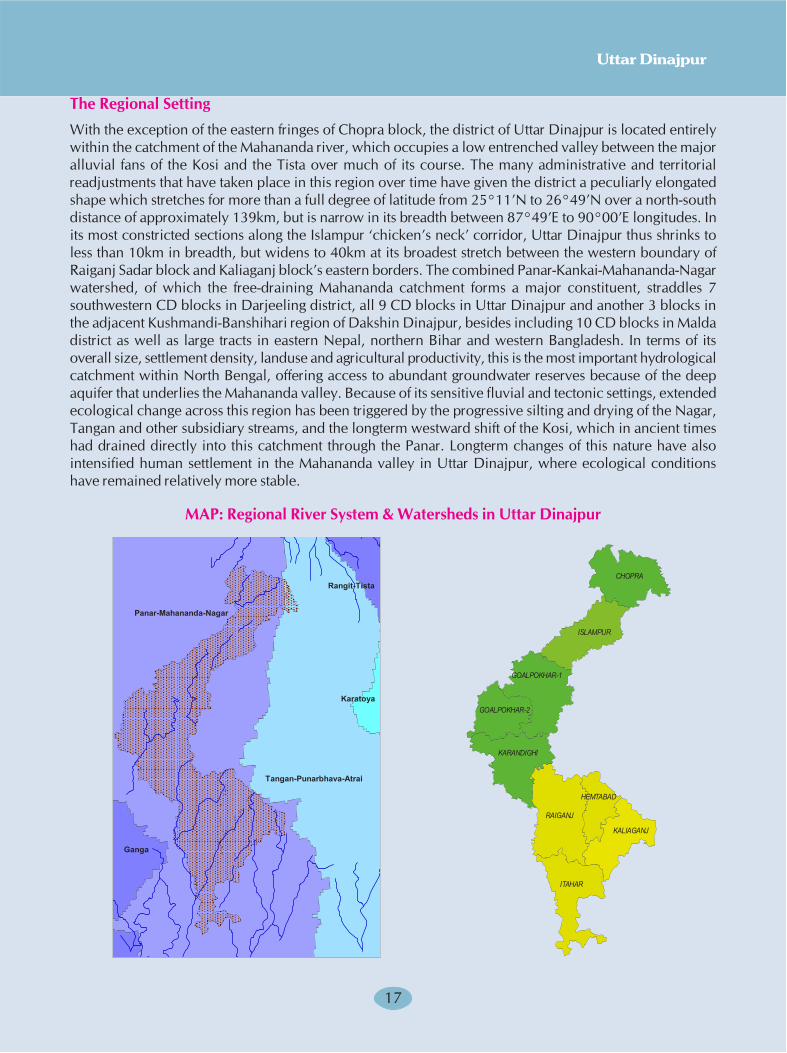
Uttar Dinajpur
17
The Regional Setting
With the exception of the eastern fringes of Chopra block, the district of Uttar Dinajpur is located entirely
within the catchment of the Mahananda river, which occupies a low entrenched valley between the major
alluvial fans of the Kosi and the Tista over much of its course. The many administrative and territorial
readjustments that have taken place in this region over time have given the district a peculiarly elongated
shape which stretches for more than a full degree of latitude from 25°11’N to 26°49’N over a north-south
distance of approximately 139km, but is narrow in its breadth between 87°49’E to 90°00’E longitudes. In
its most constricted sections along the Islampur ‘chicken’s neck’ corridor, Uttar Dinajpur thus shrinks to
less than 10km in breadth, but widens to 40km at its broadest stretch between the western boundary of
Raiganj Sadar block and Kaliaganj block’s eastern borders. The combined Panar-Kankai-Mahananda-Nagar
watershed, of which the free-draining Mahananda catchment forms a major constituent, straddles 7
southwestern CD blocks in Darjeeling district, all 9 CD blocks in Uttar Dinajpur and another 3 blocks in
the adjacent Kushmandi-Banshihari region of Dakshin Dinajpur, besides including 10 CD blocks in Malda
district as well as large tracts in eastern Nepal, northern Bihar and western Bangladesh. In terms of its
overall size, settlement density, landuse and agricultural productivity, this is the most important hydrological
catchment within North Bengal, offering access to abundant groundwater reserves because of the deep
aquifer that underlies the Mahananda valley. Because of its sensitive fluvial and tectonic settings, extended
ecological change across this region has been triggered by the progressive silting and drying of the Nagar,
Tangan and other subsidiary streams, and the longterm westward shift of the Kosi, which in ancient times
had drained directly into this catchment through the Panar. Longterm changes of this nature have also
intensified human settlement in the Mahananda valley in Uttar Dinajpur, where ecological conditions
have remained relatively more stable.
MAP: Regional River System & Watersheds in Uttar Dinajpur
�
���������
��������� �������
�����������
�������������������
�����
�
�������
��������
�� ������
���������
������������
������������
���� ����
������
�������
Human Development Report 2010
18
Uttar Dinajpur district can be broadly demarcated into three principal physiographic zones, comprising
the piedmont terraces found mostly in Chopra block to the north, the active Mahananda floodplain which
occupies more than four-fifths of the district extending from Islampur block down into northern Itahar, and
the mature floodplain that covers the lower extremities of Itahar block. Chopra block mainly comprises
elevated dangas or piedmont terraces interspersed by lowlands, along with a segment of the Mahananda
alluvial fan stretching over an area of 45 sq.km along its northwestern fringe. Local elevations decline
rapidly in the piedmont zone (300-66m), leading to the acceleration and free flow of major rivers like the
Mahananda which descend from the mountains, once their heavier colluvial sediments of gravel and sand
have been deposited at the base of the foothills. In the active floodplains, the change in gradient (66-45m)
remains sharp enough to cause scouring action by the rivers and frequent channel avulsion once they reach
their full monsoon flow. Since the adjoining Tista and Kosi on the district’s eastern and western flanks are
both snowfed rivers with larger catchments and alluvial fans, the Mahananda has remained entrenched
within its active floodplain. Other regional rivers like the Nagar, Tangan and Panar that currently flow
within or close by Uttar Dinajpur district are either distributary systems or palaeochannels left by Tista and
Kosi in earlier times, before their outward migration to their present course. High monsoon precipitation in
the upper reaches of the Mahananda catchment can cause storm surges which flood the lower Mahananda
valley, especially in the lower gradients of the mature floodplain (45-27m) near Itahar where the river
discharge becomes less efficient. However the mature floodplains which occupy less than a tenth of the
surface area of North Bengal are quickly succeeded by the large moribund region that intersects the meander
plain of the Ganga in southern Malda. Consequently, with the regional hydrological system functioning as
an integrated whole, strong backwash effects can extend up the major and minor river valleys when high
monsoon precipitation in their catchments coincides with peak discharge levels of the Ganga as it reaches
high spate. Monsoon waterlogging can thus occur in such circumstances in large parts of Hemtabad and
Itahar, Karandighi and Goalpokhar-1 blocks.
As the topographic data ranges show, elevations in the Uttar Dinajpur touch a maximum of 92m in the
piedmont zone and decline through the elongated length of the district to 27m in the mature floodplain.
The decline is somewhat uneven and at depressions found along isolated beels and waterbodies in the
district, elevations touch 25m. Nevertheless, with a quick drop in elevations past the piedmont zone, most
of Uttar Dinajpur district presents a relatively flat topographic profile except along the river valleys, with
the dominant slope consequently being much lower than the average slope in the district. Dakshin Dinajpur,
in contrast, has much less highland and therefore a much more restricted elevational range, comprising
mature floodplains and moribund tal areas. Such differences in physiographic conditions greatly influence
the agroclimatic conditions and soil distributions in the two districts, and also determine the relative
accessibility of irrigation water in their different parts.
With over four-fifths of Uttar Dinajpur being located within the active floodplains, the fluvial regimes of
regional rivers have been subject to great alteration over time, thus affecting longterm settlement patterns in
the district. Because of the break of gradient which causes silting and shifting of rivers, few stable settlements
have survived in this region from ancient times. This feature, which also causes the resulting drainage
patterns in the northern regions to diverge, is responsible for gradual distancing of the Tista-Rangit river
system from the Mahananda-Nagar river system. While the process is not unusual in submontane areas, it
can undergo sudden acceleration when flood discharges in the piedmont hit a peak following very high
precipitation in the upper catchment. The Tista and Kosi, particularly, have both been subject to cataclysmic
shifts in the past. With lowered gradients being encountered in this region, depressions tend to form when
rivers verge away from their old courses, leaving a chain of oxbows, beels and cutoff meanders behind. In
other places, natural marshlands are also formed, with hummocky areas interspersed between them.
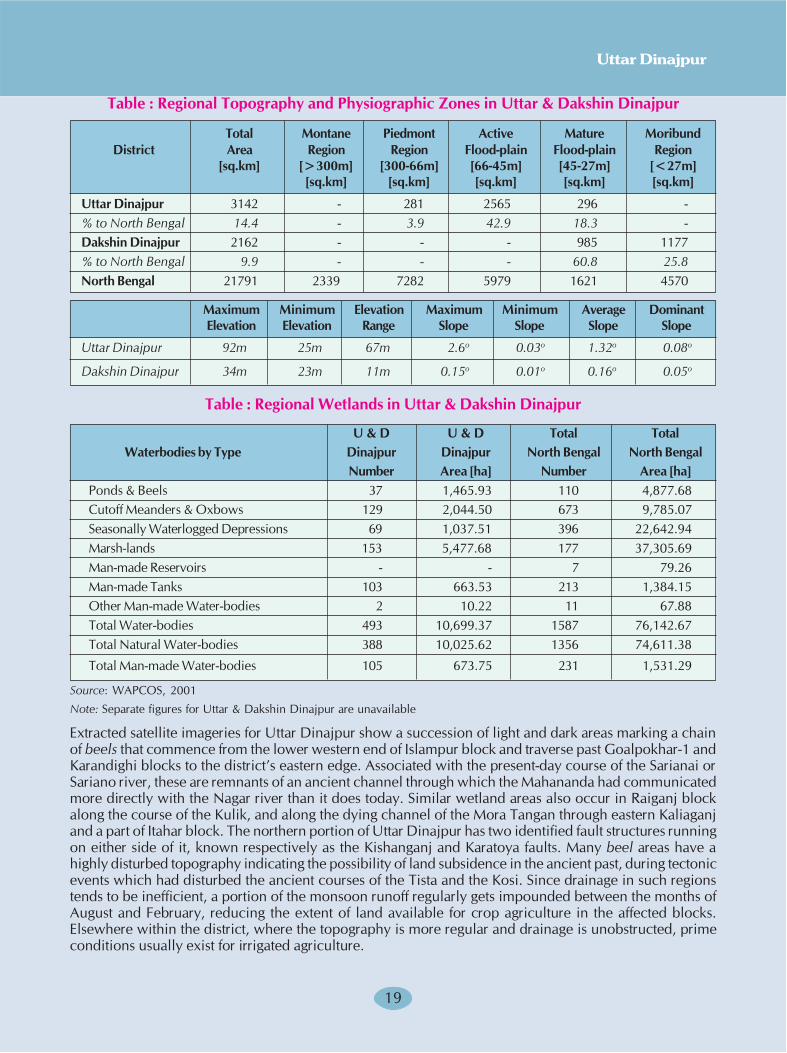
Uttar Dinajpur
19
Table : Regional Topography and Physiographic Zones in Uttar & Dakshin Dinajpur
Total Montane Piedmont Active Mature Moribund
District Area Region Region Flood-plain Flood-plain Region
[sq.km] [>300m] [300-66m] [66-45m] [45-27m] [<27m]
[sq.km] [sq.km] [sq.km] [sq.km] [sq.km]
Uttar Dinajpur 3142 - 281 2565 296 -
% to North Bengal 14.4 - 3.9 42.9 18.3 -
Dakshin Dinajpur 2162 - - - 985 1177
% to North Bengal 9.9 - - - 60.8 25.8
North Bengal 21791 2339 7282 5979 1621 4570
Maximum Minimum Elevation Maximum Minimum Average Dominant
Elevation Elevation Range Slope Slope Slope Slope
Uttar Dinajpur 92m 25m 67m 2.6o
0.03o
1.32o
0.08o
Dakshin Dinajpur 34m 23m 11m 0.15o
0.01o
0.16o
0.05o
Table : Regional Wetlands in Uttar & Dakshin Dinajpur
U & D U & D Total Total
Waterbodies by Type Dinajpur Dinajpur North Bengal North Bengal
Number Area [ha] Number Area [ha]
Ponds & Beels 37 1,465.93 110 4,877.68
Cutoff Meanders & Oxbows 129 2,044.50 673 9,785.07
Seasonally Waterlogged Depressions 69 1,037.51 396 22,642.94
Marsh-lands 153 5,477.68 177 37,305.69
Man-made Reservoirs - - 7 79.26
Man-made Tanks 103 663.53 213 1,384.15
Other Man-made Water-bodies 2 10.22 11 67.88
Total Water-bodies 493 10,699.37 1587 76,142.67
Total Natural Water-bodies 388 10,025.62 1356 74,611.38
Total Man-made Water-bodies 105 673.75 231 1,531.29
Source: WAPCOS, 2001
Note: Separate figures for Uttar & Dakshin Dinajpur are unavailable
Extracted satellite imageries for Uttar Dinajpur show a succession of light and dark areas marking a chain
of beels that commence from the lower western end of Islampur block and traverse past Goalpokhar-1 and
Karandighi blocks to the district’s eastern edge. Associated with the present-day course of the Sarianai or
Sariano river, these are remnants of an ancient channel through which the Mahananda had communicated
more directly with the Nagar river than it does today. Similar wetland areas also occur in Raiganj block
along the course of the Kulik, and along the dying channel of the Mora Tangan through eastern Kaliaganj
and a part of Itahar block. The northern portion of Uttar Dinajpur has two identified fault structures running
on either side of it, known respectively as the Kishanganj and Karatoya faults. Many beel areas have a
highly disturbed topography indicating the possibility of land subsidence in the ancient past, during tectonic
events which had disturbed the ancient courses of the Tista and the Kosi. Since drainage in such regions
tends to be inefficient, a portion of the monsoon runoff regularly gets impounded between the months of
August and February, reducing the extent of land available for crop agriculture in the affected blocks.
Elsewhere within the district, where the topography is more regular and drainage is unobstructed, prime
conditions usually exist for irrigated agriculture.
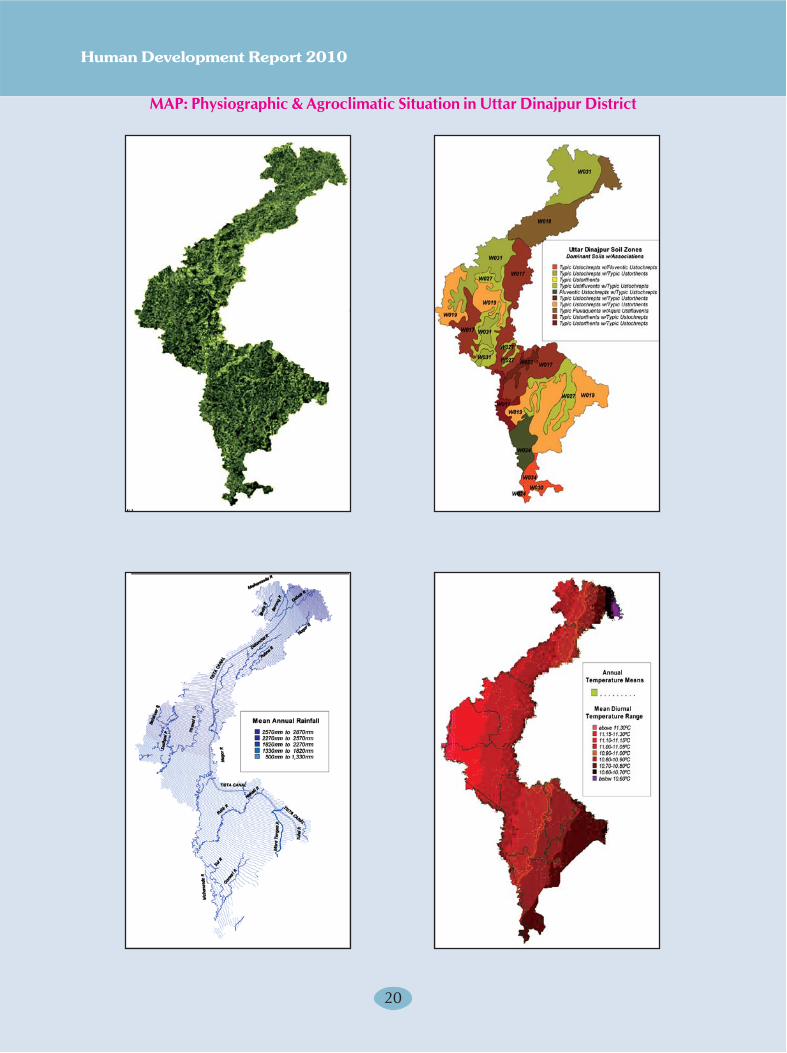
Human Development Report 2010
20
MAP: Physiographic & Agroclimatic Situation in Uttar Dinajpur District
Uttar Dinajpur
21
The depositional patterns of soils in Uttar Dinajpur district closely echo these past and present fluvial
regimes. Most soils in the district are of recent alluvial origin, and are classified under the USDA soil
classification system as ustic soils, i.e. soils which are essentially dry in nature, but retain enough soil
moisture seasonally under managed conditions to support plant growth. Dominant soils along the western
edges of Chopra, Goalpokhar-1 and Goalpokhar-2 blocks, as well as those in southern Raiganj, Itahar and
most of Kaliaganj have a fine loamy texture with limited clay and humus accumulation, thus falling into the
soil order of inceptisols. In contrast, the dominant soils in eastern Chopra, Islampur, eastern Goalpokhar-
1 and most of Karandighi and Raiganj blocks which are of more recent alluvial origin, range from coarse
loamy to fine loamy in texture and belong to the order of entisols. A small region of very young fluventic
soils [soil-class W024] occurs in Itahar block near the cusp of the Mahananda, Sui and Gamari rivers,
composed of alluvium recently deposited along river banks and streams, which generally lacks clay and
organic materials. Slightly to the northwest of this, where the Kulik meets the Mahananda along the western
edge of Raiganj block, is an area of active alluvium [soil-class W011] where deposition and active land-
building processes are currently underway. Although the only primary area of old alluvium [soil-class
W034] within Uttar Dinajpur is located in the region to the extreme south of Itahar blocks, most of the
transported soils found along the lower river valleys of the district are overlaid by a light-coloured or ochric
surface layer that is generally poor in organic carbon.
In terms of drainage classes, the soil zones forming the western areas in Chopra, Goalpokhar-1 and
Goalpokhar-2 blocks are largely characterised by imperfect drainage conditions. Most of Kaliaganj [soil-
class W019] as well as similar portions of Goalpokhar-1 and Goalpokhar-2 carry the additional hazard of
water impoundment and subsequent flooding, while the low-lying Mahananda-Gamari confluence area
[soil-class W024] in Itahar subject to active erosion processes. Thus the best drained soils [soil-class W017]
in Uttar Dinajpur district occur in the region bounded by the Nagar and Kulik river basins, extending over
the eastern tracts of Goalpokhar-1 and Karandighi, as well as the northern Raiganj and northern Hemtabad.
Although another patch of similar soil also recurs in southwestern Karandighi, drainage conditions in the
central Karandighi region which marks the ancient passage of the Mahananda are more disturbed however.
Dominant soils in the region [soil-class W017] lying to the south of the Dahuk river and spreading over
eastern Chopra and most of Islampur block show higher water tables combined with poor drainage
conditions, indicating that the region had been under inundation until comparatively recent times.
Rainfall patterns vary quite widely within Uttar Dinajpur, with sharp divergence in annual precipitation
between the five southern blocks of Karandighi, Raiganj, Hemtabad, Kaliaganj and Itahar, and the four terai
blocks of Chopra, Islampur, Goalpokhar-1 and Goalpokhar-2. Thus, while southernmost Itahar receives
around 1400-1500mm of rain annually, northeastern Chopra receives much higher precipitation ranging
between 240-2700mm p.a. A number of minor rivers thus originate from the overflows from the beels that
dot the imperfectly drained areas in the northern regions of the district. While most of these flow
southeastwards to feed the Nagar, the overflows from beels located in the western Goalpokhar region feed
the Mahananda river system. The combination of regional elevational ranges and precipitation patterns
also result in characteristic variations between mean diurnal temperature ranges in different parts of Uttar
Dinajpur. While mean annual temperatures gradually increase from the north to the south of the district,
diurnal temperature ranges increase from the west to the east. Itahar, Kaliaganj and Chopra blocks thus
show much higher variations between daily minimum and daily maximum temperatures than either
Goalpokhar-2 or Karandighi blocks. These local climatic patterns also have an important bearing on
agricultural and occupational profiles in the different Uttar Dinajpur blocks.
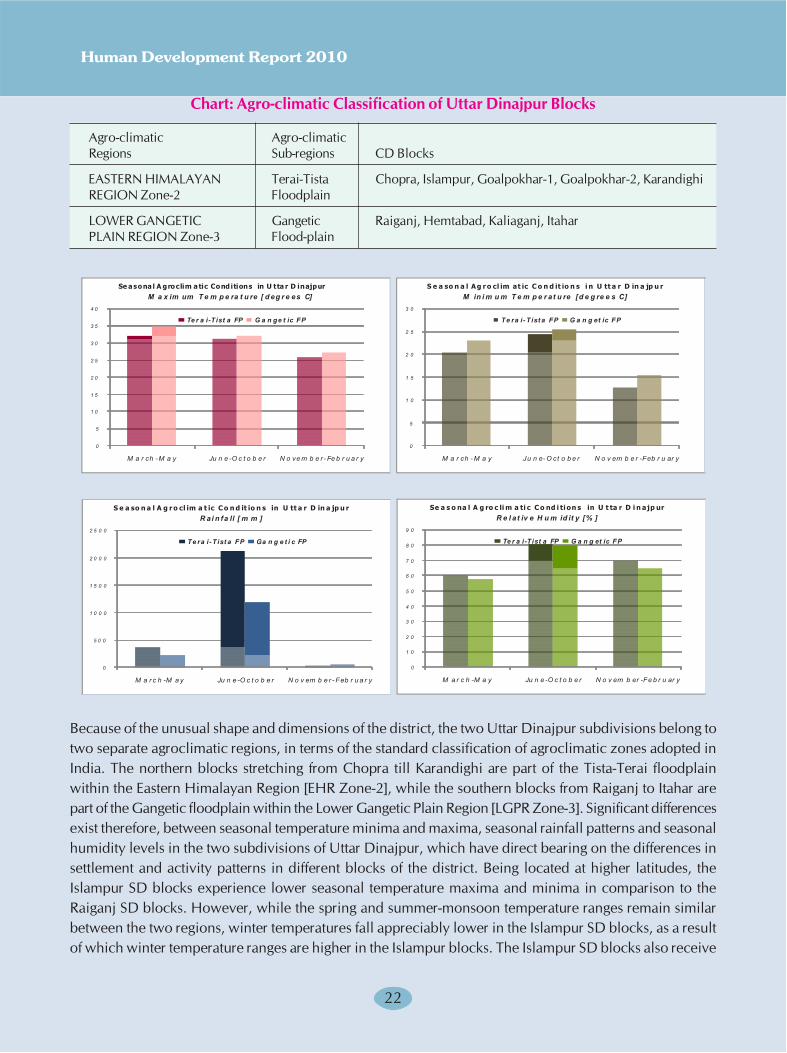
Human Development Report 2010
22
Chart: Agro-climatic Classification of Uttar Dinajpur Blocks
Agro-climatic Agro-climatic
Regions Sub-regions CD Blocks
EASTERN HIMALAYAN Terai-Tista Chopra, Islampur, Goalpokhar-1, Goalpokhar-2, Karandighi
REGION Zone-2 Floodplain
LOWER GANGETIC Gangetic Raiganj, Hemtabad, Kaliaganj, Itahar
PLAIN REGION Zone-3 Flood-plain
Because of the unusual shape and dimensions of the district, the two Uttar Dinajpur subdivisions belong to
two separate agroclimatic regions, in terms of the standard classification of agroclimatic zones adopted in
India. The northern blocks stretching from Chopra till Karandighi are part of the Tista-Terai floodplain
within the Eastern Himalayan Region [EHR Zone-2], while the southern blocks from Raiganj to Itahar are
part of the Gangetic floodplain within the Lower Gangetic Plain Region [LGPR Zone-3]. Significant differences
exist therefore, between seasonal temperature minima and maxima, seasonal rainfall patterns and seasonal
humidity levels in the two subdivisions of Uttar Dinajpur, which have direct bearing on the differences in
settlement and activity patterns in different blocks of the district. Being located at higher latitudes, the
Islampur SD blocks experience lower seasonal temperature maxima and minima in comparison to the
Raiganj SD blocks. However, while the spring and summer-monsoon temperature ranges remain similar
between the two regions, winter temperatures fall appreciably lower in the Islampur SD blocks, as a result
of which winter temperature ranges are higher in the Islampur blocks. The Islampur SD blocks also receive
�
�
� �
� �
� �
� �
� �
� �
� �
� � � �� �� � � � � � � � � � � � � � ��� � � � � �� � � � � �
�� � � ��� �� � �� � � �� �� ��
������� � ��� ��� ��� ���� ������ ��� ��� �� �������
� � � �� �� � � �� � � � � � � � � ��
�
�
� �
� �
� �
� �
� �
� � � �� �� � � � �� �� � � � � � � � �� � � � ���� � �� �
�� �� �� � �� � �� � � � � �� ��
� � � �� � � �� �� � �� �� � � � � � �� �� � � � �� �� � � � �� � �� � �
� �� �� �� � � � �� � � �� � � � ��
�
� � �
� � � �
� � � �
� � � �
� � � �
� � � � � �� � � � � � � � � � � � � � � �� � � � � ��� � � � �
�� �� ��� �� � �� � � � � � ���
� � � �� � � � � �� � �� � � � �� �� �� �� � � �� � �� � � � �� � �� � �
��� � �� �� � � � �
�
� �
� �
� �
� �
� �
� �
�
�
� �
� � � � � �� � � � � � � � � � � � � � � �� � �� ��� � � �� �
�� � � ��� �� � �� � � � � �� ��
�� � � � �� � � �� ��� � �� �� �� � �� �� � �� � � �� � � � � ��� ��
� � �� �� � �� �� �� � �� �
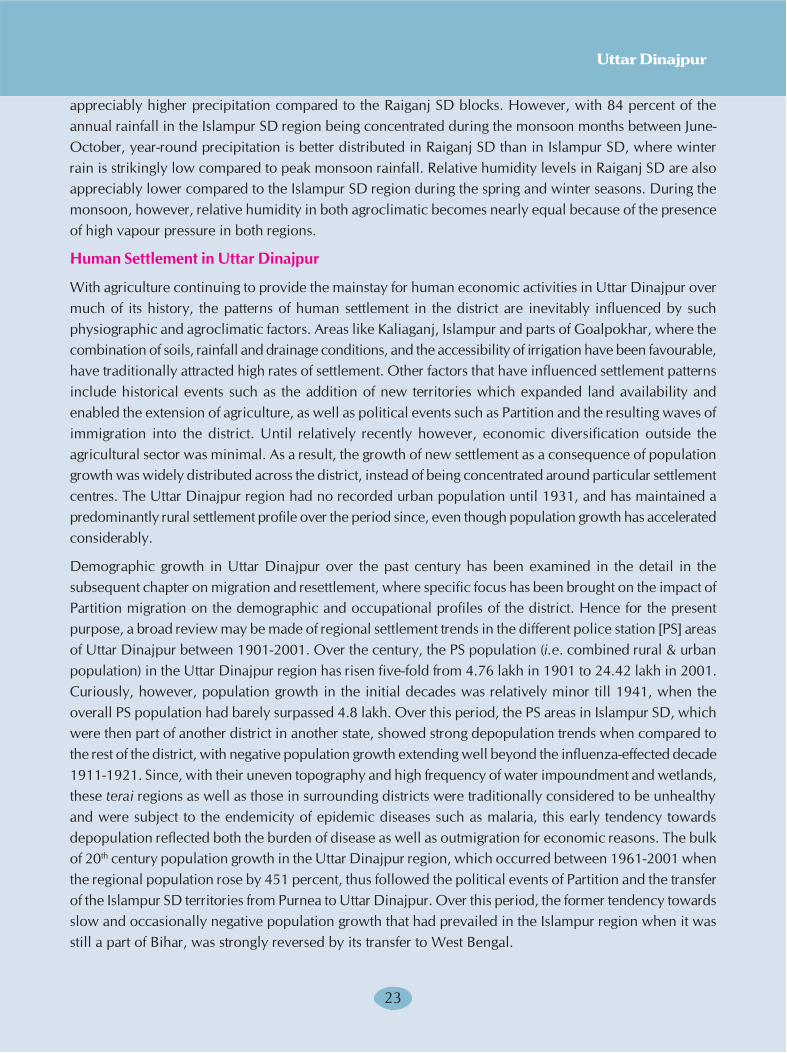
Uttar Dinajpur
23
appreciably higher precipitation compared to the Raiganj SD blocks. However, with 84 percent of the
annual rainfall in the Islampur SD region being concentrated during the monsoon months between June-
October, year-round precipitation is better distributed in Raiganj SD than in Islampur SD, where winter
rain is strikingly low compared to peak monsoon rainfall. Relative humidity levels in Raiganj SD are also
appreciably lower compared to the Islampur SD region during the spring and winter seasons. During the
monsoon, however, relative humidity in both agroclimatic becomes nearly equal because of the presence
of high vapour pressure in both regions.
Human Settlement in Uttar Dinajpur
With agriculture continuing to provide the mainstay for human economic activities in Uttar Dinajpur over
much of its history, the patterns of human settlement in the district are inevitably influenced by such
physiographic and agroclimatic factors. Areas like Kaliaganj, Islampur and parts of Goalpokhar, where the
combination of soils, rainfall and drainage conditions, and the accessibility of irrigation have been favourable,
have traditionally attracted high rates of settlement. Other factors that have influenced settlement patterns
include historical events such as the addition of new territories which expanded land availability and
enabled the extension of agriculture, as well as political events such as Partition and the resulting waves of
immigration into the district. Until relatively recently however, economic diversification outside the
agricultural sector was minimal. As a result, the growth of new settlement as a consequence of population
growth was widely distributed across the district, instead of being concentrated around particular settlement
centres. The Uttar Dinajpur region had no recorded urban population until 1931, and has maintained a
predominantly rural settlement profile over the period since, even though population growth has accelerated
considerably.
Demographic growth in Uttar Dinajpur over the past century has been examined in the detail in the
subsequent chapter on migration and resettlement, where specific focus has been brought on the impact of
Partition migration on the demographic and occupational profiles of the district. Hence for the present
purpose, a broad review may be made of regional settlement trends in the different police station [PS] areas
of Uttar Dinajpur between 1901-2001. Over the century, the PS population (i.e. combined rural & urban
population) in the Uttar Dinajpur region has risen five-fold from 4.76 lakh in 1901 to 24.42 lakh in 2001.
Curiously, however, population growth in the initial decades was relatively minor till 1941, when the
overall PS population had barely surpassed 4.8 lakh. Over this period, the PS areas in Islampur SD, which
were then part of another district in another state, showed strong depopulation trends when compared to
the rest of the district, with negative population growth extending well beyond the influenza-effected decade
1911-1921. Since, with their uneven topography and high frequency of water impoundment and wetlands,
these terai regions as well as those in surrounding districts were traditionally considered to be unhealthy
and were subject to the endemicity of epidemic diseases such as malaria, this early tendency towards
depopulation reflected both the burden of disease as well as outmigration for economic reasons. The bulk
of 20th
century population growth in the Uttar Dinajpur region, which occurred between 1961-2001 when
the regional population rose by 451 percent, thus followed the political events of Partition and the transfer
of the Islampur SD territories from Purnea to Uttar Dinajpur. Over this period, the former tendency towards
slow and occasionally negative population growth that had prevailed in the Islampur region when it was
still a part of Bihar, was strongly reversed by its transfer to West Bengal.
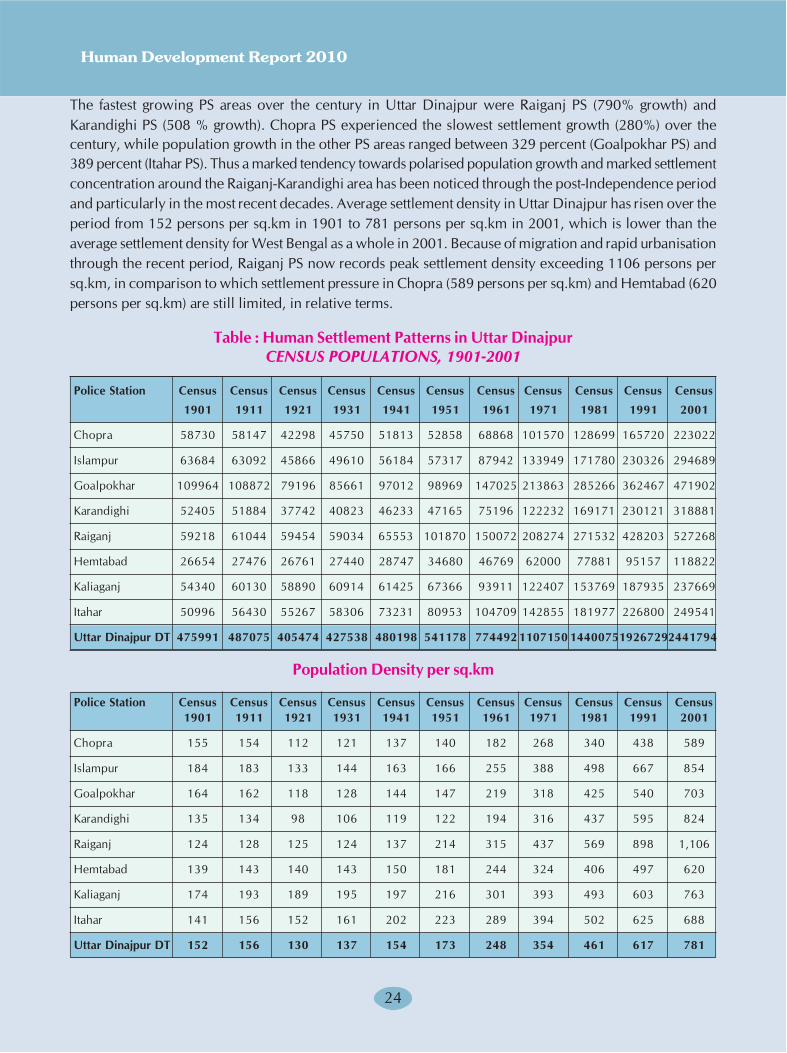
Human Development Report 2010
24
The fastest growing PS areas over the century in Uttar Dinajpur were Raiganj PS (790% growth) and
Karandighi PS (508 % growth). Chopra PS experienced the slowest settlement growth (280%) over the
century, while population growth in the other PS areas ranged between 329 percent (Goalpokhar PS) and
389 percent (Itahar PS). Thus a marked tendency towards polarised population growth and marked settlement
concentration around the Raiganj-Karandighi area has been noticed through the post-Independence period
and particularly in the most recent decades. Average settlement density in Uttar Dinajpur has risen over the
period from 152 persons per sq.km in 1901 to 781 persons per sq.km in 2001, which is lower than the
average settlement density for West Bengal as a whole in 2001. Because of migration and rapid urbanisation
through the recent period, Raiganj PS now records peak settlement density exceeding 1106 persons per
sq.km, in comparison to which settlement pressure in Chopra (589 persons per sq.km) and Hemtabad (620
persons per sq.km) are still limited, in relative terms.
Table : Human Settlement Patterns in Uttar Dinajpur
CENSUS POPULATIONS, 1901-2001
Police Station Census Census Census Census Census Census Census Census Census Census Census
1901 1911 1921 1931 1941 1951 1961 1971 1981 1991 2001
Chopra 58730 58147 42298 45750 51813 52858 68868 101570 128699 165720 223022
Islampur 63684 63092 45866 49610 56184 57317 87942 133949 171780 230326 294689
Goalpokhar 109964 108872 79196 85661 97012 98969 147025 213863 285266 362467 471902
Karandighi 52405 51884 37742 40823 46233 47165 75196 122232 169171 230121 318881
Raiganj 59218 61044 59454 59034 65553 101870 150072 208274 271532 428203 527268
Hemtabad 26654 27476 26761 27440 28747 34680 46769 62000 77881 95157 118822
Kaliaganj 54340 60130 58890 60914 61425 67366 93911 122407 153769 187935 237669
Itahar 50996 56430 55267 58306 73231 80953 104709 142855 181977 226800 249541
Uttar Dinajpur DT 475991 487075 405474 427538 480198 541178 774492 1107150 144007519267292441794
Population Density per sq.km
Police Station Census Census Census Census Census Census Census Census Census Census Census
1901 1911 1921 1931 1941 1951 1961 1971 1981 1991 2001
Chopra 155 154 112 121 137 140 182 268 340 438 589
Islampur 184 183 133 144 163 166 255 388 498 667 854
Goalpokhar 164 162 118 128 144 147 219 318 425 540 703
Karandighi 135 134 98 106 119 122 194 316 437 595 824
Raiganj 124 128 125 124 137 214 315 437 569 898 1,106
Hemtabad 139 143 140 143 150 181 244 324 406 497 620
Kaliaganj 174 193 189 195 197 216 301 393 493 603 763
Itahar 141 156 152 161 202 223 289 394 502 625 688
Uttar Dinajpur DT 152 156 130 137 154 173 248 354 461 617 781
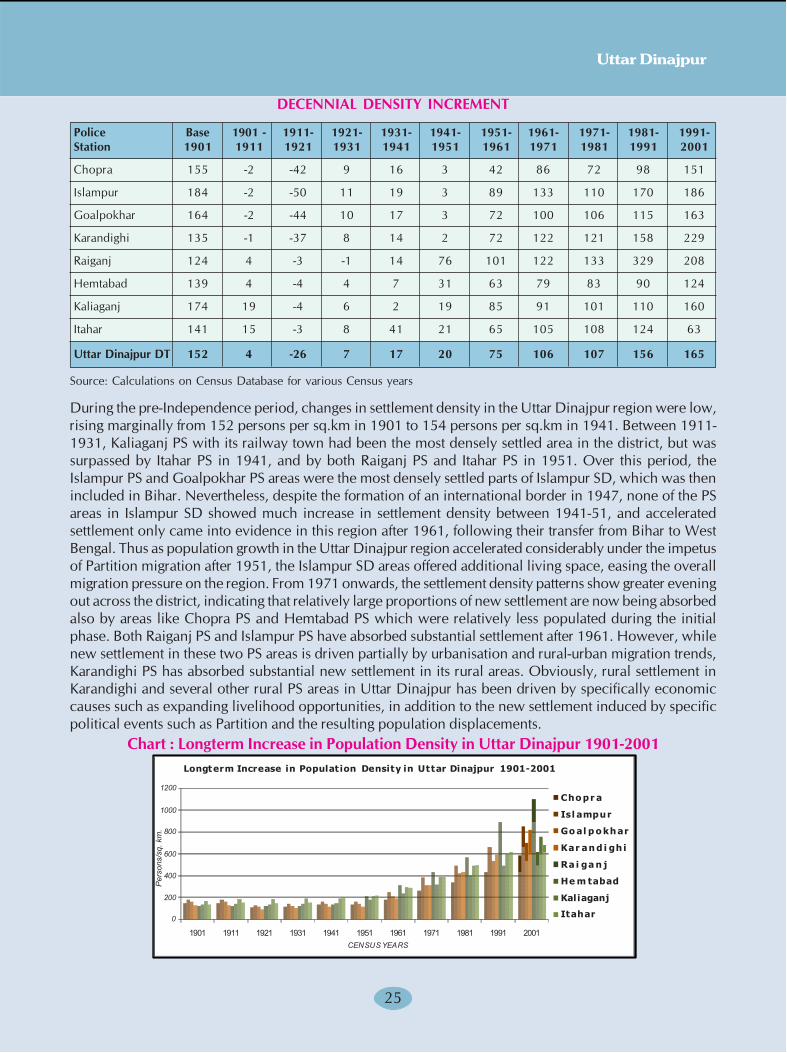
Uttar Dinajpur
25
DECENNIAL DENSITY INCREMENT
Police Base 1901 - 1911- 1921- 1931- 1941- 1951- 1961- 1971- 1981- 1991-
Station 1901 1911 1921 1931 1941 1951 1961 1971 1981 1991 2001
Chopra 155 -2 -42 9 16 3 42 86 72 98 151
Islampur 184 -2 -50 11 19 3 89 133 110 170 186
Goalpokhar 164 -2 -44 10 17 3 72 100 106 115 163
Karandighi 135 -1 -37 8 14 2 72 122 121 158 229
Raiganj 124 4 -3 -1 14 76 101 122 133 329 208
Hemtabad 139 4 -4 4 7 31 63 79 83 90 124
Kaliaganj 174 19 -4 6 2 19 85 91 101 110 160
Itahar 141 15 -3 8 41 21 65 105 108 124 63
Uttar Dinajpur DT 152 4 -26 7 17 20 75 106 107 156 165
Source: Calculations on Census Database for various Census years
During the pre-Independence period, changes in settlement density in the Uttar Dinajpur region were low,
rising marginally from 152 persons per sq.km in 1901 to 154 persons per sq.km in 1941. Between 1911-
1931, Kaliaganj PS with its railway town had been the most densely settled area in the district, but was
surpassed by Itahar PS in 1941, and by both Raiganj PS and Itahar PS in 1951. Over this period, the
Islampur PS and Goalpokhar PS areas were the most densely settled parts of Islampur SD, which was then
included in Bihar. Nevertheless, despite the formation of an international border in 1947, none of the PS
areas in Islampur SD showed much increase in settlement density between 1941-51, and accelerated
settlement only came into evidence in this region after 1961, following their transfer from Bihar to West
Bengal. Thus as population growth in the Uttar Dinajpur region accelerated considerably under the impetus
of Partition migration after 1951, the Islampur SD areas offered additional living space, easing the overall
migration pressure on the region. From 1971 onwards, the settlement density patterns show greater evening
out across the district, indicating that relatively large proportions of new settlement are now being absorbed
also by areas like Chopra PS and Hemtabad PS which were relatively less populated during the initial
phase. Both Raiganj PS and Islampur PS have absorbed substantial settlement after 1961. However, while
new settlement in these two PS areas is driven partially by urbanisation and rural-urban migration trends,
Karandighi PS has absorbed substantial new settlement in its rural areas. Obviously, rural settlement in
Karandighi and several other rural PS areas in Uttar Dinajpur has been driven by specifically economic
causes such as expanding livelihood opportunities, in addition to the new settlement induced by specific
political events such as Partition and the resulting population displacements.
Chart : Longterm Increase in Population Density in Uttar Dinajpur 1901-2001
�
���
���
���
���
����
����
���� ���� ���� ���� ���� ���� ��� ��� ���� ���� ����
����� �
� �����
�� ������
��� ��� � �� �
�� � ��� �
��� �����
��������
������
�������������������������� ���� ������ ��� �������������� !"#!$%##!
���� ���
Per
sons
/sq.
km
.

Human Development Report 2010
26
CHARTS: Population Settlement & Settlement Density Increments in Uttar Dinajpur
PS Areas, 1901-2001
Village level changes in the Uttar Dinajpur rural population over the most recent census decade 1991-
2001, as seen in the accompanying mouza maps, further establish that recent population growth has been
more concentrated in the Islampur SD region than in the Raiganj SD region. Many mouzas located between
Chopra and the northern and western parts of Goalpokhar-1 block thus show intercensal population increases
of 500 or more persons, with the fastest growing mouzas recording increases exceeding 2500 persons over
the period. In eastern Goalpokhar-1 and western Goalpokhar-2 blocks, as also along the Bangladesh border
with Raiganj, Hemtabad and Kaliaganj, many mouza populations record absolute declines over the same
period, indicating that that there is a pronounced tendency for outmigration from these border mouzas.
Similar absolute declines have also occurred in the Itahar mouzas located along the Mahananda, and along
the Kaliaganj and Itahar block borders with Dakshin Dinajpur. Since similar population declines have
occurred in the mouzas in the immediate vicinity of the municipal townships of Raiganj and Islampur, this
indicates that a certain amount of rural-urban migration from outlying rural areas into the major towns is
now occurring with increasing frequency in Uttar Dinajpur district. The impetus for such migration is
economic in nature and is driven by the livelihood searches of the rural population in the district.
Unlike the general trend in most parts of West Bengal, where the number of cultivators registered an
absolute decline between 1991-2001, many Uttar Dinajpur villages have recorded absolute increases in
the number of cultivators over the same period. The main regions where such increases have occurred
include the border areas of eastern Islampur block, much of Goalpokhar-1 and Goalpokhar-2 blocks,
northern Raiganj and the Kaliaganj border with Dakshin Dinajpur district. In these regions, the principal
livelihood choices made by rural residents are still provided by agriculture. Elsewhere in the district,
particularly in Chopra and its adjoining areas in Islampur, there has been a marked decline in the number
of cultivators, because of the largescale switchover from crop farming to small tea plantations. Many
villages in Karandighi, Hemtabad and Itahar also show similar declines. These declines are however of a
���� � ��� ��� ��� ���
����
����
���
���
����
����
����
����
����
����
����
����� �� � �
���� � ��� ��� ��� ���
����
����
���
���
����
����
����
����
����
����
����
� ���� �������� � �����
���� � ��� ��� ��� ���
����
����
���
���
����
����
����
����
����
����
����
� ���� � ���� � �� � �� ���� � �
���� � ��� ��� ��� ���
����
����
���
���
����
����
����
����
����
����
����
����� � �� �
���� � ��� ��� ��� ���
����
����
���
���
����
����
����
����
����
����
����
�������
���� � ��� ��� ��� ���
����
����
���
���
����
����
����
����
����
����
����
� �� � �� ��
���� � ��� ��� ��� ���
����
����
���
���
����
����
����
����
����
����
����
��� ����� �
���� � ��� ��� ��� ���
����
����
���
���
����
����
����
����
����
����
����
�� � � �
� ���� � ���� � �� � � ���� � ���� � �� �
� ���� �������� � � ���� � ���� � �� � � ���� � ���� � �� � � ���� � ���� � �� �
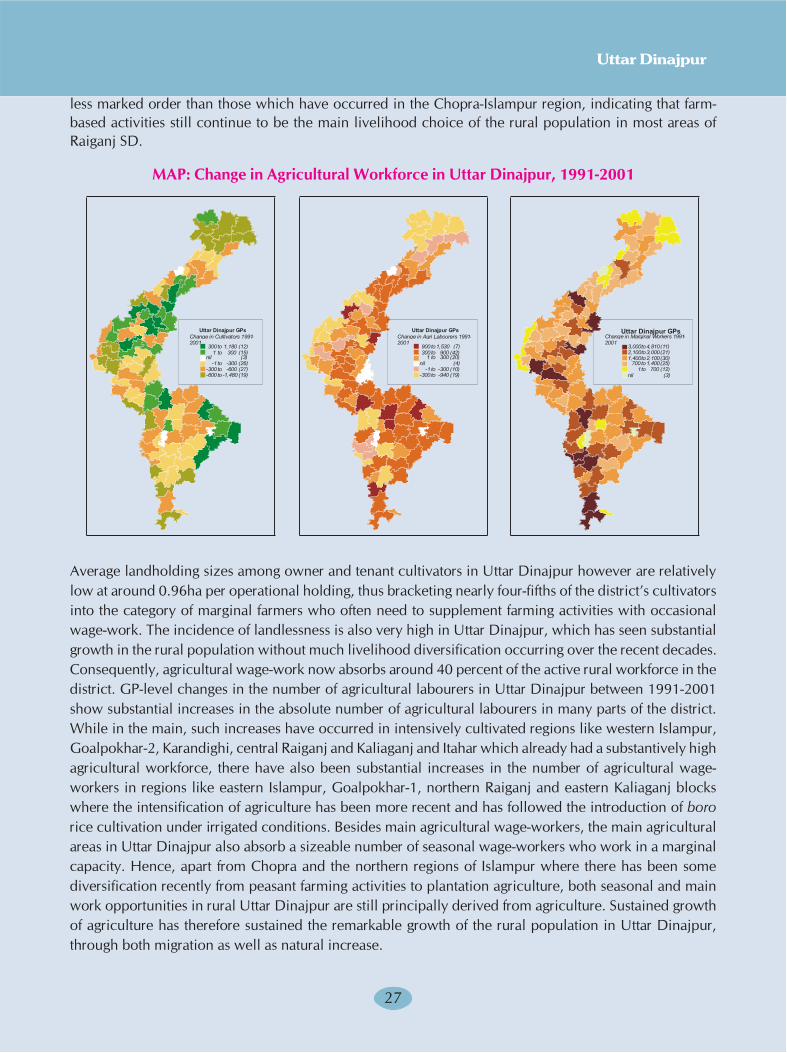
Uttar Dinajpur
27
less marked order than those which have occurred in the Chopra-Islampur region, indicating that farm-
based activities still continue to be the main livelihood choice of the rural population in most areas of
Raiganj SD.
MAP: Change in Agricultural Workforce in Uttar Dinajpur, 1991-2001
Average landholding sizes among owner and tenant cultivators in Uttar Dinajpur however are relatively
low at around 0.96ha per operational holding, thus bracketing nearly four-fifths of the district’s cultivators
into the category of marginal farmers who often need to supplement farming activities with occasional
wage-work. The incidence of landlessness is also very high in Uttar Dinajpur, which has seen substantial
growth in the rural population without much livelihood diversification occurring over the recent decades.
Consequently, agricultural wage-work now absorbs around 40 percent of the active rural workforce in the
district. GP-level changes in the number of agricultural labourers in Uttar Dinajpur between 1991-2001
show substantial increases in the absolute number of agricultural labourers in many parts of the district.
While in the main, such increases have occurred in intensively cultivated regions like western Islampur,
Goalpokhar-2, Karandighi, central Raiganj and Kaliaganj and Itahar which already had a substantively high
agricultural workforce, there have also been substantial increases in the number of agricultural wage-
workers in regions like eastern Islampur, Goalpokhar-1, northern Raiganj and eastern Kaliaganj blocks
where the intensification of agriculture has been more recent and has followed the introduction of boro
rice cultivation under irrigated conditions. Besides main agricultural wage-workers, the main agricultural
areas in Uttar Dinajpur also absorb a sizeable number of seasonal wage-workers who work in a marginal
capacity. Hence, apart from Chopra and the northern regions of Islampur where there has been some
diversification recently from peasant farming activities to plantation agriculture, both seasonal and main
work opportunities in rural Uttar Dinajpur are still principally derived from agriculture. Sustained growth
of agriculture has therefore sustained the remarkable growth of the rural population in Uttar Dinajpur,
through both migration as well as natural increase.
�
��
������������� ���
������������ �����������
�����
����
�����
������
�������
��
�����
����
�������
���
������
���
�����
�����
�������
�����
�����
�����
�������
�����
�����
�������
�������
�
��
������������� ���
������������� �!�����������
�����
����
�����
������
������
����
�����
����
�������
��
�����
����
�������
���
������
���
�����
�����
�������
�����
�����
�����
�������
�
��
������������� ���
���������"�������#��$���������
�����
������
�����
������
�������
������
�����
������
�������
������
�����
������
�������
����
�����
������
�������
��
�����
����
�������
���
������
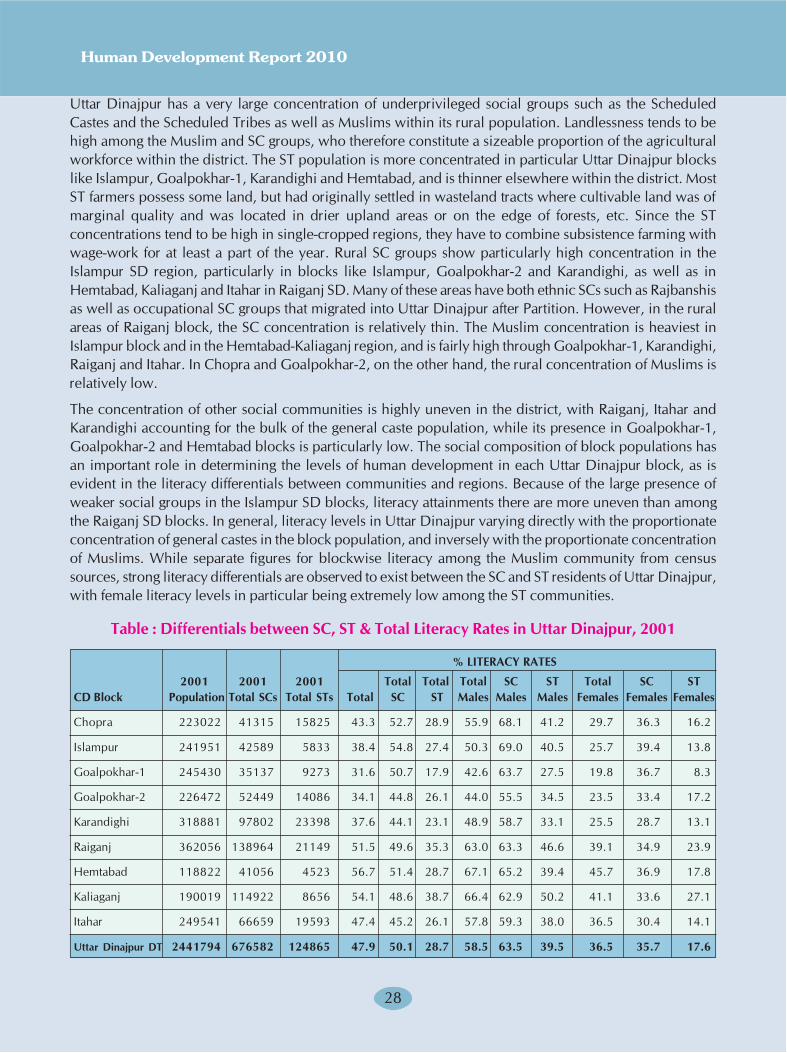
Human Development Report 2010
28
Uttar Dinajpur has a very large concentration of underprivileged social groups such as the Scheduled
Castes and the Scheduled Tribes as well as Muslims within its rural population. Landlessness tends to be
high among the Muslim and SC groups, who therefore constitute a sizeable proportion of the agricultural
workforce within the district. The ST population is more concentrated in particular Uttar Dinajpur blocks
like Islampur, Goalpokhar-1, Karandighi and Hemtabad, and is thinner elsewhere within the district. Most
ST farmers possess some land, but had originally settled in wasteland tracts where cultivable land was of
marginal quality and was located in drier upland areas or on the edge of forests, etc. Since the ST
concentrations tend to be high in single-cropped regions, they have to combine subsistence farming with
wage-work for at least a part of the year. Rural SC groups show particularly high concentration in the
Islampur SD region, particularly in blocks like Islampur, Goalpokhar-2 and Karandighi, as well as in
Hemtabad, Kaliaganj and Itahar in Raiganj SD. Many of these areas have both ethnic SCs such as Rajbanshis
as well as occupational SC groups that migrated into Uttar Dinajpur after Partition. However, in the rural
areas of Raiganj block, the SC concentration is relatively thin. The Muslim concentration is heaviest in
Islampur block and in the Hemtabad-Kaliaganj region, and is fairly high through Goalpokhar-1, Karandighi,
Raiganj and Itahar. In Chopra and Goalpokhar-2, on the other hand, the rural concentration of Muslims is
relatively low.
The concentration of other social communities is highly uneven in the district, with Raiganj, Itahar and
Karandighi accounting for the bulk of the general caste population, while its presence in Goalpokhar-1,
Goalpokhar-2 and Hemtabad blocks is particularly low. The social composition of block populations has
an important role in determining the levels of human development in each Uttar Dinajpur block, as is
evident in the literacy differentials between communities and regions. Because of the large presence of
weaker social groups in the Islampur SD blocks, literacy attainments there are more uneven than among
the Raiganj SD blocks. In general, literacy levels in Uttar Dinajpur varying directly with the proportionate
concentration of general castes in the block population, and inversely with the proportionate concentration
of Muslims. While separate figures for blockwise literacy among the Muslim community from census
sources, strong literacy differentials are observed to exist between the SC and ST residents of Uttar Dinajpur,
with female literacy levels in particular being extremely low among the ST communities.
Table : Differentials between SC, ST & Total Literacy Rates in Uttar Dinajpur, 2001
% LITERACY RATES
2001 2001 2001 Total Total Total SC ST Total SC ST
CD Block Population Total SCs Total STs Total SC ST Males Males Males Females Females Females
Chopra 223022 41315 15825 43.3 52.7 28.9 55.9 68.1 41.2 29.7 36.3 16.2
Islampur 241951 42589 5833 38.4 54.8 27.4 50.3 69.0 40.5 25.7 39.4 13.8
Goalpokhar-1 245430 35137 9273 31.6 50.7 17.9 42.6 63.7 27.5 19.8 36.7 8.3
Goalpokhar-2 226472 52449 14086 34.1 44.8 26.1 44.0 55.5 34.5 23.5 33.4 17.2
Karandighi 318881 97802 23398 37.6 44.1 23.1 48.9 58.7 33.1 25.5 28.7 13.1
Raiganj 362056 138964 21149 51.5 49.6 35.3 63.0 63.3 46.6 39.1 34.9 23.9
Hemtabad 118822 41056 4523 56.7 51.4 28.7 67.1 65.2 39.4 45.7 36.9 17.8
Kaliaganj 190019 114922 8656 54.1 48.6 38.7 66.4 62.9 50.2 41.1 33.6 27.1
Itahar 249541 66659 19593 47.4 45.2 26.1 57.8 59.3 38.0 36.5 30.4 14.1
Uttar Dinajpur DT 2441794 676582 124865 47.9 50.1 28.7 58.5 63.5 39.5 36.5 35.7 17.6

Uttar Dinajpur
29
2001 %LITERACY RATES
Rural 2001 2001 Rural Rural Rural Rural SCRural ST Rural Rural SC Rural ST
CD Block Population Rural SCs Rural STs Rural SC ST Males Males Males Females Females Females
Chopra 223022 41315 15825 43.3 52.7 28.9 55.9 68.1 41.2 29.7 36.3 16.2
Islampur 241951 42589 5833 38.4 54.8 27.4 50.3 69.0 40.5 25.7 39.4 13.8
Goalpokhar-1 245430 35137 9273 31.6 50.7 17.9 42.6 63.7 27.5 19.8 36.7 8.3
Goalpokhar-2 226472 52449 14086 34.1 44.8 26.1 44.0 55.5 34.5 23.5 33.4 17.2
Karandighi 304986 94610 23335 36.0 43.7 23.0 47.4 58.4 33.0 23.9 28.0 13.0
Raiganj 347108 134912 20986 50.3 49.2 34.8 62.0 63.0 46.2 37.7 34.4 23.3
Hemtabad 118822 41056 4523 56.7 51.4 28.7 67.1 65.2 39.4 45.7 36.9 17.8
Kaliaganj 190019 114922 8656 54.1 48.6 38.7 66.4 62.9 50.2 41.1 33.6 27.1
Itahar 249541 66659 19593 47.4 45.2 26.1 57.8 59.3 38.0 36.5 30.4 14.1
Uttar Dinajpur DT 2147351 623649 122110 42.9 48.3 27.8 54.2 62.2 38.7 30.8 33.5 16.7
Source: Census 2001
Although a small section among the occupational SC groups who had migrated into Uttar Dinajpur from
East Bengal now live in urban areas like Raiganj and Kaliaganj, the ST and Muslim residents of the district
still live by and large in rural areas. Hence the low rural literacy attainments in Uttar Dinajpur are strongly
influenced by the extent of concentration of these two social groups within the block population, as visible
in the accompanying chart. Literacy rates in most Islampur SD blocks thus tend to lag behind the literacy
attainments of most Raiganj SD blocks mainly because the concentration of Muslims in the block population
is high, while the concentration of general castes and SC groups in thee blocks is low. Between the three
underprivileged groups, the rural Muslims who generally share the same .livelihoods as the rural SCs lag
behind them in terms of development attainments. The worst placed of the three social groups are the ST
communities of Uttar Dinajpur, among whom current female literacy attainments still amount to much
below half the literacy levels attained by the other communities.
Development Administration in Uttar Dinajpur
Uttar Dinajpur has 9 second-tier block panchayats or Panchayat Samitis corresponding to its nine CD
blocks, while the structure for local self governance in the 1477 inhabited villages is provided by the 98
0
10
20
30
40
50
60
70
0
50
100
150
200
250
300
350
400
Chop
ra
Isla
mpu
r
Goa
lpok
har-
1
Goa
lpok
har-
2
Kara
ndig
hi
Raig
anj
Hem
taba
d
Kalia
ganj
Itah
ar
Po
pu
lati
on in
th
ousa
nds
General
ST
SC
Muslim
% Literacy
UTTAR DINAJPURPopulation Composition & Rural Literacy 2001 % Literacy
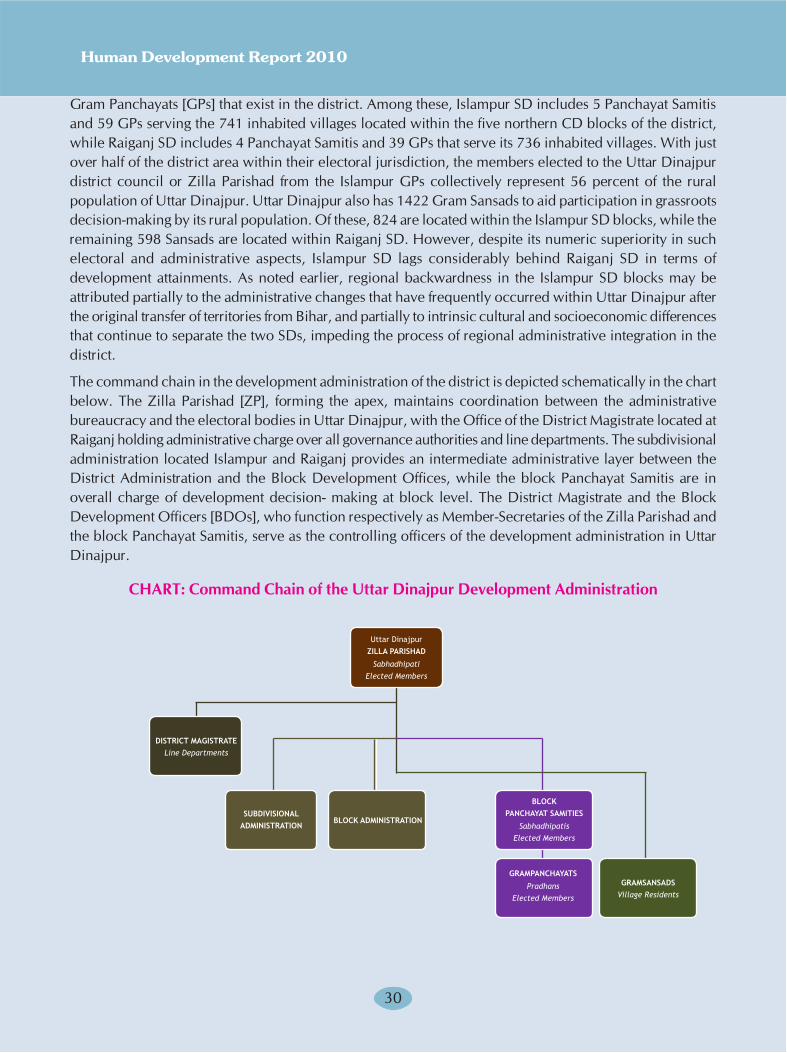
Human Development Report 2010
30
Gram Panchayats [GPs] that exist in the district. Among these, Islampur SD includes 5 Panchayat Samitis
and 59 GPs serving the 741 inhabited villages located within the five northern CD blocks of the district,
while Raiganj SD includes 4 Panchayat Samitis and 39 GPs that serve its 736 inhabited villages. With just
over half of the district area within their electoral jurisdiction, the members elected to the Uttar Dinajpur
district council or Zilla Parishad from the Islampur GPs collectively represent 56 percent of the rural
population of Uttar Dinajpur. Uttar Dinajpur also has 1422 Gram Sansads to aid participation in grassroots
decision-making by its rural population. Of these, 824 are located within the Islampur SD blocks, while the
remaining 598 Sansads are located within Raiganj SD. However, despite its numeric superiority in such
electoral and administrative aspects, Islampur SD lags considerably behind Raiganj SD in terms of
development attainments. As noted earlier, regional backwardness in the Islampur SD blocks may be
attributed partially to the administrative changes that have frequently occurred within Uttar Dinajpur after
the original transfer of territories from Bihar, and partially to intrinsic cultural and socioeconomic differences
that continue to separate the two SDs, impeding the process of regional administrative integration in the
district.
The command chain in the development administration of the district is depicted schematically in the chart
below. The Zilla Parishad [ZP], forming the apex, maintains coordination between the administrative
bureaucracy and the electoral bodies in Uttar Dinajpur, with the Office of the District Magistrate located at
Raiganj holding administrative charge over all governance authorities and line departments. The subdivisional
administration located Islampur and Raiganj provides an intermediate administrative layer between the
District Administration and the Block Development Offices, while the block Panchayat Samitis are in
overall charge of development decision- making at block level. The District Magistrate and the Block
Development Officers [BDOs], who function respectively as Member-Secretaries of the Zilla Parishad and
the block Panchayat Samitis, serve as the controlling officers of the development administration in Uttar
Dinajpur.
CHART: Command Chain of the Uttar Dinajpur Development Administration
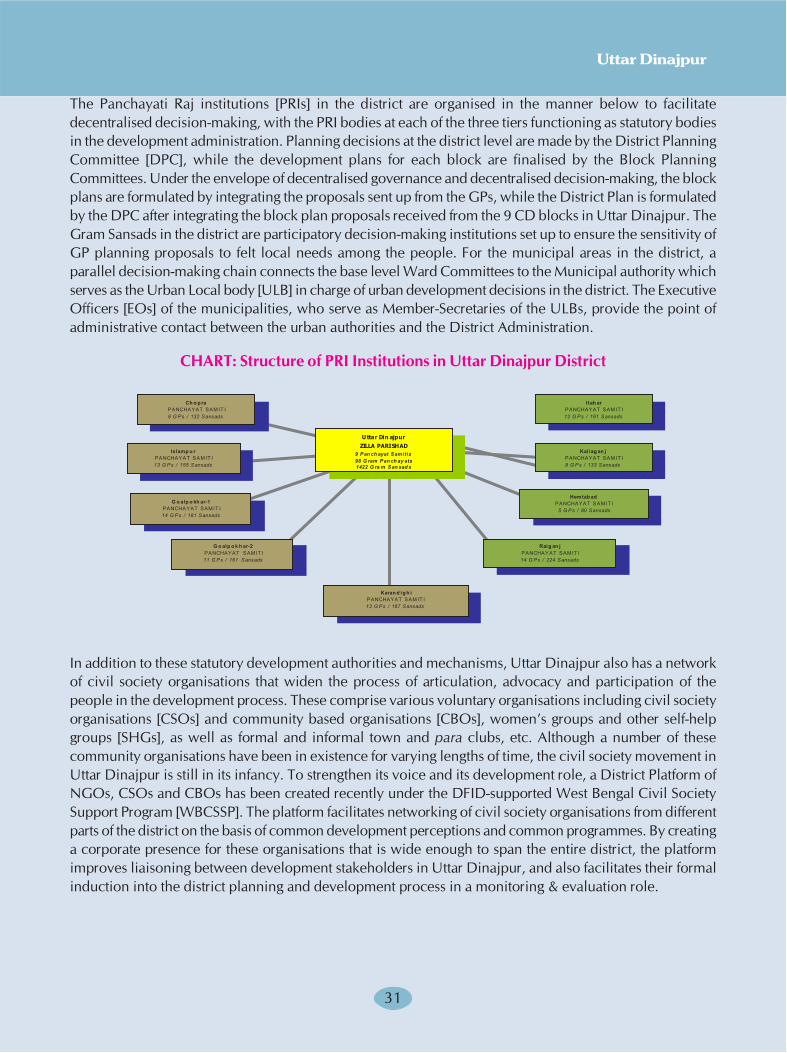
Uttar Dinajpur
31
The Panchayati Raj institutions [PRIs] in the district are organised in the manner below to facilitate
decentralised decision-making, with the PRI bodies at each of the three tiers functioning as statutory bodies
in the development administration. Planning decisions at the district level are made by the District Planning
Committee [DPC], while the development plans for each block are finalised by the Block Planning
Committees. Under the envelope of decentralised governance and decentralised decision-making, the block
plans are formulated by integrating the proposals sent up from the GPs, while the District Plan is formulated
by the DPC after integrating the block plan proposals received from the 9 CD blocks in Uttar Dinajpur. The
Gram Sansads in the district are participatory decision-making institutions set up to ensure the sensitivity of
GP planning proposals to felt local needs among the people. For the municipal areas in the district, a
parallel decision-making chain connects the base level Ward Committees to the Municipal authority which
serves as the Urban Local body [ULB] in charge of urban development decisions in the district. The Executive
Officers [EOs] of the municipalities, who serve as Member-Secretaries of the ULBs, provide the point of
administrative contact between the urban authorities and the District Administration.
CHART: Structure of PRI Institutions in Uttar Dinajpur District
In addition to these statutory development authorities and mechanisms, Uttar Dinajpur also has a network
of civil society organisations that widen the process of articulation, advocacy and participation of the
people in the development process. These comprise various voluntary organisations including civil society
organisations [CSOs] and community based organisations [CBOs], women’s groups and other self-help
groups [SHGs], as well as formal and informal town and para clubs, etc. Although a number of these
community organisations have been in existence for varying lengths of time, the civil society movement in
Uttar Dinajpur is still in its infancy. To strengthen its voice and its development role, a District Platform of
NGOs, CSOs and CBOs has been created recently under the DFID-supported West Bengal Civil Society
Support Program [WBCSSP]. The platform facilitates networking of civil society organisations from different
parts of the district on the basis of common development perceptions and common programmes. By creating
a corporate presence for these organisations that is wide enough to span the entire district, the platform
improves liaisoning between development stakeholders in Uttar Dinajpur, and also facilitates their formal
induction into the district planning and development process in a monitoring & evaluation role.
���� ���
�������� ������ ��
� ���� ������������ �
���� ��
�������� ������ ��
��� ��� � ������������ �
� ���� � �� �����
�������� ������ ��
��� ��� � ����������� �
� ���� � � � �����
�������� ������ ��
��� ��� � ���� �������� �
������ ��� ��
�������� ������ ��
��� ���� ���������� �
���� �� ��
�������� ������ ��
��� ��� � ������������ �
�������� �
�������� ������ ��
�� ���� ���������� �
��� ��� �� � �
�������� ������ ��
� ���� ������������ �
��� ���
�������� ������ ��
��� ��� � ������������ �
�������� �����
������������� �
����� �� ������ � �
���� ������� �� � �� �
������ �� ����� ��� � �
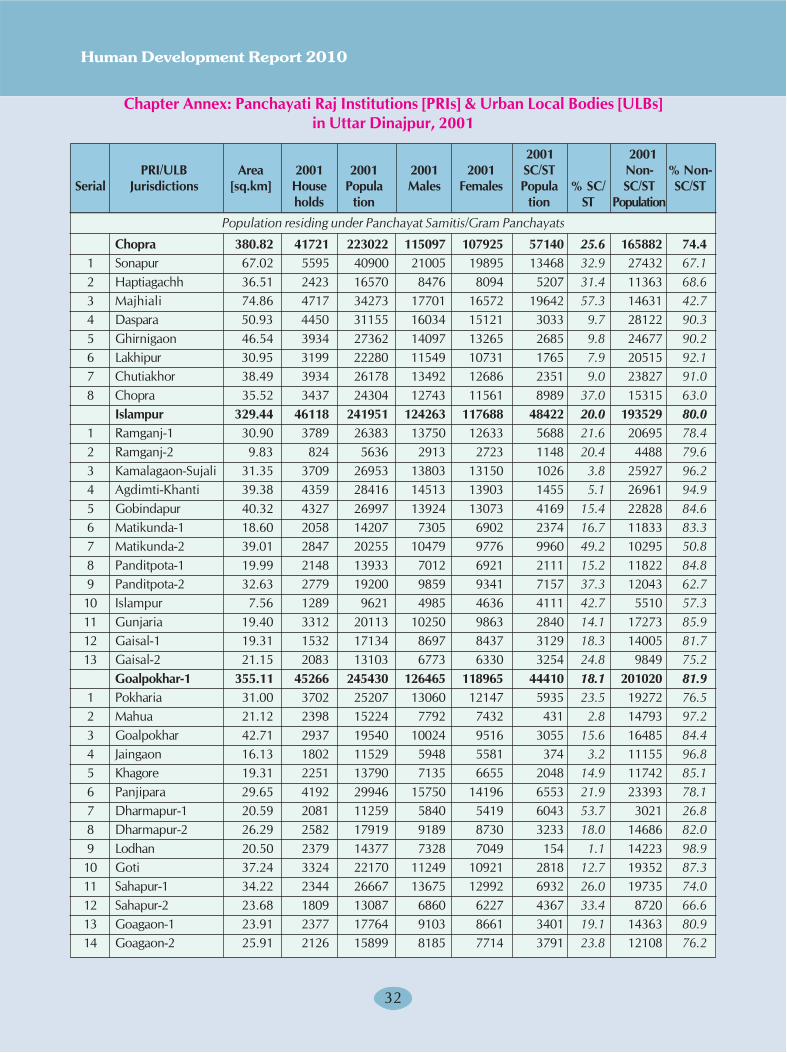
Human Development Report 2010
32
Chapter Annex: Panchayati Raj Institutions [PRIs] & Urban Local Bodies [ULBs]
in Uttar Dinajpur, 2001
2001 2001
PRI/ULB Area 2001 2001 2001 2001 SC/ST Non- % Non-
Serial Jurisdictions [sq.km] House Popula Males Females Popula % SC/ SC/ST SC/ST
holds tion tion ST Population
Population residing under Panchayat Samitis/Gram Panchayats
Chopra 380.82 41721 223022 115097 107925 57140 25.6 165882 74.4
1 Sonapur 67.02 5595 40900 21005 19895 13468 32.9 27432 67.1
2 Haptiagachh 36.51 2423 16570 8476 8094 5207 31.4 11363 68.6
3 Majhiali 74.86 4717 34273 17701 16572 19642 57.3 14631 42.7
4 Daspara 50.93 4450 31155 16034 15121 3033 9.7 28122 90.3
5 Ghirnigaon 46.54 3934 27362 14097 13265 2685 9.8 24677 90.2
6 Lakhipur 30.95 3199 22280 11549 10731 1765 7.9 20515 92.1
7 Chutiakhor 38.49 3934 26178 13492 12686 2351 9.0 23827 91.0
8 Chopra 35.52 3437 24304 12743 11561 8989 37.0 15315 63.0
Islampur 329.44 46118 241951 124263 117688 48422 20.0 193529 80.0
1 Ramganj-1 30.90 3789 26383 13750 12633 5688 21.6 20695 78.4
2 Ramganj-2 9.83 824 5636 2913 2723 1148 20.4 4488 79.6
3 Kamalagaon-Sujali 31.35 3709 26953 13803 13150 1026 3.8 25927 96.2
4 Agdimti-Khanti 39.38 4359 28416 14513 13903 1455 5.1 26961 94.9
5 Gobindapur 40.32 4327 26997 13924 13073 4169 15.4 22828 84.6
6 Matikunda-1 18.60 2058 14207 7305 6902 2374 16.7 11833 83.3
7 Matikunda-2 39.01 2847 20255 10479 9776 9960 49.2 10295 50.8
8 Panditpota-1 19.99 2148 13933 7012 6921 2111 15.2 11822 84.8
9 Panditpota-2 32.63 2779 19200 9859 9341 7157 37.3 12043 62.7
10 Islampur 7.56 1289 9621 4985 4636 4111 42.7 5510 57.3
11 Gunjaria 19.40 3312 20113 10250 9863 2840 14.1 17273 85.9
12 Gaisal-1 19.31 1532 17134 8697 8437 3129 18.3 14005 81.7
13 Gaisal-2 21.15 2083 13103 6773 6330 3254 24.8 9849 75.2
Goalpokhar-1 355.11 45266 245430 126465 118965 44410 18.1 201020 81.9
1 Pokharia 31.00 3702 25207 13060 12147 5935 23.5 19272 76.5
2 Mahua 21.12 2398 15224 7792 7432 431 2.8 14793 97.2
3 Goalpokhar 42.71 2937 19540 10024 9516 3055 15.6 16485 84.4
4 Jaingaon 16.13 1802 11529 5948 5581 374 3.2 11155 96.8
5 Khagore 19.31 2251 13790 7135 6655 2048 14.9 11742 85.1
6 Panjipara 29.65 4192 29946 15750 14196 6553 21.9 23393 78.1
7 Dharmapur-1 20.59 2081 11259 5840 5419 6043 53.7 3021 26.8
8 Dharmapur-2 26.29 2582 17919 9189 8730 3233 18.0 14686 82.0
9 Lodhan 20.50 2379 14377 7328 7049 154 1.1 14223 98.9
10 Goti 37.24 3324 22170 11249 10921 2818 12.7 19352 87.3
11 Sahapur-1 34.22 2344 26667 13675 12992 6932 26.0 19735 74.0
12 Sahapur-2 23.68 1809 13087 6860 6227 4367 33.4 8720 66.6
13 Goagaon-1 23.91 2377 17764 9103 8661 3401 19.1 14363 80.9
14 Goagaon-2 25.91 2126 15899 8185 7714 3791 23.8 12108 76.2

Uttar Dinajpur
33
2001 2001
PRI/ULB Area 2001 2001 2001 2001 SC/ST Non- % Non-
Serial Jurisdictions [sq.km] House Popula Males Females Popula % SC/ SC/ST SC/ST
holds tion tion ST Population
Goalpokhar-2 298.69 40849 226472 116758 109714 66535 29.4 159937 70.6
1 Belan 38.81 3912 20947 10853 10094 6043 28.8 14904 71.2
2 Sahapur-1 13.14 1532 7699 3970 3729 967 12.6 6732 87.4
3 Sahapur-2 22.64 2194 15838 8137 7701 2555 16.1 13283 83.9
4 Bidyanandapur 37.86 3189 21199 10877 10322 7191 33.9 14008 66.1
5 Torial 32.00 2976 19970 10323 9647 7840 39.3 12130 60.7
6 Chakulia 35.07 3918 28797 14952 13845 5565 19.3 23232 80.7
7 Nizampur-1 21.32 2382 15847 8138 7709 4517 28.5 11330 71.5
8 Nizampur-2 21.46 2169 16671 8598 8073 5737 34.4 10934 65.6
9 Kanki 25.43 3654 24782 12852 11930 8690 35.1 16092 64.9
10 Surjapur-1 11.74 2231 13194 6734 6460 3622 27.5 9572 72.5
11 Surjapur-2 29.76 3303 23175 11844 11331 9725 42.0 13450 58.0
Karandighi 388.4 54440 304986 156430 148556 117945 38.7 187041 61.3
1 Dalkola-1 16.48 1804 15378 7865 7513 7874 51.2 7504 48.8
2 Raniganj 34.68 3634 27574 14085 13489 11241 40.8 16333 59.2
3 Bazargaon-1 27.96 2380 18199 9313 8886 6046 33.2 12153 66.8
4 Bazargaon-2 24.23 1962 13492 6812 6680 6139 45.5 7353 54.5
5 Domohana 40.07 4928 36584 18603 17981 12372 33.8 24212 66.2
6 Rasakhawa-1 26.50 2883 21279 10943 10336 5000 23.5 16279 76.5
7 Rasakhawa-2 45.51 3930 27832 14374 13458 11486 41.3 16346 58.7
8 Karandighi-1 23.49 2656 19130 9807 9323 9026 47.2 10104 52.8
9 Karandighi-2 29.93 3103 25375 13149 12226 11614 45.8 13761 54.2
10 Lahutara-1 23.63 2604 18327 9293 9034 5690 31.0 12637 69.0
11 Lahutara-2 28.49 2766 20769 10768 10001 10480 50.5 10289 49.5
12 Altapur-1 25.45 3146 25114 12925 12189 10306 41.0 14808 59.0
13 Altapur-2 22.39 2184 18609 9522 9087 3989 21.4 14620 78.6
Raiganj 466.19 67986 347108 178919 168189 155898 44.9 191210 55.1
1 Bhatun 43.23 3501 25614 13328 12286 7433 29.0 18181 71.0
2 Mahipur 39.32 3594 22559 11568 10991 11592 51.4 10967 48.6
3 Bindol 38.23 3556 21208 10817 10391 9020 42.5 12188 57.5
4 Sherpur 40.43 3538 23384 12184 11200 13579 58.1 9805 41.9
5 Rampur 37.02 3291 23699 12220 11479 12236 51.6 11463 48.4
6 Jagdishpur 37.33 3641 25882 13312 12570 12140 46.9 13742 53.1
7 Sitgram 35.27 3584 25837 13182 12655 8430 32.6 17407 67.4
8 Kamlabari-1 17.01 3345 24594 12712 11882 9878 40.2 14716 59.8
9 Kamlabari-2 18.36 1975 16160 8298 7862 9081 56.2 7079 43.8
10 Barua 38.03 4752 34977 17959 17018 16390 46.9 18587 53.1
11 Maraikura 11.99 2725 18905 9851 9054 7183 38.0 11722 62.0
12 Gouri 32.43 3511 26199 13430 12769 8490 32.4 17709 67.6
13 Bahin 36.24 4435 32471 16688 15783 12080 37.2 20391 62.8
14 Birghai 41.32 4403 30732 16054 14678 19216 62.5 11516 37.5
Contd.
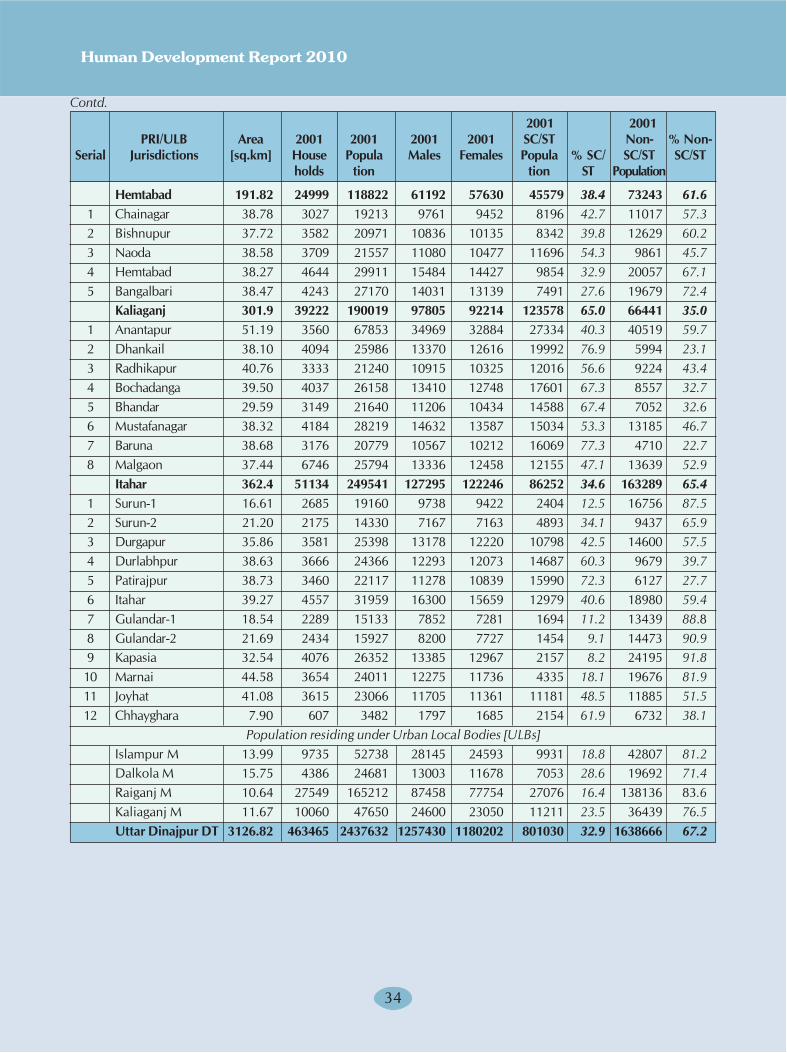
Human Development Report 2010
34
Hemtabad 191.82 24999 118822 61192 57630 45579 38.4 73243 61.6
1 Chainagar 38.78 3027 19213 9761 9452 8196 42.7 11017 57.3
2 Bishnupur 37.72 3582 20971 10836 10135 8342 39.8 12629 60.2
3 Naoda 38.58 3709 21557 11080 10477 11696 54.3 9861 45.7
4 Hemtabad 38.27 4644 29911 15484 14427 9854 32.9 20057 67.1
5 Bangalbari 38.47 4243 27170 14031 13139 7491 27.6 19679 72.4
Kaliaganj 301.9 39222 190019 97805 92214 123578 65.0 66441 35.0
1 Anantapur 51.19 3560 67853 34969 32884 27334 40.3 40519 59.7
2 Dhankail 38.10 4094 25986 13370 12616 19992 76.9 5994 23.1
3 Radhikapur 40.76 3333 21240 10915 10325 12016 56.6 9224 43.4
4 Bochadanga 39.50 4037 26158 13410 12748 17601 67.3 8557 32.7
5 Bhandar 29.59 3149 21640 11206 10434 14588 67.4 7052 32.6
6 Mustafanagar 38.32 4184 28219 14632 13587 15034 53.3 13185 46.7
7 Baruna 38.68 3176 20779 10567 10212 16069 77.3 4710 22.7
8 Malgaon 37.44 6746 25794 13336 12458 12155 47.1 13639 52.9
Itahar 362.4 51134 249541 127295 122246 86252 34.6 163289 65.4
1 Surun-1 16.61 2685 19160 9738 9422 2404 12.5 16756 87.5
2 Surun-2 21.20 2175 14330 7167 7163 4893 34.1 9437 65.9
3 Durgapur 35.86 3581 25398 13178 12220 10798 42.5 14600 57.5
4 Durlabhpur 38.63 3666 24366 12293 12073 14687 60.3 9679 39.7
5 Patirajpur 38.73 3460 22117 11278 10839 15990 72.3 6127 27.7
6 Itahar 39.27 4557 31959 16300 15659 12979 40.6 18980 59.4
7 Gulandar-1 18.54 2289 15133 7852 7281 1694 11.2 13439 88.8
8 Gulandar-2 21.69 2434 15927 8200 7727 1454 9.1 14473 90.9
9 Kapasia 32.54 4076 26352 13385 12967 2157 8.2 24195 91.8
10 Marnai 44.58 3654 24011 12275 11736 4335 18.1 19676 81.9
11 Joyhat 41.08 3615 23066 11705 11361 11181 48.5 11885 51.5
12 Chhayghara 7.90 607 3482 1797 1685 2154 61.9 6732 38.1
Population residing under Urban Local Bodies [ULBs]
Islampur M 13.99 9735 52738 28145 24593 9931 18.8 42807 81.2
Dalkola M 15.75 4386 24681 13003 11678 7053 28.6 19692 71.4
Raiganj M 10.64 27549 165212 87458 77754 27076 16.4 138136 83.6
Kaliaganj M 11.67 10060 47650 24600 23050 11211 23.5 36439 76.5
Uttar Dinajpur DT 3126.82 463465 2437632 1257430 1180202 801030 32.9 1638666 67.2
2001 2001
PRI/ULB Area 2001 2001 2001 2001 SC/ST Non- % Non-
Serial Jurisdictions [sq.km] House Popula Males Females Popula % SC/ SC/ST SC/ST
holds tion tion ST Population
Contd.
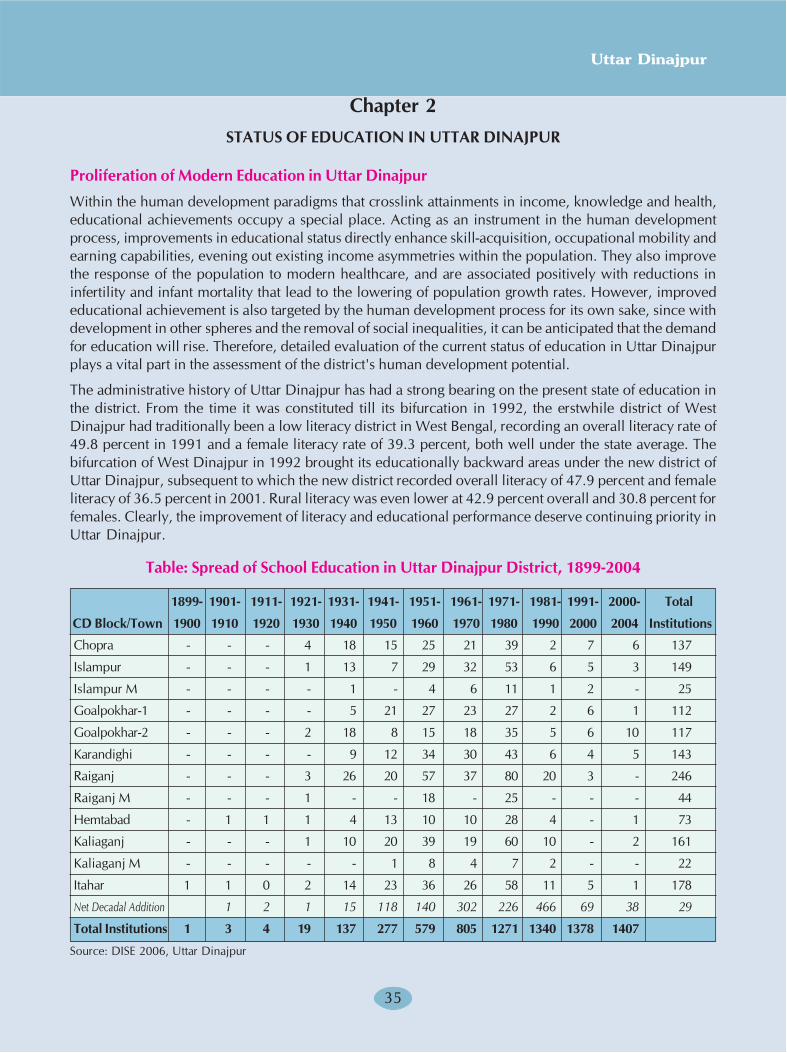
3535
Uttar Dinajpur
Chapter 2
STATUS OF EDUCATION IN UTTAR DINAJPUR
Proliferation of Modern Education in Uttar Dinajpur
Within the human development paradigms that crosslink attainments in income, knowledge and health,
educational achievements occupy a special place. Acting as an instrument in the human development
process, improvements in educational status directly enhance skill-acquisition, occupational mobility and
earning capabilities, evening out existing income asymmetries within the population. They also improve
the response of the population to modern healthcare, and are associated positively with reductions in
infertility and infant mortality that lead to the lowering of population growth rates. However, improved
educational achievement is also targeted by the human development process for its own sake, since with
development in other spheres and the removal of social inequalities, it can be anticipated that the demand
for education will rise. Therefore, detailed evaluation of the current status of education in Uttar Dinajpur
plays a vital part in the assessment of the district's human development potential.
The administrative history of Uttar Dinajpur has had a strong bearing on the present state of education in
the district. From the time it was constituted till its bifurcation in 1992, the erstwhile district of West
Dinajpur had traditionally been a low literacy district in West Bengal, recording an overall literacy rate of
49.8 percent in 1991 and a female literacy rate of 39.3 percent, both well under the state average. The
bifurcation of West Dinajpur in 1992 brought its educationally backward areas under the new district of
Uttar Dinajpur, subsequent to which the new district recorded overall literacy of 47.9 percent and female
literacy of 36.5 percent in 2001. Rural literacy was even lower at 42.9 percent overall and 30.8 percent for
females. Clearly, the improvement of literacy and educational performance deserve continuing priority in
Uttar Dinajpur.
Table: Spread of School Education in Uttar Dinajpur District, 1899-2004
1899- 1901- 1911- 1921- 1931- 1941- 1951- 1961- 1971- 1981- 1991- 2000- Total
CD Block/Town 1900 1910 1920 1930 1940 1950 1960 1970 1980 1990 2000 2004 Institutions
Chopra - - - 4 18 15 25 21 39 2 7 6 137
Islampur - - - 1 13 7 29 32 53 6 5 3 149
Islampur M - - - - 1 - 4 6 11 1 2 - 25
Goalpokhar-1 - - - - 5 21 27 23 27 2 6 1 112
Goalpokhar-2 - - - 2 18 8 15 18 35 5 6 10 117
Karandighi - - - - 9 12 34 30 43 6 4 5 143
Raiganj - - - 3 26 20 57 37 80 20 3 - 246
Raiganj M - - - 1 - - 18 - 25 - - - 44
Hemtabad - 1 1 1 4 13 10 10 28 4 - 1 73
Kaliaganj - - - 1 10 20 39 19 60 10 - 2 161
Kaliaganj M - - - - - 1 8 4 7 2 - - 22
Itahar 1 1 0 2 14 23 36 26 58 11 5 1 178
Net Decadal Addition 1 2 1 15 118 140 302 226 466 69 38 29
Total Institutions 1 3 4 19 137 277 579 805 1271 1340 1378 1407
Source: DISE 2006, Uttar Dinajpur
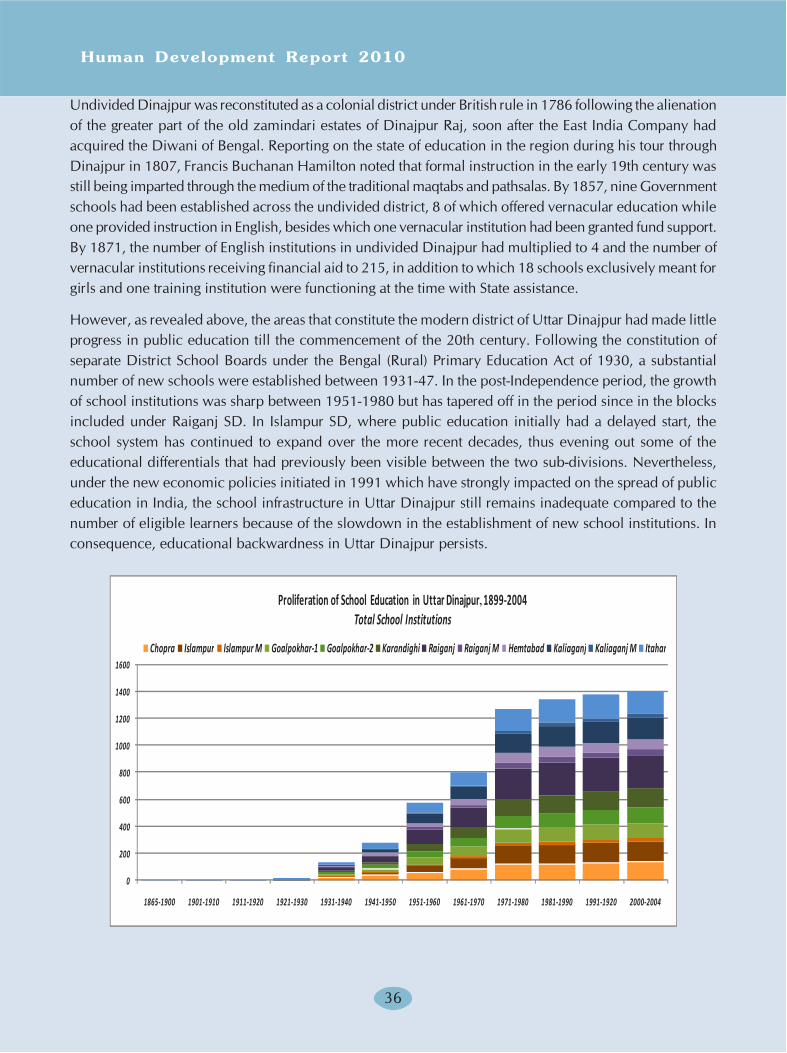
Human Development Report 2010
36
Undivided Dinajpur was reconstituted as a colonial district under British rule in 1786 following the alienation
of the greater part of the old zamindari estates of Dinajpur Raj, soon after the East India Company had
acquired the Diwani of Bengal. Reporting on the state of education in the region during his tour through
Dinajpur in 1807, Francis Buchanan Hamilton noted that formal instruction in the early 19th century was
still being imparted through the medium of the traditional maqtabs and pathsalas. By 1857, nine Government
schools had been established across the undivided district, 8 of which offered vernacular education while
one provided instruction in English, besides which one vernacular institution had been granted fund support.
By 1871, the number of English institutions in undivided Dinajpur had multiplied to 4 and the number of
vernacular institutions receiving financial aid to 215, in addition to which 18 schools exclusively meant for
girls and one training institution were functioning at the time with State assistance.
However, as revealed above, the areas that constitute the modern district of Uttar Dinajpur had made little
progress in public education till the commencement of the 20th century. Following the constitution of
separate District School Boards under the Bengal (Rural) Primary Education Act of 1930, a substantial
number of new schools were established between 1931-47. In the post-Independence period, the growth
of school institutions was sharp between 1951-1980 but has tapered off in the period since in the blocks
included under Raiganj SD. In Islampur SD, where public education initially had a delayed start, the
school system has continued to expand over the more recent decades, thus evening out some of the
educational differentials that had previously been visible between the two sub-divisions. Nevertheless,
under the new economic policies initiated in 1991 which have strongly impacted on the spread of public
education in India, the school infrastructure in Uttar Dinajpur still remains inadequate compared to the
number of eligible learners because of the slowdown in the establishment of new school institutions. In
consequence, educational backwardness in Uttar Dinajpur persists.
0
200
400
600
800
1000
1200
1400
1600
1865-1900 1901-1910 1911-1920 1921-1930 1931-1940 1941-1950 1951-1960 1961-1970 1971-1980 1981-1990 1991-1920 2000-2004
Chopra Islampur Islampur M Goalpokhar-1 Goalpokhar-2 Karandighi Raiganj Raiganj M Hemtabad Kaliaganj Kaliaganj M Itahar
Proliferation of School Education in Uttar Dinajpur 1899-2004Total School Institutions
,
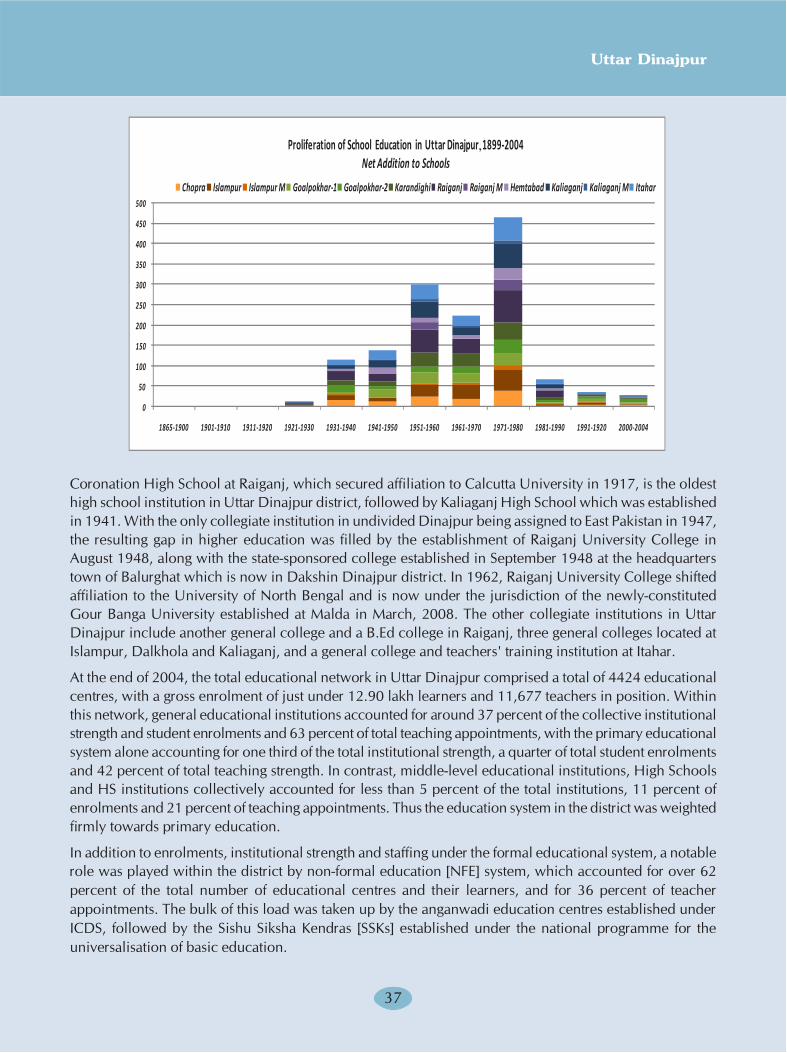
3737
Uttar Dinajpur
Coronation High School at Raiganj, which secured affiliation to Calcutta University in 1917, is the oldest
high school institution in Uttar Dinajpur district, followed by Kaliaganj High School which was established
in 1941. With the only collegiate institution in undivided Dinajpur being assigned to East Pakistan in 1947,
the resulting gap in higher education was filled by the establishment of Raiganj University College in
August 1948, along with the state-sponsored college established in September 1948 at the headquarters
town of Balurghat which is now in Dakshin Dinajpur district. In 1962, Raiganj University College shifted
affiliation to the University of North Bengal and is now under the jurisdiction of the newly-constituted
Gour Banga University established at Malda in March, 2008. The other collegiate institutions in Uttar
Dinajpur include another general college and a B.Ed college in Raiganj, three general colleges located at
Islampur, Dalkhola and Kaliaganj, and a general college and teachers' training institution at Itahar.
At the end of 2004, the total educational network in Uttar Dinajpur comprised a total of 4424 educational
centres, with a gross enrolment of just under 12.90 lakh learners and 11,677 teachers in position. Within
this network, general educational institutions accounted for around 37 percent of the collective institutional
strength and student enrolments and 63 percent of total teaching appointments, with the primary educational
system alone accounting for one third of the total institutional strength, a quarter of total student enrolments
and 42 percent of total teaching strength. In contrast, middle-level educational institutions, High Schools
and HS institutions collectively accounted for less than 5 percent of the total institutions, 11 percent of
enrolments and 21 percent of teaching appointments. Thus the education system in the district was weighted
firmly towards primary education.
In addition to enrolments, institutional strength and staffing under the formal educational system, a notable
role was played within the district by non-formal education [NFE] system, which accounted for over 62
percent of the total number of educational centres and their learners, and for 36 percent of teacher
appointments. The bulk of this load was taken up by the anganwadi education centres established under
ICDS, followed by the Sishu Siksha Kendras [SSKs] established under the national programme for the
universalisation of basic education.
0
50
100
150
200
250
300
350
400
450
500
1865-1900 1901-1910 1911-1920 1921-1930 1931-1940 1941-1950 1951-1960 1961-1970 1971-1980 1981-1990 1991-1920 2000-2004
Chopra Islampur Islampur M Goalpokhar-1 Goalpokhar-2 Karandighi Raiganj Raiganj M Hemtabad Kaliaganj Kaliaganj M Itahar
Proliferation of School Education in Uttar Dinajpur 1899-2004Net Addition to Schools
,
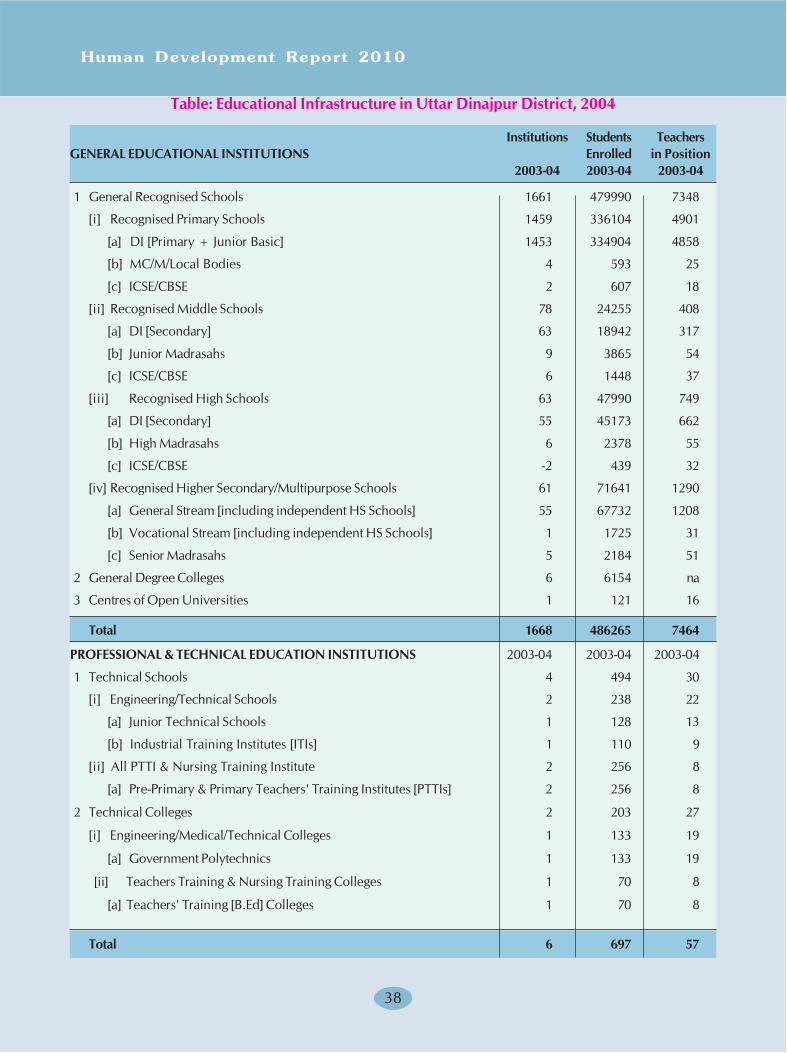
Human Development Report 2010
38
Table: Educational Infrastructure in Uttar Dinajpur District, 2004
Institutions Students Teachers
GENERAL EDUCATIONAL INSTITUTIONS Enrolled in Position
2003-04 2003-04 2003-04
1 General Recognised Schools 1661 479990 7348
[i] Recognised Primary Schools 1459 336104 4901
[a] DI [Primary + Junior Basic] 1453 334904 4858
[b] MC/M/Local Bodies 4 593 25
[c] ICSE/CBSE 2 607 18
[ii] Recognised Middle Schools 78 24255 408
[a] DI [Secondary] 63 18942 317
[b] Junior Madrasahs 9 3865 54
[c] ICSE/CBSE 6 1448 37
[iii] Recognised High Schools 63 47990 749
[a] DI [Secondary] 55 45173 662
[b] High Madrasahs 6 2378 55
[c] ICSE/CBSE -2 439 32
[iv] Recognised Higher Secondary/Multipurpose Schools 61 71641 1290
[a] General Stream [including independent HS Schools] 55 67732 1208
[b] Vocational Stream [including independent HS Schools] 1 1725 31
[c] Senior Madrasahs 5 2184 51
2 General Degree Colleges 6 6154 na
3 Centres of Open Universities 1 121 16
Total 1668 486265 7464
PROFESSIONAL & TECHNICAL EDUCATION INSTITUTIONS 2003-04 2003-04 2003-04
1 Technical Schools 4 494 30
[i] Engineering/Technical Schools 2 238 22
[a] Junior Technical Schools 1 128 13
[b] Industrial Training Institutes [ITIs] 1 110 9
[ii] All PTTI & Nursing Training Institute 2 256 8
[a] Pre-Primary & Primary Teachers' Training Institutes [PTTIs] 2 256 8
2 Technical Colleges 2 203 27
[i] Engineering/Medical/Technical Colleges 1 133 19
[a] Government Polytechnics 1 133 19
[ii] Teachers Training & Nursing Training Colleges 1 70 8
[a] Teachers' Training [B.Ed] Colleges 1 70 8
Total 6 697 57
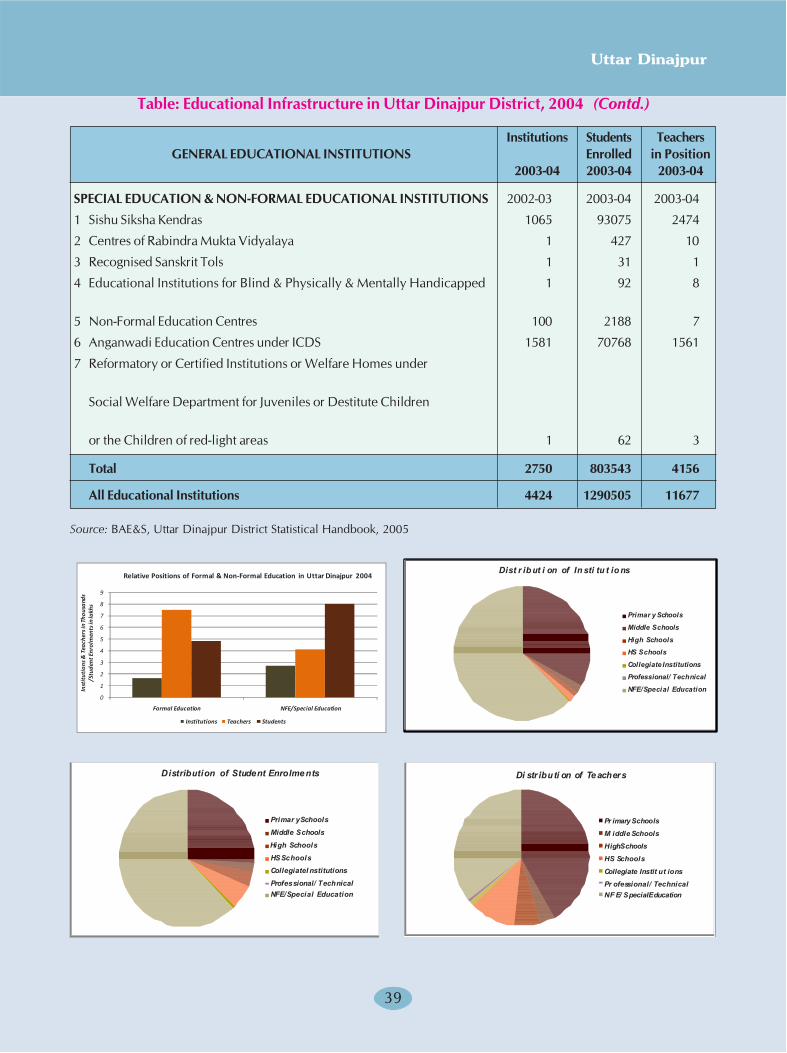
3939
Uttar Dinajpur
SPECIAL EDUCATION & NON-FORMAL EDUCATIONAL INSTITUTIONS 2002-03 2003-04 2003-04
1 Sishu Siksha Kendras 1065 93075 2474
2 Centres of Rabindra Mukta Vidyalaya 1 427 10
3 Recognised Sanskrit Tols 1 31 1
4 Educational Institutions for Blind & Physically & Mentally Handicapped 1 92 8
5 Non-Formal Education Centres 100 2188 7
6 Anganwadi Education Centres under ICDS 1581 70768 1561
7 Reformatory or Certified Institutions or Welfare Homes under
Social Welfare Department for Juveniles or Destitute Children
or the Children of red-light areas 1 62 3
Total 2750 803543 4156
All Educational Institutions 4424 1290505 11677
Source: BAE&S, Uttar Dinajpur District Statistical Handbook, 2005
Institutions Students Teachers
GENERAL EDUCATIONAL INSTITUTIONS Enrolled in Position
2003-04 2003-04 2003-04
�
���� � ���� � �� � ��� �� � ��
������ ����� �
���� ����� �
�������� �
����� �
�� �������������������
����������� � ������
�������� ���������
������������� � ���� ��������
������ � ��� ��
����� ��� ��
���� ��� ��
�� ��� ��
� ������ ! �������� ��
�� ���� ���" ��������
#$%"����� %������ �
�
�� ��� ����� �� ���������
�� ����� ���� �
� ��� ����� �
����
����� �
�� ������������� �� ����
�� ��������� � ������
���� ����
Table: Educational Infrastructure in Uttar Dinajpur District, 2004 (Contd.)
��� �
��������
�
0
1
2
3
4
5
6
7
8
9
Formal Education NFE/Special Education
Inst
itut
ions
& T
each
ers i
n Th
ousa
nds
/Stu
dent
Enr
olm
ents
in la
khs
Institutions Teachers Students
Relative Positions of Formal & Non-Formal Education in Uttar Dinajpur 2004
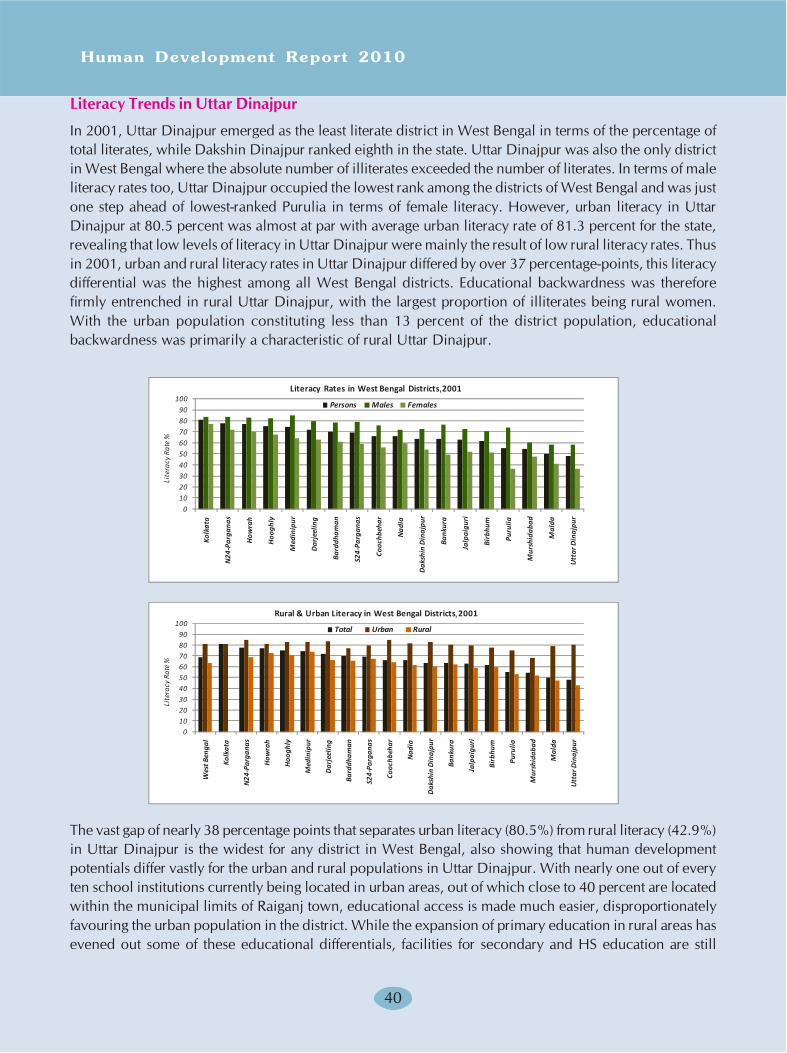
40
Literacy Trends in Uttar Dinajpur
In 2001, Uttar Dinajpur emerged as the least literate district in West Bengal in terms of the percentage of
total literates, while Dakshin Dinajpur ranked eighth in the state. Uttar Dinajpur was also the only district
in West Bengal where the absolute number of illiterates exceeded the number of literates. In terms of male
literacy rates too, Uttar Dinajpur occupied the lowest rank among the districts of West Bengal and was just
one step ahead of lowest-ranked Purulia in terms of female literacy. However, urban literacy in Uttar
Dinajpur at 80.5 percent was almost at par with average urban literacy rate of 81.3 percent for the state,
revealing that low levels of literacy in Uttar Dinajpur were mainly the result of low rural literacy rates. Thus
in 2001, urban and rural literacy rates in Uttar Dinajpur differed by over 37 percentage-points, this literacy
differential was the highest among all West Bengal districts. Educational backwardness was therefore
firmly entrenched in rural Uttar Dinajpur, with the largest proportion of illiterates being rural women.
With the urban population constituting less than 13 percent of the district population, educational
backwardness was primarily a characteristic of rural Uttar Dinajpur.
The vast gap of nearly 38 percentage points that separates urban literacy (80.5%) from rural literacy (42.9%)
in Uttar Dinajpur is the widest for any district in West Bengal, also showing that human development
potentials differ vastly for the urban and rural populations in Uttar Dinajpur. With nearly one out of every
ten school institutions currently being located in urban areas, out of which close to 40 percent are located
within the municipal limits of Raiganj town, educational access is made much easier, disproportionately
favouring the urban population in the district. While the expansion of primary education in rural areas has
evened out some of these educational differentials, facilities for secondary and HS education are still
Human Development Report 2010
0102030405060708090
100
Kolk
ata
N24
-Par
gana
s
How
rah
Hoo
ghly
Med
inip
ur
Dar
jeel
ing
Bard
dham
an
S24-
Parg
anas
Cooc
hbeh
ar
Nad
ia
Dak
shin
Din
ajpu
r
Bank
ura
Jalp
aigu
ri
Birb
hum
Puru
lia
Mur
shid
abad
Mal
da
Utt
ar D
inaj
pur
Persons Males Females
Literacy Rates in West Bengal Districts 2001
Lite
racy
Rat
e %
0102030405060708090
100
Wes
t Ben
gal
Kolk
ata
N24
-Par
gana
s
How
rah
Hoo
ghly
Med
inip
ur
Dar
jeel
ing
Bard
dham
an
S24-
Parg
anas
Cooc
hbeh
ar
Nad
ia
Dak
shin
Din
ajpu
r
Bank
ura
Jalp
aigu
ri
Birb
hum
Puru
lia
Mur
shid
abad
Mal
da
Utt
ar D
inaj
pur
Total Urban Rural
Rural & Urban Literacy in West Bengal Districts 2001
Lite
racy
Rat
e %
,
,
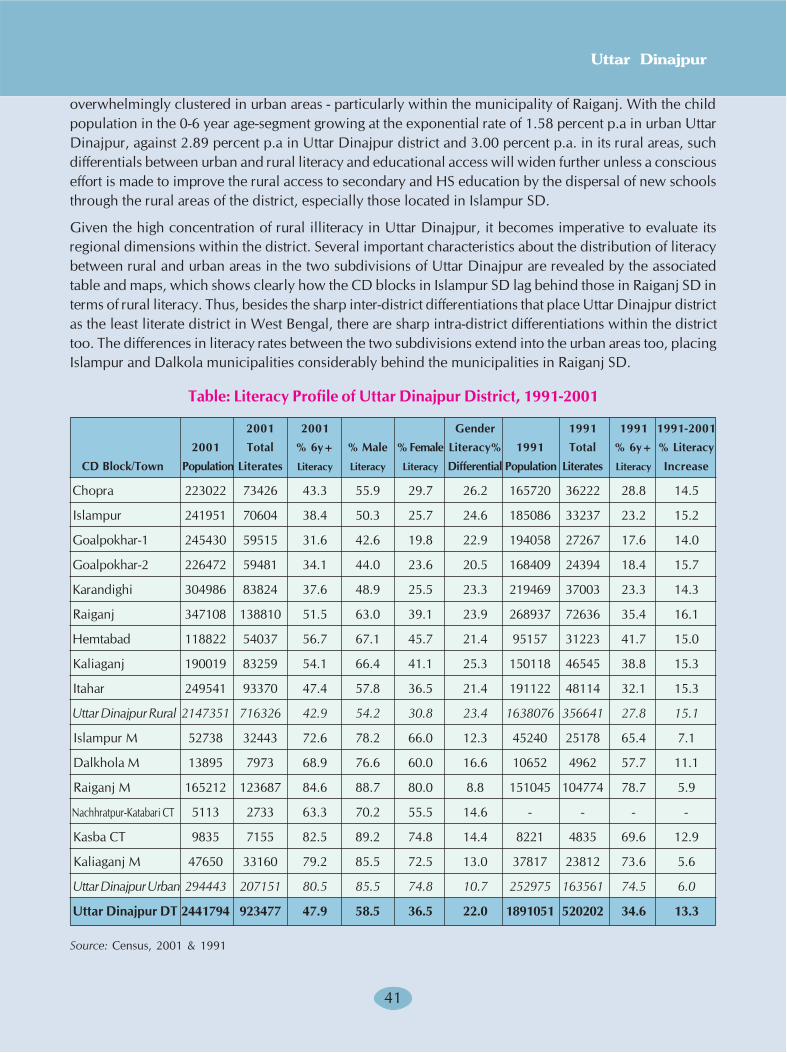
4141
Uttar Dinajpur
overwhelmingly clustered in urban areas - particularly within the municipality of Raiganj. With the child
population in the 0-6 year age-segment growing at the exponential rate of 1.58 percent p.a in urban Uttar
Dinajpur, against 2.89 percent p.a in Uttar Dinajpur district and 3.00 percent p.a. in its rural areas, such
differentials between urban and rural literacy and educational access will widen further unless a conscious
effort is made to improve the rural access to secondary and HS education by the dispersal of new schools
through the rural areas of the district, especially those located in Islampur SD.
Given the high concentration of rural illiteracy in Uttar Dinajpur, it becomes imperative to evaluate its
regional dimensions within the district. Several important characteristics about the distribution of literacy
between rural and urban areas in the two subdivisions of Uttar Dinajpur are revealed by the associated
table and maps, which shows clearly how the CD blocks in Islampur SD lag behind those in Raiganj SD in
terms of rural literacy. Thus, besides the sharp inter-district differentiations that place Uttar Dinajpur district
as the least literate district in West Bengal, there are sharp intra-district differentiations within the district
too. The differences in literacy rates between the two subdivisions extend into the urban areas too, placing
Islampur and Dalkola municipalities considerably behind the municipalities in Raiganj SD.
Table: Literacy Profile of Uttar Dinajpur District, 1991-2001
2001 2001 Gender 1991 1991 1991-2001
2001 Total % 6y+ % Male % Female Literacy% 1991 Total % 6y+ % Literacy
CD Block/Town Population Literates Literacy Literacy Literacy Differential Population Literates Literacy Increase
Chopra 223022 73426 43.3 55.9 29.7 26.2 165720 36222 28.8 14.5
Islampur 241951 70604 38.4 50.3 25.7 24.6 185086 33237 23.2 15.2
Goalpokhar-1 245430 59515 31.6 42.6 19.8 22.9 194058 27267 17.6 14.0
Goalpokhar-2 226472 59481 34.1 44.0 23.6 20.5 168409 24394 18.4 15.7
Karandighi 304986 83824 37.6 48.9 25.5 23.3 219469 37003 23.3 14.3
Raiganj 347108 138810 51.5 63.0 39.1 23.9 268937 72636 35.4 16.1
Hemtabad 118822 54037 56.7 67.1 45.7 21.4 95157 31223 41.7 15.0
Kaliaganj 190019 83259 54.1 66.4 41.1 25.3 150118 46545 38.8 15.3
Itahar 249541 93370 47.4 57.8 36.5 21.4 191122 48114 32.1 15.3
Uttar Dinajpur Rural 2147351 716326 42.9 54.2 30.8 23.4 1638076 356641 27.8 15.1
Islampur M 52738 32443 72.6 78.2 66.0 12.3 45240 25178 65.4 7.1
Dalkhola M 13895 7973 68.9 76.6 60.0 16.6 10652 4962 57.7 11.1
Raiganj M 165212 123687 84.6 88.7 80.0 8.8 151045 104774 78.7 5.9
Nachhratpur-Katabari CT 5113 2733 63.3 70.2 55.5 14.6 - - - -
Kasba CT 9835 7155 82.5 89.2 74.8 14.4 8221 4835 69.6 12.9
Kaliaganj M 47650 33160 79.2 85.5 72.5 13.0 37817 23812 73.6 5.6
Uttar Dinajpur Urban 294443 207151 80.5 85.5 74.8 10.7 252975 163561 74.5 6.0
Uttar Dinajpur DT 2441794 923477 47.9 58.5 36.5 22.0 1891051 520202 34.6 13.3
Source: Census, 2001 & 1991
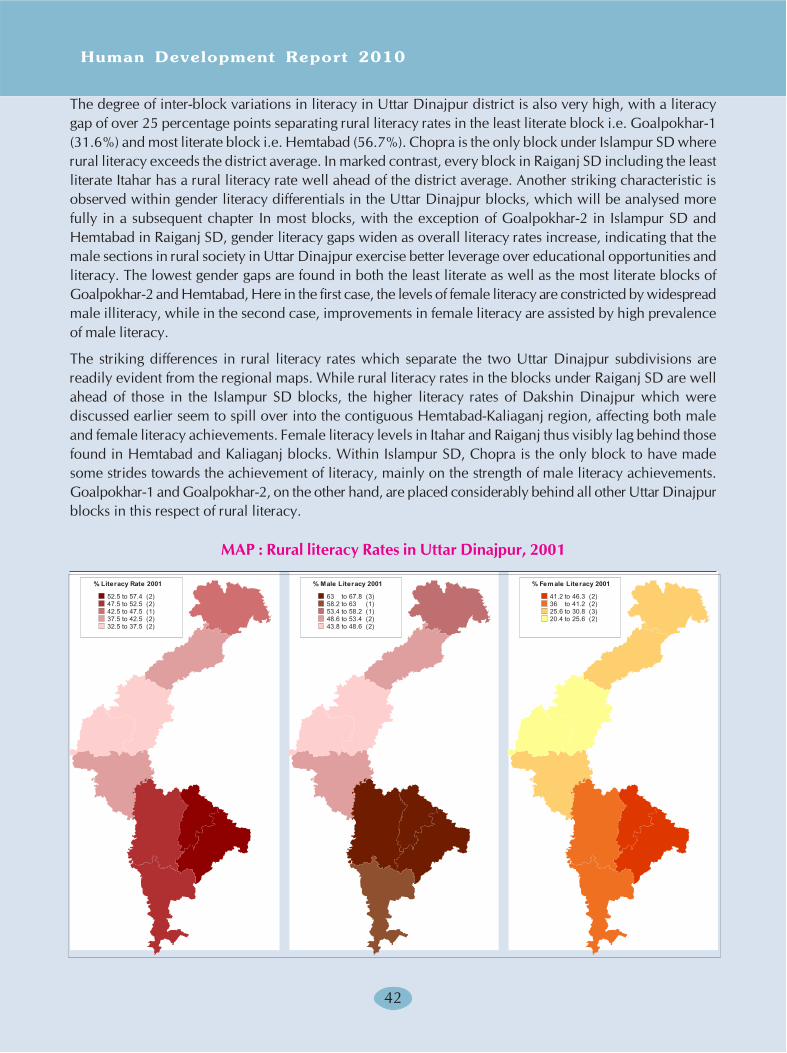
42
The degree of inter-block variations in literacy in Uttar Dinajpur district is also very high, with a literacy
gap of over 25 percentage points separating rural literacy rates in the least literate block i.e. Goalpokhar-1
(31.6%) and most literate block i.e. Hemtabad (56.7%). Chopra is the only block under Islampur SD where
rural literacy exceeds the district average. In marked contrast, every block in Raiganj SD including the least
literate Itahar has a rural literacy rate well ahead of the district average. Another striking characteristic is
observed within gender literacy differentials in the Uttar Dinajpur blocks, which will be analysed more
fully in a subsequent chapter In most blocks, with the exception of Goalpokhar-2 in Islampur SD and
Hemtabad in Raiganj SD, gender literacy gaps widen as overall literacy rates increase, indicating that the
male sections in rural society in Uttar Dinajpur exercise better leverage over educational opportunities and
literacy. The lowest gender gaps are found in both the least literate as well as the most literate blocks of
Goalpokhar-2 and Hemtabad, Here in the first case, the levels of female literacy are constricted by widespread
male illiteracy, while in the second case, improvements in female literacy are assisted by high prevalence
of male literacy.
The striking differences in rural literacy rates which separate the two Uttar Dinajpur subdivisions are
readily evident from the regional maps. While rural literacy rates in the blocks under Raiganj SD are well
ahead of those in the Islampur SD blocks, the higher literacy rates of Dakshin Dinajpur which were
discussed earlier seem to spill over into the contiguous Hemtabad-Kaliaganj region, affecting both male
and female literacy achievements. Female literacy levels in Itahar and Raiganj thus visibly lag behind those
found in Hemtabad and Kaliaganj blocks. Within Islampur SD, Chopra is the only block to have made
some strides towards the achievement of literacy, mainly on the strength of male literacy achievements.
Goalpokhar-1 and Goalpokhar-2, on the other hand, are placed considerably behind all other Uttar Dinajpur
blocks in this respect of rural literacy.
������������� ���
���������������
���������������
��������������
��������������
������� �������
������������� ���
� ���������� �
��������� ����
� �������������
�������� �����
�������������
��������������� ���
��������� ����
� �����������
�������� ����� �
���������������
MAP : Rural literacy Rates in Uttar Dinajpur, 2001
Human Development Report 2010
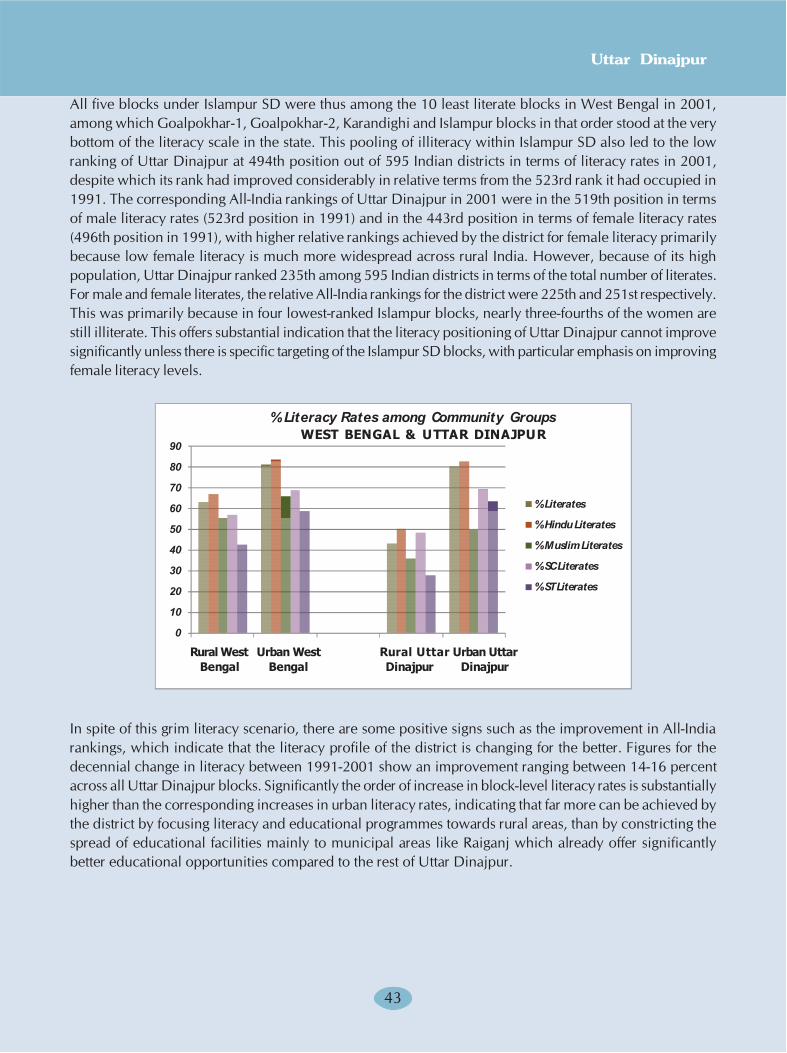
4343
Uttar Dinajpur
All five blocks under Islampur SD were thus among the 10 least literate blocks in West Bengal in 2001,
among which Goalpokhar-1, Goalpokhar-2, Karandighi and Islampur blocks in that order stood at the very
bottom of the literacy scale in the state. This pooling of illiteracy within Islampur SD also led to the low
ranking of Uttar Dinajpur at 494th position out of 595 Indian districts in terms of literacy rates in 2001,
despite which its rank had improved considerably in relative terms from the 523rd rank it had occupied in
1991. The corresponding All-India rankings of Uttar Dinajpur in 2001 were in the 519th position in terms
of male literacy rates (523rd position in 1991) and in the 443rd position in terms of female literacy rates
(496th position in 1991), with higher relative rankings achieved by the district for female literacy primarily
because low female literacy is much more widespread across rural India. However, because of its high
population, Uttar Dinajpur ranked 235th among 595 Indian districts in terms of the total number of literates.
For male and female literates, the relative All-India rankings for the district were 225th and 251st respectively.
This was primarily because in four lowest-ranked Islampur blocks, nearly three-fourths of the women are
still illiterate. This offers substantial indication that the literacy positioning of Uttar Dinajpur cannot improve
significantly unless there is specific targeting of the Islampur SD blocks, with particular emphasis on improving
female literacy levels.
In spite of this grim literacy scenario, there are some positive signs such as the improvement in All-India
rankings, which indicate that the literacy profile of the district is changing for the better. Figures for the
decennial change in literacy between 1991-2001 show an improvement ranging between 14-16 percent
across all Uttar Dinajpur blocks. Significantly the order of increase in block-level literacy rates is substantially
higher than the corresponding increases in urban literacy rates, indicating that far more can be achieved by
the district by focusing literacy and educational programmes towards rural areas, than by constricting the
spread of educational facilities mainly to municipal areas like Raiganj which already offer significantly
better educational opportunities compared to the rest of Uttar Dinajpur.
�
��
��
��
��
��
��
�
�
��
���������
� ���
���� ����
� ���
������������
�� �����
���� �������
�� �����
� ���������
� ����� ���������
� ������ ���������
� �� ���������
� �� ���������
������������ ���������������������
������������ ��������� �
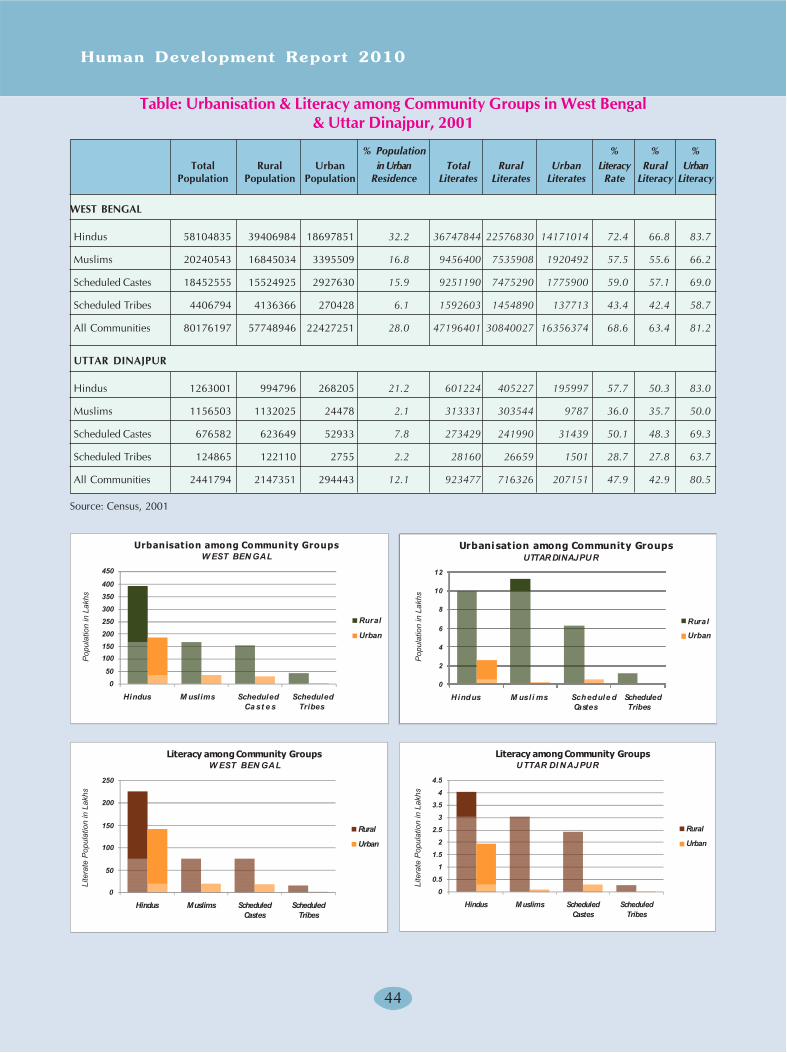
44
Table: Urbanisation & Literacy among Community Groups in West Bengal
& Uttar Dinajpur, 2001
% Population % % %
Total Rural Urban in Urban Total Rural Urban Literacy Rural Urban
Population Population Population Residence Literates Literates Literates Rate Literacy Literacy
WEST BENGAL
Hindus 58104835 39406984 18697851 32.2 36747844 22576830 14171014 72.4 66.8 83.7
Muslims 20240543 16845034 3395509 16.8 9456400 7535908 1920492 57.5 55.6 66.2
Scheduled Castes 18452555 15524925 2927630 15.9 9251190 7475290 1775900 59.0 57.1 69.0
Scheduled Tribes 4406794 4136366 270428 6.1 1592603 1454890 137713 43.4 42.4 58.7
All Communities 80176197 57748946 22427251 28.0 47196401 30840027 16356374 68.6 63.4 81.2
UTTAR DINAJPUR
Hindus 1263001 994796 268205 21.2 601224 405227 195997 57.7 50.3 83.0
Muslims 1156503 1132025 24478 2.1 313331 303544 9787 36.0 35.7 50.0
Scheduled Castes 676582 623649 52933 7.8 273429 241990 31439 50.1 48.3 69.3
Scheduled Tribes 124865 122110 2755 2.2 28160 26659 1501 28.7 27.8 63.7
All Communities 2441794 2147351 294443 12.1 923477 716326 207151 47.9 42.9 80.5
Source: Census, 2001
&
'&
(&&
('&
)&&
)'&
*&&
*'&
+&&
+'&
������ ����� �� ������
���� � �
�� ������
������
����
�����
�������������� ��������������
���������
!
"
#
$
%
%!
������ � �� � � �� ���� ��
������
�� ������
������
��
��
��
������
��
����
�����
������ �������� ��������������
������ ������
!
"
"!
#
#!
������ ����� �� ������
������
�� ������
������
����
�����
����������� ��������������
����� ����
$!
"
"$!
#
#$!
%
%$!
&
&$!
������ ����� �� ������
������
�� ������
������
����
�����
����������� ��������������
��� ������
Human Development Report 2010
Pop
ulat
ion
in L
akhs
Pop
ulat
ion
in L
akhs
Lite
rate
Pop
ulat
ion
in L
akhs
Lite
rate
Pop
ulat
ion
in L
akhs
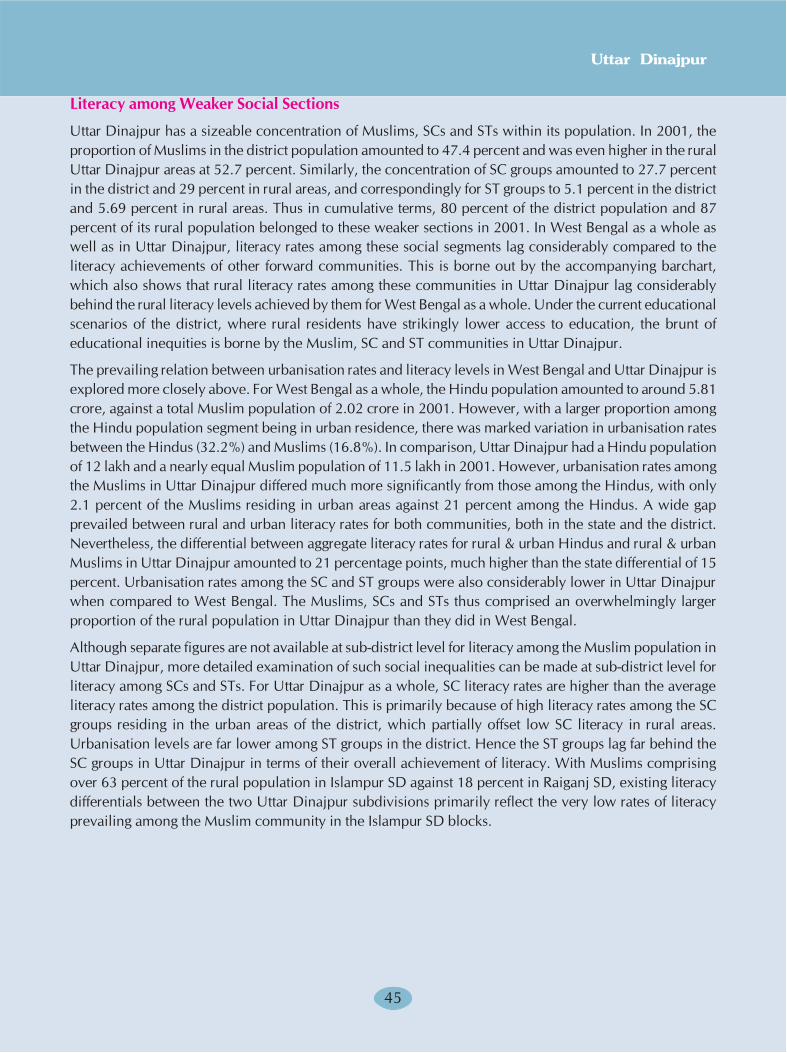
4545
Uttar Dinajpur
Literacy among Weaker Social Sections
Uttar Dinajpur has a sizeable concentration of Muslims, SCs and STs within its population. In 2001, the
proportion of Muslims in the district population amounted to 47.4 percent and was even higher in the rural
Uttar Dinajpur areas at 52.7 percent. Similarly, the concentration of SC groups amounted to 27.7 percent
in the district and 29 percent in rural areas, and correspondingly for ST groups to 5.1 percent in the district
and 5.69 percent in rural areas. Thus in cumulative terms, 80 percent of the district population and 87
percent of its rural population belonged to these weaker sections in 2001. In West Bengal as a whole as
well as in Uttar Dinajpur, literacy rates among these social segments lag considerably compared to the
literacy achievements of other forward communities. This is borne out by the accompanying barchart,
which also shows that rural literacy rates among these communities in Uttar Dinajpur lag considerably
behind the rural literacy levels achieved by them for West Bengal as a whole. Under the current educational
scenarios of the district, where rural residents have strikingly lower access to education, the brunt of
educational inequities is borne by the Muslim, SC and ST communities in Uttar Dinajpur.
The prevailing relation between urbanisation rates and literacy levels in West Bengal and Uttar Dinajpur is
explored more closely above. For West Bengal as a whole, the Hindu population amounted to around 5.81
crore, against a total Muslim population of 2.02 crore in 2001. However, with a larger proportion among
the Hindu population segment being in urban residence, there was marked variation in urbanisation rates
between the Hindus (32.2%) and Muslims (16.8%). In comparison, Uttar Dinajpur had a Hindu population
of 12 lakh and a nearly equal Muslim population of 11.5 lakh in 2001. However, urbanisation rates among
the Muslims in Uttar Dinajpur differed much more significantly from those among the Hindus, with only
2.1 percent of the Muslims residing in urban areas against 21 percent among the Hindus. A wide gap
prevailed between rural and urban literacy rates for both communities, both in the state and the district.
Nevertheless, the differential between aggregate literacy rates for rural & urban Hindus and rural & urban
Muslims in Uttar Dinajpur amounted to 21 percentage points, much higher than the state differential of 15
percent. Urbanisation rates among the SC and ST groups were also considerably lower in Uttar Dinajpur
when compared to West Bengal. The Muslims, SCs and STs thus comprised an overwhelmingly larger
proportion of the rural population in Uttar Dinajpur than they did in West Bengal.
Although separate figures are not available at sub-district level for literacy among the Muslim population in
Uttar Dinajpur, more detailed examination of such social inequalities can be made at sub-district level for
literacy among SCs and STs. For Uttar Dinajpur as a whole, SC literacy rates are higher than the average
literacy rates among the district population. This is primarily because of high literacy rates among the SC
groups residing in the urban areas of the district, which partially offset low SC literacy in rural areas.
Urbanisation levels are far lower among ST groups in the district. Hence the ST groups lag far behind the
SC groups in Uttar Dinajpur in terms of their overall achievement of literacy. With Muslims comprising
over 63 percent of the rural population in Islampur SD against 18 percent in Raiganj SD, existing literacy
differentials between the two Uttar Dinajpur subdivisions primarily reflect the very low rates of literacy
prevailing among the Muslim community in the Islampur SD blocks.
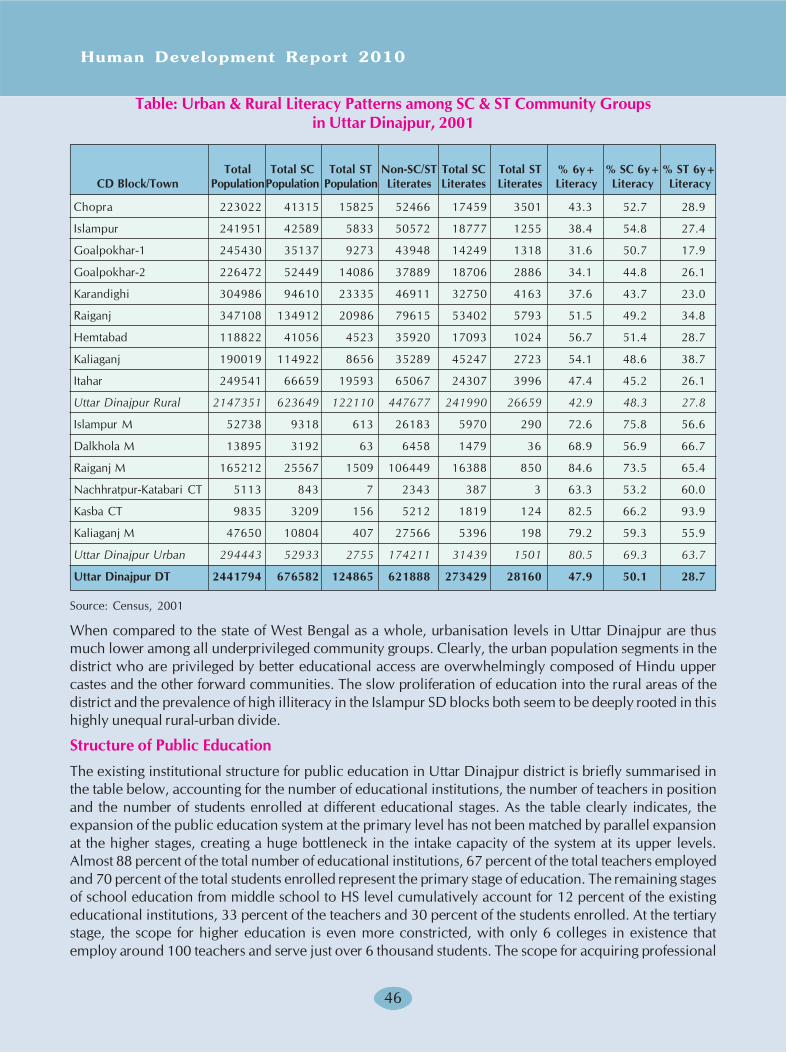
46
Table: Urban & Rural Literacy Patterns among SC & ST Community Groups
in Uttar Dinajpur, 2001
Total Total SC Total ST Non-SC/ST Total SC Total ST % 6y+ % SC 6y+ % ST 6y+
CD Block/Town PopulationPopulation Population Literates Literates Literates Literacy Literacy Literacy
Chopra 223022 41315 15825 52466 17459 3501 43.3 52.7 28.9
Islampur 241951 42589 5833 50572 18777 1255 38.4 54.8 27.4
Goalpokhar-1 245430 35137 9273 43948 14249 1318 31.6 50.7 17.9
Goalpokhar-2 226472 52449 14086 37889 18706 2886 34.1 44.8 26.1
Karandighi 304986 94610 23335 46911 32750 4163 37.6 43.7 23.0
Raiganj 347108 134912 20986 79615 53402 5793 51.5 49.2 34.8
Hemtabad 118822 41056 4523 35920 17093 1024 56.7 51.4 28.7
Kaliaganj 190019 114922 8656 35289 45247 2723 54.1 48.6 38.7
Itahar 249541 66659 19593 65067 24307 3996 47.4 45.2 26.1
Uttar Dinajpur Rural 2147351 623649 122110 447677 241990 26659 42.9 48.3 27.8
Islampur M 52738 9318 613 26183 5970 290 72.6 75.8 56.6
Dalkhola M 13895 3192 63 6458 1479 36 68.9 56.9 66.7
Raiganj M 165212 25567 1509 106449 16388 850 84.6 73.5 65.4
Nachhratpur-Katabari CT 5113 843 7 2343 387 3 63.3 53.2 60.0
Kasba CT 9835 3209 156 5212 1819 124 82.5 66.2 93.9
Kaliaganj M 47650 10804 407 27566 5396 198 79.2 59.3 55.9
Uttar Dinajpur Urban 294443 52933 2755 174211 31439 1501 80.5 69.3 63.7
Uttar Dinajpur DT 2441794 676582 124865 621888 273429 28160 47.9 50.1 28.7
Source: Census, 2001
When compared to the state of West Bengal as a whole, urbanisation levels in Uttar Dinajpur are thus
much lower among all underprivileged community groups. Clearly, the urban population segments in the
district who are privileged by better educational access are overwhelmingly composed of Hindu upper
castes and the other forward communities. The slow proliferation of education into the rural areas of the
district and the prevalence of high illiteracy in the Islampur SD blocks both seem to be deeply rooted in this
highly unequal rural-urban divide.
Structure of Public Education
The existing institutional structure for public education in Uttar Dinajpur district is briefly summarised in
the table below, accounting for the number of educational institutions, the number of teachers in position
and the number of students enrolled at different educational stages. As the table clearly indicates, the
expansion of the public education system at the primary level has not been matched by parallel expansion
at the higher stages, creating a huge bottleneck in the intake capacity of the system at its upper levels.
Almost 88 percent of the total number of educational institutions, 67 percent of the total teachers employed
and 70 percent of the total students enrolled represent the primary stage of education. The remaining stages
of school education from middle school to HS level cumulatively account for 12 percent of the existing
educational institutions, 33 percent of the teachers and 30 percent of the students enrolled. At the tertiary
stage, the scope for higher education is even more constricted, with only 6 colleges in existence that
employ around 100 teachers and serve just over 6 thousand students. The scope for acquiring professional
Human Development Report 2010
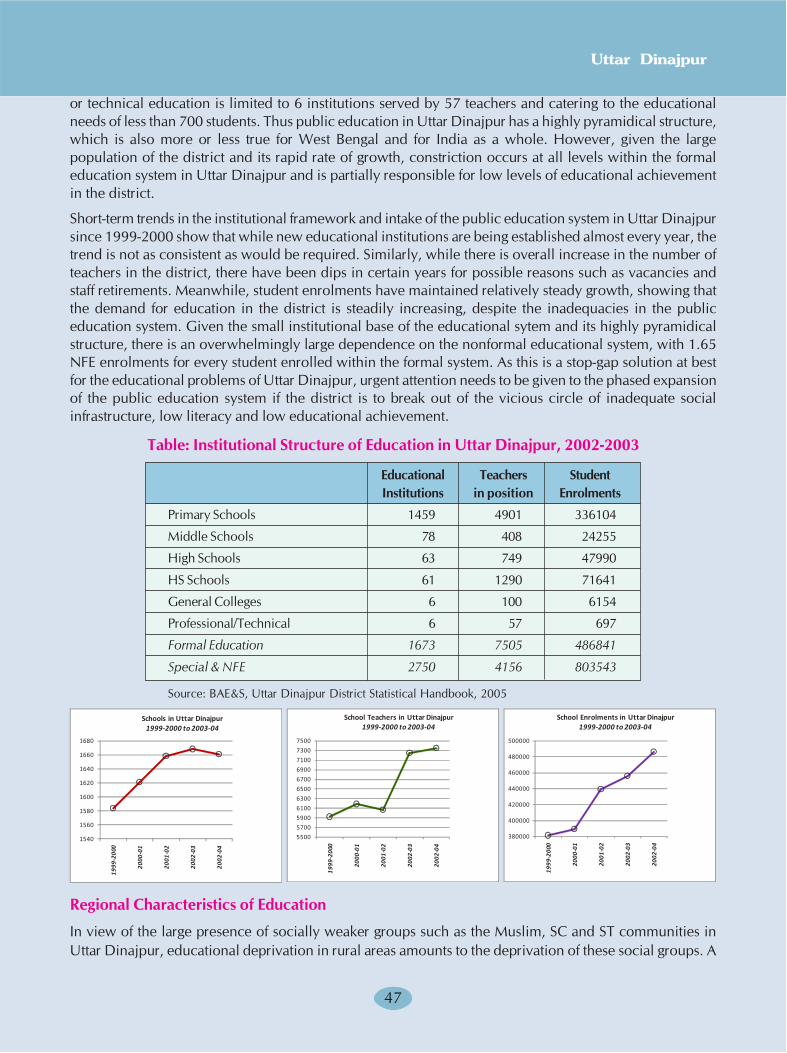
4747
Uttar Dinajpur
or technical education is limited to 6 institutions served by 57 teachers and catering to the educational
needs of less than 700 students. Thus public education in Uttar Dinajpur has a highly pyramidical structure,
which is also more or less true for West Bengal and for India as a whole. However, given the large
population of the district and its rapid rate of growth, constriction occurs at all levels within the formal
education system in Uttar Dinajpur and is partially responsible for low levels of educational achievement
in the district.
Short-term trends in the institutional framework and intake of the public education system in Uttar Dinajpur
since 1999-2000 show that while new educational institutions are being established almost every year, the
trend is not as consistent as would be required. Similarly, while there is overall increase in the number of
teachers in the district, there have been dips in certain years for possible reasons such as vacancies and
staff retirements. Meanwhile, student enrolments have maintained relatively steady growth, showing that
the demand for education in the district is steadily increasing, despite the inadequacies in the public
education system. Given the small institutional base of the educational sytem and its highly pyramidical
structure, there is an overwhelmingly large dependence on the nonformal educational system, with 1.65
NFE enrolments for every student enrolled within the formal system. As this is a stop-gap solution at best
for the educational problems of Uttar Dinajpur, urgent attention needs to be given to the phased expansion
of the public education system if the district is to break out of the vicious circle of inadequate social
infrastructure, low literacy and low educational achievement.
Table: Institutional Structure of Education in Uttar Dinajpur, 2002-2003
Educational Teachers Student
Institutions in position Enrolments
Primary Schools 1459 4901 336104
Middle Schools 78 408 24255
High Schools 63 749 47990
HS Schools 61 1290 71641
General Colleges 6 100 6154
Professional/Technical 6 57 697
Formal Education 1673 7505 486841
Special & NFE 2750 4156 803543
Source: BAE&S, Uttar Dinajpur District Statistical Handbook, 2005
Regional Characteristics of Education
In view of the large presence of socially weaker groups such as the Muslim, SC and ST communities in
Uttar Dinajpur, educational deprivation in rural areas amounts to the deprivation of these social groups. A
1540
1560
1580
1600
1620
1640
1660
1680
1999
-200
0
2000
-01
2001
-02
2002
-03
2002
-04
Schools in Uttar Dinajpur1999-2000 to 2003-04
5500
5700
5900
6100
6300
6500
6700
6900
7100
7300
7500
1999
-200
0
2000
-01
2001
-02
2002
-03
2002
-04
School Teachers in Uttar Dinajpur1999-2000 to 2003-04
380000
400000
420000
440000
460000
480000
500000
1999
-200
0
2000
-01
2001
-02
2002
-03
2002
-04
School Enrolments in Uttar Dinajpur1999-2000 to 2003-04
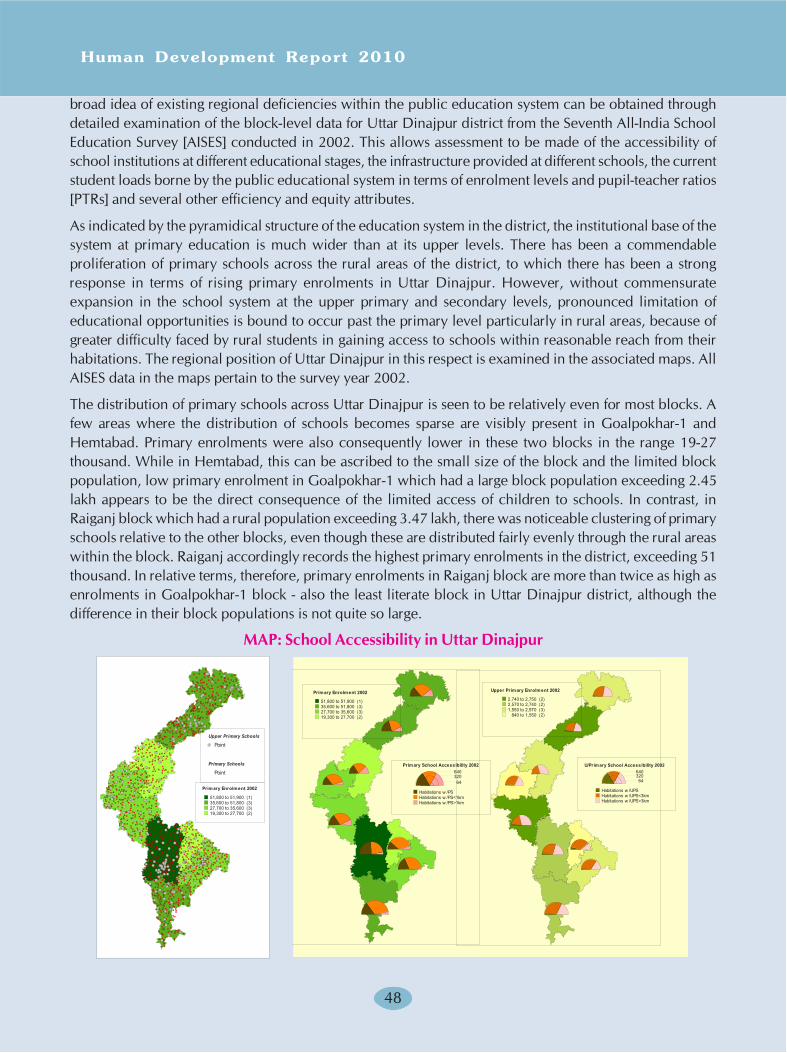
48
broad idea of existing regional deficiencies within the public education system can be obtained through
detailed examination of the block-level data for Uttar Dinajpur district from the Seventh All-India School
Education Survey [AISES] conducted in 2002. This allows assessment to be made of the accessibility of
school institutions at different educational stages, the infrastructure provided at different schools, the current
student loads borne by the public educational system in terms of enrolment levels and pupil-teacher ratios
[PTRs] and several other efficiency and equity attributes.
As indicated by the pyramidical structure of the education system in the district, the institutional base of the
system at primary education is much wider than at its upper levels. There has been a commendable
proliferation of primary schools across the rural areas of the district, to which there has been a strong
response in terms of rising primary enrolments in Uttar Dinajpur. However, without commensurate
expansion in the school system at the upper primary and secondary levels, pronounced limitation of
educational opportunities is bound to occur past the primary level particularly in rural areas, because of
greater difficulty faced by rural students in gaining access to schools within reasonable reach from their
habitations. The regional position of Uttar Dinajpur in this respect is examined in the associated maps. All
AISES data in the maps pertain to the survey year 2002.
The distribution of primary schools across Uttar Dinajpur is seen to be relatively even for most blocks. A
few areas where the distribution of schools becomes sparse are visibly present in Goalpokhar-1 and
Hemtabad. Primary enrolments were also consequently lower in these two blocks in the range 19-27
thousand. While in Hemtabad, this can be ascribed to the small size of the block and the limited block
population, low primary enrolment in Goalpokhar-1 which had a large block population exceeding 2.45
lakh appears to be the direct consequence of the limited access of children to schools. In contrast, in
Raiganj block which had a rural population exceeding 3.47 lakh, there was noticeable clustering of primary
schools relative to the other blocks, even though these are distributed fairly evenly through the rural areas
within the block. Raiganj accordingly records the highest primary enrolments in the district, exceeding 51
thousand. In relative terms, therefore, primary enrolments in Raiganj block are more than twice as high as
enrolments in Goalpokhar-1 block - also the least literate block in Uttar Dinajpur district, although the
difference in their block populations is not quite so large.
MAP: School Accessibility in Uttar Dinajpur
Human Development Report 2010
Primary Enrolment 2002
51,800 to 51,900 (1)35,600 to 51,800 (3)27,700 to 35,600 (3)19,300 to 27,700 (2)
Primary Schools
Upper Primary Schools
Point
Point
Upper Primary Enrolment 2002
2,740 to 2,750 (2)2,570 to 2,740 (2)1,550 to 2,570 (3)
840 to 1,550 (2)
U/Primary School Accessibility 200264032064
Habitations w /UPSHabitations w /UPS<3kmHabitations w /UPS>3km
Primary Enrolment 2002
51,800 to 51,900 (1)35,600 to 51,800 (3)27,700 to 35,600 (3)19,300 to 27,700 (2)
Primary School Accessibility 200264032064
Habitations w /PSHabitations w /PS<1kmHabitations w /PS>1km
4949
Uttar Dinajpur
Of the 3.14 lakh children enrolled in primary schools in Uttar Dinajpur in 2002, 2.96 lakh (96%) belonged
to rural areas. They attended a total of 1313 rural primary schools, 255 (19%) of which were located within
Raiganj block. Additionally, within the municipal limits of Raiganj, there were 43 primary schools amounting
to 38 percent of the urban primary schools in the district, which enrolled 4687 urban children. Taken
together, rural and urban Raiganj accounted for 18 percent of the total primary enrolment and 20 percent
of the primary schools established in the district. With 737 primary schools serving 1.49 lakh children,
Raiganj SD thus had 52 percent of the primary schools and accounted for 48 percent of the total primary
enrolment in Uttar Dinajpur. In contrast, 690 primary schools catered to the educational needs of 1.65
lakh children in Islampur SD. Thus poorer educational achievements in the Islampur SD blocks clearly
reflected the relative lack of school institutions, rather than the lack of effective response.
Despite such shortcomings, the base for primary education in Uttar Dinajpur is seen to be well dispersed
and strong and is able to draw forward sizeable enrolments even in the low literacy blocks. Nevertheless,
the key to the continuance of education for the rural learners who had been enrolled at the primary stage
was held by the upper primary school system in the district. In the institutional map, the distribution of
upper primary schools (represented by the larger white dot-markers) is seen to be remarkably sparse relative
to the fairly even distribution of primary institutions, and also shows marked clustering in the vicinity of
urban municipalities such as Raiganj, Kaliaganj and Islampur. In the non-urbanised blocks of Chopra,
Hemtabad and Itahar and in the relatively less-urbanised Karandighi block, there was better dispersal of
upper primary schools, even though the number of such institutions was inadequate, when compared to
the large institutional base of primary schools. Consequently, upper primary enrolments fell drastically
across the district, with 0.19 lakh upper primary students enrolled in all, equivalent to barely 6 percent of
the total primary enrolments. While Karandighi and Islampur blocks recorded the highest upper primary
enrolments, the other Uttar Dinajpur blocks together accounted for barely 12 thousand upper primary
students. In Raiganj, Kaliaganj and Islampur, upper primary students were drawn mainly from the vicinity
of the urban areas, while the rest of the rural areas within them were highly underserved. Peak upper
primary enrolments in the Uttar Dinajpur blocks decreased to approximately 2700 students, from the peak
primary enrolment exceeding 51,000 students. Ostensibly, in the statistics therefore, there was huge dropout
of rural students in Uttar Dinajpur after the primary school stage, justifying such a mismatch between the
primary and upper primary educational systems. More authentically however, such rural 'dropouts' were
involuntary in nature, and were enforced by the existing inadequacies of the public education system.
Because of the overall dearth of suitably located upper primary institutions, only one out of every five rural
students who had enrolled at the primary stage was able to advance beyond it to enter the upper primary
school system. Furthermore, this pattern was almost uniformly present across all blocks in Uttar Dinajpur
district.
Accessibility of rural schools imposed further problems. At the primary stage, most rural students were
able to reach and attend a primary school located within a radius of 1km from their point of habitation.
Accessibility was best in Kaliaganj and relatively better through the Raiganj SD blocks, compared to the
Islampur SD blocks where a relatively larger proportion of rural students had to reach primary schools over
distances exceeding 1km. Since Goalpokhar-1 block held the largest proportion of such students, the
difficulties of school access combined with the overall dearth of institutions would account for the low
primary enrolments in the block. At the upper primary stage, the problems of school access multiplied
throughout the district, with most rural students having to reach their schools commuting over distances of
3km or more. In Karandighi and Golpokhar-1, this problem was much more acute since a majority of
upper primary students had to commute over distances greater than 3km.
50
Accessibility of Rural Schools
While the spread of educational institutions in Uttar Dinajpur, particularly at the primary level, has been
commendable, two additional enabling conditions play a critical role in determining the achievement of
rural education. These are firstly, the accessibility of rural schools from the places of rural habitation, and
secondly, the provision of adequate school infrastructure at these schools. As seen above, although the
number of primary institutions is still inadequate to meet the educational needs of all potential learners,
school accessibility is less of a problem at the primary stage since the spread of primary institutions within
a radius of 1 km from the rural habitations is fairly uniform and even for most Uttar Dinajpur blocks.
However at the upper primary stage, school accessibility becomes a major problem, developing particularly
acute dimensions in some of the least literate Islampur SD blocks.
According to Census 2001 figures, 71 percent of the mouza villages in Uttar Dinajpur district provided
access to at least one primary school. While below the state average of 74 percent for West Bengal as a
whole, this represented a reasonable level of achievement for Uttar Dinajpur, which is otherwise a low
literacy district. The problem becomes much more critical at the upper primary stage, where only 9 percent
of the Uttar Dinajpur villages had access to an upper primary school in their close vicinity, against an
average of 15 percent for the state. Since the inadequate provision of upper primary education is still a
major area of concern in West Bengal, the state norm does not represent an ideal situation and is far short
of the achievement of states like Kerala in this respect. Nevertheless, the fact that Uttar Dinajpur is still well
below this state norm has substantial bearing on its poor achievements in literacy and education.
At the sub-district level, the current accessibility problems faced at different educational stages within the
district of Uttar Dinajpur become clear during proximity analysis of Census 2001 data. It is easily apparent
therefore, that the pyramidical structure of the educational system in the district places increasing institutional
impediments on the path of progress by rural learners as they transit from one educational stage to the
other. However, the most critical of these institutional barriers is encountered by rural learners as they
prepare to enter the upper primary stage. The absolute dearth of upper primary schools in the district is
enough to stop most of the rural students who had previously enrolled under the primary system in their
tracks. Thus for most rural students in Uttar Dinajpur, the possibility of progressing through the public
education system stage-after-stage becomes an increasingly distant vision. It is also pertinent to observe
that urban learners face none of these impediments, since the institutions they attend are all within easy
reach of the places where they reside.
Block-wise positions in the proximity table are captured vividly in the associated barcharts. While a sharp
drop occurs in the number of educational institutions within the proximity range of 1km between the
primary and middle school stage in every Uttar Dinajpur block, the institutional frameworks and proximities
at subsequent educational stages maintain closer compatibility with the framework of middle school
institutions. Clearly, expansion of primary education through Uttar Dinajpur district has not been
accompanied by gradual upgradation of the institutional frameworks at later educational stages, producing
the bottleneck that halts the transition of most primary learners. Since this position is repeatedly echoed in
all blocks in Uttar Dinajpur, the gravity of this problem becomes increasingly evident. Goalpokhar-1,
Goalpokhar-2 and Karandighi blocks are obviously at a special detriment in this respect at all educational
stages, explaining the low educational achievements by these blocks.
Human Development Report 2010
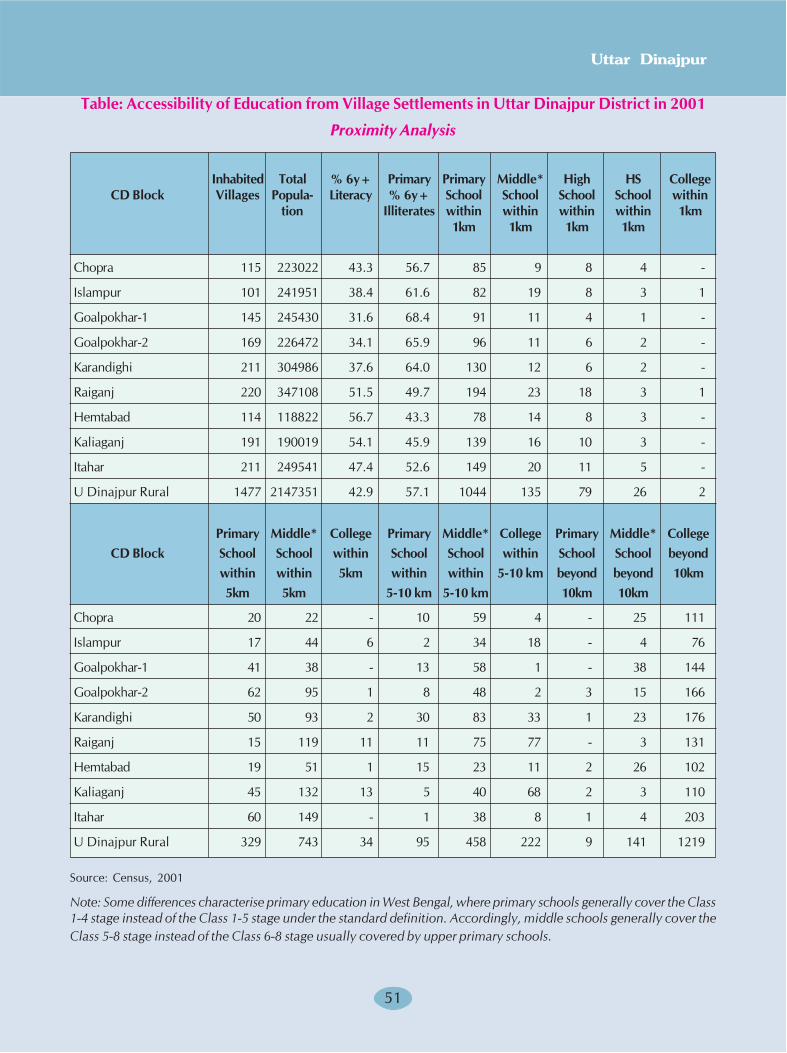
5151
Uttar Dinajpur
Table: Accessibility of Education from Village Settlements in Uttar Dinajpur District in 2001
Proximity Analysis
Inhabited Total % 6y+ Primary Primary Middle* High HS College
CD Block Villages Popula- Literacy % 6y+ School School School School within
tion Illiterates within within within within 1km
1km 1km 1km 1km
Chopra 115 223022 43.3 56.7 85 9 8 4 -
Islampur 101 241951 38.4 61.6 82 19 8 3 1
Goalpokhar-1 145 245430 31.6 68.4 91 11 4 1 -
Goalpokhar-2 169 226472 34.1 65.9 96 11 6 2 -
Karandighi 211 304986 37.6 64.0 130 12 6 2 -
Raiganj 220 347108 51.5 49.7 194 23 18 3 1
Hemtabad 114 118822 56.7 43.3 78 14 8 3 -
Kaliaganj 191 190019 54.1 45.9 139 16 10 3 -
Itahar 211 249541 47.4 52.6 149 20 11 5 -
U Dinajpur Rural 1477 2147351 42.9 57.1 1044 135 79 26 2
Primary Middle* College Primary Middle* College Primary Middle* College
CD Block School School within School School within School School beyond
within within 5km within within 5-10 km beyond beyond 10km
5km 5km 5-10 km 5-10 km 10km 10km
Chopra 20 22 - 10 59 4 - 25 111
Islampur 17 44 6 2 34 18 - 4 76
Goalpokhar-1 41 38 - 13 58 1 - 38 144
Goalpokhar-2 62 95 1 8 48 2 3 15 166
Karandighi 50 93 2 30 83 33 1 23 176
Raiganj 15 119 11 11 75 77 - 3 131
Hemtabad 19 51 1 15 23 11 2 26 102
Kaliaganj 45 132 13 5 40 68 2 3 110
Itahar 60 149 - 1 38 8 1 4 203
U Dinajpur Rural 329 743 34 95 458 222 9 141 1219
Source: Census, 2001
Note: Some differences characterise primary education in West Bengal, where primary schools generally cover the Class
1-4 stage instead of the Class 1-5 stage under the standard definition. Accordingly, middle schools generally cover the
Class 5-8 stage instead of the Class 6-8 stage usually covered by upper primary schools.
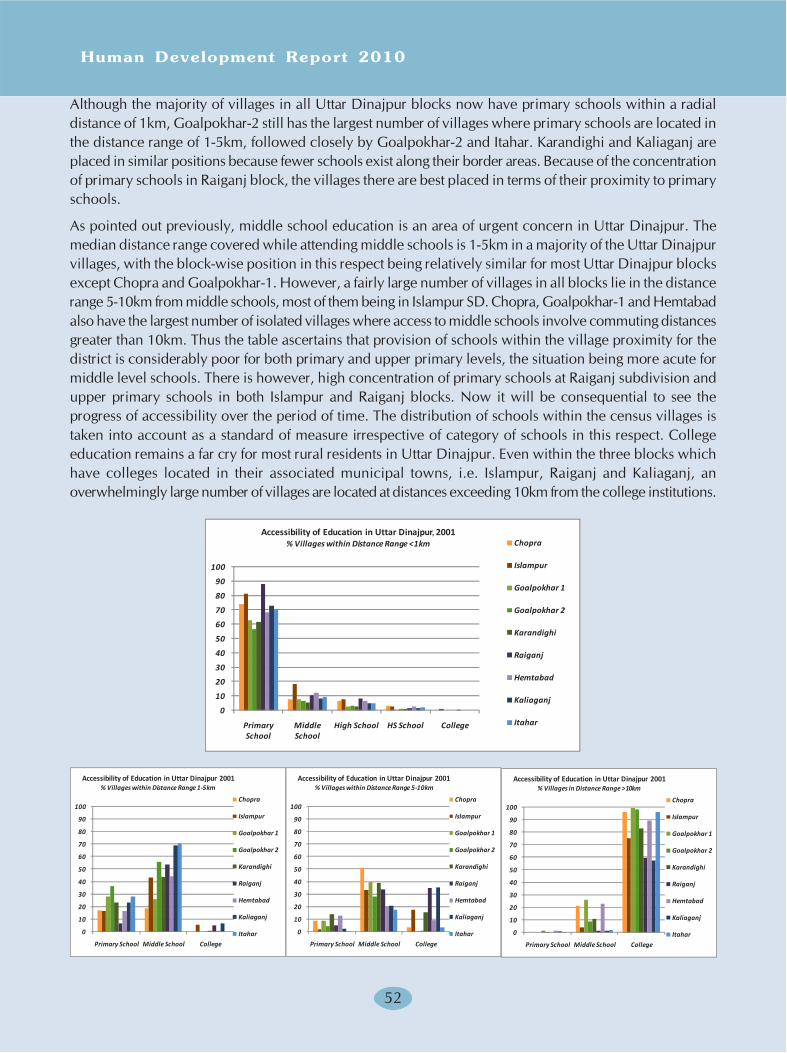
Human Development Report 2010
52
Although the majority of villages in all Uttar Dinajpur blocks now have primary schools within a radial
distance of 1km, Goalpokhar-2 still has the largest number of villages where primary schools are located in
the distance range of 1-5km, followed closely by Goalpokhar-2 and Itahar. Karandighi and Kaliaganj are
placed in similar positions because fewer schools exist along their border areas. Because of the concentration
of primary schools in Raiganj block, the villages there are best placed in terms of their proximity to primary
schools.
As pointed out previously, middle school education is an area of urgent concern in Uttar Dinajpur. The
median distance range covered while attending middle schools is 1-5km in a majority of the Uttar Dinajpur
villages, with the block-wise position in this respect being relatively similar for most Uttar Dinajpur blocks
except Chopra and Goalpokhar-1. However, a fairly large number of villages in all blocks lie in the distance
range 5-10km from middle schools, most of them being in Islampur SD. Chopra, Goalpokhar-1 and Hemtabad
also have the largest number of isolated villages where access to middle schools involve commuting distances
greater than 10km. Thus the table ascertains that provision of schools within the village proximity for the
district is considerably poor for both primary and upper primary levels, the situation being more acute for
middle level schools. There is however, high concentration of primary schools at Raiganj subdivision and
upper primary schools in both Islampur and Raiganj blocks. Now it will be consequential to see the
progress of accessibility over the period of time. The distribution of schools within the census villages is
taken into account as a standard of measure irrespective of category of schools in this respect. College
education remains a far cry for most rural residents in Uttar Dinajpur. Even within the three blocks which
have colleges located in their associated municipal towns, i.e. Islampur, Raiganj and Kaliaganj, an
overwhelmingly large number of villages are located at distances exceeding 10km from the college institutions.
0
10
20
30
40
50
60
70
80
90
100
Primary School
Middle School
High School HS School College
Chopra
Islampur
Goalpokhar 1
Goalpokhar 2
Karandighi
Raiganj
Hemtabad
Kaliaganj
Itahar
Accessibility of Education in Uttar Dinajpur 2001% Villages within Distance Range <1km
0
10
20
30
40
50
60
70
80
90
100
Primary School Middle School College
Chopra
Islampur
Goalpokhar 1
Goalpokhar 2
Karandighi
Raiganj
Hemtabad
Kaliaganj
Itahar
Accessibility of Education in Uttar Dinajpur 2001% Villages within Distance Range 1-5km
0
10
20
30
40
50
60
70
80
90
100
Primary School Middle School College
Chopra
Islampur
Goalpokhar 1
Goalpokhar 2
Karandighi
Raiganj
Hemtabad
Kaliaganj
Itahar
Accessibility of Education in Uttar Dinajpur 2001% Villages within Distance Range 5-10km
0
10
20
30
40
50
60
70
80
90
100
Primary School Middle School College
Chopra
Islampur
Goalpokhar 1
Goalpokhar 2
Karandighi
Raiganj
Hemtabad
Kaliaganj
Itahar
Accessibility of Education in Uttar Dinajpur 2001% Villages in Distance Range >10km
,
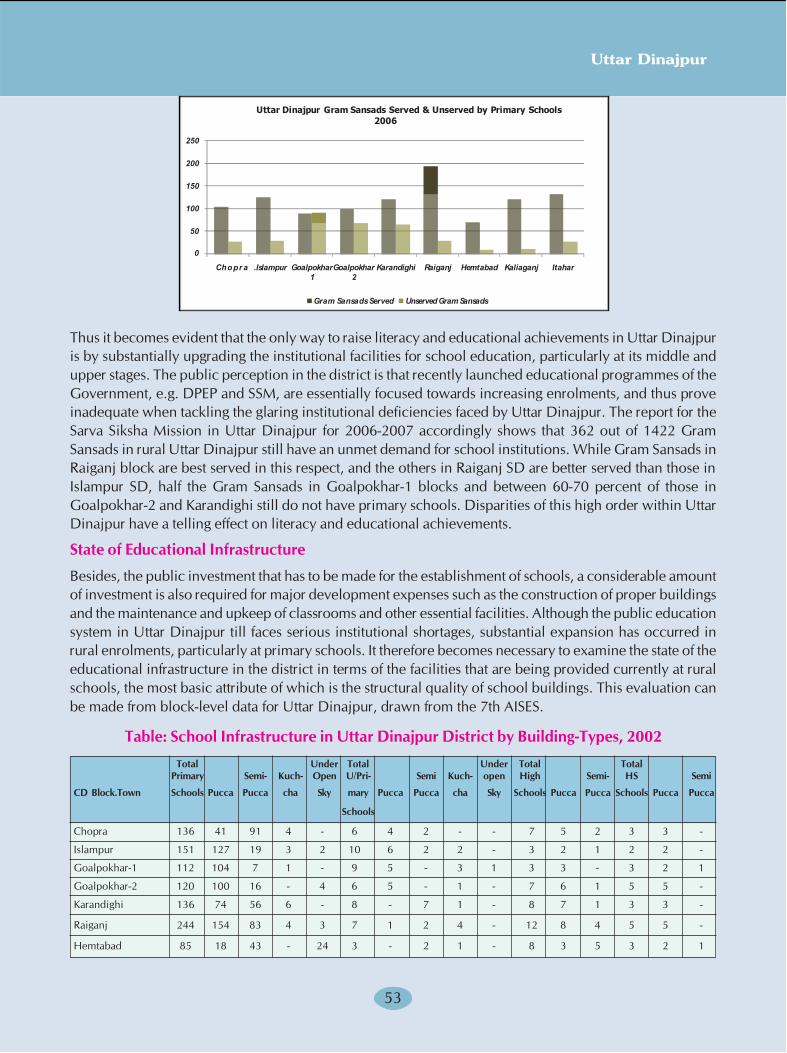
5353
Uttar Dinajpur
�
��
���
���
���
���
���� � ����� ���������
�
���������
�
��������� ������� �������� ��������� ����
���� ������� �!�� "���!������� ������
������������� ����������������������������������������������
����
Thus it becomes evident that the only way to raise literacy and educational achievements in Uttar Dinajpur
is by substantially upgrading the institutional facilities for school education, particularly at its middle and
upper stages. The public perception in the district is that recently launched educational programmes of the
Government, e.g. DPEP and SSM, are essentially focused towards increasing enrolments, and thus prove
inadequate when tackling the glaring institutional deficiencies faced by Uttar Dinajpur. The report for the
Sarva Siksha Mission in Uttar Dinajpur for 2006-2007 accordingly shows that 362 out of 1422 Gram
Sansads in rural Uttar Dinajpur still have an unmet demand for school institutions. While Gram Sansads in
Raiganj block are best served in this respect, and the others in Raiganj SD are better served than those in
Islampur SD, half the Gram Sansads in Goalpokhar-1 blocks and between 60-70 percent of those in
Goalpokhar-2 and Karandighi still do not have primary schools. Disparities of this high order within Uttar
Dinajpur have a telling effect on literacy and educational achievements.
State of Educational Infrastructure
Besides, the public investment that has to be made for the establishment of schools, a considerable amount
of investment is also required for major development expenses such as the construction of proper buildings
and the maintenance and upkeep of classrooms and other essential facilities. Although the public education
system in Uttar Dinajpur till faces serious institutional shortages, substantial expansion has occurred in
rural enrolments, particularly at primary schools. It therefore becomes necessary to examine the state of the
educational infrastructure in the district in terms of the facilities that are being provided currently at rural
schools, the most basic attribute of which is the structural quality of school buildings. This evaluation can
be made from block-level data for Uttar Dinajpur, drawn from the 7th AISES.
Table: School Infrastructure in Uttar Dinajpur District by Building-Types, 2002
Total Under Total Under Total Total
Primary Semi- Kuch- Open U/Pri- Semi Kuch- open High Semi- HS Semi
CD Block.Town Schools Pucca Pucca cha Sky mary Pucca Pucca cha Sky Schools Pucca Pucca Schools Pucca Pucca
Schools
Chopra 136 41 91 4 - 6 4 2 - - 7 5 2 3 3 -
Islampur 151 127 19 3 2 10 6 2 2 - 3 2 1 2 2 -
Goalpokhar-1 112 104 7 1 - 9 5 - 3 1 3 3 - 3 2 1
Goalpokhar-2 120 100 16 - 4 6 5 - 1 - 7 6 1 5 5 -
Karandighi 136 74 56 6 - 8 - 7 1 - 8 7 1 3 3 -
Raiganj 244 154 83 4 3 7 1 2 4 - 12 8 4 5 5 -
Hemtabad 85 18 43 - 24 3 - 2 1 - 8 3 5 3 2 1
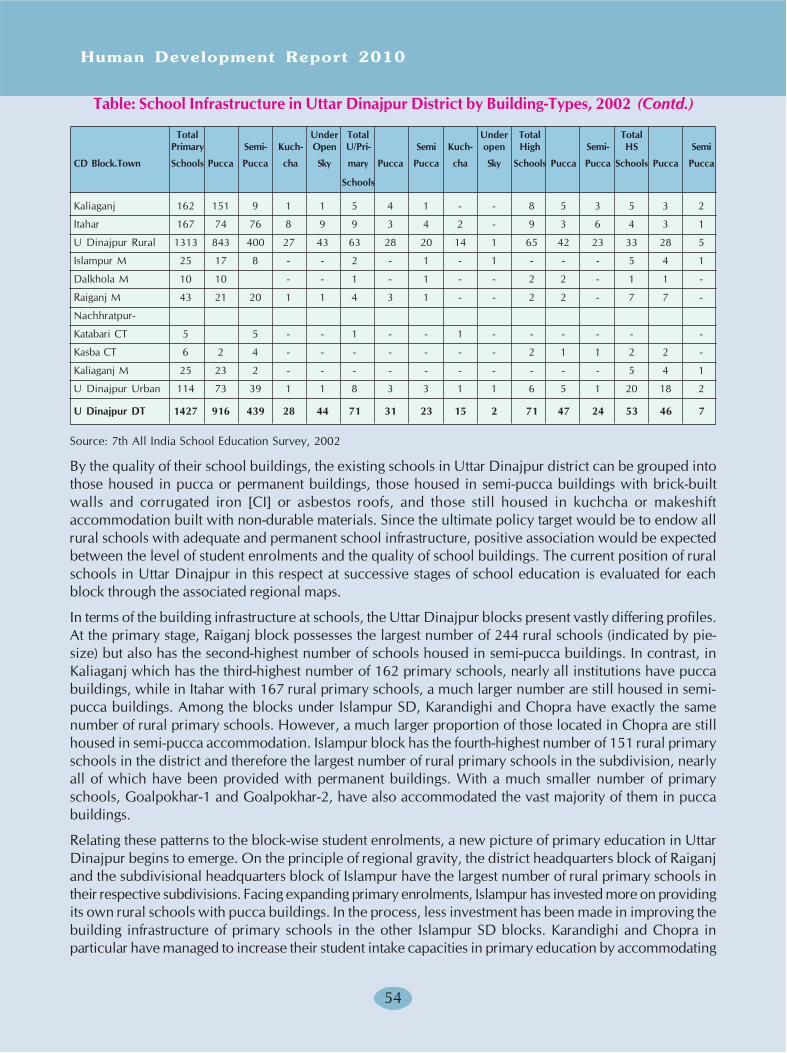
Human Development Report 2010
54
Kaliaganj 162 151 9 1 1 5 4 1 - - 8 5 3 5 3 2
Itahar 167 74 76 8 9 9 3 4 2 - 9 3 6 4 3 1
U Dinajpur Rural 1313 843 400 27 43 63 28 20 14 1 65 42 23 33 28 5
Islampur M 25 17 8 - - 2 - 1 - 1 - - - 5 4 1
Dalkhola M 10 10 - - 1 - 1 - - 2 2 - 1 1 -
Raiganj M 43 21 20 1 1 4 3 1 - - 2 2 - 7 7 -
Nachhratpur-
Katabari CT 5 5 - - 1 - - 1 - - - - - -
Kasba CT 6 2 4 - - - - - - - 2 1 1 2 2 -
Kaliaganj M 25 23 2 - - - - - - - - - - 5 4 1
U Dinajpur Urban 114 73 39 1 1 8 3 3 1 1 6 5 1 20 18 2
U Dinajpur DT 1427 916 439 28 44 71 31 23 15 2 71 47 24 53 46 7
Source: 7th All India School Education Survey, 2002
By the quality of their school buildings, the existing schools in Uttar Dinajpur district can be grouped into
those housed in pucca or permanent buildings, those housed in semi-pucca buildings with brick-built
walls and corrugated iron [CI] or asbestos roofs, and those still housed in kuchcha or makeshift
accommodation built with non-durable materials. Since the ultimate policy target would be to endow all
rural schools with adequate and permanent school infrastructure, positive association would be expected
between the level of student enrolments and the quality of school buildings. The current position of rural
schools in Uttar Dinajpur in this respect at successive stages of school education is evaluated for each
block through the associated regional maps.
In terms of the building infrastructure at schools, the Uttar Dinajpur blocks present vastly differing profiles.
At the primary stage, Raiganj block possesses the largest number of 244 rural schools (indicated by pie-
size) but also has the second-highest number of schools housed in semi-pucca buildings. In contrast, in
Kaliaganj which has the third-highest number of 162 primary schools, nearly all institutions have pucca
buildings, while in Itahar with 167 rural primary schools, a much larger number are still housed in semi-
pucca buildings. Among the blocks under Islampur SD, Karandighi and Chopra have exactly the same
number of rural primary schools. However, a much larger proportion of those located in Chopra are still
housed in semi-pucca accommodation. Islampur block has the fourth-highest number of 151 rural primary
schools in the district and therefore the largest number of rural primary schools in the subdivision, nearly
all of which have been provided with permanent buildings. With a much smaller number of primary
schools, Goalpokhar-1 and Goalpokhar-2, have also accommodated the vast majority of them in pucca
buildings.
Relating these patterns to the block-wise student enrolments, a new picture of primary education in Uttar
Dinajpur begins to emerge. On the principle of regional gravity, the district headquarters block of Raiganj
and the subdivisional headquarters block of Islampur have the largest number of rural primary schools in
their respective subdivisions. Facing expanding primary enrolments, Islampur has invested more on providing
its own rural schools with pucca buildings. In the process, less investment has been made in improving the
building infrastructure of primary schools in the other Islampur SD blocks. Karandighi and Chopra in
particular have managed to increase their student intake capacities in primary education by accommodating
Total Under Total Under Total Total
Primary Semi- Kuch- Open U/Pri- Semi Kuch- open High Semi- HS Semi
CD Block.Town Schools Pucca Pucca cha Sky mary Pucca Pucca cha Sky Schools Pucca Pucca Schools Pucca Pucca
Schools
Table: School Infrastructure in Uttar Dinajpur District by Building-Types, 2002 (Contd.)
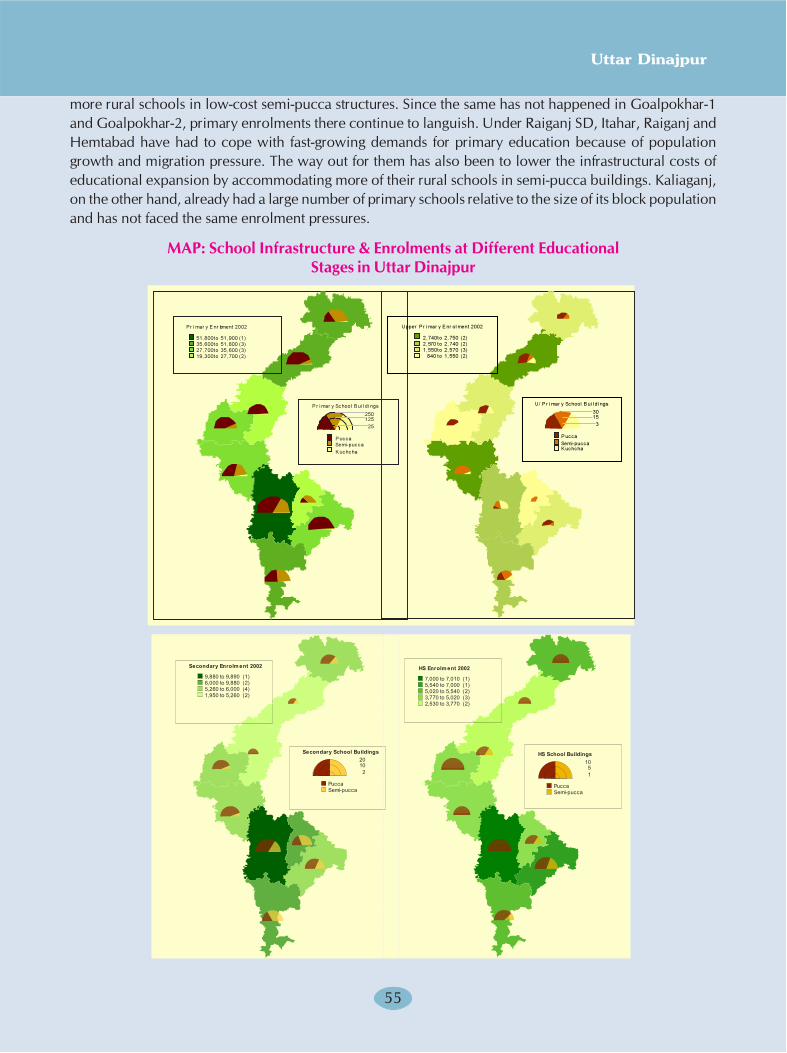
5555
Uttar Dinajpur
more rural schools in low-cost semi-pucca structures. Since the same has not happened in Goalpokhar-1
and Goalpokhar-2, primary enrolments there continue to languish. Under Raiganj SD, Itahar, Raiganj and
Hemtabad have had to cope with fast-growing demands for primary education because of population
growth and migration pressure. The way out for them has also been to lower the infrastructural costs of
educational expansion by accommodating more of their rural schools in semi-pucca buildings. Kaliaganj,
on the other hand, already had a large number of primary schools relative to the size of its block population
and has not faced the same enrolment pressures.
MAP: School Infrastructure & Enrolments at Different Educational
Stages in Uttar Dinajpur
���������������������
�����������������
���������������� �
�� ���������������
���������� ���� �
������������������������
�
�
�����
����������
������������������
�
�
�����
����������
���������������
����������������
�����������������
��� ������������ �
������������ �����
��������������� �
Pr i mar y E nr ol ment 2002
51,800 to 51,900 (1)
35,600 to 51,800 (3)
27,700 to 35,600 (3)
19,300 to 27,700 (2)
P r i mar y School B ui l di ngs
250
125
25
P ucca
Semi-pucca
K uchcha
Upper Pr i mar y E nr ol ment 2002
2,740 to 2,750 (2)
2,570 to 2,740 (2)
1,550 to 2,570 (3)
840 to 1,550 (2)
U/ P r i mar y School B ui l di ngs
30
15
3
P ucca
Semi-pucca
K uchcha
Human Development Report 2010
56
At the upper primary stage, where the total number of institutions serving the district is small, the most
striking characteristic in the relevant regional map is the substantial proportionate presence of kuchcha
school buildings in blocks like Islampur, Goalpokhar-1, Raiganj and Itahar, which also indicates that the
principal constraint faced while expanding upper primary education in Uttar Dinajpur is the high capital
cost associated with the provision of school buildings. Islampur and Karandighi blocks have the largest
upper primary enrolments in the district, which they manage to accommodate by running more upper
primary schools in semi-pucca and kuchcha buildings. Elsewhere through the district, where this cost-
economising strategy has not been adopted, access to upper primary education continues to be highly
constricted. Obviously, since such a strategy cannot be looked as a longterm solution, financial means will
have to be found in the near future for upgrading the building infrastructure at these educational institutions.
So the opening of new upper primary schools in rural areas without adequate building support merely
defers their real costs into the future. With rising primary enrolments throughout the district, the demand
for upper primary education in Uttar Dinajpur is likely to rise substantially in the foreseeable future. This
can only be met adequately and equitably if sufficient financial resources are made available to the district
for the establishment and upgradation of upper primary schools.
Secondary school enrolments are concentrated in the Raiganj SD blocks, where the number of rural
secondary schools available is also much larger, amounting in proportionate terms to 57 percent of the
rural secondary schools in the district. However, the proportion of secondary schools functioning from
semi-pucca premises is also larger in the subdivision, particularly in Hemtabad and Itahar, indicating that
the expansion of secondary enrolments in the subdivision has been achieved by economising on the
infrastructural costs of secondary school buildings. Although the proportionate presence of rural secondary
schools is much lower through Islampur SD, blocks like Karandighi, Goalpokhar-2 and Chopra have had
to increase enrolment by running more schools from semi-pucca buildings. While the higher rural secondary
and HS enrolments in Goalpokhar-2 and Karandighi show a threshold effect associated with their contiguity
to Raiganj SD, enrolments in Chopra have apparently increased because of the contiguity of the block to
the educationally-progressive district of Darjeeling. Since secondary education in Uttar Dinajpur is provided
at both secondary and integrated HS schools, the overall deficiency of secondary institutions in Islampur
SD is partially made up by the presence of additional HS schools, the greater proportion of which have
been accommodated in permanent school buildings. However in Goalpokhar-1, Hemtabad, Kaliaganj and
Itahar, several rural HS schools still function from semi-pucca buildings. In terms of building infrastructure,
the position of urban schools in Uttar Dinajpur is not fundamentally better. Nearly 4 out of every 10
primary and upper primary schools, 17 percent of urban secondary schools and 10 percent HS schools still
function from semi-pucca accommodation. Nearly 40 percent of the urban schools at all levels with
permanent buildings are located in Raiganj municipality, while around 20 percent each are located at
Islampur and Kaliaganj. The rest of the pucca schools are distributed in the census towns of Kasba and
Nachhratpur-Katabari, which are outward extensions of the city, and the smaller municipality at Dalkhola.
Somewhat paradoxically, however, the AISES data also reveal that Hemtabad which was the most literate
block in the district in 2001 had 24 primary schools (28% of the total number) running under the open sky.
A total of 44 primary schools in Uttar Dinajpur came under this category, which were scattered through all
blocks other than Chopra, Goalpokhar-2 and Karandighi. In a district like Uttar Dinajpur which hitherto
had low literacy and educational achievements, this in itself is not necessarily a bad statistic. Rather, the
example of Chopra and Itahar where the majority of primary schools function from semi-pucca
accommodation, or Hemtabad where 8 out of every 10 primary schools function either in semi-pucca
accommodation or under the open sky basically proves the point that rising literacy generates a parallel
demand for education which must be met by creating new avenues for raising school enrolment. The
solutions attempted in these blocks are far from ideal, if viewed against the interests of quality education.
However, better solutions can only be found if there is a serious effort by the state to rectify the existing
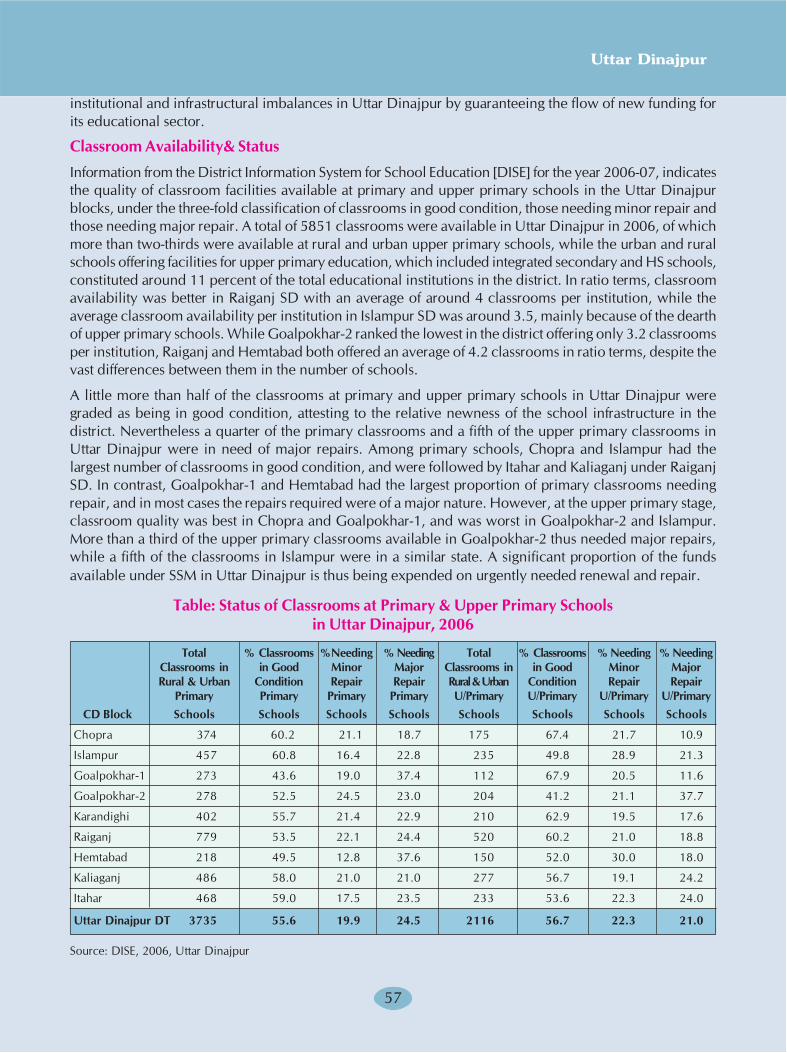
5757
Uttar Dinajpur
institutional and infrastructural imbalances in Uttar Dinajpur by guaranteeing the flow of new funding for
its educational sector.
Classroom Availability& Status
Information from the District Information System for School Education [DISE] for the year 2006-07, indicates
the quality of classroom facilities available at primary and upper primary schools in the Uttar Dinajpur
blocks, under the three-fold classification of classrooms in good condition, those needing minor repair and
those needing major repair. A total of 5851 classrooms were available in Uttar Dinajpur in 2006, of which
more than two-thirds were available at rural and urban upper primary schools, while the urban and rural
schools offering facilities for upper primary education, which included integrated secondary and HS schools,
constituted around 11 percent of the total educational institutions in the district. In ratio terms, classroom
availability was better in Raiganj SD with an average of around 4 classrooms per institution, while the
average classroom availability per institution in Islampur SD was around 3.5, mainly because of the dearth
of upper primary schools. While Goalpokhar-2 ranked the lowest in the district offering only 3.2 classrooms
per institution, Raiganj and Hemtabad both offered an average of 4.2 classrooms in ratio terms, despite the
vast differences between them in the number of schools.
A little more than half of the classrooms at primary and upper primary schools in Uttar Dinajpur were
graded as being in good condition, attesting to the relative newness of the school infrastructure in the
district. Nevertheless a quarter of the primary classrooms and a fifth of the upper primary classrooms in
Uttar Dinajpur were in need of major repairs. Among primary schools, Chopra and Islampur had the
largest number of classrooms in good condition, and were followed by Itahar and Kaliaganj under Raiganj
SD. In contrast, Goalpokhar-1 and Hemtabad had the largest proportion of primary classrooms needing
repair, and in most cases the repairs required were of a major nature. However, at the upper primary stage,
classroom quality was best in Chopra and Goalpokhar-1, and was worst in Goalpokhar-2 and Islampur.
More than a third of the upper primary classrooms available in Goalpokhar-2 thus needed major repairs,
while a fifth of the classrooms in Islampur were in a similar state. A significant proportion of the funds
available under SSM in Uttar Dinajpur is thus being expended on urgently needed renewal and repair.
Table: Status of Classrooms at Primary & Upper Primary Schools
in Uttar Dinajpur, 2006
Total % Classrooms %Needing % Needing Total % Classrooms % Needing % Needing
Classrooms in in Good Minor Major Classrooms in in Good Minor Major
Rural & Urban Condition Repair Repair Rural & Urban Condition Repair Repair
Primary Primary Primary Primary U/Primary U/Primary U/Primary U/Primary
CD Block Schools Schools Schools Schools Schools Schools Schools Schools
Chopra 374 60.2 21.1 18.7 175 67.4 21.7 10.9
Islampur 457 60.8 16.4 22.8 235 49.8 28.9 21.3
Goalpokhar-1 273 43.6 19.0 37.4 112 67.9 20.5 11.6
Goalpokhar-2 278 52.5 24.5 23.0 204 41.2 21.1 37.7
Karandighi 402 55.7 21.4 22.9 210 62.9 19.5 17.6
Raiganj 779 53.5 22.1 24.4 520 60.2 21.0 18.8
Hemtabad 218 49.5 12.8 37.6 150 52.0 30.0 18.0
Kaliaganj 486 58.0 21.0 21.0 277 56.7 19.1 24.2
Itahar 468 59.0 17.5 23.5 233 53.6 22.3 24.0
Uttar Dinajpur DT 3735 55.6 19.9 24.5 2116 56.7 22.3 21.0
Source: DISE, 2006, Uttar Dinajpur
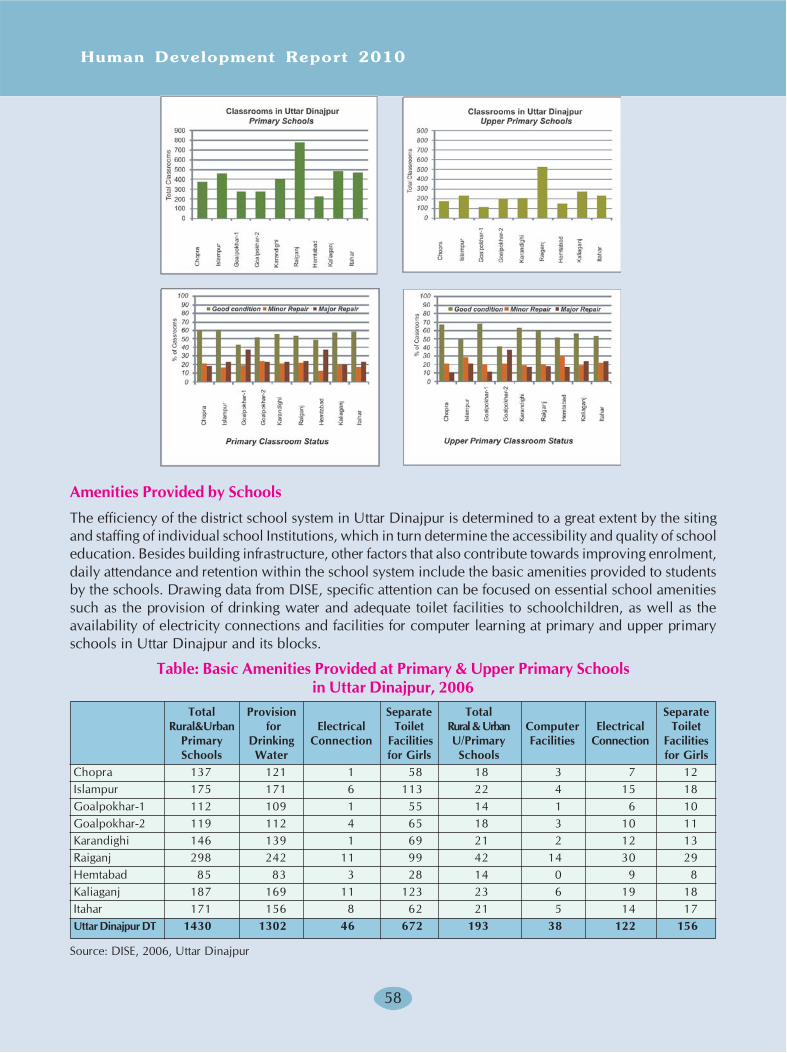
Human Development Report 2010
58
Amenities Provided by Schools
The efficiency of the district school system in Uttar Dinajpur is determined to a great extent by the siting
and staffing of individual school Institutions, which in turn determine the accessibility and quality of school
education. Besides building infrastructure, other factors that also contribute towards improving enrolment,
daily attendance and retention within the school system include the basic amenities provided to students
by the schools. Drawing data from DISE, specific attention can be focused on essential school amenities
such as the provision of drinking water and adequate toilet facilities to schoolchildren, as well as the
availability of electricity connections and facilities for computer learning at primary and upper primary
schools in Uttar Dinajpur and its blocks.
Table: Basic Amenities Provided at Primary & Upper Primary Schools
in Uttar Dinajpur, 2006
Total Provision Separate Total Separate
Rural&Urban for Electrical Toilet Rural & Urban Computer Electrical Toilet
Primary Drinking Connection Facilities U/Primary Facilities Connection Facilities
Schools Water for Girls Schools for Girls
Chopra 137 121 1 58 18 3 7 12
Islampur 175 171 6 113 22 4 15 18
Goalpokhar-1 112 109 1 55 14 1 6 10
Goalpokhar-2 119 112 4 65 18 3 10 11
Karandighi 146 139 1 69 21 2 12 13
Raiganj 298 242 11 99 42 14 30 29
Hemtabad 85 83 3 28 14 0 9 8
Kaliaganj 187 169 11 123 23 6 19 18
Itahar 171 156 8 62 21 5 14 17
Uttar Dinajpur DT 1430 1302 46 672 193 38 122 156
Source: DISE, 2006, Uttar Dinajpur
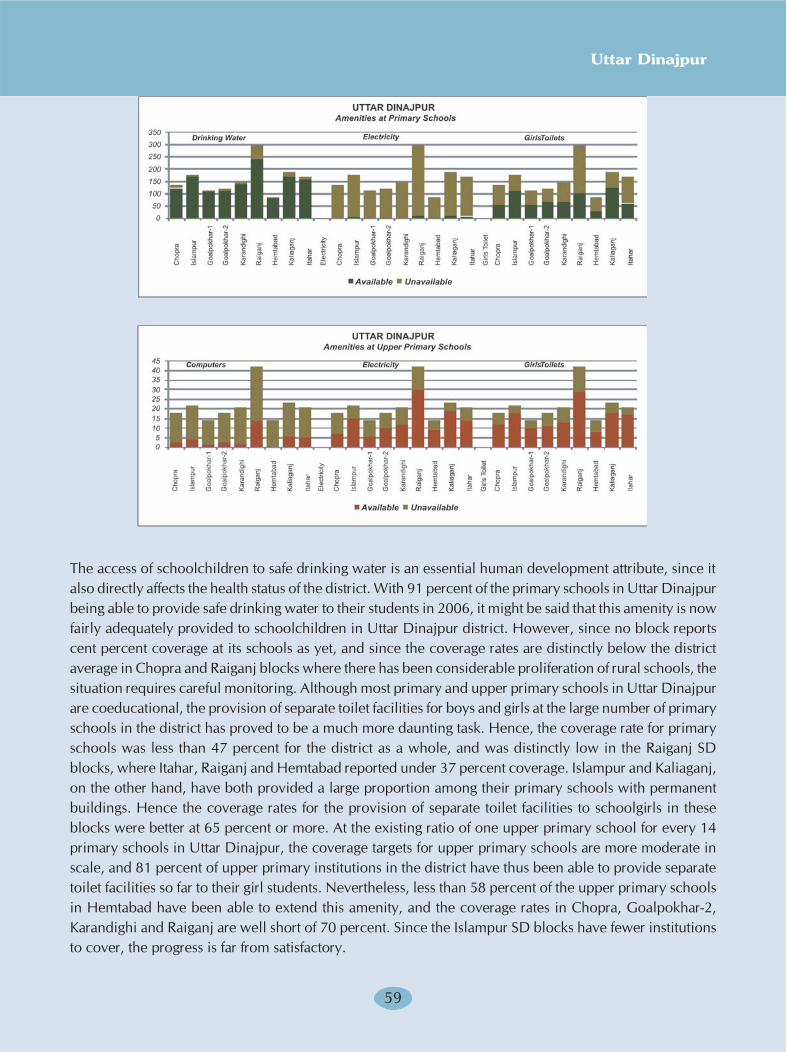
5959
Uttar Dinajpur
The access of schoolchildren to safe drinking water is an essential human development attribute, since it
also directly affects the health status of the district. With 91 percent of the primary schools in Uttar Dinajpur
being able to provide safe drinking water to their students in 2006, it might be said that this amenity is now
fairly adequately provided to schoolchildren in Uttar Dinajpur district. However, since no block reports
cent percent coverage at its schools as yet, and since the coverage rates are distinctly below the district
average in Chopra and Raiganj blocks where there has been considerable proliferation of rural schools, the
situation requires careful monitoring. Although most primary and upper primary schools in Uttar Dinajpur
are coeducational, the provision of separate toilet facilities for boys and girls at the large number of primary
schools in the district has proved to be a much more daunting task. Hence, the coverage rate for primary
schools was less than 47 percent for the district as a whole, and was distinctly low in the Raiganj SD
blocks, where Itahar, Raiganj and Hemtabad reported under 37 percent coverage. Islampur and Kaliaganj,
on the other hand, have both provided a large proportion among their primary schools with permanent
buildings. Hence the coverage rates for the provision of separate toilet facilities to schoolgirls in these
blocks were better at 65 percent or more. At the existing ratio of one upper primary school for every 14
primary schools in Uttar Dinajpur, the coverage targets for upper primary schools are more moderate in
scale, and 81 percent of upper primary institutions in the district have thus been able to provide separate
toilet facilities so far to their girl students. Nevertheless, less than 58 percent of the upper primary schools
in Hemtabad have been able to extend this amenity, and the coverage rates in Chopra, Goalpokhar-2,
Karandighi and Raiganj are well short of 70 percent. Since the Islampur SD blocks have fewer institutions
to cover, the progress is far from satisfactory.
Human Development Report 2010
60
Provision of electricity connections to the scattered network of rural primary schools however presents a
major challenge in Uttar Dinajpur, where less than 13 percent of the rural households had received domestic
electricity connections till 2005 against 25 percent for West Bengal as a whole. Under the relaxed norms
used earlier, a village was deemed to have been electrified if power lines had reached its revenue boundaries,
regardless of whether the necessary transmission and distribution equipment had been installed and power
was actually being drawn or not. Even with these old norms, rural electrification rates for the Uttar Dinajpur
villages had touched 93 percent in 2004, with Islampur SD recording less than 90 percent village
electrification against 97 percent for the Raiganj SD villages. Although, as a border district, Uttar Dinajpur
has been brought under the intensive village electrification programme of the Rajiv Gandhi Grameen
Vidyutikaran Yojana [RGGVY] since 2005, little progress has been achieved so far on the ground.
Thus through the entire district, only 42 out of the 1460 primary schools had received electricity connections
till 2006, at a coverage rate of just over 3 percent. While Kaliaganj and Itahar were nominally better placed
with their coverage at 5-6 percent, the three Islampur SD blocks of Karandighi, Goalpokhar-1 and Chopra
lagged far behind with coverage rates that had not even touched 1 percent. Once again, with fewer
institutions to be covered, 122 out of 193 upper primary schools in Uttar Dinajpur had received electricity
connections till 2006, at a coverage rate of 63 percent for the district, indicating that their electricity needs
were being prioritised. Kaliaganj led the other blocks with electrification of 83 percent of its institutions,
followed by Raiganj with 71 percent. The other Raiganj SD blocks too did better than the district average.
Among the upper primary schools in Islampur SD, in contrast, only those in Islampur block exceeded the
district average with a coverage rate of 68 percent. Chopra and Goalpokhar-2 were once again left far
behind with coverage of barely 40 percent of their upper primary institutions.
In the absence of adequate electrical connectivity, the introduction of computer learning at rural schools in
the district is still a far cry. Through Uttar Dinajpur as a whole, 38 out of 193 upper primary schools
reported having computer facilities, at a coverage rate of less than 20 percent for the district, with 14 of
these institutions being located at Raiganj. Exceedingly low computerisation rates were reported throughout
the Islampur SD blocks, with Goalpokhar-1 and Karandighi placed extremely far behind. As already observed,
Uttar Dinajpur suffers from serious institutional deficiencies in its network of upper primary schools,
which effectively halts the education of a large number of rural children. To bridge this institutional gap,
greater numbers of new upper primary schools will have to be established in Uttar Dinajpur's remote
border villages, which will also need intensive electrification if electrical connections are to be adequately
provided to these schools. The introduction of computer education at rural upper primary schools is an
important short term educational objective in itself, since it can enable rural students to cross the threshold
into the modern professions. So far, less than one out of every five upper primary school institutions in the
district is in a position to provide computer facilities even for office purposes, and most of those that can
are located either at urban or at semi-urban settlements. Universalisation of computer education at schools
thus requires careful coordination of rural electrification and educational planning in Uttar Dinajpur, to be
implemented according to a strictly time-bound schedule.
School Staffing Patterns
The general overview of the existing district school system in Uttar Dinajpur provided through the
accompanying charts, using data from the 7th AISES 2002, gives a clear picture of the existing regional
imbalances within the education sector in Uttar Dinajpur. Thus, with approximately 37 percent of the
district population, Raiganj SD accounts for 52 percent of the schools and 50 percent of the school teachers
in Uttar Dinajpur and has a student enrolment equivalent to 61 percent of the total school enrolments in
the district. On the other hand, with a subdivisional population that is nearly twice as large as that in

6161
Uttar Dinajpur
Raiganj SD, Islampur SD has 58 percent of the schools and 50 percent of the teachers, enrolling around 40
percent of the school students in the district. In terms of institutional and teaching strength, primary, secondary
and HS education is more developed in Raiganj SD. However, Islampur SD has a larger proportion of the
upper primary institutions and teachers and also surpasses Raiganj SD in terms of primary and upper
primary enrolments. Thereafter, the focus shifts to Raiganj SD during the secondary and HS stages. With
the majority of the secondary and HS schools located within the subdivision, Raiganj SD accounts for
about 58 percent of the aggregate student enrolments at these higher stages. Most strikingly, Raiganj SD has
64 percent of the primary teachers in Uttar Dinajpur and also has 57 percent of secondary teachers and 60
percent of the HS teachers. Consequently, the average teaching strength per institution in Raiganj SD
substantially exceeds that in Islampur SD at the primary, upper primary and HS stages.
OVERVIEW OF THE DISTRICT SCHOOL SYSTEM IN UTTAR DINAJPUR
Chopra ; 152
Islampur ; 166
Goalpokhar 1 ; 127Goalpokhar 2 ; 138
Karandighi ; 155
Raiganj ; 268
Hemtabad ; 99
Kaliaganj ; 180
Itahar ; 189
Islampur M; 32
Dalkhola M; 14
Raiganj M; 56
Nachh-Katabari CT; 6
Kasba CT; 10
Kaliaganj M; 30
Uttar Dinajpur District School System 2002
0
50
100
150
200
250
300
Chop
ra
Isla
mpu
r
Goa
lpok
har 1
Goa
lpok
har 2
Kara
ndig
hi
Raig
anj
Hem
taba
d
Kalia
ganj
Itah
ar
Isla
mpu
r M
Dal
khol
a M
Raig
anj M
Nac
hh-K
atab
ari C
T
Kasb
a CT
Kalia
ganj
M
HS
Secondary
U/Primary
Primary
Uttar Dinajpur 2002Stage-wise School Institutions
Uttar Dinajpur 2002Stage-wise School Institutions
Chopra ; 49329
Islampur ; 47189
Goalpokhar 1 ; 27676Goalpokhar 2 ; 38438
Karandighi ; 44702
Raiganj ; 71426
Hemtabad ; 31000
Kaliaganj ; 44690
Itahar ; 49252
Islampur M; 12023
Dalkhola M; 6141
Raiganj M; 15648Nachh-Katabari CT;
1030Kasba CT; 4646
Kaliaganj M; 9461
Uttar Dinajpur School Enrolments 2002
0
10000
20000
30000
40000
50000
60000
70000
80000
Chop
ra
Isla
mpu
r
Goa
lpok
har 1
Goa
lpok
har 2
Kara
ndig
hi
Raig
anj
Hem
taba
d
Kalia
ganj
Itah
ar
Isla
mpu
r M
Dal
khol
a M
Raig
anj M
Nac
hh-K
atab
ari C
T
Kasb
a CT
Kalia
ganj
M
HS
Secondary
U/Primary
Primary
Uttar Dinajpur 2002Stage-wise School Enrolments
Chopra ; 391
Islampur ; 398
Goalpokhar 1 ; 319
Goalpokhar 2 ; 431Karandighi ; 493
Raiganj ; 1048
Hemtabad ; 431
Kaliaganj ; 694
Itahar ; 710Islampur M; 250
Dalkhola M; 82
Raiganj M; 435
Nachh-Katabari CT; 22
Kasba CT; 94
Kaliaganj M; 254
Uttar Dinajpur School Teachers 2002
0
200
400
600
800
1000
1200
Chop
ra
Isla
mpu
r
Goa
lpok
har 1
Goa
lpok
har 2
Kara
ndig
hi
Raig
anj
Hem
taba
d
Kalia
ganj
Itah
ar
Isla
mpu
r M
Dal
khol
a M
Raig
anj M
Nac
hh-K
atab
ari C
T
Kasb
a CT
Kalia
ganj
M
HS
Secondary
U/Primary
Primary
Uttar Dinajpur 2002Stage-wise School Staffing
, ,
,,
, ,
Human Development Report 2010
62
A more detailed analysis of current school staffing patterns in Uttar Dinajpur can be made using DISE data
for the reference year 2006 relating to the elementary school system, i.e. primary and upper primary school
institutions. On an average, every upper primary school in Uttar Dinajpur serves a catchment of 7.4 primary
schools. With more upper primary schools being located in the urban areas, each urban primary school
serves a smaller catchment of 3.3 schools on the average. Each rural upper primary school, on the other
hand, has to cater to a catchment of 8.2 primary schools on the average. With access to upper primary
education being better in Raiganj SD, the ratio of primary to upper primary students is uniformly less than
2 in all the Raiganj SD blocks. In the Islampur SD blocks, on the other hand, this ratio varies from 2.4 in
Karandighi to 4.4 in Islampur block, indicating that much higher enrolment pressure now falls on upper
primary schools in this subdivision. On an average, primary teachers outnumber upper primary teachers in
the ratio 1.7:1 in Uttar Dinajpur. However in all municipal towns except Dalkola, upper primary teachers
outnumber primary teachers by a considerable proportion, as a consequence of which there is much lower
staffing at rural primary schools throughout the district. As the ratio-analysis shows, staffing levels at primary
and upper primary schools are much higher in the Raiganj SD blocks compared to those in Islampur SD. At
urban schools, they rise even more strikingly in Islampur and Kaliaganj municipalities. The impact is felt
ultimately at primary schools in blocks like Goalpokhar-1 and Golapokhar-2 where distinctly lower staffing
ratios prevail. Ultimately, the impact is felt in terms of a decline in the quality of instruction in these
backward blocks.
Appointment of women teachers in adequate numbers to teach younger children is a well-tested way of
enhancing primary enrolments and learner retention. Instruction by women teachers is also known to
lower dropout rates throughout the primary school system. At all rural primary schools in Uttar Dinajpur,
however, the presence of women teachers still remains conspicuously low. In the Islampur SD blocks,
where male primary teachers outnumber female primary teachers in the ratio 9:1, the staffing patterns are
particularly gender adverse. In fact, only Raiganj and Kaliaganj municipalities record a more favourable
gender position at their urban primary schools. In all, the 1776 women teachers serving at primary and
upper primary schools in Uttar Dinajpur in 2006 thus constituted just below one-fourth of the total staff-
strength of 7370 teachers in the district elementary school system. As a result of the marked trend towards
deploying them largely in urban postings, they constituted 57 percent of the staff-strength at urban primary
schools and 49 percent at urban upper primary schools. At rural schools, their presence was under 20
percent in both primary and upper primary schools. While Raiganj municipality and the surrounding
Raiganj block area accounted for a third of the women teachers serving in the district, they also had a larger
presence in the neighbouring Raiganj SD blocks of Kaliaganj, Hemtabad and Itahar, as well as in Karandighi,
all of which are within commuting distance of Raiganj town. Hence, besides the fact that there is insufficient
recruitment of women teachers, the other major problem relates to their deployment.
Table: Structure of the Elementary Education System in Uttar Dinajpur, 2006
Total Total Male Female Total Total Total Male Female Total
Primary Primary Primary Primary Primary Upper Upper Upper Upper Upper
Schools Teachers Teachers Students Students Primary Primary Primary Primary Primary
CD Block/Town Schools Teachers Teachers Teachers Students
Chopra 137 405 371 34 39710 17 243 183 60 15436
Islampur 157 456 408 48 39728 15 161 124 37 9094
Goalpokhar-1 112 285 269 16 27837 14 137 111 26 8353
Goalpokhar-2 119 307 278 29 31603 18 206 171 35 12270
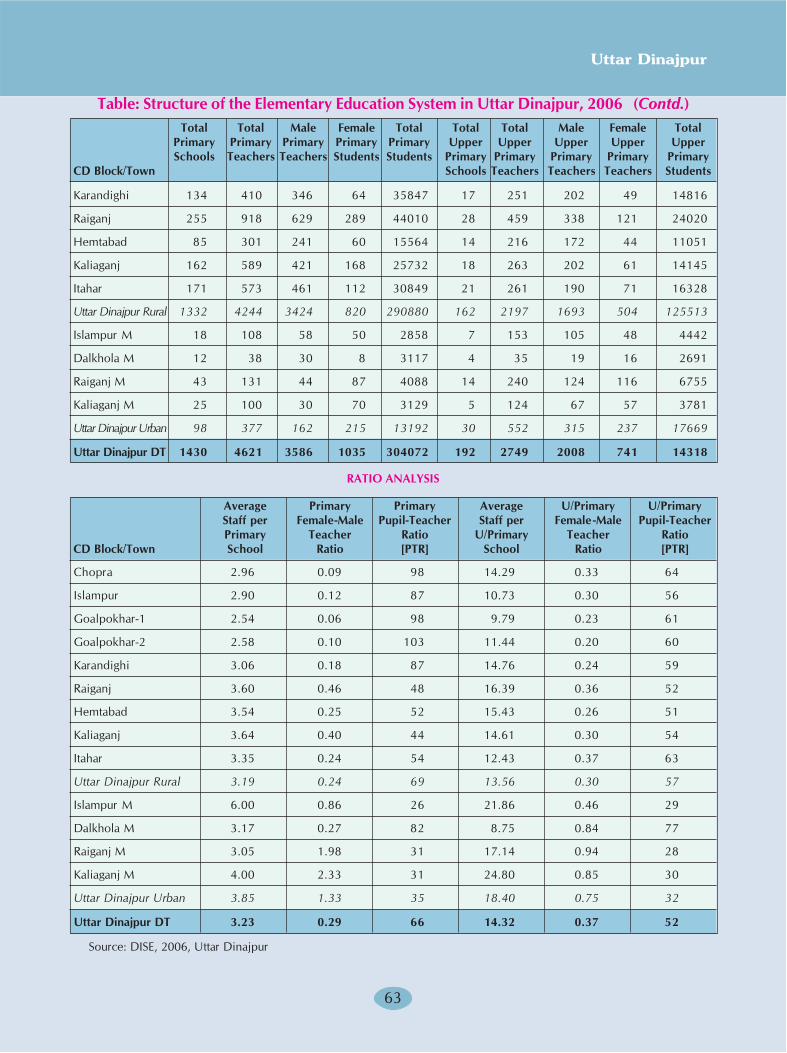
6363
Uttar Dinajpur
Karandighi 134 410 346 64 35847 17 251 202 49 14816
Raiganj 255 918 629 289 44010 28 459 338 121 24020
Hemtabad 85 301 241 60 15564 14 216 172 44 11051
Kaliaganj 162 589 421 168 25732 18 263 202 61 14145
Itahar 171 573 461 112 30849 21 261 190 71 16328
Uttar Dinajpur Rural 1332 4244 3424 820 290880 162 2197 1693 504 125513
Islampur M 18 108 58 50 2858 7 153 105 48 4442
Dalkhola M 12 38 30 8 3117 4 35 19 16 2691
Raiganj M 43 131 44 87 4088 14 240 124 116 6755
Kaliaganj M 25 100 30 70 3129 5 124 67 57 3781
Uttar Dinajpur Urban 98 377 162 215 13192 30 552 315 237 17669
Uttar Dinajpur DT 1430 4621 3586 1035 304072 192 2749 2008 741 14318
RATIO ANALYSIS
Average Primary Primary Average U/Primary U/Primary
Staff per Female-Male Pupil-Teacher Staff per Female -Male Pupil-Teacher
Primary Teacher Ratio U/Primary Teacher Ratio
CD Block/Town School Ratio [PTR] School Ratio [PTR]
Chopra 2.96 0.09 98 14.29 0.33 64
Islampur 2.90 0.12 87 10.73 0.30 56
Goalpokhar-1 2.54 0.06 98 9.79 0.23 61
Goalpokhar-2 2.58 0.10 103 11.44 0.20 60
Karandighi 3.06 0.18 87 14.76 0.24 59
Raiganj 3.60 0.46 48 16.39 0.36 52
Hemtabad 3.54 0.25 52 15.43 0.26 51
Kaliaganj 3.64 0.40 44 14.61 0.30 54
Itahar 3.35 0.24 54 12.43 0.37 63
Uttar Dinajpur Rural 3.19 0.24 69 13.56 0.30 57
Islampur M 6.00 0.86 26 21.86 0.46 29
Dalkhola M 3.17 0.27 82 8.75 0.84 77
Raiganj M 3.05 1.98 31 17.14 0.94 28
Kaliaganj M 4.00 2.33 31 24.80 0.85 30
Uttar Dinajpur Urban 3.85 1.33 35 18.40 0.75 32
Uttar Dinajpur DT 3.23 0.29 66 14.32 0.37 52
Source: DISE, 2006, Uttar Dinajpur
Total Total Male Female Total Total Total Male Female Total
Primary Primary Primary Primary Primary Upper Upper Upper Upper Upper
Schools Teachers Teachers Students Students Primary Primary Primary Primary Primary
CD Block/Town Schools Teachers Teachers Teachers Students
Table: Structure of the Elementary Education System in Uttar Dinajpur, 2006 (Contd.)
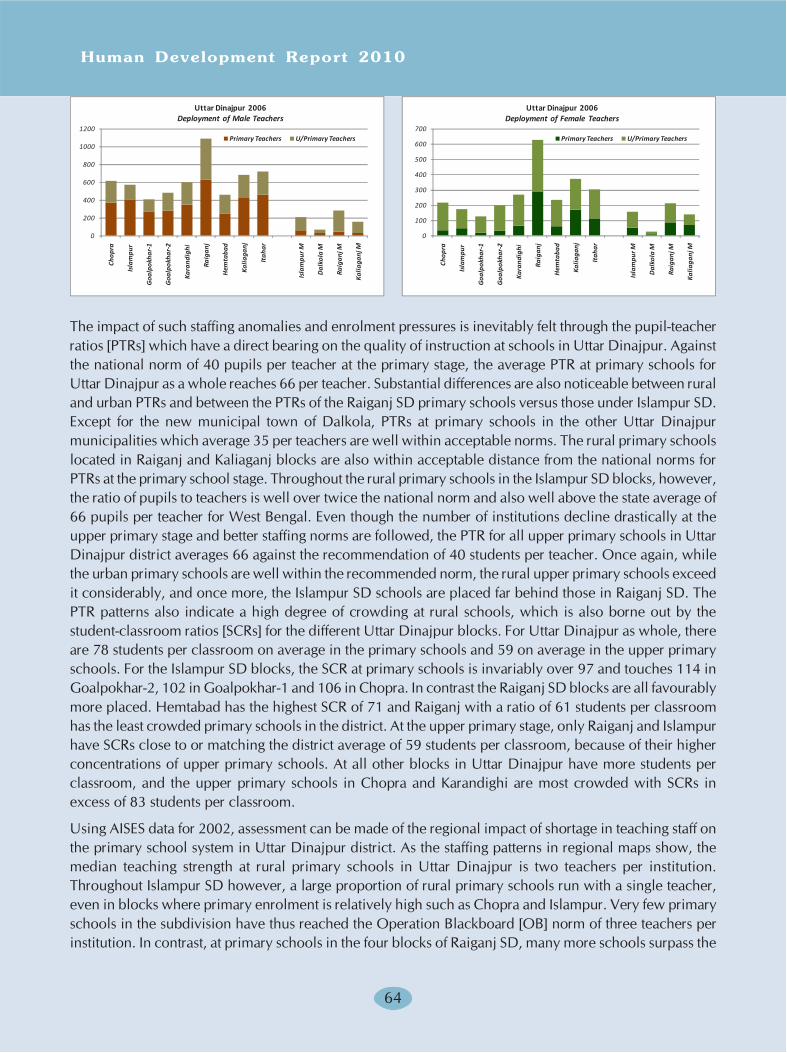
Human Development Report 2010
64
The impact of such staffing anomalies and enrolment pressures is inevitably felt through the pupil-teacher
ratios [PTRs] which have a direct bearing on the quality of instruction at schools in Uttar Dinajpur. Against
the national norm of 40 pupils per teacher at the primary stage, the average PTR at primary schools for
Uttar Dinajpur as a whole reaches 66 per teacher. Substantial differences are also noticeable between rural
and urban PTRs and between the PTRs of the Raiganj SD primary schools versus those under Islampur SD.
Except for the new municipal town of Dalkola, PTRs at primary schools in the other Uttar Dinajpur
municipalities which average 35 per teachers are well within acceptable norms. The rural primary schools
located in Raiganj and Kaliaganj blocks are also within acceptable distance from the national norms for
PTRs at the primary school stage. Throughout the rural primary schools in the Islampur SD blocks, however,
the ratio of pupils to teachers is well over twice the national norm and also well above the state average of
66 pupils per teacher for West Bengal. Even though the number of institutions decline drastically at the
upper primary stage and better staffing norms are followed, the PTR for all upper primary schools in Uttar
Dinajpur district averages 66 against the recommendation of 40 students per teacher. Once again, while
the urban primary schools are well within the recommended norm, the rural upper primary schools exceed
it considerably, and once more, the Islampur SD schools are placed far behind those in Raiganj SD. The
PTR patterns also indicate a high degree of crowding at rural schools, which is also borne out by the
student-classroom ratios [SCRs] for the different Uttar Dinajpur blocks. For Uttar Dinajpur as whole, there
are 78 students per classroom on average in the primary schools and 59 on average in the upper primary
schools. For the Islampur SD blocks, the SCR at primary schools is invariably over 97 and touches 114 in
Goalpokhar-2, 102 in Goalpokhar-1 and 106 in Chopra. In contrast the Raiganj SD blocks are all favourably
more placed. Hemtabad has the highest SCR of 71 and Raiganj with a ratio of 61 students per classroom
has the least crowded primary schools in the district. At the upper primary stage, only Raiganj and Islampur
have SCRs close to or matching the district average of 59 students per classroom, because of their higher
concentrations of upper primary schools. At all other blocks in Uttar Dinajpur have more students per
classroom, and the upper primary schools in Chopra and Karandighi are most crowded with SCRs in
excess of 83 students per classroom.
Using AISES data for 2002, assessment can be made of the regional impact of shortage in teaching staff on
the primary school system in Uttar Dinajpur district. As the staffing patterns in regional maps show, the
median teaching strength at rural primary schools in Uttar Dinajpur is two teachers per institution.
Throughout Islampur SD however, a large proportion of rural primary schools run with a single teacher,
even in blocks where primary enrolment is relatively high such as Chopra and Islampur. Very few primary
schools in the subdivision have thus reached the Operation Blackboard [OB] norm of three teachers per
institution. In contrast, at primary schools in the four blocks of Raiganj SD, many more schools surpass the
0
200
400
600
800
1000
1200
Chop
ra
Isla
mpu
r
Goa
lpok
har-
1
Goa
lpok
har-
2
Kara
ndig
hi
Raig
anj
Hem
taba
d
Kalia
ganj
Itah
ar
Isla
mpu
r M
Dal
kola
M
Raig
anj M
Kalia
ganj
M
Primary Teachers U/Primary Teachers
Uttar Dinajpur 2006Deployment of Male Teachers
0
100
200
300
400
500
600
700
Chop
ra
Isla
mpu
r
Goa
lpok
har-
1
Goa
lpok
har-
2
Kara
ndig
hi
Raig
anj
Hem
taba
d
Kalia
ganj
Itah
ar
Isla
mpu
r M
Dal
kola
M
Raig
anj M
Kalia
ganj
M
Primary Teachers U/Primary Teachers
Uttar Dinajpur 2006Deployment of Female Teachers
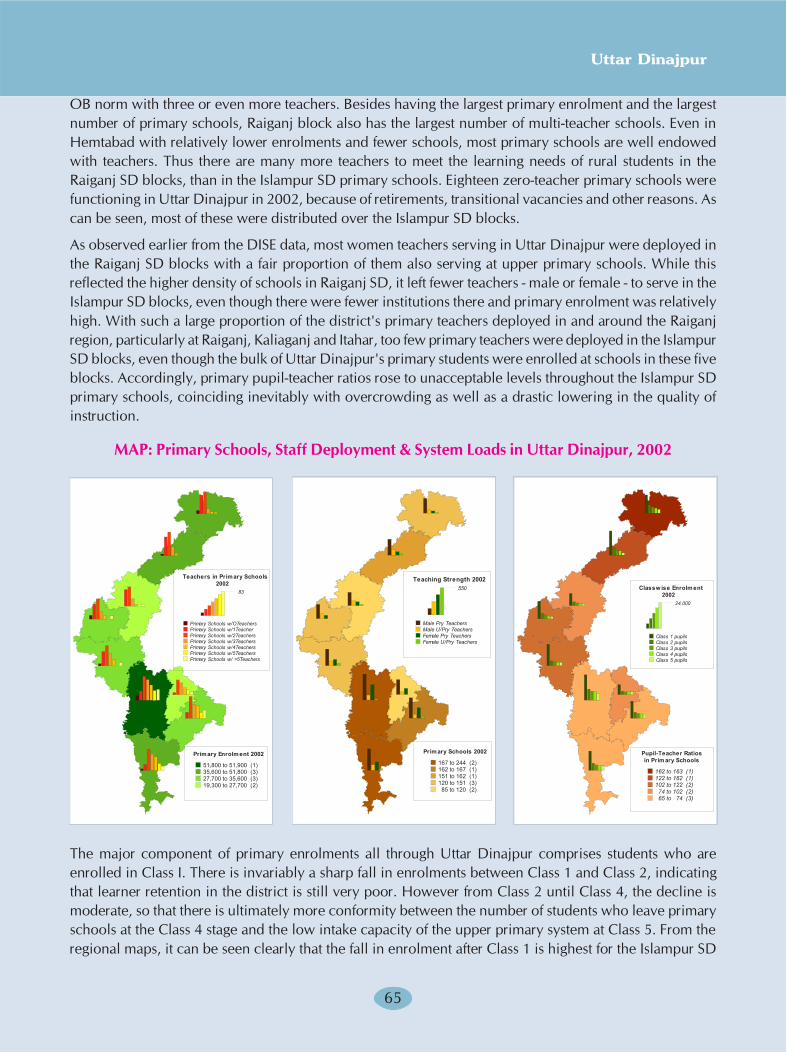
6565
Uttar Dinajpur
OB norm with three or even more teachers. Besides having the largest primary enrolment and the largest
number of primary schools, Raiganj block also has the largest number of multi-teacher schools. Even in
Hemtabad with relatively lower enrolments and fewer schools, most primary schools are well endowed
with teachers. Thus there are many more teachers to meet the learning needs of rural students in the
Raiganj SD blocks, than in the Islampur SD primary schools. Eighteen zero-teacher primary schools were
functioning in Uttar Dinajpur in 2002, because of retirements, transitional vacancies and other reasons. As
can be seen, most of these were distributed over the Islampur SD blocks.
As observed earlier from the DISE data, most women teachers serving in Uttar Dinajpur were deployed in
the Raiganj SD blocks with a fair proportion of them also serving at upper primary schools. While this
reflected the higher density of schools in Raiganj SD, it left fewer teachers - male or female - to serve in the
Islampur SD blocks, even though there were fewer institutions there and primary enrolment was relatively
high. With such a large proportion of the district's primary teachers deployed in and around the Raiganj
region, particularly at Raiganj, Kaliaganj and Itahar, too few primary teachers were deployed in the Islampur
SD blocks, even though the bulk of Uttar Dinajpur's primary students were enrolled at schools in these five
blocks. Accordingly, primary pupil-teacher ratios rose to unacceptable levels throughout the Islampur SD
primary schools, coinciding inevitably with overcrowding as well as a drastic lowering in the quality of
instruction.
MAP: Primary Schools, Staff Deployment & System Loads in Uttar Dinajpur, 2002
The major component of primary enrolments all through Uttar Dinajpur comprises students who are
enrolled in Class I. There is invariably a sharp fall in enrolments between Class 1 and Class 2, indicating
that learner retention in the district is still very poor. However from Class 2 until Class 4, the decline is
moderate, so that there is ultimately more conformity between the number of students who leave primary
schools at the Class 4 stage and the low intake capacity of the upper primary system at Class 5. From the
regional maps, it can be seen clearly that the fall in enrolment after Class 1 is highest for the Islampur SD
Primary Enrolment 2002
51,800 to 51,900 (1)35,600 to 51,800 (3)27,700 to 35,600 (3)19,300 to 27,700 (2)
Teachers in Primary Schools2002
83
Primary Schools w/OTeachersPrimary Schools w/1TeacherPrimary Schools w/2TeachersPrimary Schools w/3TeachersPrimary Schools w/4TeachersPrimary Schools w/5TeachersPrimary Schools w/ >5Teachers
Teaching Strength 2002550
Male Pry TeachersMale U/Pry TeachersFemale Pry TeachersFemale U/Pry Teachers
Primary Schools 2002
167 to 244 (2)162 to 167 (1)151 to 162 (1)120 to 151 (3)85 to 120 (2)
Classw ise Enrolm ent2002
24,000
Class 1 pupilsClass 2 pupilsClass 3 pupilsClass 4 pupilsClass 5 pupils
Pupil-Teacher Ratiosin Prim ary Schools
162 to 163 (1)122 to 162 (1)102 to 122 (2)
74 to 102 (2)65 to 74 (3)

Human Development Report 2010
66
blocks where the primary school PTRs are also very high. In Raiganj and its surrounding blocks, retention
levels are better than in Islampur SD schools. Besides the fact that there are more primary schools and less
crowding in these blocks, the other determining factor is obviously the high deployment of teachers at rural
primary schools. Although recent data from DISE report that the situation has improved somewhat and that
the PTRs in Islampur SD are not as high as they were before, a lot more needs to be done by way of
equitable teacher deployment between the two subdivisions if Uttar Dinajpur has to surmount its present
educational backwardness.
Madrasah Education in Uttar Dinajpur
Uttar Dinajpur has a sizeable Muslim population of over 11.5 lakh, which has grown significantly from
around 30 percent of the district population in 1951 to more than 47 percent currently. The northern
blocks of the district are Muslim dominated, with the share of Muslims in the combined population of
Chopra, Islampur, Goalpokhar-1 and Goalpokhar-2 blocks exceeding 67 percent. For the Muslim
community, traditional education has centred around madrasahs and maqtabs, both originally customary
institutions imparting instruction [Arabic: 'Dars'] in Arabic, Urdu and Persian, in addition to religious
instruction on the Quran Sharif and Hadith. With the setting up of the Calcutta Madrasah in 1780 (now a
Deemed University since 2008) at the instance of Warren Hastings, madrasah education in Bengal took a
new turn. Modification of the traditional Dars-i-Nizami system introduced at the Calcutta Madrasah added
instruction on subjects like Islamic jurisprudence to produce competently trained local officials who could
handle bureaucratic and legal matters for the East India Company. English was later introduced in lieu of
Persian under the reformed curriculum in 1890 at New Scheme madrasahs sponsored by the state, where
the course of instruction was also subdivided into two successive stages. The state-supported system of
madrasah education has since then been delivered through Junior High Madrasahs upto the Class 8 stage,
and upto the Alim or matriculation level and the Fazil or HS level through High Madrasahs. In addition,
Senior Madrasahs also exist which deliver instruction on the old Dars-i-Nizami pattern upto the Kamil or
graduate level and the Mumtazul Mohaddeseen [MM] or postgraduation level. While the traditional Dars-
i-Nizami curriculum had already incorporated several technical and vocational subjects including training
in Unani tibb or medicine, further reforms in the New System curriculum added instruction on mainstream
subjects like mathematics, geography and the social sciences.
Table: Madrasahs Recognised by the West Bengal Government in Uttar Dinajpur, 2006
Muslim % Muslims Recognised Recognised Recognised Students at
Population in Block Junior High High Senior Recognised
CD Block Population Madrasahs Madrasahs Madrasahs Madrasahs
Chopra 139023 62.3 - 1 1 1555
Islampur 171978 71.1 2 - - 659
Goalpokhar-1 185457 75.6 - - - -
Goalpokhar-2 139289 61.5 1 1 1 1800
Karandighi 157400 49.4 - 1 1 2650
Raiganj 118469 32.7 2 1 - 2402
Hemtabad 59698 50.2 1 1 1 1724
Kaliaganj 39334 20.7 1 - 1 893
Itahar 124876 50.0 2 1 - 1728
Uttar Dinajpur Rural 1135524 52.2 9 6 5 13411
Source: West Bengal Board of Madrasah Education & DISE, 2006, Uttar Dinajpur

6767
Uttar Dinajpur
�
�
��
��
��
��
��
��
������ ������ ������ ������ ������� ������� ��������� ��������
������ �� ����� '�� ��(���)" '�� ��(���)# *��������� +�����, �����-�� *� �����, ������
��������� ���� ��� ��������� ������ ���������
������� � �� ��� ������ ���� � ��
CD Block 1931-40 1941-50 1951-60 1961-70 1971-80 1981-90 1991-2000 2001-2004
Chopra - - 1 2 2 6 15 6
Islampur - 1 - - 1 - 3 -
Goalpokhar-1 - - - 1 - - - -
Goalpokhar-2 2 1 3 7 6 2 8 -
Karandighi - - - - 2 - 1 -
Raiganj - - - 1 1 - 1 -
Hemtabad - - - 1 2 - - -
Kaliaganj - - - 1 - 1 - -
Itahar - - - 1 3 - - -
Net Decadal Addition 2 2 4 13 17 9 28 6
Total Institutions 2 4 8 21 38 47 75 81
Recognised Madrasahs - - - 4 15 17 18 20
Khariji Madrasahs 2 4 8 17 23 30 57 61
Source: DISE, 2006, Uttar Dinajpur
After the passing of the West Bengal Board of Madrasah Education Act in 1994, madrasah education in the
state gained autonomous standing, with all affairs relating to affiliation and academic supervision of state-
recognised madrasahs vesting with the WBBME. West Bengal was in fact the first Indian state to do so and
the WBBME Act has become the model for similar legislations in other states. Another important achievement
has been the establishment of an equivalence system under which students passing out from High Madrasahs
can join HS institutions affiliated to the West Bengal Board for Higher Secondary Education [WBBHSE] for
regular studies in the humanities stream. While this has gone a long way in mainstreaming madrasah
education in West Bengal, the current challenge is to induct more general stream subjects as well as the
sciences into the modernised curriculum to equip madrasah students with the skills necessary to compete
on par with other mainstream students for higher education and job opportunities. The recent report of the
Kidwai Committee has made several recommendations in this respect.

Human Development Report 2010
68
Table: Institutional Levels within the Madrasah System in Uttar Dinajpur, 2006
Jr High High High
Madrasahs Madrasahs Madrasahs
CD Blocks Class 1-12 Class 1-10 Class 1-4 Class 1-5 Class 1-8 Class 5-8 Class 5-10 Class 5-12
Recognised Madrasahs
Chopra - 1 - - - - - 1
Islampur - - - - - 2 - -
Goalpokhar-1 - - - - - - - -
Goalpokhar-2 - 1 - - - - 1 -
Karandighi - 1 - - - 1 - 1
Raiganj - - - - - 2 1 -
Hemtabad - 1 - - - 1 1 -
Kaliaganj 1 - - - - 1 - -
Itahar - - - - - 2 1 -
Unrecognised Khariji Maqtabs & Madrasahs
Chopra - - 25 3 1 1 - -
Islampur - - 1 2 - - - -
Goalpokhar-1 - - 14 - - - - -
Goalpokhar-2 - 1 19 4 3 - - -
Karandighi - - - - - - - -
Raiganj - - - - - - - -
Hemtabad - - - - - - - -
Kaliaganj - - - - - - - -
Itahar - - - - - 1 - -
Total Recognised Institutions 1 4 - - - 9 4 2
Total Unrecognised Institutions - 1 59 9 4 2 - -
Source: DISE, 2006, Uttar Dinajpur
0
10
20
30
40
50
60
70
80
90
1931-40 1941-50 1951-60 1961-70 1971-80 1981-90 1991-2000 2001-2004
Recognised Madrasahs Unrecognised or Khariji Madrasahs
Uttar Dinajpur 1931-2004Recognised versus Unrecognised Madrasahs
0
2
4
6
8
10
Class 1-4
Class 1-5
Class 1-8
Class 1-12
Class 1-10
Class 5-8
Class 5-10
Class 5-12
Itahar
Kaliaganj
Hemtabad
Raiganj
Karandighi
Goalpokhar-2
Goalpokhar-1
Islampur
Chopra
UTTAR DINAJPUR 2006Recognised Madrasahs by Type
0
10
20
30
40
50
60
70
Class 1-4
Class 1-5
Class 1-8
Class 1-12
Class 1-10
Class 5-8
Class 5-10
Class 5-12
Itahar
Kaliaganj
Hemtabad
Raiganj
Karandighi
Goalpokhar-2
Goalpokhar-1
Islampur
Chopra
UTTAR DINAJPUR 2006Unrecognised Maqtabs & Madrasahs by Type
6969
Uttar Dinajpur
The madrasah system has traditionally played a very important role in the spread of literacy and education
among the Muslim communities that reside within Uttar Dinajpur, and has received due recognition from
the Government with significant steps being taken to modernise this traditional system. With the exception
of Goalpokhar-1, all Uttar Dinajpur blocks have 2 or 3 state-recognised madrasahs which currently enrol
over 1 percent of the rural Muslim population in the district. Total funding support for the development of
madrasah education in the district in 2006 amounted to Rs.38.92 lakh, comprising Rs.38.21 lakh disbursed
to state-recognised madrasahs as development grants under DPEP/SSA programmes and Rs.0.71 lakh as
TLM grants for acquisition of teaching/learning materials. Except for the High Madrasahs at Rahatpur and
Bindol which function from rent-free public buildings, all recognised madrasahs are accommodated in
buildings constructed by the government. Of the 202 madrasah teachers in substantive service at the state-
recognised institutions in 2006, over 94 percent had graduate qualifications while 49 percent had also
subsequently received professional training.
The growth of recognised and unrecognised madrasahs in Uttar Dinajpur has more or less kept pace with
the rise in the Muslim population in the district, with the highest rates of growth being recorded in Chopra
and Goalpokhar-2 blocks in Islampur sub-division, as can be seen in the accompanying barchart. However,
while the growth rate of institutions in Goalpokhar-2 has been sustained since 1931, with minor dips
occurring during the 1980s and between 2001-04, the institutional growth rate in Chopra is of more recent
origin and is also much sharper. As the table shows, the growth of recognised madrasahs has been outstripped
by the growth of unrecognised or khariji institutions set up autonomously without Government support.
Although state support to recognised madrasahs commences at the Junior High (post-primary) stage, the
students enter these madrasahs through the large network of maqtabs and private khariji madrasahs that
spreads across the district. Traditionally, the primary tier of the madrasah education system has been
occupied by maqtabs and ibtedai (elementary) madrasahs which are supported by community or donor
funds. While instruction at the maqtabs located at the local mosques mainly centres around the reading of
Islamic texts and other religious matters, the ibtedai curriculum gradually introduces a wider variety of
subjects. In the absence of other local educational institutions, the maqtabs and elementary madrasahs are
often the only avenue through which children in Muslim dominated areas can secure a primary education.
When viewed in this light, the proliferation of khariji madrasah institutions through Chopra, Goalpokhar-
1 & 2 and Islampur blocks reflects the persisting shortfall of formal primary schools in Muslim dominated
areas, as well as the expectation that the community will meet its need for primary education from its own
resources without equivalent public investment. Thinking of this kind is in part responsible for the continuing
educational backwardness of the Muslim community in Uttar Dinajpur.
Enrolment, Educational Transition & School Drop-outs
The adverse ratio between primary and upper primary schools is a phenomenon also encountered in other
parts of the country, and therefore is not confined to Uttar Dinajpur alone. However in West Bengal,
where substantial expansion in primary education took place beginning from the late 1970s in the effort to
draw in more rural learners, the ratio has now turned highly adverse at an average of about 5.5 primary
institutions for every upper primary institution, according to DISE 2006. High variability exists between
rural and urban areas and between the districts. Thus, while in Purulia the ratio touched a high value of
8.4, it was lowest in Kolkata with 2.5 primary institutions for every upper primary institution, against the
current national norm of 2:1. As an educationally backward district, Uttar Dinajpur too had a highly
adverse ratio of 7.6 primary schools to every upper primary school according to DISE 2006, but with high
intradistrict variability indicated by the urban ratio of 3.3 against 8.2 in rural areas. Among the Uttar
Dinajpur blocks, the ratio ranged between a low of 6.1 in Hemtabad and a high of 10.5 in Islampur.
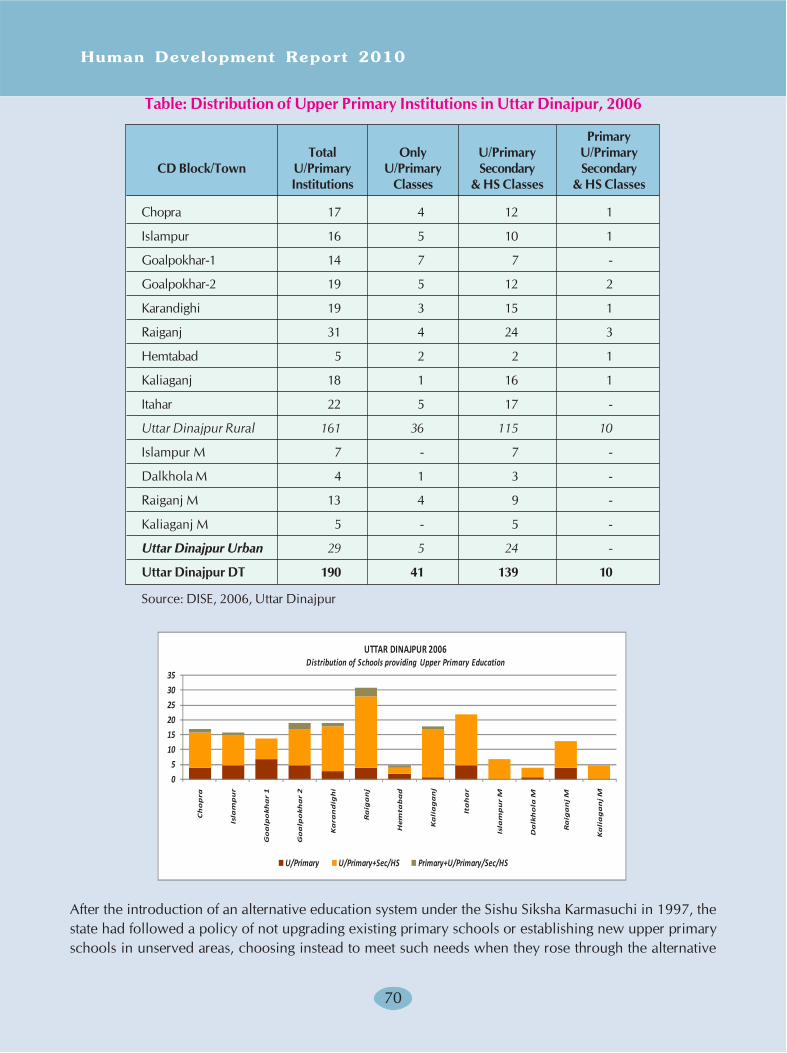
Human Development Report 2010
70
Table: Distribution of Upper Primary Institutions in Uttar Dinajpur, 2006
Primary
Total Only U/Primary U/Primary
CD Block/Town U/Primary U/Primary Secondary Secondary
Institutions Classes & HS Classes & HS Classes
Chopra 17 4 12 1
Islampur 16 5 10 1
Goalpokhar-1 14 7 7 -
Goalpokhar-2 19 5 12 2
Karandighi 19 3 15 1
Raiganj 31 4 24 3
Hemtabad 5 2 2 1
Kaliaganj 18 1 16 1
Itahar 22 5 17 -
Uttar Dinajpur Rural 161 36 115 10
Islampur M 7 - 7 -
Dalkhola M 4 1 3 -
Raiganj M 13 4 9 -
Kaliaganj M 5 - 5 -
Uttar Dinajpur Urban 29 5 24 -
Uttar Dinajpur DT 190 41 139 10
Source: DISE, 2006, Uttar Dinajpur
After the introduction of an alternative education system under the Sishu Siksha Karmasuchi in 1997, the
state had followed a policy of not upgrading existing primary schools or establishing new upper primary
schools in unserved areas, choosing instead to meet such needs when they rose through the alternative
0
5
10
15
20
25
30
35
Ch
op
ra
Isla
mp
ur
Go
alp
ok
ha
r 1
Go
alp
ok
ha
r 2
Ka
ran
dig
hi
Ra
iga
nj
He
mta
ba
d
Ka
lia
ga
nj
Ita
ha
r
Isla
mp
ur
M
Da
lkh
ola
M
Ra
iga
nj
M
Ka
lia
ga
nj
M
U/Primary U/Primary+Sec/HS Primary+U/Primary/Sec/HS
UTTAR DINAJPUR 2006Distribution of Schools providing Upper Primary Education
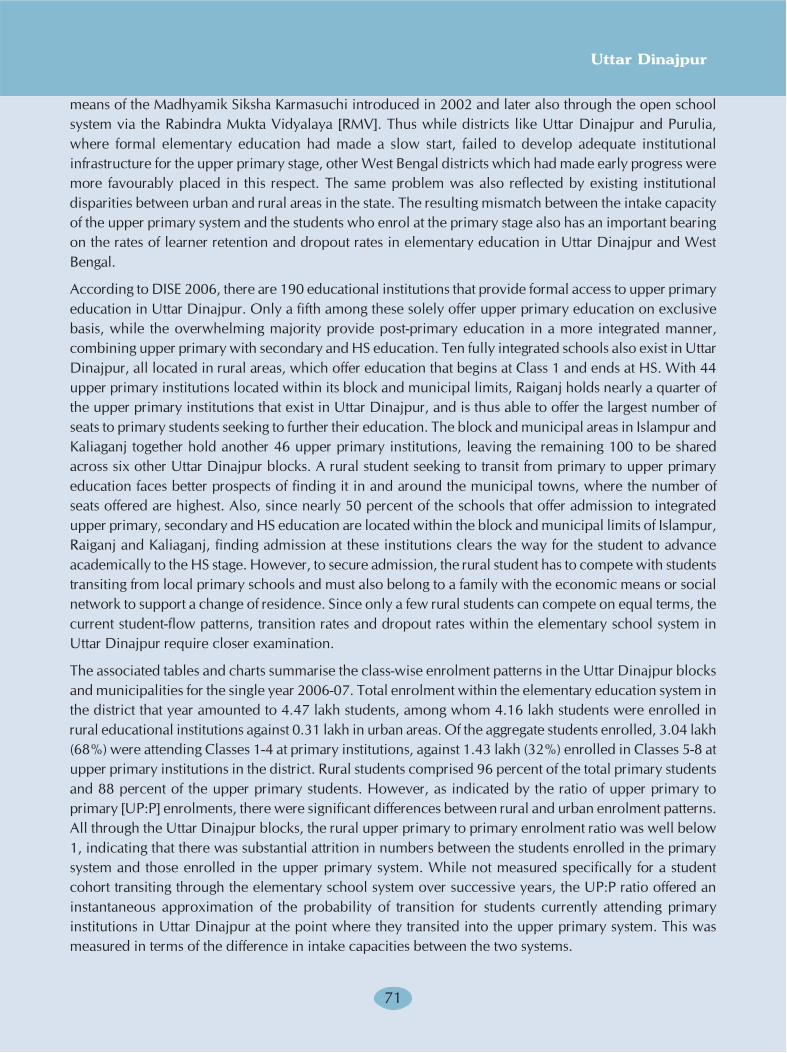
7171
Uttar Dinajpur
means of the Madhyamik Siksha Karmasuchi introduced in 2002 and later also through the open school
system via the Rabindra Mukta Vidyalaya [RMV]. Thus while districts like Uttar Dinajpur and Purulia,
where formal elementary education had made a slow start, failed to develop adequate institutional
infrastructure for the upper primary stage, other West Bengal districts which had made early progress were
more favourably placed in this respect. The same problem was also reflected by existing institutional
disparities between urban and rural areas in the state. The resulting mismatch between the intake capacity
of the upper primary system and the students who enrol at the primary stage also has an important bearing
on the rates of learner retention and dropout rates in elementary education in Uttar Dinajpur and West
Bengal.
According to DISE 2006, there are 190 educational institutions that provide formal access to upper primary
education in Uttar Dinajpur. Only a fifth among these solely offer upper primary education on exclusive
basis, while the overwhelming majority provide post-primary education in a more integrated manner,
combining upper primary with secondary and HS education. Ten fully integrated schools also exist in Uttar
Dinajpur, all located in rural areas, which offer education that begins at Class 1 and ends at HS. With 44
upper primary institutions located within its block and municipal limits, Raiganj holds nearly a quarter of
the upper primary institutions that exist in Uttar Dinajpur, and is thus able to offer the largest number of
seats to primary students seeking to further their education. The block and municipal areas in Islampur and
Kaliaganj together hold another 46 upper primary institutions, leaving the remaining 100 to be shared
across six other Uttar Dinajpur blocks. A rural student seeking to transit from primary to upper primary
education faces better prospects of finding it in and around the municipal towns, where the number of
seats offered are highest. Also, since nearly 50 percent of the schools that offer admission to integrated
upper primary, secondary and HS education are located within the block and municipal limits of Islampur,
Raiganj and Kaliaganj, finding admission at these institutions clears the way for the student to advance
academically to the HS stage. However, to secure admission, the rural student has to compete with students
transiting from local primary schools and must also belong to a family with the economic means or social
network to support a change of residence. Since only a few rural students can compete on equal terms, the
current student-flow patterns, transition rates and dropout rates within the elementary school system in
Uttar Dinajpur require closer examination.
The associated tables and charts summarise the class-wise enrolment patterns in the Uttar Dinajpur blocks
and municipalities for the single year 2006-07. Total enrolment within the elementary education system in
the district that year amounted to 4.47 lakh students, among whom 4.16 lakh students were enrolled in
rural educational institutions against 0.31 lakh in urban areas. Of the aggregate students enrolled, 3.04 lakh
(68%) were attending Classes 1-4 at primary institutions, against 1.43 lakh (32%) enrolled in Classes 5-8 at
upper primary institutions in the district. Rural students comprised 96 percent of the total primary students
and 88 percent of the upper primary students. However, as indicated by the ratio of upper primary to
primary [UP:P] enrolments, there were significant differences between rural and urban enrolment patterns.
All through the Uttar Dinajpur blocks, the rural upper primary to primary enrolment ratio was well below
1, indicating that there was substantial attrition in numbers between the students enrolled in the primary
system and those enrolled in the upper primary system. While not measured specifically for a student
cohort transiting through the elementary school system over successive years, the UP:P ratio offered an
instantaneous approximation of the probability of transition for students currently attending primary
institutions in Uttar Dinajpur at the point where they transited into the upper primary system. This was
measured in terms of the difference in intake capacities between the two systems.
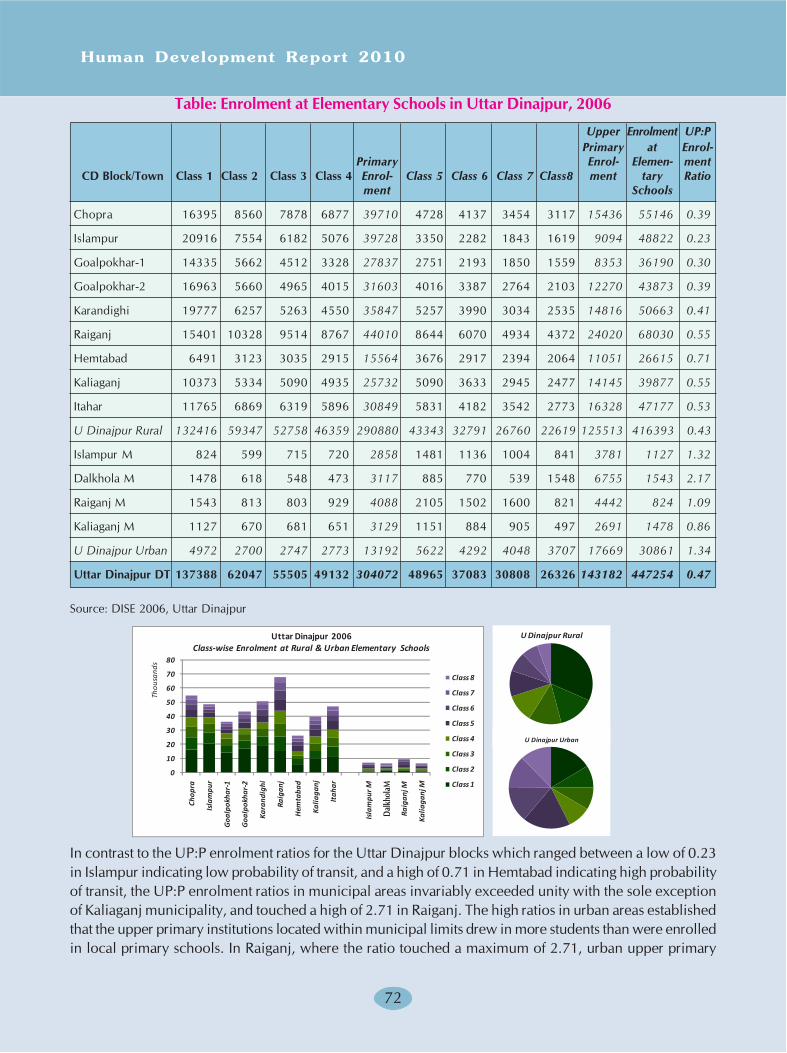
Human Development Report 2010
72
Table: Enrolment at Elementary Schools in Uttar Dinajpur, 2006
Upper Enrolment UP:P
Primary at Enrol-
Primary Enrol- Elemen- ment
CD Block/Town Class 1 Class 2 Class 3 Class 4 Enrol- Class 5 Class 6 Class 7 Class8 ment tary Ratio
ment Schools
Chopra 16395 8560 7878 6877 39710 4728 4137 3454 3117 15436 55146 0.39
Islampur 20916 7554 6182 5076 39728 3350 2282 1843 1619 9094 48822 0.23
Goalpokhar-1 14335 5662 4512 3328 27837 2751 2193 1850 1559 8353 36190 0.30
Goalpokhar-2 16963 5660 4965 4015 31603 4016 3387 2764 2103 12270 43873 0.39
Karandighi 19777 6257 5263 4550 35847 5257 3990 3034 2535 14816 50663 0.41
Raiganj 15401 10328 9514 8767 44010 8644 6070 4934 4372 24020 68030 0.55
Hemtabad 6491 3123 3035 2915 15564 3676 2917 2394 2064 11051 26615 0.71
Kaliaganj 10373 5334 5090 4935 25732 5090 3633 2945 2477 14145 39877 0.55
Itahar 11765 6869 6319 5896 30849 5831 4182 3542 2773 16328 47177 0.53
U Dinajpur Rural 132416 59347 52758 46359 290880 43343 32791 26760 22619 125513 416393 0.43
Islampur M 824 599 715 720 2858 1481 1136 1004 841 3781 1127 1.32
Dalkhola M 1478 618 548 473 3117 885 770 539 1548 6755 1543 2.17
Raiganj M 1543 813 803 929 4088 2105 1502 1600 821 4442 824 1.09
Kaliaganj M 1127 670 681 651 3129 1151 884 905 497 2691 1478 0.86
U Dinajpur Urban 4972 2700 2747 2773 13192 5622 4292 4048 3707 17669 30861 1.34
Uttar Dinajpur DT 137388 62047 55505 49132 304072 48965 37083 30808 26326 143182 447254 0.47
Source: DISE 2006, Uttar Dinajpur
In contrast to the UP:P enrolment ratios for the Uttar Dinajpur blocks which ranged between a low of 0.23
in Islampur indicating low probability of transit, and a high of 0.71 in Hemtabad indicating high probability
of transit, the UP:P enrolment ratios in municipal areas invariably exceeded unity with the sole exception
of Kaliaganj municipality, and touched a high of 2.71 in Raiganj. The high ratios in urban areas established
that the upper primary institutions located within municipal limits drew in more students than were enrolled
in local primary schools. In Raiganj, where the ratio touched a maximum of 2.71, urban upper primary
U Dinajpur Rural
U Dinajpur Urban
0
10
20
30
40
50
60
70
80
Chop
ra
Isla
mpu
r
Goa
lpok
har-
1
Goa
lpok
har-
2
Kara
ndig
hi
Raig
anj
Hem
taba
d
Kalia
ganj
Itah
ar
Isla
mpu
r M
Dal
kola
M
Raig
anj M
Kalia
ganj
M
Thou
sand
s
Class 8
Class 7
Class 6
Class 5
Class 4
Class 3
Class 2
Class 1
Uttar Dinajpur 2006Class-wise Enrolment at Rural & Urban Elementary Schools
Dalkh
olaM
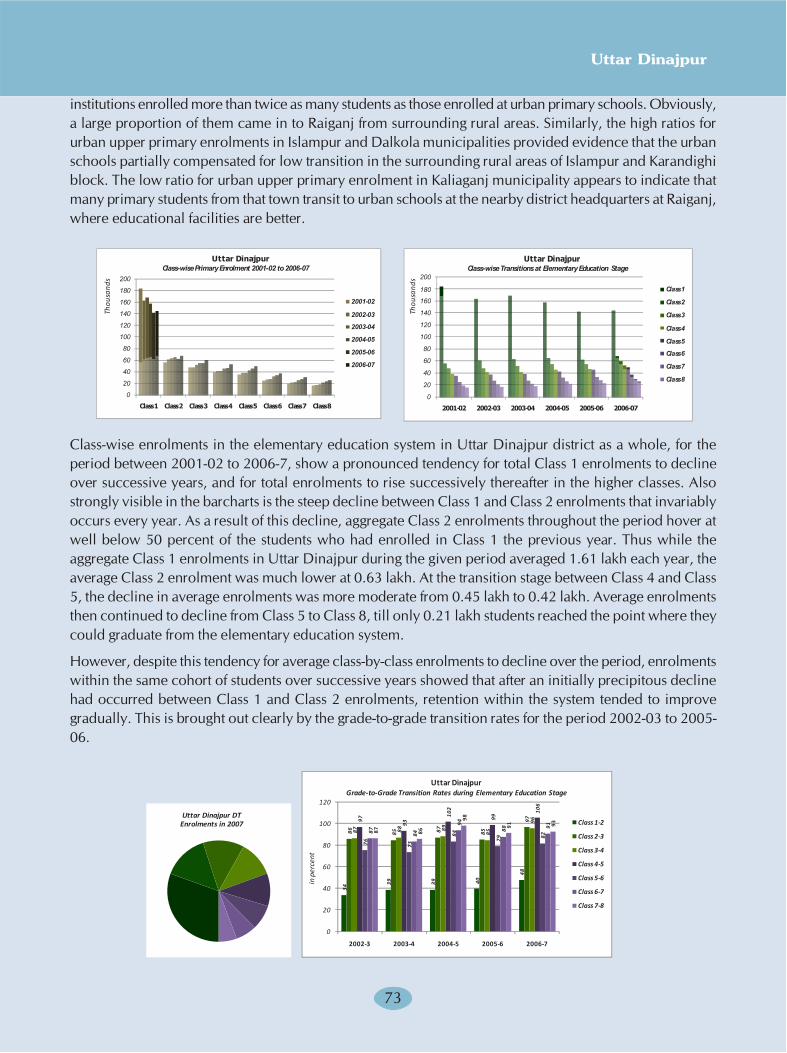
7373
Uttar Dinajpur
institutions enrolled more than twice as many students as those enrolled at urban primary schools. Obviously,
a large proportion of them came in to Raiganj from surrounding rural areas. Similarly, the high ratios for
urban upper primary enrolments in Islampur and Dalkola municipalities provided evidence that the urban
schools partially compensated for low transition in the surrounding rural areas of Islampur and Karandighi
block. The low ratio for urban upper primary enrolment in Kaliaganj municipality appears to indicate that
many primary students from that town transit to urban schools at the nearby district headquarters at Raiganj,
where educational facilities are better.
Class-wise enrolments in the elementary education system in Uttar Dinajpur district as a whole, for the
period between 2001-02 to 2006-7, show a pronounced tendency for total Class 1 enrolments to decline
over successive years, and for total enrolments to rise successively thereafter in the higher classes. Also
strongly visible in the barcharts is the steep decline between Class 1 and Class 2 enrolments that invariably
occurs every year. As a result of this decline, aggregate Class 2 enrolments throughout the period hover at
well below 50 percent of the students who had enrolled in Class 1 the previous year. Thus while the
aggregate Class 1 enrolments in Uttar Dinajpur during the given period averaged 1.61 lakh each year, the
average Class 2 enrolment was much lower at 0.63 lakh. At the transition stage between Class 4 and Class
5, the decline in average enrolments was more moderate from 0.45 lakh to 0.42 lakh. Average enrolments
then continued to decline from Class 5 to Class 8, till only 0.21 lakh students reached the point where they
could graduate from the elementary education system.
However, despite this tendency for average class-by-class enrolments to decline over the period, enrolments
within the same cohort of students over successive years showed that after an initially precipitous decline
had occurred between Class 1 and Class 2 enrolments, retention within the system tended to improve
gradually. This is brought out clearly by the grade-to-grade transition rates for the period 2002-03 to 2005-
06.
�
��
��
��
��
���
���
���
���
���
���
������� ������� ������ ������ ������� ������� ������ �������
�������
�������
�������
�������
�������
�������
������������
�����,-�� ������� %�� ���� )&&(,&) � )&&.,&/
�
��
��
��
��
���
���
���
���
���
���
������� ������ ����� ������ ������� ������
������
������
������
������
������
������
������
������
������������
�����,-�� �������� �� �� %������� %������ � ����
34
39 39 40
48
86 85 87 85
97
87 88 89
85
9697
93
102
99
106
76 73
84
79 82
87 84
94
88 91
87 86
98
91 93
0
20
40
60
80
100
120
2002-3 2003-4 2004-5 2005-6 2006-7
Class 1-2
Class 2-3
Class 3-4
Class 4-5
Class 5-6
Class 6-7
Class 7-8
in p
erce
nt
Uttar DinajpurGrade-to-Grade Transition Rates during Elementary Education Stage
Uttar Dinajpur DTEnrolments in 2007
Thou
sand
s
Thou
sand
s
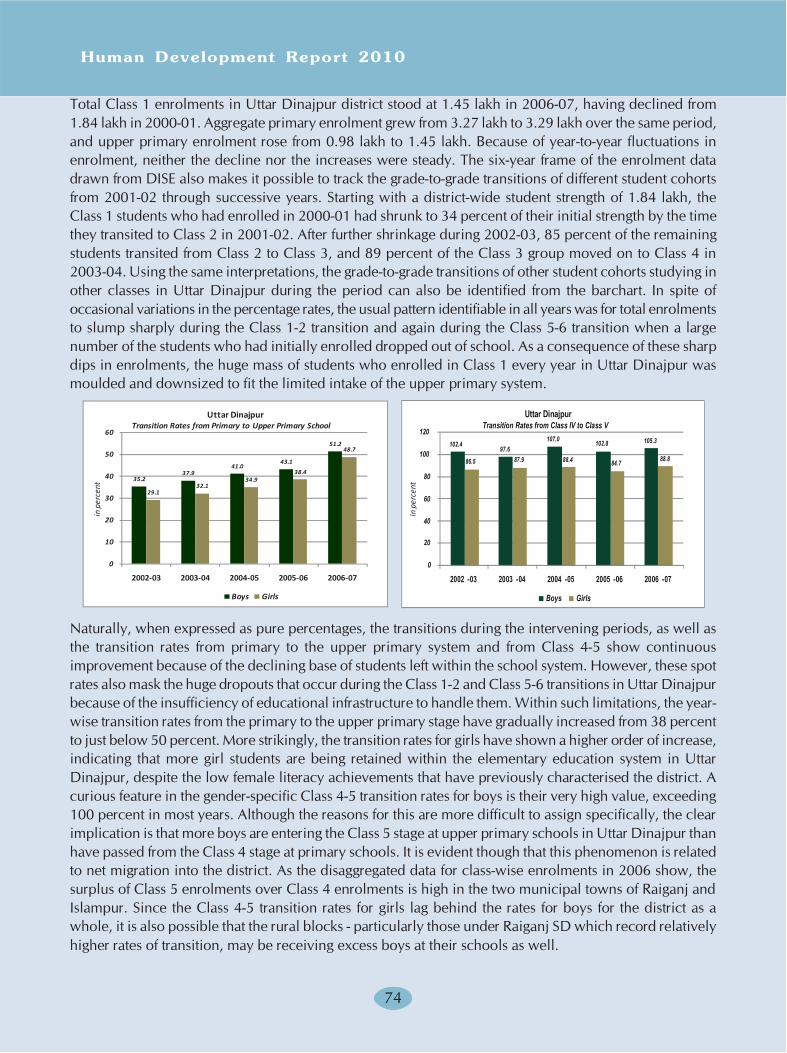
Human Development Report 2010
74
Total Class 1 enrolments in Uttar Dinajpur district stood at 1.45 lakh in 2006-07, having declined from
1.84 lakh in 2000-01. Aggregate primary enrolment grew from 3.27 lakh to 3.29 lakh over the same period,
and upper primary enrolment rose from 0.98 lakh to 1.45 lakh. Because of year-to-year fluctuations in
enrolment, neither the decline nor the increases were steady. The six-year frame of the enrolment data
drawn from DISE also makes it possible to track the grade-to-grade transitions of different student cohorts
from 2001-02 through successive years. Starting with a district-wide student strength of 1.84 lakh, the
Class 1 students who had enrolled in 2000-01 had shrunk to 34 percent of their initial strength by the time
they transited to Class 2 in 2001-02. After further shrinkage during 2002-03, 85 percent of the remaining
students transited from Class 2 to Class 3, and 89 percent of the Class 3 group moved on to Class 4 in
2003-04. Using the same interpretations, the grade-to-grade transitions of other student cohorts studying in
other classes in Uttar Dinajpur during the period can also be identified from the barchart. In spite of
occasional variations in the percentage rates, the usual pattern identifiable in all years was for total enrolments
to slump sharply during the Class 1-2 transition and again during the Class 5-6 transition when a large
number of the students who had initially enrolled dropped out of school. As a consequence of these sharp
dips in enrolments, the huge mass of students who enrolled in Class 1 every year in Uttar Dinajpur was
moulded and downsized to fit the limited intake of the upper primary system.
Naturally, when expressed as pure percentages, the transitions during the intervening periods, as well as
the transition rates from primary to the upper primary system and from Class 4-5 show continuous
improvement because of the declining base of students left within the school system. However, these spot
rates also mask the huge dropouts that occur during the Class 1-2 and Class 5-6 transitions in Uttar Dinajpur
because of the insufficiency of educational infrastructure to handle them. Within such limitations, the year-
wise transition rates from the primary to the upper primary stage have gradually increased from 38 percent
to just below 50 percent. More strikingly, the transition rates for girls have shown a higher order of increase,
indicating that more girl students are being retained within the elementary education system in Uttar
Dinajpur, despite the low female literacy achievements that have previously characterised the district. A
curious feature in the gender-specific Class 4-5 transition rates for boys is their very high value, exceeding
100 percent in most years. Although the reasons for this are more difficult to assign specifically, the clear
implication is that more boys are entering the Class 5 stage at upper primary schools in Uttar Dinajpur than
have passed from the Class 4 stage at primary schools. It is evident though that this phenomenon is related
to net migration into the district. As the disaggregated data for class-wise enrolments in 2006 show, the
surplus of Class 5 enrolments over Class 4 enrolments is high in the two municipal towns of Raiganj and
Islampur. Since the Class 4-5 transition rates for girls lag behind the rates for boys for the district as a
whole, it is also possible that the rural blocks - particularly those under Raiganj SD which record relatively
higher rates of transition, may be receiving excess boys at their schools as well.
35.237.9
41.043.1
51.2
29.132.1
34.938.4
48.7
0
10
20
30
40
50
60
2002-03 2003-04 2004-05 2005-06 2006-07
Boys Girls
Uttar DinajpurTransition Rates from Primary to Upper Primary School
in p
erce
nt
102.497.6
107.0 102.8 105.3
86.5 87.9 88.4 84.7 88.8
0
20
40
60
80
100
120
2002 -03 2003 -04 2004 -05 2005 -06 2006 -07
Boys Girls
Uttar DinajpurTransition Rates from Class IV to Class V
in pe
rcen
t
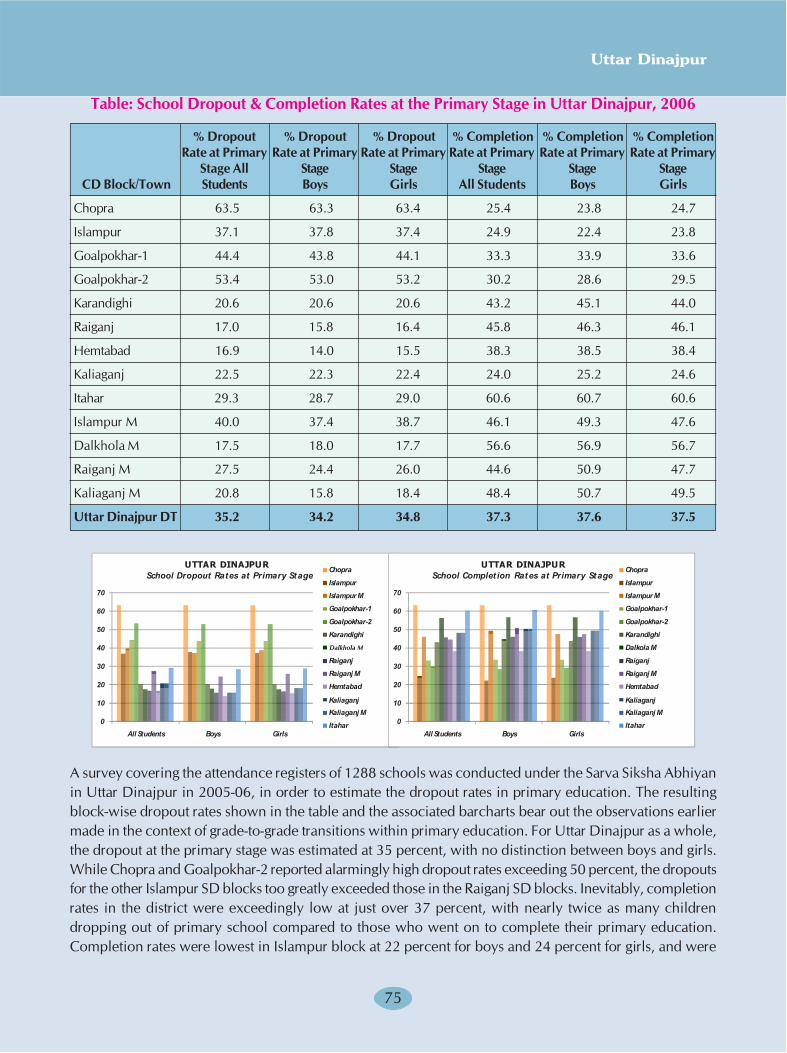
7575
Uttar Dinajpur
Table: School Dropout & Completion Rates at the Primary Stage in Uttar Dinajpur, 2006
% Dropout % Dropout % Dropout % Completion % Completion % Completion
Rate at Primary Rate at Primary Rate at Primary Rate at Primary Rate at Primary Rate at Primary
Stage All Stage Stage Stage Stage Stage
CD Block/Town Students Boys Girls All Students Boys Girls
Chopra 63.5 63.3 63.4 25.4 23.8 24.7
Islampur 37.1 37.8 37.4 24.9 22.4 23.8
Goalpokhar-1 44.4 43.8 44.1 33.3 33.9 33.6
Goalpokhar-2 53.4 53.0 53.2 30.2 28.6 29.5
Karandighi 20.6 20.6 20.6 43.2 45.1 44.0
Raiganj 17.0 15.8 16.4 45.8 46.3 46.1
Hemtabad 16.9 14.0 15.5 38.3 38.5 38.4
Kaliaganj 22.5 22.3 22.4 24.0 25.2 24.6
Itahar 29.3 28.7 29.0 60.6 60.7 60.6
Islampur M 40.0 37.4 38.7 46.1 49.3 47.6
Dalkhola M 17.5 18.0 17.7 56.6 56.9 56.7
Raiganj M 27.5 24.4 26.0 44.6 50.9 47.7
Kaliaganj M 20.8 15.8 18.4 48.4 50.7 49.5
Uttar Dinajpur DT 35.2 34.2 34.8 37.3 37.6 37.5
A survey covering the attendance registers of 1288 schools was conducted under the Sarva Siksha Abhiyan
in Uttar Dinajpur in 2005-06, in order to estimate the dropout rates in primary education. The resulting
block-wise dropout rates shown in the table and the associated barcharts bear out the observations earlier
made in the context of grade-to-grade transitions within primary education. For Uttar Dinajpur as a whole,
the dropout at the primary stage was estimated at 35 percent, with no distinction between boys and girls.
While Chopra and Goalpokhar-2 reported alarmingly high dropout rates exceeding 50 percent, the dropouts
for the other Islampur SD blocks too greatly exceeded those in the Raiganj SD blocks. Inevitably, completion
rates in the district were exceedingly low at just over 37 percent, with nearly twice as many children
dropping out of primary school compared to those who went on to complete their primary education.
Completion rates were lowest in Islampur block at 22 percent for boys and 24 percent for girls, and were
&
(&
)&
*&
+&
'&
.&
/&
0�� ������� 1 �� 2����
�� ��
!������
!������ �
2 �� 3���,(
2 �� 3���,)
4���������
5��3 �� �
������6
������6 �
����7��
4�������6
4�������6 �
!�����
������������
���������� ��������� ��������������
&
(&
)&
*&
+&
'&
.&
/&
0�� ������� 1 �� 2����
�� ��
!������
!������ �
2 �� 3���,(
2 �� 3���,)
4���������
5��3 �� �
������6
������6 �
����7��
4�������6
4�������6 �
!�����
������������
����������� �� �������� ��������������
Dalkhola M

Human Development Report 2010
76
only marginally higher in Chopra which records substantially high primary enrolment. Even in Goalpokhar-
1 and Goalpokhar-2 blocks, where primary enrolment is limited, completion rates still remained low.
While the contiguous blocks of Karandighi and Raiganj recorded better completion rates of over 40 percent,
placing them on par with the urban municipalities, the primary completion rate at Itahar was truly impressive,
at well over 60 percent.
According to the child census carried out under the Bhartikaran Karmasuchi of SSM, 66,932 children in the
5-14 age-group in Uttar Dinajpur were out of school in 2006. The Islampur SD blocks accounted for a
larger proportion of such children, with Karandighi having the largest number, followed by Goalpokhar-1,
Islampur and Chopra. In contrast, Itahar was the only block in Raiganj SD where the problem still occurred
significantly, while apart from the municipal areas, Hemtabad had the lowest number of out of school
children in Uttar Dinajpur. While the special enrolment drive under the Bhartikaran Karmasuchi of SSM
succeeded in subsequently enrolling around half of these children, it is estimated that 34,315 children are
still out of school in the district.
Non-Formal Education [NFE] in Uttar Dinajpur
Largescale mass literacy campaigns were initiated in India in 1989 under the overall agency of the National
Literacy Mission [NLM], to cope with the mounting burden of adult illiteracy. Mass literacy activities in
Uttar Dinajpur got underway in 1995-96 after a prior proposal for launching TLC programmes in the
district had obtained sanction from NLM. A fresh survey conducted in 1998 estimated the total number of
illiterates to be targeted through TLC at 5.6 lakh. Success rates were quite satisfactory at the inception
phase. Around 4.0 lakh illiterate persons or 71 percent of the estimated TLC target were initially enrolled as
learners under the literacy programmes, among whom 2.6 lakh learners (65%) achieved the NLM norm.
With close to half of them being females, gender parity in literacy achievements was also well maintained.
Goalpokhar-1 and Raiganj had the largest number of targeted illiterates, followed by Itahar and Chopra.
However, while the ratio of learners enrolled to TLC block-targets was relatively high in the first two
blocks, a considerable mass of illiterate persons in Chopra and Itahar could not be drawn into the literacy
campaign. Also in most blocks where TLC enrolment was high, the number of learners who were unable
to reach the NLM norm was also substantial.
The principal difficulty faced during the TLC phase in Uttar Dinajpur was in targeting illiterates in an even
manner across the district. Among the rural segment who constituted over 97 percent of the TLC target in
Uttar Dinajpur, the ratio of enrolment was 50 percent or lower in Itahar and Chopra which together
accounted for nearly a quarter of the estimated illiterates in the district, but surpassed 87 percent in Kaliaganj
and Karandighi where the numbers of illiterates involved were fewer. Low average enrolment rates among
0
10
20
30
40
50
60
70
80
Enrolment Target Actually Enrolled Still Uncovered
Num
ber i
n Th
ousa
nds
Total Out-of-School Children Out-of-School Boys Out-of-School Girls
Out-of-School Children in Uttar Dinajpur 2006
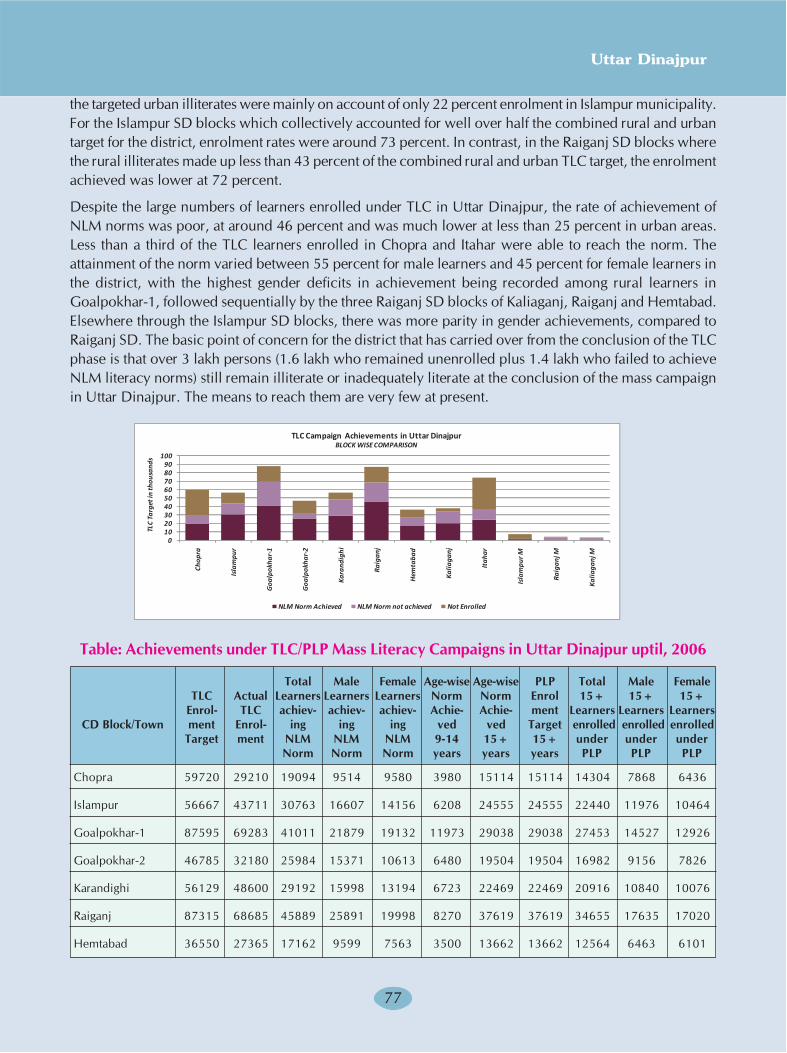
7777
Uttar Dinajpur
the targeted urban illiterates were mainly on account of only 22 percent enrolment in Islampur municipality.
For the Islampur SD blocks which collectively accounted for well over half the combined rural and urban
target for the district, enrolment rates were around 73 percent. In contrast, in the Raiganj SD blocks where
the rural illiterates made up less than 43 percent of the combined rural and urban TLC target, the enrolment
achieved was lower at 72 percent.
Despite the large numbers of learners enrolled under TLC in Uttar Dinajpur, the rate of achievement of
NLM norms was poor, at around 46 percent and was much lower at less than 25 percent in urban areas.
Less than a third of the TLC learners enrolled in Chopra and Itahar were able to reach the norm. The
attainment of the norm varied between 55 percent for male learners and 45 percent for female learners in
the district, with the highest gender deficits in achievement being recorded among rural learners in
Goalpokhar-1, followed sequentially by the three Raiganj SD blocks of Kaliaganj, Raiganj and Hemtabad.
Elsewhere through the Islampur SD blocks, there was more parity in gender achievements, compared to
Raiganj SD. The basic point of concern for the district that has carried over from the conclusion of the TLC
phase is that over 3 lakh persons (1.6 lakh who remained unenrolled plus 1.4 lakh who failed to achieve
NLM literacy norms) still remain illiterate or inadequately literate at the conclusion of the mass campaign
in Uttar Dinajpur. The means to reach them are very few at present.
Table: Achievements under TLC/PLP Mass Literacy Campaigns in Uttar Dinajpur uptil, 2006
Total Male Female Age-wise Age-wise PLP Total Male Female
TLC Actual Learners Learners Learners Norm Norm Enrol 15+ 15+ 15+
Enrol- TLC achiev- achiev- achiev- Achie- Achie- ment Learners Learners Learners
CD Block/Town ment Enrol- ing ing ing ved ved Target enrolled enrolled enrolled
Target ment NLM NLM NLM 9-14 15+ 15+ under under under
Norm Norm Norm years years years PLP PLP PLP
Chopra 59720 29210 19094 9514 9580 3980 15114 15114 14304 7868 6436
Islampur 56667 43711 30763 16607 14156 6208 24555 24555 22440 11976 10464
Goalpokhar-1 87595 69283 41011 21879 19132 11973 29038 29038 27453 14527 12926
Goalpokhar-2 46785 32180 25984 15371 10613 6480 19504 19504 16982 9156 7826
Karandighi 56129 48600 29192 15998 13194 6723 22469 22469 20916 10840 10076
Raiganj 87315 68685 45889 25891 19998 8270 37619 37619 34655 17635 17020
Hemtabad 36550 27365 17162 9599 7563 3500 13662 13662 12564 6463 6101
0102030405060708090
100
Chop
ra
Isla
mpu
r
Goa
lpok
har-
1
Goa
lpok
har-
2
Kara
ndig
hi
Raig
anj
Hem
taba
d
Kalia
ganj
Itah
ar
Isla
mpu
r M
Raig
anj M
Kalia
ganj
M
TLC
Targ
et in
thou
sand
s
NLM Norm Achieved NLM Norm not achieved Not Enrolled
TLC Campaign Achievements in Uttar DinajpurBLOCK WISE COMPARISON
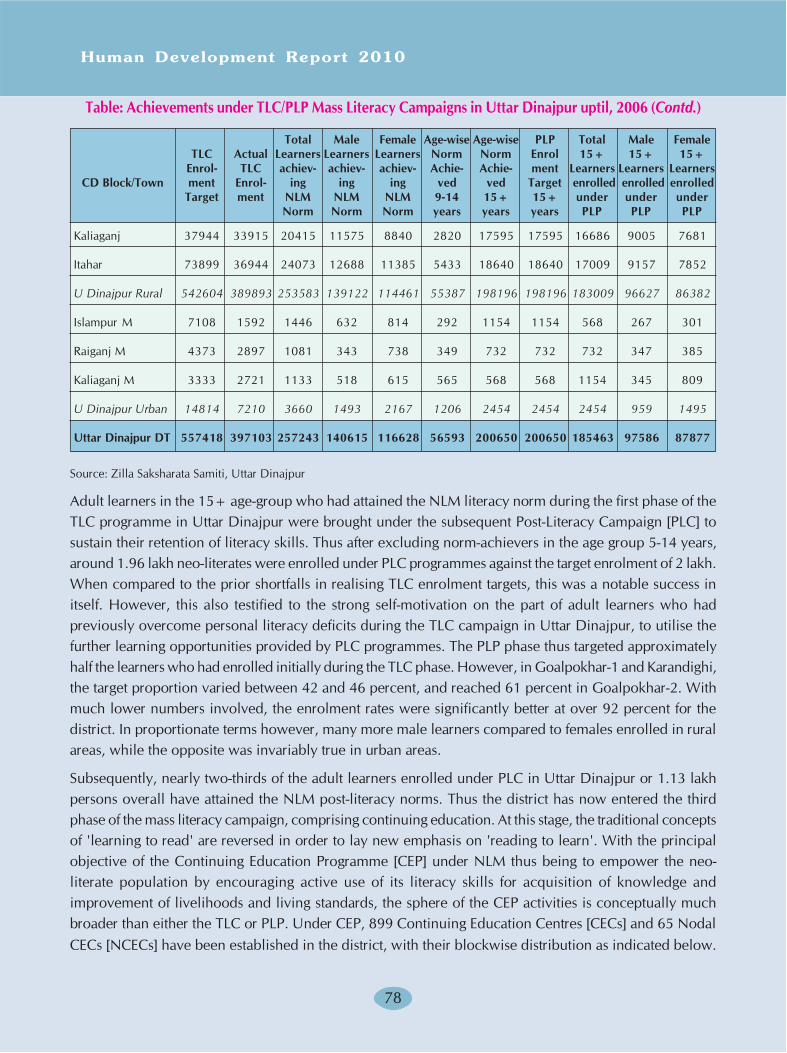
Human Development Report 2010
78
Kaliaganj 37944 33915 20415 11575 8840 2820 17595 17595 16686 9005 7681
Itahar 73899 36944 24073 12688 11385 5433 18640 18640 17009 9157 7852
U Dinajpur Rural 542604 389893 253583 139122 114461 55387 198196 198196 183009 96627 86382
Islampur M 7108 1592 1446 632 814 292 1154 1154 568 267 301
Raiganj M 4373 2897 1081 343 738 349 732 732 732 347 385
Kaliaganj M 3333 2721 1133 518 615 565 568 568 1154 345 809
U Dinajpur Urban 14814 7210 3660 1493 2167 1206 2454 2454 2454 959 1495
Uttar Dinajpur DT 557418 397103 257243 140615 116628 56593 200650 200650 185463 97586 87877
Source: Zilla Saksharata Samiti, Uttar Dinajpur
Adult learners in the 15+ age-group who had attained the NLM literacy norm during the first phase of the
TLC programme in Uttar Dinajpur were brought under the subsequent Post-Literacy Campaign [PLC] to
sustain their retention of literacy skills. Thus after excluding norm-achievers in the age group 5-14 years,
around 1.96 lakh neo-literates were enrolled under PLC programmes against the target enrolment of 2 lakh.
When compared to the prior shortfalls in realising TLC enrolment targets, this was a notable success in
itself. However, this also testified to the strong self-motivation on the part of adult learners who had
previously overcome personal literacy deficits during the TLC campaign in Uttar Dinajpur, to utilise the
further learning opportunities provided by PLC programmes. The PLP phase thus targeted approximately
half the learners who had enrolled initially during the TLC phase. However, in Goalpokhar-1 and Karandighi,
the target proportion varied between 42 and 46 percent, and reached 61 percent in Goalpokhar-2. With
much lower numbers involved, the enrolment rates were significantly better at over 92 percent for the
district. In proportionate terms however, many more male learners compared to females enrolled in rural
areas, while the opposite was invariably true in urban areas.
Subsequently, nearly two-thirds of the adult learners enrolled under PLC in Uttar Dinajpur or 1.13 lakh
persons overall have attained the NLM post-literacy norms. Thus the district has now entered the third
phase of the mass literacy campaign, comprising continuing education. At this stage, the traditional concepts
of 'learning to read' are reversed in order to lay new emphasis on 'reading to learn'. With the principal
objective of the Continuing Education Programme [CEP] under NLM thus being to empower the neo-
literate population by encouraging active use of its literacy skills for acquisition of knowledge and
improvement of livelihoods and living standards, the sphere of the CEP activities is conceptually much
broader than either the TLC or PLP. Under CEP, 899 Continuing Education Centres [CECs] and 65 Nodal
CECs [NCECs] have been established in the district, with their blockwise distribution as indicated below.
Table: Achievements under TLC/PLP Mass Literacy Campaigns in Uttar Dinajpur uptil, 2006 (Contd.)
Total Male Female Age-wise Age-wise PLP Total Male Female
TLC Actual Learners Learners Learners Norm Norm Enrol 15+ 15+ 15+
Enrol- TLC achiev- achiev- achiev- Achie- Achie- ment Learners Learners Learners
CD Block/Town ment Enrol- ing ing ing ved ved Target enrolled enrolled enrolled
Target ment NLM NLM NLM 9-14 15+ 15+ under under under
Norm Norm Norm years years years PLP PLP PLP
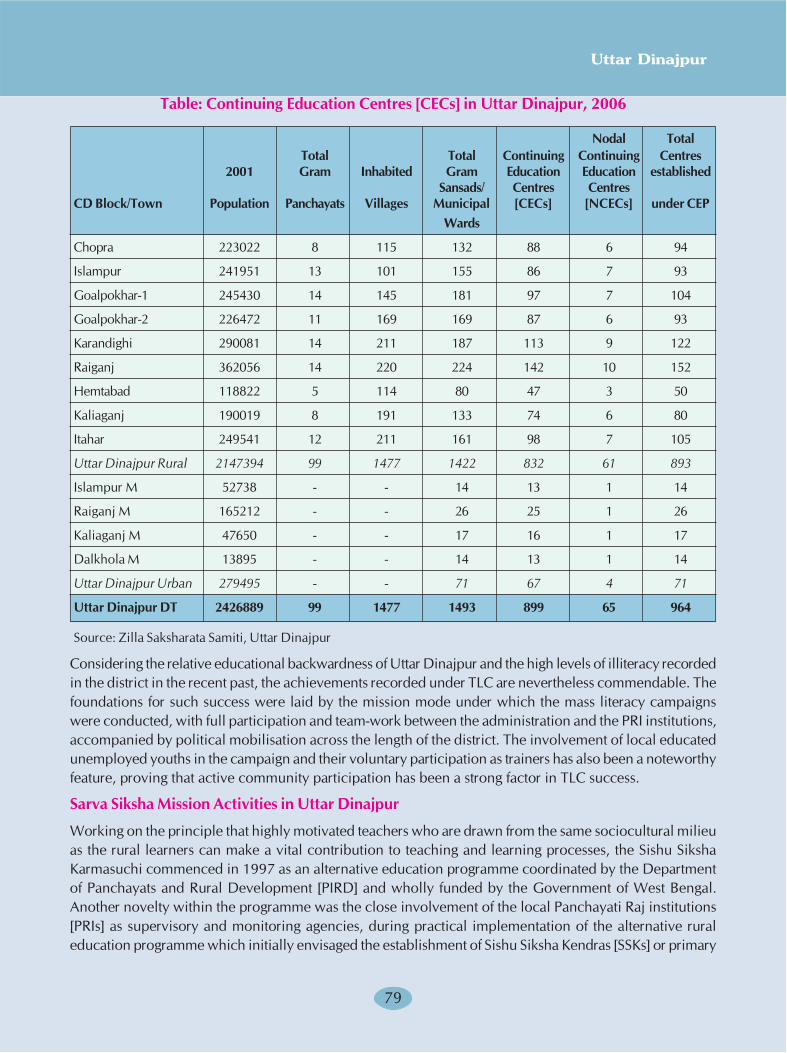
7979
Uttar Dinajpur
Table: Continuing Education Centres [CECs] in Uttar Dinajpur, 2006
Nodal Total
Total Total Continuing Continuing Centres
2001 Gram Inhabited Gram Education Education established
Sansads/ Centres Centres
CD Block/Town Population Panchayats Villages Municipal [CECs] [NCECs] under CEP
Wards
Chopra 223022 8 115 132 88 6 94
Islampur 241951 13 101 155 86 7 93
Goalpokhar-1 245430 14 145 181 97 7 104
Goalpokhar-2 226472 11 169 169 87 6 93
Karandighi 290081 14 211 187 113 9 122
Raiganj 362056 14 220 224 142 10 152
Hemtabad 118822 5 114 80 47 3 50
Kaliaganj 190019 8 191 133 74 6 80
Itahar 249541 12 211 161 98 7 105
Uttar Dinajpur Rural 2147394 99 1477 1422 832 61 893
Islampur M 52738 - - 14 13 1 14
Raiganj M 165212 - - 26 25 1 26
Kaliaganj M 47650 - - 17 16 1 17
Dalkhola M 13895 - - 14 13 1 14
Uttar Dinajpur Urban 279495 - - 71 67 4 71
Uttar Dinajpur DT 2426889 99 1477 1493 899 65 964
Source: Zilla Saksharata Samiti, Uttar Dinajpur
Considering the relative educational backwardness of Uttar Dinajpur and the high levels of illiteracy recorded
in the district in the recent past, the achievements recorded under TLC are nevertheless commendable. The
foundations for such success were laid by the mission mode under which the mass literacy campaigns
were conducted, with full participation and team-work between the administration and the PRI institutions,
accompanied by political mobilisation across the length of the district. The involvement of local educated
unemployed youths in the campaign and their voluntary participation as trainers has also been a noteworthy
feature, proving that active community participation has been a strong factor in TLC success.
Sarva Siksha Mission Activities in Uttar Dinajpur
Working on the principle that highly motivated teachers who are drawn from the same sociocultural milieu
as the rural learners can make a vital contribution to teaching and learning processes, the Sishu Siksha
Karmasuchi commenced in 1997 as an alternative education programme coordinated by the Department
of Panchayats and Rural Development [PIRD] and wholly funded by the Government of West Bengal.
Another novelty within the programme was the close involvement of the local Panchayati Raj institutions
[PRIs] as supervisory and monitoring agencies, during practical implementation of the alternative rural
education programme which initially envisaged the establishment of Sishu Siksha Kendras [SSKs] or primary
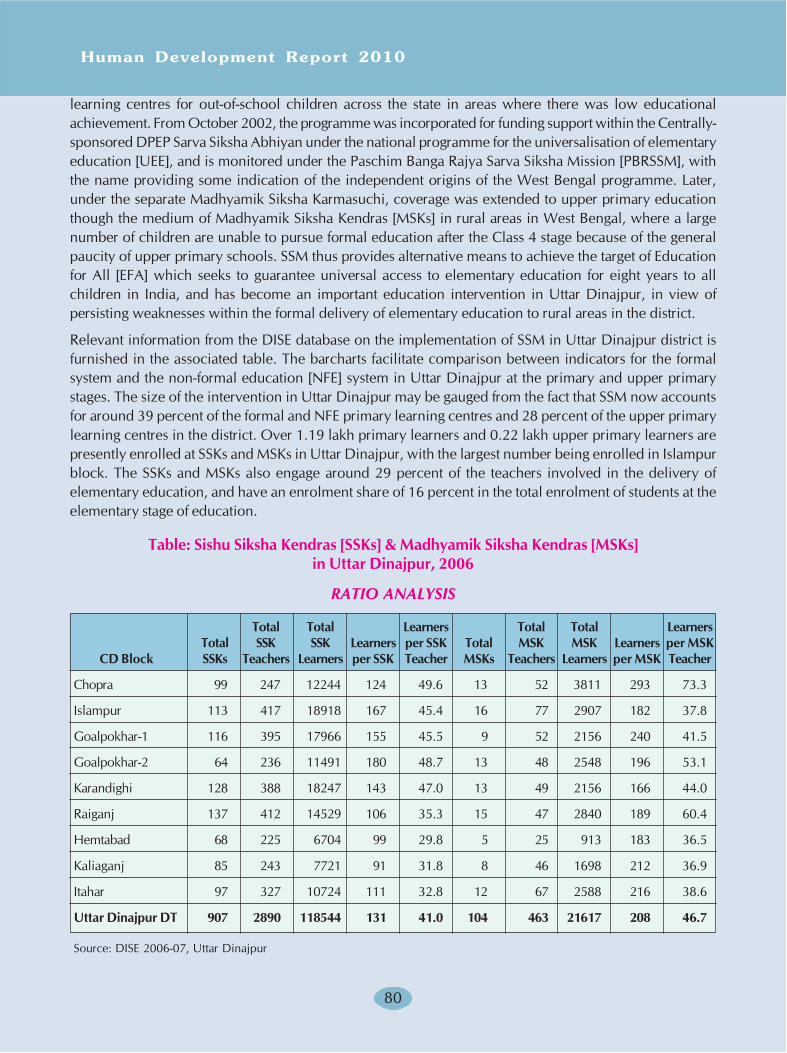
Human Development Report 2010
80
learning centres for out-of-school children across the state in areas where there was low educational
achievement. From October 2002, the programme was incorporated for funding support within the Centrally-
sponsored DPEP Sarva Siksha Abhiyan under the national programme for the universalisation of elementary
education [UEE], and is monitored under the Paschim Banga Rajya Sarva Siksha Mission [PBRSSM], with
the name providing some indication of the independent origins of the West Bengal programme. Later,
under the separate Madhyamik Siksha Karmasuchi, coverage was extended to upper primary education
though the medium of Madhyamik Siksha Kendras [MSKs] in rural areas in West Bengal, where a large
number of children are unable to pursue formal education after the Class 4 stage because of the general
paucity of upper primary schools. SSM thus provides alternative means to achieve the target of Education
for All [EFA] which seeks to guarantee universal access to elementary education for eight years to all
children in India, and has become an important education intervention in Uttar Dinajpur, in view of
persisting weaknesses within the formal delivery of elementary education to rural areas in the district.
Relevant information from the DISE database on the implementation of SSM in Uttar Dinajpur district is
furnished in the associated table. The barcharts facilitate comparison between indicators for the formal
system and the non-formal education [NFE] system in Uttar Dinajpur at the primary and upper primary
stages. The size of the intervention in Uttar Dinajpur may be gauged from the fact that SSM now accounts
for around 39 percent of the formal and NFE primary learning centres and 28 percent of the upper primary
learning centres in the district. Over 1.19 lakh primary learners and 0.22 lakh upper primary learners are
presently enrolled at SSKs and MSKs in Uttar Dinajpur, with the largest number being enrolled in Islampur
block. The SSKs and MSKs also engage around 29 percent of the teachers involved in the delivery of
elementary education, and have an enrolment share of 16 percent in the total enrolment of students at the
elementary stage of education.
Table: Sishu Siksha Kendras [SSKs] & Madhyamik Siksha Kendras [MSKs]
in Uttar Dinajpur, 2006
RATIO ANALYSIS
Total Total Learners Total Total Learners
Total SSK SSK Learners per SSK Total MSK MSK Learners per MSK
CD Block SSKs Teachers Learners per SSK Teacher MSKs Teachers Learners per MSK Teacher
Chopra 99 247 12244 124 49.6 13 52 3811 293 73.3
Islampur 113 417 18918 167 45.4 16 77 2907 182 37.8
Goalpokhar-1 116 395 17966 155 45.5 9 52 2156 240 41.5
Goalpokhar-2 64 236 11491 180 48.7 13 48 2548 196 53.1
Karandighi 128 388 18247 143 47.0 13 49 2156 166 44.0
Raiganj 137 412 14529 106 35.3 15 47 2840 189 60.4
Hemtabad 68 225 6704 99 29.8 5 25 913 183 36.5
Kaliaganj 85 243 7721 91 31.8 8 46 1698 212 36.9
Itahar 97 327 10724 111 32.8 12 67 2588 216 38.6
Uttar Dinajpur DT 907 2890 118544 131 41.0 104 463 21617 208 46.7
Source: DISE 2006-07, Uttar Dinajpur
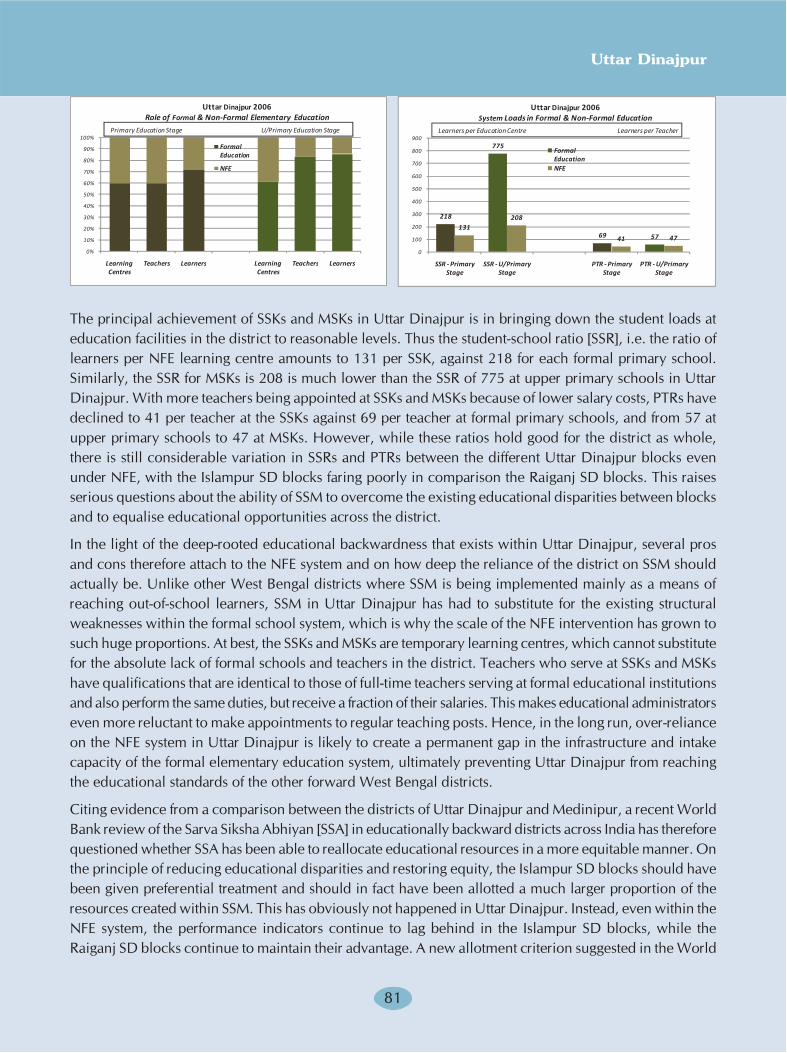
8181
Uttar Dinajpur
The principal achievement of SSKs and MSKs in Uttar Dinajpur is in bringing down the student loads at
education facilities in the district to reasonable levels. Thus the student-school ratio [SSR], i.e. the ratio of
learners per NFE learning centre amounts to 131 per SSK, against 218 for each formal primary school.
Similarly, the SSR for MSKs is 208 is much lower than the SSR of 775 at upper primary schools in Uttar
Dinajpur. With more teachers being appointed at SSKs and MSKs because of lower salary costs, PTRs have
declined to 41 per teacher at the SSKs against 69 per teacher at formal primary schools, and from 57 at
upper primary schools to 47 at MSKs. However, while these ratios hold good for the district as whole,
there is still considerable variation in SSRs and PTRs between the different Uttar Dinajpur blocks even
under NFE, with the Islampur SD blocks faring poorly in comparison the Raiganj SD blocks. This raises
serious questions about the ability of SSM to overcome the existing educational disparities between blocks
and to equalise educational opportunities across the district.
In the light of the deep-rooted educational backwardness that exists within Uttar Dinajpur, several pros
and cons therefore attach to the NFE system and on how deep the reliance of the district on SSM should
actually be. Unlike other West Bengal districts where SSM is being implemented mainly as a means of
reaching out-of-school learners, SSM in Uttar Dinajpur has had to substitute for the existing structural
weaknesses within the formal school system, which is why the scale of the NFE intervention has grown to
such huge proportions. At best, the SSKs and MSKs are temporary learning centres, which cannot substitute
for the absolute lack of formal schools and teachers in the district. Teachers who serve at SSKs and MSKs
have qualifications that are identical to those of full-time teachers serving at formal educational institutions
and also perform the same duties, but receive a fraction of their salaries. This makes educational administrators
even more reluctant to make appointments to regular teaching posts. Hence, in the long run, over-reliance
on the NFE system in Uttar Dinajpur is likely to create a permanent gap in the infrastructure and intake
capacity of the formal elementary education system, ultimately preventing Uttar Dinajpur from reaching
the educational standards of the other forward West Bengal districts.
Citing evidence from a comparison between the districts of Uttar Dinajpur and Medinipur, a recent World
Bank review of the Sarva Siksha Abhiyan [SSA] in educationally backward districts across India has therefore
questioned whether SSA has been able to reallocate educational resources in a more equitable manner. On
the principle of reducing educational disparities and restoring equity, the Islampur SD blocks should have
been given preferential treatment and should in fact have been allotted a much larger proportion of the
resources created within SSM. This has obviously not happened in Uttar Dinajpur. Instead, even within the
NFE system, the performance indicators continue to lag behind in the Islampur SD blocks, while the
Raiganj SD blocks continue to maintain their advantage. A new allotment criterion suggested in the World
0%
10%
20%
30%
40%
50%
60%
70%
80%
90%
100%
Learning Centres
Teachers Learners Learning Centres
Teachers Learners
Formal Education
NFE
Primary Education Stage U/Primary Education Stage
Uttar Dinajpur 2006Role of Formal & Non-Formal Elementary Education
218
775
69 57131
208
41 47
0
100
200
300
400
500
600
700
800
900
SSR - Primary Stage
SSR - U/Primary Stage
PTR - Primary Stage
PTR - U/Primary Stage
Formal EducationNFE
Learners per Education Centre Learners per Teacher
Uttar Dinajpur 2006System Loads in Formal & Non-Formal Education
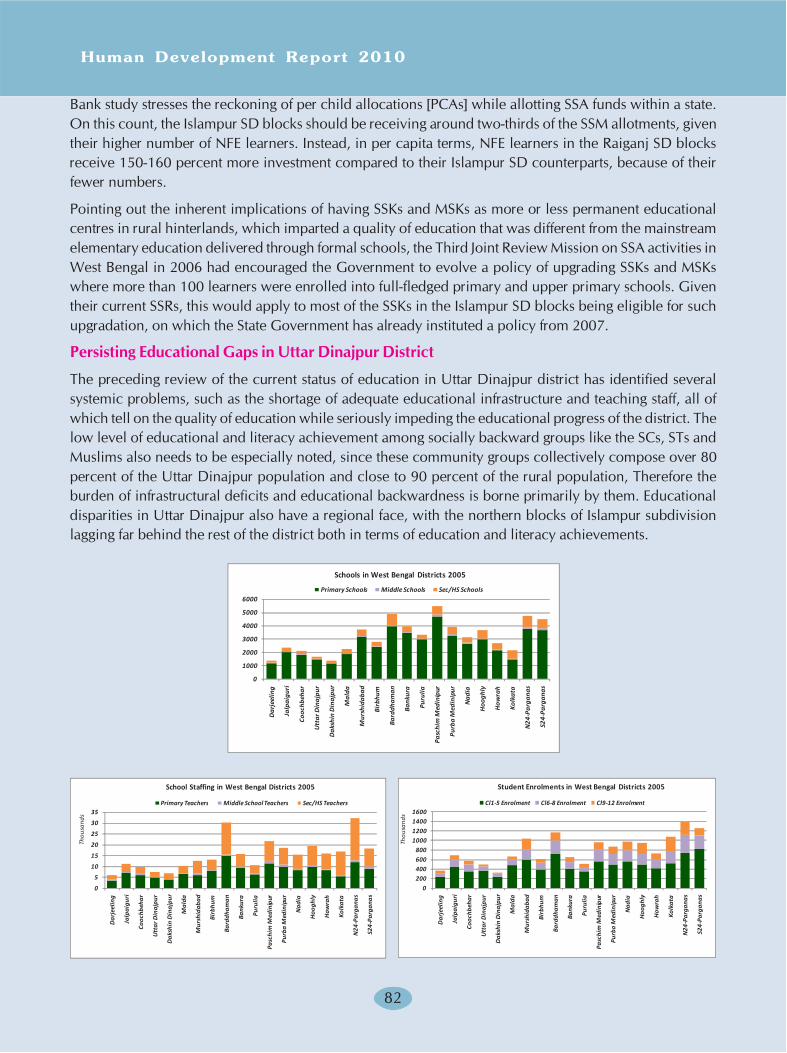
Human Development Report 2010
82
Bank study stresses the reckoning of per child allocations [PCAs] while allotting SSA funds within a state.
On this count, the Islampur SD blocks should be receiving around two-thirds of the SSM allotments, given
their higher number of NFE learners. Instead, in per capita terms, NFE learners in the Raiganj SD blocks
receive 150-160 percent more investment compared to their Islampur SD counterparts, because of their
fewer numbers.
Pointing out the inherent implications of having SSKs and MSKs as more or less permanent educational
centres in rural hinterlands, which imparted a quality of education that was different from the mainstream
elementary education delivered through formal schools, the Third Joint Review Mission on SSA activities in
West Bengal in 2006 had encouraged the Government to evolve a policy of upgrading SSKs and MSKs
where more than 100 learners were enrolled into full-fledged primary and upper primary schools. Given
their current SSRs, this would apply to most of the SSKs in the Islampur SD blocks being eligible for such
upgradation, on which the State Government has already instituted a policy from 2007.
Persisting Educational Gaps in Uttar Dinajpur District
The preceding review of the current status of education in Uttar Dinajpur district has identified several
systemic problems, such as the shortage of adequate educational infrastructure and teaching staff, all of
which tell on the quality of education while seriously impeding the educational progress of the district. The
low level of educational and literacy achievement among socially backward groups like the SCs, STs and
Muslims also needs to be especially noted, since these community groups collectively compose over 80
percent of the Uttar Dinajpur population and close to 90 percent of the rural population, Therefore the
burden of infrastructural deficits and educational backwardness is borne primarily by them. Educational
disparities in Uttar Dinajpur also have a regional face, with the northern blocks of Islampur subdivision
lagging far behind the rest of the district both in terms of education and literacy achievements.
0
1000
2000
3000
4000
5000
6000
Dar
jeel
ing
Jalp
aigu
ri
Cooc
hbeh
ar
Utt
ar D
inaj
pur
Dak
shin
Din
ajpu
r
Mal
da
Mur
shid
abad
Birb
hum
Bard
dham
an
Bank
ura
Puru
lia
Pasc
him
Med
inip
ur
Purb
a M
edin
ipur
Nad
ia
Hoo
ghly
How
rah
Kolk
ata
N24
-Par
gana
s
S24-
Parg
anas
Primary Schools Middle Schools Sec/HS Schools
Schools in West Bengal Districts 2005
0
5
10
15
20
25
30
35
Dar
jeel
ing
Jalp
aigu
ri
Cooc
hbeh
ar
Utt
ar D
inaj
pur
Dak
shin
Din
ajpu
r
Mal
da
Mur
shid
abad
Birb
hum
Bard
dham
an
Bank
ura
Puru
lia
Pasc
him
Med
inip
ur
Purb
a M
edin
ipur
Nad
ia
Hoo
ghly
How
rah
Kolk
ata
N24
-Par
gana
s
S24-
Parg
anas
Thou
sand
s
Primary Teachers Middle School Teachers Sec/HS Teachers
School Staffing in West Bengal Districts 2005
0200400600800
1000120014001600
Dar
jeel
ing
Jalp
aigu
ri
Cooc
hbeh
ar
Utt
ar D
inaj
pur
Dak
shin
Din
ajpu
r
Mal
da
Mur
shid
abad
Birb
hum
Bard
dham
an
Bank
ura
Puru
lia
Pasc
him
Med
inip
ur
Purb
a M
edin
ipur
Nad
ia
Hoo
ghly
How
rah
Kolk
ata
N24
-Par
gana
s
S24-
Parg
anas
Thou
sand
s
Cl1-5 Enrolment Cl6-8 Enrolment Cl9-12 Enrolment
Student Enrolments in West Bengal Districts 2005
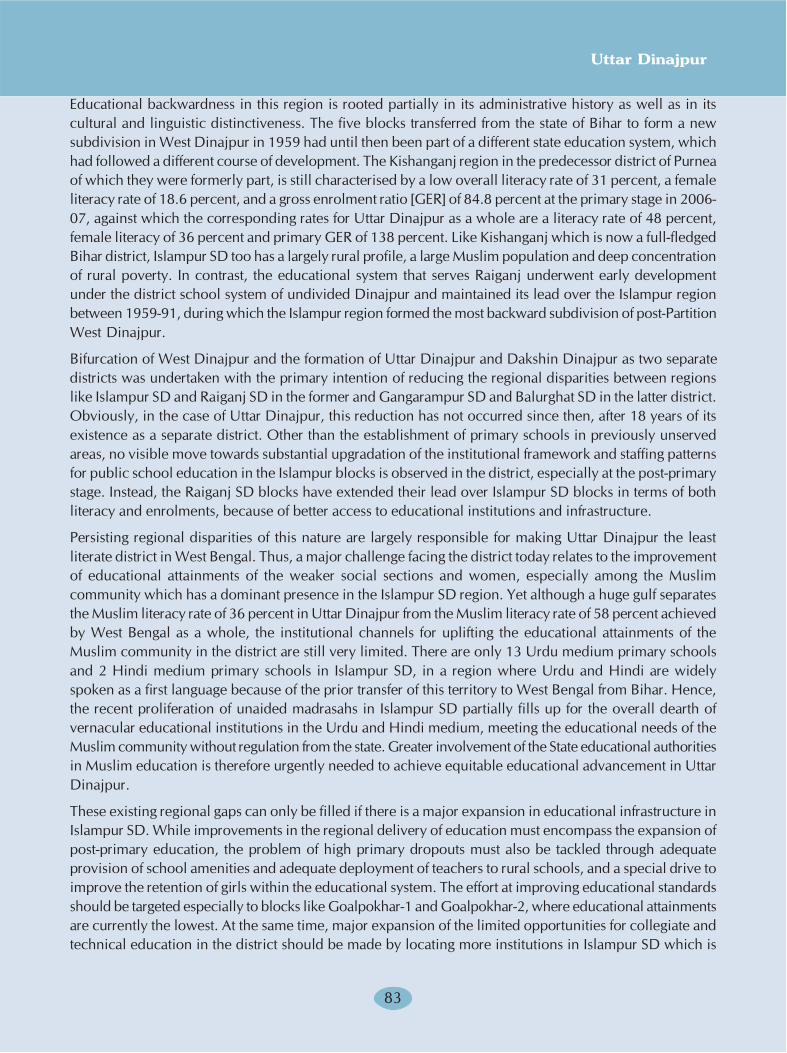
8383
Uttar Dinajpur
Educational backwardness in this region is rooted partially in its administrative history as well as in its
cultural and linguistic distinctiveness. The five blocks transferred from the state of Bihar to form a new
subdivision in West Dinajpur in 1959 had until then been part of a different state education system, which
had followed a different course of development. The Kishanganj region in the predecessor district of Purnea
of which they were formerly part, is still characterised by a low overall literacy rate of 31 percent, a female
literacy rate of 18.6 percent, and a gross enrolment ratio [GER] of 84.8 percent at the primary stage in 2006-
07, against which the corresponding rates for Uttar Dinajpur as a whole are a literacy rate of 48 percent,
female literacy of 36 percent and primary GER of 138 percent. Like Kishanganj which is now a full-fledged
Bihar district, Islampur SD too has a largely rural profile, a large Muslim population and deep concentration
of rural poverty. In contrast, the educational system that serves Raiganj underwent early development
under the district school system of undivided Dinajpur and maintained its lead over the Islampur region
between 1959-91, during which the Islampur region formed the most backward subdivision of post-Partition
West Dinajpur.
Bifurcation of West Dinajpur and the formation of Uttar Dinajpur and Dakshin Dinajpur as two separate
districts was undertaken with the primary intention of reducing the regional disparities between regions
like Islampur SD and Raiganj SD in the former and Gangarampur SD and Balurghat SD in the latter district.
Obviously, in the case of Uttar Dinajpur, this reduction has not occurred since then, after 18 years of its
existence as a separate district. Other than the establishment of primary schools in previously unserved
areas, no visible move towards substantial upgradation of the institutional framework and staffing patterns
for public school education in the Islampur blocks is observed in the district, especially at the post-primary
stage. Instead, the Raiganj SD blocks have extended their lead over Islampur SD blocks in terms of both
literacy and enrolments, because of better access to educational institutions and infrastructure.
Persisting regional disparities of this nature are largely responsible for making Uttar Dinajpur the least
literate district in West Bengal. Thus, a major challenge facing the district today relates to the improvement
of educational attainments of the weaker social sections and women, especially among the Muslim
community which has a dominant presence in the Islampur SD region. Yet although a huge gulf separates
the Muslim literacy rate of 36 percent in Uttar Dinajpur from the Muslim literacy rate of 58 percent achieved
by West Bengal as a whole, the institutional channels for uplifting the educational attainments of the
Muslim community in the district are still very limited. There are only 13 Urdu medium primary schools
and 2 Hindi medium primary schools in Islampur SD, in a region where Urdu and Hindi are widely
spoken as a first language because of the prior transfer of this territory to West Bengal from Bihar. Hence,
the recent proliferation of unaided madrasahs in Islampur SD partially fills up for the overall dearth of
vernacular educational institutions in the Urdu and Hindi medium, meeting the educational needs of the
Muslim community without regulation from the state. Greater involvement of the State educational authorities
in Muslim education is therefore urgently needed to achieve equitable educational advancement in Uttar
Dinajpur.
These existing regional gaps can only be filled if there is a major expansion in educational infrastructure in
Islampur SD. While improvements in the regional delivery of education must encompass the expansion of
post-primary education, the problem of high primary dropouts must also be tackled through adequate
provision of school amenities and adequate deployment of teachers to rural schools, and a special drive to
improve the retention of girls within the educational system. The effort at improving educational standards
should be targeted especially to blocks like Goalpokhar-1 and Goalpokhar-2, where educational attainments
are currently the lowest. At the same time, major expansion of the limited opportunities for collegiate and
technical education in the district should be made by locating more institutions in Islampur SD which is
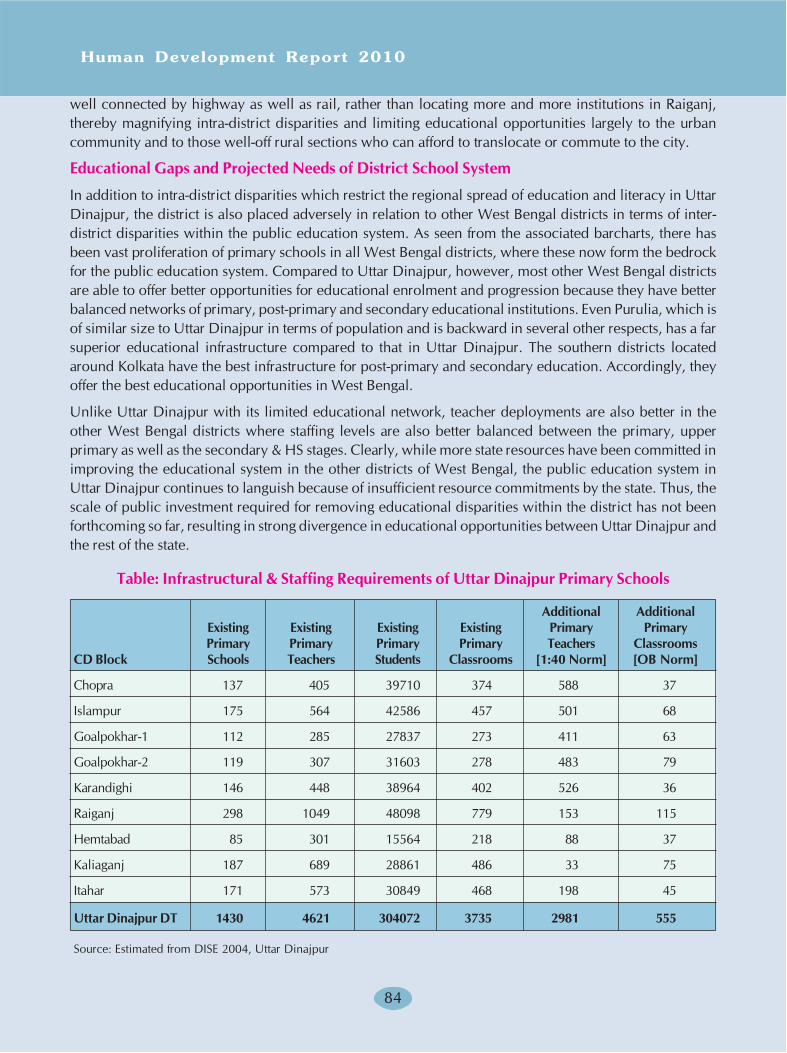
Human Development Report 2010
84
well connected by highway as well as rail, rather than locating more and more institutions in Raiganj,
thereby magnifying intra-district disparities and limiting educational opportunities largely to the urban
community and to those well-off rural sections who can afford to translocate or commute to the city.
Educational Gaps and Projected Needs of District School System
In addition to intra-district disparities which restrict the regional spread of education and literacy in Uttar
Dinajpur, the district is also placed adversely in relation to other West Bengal districts in terms of inter-
district disparities within the public education system. As seen from the associated barcharts, there has
been vast proliferation of primary schools in all West Bengal districts, where these now form the bedrock
for the public education system. Compared to Uttar Dinajpur, however, most other West Bengal districts
are able to offer better opportunities for educational enrolment and progression because they have better
balanced networks of primary, post-primary and secondary educational institutions. Even Purulia, which is
of similar size to Uttar Dinajpur in terms of population and is backward in several other respects, has a far
superior educational infrastructure compared to that in Uttar Dinajpur. The southern districts located
around Kolkata have the best infrastructure for post-primary and secondary education. Accordingly, they
offer the best educational opportunities in West Bengal.
Unlike Uttar Dinajpur with its limited educational network, teacher deployments are also better in the
other West Bengal districts where staffing levels are also better balanced between the primary, upper
primary as well as the secondary & HS stages. Clearly, while more state resources have been committed in
improving the educational system in the other districts of West Bengal, the public education system in
Uttar Dinajpur continues to languish because of insufficient resource commitments by the state. Thus, the
scale of public investment required for removing educational disparities within the district has not been
forthcoming so far, resulting in strong divergence in educational opportunities between Uttar Dinajpur and
the rest of the state.
Table: Infrastructural & Staffing Requirements of Uttar Dinajpur Primary Schools
Additional Additional
Existing Existing Existing Existing Primary Primary
Primary Primary Primary Primary Teachers Classrooms
CD Block Schools Teachers Students Classrooms [1:40 Norm] [OB Norm]
Chopra 137 405 39710 374 588 37
Islampur 175 564 42586 457 501 68
Goalpokhar-1 112 285 27837 273 411 63
Goalpokhar-2 119 307 31603 278 483 79
Karandighi 146 448 38964 402 526 36
Raiganj 298 1049 48098 779 153 115
Hemtabad 85 301 15564 218 88 37
Kaliaganj 187 689 28861 486 33 75
Itahar 171 573 30849 468 198 45
Uttar Dinajpur DT 1430 4621 304072 3735 2981 555
Source: Estimated from DISE 2004, Uttar Dinajpur
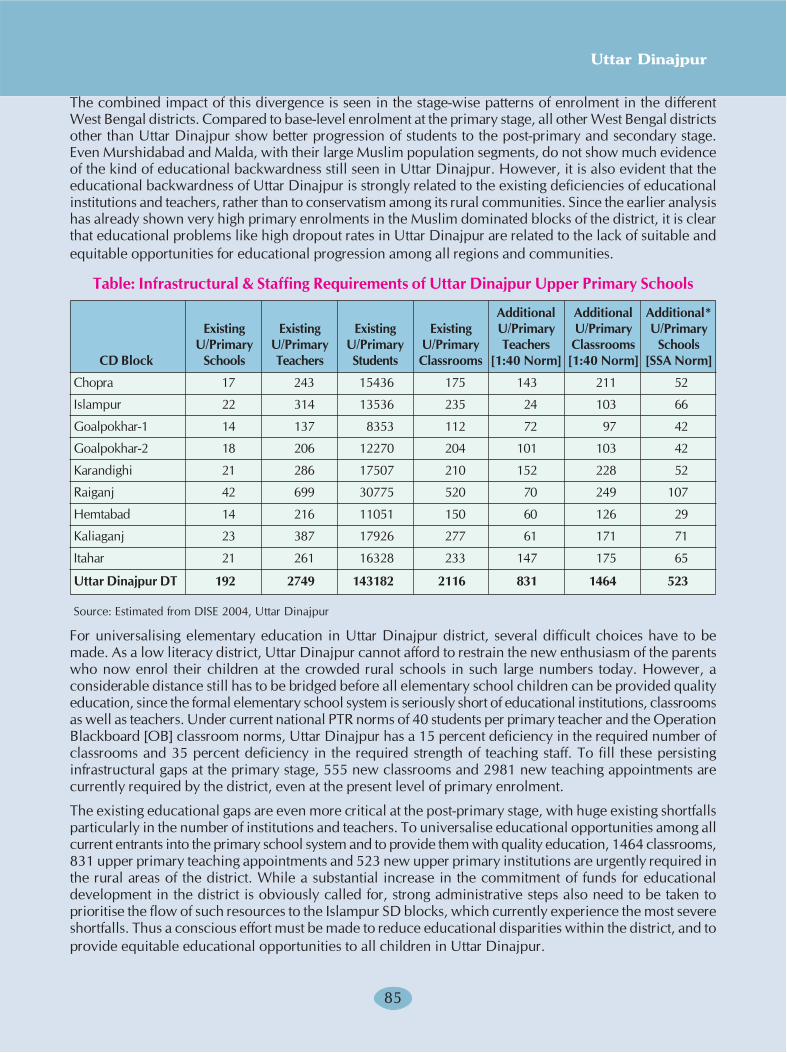
8585
Uttar Dinajpur
The combined impact of this divergence is seen in the stage-wise patterns of enrolment in the different
West Bengal districts. Compared to base-level enrolment at the primary stage, all other West Bengal districts
other than Uttar Dinajpur show better progression of students to the post-primary and secondary stage.
Even Murshidabad and Malda, with their large Muslim population segments, do not show much evidence
of the kind of educational backwardness still seen in Uttar Dinajpur. However, it is also evident that the
educational backwardness of Uttar Dinajpur is strongly related to the existing deficiencies of educational
institutions and teachers, rather than to conservatism among its rural communities. Since the earlier analysis
has already shown very high primary enrolments in the Muslim dominated blocks of the district, it is clear
that educational problems like high dropout rates in Uttar Dinajpur are related to the lack of suitable and
equitable opportunities for educational progression among all regions and communities.
Table: Infrastructural & Staffing Requirements of Uttar Dinajpur Upper Primary Schools
Additional Additional Additional*
Existing Existing Existing Existing U/Primary U/Primary U/Primary
U/Primary U/Primary U/Primary U/Primary Teachers Classrooms Schools
CD Block Schools Teachers Students Classrooms [1:40 Norm] [1:40 Norm] [SSA Norm]
Chopra 17 243 15436 175 143 211 52
Islampur 22 314 13536 235 24 103 66
Goalpokhar-1 14 137 8353 112 72 97 42
Goalpokhar-2 18 206 12270 204 101 103 42
Karandighi 21 286 17507 210 152 228 52
Raiganj 42 699 30775 520 70 249 107
Hemtabad 14 216 11051 150 60 126 29
Kaliaganj 23 387 17926 277 61 171 71
Itahar 21 261 16328 233 147 175 65
Uttar Dinajpur DT 192 2749 143182 2116 831 1464 523
Source: Estimated from DISE 2004, Uttar Dinajpur
For universalising elementary education in Uttar Dinajpur district, several difficult choices have to be
made. As a low literacy district, Uttar Dinajpur cannot afford to restrain the new enthusiasm of the parents
who now enrol their children at the crowded rural schools in such large numbers today. However, a
considerable distance still has to be bridged before all elementary school children can be provided quality
education, since the formal elementary school system is seriously short of educational institutions, classrooms
as well as teachers. Under current national PTR norms of 40 students per primary teacher and the Operation
Blackboard [OB] classroom norms, Uttar Dinajpur has a 15 percent deficiency in the required number of
classrooms and 35 percent deficiency in the required strength of teaching staff. To fill these persisting
infrastructural gaps at the primary stage, 555 new classrooms and 2981 new teaching appointments are
currently required by the district, even at the present level of primary enrolment.
The existing educational gaps are even more critical at the post-primary stage, with huge existing shortfalls
particularly in the number of institutions and teachers. To universalise educational opportunities among all
current entrants into the primary school system and to provide them with quality education, 1464 classrooms,
831 upper primary teaching appointments and 523 new upper primary institutions are urgently required in
the rural areas of the district. While a substantial increase in the commitment of funds for educational
development in the district is obviously called for, strong administrative steps also need to be taken to
prioritise the flow of such resources to the Islampur SD blocks, which currently experience the most severe
shortfalls. Thus a conscious effort must be made to reduce educational disparities within the district, and to
provide equitable educational opportunities to all children in Uttar Dinajpur.

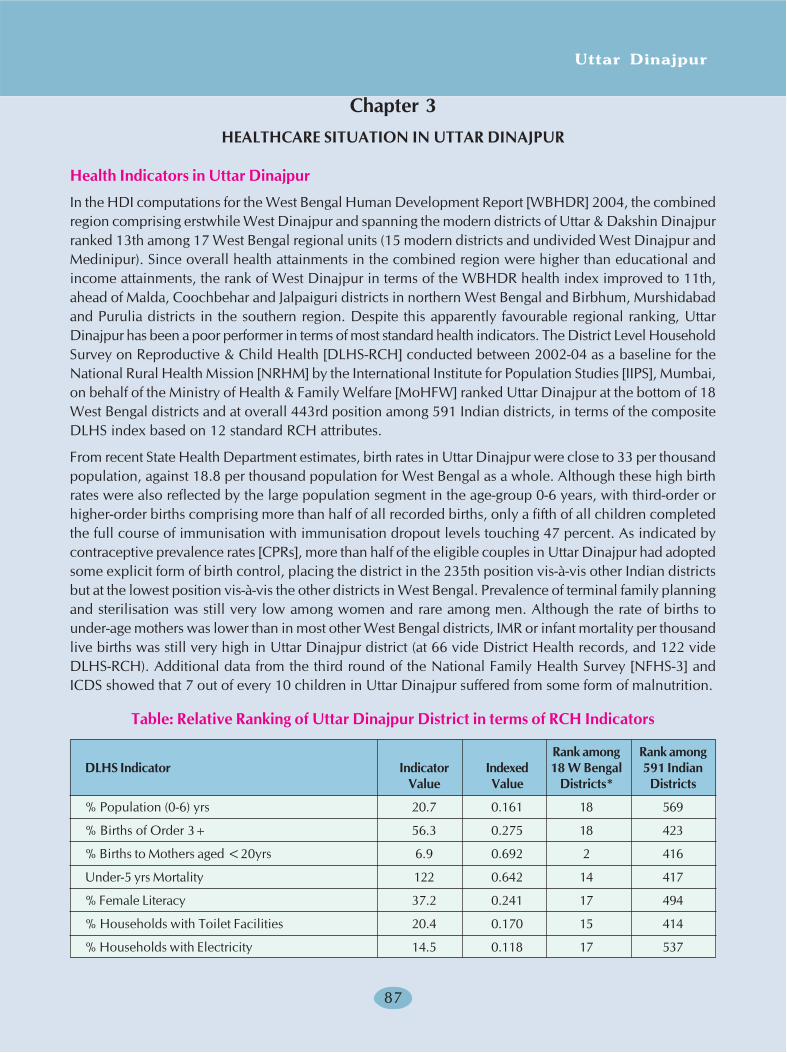
Uttar Dinajpur
87
Chapter 3HEALTHCARE SITUATION IN UTTAR DINAJPUR
Health Indicators in Uttar Dinajpur
In the HDI computations for the West Bengal Human Development Report [WBHDR] 2004, the combinedregion comprising erstwhile West Dinajpur and spanning the modern districts of Uttar & Dakshin Dinajpurranked 13th among 17 West Bengal regional units (15 modern districts and undivided West Dinajpur andMedinipur). Since overall health attainments in the combined region were higher than educational andincome attainments, the rank of West Dinajpur in terms of the WBHDR health index improved to 11th,ahead of Malda, Coochbehar and Jalpaiguri districts in northern West Bengal and Birbhum, Murshidabadand Purulia districts in the southern region. Despite this apparently favourable regional ranking, UttarDinajpur has been a poor performer in terms of most standard health indicators. The District Level HouseholdSurvey on Reproductive & Child Health [DLHS-RCH] conducted between 2002-04 as a baseline for theNational Rural Health Mission [NRHM] by the International Institute for Population Studies [IIPS], Mumbai,on behalf of the Ministry of Health & Family Welfare [MoHFW] ranked Uttar Dinajpur at the bottom of 18West Bengal districts and at overall 443rd position among 591 Indian districts, in terms of the compositeDLHS index based on 12 standard RCH attributes.
From recent State Health Department estimates, birth rates in Uttar Dinajpur were close to 33 per thousandpopulation, against 18.8 per thousand population for West Bengal as a whole. Although these high birthrates were also reflected by the large population segment in the age-group 0-6 years, with third-order orhigher-order births comprising more than half of all recorded births, only a fifth of all children completedthe full course of immunisation with immunisation dropout levels touching 47 percent. As indicated bycontraceptive prevalence rates [CPRs], more than half of the eligible couples in Uttar Dinajpur had adoptedsome explicit form of birth control, placing the district in the 235th position vis-à-vis other Indian districtsbut at the lowest position vis-à-vis the other districts in West Bengal. Prevalence of terminal family planningand sterilisation was still very low among women and rare among men. Although the rate of births tounder-age mothers was lower than in most other West Bengal districts, IMR or infant mortality per thousandlive births was still very high in Uttar Dinajpur district (at 66 vide District Health records, and 122 videDLHS-RCH). Additional data from the third round of the National Family Health Survey [NFHS-3] andICDS showed that 7 out of every 10 children in Uttar Dinajpur suffered from some form of malnutrition.
Table: Relative Ranking of Uttar Dinajpur District in terms of RCH Indicators
Rank among Rank amongDLHS Indicator Indicator Indexed 18 W Bengal 591 Indian
Value Value Districts* Districts
% Population (0-6) yrs 20.7 0.161 18 569
% Births of Order 3+ 56.3 0.275 18 423
% Births to Mothers aged <20yrs 6.9 0.692 2 416
Under-5 yrs Mortality 122 0.642 14 417
% Female Literacy 37.2 0.241 17 494
% Households with Toilet Facilities 20.4 0.170 15 414
% Households with Electricity 14.5 0.118 17 537
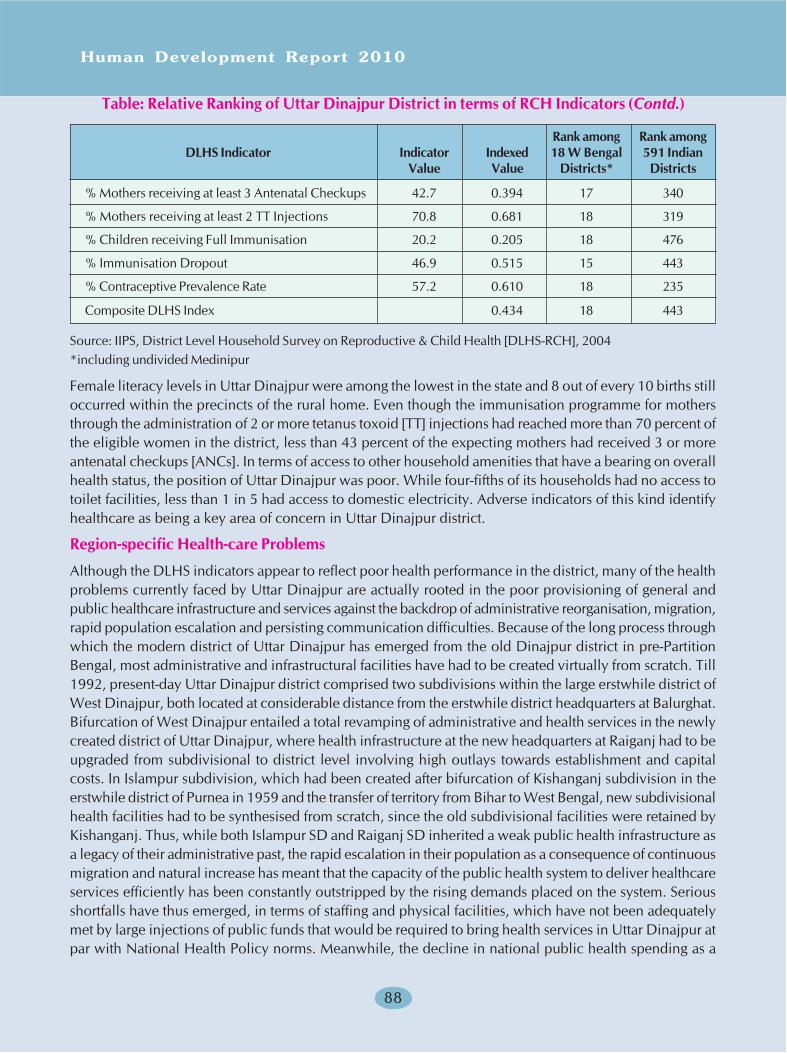
Human Development Report 2010
88
% Mothers receiving at least 3 Antenatal Checkups 42.7 0.394 17 340
% Mothers receiving at least 2 TT Injections 70.8 0.681 18 319
% Children receiving Full Immunisation 20.2 0.205 18 476
% Immunisation Dropout 46.9 0.515 15 443
% Contraceptive Prevalence Rate 57.2 0.610 18 235
Composite DLHS Index 0.434 18 443
Source: IIPS, District Level Household Survey on Reproductive & Child Health [DLHS-RCH], 2004*including undivided Medinipur
Female literacy levels in Uttar Dinajpur were among the lowest in the state and 8 out of every 10 births stilloccurred within the precincts of the rural home. Even though the immunisation programme for mothersthrough the administration of 2 or more tetanus toxoid [TT] injections had reached more than 70 percent ofthe eligible women in the district, less than 43 percent of the expecting mothers had received 3 or moreantenatal checkups [ANCs]. In terms of access to other household amenities that have a bearing on overallhealth status, the position of Uttar Dinajpur was poor. While four-fifths of its households had no access totoilet facilities, less than 1 in 5 had access to domestic electricity. Adverse indicators of this kind identifyhealthcare as being a key area of concern in Uttar Dinajpur district.
Region-specific Health-care Problems
Although the DLHS indicators appear to reflect poor health performance in the district, many of the healthproblems currently faced by Uttar Dinajpur are actually rooted in the poor provisioning of general andpublic healthcare infrastructure and services against the backdrop of administrative reorganisation, migration,rapid population escalation and persisting communication difficulties. Because of the long process throughwhich the modern district of Uttar Dinajpur has emerged from the old Dinajpur district in pre-PartitionBengal, most administrative and infrastructural facilities have had to be created virtually from scratch. Till1992, present-day Uttar Dinajpur district comprised two subdivisions within the large erstwhile district ofWest Dinajpur, both located at considerable distance from the erstwhile district headquarters at Balurghat.Bifurcation of West Dinajpur entailed a total revamping of administrative and health services in the newlycreated district of Uttar Dinajpur, where health infrastructure at the new headquarters at Raiganj had to beupgraded from subdivisional to district level involving high outlays towards establishment and capitalcosts. In Islampur subdivision, which had been created after bifurcation of Kishanganj subdivision in theerstwhile district of Purnea in 1959 and the transfer of territory from Bihar to West Bengal, new subdivisionalhealth facilities had to be synthesised from scratch, since the old subdivisional facilities were retained byKishanganj. Thus, while both Islampur SD and Raiganj SD inherited a weak public health infrastructure asa legacy of their administrative past, the rapid escalation in their population as a consequence of continuousmigration and natural increase has meant that the capacity of the public health system to deliver healthcareservices efficiently has been constantly outstripped by the rising demands placed on the system. Seriousshortfalls have thus emerged, in terms of staffing and physical facilities, which have not been adequatelymet by large injections of public funds that would be required to bring health services in Uttar Dinajpur atpar with National Health Policy norms. Meanwhile, the decline in national public health spending as a
Table: Relative Ranking of Uttar Dinajpur District in terms of RCH Indicators (Contd.)
Rank among Rank amongDLHS Indicator Indicator Indexed 18 W Bengal 591 Indian
Value Value Districts* Districts
Uttar Dinajpur
89
direct consequence of the economic reforms instituted in 1991 has resulted in an inevitable slowdown inthe process of public healthcare provisioning, where an acceleration was actually required.
Since the gaps in the public health infrastructure in Uttar Dinajpur, which were already wide, have beenwidened further, the health system is unable to handle its present loads. The elongated geography of thedistrict and the presence of long international and interstate borders to the east and west multiplies theproblems of rural health service delivery, since the location of health subcentres [SHCs] and primary healthcentres [PHCs] cannot be efficiently planned on the usual radial principle. For the same reason, theinfrastructure of rural roads is poor, increasing access difficulties for persons seeking healthcare. Mostprivate and public health facilities located in the narrow 'chicken's neck' corridor area adjoining Bihar alsohave to provide healthcare services to interstate users from both sides of the border. Similar situations alsorecur along the new interdistrict boundary with Dakshin Dinajpur where a portion of the erstwhile Raiganjsubdivision of the undivided West Dinajpur district has been transferred to Dakshin Dinajpur. Because ofpast dependency patterns and proximity, health facilities located within the newly reconstituted RaiganjSD also provide healthcare services to users from adjoining areas in Dakshin Dinajpur, as is most visible inthe case of the State General Hospital at Kaliaganj. Such region-specific problems that are not encounteredin most developed districts in India and West Bengal, contribute to the inadequate delivery of rural healthservices in Uttar Dinajpur district.
Other factors which are responsible for overall social and economic backwardness in the district alsoexercise an adverse influence on the general state of human development and public health, including thelarge numeric presence of socially underprivileged ethnocultural groups such as SCs, STs and Muslimswithin the district, among whom literacy achievements are poor and economic poverty is endemically veryhigh. Low female literacy attainments also have a direct bearing on the adverse state of maternal and childhealth. Along with rapid population growth, high rates of inward and outward migration lead to populationtransience, multiplying the spread of communicable disease as well as major public health hazards likeHIV/AIDS.
While the present human development and health situations in Uttar Dinajpur amalgamate all theseinstitutional and infrastructural difficulties, they also reflect most of the generic problems affecting theperformance of the public healthcare system in India, based upon the decline in public health investment,poor provisioning of rural healthcare and widening disparities between rural and urban health standards.Uttar Dinajpur nevertheless suffers much more than most other districts in this respect. The long process ofadministrative reorganisation that commenced in 1992 has imposed additional capital costs on the healthsystem and is still far from complete. Many of the present weaknesses in the public healthcare system,which have thus been inherited from the past, place the district among the lowest ranked districts in thecountry. The physical provisioning and staffing of rural health institutions, particularly at SHC and PHClevel is too poor for the referral system to work with any degree of efficiency. While this is also generallytrue for most other districts in India, the institutional gaps visible in Uttar Dinajpur are particularly severe,because of the region-specific reasons described above. Yet in spite of this huge inherited backlog, thepresent level of public health spending is too low to bring about the radical turnarounds in healthcareservices that are required by the district. Although the Indian experiment with health sector reforms since1991 has repeatedly shown that public expenditure gaps cannot be filled by private health investments,budget appropriations for the health sector have declined further when they should have increased. Theoverall human development impact on socially and economically backward population segments has beenmost adverse in districts like Uttar Dinajpur, which ranks among the most deprived districts in the countryin health terms. Thus for a proper understanding of critical health issues to emerge, current health situationswithin the district have to be examined against the National Health Policy frame.

Human Development Report 2010
90
BOX-CHART: Typical Structure of District Referral Healthcare System
Sub-
divisional/
BPHCs/ State District
Rural General
Health Services Provided SHCs PHCs Hospitals Hospitals Hospital
Preventive Healthcare Services
Immunisation of Mothers & Children Yes Yes Yes Yes* Yes*
Public Health Services
Prevention & Control of Communicable Diseases Yes Yes Yes - -
Family Welfare Services
Distribution of Oral Polio Vaccine [OPV], Iron & Folic Acid Yes Yes Yes Yes* Yes*
[IFA] Tablets etc
Ante-natal & Post-natal Services Yes Yes Yes Yes* Yes*
IUD Insertions Yes Yes Yes Yes* Yes*
Safe Deliveries Yes Yes Yes Yes* Yes*
Information, Education & Communication [IEC] Services
Generation of Health Awareness Yes Yes Yes - -
Epidemic Control Yes Yes Yes - -
Treatment & Referral Services
Treatment of Minor Ailments - Yes - - -
Indoor Odd-Hour Admissions prior to Referral - - Yes - -
Indoor Admissions for Curative Treatment - - - Yes Yes
Laboratory Services - - Yes Yes Yes
Referral to PHCs Yes - - - -
Referral to RH/BPHCs - Yes - - -
Referral to SDH/SGH - - Yes - -
Referral to DH - - - Yes -
Referral to Regional Medical College & Hospital - - - - Yes
Administrative Services
Supervision & Monitoring - Yes Yes Yes Yes
*Through Post-Partum [PP] Units/Urban Family Welfare Centres [FWCs]
Health Policy Framework
Public healthcare has been a major component of social welfare policy in India since Independence.
Primary and secondary healthcare services at district level are now provided through a decentralised referral
chain extending vertically from the health subcentres at the rural base to the district hospitals at the apex.
The National Health Policy 1983 made universalisation of primary healthcare services, the cornerstone of
public health policy during the Sixth Five-Year Plan. Since under constitutional provisions, primary healthcare
is included in the State list, the onus for mobilising adequate resources to achieve the ambitious target of
Uttar Dinajpur
91
Health for All by the year 2000 fell largely to the lot of the State Governments. However serious gaps hademerged within the healthcare system by the time the revised National Health Policy 2002 was announced,because of inadequate public investment in the health sector. Between 1990-1999, public health investmentdeclined in proportionate terms from 1.3 percent to 0.9 percent of GDP [NHP 2002]. Although aggregateexpenditure on healthcare in India rose cumulatively to 5.2 percent of GDP over the same period, less thana fifth of this was supported by public expenditure, and the remainder comprised out-of-pocket expensesborne personally by healthcare-seekers who were also compelled to depend increasingly on privatehealthcare providers. While total budgetary appropriations for the health sector in the Union Budget remainedstationary at 1.3 percent, the severe revenue crunches encountered by all State Governments over theperiod since 1991 reduced healthcare appropriations in the State budgets from 7.0 percent to 5.5 percent.Consequently, since the targets set for expansion of the primary healthcare system could not be adequatelymet, the outreach and quality of public healthcare services fell significantly short of desired standards.
The principal problems that currently confront the public healthcare system in India include
(i) persisting inadequacies in public health infrastructure
(ii) overcrowding of medical facilities
(iii) insufficient investment on outdoor medical facilities
(iv) inadequate staffing by medical and paramedical personnel
(v) shortages in medical stores and equipment, and
(vi) inadequate provision of essential generic drugs
all of which have led to sharp deterioration in the quality of public healthcare services. For the country asa whole, the total institutional shortfall in healthcare facilities at all levels, in relation to population norms,was estimated at 16 percent in 2000. However, for community referral institutions or CHCs, the shortfallwas as high as 58 percent. In such circumstances, it was estimated that less than 20 percent of all patientsseeking outdoor medical services and less than 45 percent of all indoor patients preferred to attend publichealthcare institutions, while the rest sought healthcare from private facilities.
Recognising such persisting difficulties, the National Health Policy 2002 stressed that substantial resourceswould have to be committed by the Central Government to the public health system in a phased manner,in order to ensure equitable access to healthcare services. The reworked healthcare strategy formulatedunder NHP 2002 thus envisaged
- creation of a well distributed network of primary healthcare services closely interlinked withhealth education and extension
- health intermediation through the agency of trained health volunteers who would form anessential link between the community and the healthcare institutions
- establishment and strengthening of the decentralised referral healthcare system to reduce excesspatient loads on secondary and tertiary facilities by ensuring that most basic healthcare serviceswere accessible as required at the nearest referral units
- more even dispersal of speciality and super-speciality services, with the involvement of privateinvestment for meeting the needs of paying patients, so that free public facilities wereincreasingly availed by poorer users
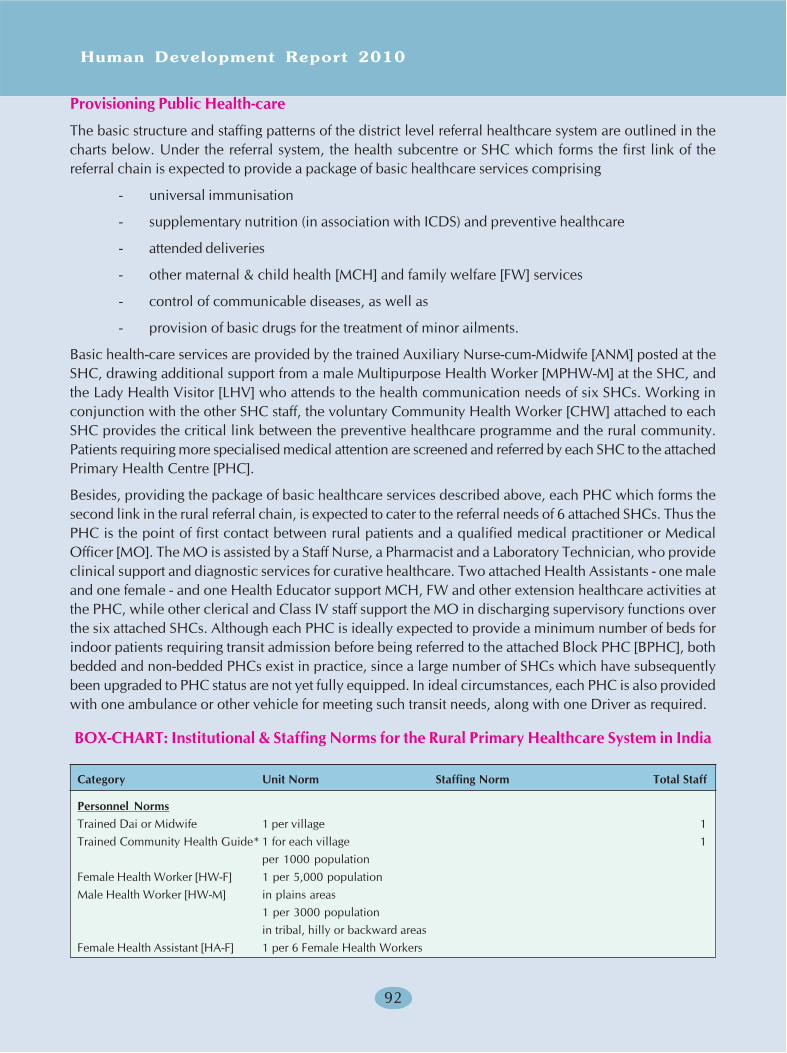
Human Development Report 2010
92
Provisioning Public Health-care
The basic structure and staffing patterns of the district level referral healthcare system are outlined in thecharts below. Under the referral system, the health subcentre or SHC which forms the first link of thereferral chain is expected to provide a package of basic healthcare services comprising
- universal immunisation
- supplementary nutrition (in association with ICDS) and preventive healthcare
- attended deliveries
- other maternal & child health [MCH] and family welfare [FW] services
- control of communicable diseases, as well as
- provision of basic drugs for the treatment of minor ailments.
Basic health-care services are provided by the trained Auxiliary Nurse-cum-Midwife [ANM] posted at theSHC, drawing additional support from a male Multipurpose Health Worker [MPHW-M] at the SHC, andthe Lady Health Visitor [LHV] who attends to the health communication needs of six SHCs. Working inconjunction with the other SHC staff, the voluntary Community Health Worker [CHW] attached to eachSHC provides the critical link between the preventive healthcare programme and the rural community.Patients requiring more specialised medical attention are screened and referred by each SHC to the attachedPrimary Health Centre [PHC].
Besides, providing the package of basic healthcare services described above, each PHC which forms thesecond link in the rural referral chain, is expected to cater to the referral needs of 6 attached SHCs. Thus thePHC is the point of first contact between rural patients and a qualified medical practitioner or MedicalOfficer [MO]. The MO is assisted by a Staff Nurse, a Pharmacist and a Laboratory Technician, who provideclinical support and diagnostic services for curative healthcare. Two attached Health Assistants - one maleand one female - and one Health Educator support MCH, FW and other extension healthcare activities atthe PHC, while other clerical and Class IV staff support the MO in discharging supervisory functions overthe six attached SHCs. Although each PHC is ideally expected to provide a minimum number of beds forindoor patients requiring transit admission before being referred to the attached Block PHC [BPHC], bothbedded and non-bedded PHCs exist in practice, since a large number of SHCs which have subsequentlybeen upgraded to PHC status are not yet fully equipped. In ideal circumstances, each PHC is also providedwith one ambulance or other vehicle for meeting such transit needs, along with one Driver as required.
BOX-CHART: Institutional & Staffing Norms for the Rural Primary Healthcare System in India
Category Unit Norm Staffing Norm Total Staff
Personnel NormsTrained Dai or Midwife 1 per village 1Trained Community Health Guide* 1 for each village 1
per 1000 populationFemale Health Worker [HW-F] 1 per 5,000 populationMale Health Worker [HW-M] in plains areas
1 per 3000 populationin tribal, hilly or backward areas
Female Health Assistant [HA-F] 1 per 6 Female Health Workers
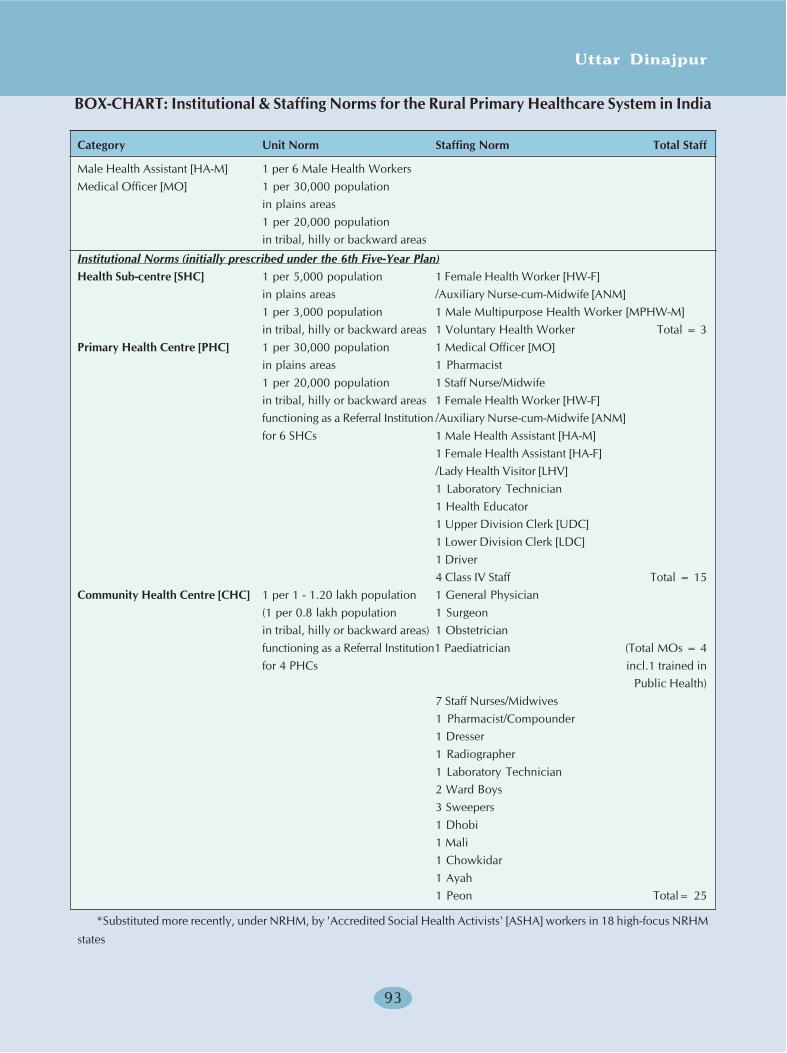
Uttar Dinajpur
93
Male Health Assistant [HA-M] 1 per 6 Male Health WorkersMedical Officer [MO] 1 per 30,000 population
in plains areas1 per 20,000 populationin tribal, hilly or backward areas
Institutional Norms (initially prescribed under the 6th Five-Year Plan)Health Sub-centre [SHC] 1 per 5,000 population 1 Female Health Worker [HW-F]
in plains areas /Auxiliary Nurse-cum-Midwife [ANM]1 per 3,000 population 1 Male Multipurpose Health Worker [MPHW-M]in tribal, hilly or backward areas 1 Voluntary Health Worker Total = 3
Primary Health Centre [PHC] 1 per 30,000 population 1 Medical Officer [MO]in plains areas 1 Pharmacist1 per 20,000 population 1 Staff Nurse/Midwifein tribal, hilly or backward areas 1 Female Health Worker [HW-F]functioning as a Referral Institution /Auxiliary Nurse-cum-Midwife [ANM]for 6 SHCs 1 Male Health Assistant [HA-M]
1 Female Health Assistant [HA-F]/Lady Health Visitor [LHV]1 Laboratory Technician1 Health Educator1 Upper Division Clerk [UDC]1 Lower Division Clerk [LDC]1 Driver4 Class IV Staff Total = 15
Community Health Centre [CHC] 1 per 1 - 1.20 lakh population 1 General Physician(1 per 0.8 lakh population 1 Surgeonin tribal, hilly or backward areas) 1 Obstetricianfunctioning as a Referral Institution1 Paediatrician (Total MOs = 4for 4 PHCs incl.1 trained in
Public Health)7 Staff Nurses/Midwives1 Pharmacist/Compounder1 Dresser1 Radiographer1 Laboratory Technician2 Ward Boys3 Sweepers1 Dhobi1 Mali1 Chowkidar1 Ayah1 Peon Total= 25
*Substituted more recently, under NRHM, by 'Accredited Social Health Activists' [ASHA] workers in 18 high-focus NRHM
states
BOX-CHART: Institutional & Staffing Norms for the Rural Primary Healthcare System in India
Category Unit Norm Staffing Norm Total Staff
Human Development Report 2010
94
In addition to several SHCs and PHCs, each community development block is also provided with a BlockPHC which functions as a community healthcare institution, handling all referrals from the PHCs andforming the apex of the rural healthcare system. The BPHC has facilities for more specialised healthcareencompassing surgery, paediatric and obstetric services, in addition to basic diagnostic services and clinicalcare, and is staffed by several MOs, nursing, technical and ancillary staff, with the requirement that at leastone MO is qualified in Public Health. Since the BPHC functions as a full-fledged hospital, several otheradjunct staff are also appointed to look after establishment needs. Ideally, since national norms require thatthere should be one Community Health Centre [CHC] for every 1-1.2 lakh population (0.8 lakh populationin tribal, hilly and other difficult areas) which would cater to the referral needs of 4 attached PHCs, a CDBlock would normally require more than one CHC in proportion to its population. However, with institutionalshortfalls being highest at this level, the BPHC usually functions as the sole clinical healthcare facilitydirectly serving the rural population. Depending on the distribution of patient loads and other technicalconsiderations, a number of BPHCs have been subsequently upgraded into 30-60 bedded Rural Hospitals[RHs] with augmented facilities for curative healthcare.
Secondary healthcare within a district is provided initially by Sub-divisional Hospitals [SDHs] or StateGeneral Hospitals [SGHs] which are 60-bedded hospitals which function as First Referral Units [FRUs],with several clinical wings that provide specialised curative healthcare to indoor patients referred by theBPHCs and RHs. The District Hospital [DH] at the apex of the referral healthcare system is usually a large300-bedded multi-speciality hospital providing secondary healthcare and pathological services to all patientsreferred upto it from any part of the district through the referral chain. Depending on their relative locationof within the catchment of the referral system, the SDH/SGH and DH may also be required to play the roleof referral units for rural areas located in close proximity to them. Thus in addition to indoor facilities, mostsecondary healthcare institutions also provide outpatient services, as well as MCH and FW services throughtheir Post-Partum [PP] units.
While rural PHCs are established and maintained by the State Health Department under the MinimumNeeds Programme [MNP] or Basic Minimum Services [BMS] Programme, basic rental and contingencycharges, expenditure on drugs and equipment kits, and salary expenditures for ANMs and LHVs at theSHCs are now supported by Central assistance under NHP 2002. Salary expenditures on male MPHWs atthe SHCs continue to be met by the State Government. BPHCs/RHs and other hospital level institutions areestablished and maintained by the State Government, but are eligible to receive Central funding for theirupgradation.
Problems in Rural Health-care Delivery
The structure of the district level referral system shows that in addition to clinical, indoor and outdoorhealthcare, all public healthcare institutions are also expected to support the family welfare and MCHprogramme activities within the district. Besides these two essential functions, the public institutions arealso required to provide technical support to various independent national programmes for vector anddisease control, each with a vertical nature of its own. Thus in face of existing institutional deficiencies andinfrastructural inadequacies, the public healthcare system is usually overloaded with programme activities,among which family welfare activities gain overall precedence. The impact of system overloading isparticularly severe at the SHCs, where the ANM is the only technically qualified staff available to look aftergrassroots health needs. The LHVs and Health Assistants deputed by the PHCs have to travel to and look
Uttar Dinajpur
95
after 5 other SHCs in the area. Much of their time and energy is devoted, in any case, towards programmeand family welfare activities. Similarly, the sole MO posted at each PHC to look after the clinical needs ofpatients referred to the PHC is additionally expected to make periodic clinical visits to all 6 SHCs whichare located at some distance from each other, besides having to look after the administrative and supervisoryneeds of the 7 health institutions (6 SHCs + 1 PHC) which make up each rural healthcare node. Even in thebest of circumstances, the rural public health system becomes overstretched and is unable to fulfil thereferral healthcare needs of the district efficiently, with particularly grave consequences for rural areas.Since in most practical situations, there are fewer SHCs, PHCs and CHCs than warranted by the size of therural population, the extent of such system pressure becomes unimaginably high and is reflected indeterioration of service quality as well the reluctance of rural residents to seek basic healthcare from localpublic institutions. This rural health gap is increasingly filled by traditional healers, other private registeredmedical practitioners [RMPs] and quack doctors who are perceived to be more efficient in providing healthservices. Meanwhile, the rates of referral to secondary healthcare institutions become unreasonably high,greatly expanding their patient loads, with the primary health facilities being bypassed altogether in manycases.
Such problems which are basically rooted in existing institutional and infrastructural deficiencies arisingfrom inadequate public health investment are then perceived as an inherent organisational weakness of thepublic healthcare system by policy advocates who wish to expand the scope of privately-provided healthservices in the sphere of rural healthcare. While the NSSO 60th Round survey on morbidity and healthcare(NSSO 2004) revealed growing awareness about health ailments in rural areas across the country,18 percentof the rural residents reporting such health ailments generally went untreated, partly because of difficultiesin access to rural healthcare and partly because of financial constraints. On the other hand, 8 out of every10 patients who sought outdoor treatment in rural and urban areas depended on private non-institutionalfacilities, and 6 out of every 10 rural and urban patients seeking hospital care depended on private institutions.Since most large public hospitals and private healthcare facilities were located in urban areas, rural patientshad to incur higher personal costs than urban patients in order to access clinical healthcare. The growingshift to private providers of healthcare, despite higher attached costs, was the combined result of overallcapacity constraints within the public healthcare system, the high system load on account of programmeand RCH related services as well as the overall perception that the quality of private health services wassomehow better than those extended by the public healthcare system, although the deterioration in thequality of public services was the result of low system capacity relative to the patient load.
Recognising the growing gravity of this problem, the National Rural Health Mission [NRHM] launched in2005 has sought to rectify this by encouraging vertical integration of all programme activities and all healthsector resources under a unified District Health Plan, under the control of a common supervising authority.Since NRHM is to run uptil 2012, it will also eventually augment the number of health staff who directlyattend to the needs of the rural population. NRHM is expected to bring about radical improvement ingrassroot rural healthcare situation, but will also expand the demand for secondary and tertiary referralservices. Hence the entire district level public healthcare system in India is due for a thorough overhaul inorder to bring system capacity in line with growing healthcare demands. This can only be accomplished ifpublic health investments by the State and Central Governments expand considerably beyond their presentlevels.
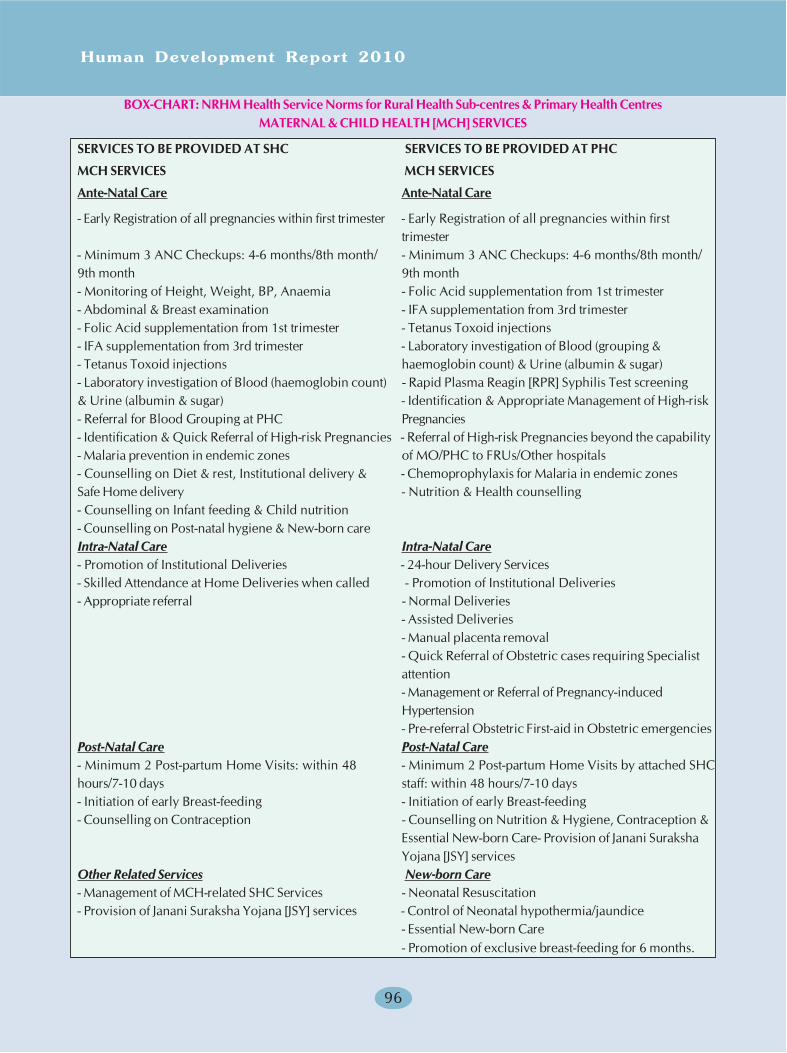
Human Development Report 2010
96
BOX-CHART: NRHM Health Service Norms for Rural Health Sub-centres & Primary Health CentresMATERNAL & CHILD HEALTH [MCH] SERVICES
SERVICES TO BE PROVIDED AT SHC SERVICES TO BE PROVIDED AT PHC
MCH SERVICES MCH SERVICES
Ante-Natal Care Ante-Natal Care
- Early Registration of all pregnancies within first trimester - Early Registration of all pregnancies within first
trimester
- Minimum 3 ANC Checkups: 4-6 months/8th month/ - Minimum 3 ANC Checkups: 4-6 months/8th month/
9th month 9th month
- Monitoring of Height, Weight, BP, Anaemia - Folic Acid supplementation from 1st trimester
- Abdominal & Breast examination - IFA supplementation from 3rd trimester
- Folic Acid supplementation from 1st trimester - Tetanus Toxoid injections
- IFA supplementation from 3rd trimester - Laboratory investigation of Blood (grouping &
- Tetanus Toxoid injections haemoglobin count) & Urine (albumin & sugar)
- Laboratory investigation of Blood (haemoglobin count) - Rapid Plasma Reagin [RPR] Syphilis Test screening
& Urine (albumin & sugar) - Identification & Appropriate Management of High-risk
- Referral for Blood Grouping at PHC Pregnancies
- Identification & Quick Referral of High-risk Pregnancies - Referral of High-risk Pregnancies beyond the capability
- Malaria prevention in endemic zones of MO/PHC to FRUs/Other hospitals
- Counselling on Diet & rest, Institutional delivery & - Chemoprophylaxis for Malaria in endemic zones
Safe Home delivery - Nutrition & Health counselling
- Counselling on Infant feeding & Child nutrition
- Counselling on Post-natal hygiene & New-born care
Intra-Natal Care Intra-Natal Care
- Promotion of Institutional Deliveries - 24-hour Delivery Services
- Skilled Attendance at Home Deliveries when called - Promotion of Institutional Deliveries
- Appropriate referral - Normal Deliveries
- Assisted Deliveries
- Manual placenta removal
- Quick Referral of Obstetric cases requiring Specialist
attention
- Management or Referral of Pregnancy-induced
Hypertension
- Pre-referral Obstetric First-aid in Obstetric emergencies
Post-Natal Care Post-Natal Care
- Minimum 2 Post-partum Home Visits: within 48 - Minimum 2 Post-partum Home Visits by attached SHC
hours/7-10 days staff: within 48 hours/7-10 days
- Initiation of early Breast-feeding - Initiation of early Breast-feeding
- Counselling on Contraception - Counselling on Nutrition & Hygiene, Contraception &
Essential New-born Care- Provision of Janani Suraksha
Yojana [JSY] services
Other Related Services New-born Care
- Management of MCH-related SHC Services - Neonatal Resuscitation
- Provision of Janani Suraksha Yojana [JSY] services - Control of Neonatal hypothermia/jaundice
- Essential New-born Care
- Promotion of exclusive breast-feeding for 6 months.
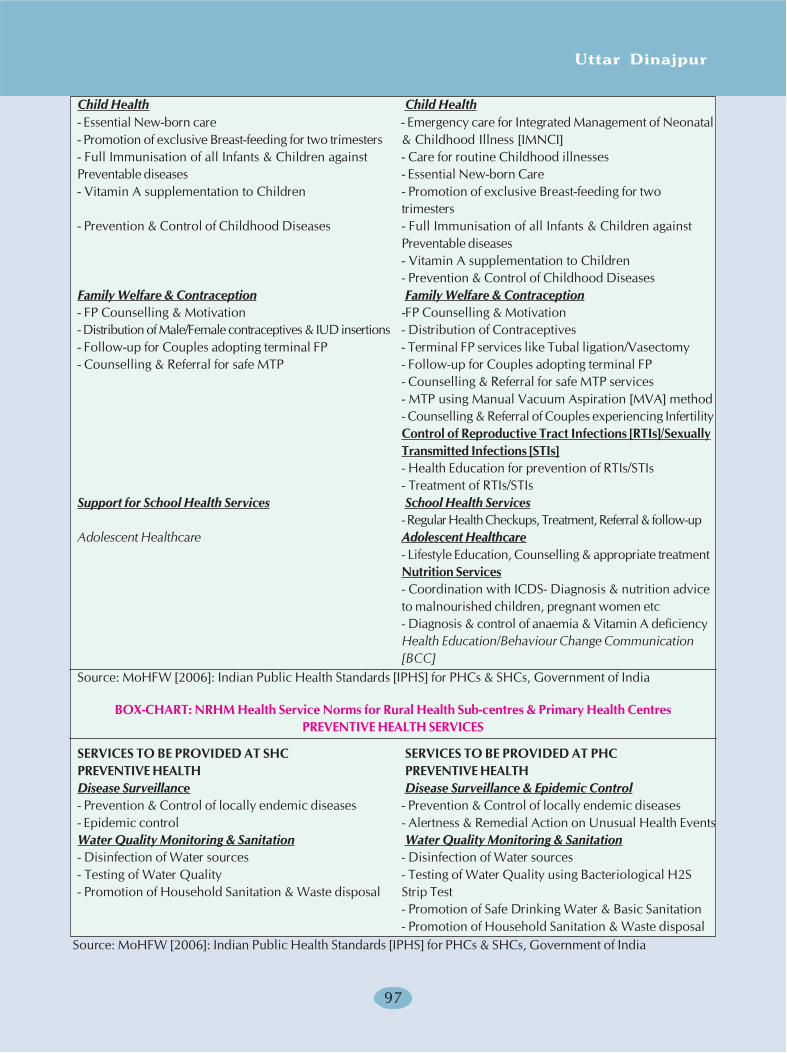
Uttar Dinajpur
97
Source: MoHFW [2006]: Indian Public Health Standards [IPHS] for PHCs & SHCs, Government of India
Child Health Child Health
- Essential New-born care - Emergency care for Integrated Management of Neonatal
- Promotion of exclusive Breast-feeding for two trimesters & Childhood Illness [IMNCI]
- Full Immunisation of all Infants & Children against - Care for routine Childhood illnesses
Preventable diseases - Essential New-born Care
- Vitamin A supplementation to Children - Promotion of exclusive Breast-feeding for two
trimesters
- Prevention & Control of Childhood Diseases - Full Immunisation of all Infants & Children against
Preventable diseases
- Vitamin A supplementation to Children
- Prevention & Control of Childhood Diseases
Family Welfare & Contraception Family Welfare & Contraception
- FP Counselling & Motivation -FP Counselling & Motivation
- Distribution of Male/Female contraceptives & IUD insertions - Distribution of Contraceptives
- Follow-up for Couples adopting terminal FP - Terminal FP services like Tubal ligation/Vasectomy
- Counselling & Referral for safe MTP - Follow-up for Couples adopting terminal FP
- Counselling & Referral for safe MTP services
- MTP using Manual Vacuum Aspiration [MVA] method
- Counselling & Referral of Couples experiencing Infertility
Control of Reproductive Tract Infections [RTIs]/Sexually
Transmitted Infections [STIs]
- Health Education for prevention of RTIs/STIs
- Treatment of RTIs/STIs
Support for School Health Services School Health Services
- Regular Health Checkups, Treatment, Referral & follow-up
Adolescent Healthcare Adolescent Healthcare
- Lifestyle Education, Counselling & appropriate treatment
Nutrition Services
- Coordination with ICDS- Diagnosis & nutrition advice
to malnourished children, pregnant women etc
- Diagnosis & control of anaemia & Vitamin A deficiency
Health Education/Behaviour Change Communication
[BCC]
Source: MoHFW [2006]: Indian Public Health Standards [IPHS] for PHCs & SHCs, Government of India
BOX-CHART: NRHM Health Service Norms for Rural Health Sub-centres & Primary Health Centres
PREVENTIVE HEALTH SERVICES
SERVICES TO BE PROVIDED AT SHC SERVICES TO BE PROVIDED AT PHC
PREVENTIVE HEALTH PREVENTIVE HEALTH
Disease Surveillance Disease Surveillance & Epidemic Control
- Prevention & Control of locally endemic diseases - Prevention & Control of locally endemic diseases
- Epidemic control - Alertness & Remedial Action on Unusual Health Events
Water Quality Monitoring & Sanitation Water Quality Monitoring & Sanitation
- Disinfection of Water sources - Disinfection of Water sources
- Testing of Water Quality - Testing of Water Quality using Bacteriological H2S
- Promotion of Household Sanitation & Waste disposal Strip Test
- Promotion of Safe Drinking Water & Basic Sanitation
- Promotion of Household Sanitation & Waste disposal
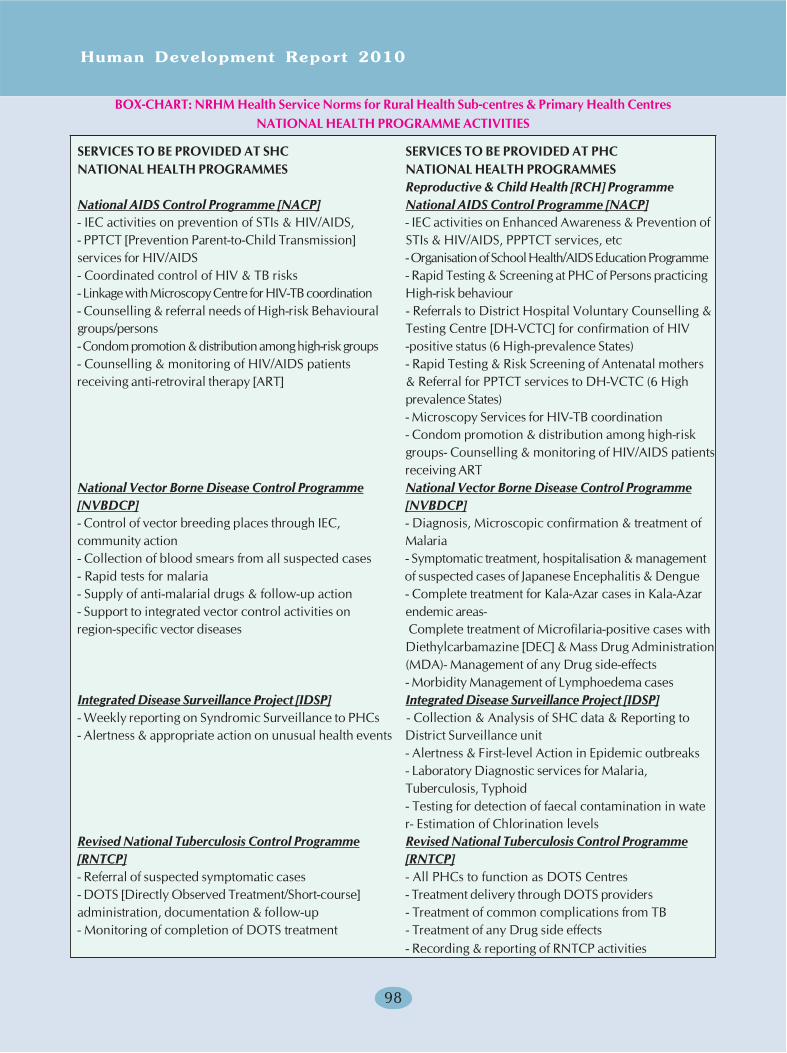
Human Development Report 2010
98
BOX-CHART: NRHM Health Service Norms for Rural Health Sub-centres & Primary Health CentresNATIONAL HEALTH PROGRAMME ACTIVITIES
SERVICES TO BE PROVIDED AT SHC SERVICES TO BE PROVIDED AT PHC
NATIONAL HEALTH PROGRAMMES NATIONAL HEALTH PROGRAMMES
Reproductive & Child Health [RCH] Programme
National AIDS Control Programme [NACP] National AIDS Control Programme [NACP]
- IEC activities on prevention of STIs & HIV/AIDS, - IEC activities on Enhanced Awareness & Prevention of
- PPTCT [Prevention Parent-to-Child Transmission] STIs & HIV/AIDS, PPPTCT services, etc
services for HIV/AIDS - Organisation of School Health/AIDS Education Programme
- Coordinated control of HIV & TB risks - Rapid Testing & Screening at PHC of Persons practicing
- Linkage with Microscopy Centre for HIV-TB coordination High-risk behaviour
- Counselling & referral needs of High-risk Behavioural - Referrals to District Hospital Voluntary Counselling &
groups/persons Testing Centre [DH-VCTC] for confirmation of HIV
- Condom promotion & distribution among high-risk groups -positive status (6 High-prevalence States)
- Counselling & monitoring of HIV/AIDS patients - Rapid Testing & Risk Screening of Antenatal mothers
receiving anti-retroviral therapy [ART] & Referral for PPTCT services to DH-VCTC (6 High
prevalence States)
- Microscopy Services for HIV-TB coordination
- Condom promotion & distribution among high-risk
groups- Counselling & monitoring of HIV/AIDS patients
receiving ART
National Vector Borne Disease Control Programme National Vector Borne Disease Control Programme
[NVBDCP] [NVBDCP]
- Control of vector breeding places through IEC, - Diagnosis, Microscopic confirmation & treatment of
community action Malaria
- Collection of blood smears from all suspected cases - Symptomatic treatment, hospitalisation & management
- Rapid tests for malaria of suspected cases of Japanese Encephalitis & Dengue
- Supply of anti-malarial drugs & follow-up action - Complete treatment for Kala-Azar cases in Kala-Azar
- Support to integrated vector control activities on endemic areas-
region-specific vector diseases Complete treatment of Microfilaria-positive cases with
Diethylcarbamazine [DEC] & Mass Drug Administration
(MDA)- Management of any Drug side-effects
- Morbidity Management of Lymphoedema cases
Integrated Disease Surveillance Project [IDSP] Integrated Disease Surveillance Project [IDSP]
- Weekly reporting on Syndromic Surveillance to PHCs - Collection & Analysis of SHC data & Reporting to
- Alertness & appropriate action on unusual health events District Surveillance unit
- Alertness & First-level Action in Epidemic outbreaks
- Laboratory Diagnostic services for Malaria,
Tuberculosis, Typhoid
- Testing for detection of faecal contamination in wate
r- Estimation of Chlorination levels
Revised National Tuberculosis Control Programme Revised National Tuberculosis Control Programme
[RNTCP] [RNTCP]
- Referral of suspected symptomatic cases - All PHCs to function as DOTS Centres
- DOTS [Directly Observed Treatment/Short-course] - Treatment delivery through DOTS providers
administration, documentation & follow-up - Treatment of common complications from TB
- Monitoring of completion of DOTS treatment - Treatment of any Drug side effects
- Recording & reporting of RNTCP activities
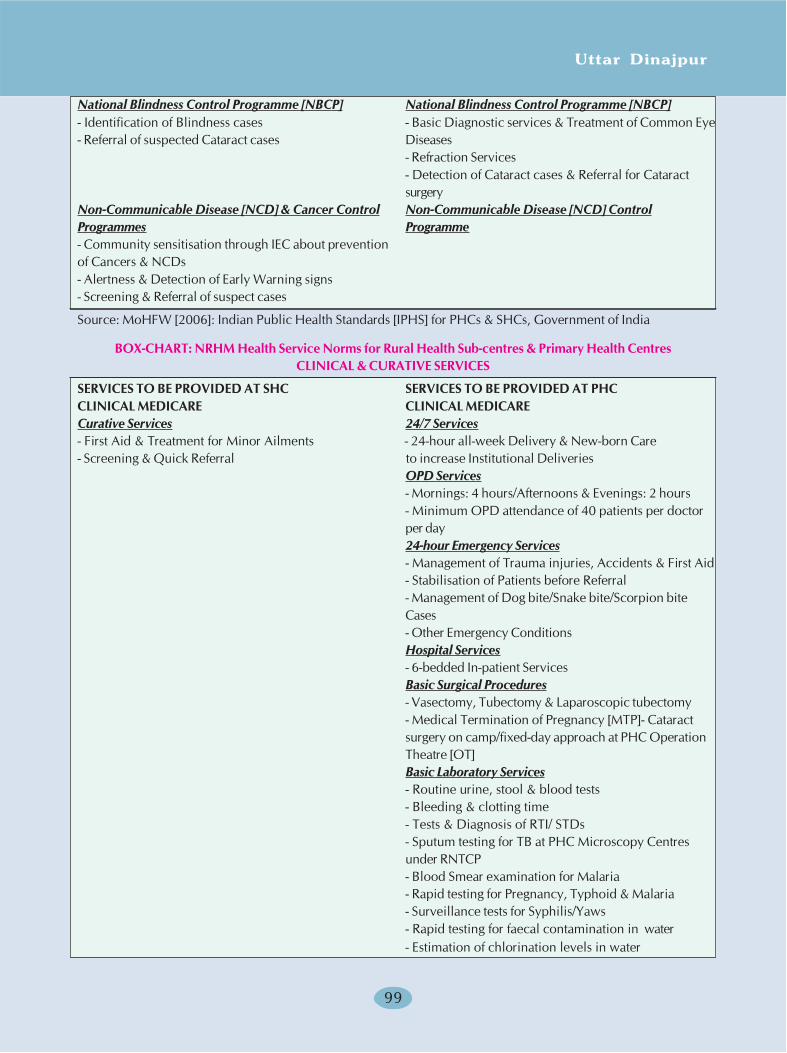
Uttar Dinajpur
99
National Blindness Control Programme [NBCP] National Blindness Control Programme [NBCP]
- Identification of Blindness cases - Basic Diagnostic services & Treatment of Common Eye
- Referral of suspected Cataract cases Diseases
- Refraction Services
- Detection of Cataract cases & Referral for Cataract
surgery
Non-Communicable Disease [NCD] & Cancer Control Non-Communicable Disease [NCD] Control
Programmes Programme
- Community sensitisation through IEC about prevention
of Cancers & NCDs
- Alertness & Detection of Early Warning signs
- Screening & Referral of suspect cases
Source: MoHFW [2006]: Indian Public Health Standards [IPHS] for PHCs & SHCs, Government of India
BOX-CHART: NRHM Health Service Norms for Rural Health Sub-centres & Primary Health Centres
CLINICAL & CURATIVE SERVICES
SERVICES TO BE PROVIDED AT SHC SERVICES TO BE PROVIDED AT PHC
CLINICAL MEDICARE CLINICAL MEDICARE
Curative Services 24/7 Services
- First Aid & Treatment for Minor Ailments - 24-hour all-week Delivery & New-born Care
- Screening & Quick Referral to increase Institutional Deliveries
OPD Services
- Mornings: 4 hours/Afternoons & Evenings: 2 hours
- Minimum OPD attendance of 40 patients per doctor
per day
24-hour Emergency Services
- Management of Trauma injuries, Accidents & First Aid
- Stabilisation of Patients before Referral
- Management of Dog bite/Snake bite/Scorpion bite
Cases
- Other Emergency Conditions
Hospital Services
- 6-bedded In-patient Services
Basic Surgical Procedures
- Vasectomy, Tubectomy & Laparoscopic tubectomy
- Medical Termination of Pregnancy [MTP]- Cataract
surgery on camp/fixed-day approach at PHC Operation
Theatre [OT]
Basic Laboratory Services
- Routine urine, stool & blood tests
- Bleeding & clotting time
- Tests & Diagnosis of RTI/ STDs
- Sputum testing for TB at PHC Microscopy Centres
under RNTCP
- Blood Smear examination for Malaria
- Rapid testing for Pregnancy, Typhoid & Malaria
- Surveillance tests for Syphilis/Yaws
- Rapid testing for faecal contamination in water
- Estimation of chlorination levels in water
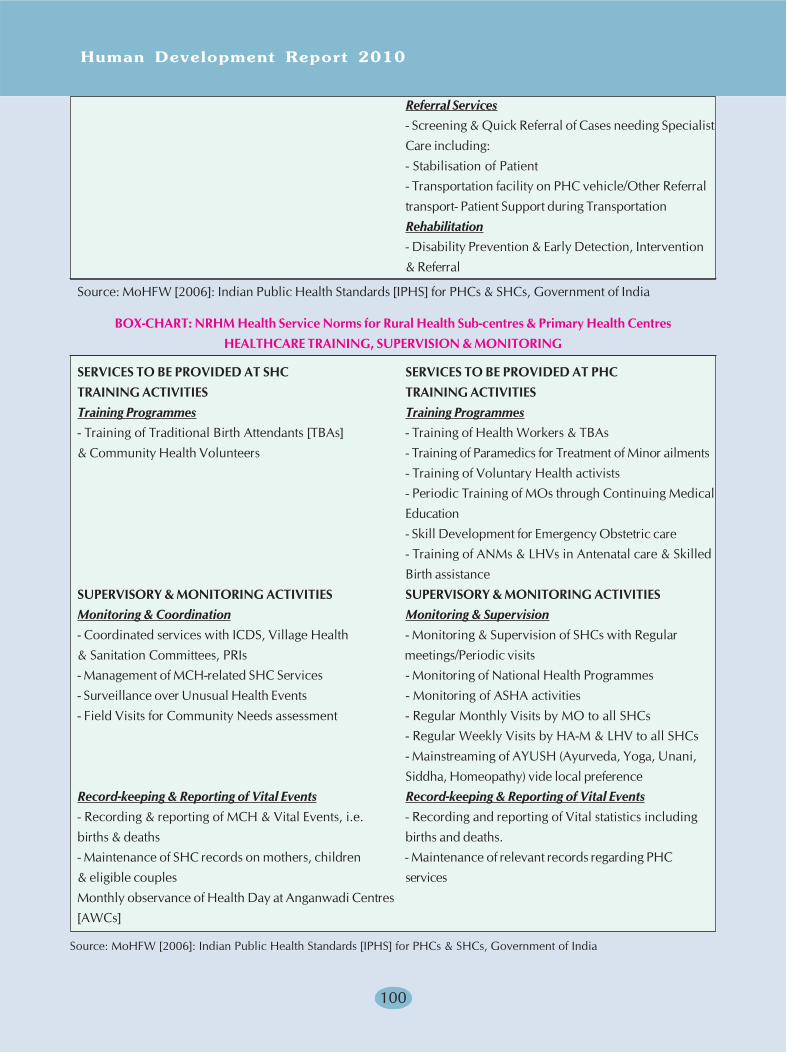
Human Development Report 2010
100
Source: MoHFW [2006]: Indian Public Health Standards [IPHS] for PHCs & SHCs, Government of India
Referral Services
- Screening & Quick Referral of Cases needing Specialist
Care including:
- Stabilisation of Patient
- Transportation facility on PHC vehicle/Other Referral
transport- Patient Support during Transportation
Rehabilitation
- Disability Prevention & Early Detection, Intervention
& Referral
Source: MoHFW [2006]: Indian Public Health Standards [IPHS] for PHCs & SHCs, Government of India
BOX-CHART: NRHM Health Service Norms for Rural Health Sub-centres & Primary Health Centres
HEALTHCARE TRAINING, SUPERVISION & MONITORING
SERVICES TO BE PROVIDED AT SHC SERVICES TO BE PROVIDED AT PHC
TRAINING ACTIVITIES TRAINING ACTIVITIES
Training Programmes Training Programmes
- Training of Traditional Birth Attendants [TBAs] - Training of Health Workers & TBAs
& Community Health Volunteers - Training of Paramedics for Treatment of Minor ailments
- Training of Voluntary Health activists
- Periodic Training of MOs through Continuing Medical
Education
- Skill Development for Emergency Obstetric care
- Training of ANMs & LHVs in Antenatal care & Skilled
Birth assistance
SUPERVISORY & MONITORING ACTIVITIES SUPERVISORY & MONITORING ACTIVITIES
Monitoring & Coordination Monitoring & Supervision
- Coordinated services with ICDS, Village Health - Monitoring & Supervision of SHCs with Regular
& Sanitation Committees, PRIs meetings/Periodic visits
- Management of MCH-related SHC Services - Monitoring of National Health Programmes
- Surveillance over Unusual Health Events - Monitoring of ASHA activities
- Field Visits for Community Needs assessment - Regular Monthly Visits by MO to all SHCs
- Regular Weekly Visits by HA-M & LHV to all SHCs
- Mainstreaming of AYUSH (Ayurveda, Yoga, Unani,
Siddha, Homeopathy) vide local preference
Record-keeping & Reporting of Vital Events Record-keeping & Reporting of Vital Events
- Recording & reporting of MCH & Vital Events, i.e. - Recording and reporting of Vital statistics including
births & deaths births and deaths.
- Maintenance of SHC records on mothers, children - Maintenance of relevant records regarding PHC
& eligible couples services
Monthly observance of Health Day at Anganwadi Centres
[AWCs]
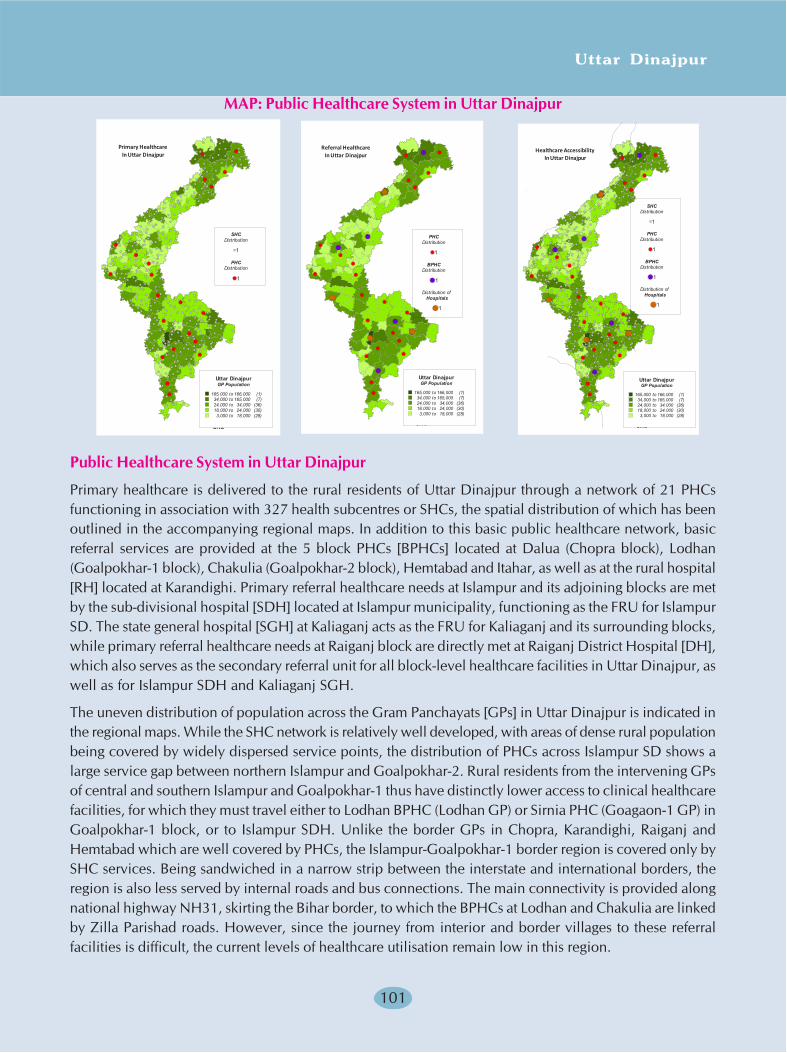
Uttar Dinajpur
101
MAP: Public Healthcare System in Uttar Dinajpur
Public Healthcare System in Uttar Dinajpur
Primary healthcare is delivered to the rural residents of Uttar Dinajpur through a network of 21 PHCsfunctioning in association with 327 health subcentres or SHCs, the spatial distribution of which has beenoutlined in the accompanying regional maps. In addition to this basic public healthcare network, basicreferral services are provided at the 5 block PHCs [BPHCs] located at Dalua (Chopra block), Lodhan(Goalpokhar-1 block), Chakulia (Goalpokhar-2 block), Hemtabad and Itahar, as well as at the rural hospital[RH] located at Karandighi. Primary referral healthcare needs at Islampur and its adjoining blocks are metby the sub-divisional hospital [SDH] located at Islampur municipality, functioning as the FRU for IslampurSD. The state general hospital [SGH] at Kaliaganj acts as the FRU for Kaliaganj and its surrounding blocks,while primary referral healthcare needs at Raiganj block are directly met at Raiganj District Hospital [DH],which also serves as the secondary referral unit for all block-level healthcare facilities in Uttar Dinajpur, aswell as for Islampur SDH and Kaliaganj SGH.
The uneven distribution of population across the Gram Panchayats [GPs] in Uttar Dinajpur is indicated inthe regional maps. While the SHC network is relatively well developed, with areas of dense rural populationbeing covered by widely dispersed service points, the distribution of PHCs across Islampur SD shows alarge service gap between northern Islampur and Goalpokhar-2. Rural residents from the intervening GPsof central and southern Islampur and Goalpokhar-1 thus have distinctly lower access to clinical healthcarefacilities, for which they must travel either to Lodhan BPHC (Lodhan GP) or Sirnia PHC (Goagaon-1 GP) inGoalpokhar-1 block, or to Islampur SDH. Unlike the border GPs in Chopra, Karandighi, Raiganj andHemtabad which are well covered by PHCs, the Islampur-Goalpokhar-1 border region is covered only bySHC services. Being sandwiched in a narrow strip between the interstate and international borders, theregion is also less served by internal roads and bus connections. The main connectivity is provided alongnational highway NH31, skirting the Bihar border, to which the BPHCs at Lodhan and Chakulia are linkedby Zilla Parishad roads. However, since the journey from interior and border villages to these referralfacilities is difficult, the current levels of healthcare utilisation remain low in this region.
SHC
Uttar DinajpurGP Population
165,000 to 166,000 (1)34,000 to 165,000 (7)24,000 to 34,000 (36)18,000 to 24,000 (30)3,000 to 18,000 (28)
PHCDistribution
1
SHCDistribution
1
Primary HealthcareIn Uttar Dinajpur
SHC
Uttar DinajpurGP Population
165,000 to 166,000 (1)34,000 to 165,000 (7)24,000 to 34,000 (36)18,000 to 24,000 (30)3,000 to 18,000 (28)
Distribution ofHospitals
1
BPHCDistribution
1
PHCDistribution
1
Referral HealthcareIn Uttar Dinajpur
SHC
Uttar DinajpurGP Population
165,000 to 166,000 (1)34,000 to 165,000 (7)24,000 to 34,000 (36)18,000 to 24,000 (30)3,000 to 18,000 (28)
Distribution ofHospitals
1
BPHCDistribution
1
PHCDistribution
1
SHCDistribution
1
Healthcare AccessibilityIn Uttar Dinajpur
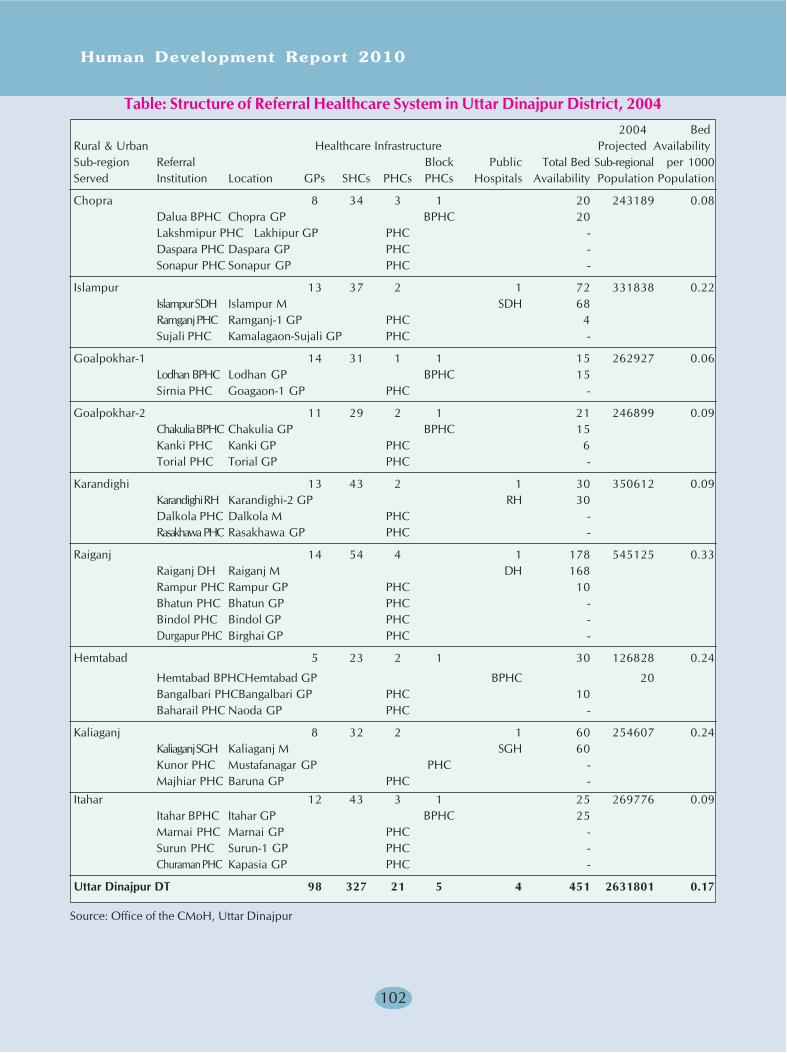
Human Development Report 2010
102
Table: Structure of Referral Healthcare System in Uttar Dinajpur District, 20042004 Bed
Rural & Urban Healthcare Infrastructure Projected AvailabilitySub-region Referral Block Public Total Bed Sub-regional per 1000Served Institution Location GPs SHCs PHCs PHCs Hospitals Availability Population Population
Chopra 8 34 3 1 20 243189 0.08Dalua BPHC Chopra GP BPHC 20Lakshmipur PHC Lakhipur GP PHC -Daspara PHC Daspara GP PHC -Sonapur PHC Sonapur GP PHC -
Islampur 13 37 2 1 72 331838 0.22Islampur SDH Islampur M SDH 68Ramganj PHC Ramganj-1 GP PHC 4Sujali PHC Kamalagaon-Sujali GP PHC -
Goalpokhar-1 14 31 1 1 15 262927 0.06Lodhan BPHC Lodhan GP BPHC 15Sirnia PHC Goagaon-1 GP PHC -
Goalpokhar-2 11 29 2 1 21 246899 0.09Chakulia BPHC Chakulia GP BPHC 15Kanki PHC Kanki GP PHC 6Torial PHC Torial GP PHC -
Karandighi 13 43 2 1 30 350612 0.09Karandighi RH Karandighi-2 GP RH 30Dalkola PHC Dalkola M PHC -Rasakhawa PHC Rasakhawa GP PHC -
Raiganj 14 54 4 1 178 545125 0.33Raiganj DH Raiganj M DH 168Rampur PHC Rampur GP PHC 10Bhatun PHC Bhatun GP PHC -Bindol PHC Bindol GP PHC -Durgapur PHC Birghai GP PHC -
Hemtabad 5 23 2 1 30 126828 0.24
Hemtabad BPHCHemtabad GP BPHC 20Bangalbari PHCBangalbari GP PHC 10Baharail PHC Naoda GP PHC -
Kaliaganj 8 32 2 1 60 254607 0.24Kaliaganj SGH Kaliaganj M SGH 60Kunor PHC Mustafanagar GP PHC -Majhiar PHC Baruna GP PHC -
Itahar 12 43 3 1 25 269776 0.09Itahar BPHC Itahar GP BPHC 25Marnai PHC Marnai GP PHC -Surun PHC Surun-1 GP PHC -Churaman PHC Kapasia GP PHC -
Uttar Dinajpur DT 98 327 21 5 4 451 2631801 0.17
Source: Office of the CMoH, Uttar Dinajpur
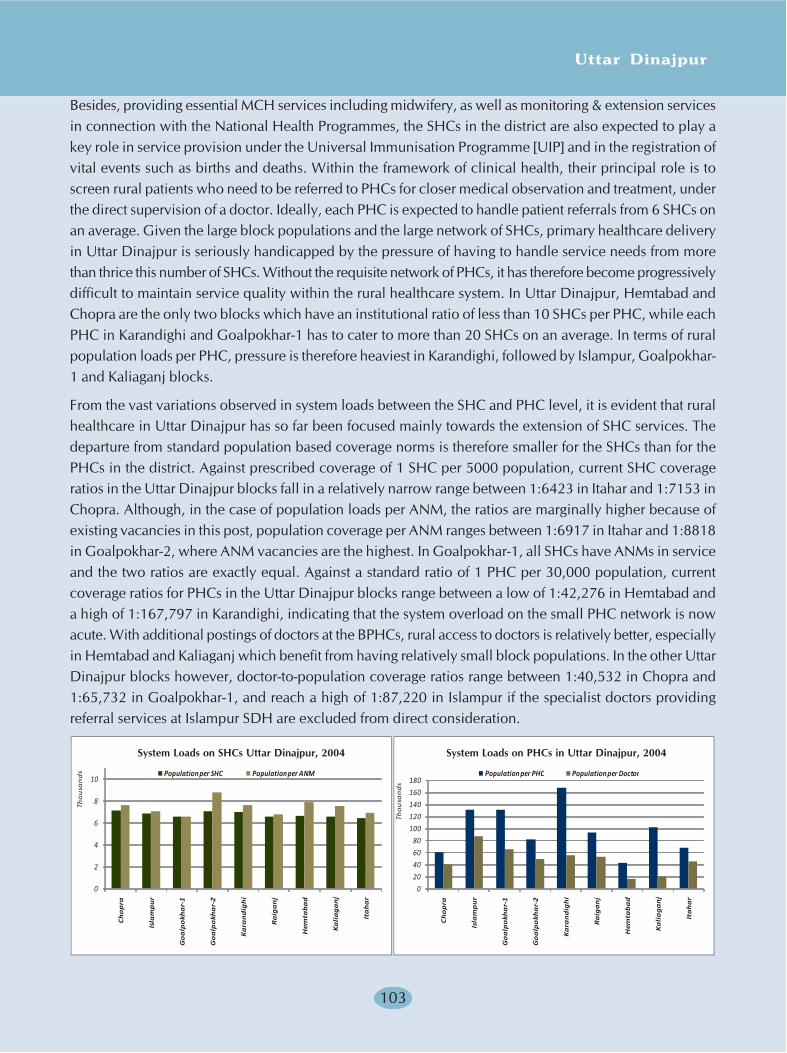
Uttar Dinajpur
103
Besides, providing essential MCH services including midwifery, as well as monitoring & extension servicesin connection with the National Health Programmes, the SHCs in the district are also expected to play akey role in service provision under the Universal Immunisation Programme [UIP] and in the registration ofvital events such as births and deaths. Within the framework of clinical health, their principal role is toscreen rural patients who need to be referred to PHCs for closer medical observation and treatment, underthe direct supervision of a doctor. Ideally, each PHC is expected to handle patient referrals from 6 SHCs onan average. Given the large block populations and the large network of SHCs, primary healthcare deliveryin Uttar Dinajpur is seriously handicapped by the pressure of having to handle service needs from morethan thrice this number of SHCs. Without the requisite network of PHCs, it has therefore become progressivelydifficult to maintain service quality within the rural healthcare system. In Uttar Dinajpur, Hemtabad andChopra are the only two blocks which have an institutional ratio of less than 10 SHCs per PHC, while eachPHC in Karandighi and Goalpokhar-1 has to cater to more than 20 SHCs on an average. In terms of ruralpopulation loads per PHC, pressure is therefore heaviest in Karandighi, followed by Islampur, Goalpokhar-1 and Kaliaganj blocks.
From the vast variations observed in system loads between the SHC and PHC level, it is evident that ruralhealthcare in Uttar Dinajpur has so far been focused mainly towards the extension of SHC services. Thedeparture from standard population based coverage norms is therefore smaller for the SHCs than for thePHCs in the district. Against prescribed coverage of 1 SHC per 5000 population, current SHC coverageratios in the Uttar Dinajpur blocks fall in a relatively narrow range between 1:6423 in Itahar and 1:7153 inChopra. Although, in the case of population loads per ANM, the ratios are marginally higher because ofexisting vacancies in this post, population coverage per ANM ranges between 1:6917 in Itahar and 1:8818in Goalpokhar-2, where ANM vacancies are the highest. In Goalpokhar-1, all SHCs have ANMs in serviceand the two ratios are exactly equal. Against a standard ratio of 1 PHC per 30,000 population, currentcoverage ratios for PHCs in the Uttar Dinajpur blocks range between a low of 1:42,276 in Hemtabad anda high of 1:167,797 in Karandighi, indicating that the system overload on the small PHC network is nowacute. With additional postings of doctors at the BPHCs, rural access to doctors is relatively better, especiallyin Hemtabad and Kaliaganj which benefit from having relatively small block populations. In the other UttarDinajpur blocks however, doctor-to-population coverage ratios range between 1:40,532 in Chopra and1:65,732 in Goalpokhar-1, and reach a high of 1:87,220 in Islampur if the specialist doctors providingreferral services at Islampur SDH are excluded from direct consideration.
0
2
4
6
8
10
Ch
op
ra
Isla
mp
ur
Go
alp
okh
ar-
1
Go
alp
okh
ar-
2
Ka
ran
dig
hi
Ra
iga
nj
Hem
tab
ad
Ka
lia
ga
nj
Ita
ha
r
Tho
usa
nd
s Population per SHC Population per ANM
System Loads on SHCs in Uttar Dinajpur 2004
0
20
40
60
80
100
120
140
160
180
Ch
op
ra
Isla
mp
ur
Go
alp
okh
ar-
1
Go
alp
okh
ar-
2
Ka
ran
dig
hi
Ra
iga
nj
Hem
tab
ad
Ka
lia
ga
nj
Ita
ha
r
Tho
usa
nd
s
Population per PHC Population per Doctor
System Loads on PHCs in Uttar Dinajpur 2004
System Loads on SHCs Uttar Dinajpur, 2004 System Loads on PHCs in Uttar Dinajpur, 2004

Human Development Report 2010
104
Despite the recently announced addition of another 17 SHCs, delivery of SHC services to the large ruralpopulation of Uttar Dinajpur still remains inadequate. On the basis of current population projections, it isestimated in the District Health Plan 2007 that another 114 SHCs will be required for the standard populationbased norm for SHCs to be met. The shortage of PHCs against standard population norms is even moreserious, since it closely reflects the shortage of doctors in the district. With a rural population of 21.47 lakhin 2001, Uttar Dinajpur required at least 71 PHCs for the standard norm of one doctor and one PHC per0.30 lakh population to be maintained. Because of the overall insufficiency of institutions, PHCs in Kaliaganj,Islampur, Goalpokhar-1 and Karandighi now have to cover a rural population ranging from 1.02 lakh to1.68 lakh per PHC. Even in Hemtabad block which is most favourably placed, each PHC has a coveragerate of 0.42 lakh. To mitigate the additional pressure that falls on Islampur SDH and Raiganj DH of havingto provide basic referral healthcare services to patients referred in from PHCs in Islampur and Raiganjblocks, two of the PHCs in these blocks, namely Ramganj in Islampur and Rampur in Raiganj block haverecently been redesignated to BPHCs. However, since the infrastructure, staffing and service levels providedthere remain at PHC level with inpatient services still to start, Islampur SDH and Raiganj DH continue tocope with unusually high service loads since, in addition to their referral loads, they also have to cater to alarge number of rural patients who report for first-stage treatment.
Besides, the principal municipal towns of Islampur, Raiganj and Kaliaganj where the main referral hospitalsare located, Uttar Dinajpur has 1477 villages distributed over 98 GPs under its nine blocks. Each GP, onan average, covers approximately 15 villages scattered over an area of 31 sq.km, with around 4200 ruralhouseholds and an average population of nearly 22 thousand. Except in Chopra block where an averageGP spreads over a larger area of 47.60 sq.km, holding over 5200 households and a rural population ofapproximately 28 thousand, GP areas under Islampur SD are generally compact and hold relatively sparsepopulations. Thus with 59 GPs, Islampur SD includes 195 SHCs, while the Raiganj SD blocks hold 39GPs and 149 SHCs as well as over 44 percent of Uttar Dinajpur's rural population. While the PHCs in thedistrict are divided equally between the two subdivisions, Raiganj SD is better endowed with public andprivate hospital facilities.
Despite having a rural population almost as large as that of Raiganj block, Karandighi occupies a muchsmaller area, with fewer GPs, SHCs and PHCs. While the pressure on rural health facilities in the block isconsequently intense, the healthcare network that serves these needs is highly inadequate. In Goalpokhar-1 and Islampur too, the number of SHCs is inadequate relative to the overall size of the block population,while the population pressure on the sparse network of PHCs is excessively high. The brunt of this fallsdirectly on Lodhan BPHC as well as on Islampur SDH. While Kaliaganj too has few PHCs relative to itsblock population, the presence of Kaliaganj SGH relieves the resulting system load. As a direct consequence,rural access to hospital beds and doctors is considerably better in Kaliaganj and Hemtabad compared tothe rest of the district. Although Raiganj and Islampur have higher bed strengths, the referral hospitals therehave handle secondary referral needs in much higher volumes. Throughout Islampur SD, rural healthcarefacilities cope with much higher system loads than in Raiganj SD.

Uttar Dinajpur
105
MAP: Rural Healthcare Facilities & System Loads in Uttar Dinajpur
Rural Healthcare Gaps
In spite of new policy guidelines that require each GP headquarters to be served by a health subcentre,only 81 Uttar Dinajpur GPs presently comply with this and 17 still do not have SHCs located at theirheadquarters. Although another 246 SHCs function at various distances from the GP headquarters, projectionsmade on the 2006 mid-year population show that the district would need at least 458 SHCs to meetnational norms. Thus the current shortfall in SHCs thus amounts to 25 percent. For basic NRHM norms tobe met, another 114 SHCs would have to be established along with complementary staff appointments,before 2012 when NRHM will end. The challenge of improving the provisioning of basic rural healthcareservices in Uttar Dinajpur is therefore immense.
Only 60 percent of the existing SHCs in the district function from their own buildings, while the rest arehoused at rented premises or local clubs. Since building specifications and amenities at these makeshifthealthcare facilities are inadequate, the health service quality is adversely affected. Because of the generallypoor status of rural electrification in the district, nearly 70 percent of the existing SHCs do not have electricalconnections, hindering the installation of lighting, basic technical equipment and refrigeration units whichare essential for the safe preservation of medicines and vaccine stocks. Nearly 53 percent of the existingSHCs do not have direct water supply, as a result of which the maintenance of aseptic standards duringhealthcare procedures becomes a problem. Nearly 60 percent of the existing SHCs do not provide toiletfacilities for patients and staff. Clearly therefore, if the rural healthcare system in Uttar Dinajpur is toimprove substantially through national interventions like NRHM, the most critical effort will have to bedirected at improving the quality of health infrastructure and services at the base.
Uttar Dinajpur 2004Rural Population per PHC
167,000 to 168,000 (1)130,000 to 167,000 (2)101,000 to 130,000 (1)60,000 to 101,000 (4)42,000 to 60,000 (1)
SHCs
57
PHCs/BPHCs
4
Uttar Dinajpur 2004Projected Rural Population
374,000 to 375,000 (1)335,000 to 374,000 (1)261,000 to 335,000 (3)203,000 to 261,000 (3)126,000 to 203,000 (1)
Uttar Dinajpur 2004Referral Healthcare Infrastructure
180
PHCsRural DoctorsTotal Beds
Uttar Dinajpur 2004Projected Rural Population
374,000 to 375,000 (1)335,000 to 374,000 (1)261,000 to 335,000 (3)203,000 to 261,000 (3)126,000 to 203,000 (1)
HeatlhcareService Ratios
48
Beds per lakh personsDoctors per lakh persons

Human Development Report 2010
106
0
50
100
150
200
250
300
GPHQ SHCs SHCs in Own Premises
SHCs with Electricity
SHCs with Water Supply
SHCs with Toilets
No
Yes
UTTAR DINAJPUR 2006Existing Infrastructure Gaps at Sub-Healthcentres
Uttar Dinajpur 2004Inhabited Villages
220 to 220 (1)211 to 220 (2)169 to 211 (2)145 to 169 (1)101 to 145 (3)
Rural Health Facilities24
% Villages with Inpatient Facilities% Villages with Govt. Dispensaries% Villages with SHCs% Villages with PHCs
Uttar Dinajpur 2004Inhabited Villages
220 to 220 (1)211 to 220 (2)169 to 211 (2)145 to 169 (1)101 to 145 (3)
PHC Proximity220110
22
PHC in villagePHC <5kmPHC within 5-10kmPHC >10km
Uttar Dinajpur 2004Inhabited Villages
220 to 220 (1)211 to 220 (2)169 to 211 (2)145 to 169 (1)101 to 145 (3)
Village Connectivity220110
22
Direct Bus connectionBus connection <5kmBus connection 5-10kmBus connection >10km
Differences in the regional structure of rural settlements between the northern and southern blocks of UttarDinajpur have an important bearing on the accessibility of rural healthcare. Although the five Islampur SDblocks which were originally transferred from Purnea district in neighbouring Bihar now have relativelylarge block populations, settlement patterns there are still relatively sparse. The predominant gachh tenanciesthat give character to this dispersed pattern of regional settlement date from times when these agriculturallands and village settlements were carved out of the original forest by early settlers. In contrast, with theexception of Karandighi, the density of inhabited villages per GP is much higher in Raiganj SD than in theIslampur blocks, and has encouraged better networking and connectivity among rural settlements. Raiganjblock alone accounts for around 15 percent of the inhabited villages and 17 percent of the SHCs in ruralUttar Dinajpur, in comparison to which the structure of rural settlements in the Islampur blocks is much
Map : Patterns of Settlements & Rural Health-care Accessibility
UTTAR DINAJPUR, 2006Existing Infrastructure Gaps at Sub-Healthcentres
Uttar Dinajpur
107
thinner. The proportion of villages having SHCs within them is relatively high in Chopra and Islampurwhere the overall number of villages is fewer, and also in the Karandighi-Raiganj-Hemtabad region wherethe overall network of villages as well as of SHCs is much larger. While Islampur and Raiganj towns formthe respective hubs for these two regional networks, the proportion of villages having SHC facilities declinesin the peripheral blocks of Goalpokhar-1 and Goalpokhar-2, and Kaliaganj and Itahar. Goalpokhar-1 andKarandighi also have a fairly large number of villages served by Government allopathic dispensaries. Thepresence of these is lower in blocks which have a more developed SHC network.
Raiganj block offers the best relative access to primary healthcare services, with nearly half its villagesbeing located within distances of 5km from the nearest PHCs. In the adjoining blocks of Karandighi andHemtabad, the PHCs are less accessible, and the majority of rural residents in Itahar and Kaliaganj have tocommute over distances upto or greater than 10km to avail of primary healthcare services. Among theother Islampur SD blocks, only Chopra offers relatively better rural healthcare access because of its well-dispersed network of PHCs. Even though Islampur offers specialised referral healthcare facilities for theentire region at the subdivisional hospital, half of its villages are located at distances of 10km or more fromthe nearest PHCs. While the level of primary healthcare accessibility is also roughly similar in Goalpokhar-2, residents in nearly two thirds of villages in Goalpokhar-1 face the greatest difficulty in seeking primaryhealthcare, having to traverse distances greater than 10km to get to the nearest PHC.
In most parts of Uttar Dinajpur, rural residents who seek healthcare also face considerable difficulties incommunications. The position is relatively better in the three blocks that surround Raiganj, namely Hemtabad,Kaliaganj and Itahar, where the vast majority of villages either have direct bus communications or haveaccess to bus routes within a distance of 5km. Communications in Raiganj block itself are more difficult,with most villages being located at a distance of 5-10km from the nearest bus routes. Nevertheless, with alarge proportion of these villages being located fairly close to the PHCs, the problems in accessing healthcareare not so bad. In Islampur SD, where the distances from villages to PHCs are generally higher, poor busconnectivity adds to the problem of healthcare accessibility in blocks like Goalpokhar-2 and Islampur,where a sizeable number of villages are located more than 10km away from the nearest bus routes. Thus,rural healthcare accessibility remains poor throughout the Islampur SD blocks, because of the limitednetwork of PHCs as well as limited access to communications. Physical barriers such as these constrict theeffective delivery of public healthcare in the region to a considerable extent, and are responsible in largemeasure for the poor rural healthcare indicators of Uttar Dinajpur.
ICDS Facilities
Following relevant orders issued by the Supreme Court to the Government of India in December 2006,regarding universalisation of the ICDS scheme in all rural habitations of the country by the end of 2008, amassive expansion has occurred in the number of anganwadi centres [AWCs] as well as in the serviceoutreach of the scheme. Yet even after the establishment of 750 new AWCs under ICDS during 2006-07,Uttar Dinajpur is still far short of the number of AWCs warranted by the size of its rural population in theage-group 0-6 years. While rapid extension of ICDS has assured the accessibility of ICDS services to alarger mass of rural children, this has not been matched so far by equivalent outlays on building physicalinfrastructure for ICDS since no provision for this exists within the funding component of the scheme.
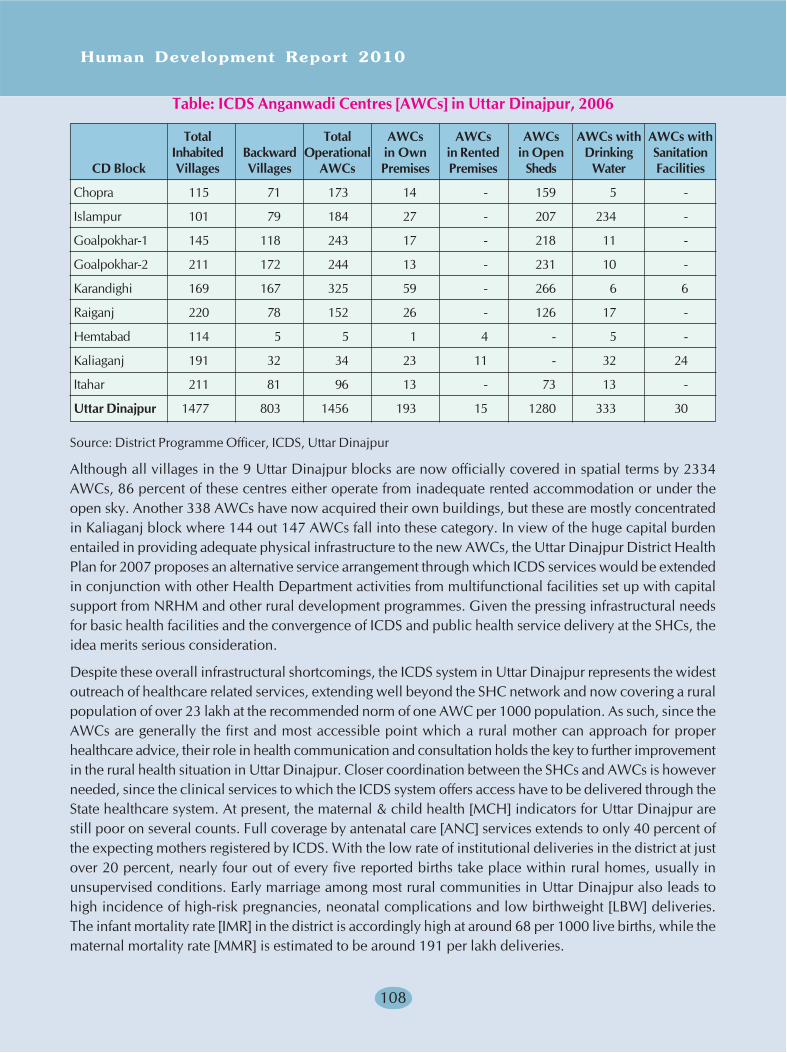
Human Development Report 2010
108
Table: ICDS Anganwadi Centres [AWCs] in Uttar Dinajpur, 2006
Total Total AWCs AWCs AWCs AWCs with AWCs withInhabited Backward Operational in Own in Rented in Open Drinking Sanitation
CD Block Villages Villages AWCs Premises Premises Sheds Water Facilities
Chopra 115 71 173 14 - 159 5 -
Islampur 101 79 184 27 - 207 234 -
Goalpokhar-1 145 118 243 17 - 218 11 -
Goalpokhar-2 211 172 244 13 - 231 10 -
Karandighi 169 167 325 59 - 266 6 6
Raiganj 220 78 152 26 - 126 17 -
Hemtabad 114 5 5 1 4 - 5 -
Kaliaganj 191 32 34 23 11 - 32 24
Itahar 211 81 96 13 - 73 13 -
Uttar Dinajpur 1477 803 1456 193 15 1280 333 30
Source: District Programme Officer, ICDS, Uttar Dinajpur
Although all villages in the 9 Uttar Dinajpur blocks are now officially covered in spatial terms by 2334AWCs, 86 percent of these centres either operate from inadequate rented accommodation or under theopen sky. Another 338 AWCs have now acquired their own buildings, but these are mostly concentratedin Kaliaganj block where 144 out 147 AWCs fall into these category. In view of the huge capital burdenentailed in providing adequate physical infrastructure to the new AWCs, the Uttar Dinajpur District HealthPlan for 2007 proposes an alternative service arrangement through which ICDS services would be extendedin conjunction with other Health Department activities from multifunctional facilities set up with capitalsupport from NRHM and other rural development programmes. Given the pressing infrastructural needsfor basic health facilities and the convergence of ICDS and public health service delivery at the SHCs, theidea merits serious consideration.
Despite these overall infrastructural shortcomings, the ICDS system in Uttar Dinajpur represents the widestoutreach of healthcare related services, extending well beyond the SHC network and now covering a ruralpopulation of over 23 lakh at the recommended norm of one AWC per 1000 population. As such, since theAWCs are generally the first and most accessible point which a rural mother can approach for properhealthcare advice, their role in health communication and consultation holds the key to further improvementin the rural health situation in Uttar Dinajpur. Closer coordination between the SHCs and AWCs is howeverneeded, since the clinical services to which the ICDS system offers access have to be delivered through theState healthcare system. At present, the maternal & child health [MCH] indicators for Uttar Dinajpur arestill poor on several counts. Full coverage by antenatal care [ANC] services extends to only 40 percent ofthe expecting mothers registered by ICDS. With the low rate of institutional deliveries in the district at justover 20 percent, nearly four out of every five reported births take place within rural homes, usually inunsupervised conditions. Early marriage among most rural communities in Uttar Dinajpur also leads tohigh incidence of high-risk pregnancies, neonatal complications and low birthweight [LBW] deliveries.The infant mortality rate [IMR] in the district is accordingly high at around 68 per 1000 live births, while thematernal mortality rate [MMR] is estimated to be around 191 per lakh deliveries.
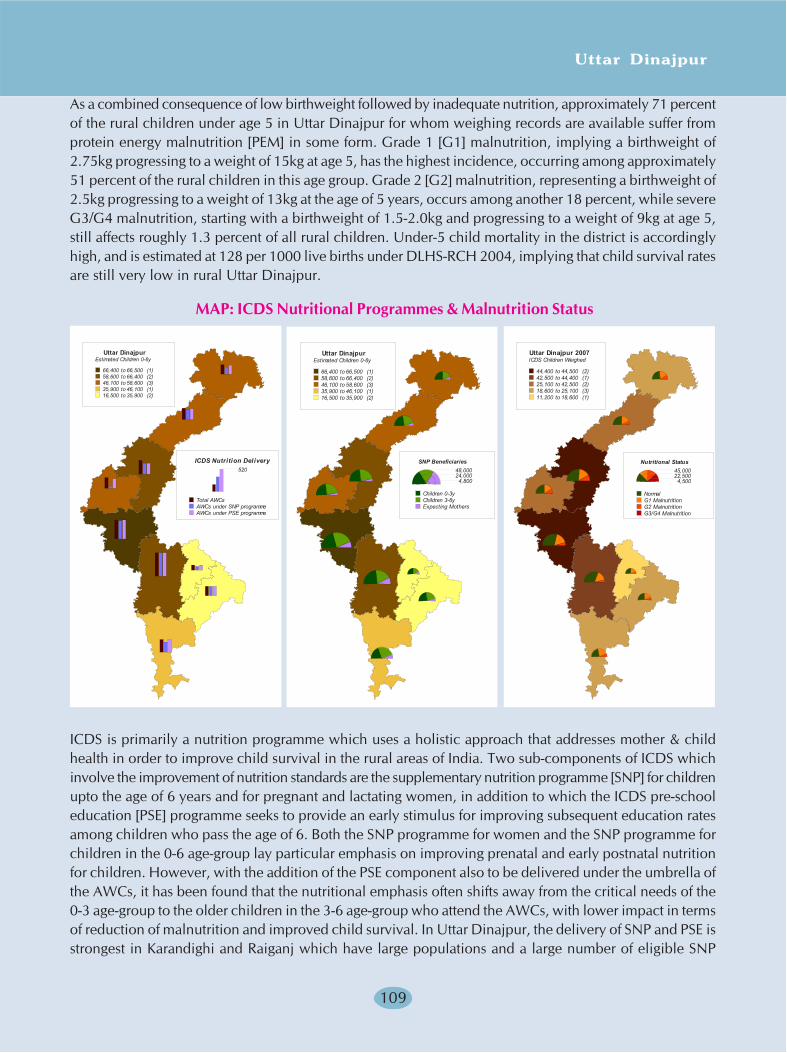
Uttar Dinajpur
109
As a combined consequence of low birthweight followed by inadequate nutrition, approximately 71 percentof the rural children under age 5 in Uttar Dinajpur for whom weighing records are available suffer fromprotein energy malnutrition [PEM] in some form. Grade 1 [G1] malnutrition, implying a birthweight of2.75kg progressing to a weight of 15kg at age 5, has the highest incidence, occurring among approximately51 percent of the rural children in this age group. Grade 2 [G2] malnutrition, representing a birthweight of2.5kg progressing to a weight of 13kg at the age of 5 years, occurs among another 18 percent, while severeG3/G4 malnutrition, starting with a birthweight of 1.5-2.0kg and progressing to a weight of 9kg at age 5,still affects roughly 1.3 percent of all rural children. Under-5 child mortality in the district is accordinglyhigh, and is estimated at 128 per 1000 live births under DLHS-RCH 2004, implying that child survival ratesare still very low in rural Uttar Dinajpur.
MAP: ICDS Nutritional Programmes & Malnutrition Status
ICDS is primarily a nutrition programme which uses a holistic approach that addresses mother & childhealth in order to improve child survival in the rural areas of India. Two sub-components of ICDS whichinvolve the improvement of nutrition standards are the supplementary nutrition programme [SNP] for childrenupto the age of 6 years and for pregnant and lactating women, in addition to which the ICDS pre-schooleducation [PSE] programme seeks to provide an early stimulus for improving subsequent education ratesamong children who pass the age of 6. Both the SNP programme for women and the SNP programme forchildren in the 0-6 age-group lay particular emphasis on improving prenatal and early postnatal nutritionfor children. However, with the addition of the PSE component also to be delivered under the umbrella ofthe AWCs, it has been found that the nutritional emphasis often shifts away from the critical needs of the0-3 age-group to the older children in the 3-6 age-group who attend the AWCs, with lower impact in termsof reduction of malnutrition and improved child survival. In Uttar Dinajpur, the delivery of SNP and PSE isstrongest in Karandighi and Raiganj which have large populations and a large number of eligible SNP
Uttar DinajpurEstimated Children 0-6y
66,400 to 66,500 (1)58,600 to 66,400 (2)46,100 to 58,600 (3)35,900 to 46,100 (1)16,500 to 35,900 (2)
ICDS Nutrition Delivery520
Total AWCsAWCs under SNP programmeAWCs under PSE programme
Uttar DinajpurEstimated Children 0-6y
66,400 to 66,500 (1)58,600 to 66,400 (2)46,100 to 58,600 (3)35,900 to 46,100 (1)16,500 to 35,900 (2)
SNP Beneficiaries48,00024,000
4,800
Children 0-3yChildren 3-6yExpecting Mothers
Uttar Dinajpur 2007ICDS Children Weighed
44,400 to 44,500 (2)42,500 to 44,400 (1)25,100 to 42,500 (2)18,600 to 25,100 (3)11,200 to 18,600 (1)
Nutritional Status45,00022,5004,500
NormalG1 MalnutritionG2 MalnutritionG3/G4 Malnutrition
Human Development Report 2010
110
beneficiaries. Coverage under SNP and PSE is also fairly even across the AWCs in Kaliaganj, but varies tothe detriment of the SNP programme in most other blocks. Throughout Islampur SD, the SNP programmeconsistently attracts more children in the 3-6 age-group and fewer in the 0-3 age-group, while Goalpokhar-2 represents the worst case where SNP coverage is considerably outstripped by the coverage under PSE.Through most parts of the district, SNP coverage of eligible mothers and 0-3 age children is therefore low,increasing the incidence of malnutrition among children. More than 50 percent of the children in Chopra,Islampur, and Goalpokhar-2, as well as in Hemtabad, Kaliaganj and Itahar blocks suffer from PEMmalnutrition, with the incidence being highest in Itahar. G1 malnutrition is the commonest form, affecting27 percent of the children in Raiganj and 40 percent in Itahar, while ranging between 31-37 percent in theother Uttar Dinajpur blocks. The frequency of G2 malnutrition among young children is also well above16 percent in Itahar, Goalpokhar-1, Goalpokhar-2 and Chopra blocks. Incidence of G3/G4 malnutritionranges between 1-2 percent in all Islampur SD blocks except Goalpokhar-1, touching a high of 2.2 percentin Kaliaganj.
The natural corollary of poor child health and low child survival rates in Uttar Dinajpur is seen in high totalfertility rates [TFRs] among rural women in the district, which has led to explosive population growthfollowing the gradual improvement in rural health conditions. More detailed analysis of the delivery ofreproductive & child health services through the ICDS system in Uttar Dinajpur district is taken up separatelyin the chapter on gender status in the Uttar Dinajpur DHDR. However, it is quite obvious the ruralhealthcare programme in the district must expand its focus on strengthening the SHC and ICDS infrastructure,if accelerated healthcare benefits are to be obtained from NRHM.
National Health Programmes in Uttar Dinajpur
A fair proportion of the diagnostic, monitoring and information services extended to the public by thehealthcare system are provided as part of ongoing national health programmes that delivered through thecommon infrastructure of the State Health system. Thus in addition to the Reproductive & Child Health[RCH] services under ICDS which are focused towards preventive aspects of healthcare and the improvementof population quality, these include
- the Integrated Disease Surveillance Project [IDSP] providing technical facilities for the diagnosisand monitoring of major communicable diseases like malaria, tuberculosis, typhoid, etc.
- the National Vector Borne Disease Control Programme [NVBDCP] and its programmeinterventions for the monitoring, treatment and control of leprosy, malaria, kala-azar, etc.
- the Revised National Tuberculosis Control Programme [RNTCP] which screens patients andprovides DOTS treatment for the incidence of TB
- the National AIDS Control Programme [NACP] that seeks to minimise HIV/AIDS risks throughmass behavioural counselling and health communication, while screening sero-positivesufferers who may need advanced anti-retroviral [ART] treatment
- the Non-Communicable Disease [NCD] Control Programme that provides healthcare supportfor controlling the spread of lifestyle diseases like diabetes, cardiovascular disease, and cancer
- the National Blindness Control Programme [NBCP] that provides screening, refractive servicesand surgery for ophthalmic ailments.
Most of the programme interventions are conducted through a nested diagnostic & delivery structureextending from national monitoring bodies to the grassroots with funding support of external agencies likethe World Health Organisation [WHO] and the World Bank, and also have an intensive research component
Uttar Dinajpur
111
through which field data are transmitted to national research organisations like the Indian Council forMedical Research [ICMR]. While this external support enables the State Health Department to providecritical technical facilities and personnel to the district healthcare system, it can sometimes overburden thesystem at the cost of basic healthcare services. Thus, as pointed out in several monitoring reviews andstudies, one of the reasons why the private healthcare system is able to offer better service delivery isbecause it remains largely free of this technical overload. The critical data available through these programmeshowever enable the burden of disease in Uttar Dinajpur district to be closely monitored.
Leprosy Incidence
With an overall prevalence rate [PR] of 2.36 cases under treatment per 10,000 population and a new casedetection rate [NCDR] of 3.7 per 10,000 persons, both considerably in excess of the West Bengal PR of1.24 and NCDR of 1.81, the incidence of leprosy in Uttar Dinajpur district is still very high. In the country,where PR has declined substantially, the elimination level being targeted by WHO-sponsored leprosyeradication programmes will be achieved at a PR of 1 per 10,000 which would lower the transmission riskof the disease. However, for this to happen, the detection of new cases in high-incidence districts suchUttar Dinajpur would also have to decline steeply. A major impediment in meeting programme targets isposed by the relatively long incubation period of the disease and by the social stigma attached to it whichcauses its incidence to be concealed. Hence, although the prevalence of leprosy may decline steadily, ittakes some time for NCDR to respond during which the possibility of transmission remains high.
Nearly half of the new cases currently detected in Uttar Dinajpur are diagnosed to be suffering from themore contagious multibacillary [MB] form of the disease. Compared to leprosy in other forms, the treatmentcycle for MB leprosy with multi-drug therapy [MDT] is twice as prolonged and takes twice as many doses.Thus with a release from treatment [RFT] rate of 48.08 percent, the district still lags considerably behind thenational RFT of around 90.6 percent. While this partly reflects the longer treatment cycle, the possibilitythat many patients may discontinue their treatment midway is also real. In such cases, while the contagionrisk of MB leprosy remains high, re-infection may also occur among the original patients. Women patientscomprise 32.1 percent of the new cases detected in Uttar Dinajpur district. Although fewer women areknown to suffer from the MB form of the disease, the two-thirds presence of men among new casesdetected does not necessarily indicate that women are at lower risk. The usual cause for femaleunderrepresentation in NCDR is the limited access of women to facilities where leprosy infections can bedetected and treated, as a result of which more cases of leprosy among women still go undetected.
Malaria Incidence
Malaria in human beings is caused by presence of the protozoan parasites Plasmodium vivax or Plasmodiumfalciparum, which enter the blood stream after bites from the female anopheles mosquito. The P. falciparum[Pf] induced strain of malaria is more virulent because of its resistance to treatment with syntheticcholoroquine, the usual drug administered in cases of malaria. Under the NVCDP surveillance system,case detection of malaria commences with the fortnightly domiciliary visits made by male MPHWs, whensample blood smears are taken from patients suspected to be suffering symptomatically from malarialfever. These slides are tested at microscopy laboratories at NMCP designated public health institutions toestablish whether the malaria parasite is present. The annual parasite incidence [API] reported in UttarDinajpur in 2007 i.e. the annual number of cases where the presence of the malaria parasite was confirmedby microscopy tests was estimated to be around 0.17 per 1000 population on a sampling rate of 2.88percent, with a slide positivity rate [SPR] of 0.16 percent. Although low when compared to the all-India API
Human Development Report 2010
112
of 0.89 in 2004, the accuracy of the API measure depends on the annual blood smear examination rates[ABER] i.e. the proportion of the population under surveillance from whom blood smears have been collected,which was 2.88 percent in Uttar Dinajpur. Since this depends in turn on the total number of MPHWsavailable and the overall efficiency of the domiciliary visit system, persisting staffing gaps and vacanciescan lead to lower detection rates. Although no deaths from the disease were reported in the district, 9 casesof Pf malaria were detected among the slides examined, indicating that this drug-resistant strain which isendemic in the Northeast states and neighbouring Bangladesh has also spread into Uttar Dinajpur.
Among the other diseases in the vector-borne group, kala-azar had a major presence with 118 reportedcases in 2007. With 710 kala-azar cases being recorded cumulatively in the district between 2001-06,Uttar Dinajpur accounted for 6 percent of the total cases recorded in West Bengal. However, with modernprophylaxis the number of fatalities could be limited to 3. Dengue fever which strikes the neighbouringdistrict of Malda with greater severity had lower presence in Uttar Dinajpur with only 4 reported cases,while no cases of lymphatic filariasis and Japanese encephalitis were found to be present in 2007.
Tuberculosis Incidence
Tuberculosis was once a major killer disease in India and the country still accounts for over one-fourth ofthe new cases detected globally today. Although the National TB Control Programme [NTCP] instituted in1962 aimed at early detection and treatment of the disease through a widespread network of DistrictTuberculosis Centres [DTCs] and PHC level testing services, one of the long-standing problems faced byNTCP was the non-completion of the lengthy course of treatment by patients in whom the presence of theTB bacillus had been detected. Since 1992, the revised RNTCP programme has thus sought to improvedetection rates by extending microscopy services through the PHCs and to provide effective short-courseDOTS treatment to all sufferers in order the break the chain of transmission and thereby shrink the pool ofthe disease to negligible proportions. Significant success has since been achieved under RNTCP withannual total case detection rates rising nationally to 125 per lakh population with a positive smear detectionrate of 53 per lakh while cure rates among new cases have now risen to 83 percent, all of which have beensurpassed in West Bengal. However, with 3091 new cases of TB being detected in Uttar Dinapur in 2007,the annual total case detection rate is still around 118 per lakh population and lags behind the national andstate averages. However, although the smear positive rate for the district matches the national rate of 53 perlakh, the cure rate of 86 percent among new TB cases is better than the national rate with a low default rateof 7.53 percent, though still short of the state average of 90 percent. For the incidence of TB to be eradicatedin Uttar Dinajpur, a strong thrust will have to be placed on new case detection.
HIV/AIDS Risks
The incidence of sexually transmitted infections [STIs] and direct risks of HIV/AIDS are known to haverisen in Uttar Dinajpur as a consequence of the growing movement of young males from the district toother metropolitan cities and states in search of temporary work. Such movements are particularly strong inthe border blocks of Islampur SD. Migrant workers in large cities may often engage in high-risk sexualbehavior, and because they return seasonally to their homes and spouses, the vulnerability of womenfolkto transmission risks also becomes similarly high. Because of the possibility of parental transmission, thefuture generation of children is also rendered vulnerable.
Such health risks are accentuated by the passage of major highway links through the length of the district,especially after Dalkola where the NH34 route leading from Kolkata to Uttar Dinajpur is joined by NH31
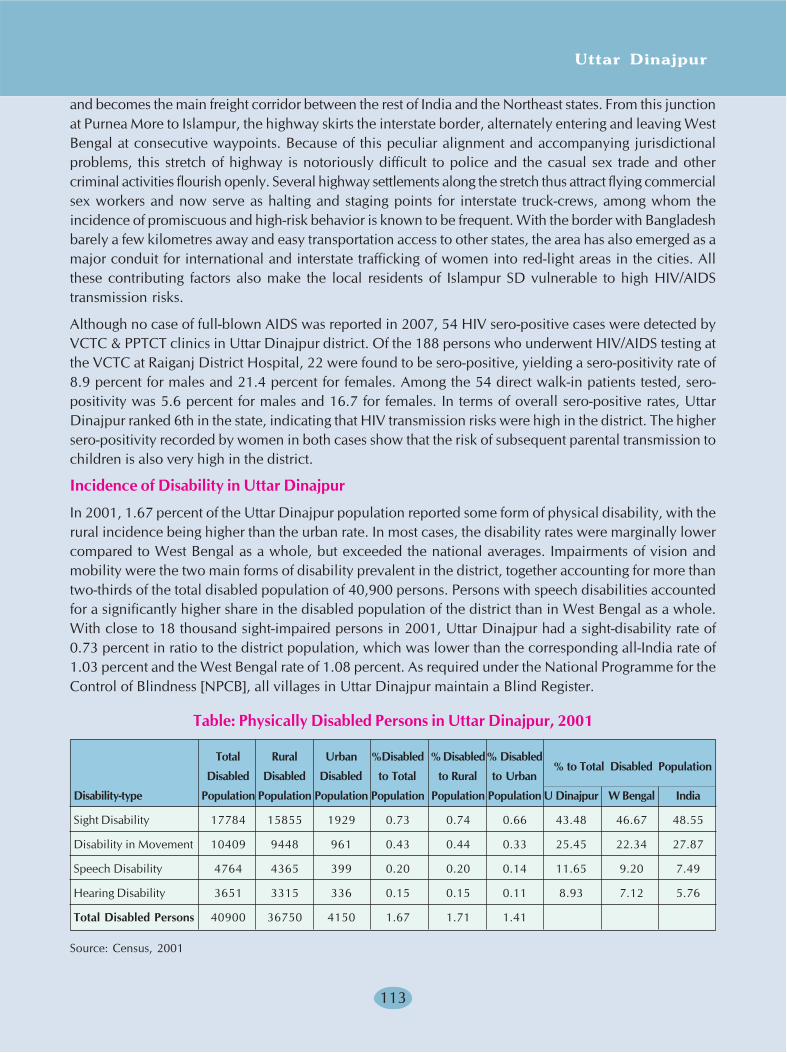
Uttar Dinajpur
113
and becomes the main freight corridor between the rest of India and the Northeast states. From this junctionat Purnea More to Islampur, the highway skirts the interstate border, alternately entering and leaving WestBengal at consecutive waypoints. Because of this peculiar alignment and accompanying jurisdictionalproblems, this stretch of highway is notoriously difficult to police and the casual sex trade and othercriminal activities flourish openly. Several highway settlements along the stretch thus attract flying commercialsex workers and now serve as halting and staging points for interstate truck-crews, among whom theincidence of promiscuous and high-risk behavior is known to be frequent. With the border with Bangladeshbarely a few kilometres away and easy transportation access to other states, the area has also emerged as amajor conduit for international and interstate trafficking of women into red-light areas in the cities. Allthese contributing factors also make the local residents of Islampur SD vulnerable to high HIV/AIDStransmission risks.
Although no case of full-blown AIDS was reported in 2007, 54 HIV sero-positive cases were detected byVCTC & PPTCT clinics in Uttar Dinajpur district. Of the 188 persons who underwent HIV/AIDS testing atthe VCTC at Raiganj District Hospital, 22 were found to be sero-positive, yielding a sero-positivity rate of8.9 percent for males and 21.4 percent for females. Among the 54 direct walk-in patients tested, sero-positivity was 5.6 percent for males and 16.7 for females. In terms of overall sero-positive rates, UttarDinajpur ranked 6th in the state, indicating that HIV transmission risks were high in the district. The highersero-positivity recorded by women in both cases show that the risk of subsequent parental transmission tochildren is also very high in the district.
Incidence of Disability in Uttar Dinajpur
In 2001, 1.67 percent of the Uttar Dinajpur population reported some form of physical disability, with therural incidence being higher than the urban rate. In most cases, the disability rates were marginally lowercompared to West Bengal as a whole, but exceeded the national averages. Impairments of vision andmobility were the two main forms of disability prevalent in the district, together accounting for more thantwo-thirds of the total disabled population of 40,900 persons. Persons with speech disabilities accountedfor a significantly higher share in the disabled population of the district than in West Bengal as a whole.With close to 18 thousand sight-impaired persons in 2001, Uttar Dinajpur had a sight-disability rate of0.73 percent in ratio to the district population, which was lower than the corresponding all-India rate of1.03 percent and the West Bengal rate of 1.08 percent. As required under the National Programme for theControl of Blindness [NPCB], all villages in Uttar Dinajpur maintain a Blind Register.
Table: Physically Disabled Persons in Uttar Dinajpur, 2001
Total Rural Urban %Disabled % Disabled% Disabled
Disabled Disabled Disabled to Total to Rural to Urban% to Total Disabled Population
Disability-type Population Population Population Population Population Population U Dinajpur W Bengal India
Sight Disability 17784 15855 1929 0.73 0.74 0.66 43.48 46.67 48.55
Disability in Movement 10409 9448 961 0.43 0.44 0.33 25.45 22.34 27.87
Speech Disability 4764 4365 399 0.20 0.20 0.14 11.65 9.20 7.49
Hearing Disability 3651 3315 336 0.15 0.15 0.11 8.93 7.12 5.76
Total Disabled Persons 40900 36750 4150 1.67 1.71 1.41
Source: Census, 2001
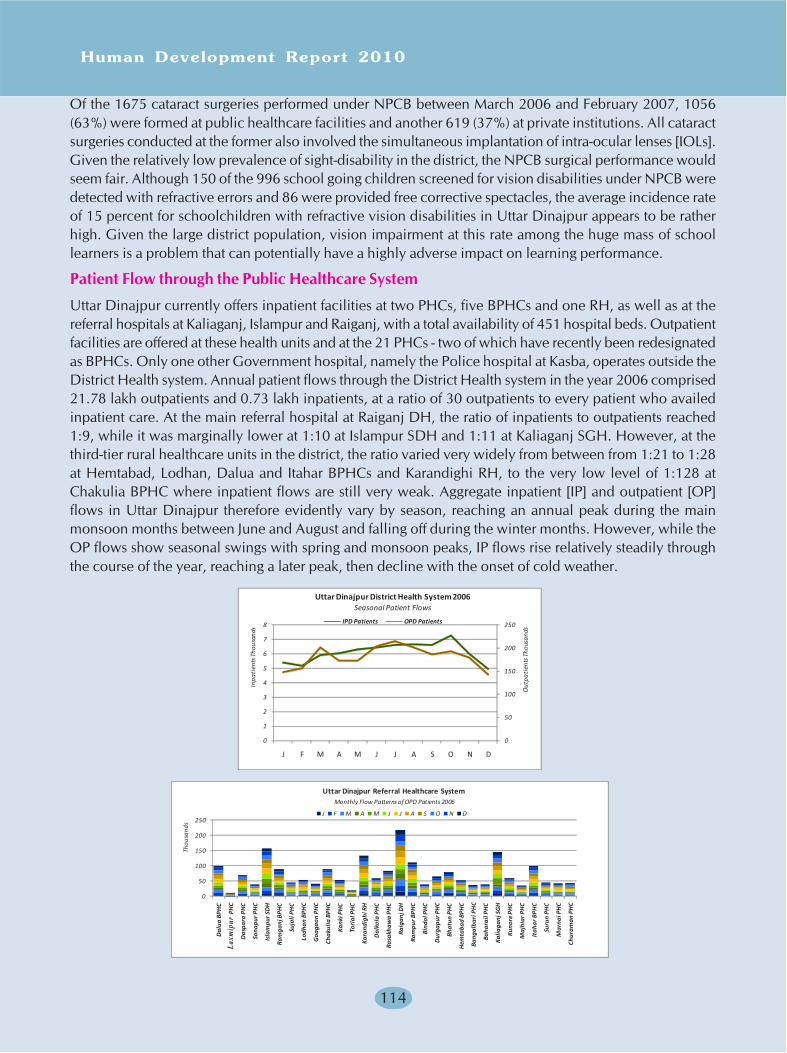
Human Development Report 2010
114
Of the 1675 cataract surgeries performed under NPCB between March 2006 and February 2007, 1056(63%) were formed at public healthcare facilities and another 619 (37%) at private institutions. All cataractsurgeries conducted at the former also involved the simultaneous implantation of intra-ocular lenses [IOLs].Given the relatively low prevalence of sight-disability in the district, the NPCB surgical performance wouldseem fair. Although 150 of the 996 school going children screened for vision disabilities under NPCB weredetected with refractive errors and 86 were provided free corrective spectacles, the average incidence rateof 15 percent for schoolchildren with refractive vision disabilities in Uttar Dinajpur appears to be ratherhigh. Given the large district population, vision impairment at this rate among the huge mass of schoollearners is a problem that can potentially have a highly adverse impact on learning performance.
Patient Flow through the Public Healthcare System
Uttar Dinajpur currently offers inpatient facilities at two PHCs, five BPHCs and one RH, as well as at thereferral hospitals at Kaliaganj, Islampur and Raiganj, with a total availability of 451 hospital beds. Outpatientfacilities are offered at these health units and at the 21 PHCs - two of which have recently been redesignatedas BPHCs. Only one other Government hospital, namely the Police hospital at Kasba, operates outside theDistrict Health system. Annual patient flows through the District Health system in the year 2006 comprised21.78 lakh outpatients and 0.73 lakh inpatients, at a ratio of 30 outpatients to every patient who availedinpatient care. At the main referral hospital at Raiganj DH, the ratio of inpatients to outpatients reached1:9, while it was marginally lower at 1:10 at Islampur SDH and 1:11 at Kaliaganj SGH. However, at thethird-tier rural healthcare units in the district, the ratio varied very widely from between from 1:21 to 1:28at Hemtabad, Lodhan, Dalua and Itahar BPHCs and Karandighi RH, to the very low level of 1:128 atChakulia BPHC where inpatient flows are still very weak. Aggregate inpatient [IP] and outpatient [OP]flows in Uttar Dinajpur therefore evidently vary by season, reaching an annual peak during the mainmonsoon months between June and August and falling off during the winter months. However, while theOP flows show seasonal swings with spring and monsoon peaks, IP flows rise relatively steadily throughthe course of the year, reaching a later peak, then decline with the onset of cold weather.
0
50
100
150
200
250
0
1
2
3
4
5
6
7
8
J F M A M J J A S O N D
Out
pati
ents
Tho
usan
ds
Inpa
tien
ts T
hous
ands
IPD Patients OPD Patients
Uttar Dinajpur District Health System 2006Seasonal Patient Flows
0
50
100
150
200
250
Dal
ua B
PHC
Lakh
ipur
PH
C
Das
para
PH
C
Sona
pur P
HC
Isla
mpu
r SD
H
Ram
ganj
BPH
C
Suja
li PH
C
Lodh
an B
PHC
Goa
gaon
PH
C
Chak
ulia
BPH
C
Kank
i PH
C
Tori
al P
HC
Kara
ndig
hi R
H
Dal
kola
PH
C
Rasa
khaw
a PH
C
Raig
anj D
H
Ram
pur B
PHC
Bind
ol P
HC
Dur
gapu
r PH
C
Bhat
un P
HC
Hem
taba
d BP
HC
Bang
alba
ri P
HC
Baha
rail
PHC
Kalia
ganj
SG
H
Kuno
re P
HC
Maj
hiar
PH
C
Itah
ar B
PHC
Suru
n PH
C
Mar
nai P
HC
Chur
aman
PH
C
Thou
sand
s
J F M A M J J A S O N D
Uttar Dinajpur Referral Healthcare SystemMonthly Flow Patterns of OPD Patients 2006
Laxmipur
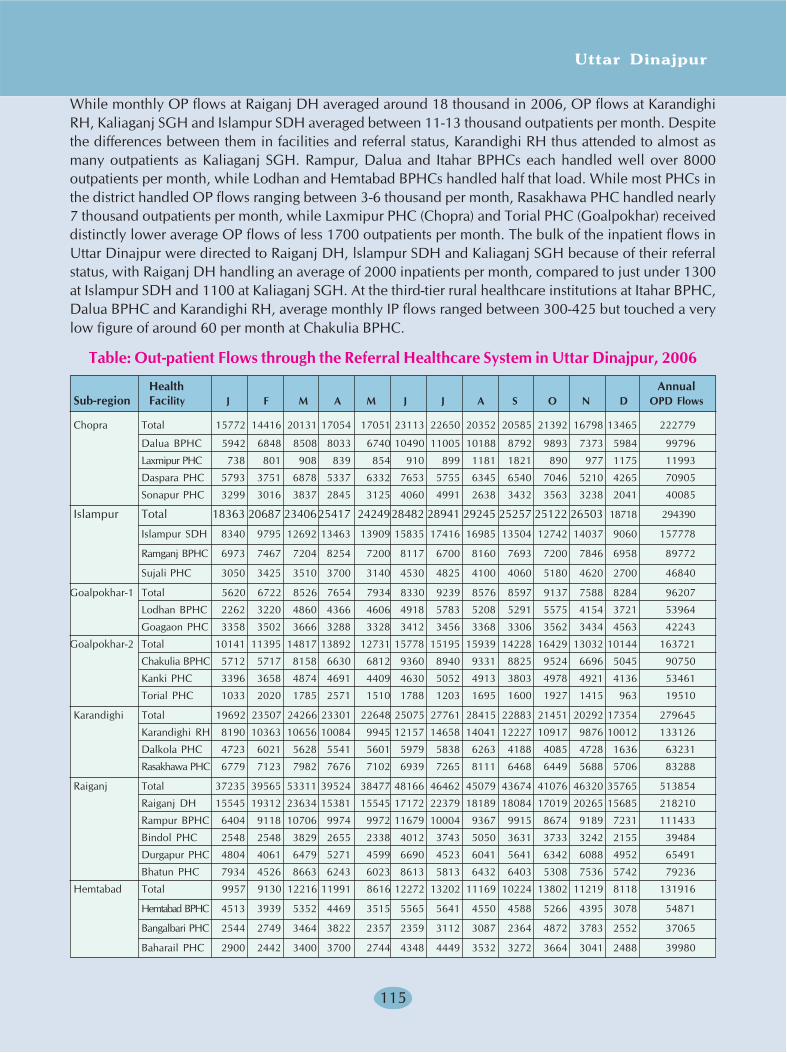
Uttar Dinajpur
115
While monthly OP flows at Raiganj DH averaged around 18 thousand in 2006, OP flows at KarandighiRH, Kaliaganj SGH and Islampur SDH averaged between 11-13 thousand outpatients per month. Despitethe differences between them in facilities and referral status, Karandighi RH thus attended to almost asmany outpatients as Kaliaganj SGH. Rampur, Dalua and Itahar BPHCs each handled well over 8000outpatients per month, while Lodhan and Hemtabad BPHCs handled half that load. While most PHCs inthe district handled OP flows ranging between 3-6 thousand per month, Rasakhawa PHC handled nearly7 thousand outpatients per month, while Laxmipur PHC (Chopra) and Torial PHC (Goalpokhar) receiveddistinctly lower average OP flows of less 1700 outpatients per month. The bulk of the inpatient flows inUttar Dinajpur were directed to Raiganj DH, lslampur SDH and Kaliaganj SGH because of their referralstatus, with Raiganj DH handling an average of 2000 inpatients per month, compared to just under 1300at Islampur SDH and 1100 at Kaliaganj SGH. At the third-tier rural healthcare institutions at Itahar BPHC,Dalua BPHC and Karandighi RH, average monthly IP flows ranged between 300-425 but touched a verylow figure of around 60 per month at Chakulia BPHC.
Table: Out-patient Flows through the Referral Healthcare System in Uttar Dinajpur, 2006
Health AnnualSub-region Facility J F M A M J J A S O N D OPD Flows
Chopra Total 15772 14416 20131 17054 17051 23113 22650 20352 20585 21392 16798 13465 222779
Dalua BPHC 5942 6848 8508 8033 6740 10490 11005 10188 8792 9893 7373 5984 99796
Laxmipur PHC 738 801 908 839 854 910 899 1181 1821 890 977 1175 11993
Daspara PHC 5793 3751 6878 5337 6332 7653 5755 6345 6540 7046 5210 4265 70905
Sonapur PHC 3299 3016 3837 2845 3125 4060 4991 2638 3432 3563 3238 2041 40085
Islampur Total 18363 20687 2340625417 2424928482 28941 29245 25257 25122 26503 18718 294390
Islampur SDH 8340 9795 12692 13463 13909 15835 17416 16985 13504 12742 14037 9060 157778
Ramganj BPHC 6973 7467 7204 8254 7200 8117 6700 8160 7693 7200 7846 6958 89772
Sujali PHC 3050 3425 3510 3700 3140 4530 4825 4100 4060 5180 4620 2700 46840
Goalpokhar-1 Total 5620 6722 8526 7654 7934 8330 9239 8576 8597 9137 7588 8284 96207
Lodhan BPHC 2262 3220 4860 4366 4606 4918 5783 5208 5291 5575 4154 3721 53964
Goagaon PHC 3358 3502 3666 3288 3328 3412 3456 3368 3306 3562 3434 4563 42243
Goalpokhar-2 Total 10141 11395 14817 13892 12731 15778 15195 15939 14228 16429 13032 10144 163721
Chakulia BPHC 5712 5717 8158 6630 6812 9360 8940 9331 8825 9524 6696 5045 90750
Kanki PHC 3396 3658 4874 4691 4409 4630 5052 4913 3803 4978 4921 4136 53461
Torial PHC 1033 2020 1785 2571 1510 1788 1203 1695 1600 1927 1415 963 19510
Karandighi Total 19692 23507 24266 23301 22648 25075 27761 28415 22883 21451 20292 17354 279645
Karandighi RH 8190 10363 10656 10084 9945 12157 14658 14041 12227 10917 9876 10012 133126
Dalkola PHC 4723 6021 5628 5541 5601 5979 5838 6263 4188 4085 4728 1636 63231
Rasakhawa PHC 6779 7123 7982 7676 7102 6939 7265 8111 6468 6449 5688 5706 83288
Raiganj Total 37235 39565 53311 39524 38477 48166 46462 45079 43674 41076 46320 35765 513854
Raiganj DH 15545 19312 23634 15381 15545 17172 22379 18189 18084 17019 20265 15685 218210
Rampur BPHC 6404 9118 10706 9974 9972 11679 10004 9367 9915 8674 9189 7231 111433
Bindol PHC 2548 2548 3829 2655 2338 4012 3743 5050 3631 3733 3242 2155 39484
Durgapur PHC 4804 4061 6479 5271 4599 6690 4523 6041 5641 6342 6088 4952 65491
Bhatun PHC 7934 4526 8663 6243 6023 8613 5813 6432 6403 5308 7536 5742 79236
Hemtabad Total 9957 9130 12216 11991 8616 12272 13202 11169 10224 13802 11219 8118 131916
Hemtabad BPHC 4513 3939 5352 4469 3515 5565 5641 4550 4588 5266 4395 3078 54871
Bangalbari PHC 2544 2749 3464 3822 2357 2359 3112 3087 2364 4872 3783 2552 37065
Baharail PHC 2900 2442 3400 3700 2744 4348 4449 3532 3272 3664 3041 2488 39980
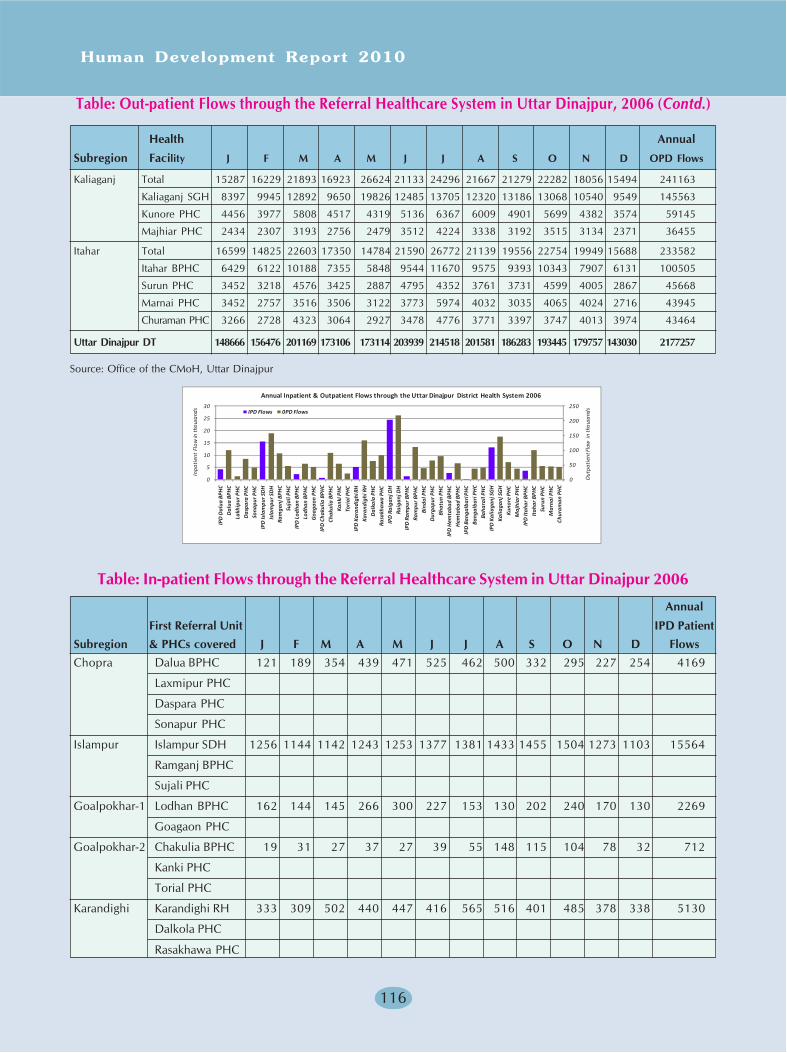
Human Development Report 2010
116
Kaliaganj Total 15287 16229 21893 16923 26624 21133 24296 21667 21279 22282 18056 15494 241163
Kaliaganj SGH 8397 9945 12892 9650 19826 12485 13705 12320 13186 13068 10540 9549 145563
Kunore PHC 4456 3977 5808 4517 4319 5136 6367 6009 4901 5699 4382 3574 59145
Majhiar PHC 2434 2307 3193 2756 2479 3512 4224 3338 3192 3515 3134 2371 36455
Itahar Total 16599 14825 22603 17350 14784 21590 26772 21139 19556 22754 19949 15688 233582
Itahar BPHC 6429 6122 10188 7355 5848 9544 11670 9575 9393 10343 7907 6131 100505
Surun PHC 3452 3218 4576 3425 2887 4795 4352 3761 3731 4599 4005 2867 45668
Marnai PHC 3452 2757 3516 3506 3122 3773 5974 4032 3035 4065 4024 2716 43945
Churaman PHC 3266 2728 4323 3064 2927 3478 4776 3771 3397 3747 4013 3974 43464
Uttar Dinajpur DT 148666 156476 201169 173106 173114 203939 214518 201581 186283 193445 179757 143030 2177257
Source: Office of the CMoH, Uttar Dinajpur
Table: In-patient Flows through the Referral Healthcare System in Uttar Dinajpur 2006
Annual
First Referral Unit IPD PatientSubregion & PHCs covered J F M A M J J A S O N D FlowsChopra Dalua BPHC 121 189 354 439 471 525 462 500 332 295 227 254 4169
Laxmipur PHC
Daspara PHC
Sonapur PHC
Islampur Islampur SDH 1256 1144 1142 1243 1253 1377 1381 1433 1455 1504 1273 1103 15564
Ramganj BPHC
Sujali PHC
Goalpokhar-1 Lodhan BPHC 162 144 145 266 300 227 153 130 202 240 170 130 2269
Goagaon PHC
Goalpokhar-2 Chakulia BPHC 19 31 27 37 27 39 55 148 115 104 78 32 712
Kanki PHC
Torial PHC
Karandighi Karandighi RH 333 309 502 440 447 416 565 516 401 485 378 338 5130
Dalkola PHC
Rasakhawa PHC
Table: Out-patient Flows through the Referral Healthcare System in Uttar Dinajpur, 2006 (Contd.)
Health Annual
Subregion Facility J F M A M J J A S O N D OPD Flows
0
50
100
150
200
250
0
5
10
15
20
25
30
IPD
Dal
ua B
PHC
Dal
ua B
PHC
Lakh
ipur
PH
CD
aspa
ra P
HC
Sona
pur P
HC
IPD
Isla
mpu
r SD
HIs
lam
pur S
DH
Ram
ganj
BPH
CSu
jali
PHC
IPD
Lod
han
BPH
CLo
dhan
BPH
CG
oaga
on P
HC
IPD
Cha
kulia
BPH
CCh
akul
ia B
PHC
Kank
i PH
CTo
rial
PH
CIP
D K
aran
digh
i RH
Kara
ndig
hi R
HD
alko
la P
HC
Rasa
khaw
a PH
CIP
D R
aiga
nj D
HRa
igan
j DH
IPD
Ram
pur B
PHC
Ram
pur B
PHC
Bind
ol P
HC
Dur
gapu
r PH
CBh
atun
PH
CIP
D H
emta
bad
BPH
CH
emta
bad
BPH
CIP
D B
anga
lbar
i PH
CBa
ngal
bari
PH
CBa
hara
il PH
CIP
D K
alia
ganj
SG
HKa
liaga
nj S
GH
Kuno
re P
HC
Maj
hiar
PH
CIP
D It
ahar
BPH
CIt
ahar
BPH
CSu
run
PHC
Mar
nai P
HC
Chur
aman
PH
C
Out
pati
ent F
low
in
thou
sand
s
Inpa
tien
t Fl
ow in
thou
sand
s
IPD Flows 0PD Flows
Annual Inpatient & Outpatient Flows through the Uttar Dinajpur District Health System 2006
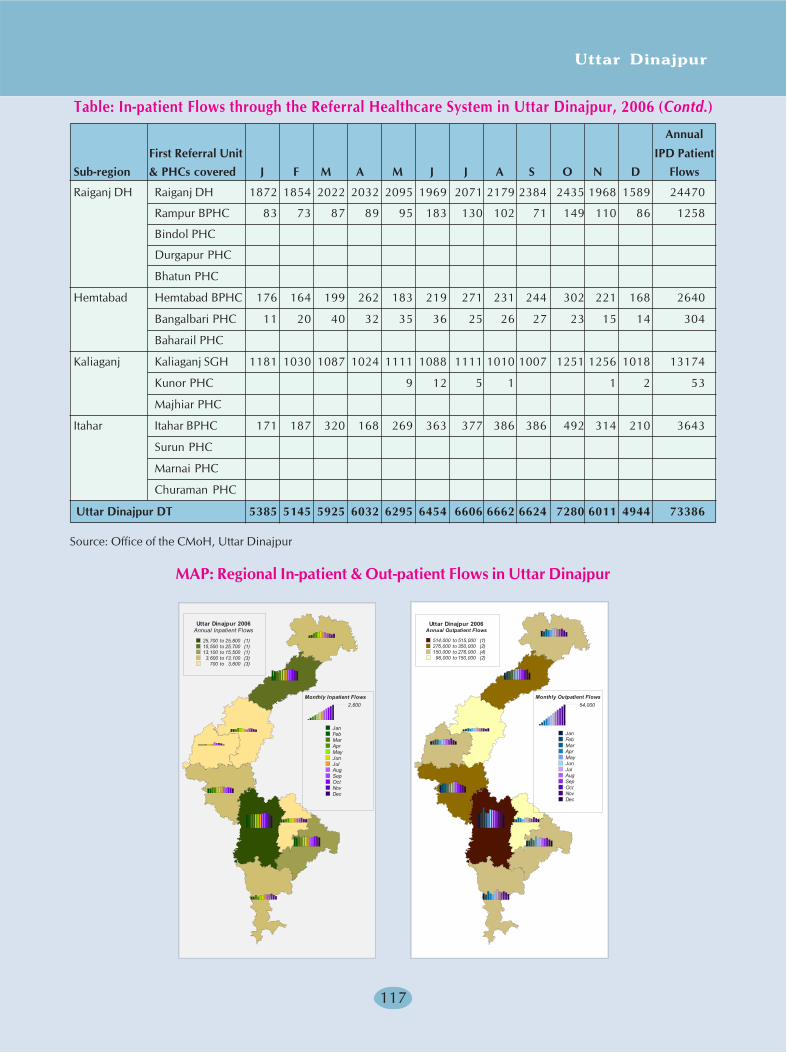
Uttar Dinajpur
117
Raiganj DH Raiganj DH 1872 1854 2022 2032 2095 1969 2071 2179 2384 2435 1968 1589 24470
Rampur BPHC 83 73 87 89 95 183 130 102 71 149 110 86 1258
Bindol PHC
Durgapur PHC
Bhatun PHC
Hemtabad Hemtabad BPHC 176 164 199 262 183 219 271 231 244 302 221 168 2640
Bangalbari PHC 11 20 40 32 35 36 25 26 27 23 15 14 304
Baharail PHC
Kaliaganj Kaliaganj SGH 1181 1030 1087 1024 1111 1088 1111 1010 1007 1251 1256 1018 13174
Kunor PHC 9 12 5 1 1 2 53
Majhiar PHC
Itahar Itahar BPHC 171 187 320 168 269 363 377 386 386 492 314 210 3643
Surun PHC
Marnai PHC
Churaman PHC
Uttar Dinajpur DT 5385 5145 5925 6032 6295 6454 6606 6662 6624 7280 6011 4944 73386
Source: Office of the CMoH, Uttar Dinajpur
MAP: Regional In-patient & Out-patient Flows in Uttar Dinajpur
Table: In-patient Flows through the Referral Healthcare System in Uttar Dinajpur, 2006 (Contd.)
Annual
First Referral Unit IPD PatientSub-region & PHCs covered J F M A M J J A S O N D Flows
Uttar Dinajpur 2006Annual Inpatient Flows
25,700 to 25,800 (1)15,500 to 25,700 (1)13,100 to 15,500 (1)3,600 to 13,100 (3)
700 to 3,600 (3)
Monthly Inpatient Flows2,600
JanFebMarAprMayJunJulAugSepOctNovDec
Uttar Dinajpur 2006Annual Outpatient Flows
514,000 to 515,000 (1)276,000 to 350,000 (2)150,000 to 276,000 (4)96,000 to 150,000 (2)
Monthly Outpatient Flows54,000
JanFebMarAprMayJunJulAugSepOctNovDec
Human Development Report 2010
118
Inpatient care in Uttar Dinajpur suffers considerably from the limited availability of hospital beds relativeto the size of the district population. Against the current WHO norms of 3 beds per 1000 and the nationaltarget of attaining the bed-availability norms of 1 bed per 1000 by the year 2012, bed availability in UttarDinajpur in 2004 averaged 0.17 per 1000 persons on the projected 2004 population. Bed availability inWest Bengal as a whole in 2004 was around 0.8 per 1000, but was considerably higher in Kerala (2.3 per1000) and Maharashtra (1.5 per 1000). Low urbanisation rates in Uttar Dinajpur are partially responsiblefor low hospital bed availability, since in India as a whole, hospital bed availability was 0.7 per 1000 butwas markedly lower at 0.19 per 1000 in rural areas [National Health Profile 2006]. Inpatient care in UttarDinajpur also suffers from wide intradistrict differentials in hospital bed availability, with bed availabilityper 1000 persons touching a low of 0.06 in Chopra and 0.08 in Goalpokhar-1, but improving substantially,because of the presence of the referral hospitals, to 0.22 in Islampur block, 0.24 in Kaliaganj and 0.33 inRaiganj block. Given such figures, it is obvious that the key to improvement in the health situation in UttarDinajpur will lie in the rapid upgradation of rural inpatient facilities, which would also have a telling effectin raising IP:OP ratios across the district.
As is evident from the accompanying regional maps, Raiganj and Islampur blocks currently account for theheaviest IP flows in Uttar Dinajpur, while Goalpokhar-1 and Goalpokhar-2 generate the lowest IP and OPflows because of existing weaknesses in their primary healthcare and communications networks. In termsof the intensity of overall OP flows, Raiganj and Islampur are also joined by Karandighi. While Chopra,Kaliaganj and Itahar occupy broadly similar positions in terms of the overall volume of outpatients, Kaliaganjstands well ahead of these other blocks in terms of the volume of inpatients. In general, both inpatient andoutpatient flows are much higher in the densely settled southern blocks Raiganj SD and Karandighi, comparedto the sparsely settled blocks located to the district's north.
Health System Performance in Uttar Dinajpur
Inpatient care requiring hospitalisation is presently provided through 9 public healthcare institutions locatedin Uttar Dinajpur, which include five 15-25 bedded block hospitals at BPHC level serving Chopra,Goalpokhar-1, Goalpokhar-2, Hemtabad and Itahar blocks, one 30 bedded block hospital at RH levelserving Karandighi, two 60-68 bedded SGH/SDH referral hospitals serving Kaliaganj and Islampur blocksas well as the rest of their respective subdivisions, and the 168 bedded District Hospital which serves thecity of Raiganj as well as Raiganj block, besides providing secondary referral for the whole district. In2007, these public hospitals collectively provided healthcare services to 12.20 lakh OP patients and 0.71lakh IPD patients. Among the IPD patients in Uttar Dinajpur, as many as 0.66 lakh (92%) representedemergency admissions, while for West Bengal as a whole, the corresponding ratio of emergency admissionsto total admissions at block hospitals, rural hospitals, SDH and SGH hospitals and district hospitals wasdistinctly lower at around 86 percent. Thus with its limited bed strength being overwhelmed by patientpressure, the public health system in Uttar Dinajpur is left with little slack to provide IPD services to othernon-emergency patients whose condition might also warrant hospitalisation. Besides offering inpatientcare, the Uttar Dinajpur public hospitals also extended non-residential services to another 0.75 lakhemergency patients in 2007. The annual volume of patients collectively handled at all public hospitalinstitutions across the district thus amounted to approximately 12.91 lakh, at an average daily inpatientcensus rate of 196 IPD patients per day and daily attendance of 3343 patients per day at the OPD wings.
At the BPHC level, rural IPD facilities are mainly designed to handle normal maternity cases, minor surgeryand emergencies, while RH hospitals are somewhat better equipped. Yet although the bed availability inratio to the block population is roughly similar between the BPHCs at Dalua, Lodhan, Chakulia and Itahar,and is considerably better at Hemtabad BPHC which has a low block population, the OPD and IPD flows
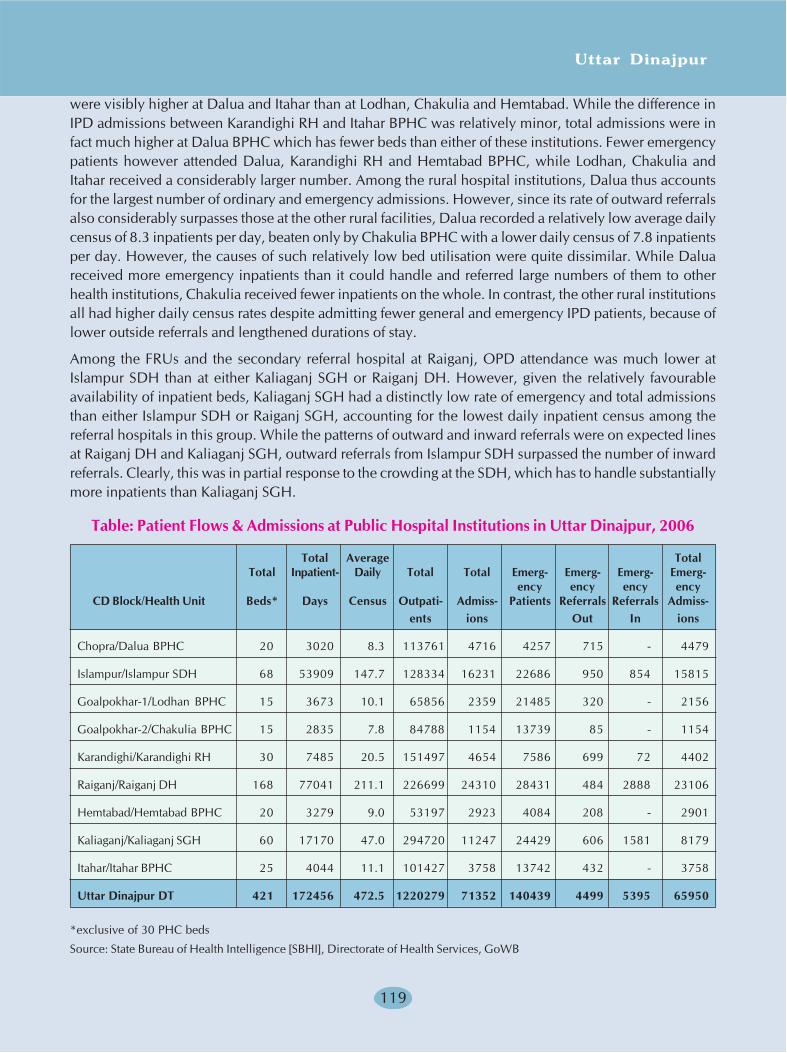
Uttar Dinajpur
119
were visibly higher at Dalua and Itahar than at Lodhan, Chakulia and Hemtabad. While the difference inIPD admissions between Karandighi RH and Itahar BPHC was relatively minor, total admissions were infact much higher at Dalua BPHC which has fewer beds than either of these institutions. Fewer emergencypatients however attended Dalua, Karandighi RH and Hemtabad BPHC, while Lodhan, Chakulia andItahar received a considerably larger number. Among the rural hospital institutions, Dalua thus accountsfor the largest number of ordinary and emergency admissions. However, since its rate of outward referralsalso considerably surpasses those at the other rural facilities, Dalua recorded a relatively low average dailycensus of 8.3 inpatients per day, beaten only by Chakulia BPHC with a lower daily census of 7.8 inpatientsper day. However, the causes of such relatively low bed utilisation were quite dissimilar. While Daluareceived more emergency inpatients than it could handle and referred large numbers of them to otherhealth institutions, Chakulia received fewer inpatients on the whole. In contrast, the other rural institutionsall had higher daily census rates despite admitting fewer general and emergency IPD patients, because oflower outside referrals and lengthened durations of stay.
Among the FRUs and the secondary referral hospital at Raiganj, OPD attendance was much lower atIslampur SDH than at either Kaliaganj SGH or Raiganj DH. However, given the relatively favourableavailability of inpatient beds, Kaliaganj SGH had a distinctly low rate of emergency and total admissionsthan either Islampur SDH or Raiganj SGH, accounting for the lowest daily inpatient census among thereferral hospitals in this group. While the patterns of outward and inward referrals were on expected linesat Raiganj DH and Kaliaganj SGH, outward referrals from Islampur SDH surpassed the number of inwardreferrals. Clearly, this was in partial response to the crowding at the SDH, which has to handle substantiallymore inpatients than Kaliaganj SGH.
Table: Patient Flows & Admissions at Public Hospital Institutions in Uttar Dinajpur, 2006
Total Average TotalTotal Inpatient- Daily Total Total Emerg- Emerg- Emerg- Emerg-
ency ency ency encyCD Block/Health Unit Beds* Days Census Outpati- Admiss- Patients Referrals Referrals Admiss-
ents ions Out In ions
Chopra/Dalua BPHC 20 3020 8.3 113761 4716 4257 715 - 4479
Islampur/Islampur SDH 68 53909 147.7 128334 16231 22686 950 854 15815
Goalpokhar-1/Lodhan BPHC 15 3673 10.1 65856 2359 21485 320 - 2156
Goalpokhar-2/Chakulia BPHC 15 2835 7.8 84788 1154 13739 85 - 1154
Karandighi/Karandighi RH 30 7485 20.5 151497 4654 7586 699 72 4402
Raiganj/Raiganj DH 168 77041 211.1 226699 24310 28431 484 2888 23106
Hemtabad/Hemtabad BPHC 20 3279 9.0 53197 2923 4084 208 - 2901
Kaliaganj/Kaliaganj SGH 60 17170 47.0 294720 11247 24429 606 1581 8179
Itahar/Itahar BPHC 25 4044 11.1 101427 3758 13742 432 - 3758
Uttar Dinajpur DT 421 172456 472.5 1220279 71352 140439 4499 5395 65950
*exclusive of 30 PHC beds
Source: State Bureau of Health Intelligence [SBHI], Directorate of Health Services, GoWB

Human Development Report 2010
120
0
5
10
15
20
25
30
35
40
0
50
100
150
200
250
300
350D
alua
BPH
C
Isla
mpu
r SD
H
Lodh
an B
PHC
Chak
ulia
BPH
C
Kara
ndig
hi R
H
Raig
anj D
H
Hem
taba
d B
PHC
Kalia
ganj
SG
H
Itah
ar B
PHC
IPD
Tho
usan
ds
OPD
Tho
usan
ds OPD & Emergency OPD IPD Patients Emergency IPD
Uttar Dinajpur 2006OPD & IPD Patient Flow at Public Hospitals
-1
4
9
14
19
24
29
34
Dal
ua B
PHC
Isla
mpu
r SD
H
Lodh
an B
PHC
Chak
ulia
BPH
C
Kara
ndig
hi R
H
Raig
anj D
H
Hem
taba
d B
PHC
Kalia
ganj
SG
H
Itah
ar B
PHC
Thou
sand
s
Em/Patients Em/Admissions Em/Referred-out Em/Referred-in
Uttar Dinajpur 2006Patient Flow at Hospital Emergency Facilities
While collectively attending to around 54 percent of the OPD and emergency patients in Uttar Dinajpur,the two FRUs and Raiganj DH accounted for approximately 72 percent of the total inpatients and emergencyadmissions, and for 86 percent of the total inpatient days of care in 2007. Along with two thirds of thepathological tests, virtually all of the electromagnetic imaging tests and all major surgeries are performed atthese referral hospitals. However, the BPHCs and Karandighi RH collectively account for well over a fifthof the institutional deliveries that take place at public hospitals in the district. Despite receiving nearly aquarter of the total OPD outpatients, 29 percent of inward referrals and over 17 percent of the emergencypatients, the share of Kaliaganj SGH in emergency admissions, pathological tests and major surgeriesremains relatively small, indicating that a reasonable level of slack still exists at Kaliaganj, not found anywhereelse at other public hospitals in the district.
Thus, of the 5402 non-emergency patients admitted into inpatient care facilities at public hospitals in UttarDinajpur in 2007, as many as 3068 (57%) were therefore admitted at Kaliaganj SGH, at a low emergencyto total admissions ratio of 73 percent. All other public inpatient facilities in Uttar Dinajpur have muchhigher emergency to total admissions ratios ranging between 91 percent (Dalua) to 100 percent (Chakulia,Itahar), while at the other full-fledged referral hospitals, the ratio touches 95 percent (Raiganj DH) and 97percent (Islampur SDH). Besides attending to the largest number of outpatients in the district, KaliaganjSGH also receives the second-highest number of emergency patients exclusive and inclusive of net referrals,after Raiganj DH. However, the rate of emergency inpatient admissions in response to this flow is distinctlylower at Kaliaganj compared to Raiganj DH. Kaliaganj SGH is thus able to draw some of the OPD healthcarepressure away from Raiganj DH, since it is located fairly close to Raiganj. Islampur SDH, in contrast, islocated too far away from the other referral hospitals for current pressures on its OPD and IPD facilities tobe similarly relieved. It thus has to cope with very high system loads from patients drawn from all overIslampur SD, and records an emergency to total admissions rate of 97 percent which significantly exceedsthe corresponding rates at other major referral hospitals in Uttar Dinajpur. With only 68 inpatient beds,Islampur SDH handles approximately one third of the emergency inpatients and total inpatients that arereceived by the three major referral hospitals, and attends to 36 percent of the deliveries and 50 percent ofthe major surgeries performed at these facilities. Overall pressure on the referral hospital system is thusconsiderably higher in Islampur SD than in Raiganj SD.
With such heavy regional inpatient loads being borne by public hospital facilities in Uttar Dinajpur, theDistrict Health authorities have to manage the flows of OPD and emergency patients and inpatientadmissions in a way that best matches the current intake capacity of the hospital system. Where the fit isnot perfect, the stresses within the system begin to show in hospital performance indicators for variouspublic healthcare institutions. Analysis of these helps in identifying some the most pressing healthcareproblems that confront the district today.
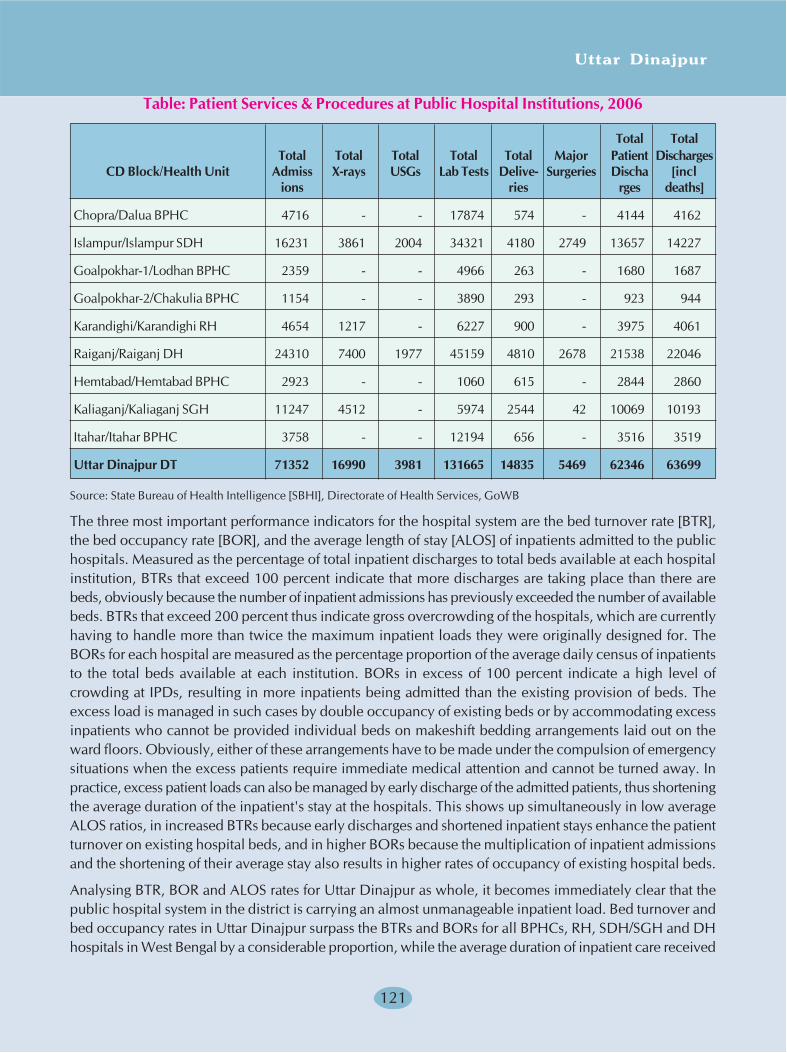
Uttar Dinajpur
121
Table: Patient Services & Procedures at Public Hospital Institutions, 2006
Total TotalTotal Total Total Total Total Major Patient Discharges
CD Block/Health Unit Admiss X-rays USGs Lab Tests Delive- Surgeries Discha [inclions ries rges deaths]
Chopra/Dalua BPHC 4716 - - 17874 574 - 4144 4162
Islampur/Islampur SDH 16231 3861 2004 34321 4180 2749 13657 14227
Goalpokhar-1/Lodhan BPHC 2359 - - 4966 263 - 1680 1687
Goalpokhar-2/Chakulia BPHC 1154 - - 3890 293 - 923 944
Karandighi/Karandighi RH 4654 1217 - 6227 900 - 3975 4061
Raiganj/Raiganj DH 24310 7400 1977 45159 4810 2678 21538 22046
Hemtabad/Hemtabad BPHC 2923 - - 1060 615 - 2844 2860
Kaliaganj/Kaliaganj SGH 11247 4512 - 5974 2544 42 10069 10193
Itahar/Itahar BPHC 3758 - - 12194 656 - 3516 3519
Uttar Dinajpur DT 71352 16990 3981 131665 14835 5469 62346 63699
Source: State Bureau of Health Intelligence [SBHI], Directorate of Health Services, GoWB
The three most important performance indicators for the hospital system are the bed turnover rate [BTR],the bed occupancy rate [BOR], and the average length of stay [ALOS] of inpatients admitted to the publichospitals. Measured as the percentage of total inpatient discharges to total beds available at each hospitalinstitution, BTRs that exceed 100 percent indicate that more discharges are taking place than there arebeds, obviously because the number of inpatient admissions has previously exceeded the number of availablebeds. BTRs that exceed 200 percent thus indicate gross overcrowding of the hospitals, which are currentlyhaving to handle more than twice the maximum inpatient loads they were originally designed for. TheBORs for each hospital are measured as the percentage proportion of the average daily census of inpatientsto the total beds available at each institution. BORs in excess of 100 percent indicate a high level ofcrowding at IPDs, resulting in more inpatients being admitted than the existing provision of beds. Theexcess load is managed in such cases by double occupancy of existing beds or by accommodating excessinpatients who cannot be provided individual beds on makeshift bedding arrangements laid out on theward floors. Obviously, either of these arrangements have to be made under the compulsion of emergencysituations when the excess patients require immediate medical attention and cannot be turned away. Inpractice, excess patient loads can also be managed by early discharge of the admitted patients, thus shorteningthe average duration of the inpatient's stay at the hospitals. This shows up simultaneously in low averageALOS ratios, in increased BTRs because early discharges and shortened inpatient stays enhance the patientturnover on existing hospital beds, and in higher BORs because the multiplication of inpatient admissionsand the shortening of their average stay also results in higher rates of occupancy of existing hospital beds.
Analysing BTR, BOR and ALOS rates for Uttar Dinajpur as whole, it becomes immediately clear that thepublic hospital system in the district is carrying an almost unmanageable inpatient load. Bed turnover andbed occupancy rates in Uttar Dinajpur surpass the BTRs and BORs for all BPHCs, RH, SDH/SGH and DHhospitals in West Bengal by a considerable proportion, while the average duration of inpatient care received
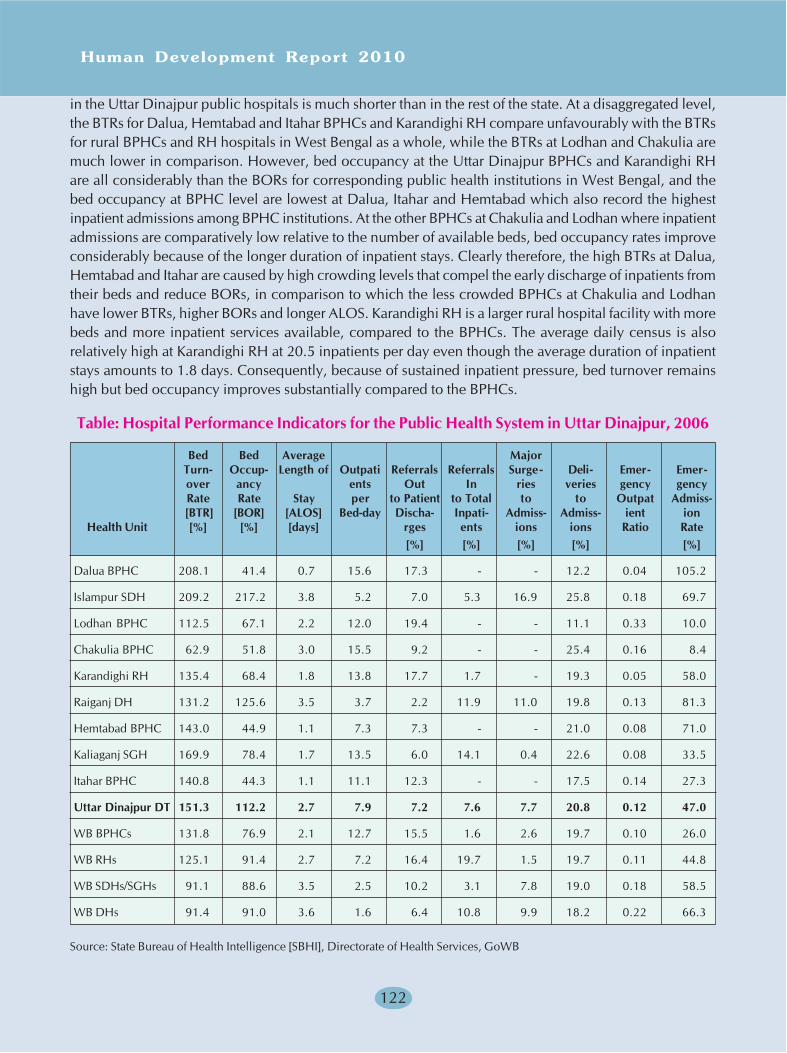
Human Development Report 2010
122
in the Uttar Dinajpur public hospitals is much shorter than in the rest of the state. At a disaggregated level,the BTRs for Dalua, Hemtabad and Itahar BPHCs and Karandighi RH compare unfavourably with the BTRsfor rural BPHCs and RH hospitals in West Bengal as a whole, while the BTRs at Lodhan and Chakulia aremuch lower in comparison. However, bed occupancy at the Uttar Dinajpur BPHCs and Karandighi RHare all considerably than the BORs for corresponding public health institutions in West Bengal, and thebed occupancy at BPHC level are lowest at Dalua, Itahar and Hemtabad which also record the highestinpatient admissions among BPHC institutions. At the other BPHCs at Chakulia and Lodhan where inpatientadmissions are comparatively low relative to the number of available beds, bed occupancy rates improveconsiderably because of the longer duration of inpatient stays. Clearly therefore, the high BTRs at Dalua,Hemtabad and Itahar are caused by high crowding levels that compel the early discharge of inpatients fromtheir beds and reduce BORs, in comparison to which the less crowded BPHCs at Chakulia and Lodhanhave lower BTRs, higher BORs and longer ALOS. Karandighi RH is a larger rural hospital facility with morebeds and more inpatient services available, compared to the BPHCs. The average daily census is alsorelatively high at Karandighi RH at 20.5 inpatients per day even though the average duration of inpatientstays amounts to 1.8 days. Consequently, because of sustained inpatient pressure, bed turnover remainshigh but bed occupancy improves substantially compared to the BPHCs.
Table: Hospital Performance Indicators for the Public Health System in Uttar Dinajpur, 2006
Bed Bed Average MajorTurn- Occup- Length of Outpati Referrals Referrals Surge - Deli- Emer- Emer-over ancy ents Out In ries veries gency gencyRate Rate Stay per to Patient to Total to to Outpat Admiss-
[BTR] [BOR] [ALOS] Bed-day Discha- Inpati- Admiss- Admiss- ient ionHealth Unit [%] [%] [days] rges ents ions ions Ratio Rate
[%] [%] [%] [%] [%]
Dalua BPHC 208.1 41.4 0.7 15.6 17.3 - - 12.2 0.04 105.2
Islampur SDH 209.2 217.2 3.8 5.2 7.0 5.3 16.9 25.8 0.18 69.7
Lodhan BPHC 112.5 67.1 2.2 12.0 19.4 - - 11.1 0.33 10.0
Chakulia BPHC 62.9 51.8 3.0 15.5 9.2 - - 25.4 0.16 8.4
Karandighi RH 135.4 68.4 1.8 13.8 17.7 1.7 - 19.3 0.05 58.0
Raiganj DH 131.2 125.6 3.5 3.7 2.2 11.9 11.0 19.8 0.13 81.3
Hemtabad BPHC 143.0 44.9 1.1 7.3 7.3 - - 21.0 0.08 71.0
Kaliaganj SGH 169.9 78.4 1.7 13.5 6.0 14.1 0.4 22.6 0.08 33.5
Itahar BPHC 140.8 44.3 1.1 11.1 12.3 - - 17.5 0.14 27.3
Uttar Dinajpur DT 151.3 112.2 2.7 7.9 7.2 7.6 7.7 20.8 0.12 47.0
WB BPHCs 131.8 76.9 2.1 12.7 15.5 1.6 2.6 19.7 0.10 26.0
WB RHs 125.1 91.4 2.7 7.2 16.4 19.7 1.5 19.7 0.11 44.8
WB SDHs/SGHs 91.1 88.6 3.5 2.5 10.2 3.1 7.8 19.0 0.18 58.5
WB DHs 91.4 91.0 3.6 1.6 6.4 10.8 9.9 18.2 0.22 66.3
Source: State Bureau of Health Intelligence [SBHI], Directorate of Health Services, GoWB
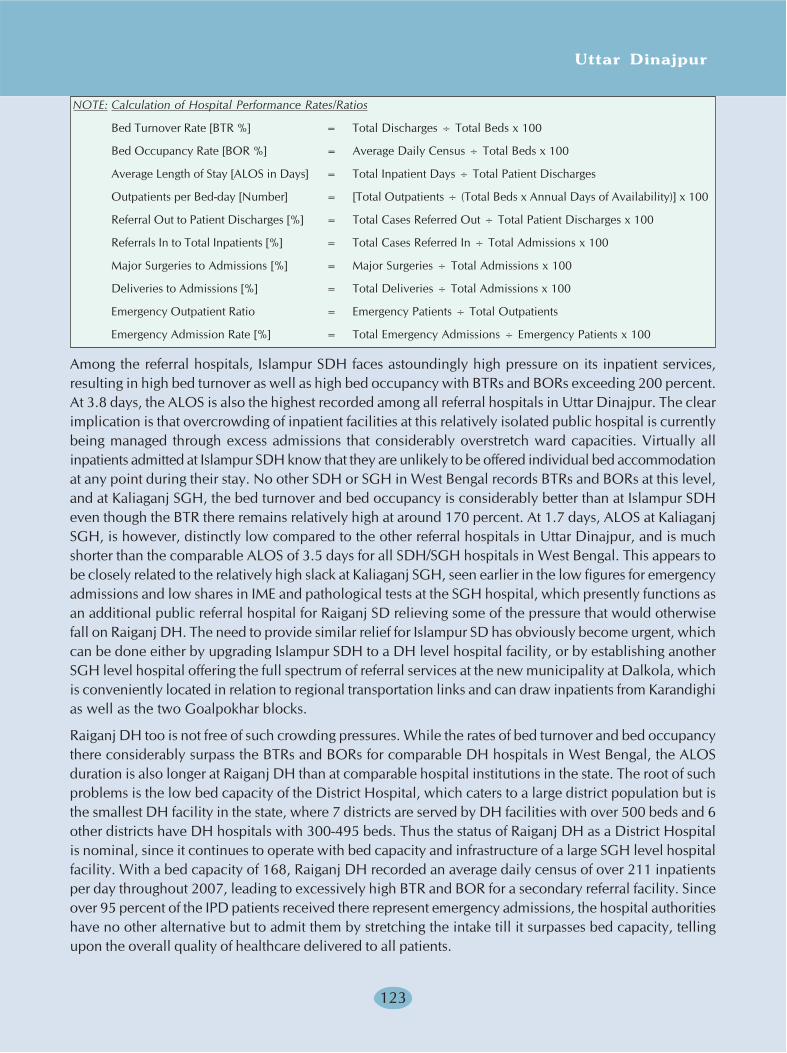
Uttar Dinajpur
123
NOTE: Calculation of Hospital Performance Rates/Ratios
Bed Turnover Rate [BTR %] = Total Discharges ÷ Total Beds x 100
Bed Occupancy Rate [BOR %] = Average Daily Census ÷ Total Beds x 100
Average Length of Stay [ALOS in Days] = Total Inpatient Days ÷ Total Patient Discharges
Outpatients per Bed-day [Number] = [Total Outpatients ÷ (Total Beds x Annual Days of Availability)] x 100
Referral Out to Patient Discharges [%] = Total Cases Referred Out ÷ Total Patient Discharges x 100
Referrals In to Total Inpatients [%] = Total Cases Referred In ÷ Total Admissions x 100
Major Surgeries to Admissions [%] = Major Surgeries ÷ Total Admissions x 100
Deliveries to Admissions [%] = Total Deliveries ÷ Total Admissions x 100
Emergency Outpatient Ratio = Emergency Patients ÷ Total Outpatients
Emergency Admission Rate [%] = Total Emergency Admissions ÷ Emergency Patients x 100
Among the referral hospitals, Islampur SDH faces astoundingly high pressure on its inpatient services,resulting in high bed turnover as well as high bed occupancy with BTRs and BORs exceeding 200 percent.At 3.8 days, the ALOS is also the highest recorded among all referral hospitals in Uttar Dinajpur. The clearimplication is that overcrowding of inpatient facilities at this relatively isolated public hospital is currentlybeing managed through excess admissions that considerably overstretch ward capacities. Virtually allinpatients admitted at Islampur SDH know that they are unlikely to be offered individual bed accommodationat any point during their stay. No other SDH or SGH in West Bengal records BTRs and BORs at this level,and at Kaliaganj SGH, the bed turnover and bed occupancy is considerably better than at Islampur SDHeven though the BTR there remains relatively high at around 170 percent. At 1.7 days, ALOS at KaliaganjSGH, is however, distinctly low compared to the other referral hospitals in Uttar Dinajpur, and is muchshorter than the comparable ALOS of 3.5 days for all SDH/SGH hospitals in West Bengal. This appears tobe closely related to the relatively high slack at Kaliaganj SGH, seen earlier in the low figures for emergencyadmissions and low shares in IME and pathological tests at the SGH hospital, which presently functions asan additional public referral hospital for Raiganj SD relieving some of the pressure that would otherwisefall on Raiganj DH. The need to provide similar relief for Islampur SD has obviously become urgent, whichcan be done either by upgrading Islampur SDH to a DH level hospital facility, or by establishing anotherSGH level hospital offering the full spectrum of referral services at the new municipality at Dalkola, whichis conveniently located in relation to regional transportation links and can draw inpatients from Karandighias well as the two Goalpokhar blocks.
Raiganj DH too is not free of such crowding pressures. While the rates of bed turnover and bed occupancythere considerably surpass the BTRs and BORs for comparable DH hospitals in West Bengal, the ALOSduration is also longer at Raiganj DH than at comparable hospital institutions in the state. The root of suchproblems is the low bed capacity of the District Hospital, which caters to a large district population but isthe smallest DH facility in the state, where 7 districts are served by DH facilities with over 500 beds and 6other districts have DH hospitals with 300-495 beds. Thus the status of Raiganj DH as a District Hospitalis nominal, since it continues to operate with bed capacity and infrastructure of a large SGH level hospitalfacility. With a bed capacity of 168, Raiganj DH recorded an average daily census of over 211 inpatientsper day throughout 2007, leading to excessively high BTR and BOR for a secondary referral facility. Sinceover 95 percent of the IPD patients received there represent emergency admissions, the hospital authoritieshave no other alternative but to admit them by stretching the intake till it surpasses bed capacity, tellingupon the overall quality of healthcare delivered to all patients.
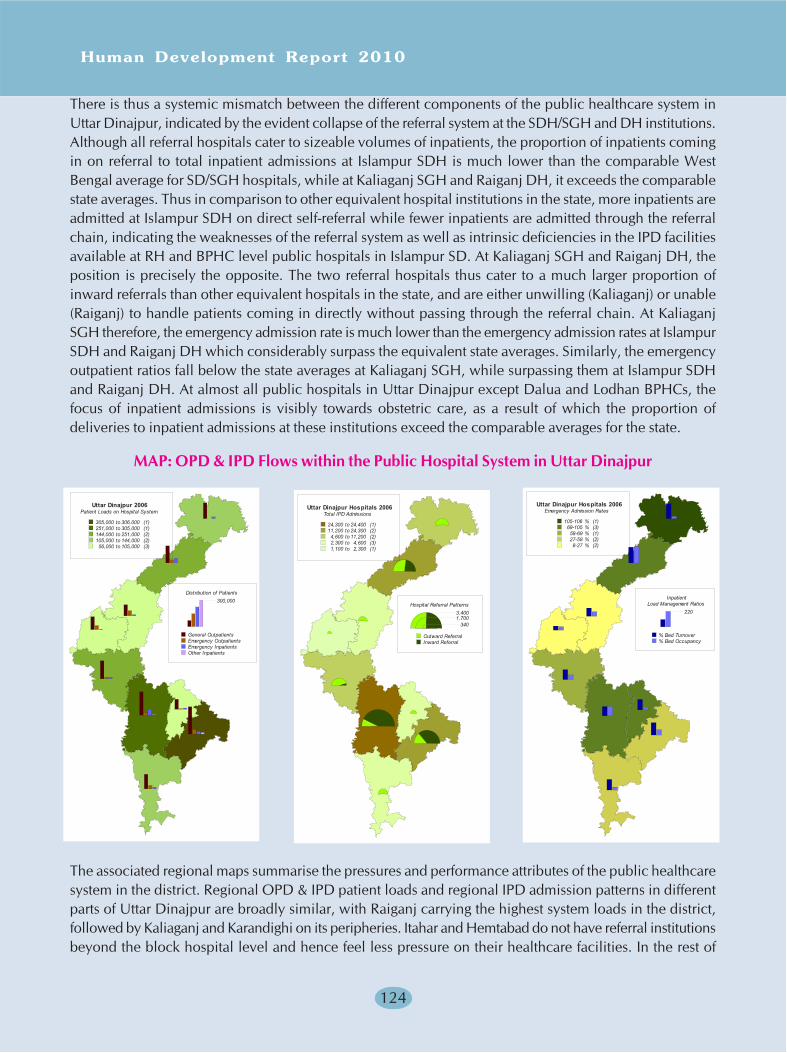
Human Development Report 2010
124
There is thus a systemic mismatch between the different components of the public healthcare system inUttar Dinajpur, indicated by the evident collapse of the referral system at the SDH/SGH and DH institutions.Although all referral hospitals cater to sizeable volumes of inpatients, the proportion of inpatients comingin on referral to total inpatient admissions at Islampur SDH is much lower than the comparable WestBengal average for SD/SGH hospitals, while at Kaliaganj SGH and Raiganj DH, it exceeds the comparablestate averages. Thus in comparison to other equivalent hospital institutions in the state, more inpatients areadmitted at Islampur SDH on direct self-referral while fewer inpatients are admitted through the referralchain, indicating the weaknesses of the referral system as well as intrinsic deficiencies in the IPD facilitiesavailable at RH and BPHC level public hospitals in Islampur SD. At Kaliaganj SGH and Raiganj DH, theposition is precisely the opposite. The two referral hospitals thus cater to a much larger proportion ofinward referrals than other equivalent hospitals in the state, and are either unwilling (Kaliaganj) or unable(Raiganj) to handle patients coming in directly without passing through the referral chain. At KaliaganjSGH therefore, the emergency admission rate is much lower than the emergency admission rates at IslampurSDH and Raiganj DH which considerably surpass the equivalent state averages. Similarly, the emergencyoutpatient ratios fall below the state averages at Kaliaganj SGH, while surpassing them at Islampur SDHand Raiganj DH. At almost all public hospitals in Uttar Dinajpur except Dalua and Lodhan BPHCs, thefocus of inpatient admissions is visibly towards obstetric care, as a result of which the proportion ofdeliveries to inpatient admissions at these institutions exceed the comparable averages for the state.
MAP: OPD & IPD Flows within the Public Hospital System in Uttar Dinajpur
The associated regional maps summarise the pressures and performance attributes of the public healthcaresystem in the district. Regional OPD & IPD patient loads and regional IPD admission patterns in differentparts of Uttar Dinajpur are broadly similar, with Raiganj carrying the highest system loads in the district,followed by Kaliaganj and Karandighi on its peripheries. Itahar and Hemtabad do not have referral institutionsbeyond the block hospital level and hence feel less pressure on their healthcare facilities. In the rest of
Distribution of Patients300,000
General OutpatientsEmergency OutpatientsEmergency InpatientsOther Inpatients
Uttar Dinajpur 2006Patient Loads on Hospital System
305,000 to 306,000 (1)251,000 to 305,000 (1)144,000 to 251,000 (2)105,000 to 144,000 (2)56,000 to 105,000 (3)
Hospital Referral Patterns3,4001,700
340
Outward ReferralInward Referral
Uttar Dinajpur Hospitals 2006Total IPD Admissions
24,300 to 24,400 (1)11,200 to 24,300 (2)4,600 to 11,200 (2)2,300 to 4,600 (3)1,100 to 2,300 (1)
InpatientLoad Management Ratios
220
% Bed Turnover% Bed Occupancy
Uttar Dinajpur Hospitals 2006Emergency Admission Rates
105-106 % (1)69-105 % (3)
58-69 % (1)27-58 % (2)8-27 % (2)

Uttar Dinajpur
125
Islampur SD, the pressure from patient loads is overwhelmingly borne by Islampur SDH, since neitherChopra nor Goalpokhar-1 and Goalpokhar-2 have referral institutions other than the rural BPHCs. OPDpatients currently comprise a larger proportion of the patient loads within Raiganj SD, while their presenceis proportionately small in Islampur SD, particularly in the two Goalpokhar blocks. As seen earlier, thisdifference is caused by relative weaknesses in the communication links and SHC-PHC referral chains inthe Islampur SD blocks. High emergency outpatient ratios at Lodhan and Chakulia which surpass the stateaverages for BPHCs considerably also corroborate that a large proportion among the patients attending theOPD wings of Goalpokhar-1 and Goalpokhar-2 BPHCs represent emergency patients. However, withinpatient admissions being low in the other blocks, most of this pressure is borne through self-referrals atIslampur SDH. Although the OPD flows at public hospitals in the Raiganj SD blocks are better distributed,the bulk of the responsibility for inpatient care has to be carried by Raiganj DH.
Only four public hospital institutions in Uttar Dinajpur receive inward referrals, among which KarandighiRH receives a relatively minor share. While Kaliaganj SGH is able to absorb some of the referrals, themajor portion of the referrals are handled at Raiganj DH. Without an intermediating institution in itsvicinity, Islampur SDH on the other hand has to refer out almost as many cases as are referred in. Themajor portion of the outward referrals originate in Islampur SD, with Chopra, Islampur and Karandighicontributing the main share. Since relatively few patients attending the BPHCs at Goalpokhar-1, Goalpokhar-2, Hemtabad and Itahar are formally referred out. A large proportion of the IPD patients attending IslampurSDH, Kaliaganj SGH and Raiganj DH are self-referred. Emergency admission rates are highest at Chopra,followed by Raiganj, Hemtabad and Islampur. However, while Islampur SDH and Raiganj DH cope withthese additional pressures through multiple occupancy, raising both BTRs and BORs, the other publichospital institutions in the district that face this pressure cope by increasing short discharge rates, raisingBTRs while lowering BORs and ALOS rates. Chopra presents an extreme example, with very high BTR anda relatively modest BOR. Chakulia BPHC in Goalpokhar-2 block faces the lowest inpatient pressure and isable to handle this at relatively moderate BTR and BOR rates.
Staffing Constraints & Health Service Delivery
Persisting staffing shortages, stretching all the way from the SHCs up to Raiganj DH, are another importantreason for the relatively weak state of health service delivery in Uttar Dinajpur. Against 344 sanctionedposts of ANMs/female health assistants at the SHCs, 26 positions (7.5%) are currently vacant. Staff shortagereaches critical levels in case of the 304 sanctioned posts of male health assistants at the SHCs, with only90 incumbents in position and vacancies in as many as 214 (70.4%) posts. Under the current staffingpatterns where the auxiliary male and female health staff at the SHCs are assigned largely complementaryfunctions, the absence of 26 female health staff would bring immunisation, MCH and attended deliveryservices at least 26 SHCs to a virtual standstill, adversely affecting a rural population of over 1.75 lakh.Similarly, with more than two-thirds of the SHCs in Uttar Dinajpur having to depend on the services of asingle female staff member because of high vacancy rates among male staff, the performance of a host ofauxiliary community health activities including school health programmes, environmental sanitation andwater quality monitoring, as well as the reliability of the recording of vital events, malaria & TB screeningprocedures, disease surveillance as well epidemic control would be severely compromised in most ruralareas of the district.
The critical link between the PHCs and SHCs in the delivery of rural healthcare depends on the supervisorycadre of Lady Health Visitors [LHVs] and male health supervisors (designated usually as senior healthassistants in states outside West Bengal), who are expected to visit the SHCs under their supervision on aregular basis to monitor and assist the performance of all assigned public health activities, including RCH
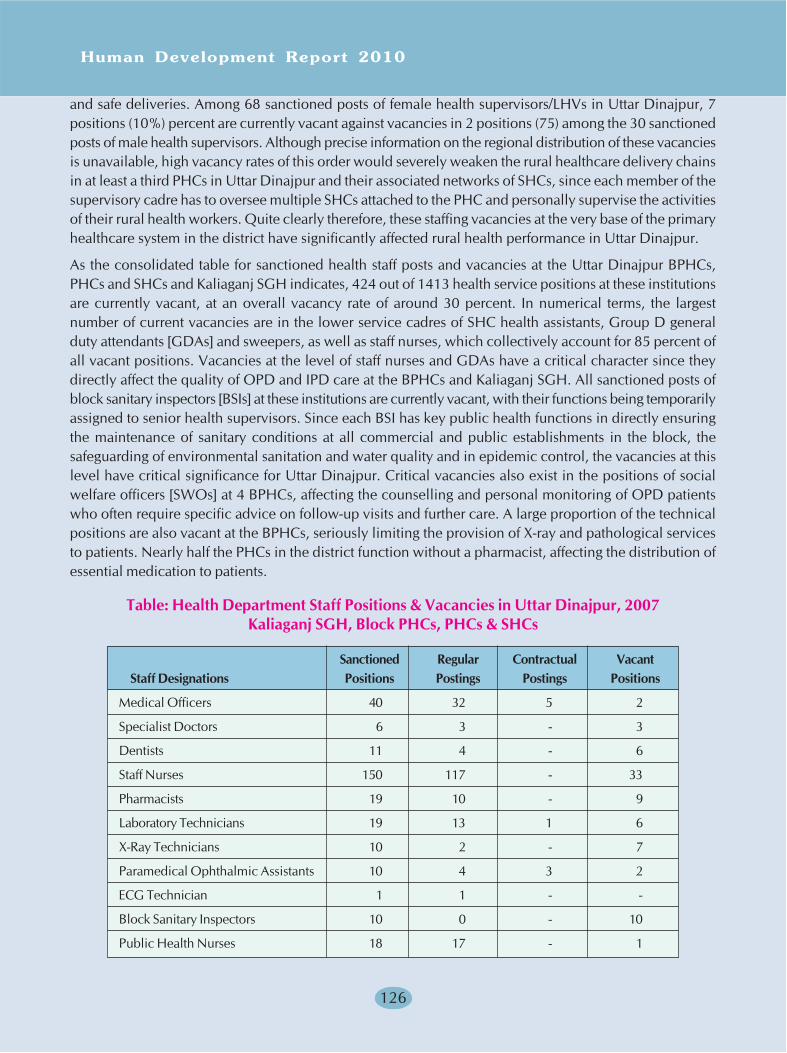
Human Development Report 2010
126
and safe deliveries. Among 68 sanctioned posts of female health supervisors/LHVs in Uttar Dinajpur, 7positions (10%) percent are currently vacant against vacancies in 2 positions (75) among the 30 sanctionedposts of male health supervisors. Although precise information on the regional distribution of these vacanciesis unavailable, high vacancy rates of this order would severely weaken the rural healthcare delivery chainsin at least a third PHCs in Uttar Dinajpur and their associated networks of SHCs, since each member of thesupervisory cadre has to oversee multiple SHCs attached to the PHC and personally supervise the activitiesof their rural health workers. Quite clearly therefore, these staffing vacancies at the very base of the primaryhealthcare system in the district have significantly affected rural health performance in Uttar Dinajpur.
As the consolidated table for sanctioned health staff posts and vacancies at the Uttar Dinajpur BPHCs,PHCs and SHCs and Kaliaganj SGH indicates, 424 out of 1413 health service positions at these institutionsare currently vacant, at an overall vacancy rate of around 30 percent. In numerical terms, the largestnumber of current vacancies are in the lower service cadres of SHC health assistants, Group D generalduty attendants [GDAs] and sweepers, as well as staff nurses, which collectively account for 85 percent ofall vacant positions. Vacancies at the level of staff nurses and GDAs have a critical character since theydirectly affect the quality of OPD and IPD care at the BPHCs and Kaliaganj SGH. All sanctioned posts ofblock sanitary inspectors [BSIs] at these institutions are currently vacant, with their functions being temporarilyassigned to senior health supervisors. Since each BSI has key public health functions in directly ensuringthe maintenance of sanitary conditions at all commercial and public establishments in the block, thesafeguarding of environmental sanitation and water quality and in epidemic control, the vacancies at thislevel have critical significance for Uttar Dinajpur. Critical vacancies also exist in the positions of socialwelfare officers [SWOs] at 4 BPHCs, affecting the counselling and personal monitoring of OPD patientswho often require specific advice on follow-up visits and further care. A large proportion of the technicalpositions are also vacant at the BPHCs, seriously limiting the provision of X-ray and pathological servicesto patients. Nearly half the PHCs in the district function without a pharmacist, affecting the distribution ofessential medication to patients.
Table: Health Department Staff Positions & Vacancies in Uttar Dinajpur, 2007Kaliaganj SGH, Block PHCs, PHCs & SHCs
Sanctioned Regular Contractual VacantStaff Designations Positions Postings Postings Positions
Medical Officers 40 32 5 2
Specialist Doctors 6 3 - 3
Dentists 11 4 - 6
Staff Nurses 150 117 - 33
Pharmacists 19 10 - 9
Laboratory Technicians 19 13 1 6
X-Ray Technicians 10 2 - 7
Paramedical Ophthalmic Assistants 10 4 3 2
ECG Technician 1 1 - -
Block Sanitary Inspectors 10 0 - 10
Public Health Nurses 18 17 - 1
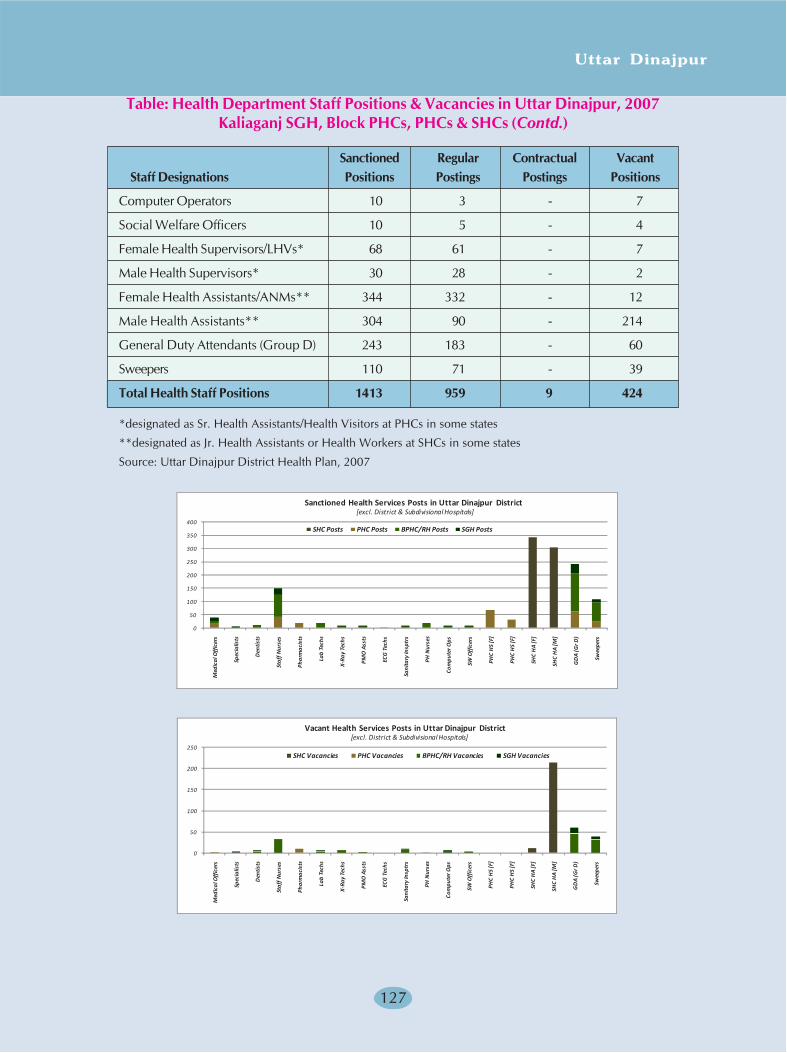
Uttar Dinajpur
127
Computer Operators 10 3 - 7
Social Welfare Officers 10 5 - 4
Female Health Supervisors/LHVs* 68 61 - 7
Male Health Supervisors* 30 28 - 2
Female Health Assistants/ANMs** 344 332 - 12
Male Health Assistants** 304 90 - 214
General Duty Attendants (Group D) 243 183 - 60
Sweepers 110 71 - 39
Total Health Staff Positions 1413 959 9 424
*designated as Sr. Health Assistants/Health Visitors at PHCs in some states
**designated as Jr. Health Assistants or Health Workers at SHCs in some states
Source: Uttar Dinajpur District Health Plan, 2007
Table: Health Department Staff Positions & Vacancies in Uttar Dinajpur, 2007Kaliaganj SGH, Block PHCs, PHCs & SHCs (Contd.)
Sanctioned Regular Contractual VacantStaff Designations Positions Postings Postings Positions
0
50
100
150
200
250
300
350
400
Med
ical
Off
icer
s
Spec
ialis
ts
Den
tists
Staf
f Nur
ses
Phar
mac
ists
Lab
Tech
s
X-Ra
y Te
chs
PMO
Ass
ts
ECG
Tec
hs
Sani
tary
Insp
trs
PH N
urse
s
Com
pute
r Ops
SW O
ffic
ers
PHC
HS
[F]
PHC
HS
[F]
SHC
HA
[F]
SHC
HA
[M]
GD
A (G
r D)
Swee
pers
SHC Posts PHC Posts BPHC/RH Posts SGH Posts
Sanctioned Health Services Posts in Uttar Dinajpur District[excl. District & Subdivisional Hospitals]
0
50
100
150
200
250
Med
ical
Off
icer
s
Spec
ialis
ts
Den
tists
Staf
f Nur
ses
Phar
mac
ists
Lab
Tech
s
X-Ra
y Te
chs
PMO
Ass
ts
ECG
Tec
hs
Sani
tary
Insp
trs
PH N
urse
s
Com
pute
r Ops
SW O
ffic
ers
PHC
HS
[F]
PHC
HS
[F]
SHC
HA
[F]
SHC
HA
[M]
GD
A (G
r D)
Swee
pers
SHC Vacancies PHC Vacancies BPHC/RH Vacancies SGH Vacancies
Vacant Health Services Posts in Uttar Dinajpur District[excl. District & Subdivisional Hospitals]
Human Development Report 2010
128
While critical vacancies in the positions of dentists and paramedical ophthalmic assistants [PMOAs] denyessential dental and ophthalmic care to the patients of at least 5 affected BPHCs, persisting vacancies in thepositions of medical officers and specialist doctors have the most disturbing implications for the statehealthcare system in Uttar Dinajpur, since the delivery of most essential public healthcare and clinicalservices become infructuous without the essential presence of qualified doctors. Of the 19 PHCs, 7 do nothave permanently appointed MOs. In five of these, the vacancies in this position have been filled oncontract. However, in another two PHCs and their associated SHC networks, the entire chain of clinicaland referral services would fall apart because of these critical vacancies.
Under the present system in West Bengal, no paediatricians, gynaecologists or anaesthetists are beingposted at the BPHCs till these are upgraded into RH hospitals with at least 30 beds. Unlike most otherWest Bengal districts, Uttar Dinajpur, Dakshin Dinajpur and Coochbehar still have only one hospital eachin this category. While Dakshin Dinajpur has a large DH hospital and Coochbehar in addition has severalSDH hospitals, all patients requiring attention from specialist doctors have to depend on the single RH andthree referral hospitals. Among the latter hospitals, Kaliaganj SGH has no resident surgeon, physician orpaediatrician, since these three sanctioned posts are vacant. Thus all SGH patients requiring surgery orspecialised paediatric care have to be referred up to Raiganj DH, and the posting of an anaesthetist at theSGH also becomes infructuous.
BOX TEXT
THE VANISHING CADRE OF MALE RURAL HEALTH WORKERS
The problem of male health staff vacancies at the SHCs has been encountered so frequently in statesacross India, where the posts usually carry the equivalent designation of multipurpose health workers[MPHWs], that the service has been called a dying cadre. In the other states however, the crisis has notyet reached the same dimensions as in Uttar Dinajpur where over 70 percent of the 304 existing postsare now vacant, turning a corresponding number of SHCs from double-staffed rural health institutions asthey were originally intended, into understaffed institutions where a single staff member is expected tocarry the workload originally intended for two persons.
The genesis of the problem begins with the decision in 1966 to bifurcate the activities of the UnionMinistry of Health into two departments to deal separately with Health and Family Welfare (formerlyFamily Planning) issues, coinciding with the inception of the externally funded Postpartum Family Planning[PP-FP] programme. Till then, male health staff had been inducted regularly into the State Health servicesto meet staffing needs during the vertical disease eradication campaigns against malaria, tuberculosisand smallpox that had been at the core of the public health effort after Independence. While the PP-FPprogramme gave new emphasis to population issues in India, it gradually shifted the focus of nationalhealth policy from the provision of efficient public healthcare towards the promotion of MCH basedactivities. After the Population Council of India had been established in 1970, the male rural healthworkers who had been holding specialised designations in the vertical programmes were redesignatedunder the new auxiliary cadre of MPHWs in 1973, when rural SHCs were first launched at therecommendations from the Kartar Singh Committee.
After the disastrous experience of compulsory FP between 1975-76, Population Control and FamilyPlanning were brought into the Concurrent List in 1977 under the changed nomenclature of FamilyWelfare. This allowed external donor funding to be channeled exclusively into the extension of MCHservices through Centrally sponsored schemes [CSS], while public healthcare remained primarily in the

Uttar Dinajpur
129
domain of the State Health services, along with the fiscal responsibility for funding and staffing publichealth institutions. At the rural SHCs, activities of female health workers/ANMs and health supervisors/LHVs were refocused on RCH which moved rapidly to centre-stage, while the role of the male SHChealth workers remained unspecified and ill defined with the downgrading of other health activities.Gradually, vacancies began to appear in the male MHPW cadre, which remained unfilled for longlengths of time. With the wilting of public expenditure on health and the fiscal crisis of the states throughthe 1990s, the problem expanded until, coinciding with the new National Health Policy [NHP] of 2002,the Department of Family Welfare [DoFW] began to provide 100% Central assistance towards the salariesof ANMs and LHVs, while the liability, the salaries of male health workers remained the responsibilityof the State Health services. As part of the donor consortium supported sector-wide approach [SWAp],a tradeoff was made through which the 39,554 SHCs established by the State Governments were takenover by DoFW, against the liabilities of 5434 rural FW centres, which would subsequently be borne bythe State Governments.
These sequential developments had the perhaps unintended impact of focusing the delivery of publichealthcare in rural India around a relatively narrow spectrum of RCH activities. Naturally, MHPWswere not appointed, nor was their absence felt. However, as widely seen through Uttar Dinajpur, thecost has been the inadequate development of primary and referral healthcare infrastructure so that thebasic public healthcare services needed to support RCH and other health attainment targets are nolonger accessible to vast sections among the rural population. Meanwhile, the return of killer diseaseslike drug-resistant malaria, tuberculosis and dengue establishes that the high levels of understaffing inthe male MHPW cadre extract a huge cost in terms of decreased environmental sanitation and decreaseddisease surveillance. Public healthcare and RCH are not substitutes, but have to be delivered in closecoordination from under the same umbrella.
While detailed staffing data for Islampur SDH and Raiganj DH are not available for the same year, it isfairly evident that the mounting IPD pressures and the rapidly deteriorating BTRs, BORs and otherperformance parameters at these better-equipped referral hospitals are the product of these infrastructuraland staffing deficiencies at other public healthcare institutions in Uttar Dinajpur. The human cost to thedistrict in terms of deteriorating public health safeguards, increasing burden of disease, decreased healthsurveillance and escalating epidemic risks thus becomes a crucial are of concern. No improvement in thehealth situation in Uttar Dinajpur can be obtained if the delivery and quality of public healthcare andclinical services does not improve commensurately, so that equal health access is assured to all people andall regions. NRHM has thus opened an important window, through which the district can identify itscritical needs once and for all, and remove the infrastructural and staffing deficits that have chiselled awaythe foundations of equity in public health-care.
A beginning has already been made, with the establishment of a large number of new AWCs and SHCs.However, the present scheme of Central assistance from DoFW does not underwrite the salary cost ofmale SHC workers and limits the assistance towards establishment costs to an annual rental value ofRs.3000 for SHC premises. For the SHCs to become fully functional units within an efficient public healthcaresystem, each SHC has to be viable from the start and must be provided the physical establishment and staffto deliver a gamut of clinical, preventive and MCH services according to NRHM norms. Hence the extensionof donor assistance does not create room for further withdrawal of the state from the provision of publichealth-care.
Human Development Report 2010
130
BOX TEXT
RAIGANJ DISTRICT HOSPITAL
When Uttar Dinajpur was reconstituted into a separate district in 1992, the major district level officesand facilities serving erstwhile West Dinajpur that were located in the former headquarter sub-divisionof Balurghat were inherited by the successor district of Dakshin Dinajpur. This included the 300-beddedBalurghat DH which had formerly provided secondary referral facilities for the undivided district. Thenew departmental infrastructure for the Uttar Dinajpur district headquarters had to be recreated anewby upgrading the subdivisional facilities that had previously served Raiganj SD. Because of the hugecapital investments involved in upgrading the existing infrastructure to the desired level, the process isstill incomplete 17 years later. Raiganj DH was designated as the new District Hospital for the reconstitutedUttar Dinajpur district in 1997, but still functions for all practical purposes at the level of a State GeneralHospital in terms of its current bed and staff capacity, technical equipment and building facilities. Itofficially has the status of a project hospital since new construction is in progress, and will remain in thetransitional state between an SGH and a full-fledged District Hospital until all hospital construction iscomplete and the requisite technical infrastructure is in place. Dakshin Dinajpur is in a much morefavourable position with a full-fledged Grade II DH facility, serving a much smaller district population of15.04 lakh (Census 2001).
In accordance with current MoHFW norms for Grade II District Hospitals, a district with a populationof 10 lakh would need a central public hospital with around 300 beds, at annual admission rates of 1indoor patient per 50 persons and an average length of stay of 5 days. At such rates, the district wouldneed to provide annually for 20,000 patient admissions, requiring 1 lakh bed days spread over thecourse of the year. Between 85-95 percent of these bed days would have to provided by the central DH.With desirable bed occupancy rate at 80 percent, the district would thus need between 270-302 beds.Thus in pro rata terms, Uttar Dinajpur with a 2001 population of 24.42 lakh needed to provide bedfacilities for 0.49 lakh indoor patients annually or 2.44 lakh bed days overall. At 80 percent bed occupancy,this would have required a total of 1029 hospital beds, with the share to be provided at DH facilitiesranging between 874-977 beds. Obviously, since this need could not have been met even at 100 percentbed occupancy by a Grade II hospital, the minimum bed capacity to serve the needs of the 2001 UttarDinajpur population at higher bed occupancy rates exceeding 80 percent required at least two DHfacilities at Grade I (500 beds) and Grade II (300 beds) levels.
Raiganj DH, in contrast, is still a 168-bedded referral hospital with staffing and equipment facilities thatfall well short of Indian Public Health Standards [IPHS] for a full-fledged District Hospital (see Appendix).The OPD Department of the hospital, which is relatively new and in comparatively better physicalcondition, comprises general medicine, surgery, gynaecology & obstetrics, paediatric, ophthalmologyand dental wings which are open for consultation every day of the week, and psychiatry, dermatology &STI, ENT and orthopaedic wings which open on selected days of the week. Daily footfall at the OPDwings in 2006 averaged around 600 per day, compared the OPD footfall of around 430 per day atIslampur SDH and under 400 per day at Kaliaganj SGH. The IPD Department at Raiganj DH comprises24-hour emergency services, surgery, maternity and paediatric, along with support facilities includingpathology, radiology as well as the blood bank. The single major OT theatre looks after the commonsurgical needs of general surgery, obstetrics & gynaecology, ENT, ophthalmology and dental surgery.Since there is no minor OT for orthopaedic plaster setting, this has to be carried out in a passage in front
Uttar Dinajpur
131
of the OT for the A kitchen attached to the IPD looks after patient diets. The separate leprosy surveillanceunit is the oldest healthcare facility at the hospital, dating back to 1926, while the DTC centre overseesactivities under the Revised National Tuberculosis Control Programme [RNTCP].
General ward facilities at the IPD section of Raiganj DH include a male ward with 47 beds and a femaleward with 28 beds. Since the main section of the male ward has room for only 23 beds, 13 additionalbeds are accommodated in the verandah of the ward and another 9 in the annexe, besides which thereis also provision for two paid beds. The female ward has a capacity of 26 general beds as well as twopaid beds. The largest number of IPD beds in both male and female wards are attached to generalmedicine and surgery. In addition, there are beds assigned specifically to ENT and ophthalmology. Thematernity ward at the hospital accommodates 42 beds. In 2006, Raiganj DH performed an average ofaround 13 deliveries a day and 7 major surgeries per day, which gives an idea of the pressure thatcurrently falls on these existing facilities. During the seasonal peak in deliveries in the autumn months,the additional patients have to be accommodated on the ward floors. The paediatric ward of the hospital,which admits children under age 12, has only 11 beds. Hence sharing of beds and ward floors is arelatively common sight, especially during seasonal peaks when the ward often has to admit over 25patients.
Although in nominal terms, Raiganj DH has the cumulative staff strength recommended under IPHS for100-200 bedded district hospitals, there is an excess of Group D GDAs and menial positions andcritical shortages at technical and paramedical levels. Although the number of nursing positions apparentlyexceeds the sanctioned nursing strength, it is well within IPHS norms and is justified further by theexcessive OPD and IPD loads at the hospital, and by the BTR and BOR which are now around 131percent and 126 percent at Raiganj DH, against the respective West Bengal Health Department normsof 72-96 percent for bed turnover and 75-100 percent for bed occupancy. The ubiquitous GDAs andstaff nurses fill in for many infrastructural and personnel gaps and keep the hospital running in the faceof almost insurmountable system pressure.
Rationalisation of system loads in Uttar Dinajpur also requires the planned upgradation of several SHCsinto PHCs, besides the strengthening of PHCs and BPHCs for the delivery of clinical services and referralhealthcare. A beginning has again been made through the proposed establishment of new PHCs atKalanaginhat under Panditpota-2 GP in Islampur block, and at Sahapurhat under Sahapur-1 GP inGoalpokhar-1 block. Similarly, with critical support from NABARD, the upgradation of Ramganj PHC inIslampur block and Rampur PHC in Raiganj block into BPHCs is already underway, which is expected toaugment IPD bed availability in Uttar Dinajpur by 60 additional beds, while also reducing some of theexisting system load on Islampur SDH and Raiganj DH. Upgradation of the existing PHCs at Daspara(Chopra), Goagaon (Goalpokhar-1), Kanki (Goalpokhar-2) and Rasakhawa (Karandighi) into BPHCs hasalso been proposed under the first phase of the West Bengal Health Systems Development Initiative [HSDI].As all these are located in Islampur SD, the prioritisation of these PHCs for upgradation will improve theprovision of referral healthcare in the subdivision substantially. The five existing BPHCs at Dalua, Lodhan,Chakulia, Hemtabad and Itahar are currently at various stages of conversion into RH level hospitals, drawingupon funding support from the Rural Infrastructure Development Fund [RIDF] and HSDI. Upgradation ofSujali PHC (Islampur block) and Bangalbari PHC (Hemtabad block) has been proposed for the secondphase of HSDI. When all these upgradations are accomplished, referral healthcare in the district is expectedto improve, stretching a safety net beneath the growing healthcare needs of the rural population.
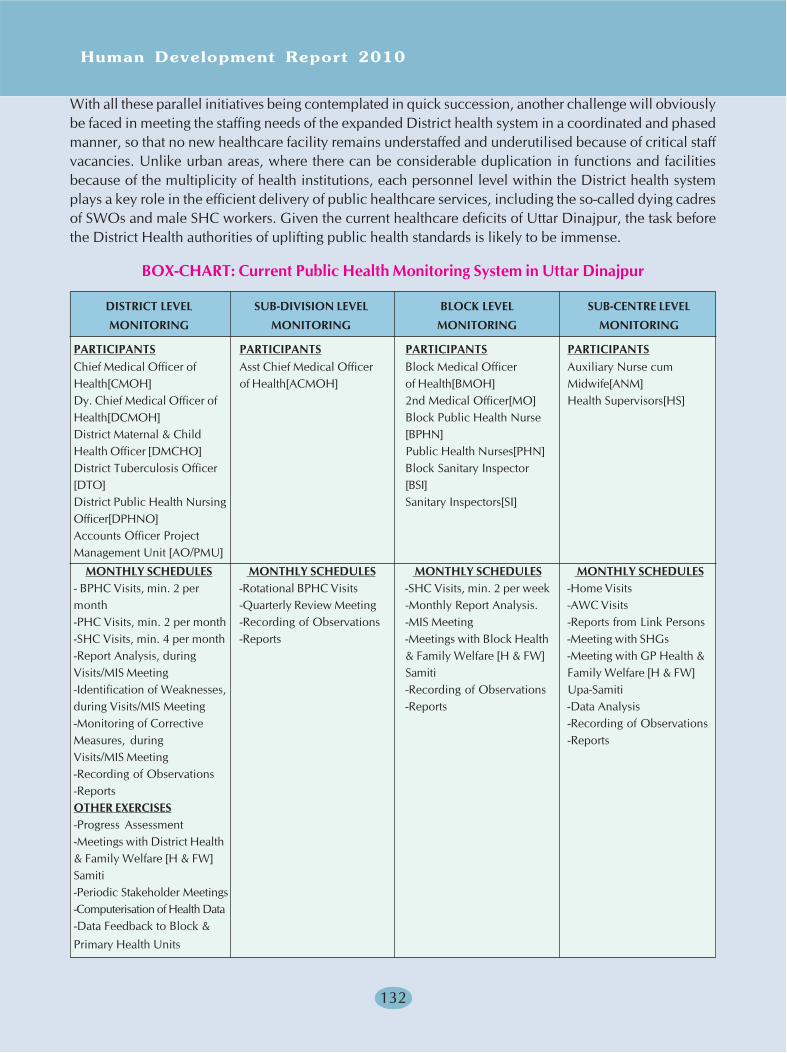
Human Development Report 2010
132
With all these parallel initiatives being contemplated in quick succession, another challenge will obviouslybe faced in meeting the staffing needs of the expanded District health system in a coordinated and phasedmanner, so that no new healthcare facility remains understaffed and underutilised because of critical staffvacancies. Unlike urban areas, where there can be considerable duplication in functions and facilitiesbecause of the multiplicity of health institutions, each personnel level within the District health systemplays a key role in the efficient delivery of public healthcare services, including the so-called dying cadresof SWOs and male SHC workers. Given the current healthcare deficits of Uttar Dinajpur, the task beforethe District Health authorities of uplifting public health standards is likely to be immense.
BOX-CHART: Current Public Health Monitoring System in Uttar Dinajpur
DISTRICT LEVEL SUB-DIVISION LEVEL BLOCK LEVEL SUB-CENTRE LEVEL
MONITORING MONITORING MONITORING MONITORING
PARTICIPANTS PARTICIPANTS PARTICIPANTS PARTICIPANTSChief Medical Officer of Asst Chief Medical Officer Block Medical Officer Auxiliary Nurse cumHealth[CMOH] of Health[ACMOH] of Health[BMOH] Midwife[ANM]Dy. Chief Medical Officer of 2nd Medical Officer[MO] Health Supervisors[HS]Health[DCMOH] Block Public Health NurseDistrict Maternal & Child [BPHN]Health Officer [DMCHO] Public Health Nurses[PHN]District Tuberculosis Officer Block Sanitary Inspector[DTO] [BSI]District Public Health Nursing Sanitary Inspectors[SI]Officer[DPHNO]Accounts Officer ProjectManagement Unit [AO/PMU]
MONTHLY SCHEDULES MONTHLY SCHEDULES MONTHLY SCHEDULES MONTHLY SCHEDULES- BPHC Visits, min. 2 per -Rotational BPHC Visits -SHC Visits, min. 2 per week -Home Visitsmonth -Quarterly Review Meeting -Monthly Report Analysis. -AWC Visits-PHC Visits, min. 2 per month -Recording of Observations -MIS Meeting -Reports from Link Persons-SHC Visits, min. 4 per month -Reports -Meetings with Block Health -Meeting with SHGs-Report Analysis, during & Family Welfare [H & FW] -Meeting with GP Health &Visits/MIS Meeting Samiti Family Welfare [H & FW]-Identification of Weaknesses, -Recording of Observations Upa-Samitiduring Visits/MIS Meeting -Reports -Data Analysis-Monitoring of Corrective -Recording of ObservationsMeasures, during -ReportsVisits/MIS Meeting-Recording of Observations-ReportsOTHER EXERCISES-Progress Assessment-Meetings with District Health& Family Welfare [H & FW]Samiti-Periodic Stakeholder Meetings-Computerisation of Health Data-Data Feedback to Block &
Primary Health Units
Uttar Dinajpur
133
Community Involvement & Monitoring Mechanisms
A critical role is being assigned under NRHM to women Accredited Social Health Activists or ASHAworkers who are expected to create the vital link between the healthcare system and the rural community.Rather than being a new innovation, the ASHA concept follows from the earlier experiment with villagehealth guides [VHGs] under recommendations of the Shrivastav Committee in 1977 for creation of a teamof auxiliary and community health workers to support the extension of the rural healthcare system. Theearlier concept had also experimented with the idea of forming a volunteer workforce to expand the outreachof the system, without increasing its costs. Each ASHA volunteer would be appointed to the populationnorm of 1:1000, and is required to be a woman in the 25-45 age-group with at least an elementary educationwho is a primary resident of the village concerned. Along with the AWW (also a woman volunteer appointedon a 1:1000 population ratio), the ASHA worker would coordinate village community health needs withthe two ANMs who would be appointed at each SHC under NRHM, and would assist the Village HealthCommittee [VHC] in formulating a Village Health Plan. Besides these functions, she would also be expectedto serve as a community mobiliser and educator as well as a paramedical worker trained in dispensingbasic drugs, and would be accountable to the local panchayat.
At the recommended NRHM 1:1000 norm, Uttar Dinajpur will require over 26 thousand ASHA workerson the basis of the 2004 projected population. Another norm requires that each ASHA worker be imparted23 days of intensive training spread over five episodes during the first year of induction. The District RuralHealth Mission will thus need to arrange over 6000 training sessions with equivalent establishment, trainerand logistic costs, assuming that the ASHA workers can be trained in regional batches of 50. While theeffort and expenditure involved in getting the ASHA scheme off the ground is therefore likely to be immense,the results may be a little slow in coming. The ASHA scheme represents a process innovation, whoseresults also depend on simultaneous strengthening of the physical quality standards of the rural referralhealthcare system. A recent PACS-VHAI review of the impact of NRHM in 24 districts spread over eightIndian states found substantial training gaps and knowledge gaps still prevalent among ASHA workerswho were also unclear about their own roles. The lack of equivalent support structures for the ASHAscheme pins too much responsibility on the ASHA workers who are expected to function as principalchange agents. There is therefore an apprehension that the ASHA scheme may cause further shrinkage ofthe outreach-roles of the AWWs and ANMs, unless there is sufficient compulsion on the latter to work aspart of village health team.
An important innovation contemplated within NRHM involves community monitoring of healthcare qualityand service delivery, through newly-formed Rogi Kalyan Samitis [RKS] at the PHCs and hospital institutions,and through the Village Health Committees [VHCs] and PRIs at local government levels. Although RKSsamitis have recently been formed at all public healthcare institutions in Uttar Dinajpur ranging from thePHCs to Raiganj DH, their meetings are still irregular. As part of the NRHM effort to decentralise themanagement of primary healthcare, the VHCs are also expected to formulate village plans articulating thehealthcare needs felt by the community, for eventual consolidation under the District Health Plan. Noclear mechanisms have yet been designed for this important exercise, leading to administrative apathy aswell as PRI disinterest. The PACS-VHAI review study therefore found this aspect to be a particularly weaklink in the NRHM community management chain, since few PRI and VHC members had either theknowledge or the training to prioritise health issues. Until such problems are satisfactorily resolved, theDistrict Health Plans will continue to retain the design of Departmental plans, echoing the supply sidemuch more than the felt healthcare needs of the community. Besides the provision for community levelmonitoring of the District Health system, a system of multi level technical monitoring by the Departmental
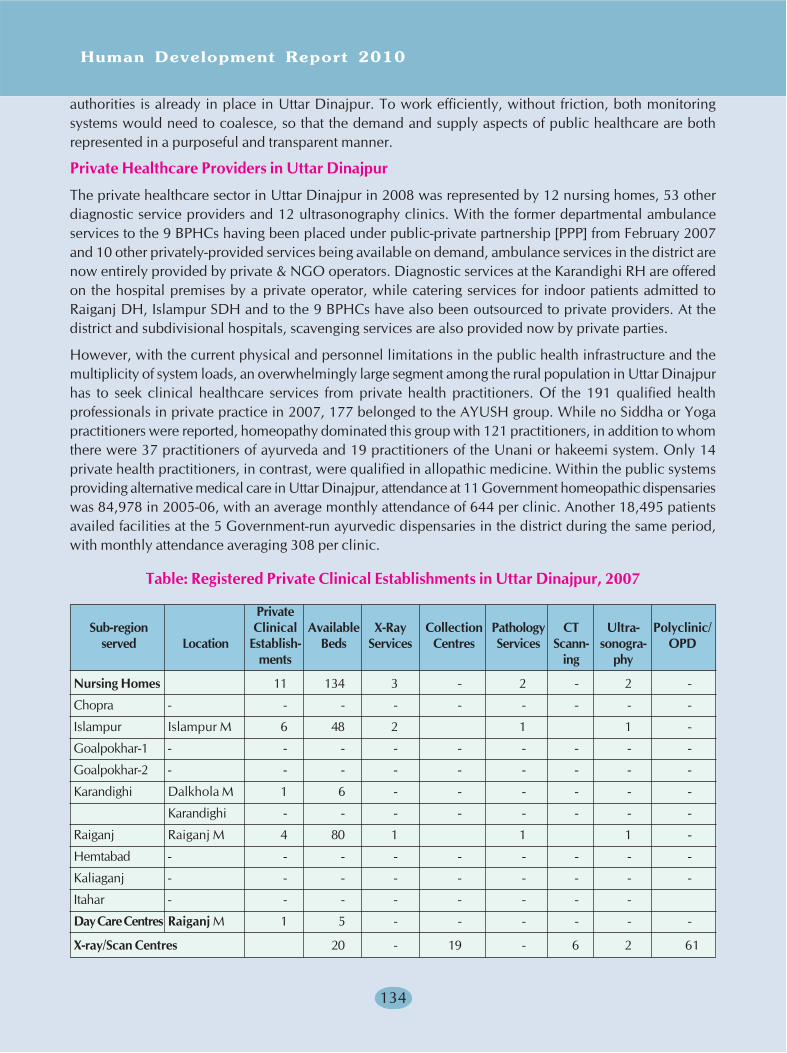
Human Development Report 2010
134
authorities is already in place in Uttar Dinajpur. To work efficiently, without friction, both monitoringsystems would need to coalesce, so that the demand and supply aspects of public healthcare are bothrepresented in a purposeful and transparent manner.
Private Healthcare Providers in Uttar Dinajpur
The private healthcare sector in Uttar Dinajpur in 2008 was represented by 12 nursing homes, 53 otherdiagnostic service providers and 12 ultrasonography clinics. With the former departmental ambulanceservices to the 9 BPHCs having been placed under public-private partnership [PPP] from February 2007and 10 other privately-provided services being available on demand, ambulance services in the district arenow entirely provided by private & NGO operators. Diagnostic services at the Karandighi RH are offeredon the hospital premises by a private operator, while catering services for indoor patients admitted toRaiganj DH, Islampur SDH and to the 9 BPHCs have also been outsourced to private providers. At thedistrict and subdivisional hospitals, scavenging services are also provided now by private parties.
However, with the current physical and personnel limitations in the public health infrastructure and themultiplicity of system loads, an overwhelmingly large segment among the rural population in Uttar Dinajpurhas to seek clinical healthcare services from private health practitioners. Of the 191 qualified healthprofessionals in private practice in 2007, 177 belonged to the AYUSH group. While no Siddha or Yogapractitioners were reported, homeopathy dominated this group with 121 practitioners, in addition to whomthere were 37 practitioners of ayurveda and 19 practitioners of the Unani or hakeemi system. Only 14private health practitioners, in contrast, were qualified in allopathic medicine. Within the public systemsproviding alternative medical care in Uttar Dinajpur, attendance at 11 Government homeopathic dispensarieswas 84,978 in 2005-06, with an average monthly attendance of 644 per clinic. Another 18,495 patientsavailed facilities at the 5 Government-run ayurvedic dispensaries in the district during the same period,with monthly attendance averaging 308 per clinic.
Table: Registered Private Clinical Establishments in Uttar Dinajpur, 2007
PrivateSub-region Clinical Available X-Ray Collection Pathology CT Ultra- Polyclinic/
served Location Establish- Beds Services Centres Services Scann- sonogra- OPDments ing phy
Nursing Homes 11 134 3 - 2 - 2 -
Chopra - - - - - - - - -
Islampur Islampur M 6 48 2 1 1 -
Goalpokhar-1 - - - - - - - - -
Goalpokhar-2 - - - - - - - - -
Karandighi Dalkhola M 1 6 - - - - - -
Karandighi - - - - - - - -
Raiganj Raiganj M 4 80 1 1 1 -
Hemtabad - - - - - - - - -
Kaliaganj - - - - - - - - -
Itahar - - - - - - - -
Day Care Centres Raiganj M 1 5 - - - - - -
X-ray/Scan Centres 20 - 19 - 6 2 61
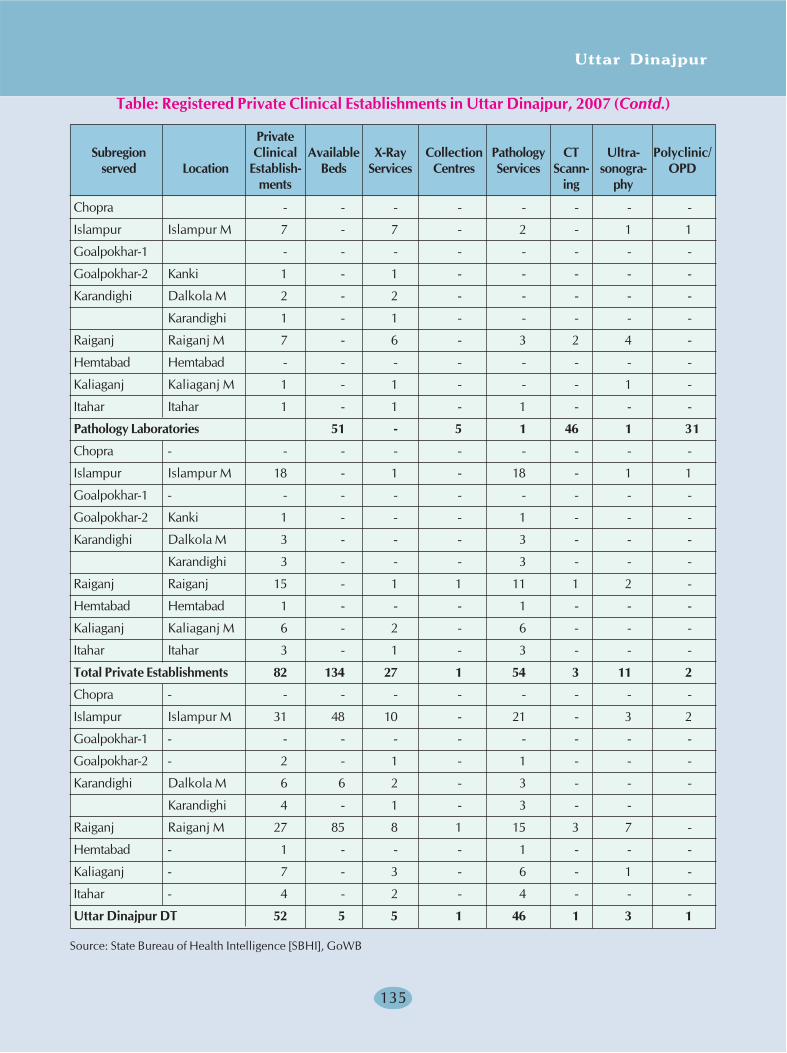
Uttar Dinajpur
135
Chopra - - - - - - - -
Islampur Islampur M 7 - 7 - 2 - 1 1
Goalpokhar-1 - - - - - - - -
Goalpokhar-2 Kanki 1 - 1 - - - - -
Karandighi Dalkola M 2 - 2 - - - - -
Karandighi 1 - 1 - - - - -
Raiganj Raiganj M 7 - 6 - 3 2 4 -
Hemtabad Hemtabad - - - - - - - -
Kaliaganj Kaliaganj M 1 - 1 - - - 1 -
Itahar Itahar 1 - 1 - 1 - - -
Pathology Laboratories 51 - 5 1 46 1 31
Chopra - - - - - - - - -
Islampur Islampur M 18 - 1 - 18 - 1 1
Goalpokhar-1 - - - - - - - - -
Goalpokhar-2 Kanki 1 - - - 1 - - -
Karandighi Dalkola M 3 - - - 3 - - -
Karandighi 3 - - - 3 - - -
Raiganj Raiganj 15 - 1 1 11 1 2 -
Hemtabad Hemtabad 1 - - - 1 - - -
Kaliaganj Kaliaganj M 6 - 2 - 6 - - -
Itahar Itahar 3 - 1 - 3 - - -
Total Private Establishments 82 134 27 1 54 3 11 2
Chopra - - - - - - - - -
Islampur Islampur M 31 48 10 - 21 - 3 2
Goalpokhar-1 - - - - - - - - -
Goalpokhar-2 - 2 - 1 - 1 - - -
Karandighi Dalkola M 6 6 2 - 3 - - -
Karandighi 4 - 1 - 3 - -
Raiganj Raiganj M 27 85 8 1 15 3 7 -
Hemtabad - 1 - - - 1 - - -
Kaliaganj - 7 - 3 - 6 - 1 -
Itahar - 4 - 2 - 4 - - -
Uttar Dinajpur DT 52 5 5 1 46 1 3 1
Source: State Bureau of Health Intelligence [SBHI], GoWB
Table: Registered Private Clinical Establishments in Uttar Dinajpur, 2007 (Contd.)
PrivateSubregion Clinical Available X-Ray Collection Pathology CT Ultra- Polyclinic/
served Location Establish- Beds Services Centres Services Scann- sonogra- OPDments ing phy
Human Development Report 2010
136
Yet even with such numbers, the combined strength of public and private allopathic doctors and AYUSHpractitioners would be far too low to meet the total healthcare demands of the district, if this critical ruralhealth gap was not filled by 3013 other RMP physicians. Sometimes called 'barefoot doctors', these arepersons who, on the basis of prior experience as pharmacists and compounders, etc. or certificatequalifications in alternate medicine, have qualified to practice as registered medical practitioners, but haveno formal qualifications in modern medicine. The highly disproportionate ratio between RMPs and formallyqualified physicians in the district is also a strong indicator of disparities in healthcare availability in theremote rural areas of Uttar Dinajpur, where few trained doctors are willing to serve.
Utilisation of Public & Private Healthcare
A project-study on the implementation of IEC strategy in Uttar Dinajpur undertaken in 2001 for theDepartment of Health & Family Welfare, Government of West Bengal, made a detailed examination of thecurrent patterns of utilisation of healthcare services at Raiganj District Hospital and the State GeneralHospital at Kaliaganj (Inspiration, 2001). While Kaliaganj SGH drew most of its patients from Kaliaganjblock and neighbouring Hemtabad, the patients visiting Raiganj DH were from Raiganj block and adjacentItahar and Hemtabad, as well as smaller numbers from Karandighi, Kaliaganj and the adjoining district ofDakshin Dinajpur. However, only a few patients were observed to come to the two hospitals through thereferral system, OPD services at the hospitals were dominated mainly by paediatric cases.
The 2001 Inspiration study also included a sample survey of healthcare utilisation patterns among 861rural residents drawn from 44 villages in 39 selected GPs, spread over the five blocks of Karandighi,Raiganj, Hemtabad, Kaliaganj and Itahar which form the principal catchment of Raiganj District Hospitaland Kaliaganj State General Hospital. The institutions providing public healthcare to these blocks in UttarDinajpur comprised Raiganj DH, Kaliaganj SGH, Karandighi RH and 5 BPHCs, as well as the PHC andSHC networks attached to the Block PHCs. As visible from the accompanying charts, the core publichealthcare services utilised by rural residents in Uttar Dinajpur are principally in the MCH group, comprisingcontraception, antenatal care, attended or institutionalised deliveries, MTP when required, and immunisationand child health services. These are generally accessed at all levels from the rural SHC to the Raiganj DH.While surgical contraception is mainly sought through rural referral units like the BPHCs, rural hospitalsand Kaliaganj SGH, antenatal care is sought at SHC and PHC level, and to an extent through the SGH. Therural referral units and FRUs also play the main part in fulfilling more specialised obstetric needs, and inattending to surgical cases and other patients with serious disease. Basic delivery services are availedmainly at the PHCs and SHCs, and orthopaedic services at the BPHCs, Kaliaganj SGH and Raiganj DH.When brought to public institutions, emergency snakebite cases are largely treated at the BPHCs. Basichealthcare needs in the common ailment group comprising ordinary fevers, diarrhoeal & dysenteric problemsand common skin infections are mainly met at the PHCs, RH and SGH, while a limited number of casesreach the DH and BPHCs. Thus while higher level public healthcare institutions attend to the bulk of thepatients requiring major treatment, most basic healthcare needs other then MCH are met at more medianlevels by the institutions ranging from the SGH to the PHCs. The role of MCH services in squeezing outother basic health services is strongest in case of the SHCs.
Private healthcare providers in the district comprise a mix of private nursing homes providing indoor andoutdoor services, RMP physicians and pharmacists, all of whom provide treatments based on the allopathicsystem, as well kabiraj physicians, homeopaths, and quack healers who provide other healing treatments.The quack healers provide a wide range of treatment extending from basic allopathic drugs tophysiotherapeutic and surgical manipulations, all without any formal training in any recognisable branchof medicine. Utilisation of private healthcare services available from these providers by rural residents
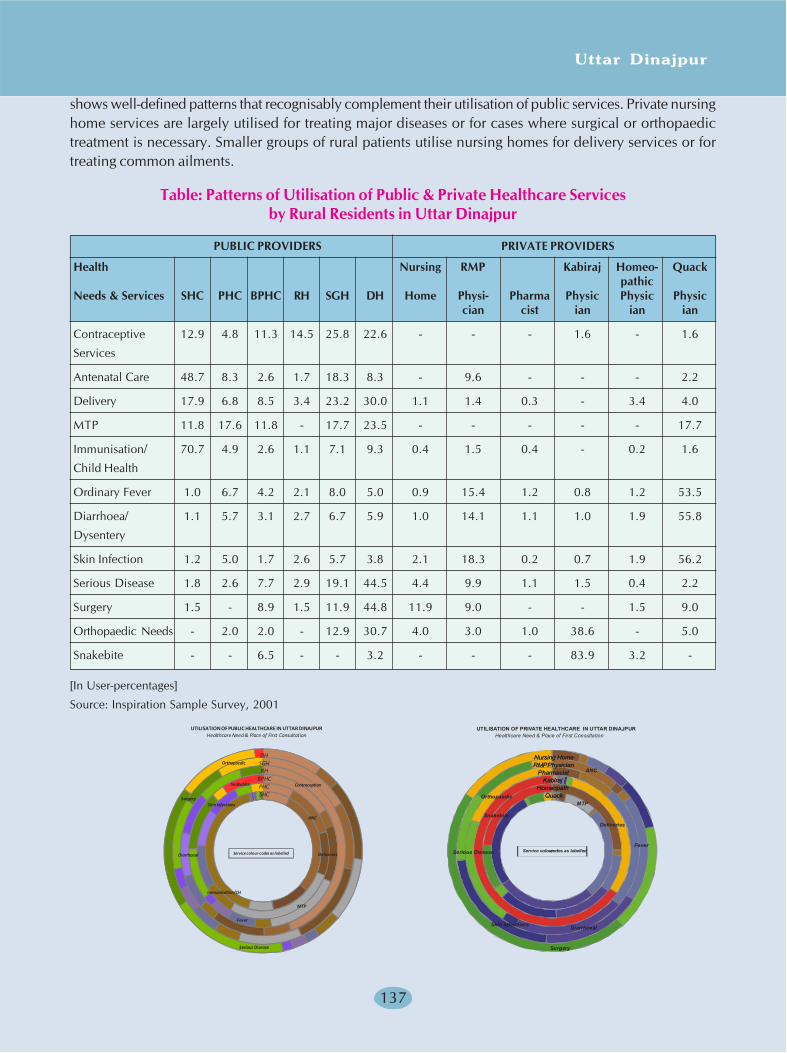
Uttar Dinajpur
137
shows well-defined patterns that recognisably complement their utilisation of public services. Private nursinghome services are largely utilised for treating major diseases or for cases where surgical or orthopaedictreatment is necessary. Smaller groups of rural patients utilise nursing homes for delivery services or fortreating common ailments.
Table: Patterns of Utilisation of Public & Private Healthcare Servicesby Rural Residents in Uttar Dinajpur
PUBLIC PROVIDERS PRIVATE PROVIDERS
Health Nursing RMP Kabiraj Homeo- Quackpathic
Needs & Services SHC PHC BPHC RH SGH DH Home Physi- Pharma Physic Physic Physiccian cist ian ian ian
Contraceptive 12.9 4.8 11.3 14.5 25.8 22.6 - - - 1.6 - 1.6
Services
Antenatal Care 48.7 8.3 2.6 1.7 18.3 8.3 - 9.6 - - - 2.2
Delivery 17.9 6.8 8.5 3.4 23.2 30.0 1.1 1.4 0.3 - 3.4 4.0
MTP 11.8 17.6 11.8 - 17.7 23.5 - - - - - 17.7
Immunisation/ 70.7 4.9 2.6 1.1 7.1 9.3 0.4 1.5 0.4 - 0.2 1.6
Child Health
Ordinary Fever 1.0 6.7 4.2 2.1 8.0 5.0 0.9 15.4 1.2 0.8 1.2 53.5
Diarrhoea/ 1.1 5.7 3.1 2.7 6.7 5.9 1.0 14.1 1.1 1.0 1.9 55.8
Dysentery
Skin Infection 1.2 5.0 1.7 2.6 5.7 3.8 2.1 18.3 0.2 0.7 1.9 56.2
Serious Disease 1.8 2.6 7.7 2.9 19.1 44.5 4.4 9.9 1.1 1.5 0.4 2.2
Surgery 1.5 - 8.9 1.5 11.9 44.8 11.9 9.0 - - 1.5 9.0
Orthopaedic Needs - 2.0 2.0 - 12.9 30.7 4.0 3.0 1.0 38.6 - 5.0
Snakebite - - 6.5 - - 3.2 - - - 83.9 3.2 -
[In User-percentages]
Source: Inspiration Sample Survey, 2001
Contraception
ANC
Deliveries
MTP
Immunisation/CH
Fever
Diarrhoeal
Skin Infections
Serious Disease
Surgery
Orthopaedic
Snakebite
UTILISATION OF PUBLIC HEALTHCARE IN UTTAR DINAJPUR Healthcare Need & Place of First Consultation
DHSGHRH
BPHCPHCSHC
Service colour-codes as labelled
ANC
Deliveries
MTP
Fever
DiarrhoealSkin Infections
Serious Disease
Surgery
Orthopaedic
Snakebite
UTILISATION OF PRIVATE HEALTHCARE IN UTTAR DINAJPURHealthcare Need & Place of First Consultation
Nursing HomeRMPPhysician
PharmacistKabiraj
HomeopathQuack
Nursing HomeRMPPhysician
PharmacistKabiraj
HomeopathQuack
Service colour-codes as labelled
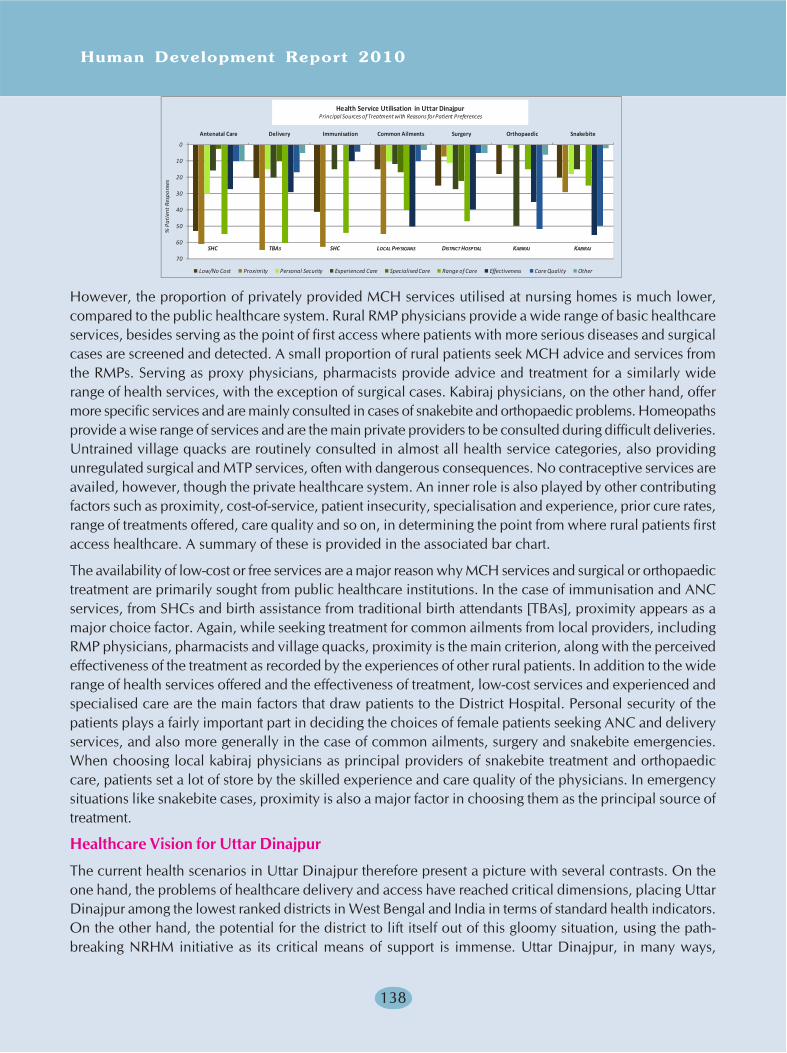
Human Development Report 2010
138
0
10
20
30
40
50
60
70
Antenatal Care Delivery Immunisation Common Ailments Surgery Orthopaedic Snakebite
Low/No Cost Proximity Personal Security Experienced Care Specialised Care Range of Care Effectiveness Care Quality Other
SHC TBAS SHC LOCAL PHYSICIANS DISTRICT HOSPTIAL KABIRAJ KABIRAJ
Health Service Utilisation in Uttar DinajpurPrincipal Sources of Treatment with Reasons for Patient Preferences
% P
ati
ent
Res
po
nses
However, the proportion of privately provided MCH services utilised at nursing homes is much lower,compared to the public healthcare system. Rural RMP physicians provide a wide range of basic healthcareservices, besides serving as the point of first access where patients with more serious diseases and surgicalcases are screened and detected. A small proportion of rural patients seek MCH advice and services fromthe RMPs. Serving as proxy physicians, pharmacists provide advice and treatment for a similarly widerange of health services, with the exception of surgical cases. Kabiraj physicians, on the other hand, offermore specific services and are mainly consulted in cases of snakebite and orthopaedic problems. Homeopathsprovide a wise range of services and are the main private providers to be consulted during difficult deliveries.Untrained village quacks are routinely consulted in almost all health service categories, also providingunregulated surgical and MTP services, often with dangerous consequences. No contraceptive services areavailed, however, though the private healthcare system. An inner role is also played by other contributingfactors such as proximity, cost-of-service, patient insecurity, specialisation and experience, prior cure rates,range of treatments offered, care quality and so on, in determining the point from where rural patients firstaccess healthcare. A summary of these is provided in the associated bar chart.
The availability of low-cost or free services are a major reason why MCH services and surgical or orthopaedictreatment are primarily sought from public healthcare institutions. In the case of immunisation and ANCservices, from SHCs and birth assistance from traditional birth attendants [TBAs], proximity appears as amajor choice factor. Again, while seeking treatment for common ailments from local providers, includingRMP physicians, pharmacists and village quacks, proximity is the main criterion, along with the perceivedeffectiveness of the treatment as recorded by the experiences of other rural patients. In addition to the widerange of health services offered and the effectiveness of treatment, low-cost services and experienced andspecialised care are the main factors that draw patients to the District Hospital. Personal security of thepatients plays a fairly important part in deciding the choices of female patients seeking ANC and deliveryservices, and also more generally in the case of common ailments, surgery and snakebite emergencies.When choosing local kabiraj physicians as principal providers of snakebite treatment and orthopaediccare, patients set a lot of store by the skilled experience and care quality of the physicians. In emergencysituations like snakebite cases, proximity is also a major factor in choosing them as the principal source oftreatment.
Healthcare Vision for Uttar Dinajpur
The current health scenarios in Uttar Dinajpur therefore present a picture with several contrasts. On theone hand, the problems of healthcare delivery and access have reached critical dimensions, placing UttarDinajpur among the lowest ranked districts in West Bengal and India in terms of standard health indicators.On the other hand, the potential for the district to lift itself out of this gloomy situation, using the path-breaking NRHM initiative as its critical means of support is immense. Uttar Dinajpur, in many ways,
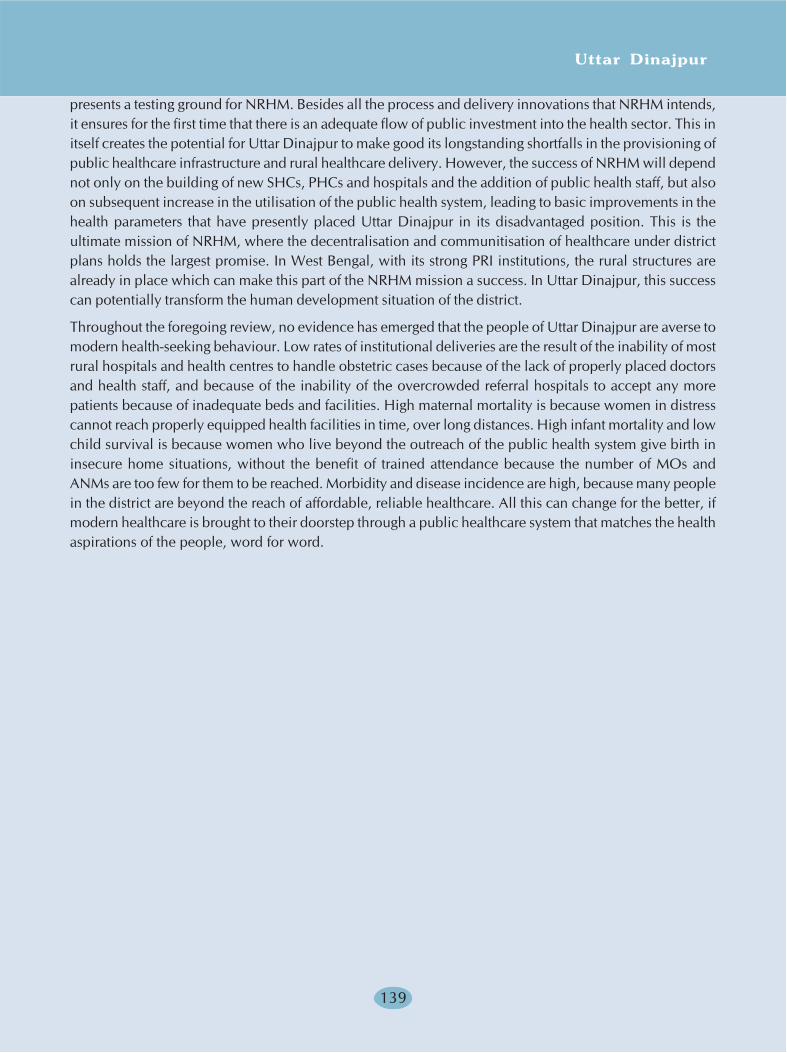
Uttar Dinajpur
139
presents a testing ground for NRHM. Besides all the process and delivery innovations that NRHM intends,it ensures for the first time that there is an adequate flow of public investment into the health sector. This initself creates the potential for Uttar Dinajpur to make good its longstanding shortfalls in the provisioning ofpublic healthcare infrastructure and rural healthcare delivery. However, the success of NRHM will dependnot only on the building of new SHCs, PHCs and hospitals and the addition of public health staff, but alsoon subsequent increase in the utilisation of the public health system, leading to basic improvements in thehealth parameters that have presently placed Uttar Dinajpur in its disadvantaged position. This is theultimate mission of NRHM, where the decentralisation and communitisation of healthcare under districtplans holds the largest promise. In West Bengal, with its strong PRI institutions, the rural structures arealready in place which can make this part of the NRHM mission a success. In Uttar Dinajpur, this successcan potentially transform the human development situation of the district.
Throughout the foregoing review, no evidence has emerged that the people of Uttar Dinajpur are averse tomodern health-seeking behaviour. Low rates of institutional deliveries are the result of the inability of mostrural hospitals and health centres to handle obstetric cases because of the lack of properly placed doctorsand health staff, and because of the inability of the overcrowded referral hospitals to accept any morepatients because of inadequate beds and facilities. High maternal mortality is because women in distresscannot reach properly equipped health facilities in time, over long distances. High infant mortality and lowchild survival is because women who live beyond the outreach of the public health system give birth ininsecure home situations, without the benefit of trained attendance because the number of MOs andANMs are too few for them to be reached. Morbidity and disease incidence are high, because many peoplein the district are beyond the reach of affordable, reliable healthcare. All this can change for the better, ifmodern healthcare is brought to their doorstep through a public healthcare system that matches the healthaspirations of the people, word for word.
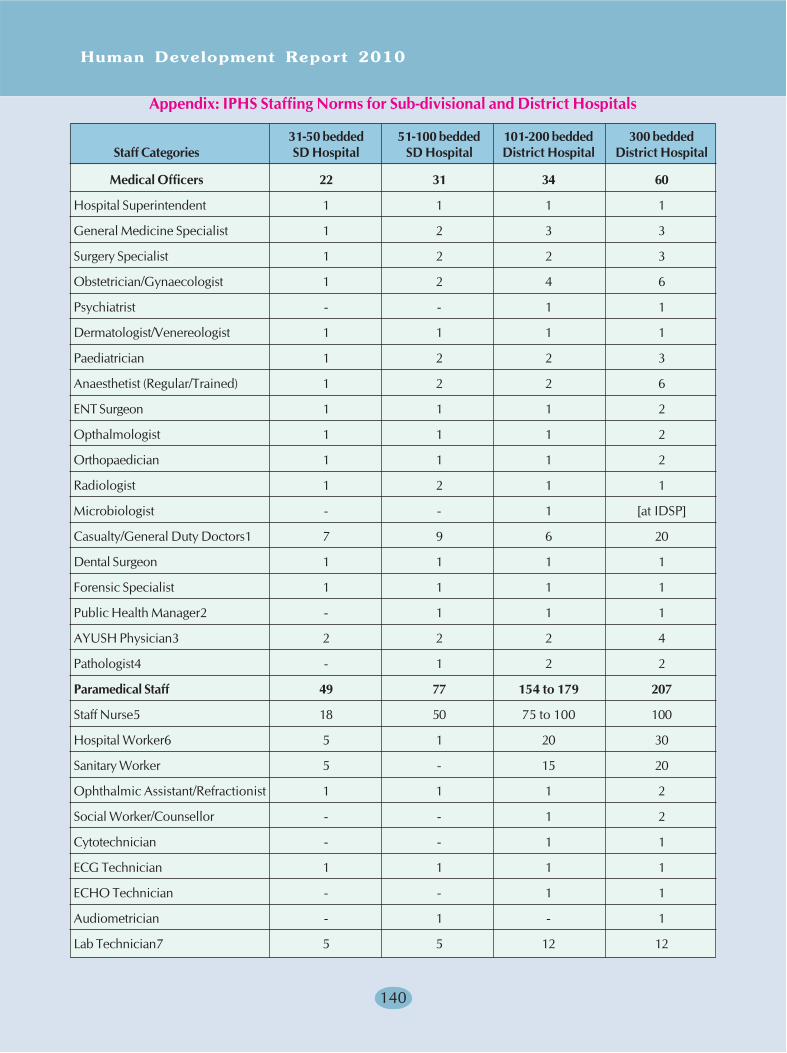
Human Development Report 2010
140
Medical Officers 22 31 34 60
Hospital Superintendent 1 1 1 1
General Medicine Specialist 1 2 3 3
Surgery Specialist 1 2 2 3
Obstetrician/Gynaecologist 1 2 4 6
Psychiatrist - - 1 1
Dermatologist/Venereologist 1 1 1 1
Paediatrician 1 2 2 3
Anaesthetist (Regular/Trained) 1 2 2 6
ENT Surgeon 1 1 1 2
Opthalmologist 1 1 1 2
Orthopaedician 1 1 1 2
Radiologist 1 2 1 1
Microbiologist - - 1 [at IDSP]
Casualty/General Duty Doctors1 7 9 6 20
Dental Surgeon 1 1 1 1
Forensic Specialist 1 1 1 1
Public Health Manager2 - 1 1 1
AYUSH Physician3 2 2 2 4
Pathologist4 - 1 2 2
Paramedical Staff 49 77 154 to 179 207
Staff Nurse5 18 50 75 to 100 100
Hospital Worker6 5 1 20 30
Sanitary Worker 5 - 15 20
Ophthalmic Assistant/Refractionist 1 1 1 2
Social Worker/Counsellor - - 1 2
Cytotechnician - - 1 1
ECG Technician 1 1 1 1
ECHO Technician - - 1 1
Audiometrician - 1 - 1
Lab Technician7 5 5 12 12
Appendix: IPHS Staffing Norms for Sub-divisional and District Hospitals
31-50 bedded 51-100 bedded 101-200 bedded 300 beddedStaff Categories SD Hospital SD Hospital District Hospital District Hospital
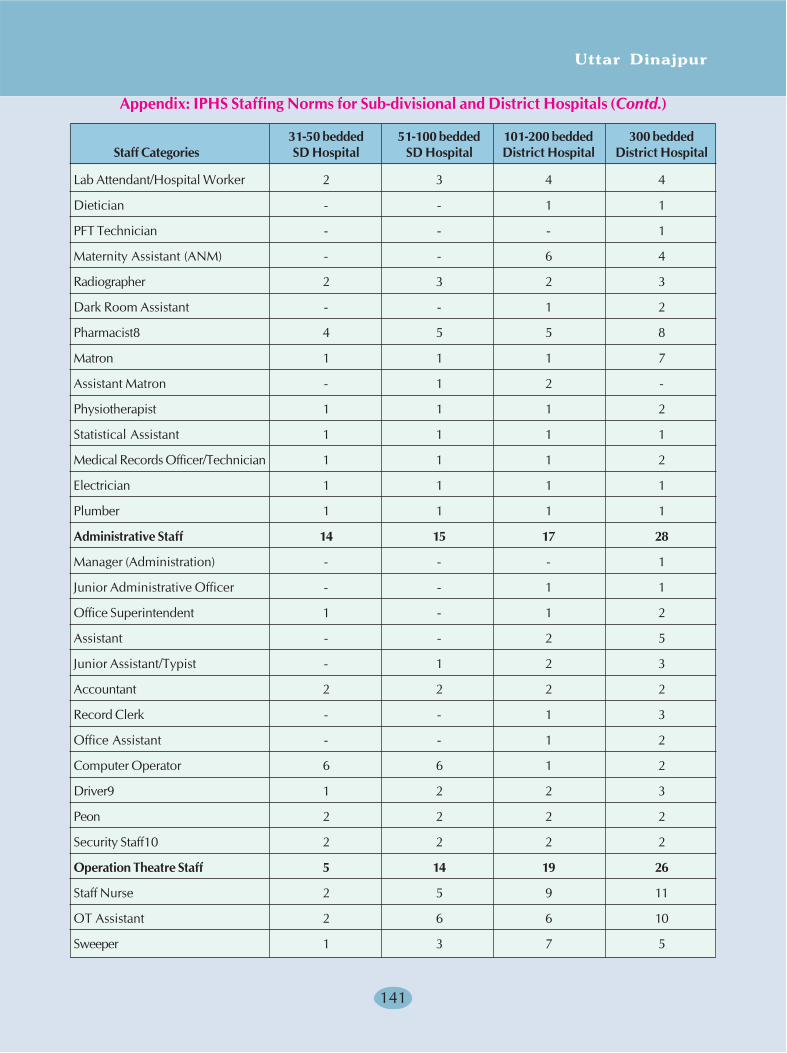
Uttar Dinajpur
141
Lab Attendant/Hospital Worker 2 3 4 4
Dietician - - 1 1
PFT Technician - - - 1
Maternity Assistant (ANM) - - 6 4
Radiographer 2 3 2 3
Dark Room Assistant - - 1 2
Pharmacist8 4 5 5 8
Matron 1 1 1 7
Assistant Matron - 1 2 -
Physiotherapist 1 1 1 2
Statistical Assistant 1 1 1 1
Medical Records Officer/Technician 1 1 1 2
Electrician 1 1 1 1
Plumber 1 1 1 1
Administrative Staff 14 15 17 28
Manager (Administration) - - - 1
Junior Administrative Officer - - 1 1
Office Superintendent 1 - 1 2
Assistant - - 2 5
Junior Assistant/Typist - 1 2 3
Accountant 2 2 2 2
Record Clerk - - 1 3
Office Assistant - - 1 2
Computer Operator 6 6 1 2
Driver9 1 2 2 3
Peon 2 2 2 2
Security Staff10 2 2 2 2
Operation Theatre Staff 5 14 19 26
Staff Nurse 2 5 9 11
OT Assistant 2 6 6 10
Sweeper 1 3 7 5
Appendix: IPHS Staffing Norms for Sub-divisional and District Hospitals (Contd.)
31-50 bedded 51-100 bedded 101-200 bedded 300 beddedStaff Categories SD Hospital SD Hospital District Hospital District Hospital
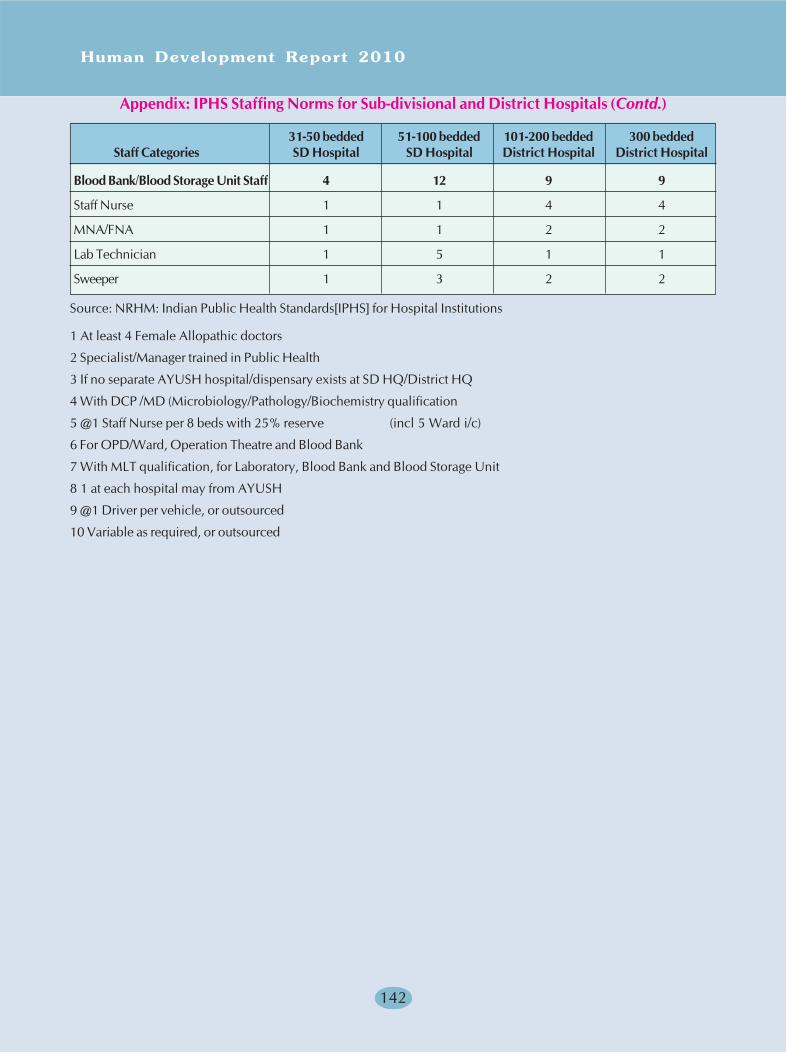
Human Development Report 2010
142
Blood Bank/Blood Storage Unit Staff 4 12 9 9
Staff Nurse 1 1 4 4
MNA/FNA 1 1 2 2
Lab Technician 1 5 1 1
Sweeper 1 3 2 2
Source: NRHM: Indian Public Health Standards[IPHS] for Hospital Institutions
1 At least 4 Female Allopathic doctors
2 Specialist/Manager trained in Public Health
3 If no separate AYUSH hospital/dispensary exists at SD HQ/District HQ
4 With DCP /MD (Microbiology/Pathology/Biochemistry qualification
5 @1 Staff Nurse per 8 beds with 25% reserve (incl 5 Ward i/c)
6 For OPD/Ward, Operation Theatre and Blood Bank
7 With MLT qualification, for Laboratory, Blood Bank and Blood Storage Unit
8 1 at each hospital may from AYUSH
9 @1 Driver per vehicle, or outsourced
10 Variable as required, or outsourced
Appendix: IPHS Staffing Norms for Sub-divisional and District Hospitals (Contd.)
31-50 bedded 51-100 bedded 101-200 bedded 300 beddedStaff Categories SD Hospital SD Hospital District Hospital District Hospital
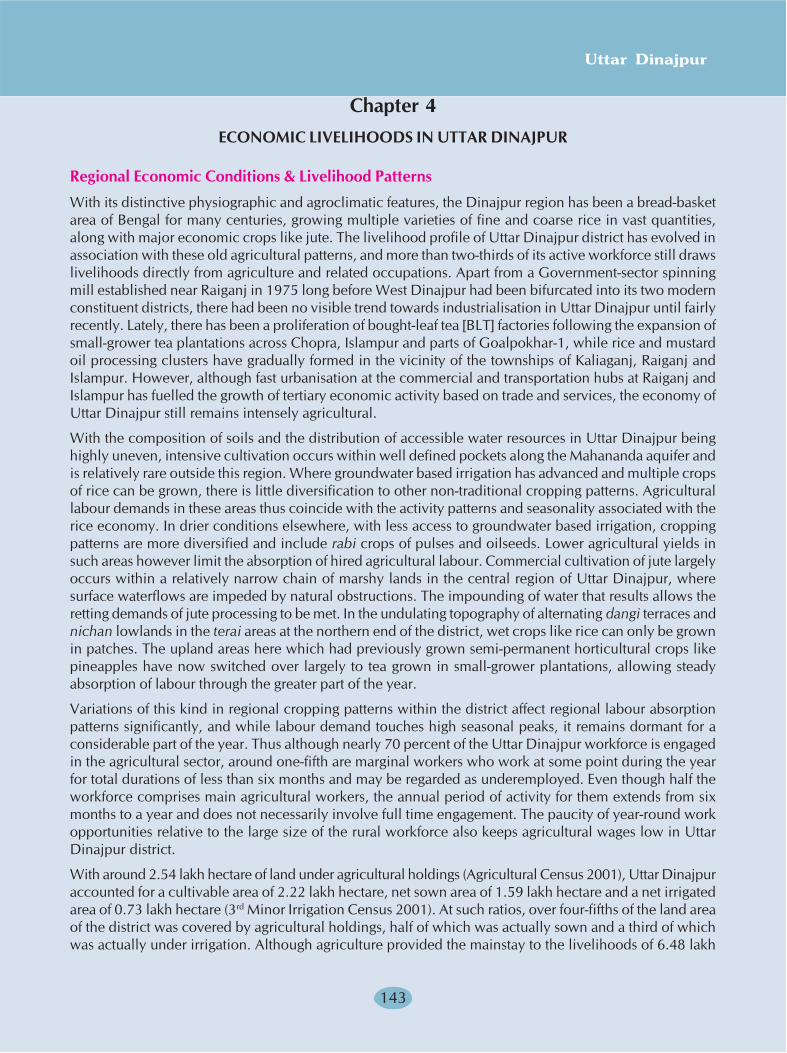
Uttar Dinajpur
143
Chapter 4ECONOMIC LIVELIHOODS IN UTTAR DINAJPUR
Regional Economic Conditions & Livelihood Patterns
With its distinctive physiographic and agroclimatic features, the Dinajpur region has been a bread-basketarea of Bengal for many centuries, growing multiple varieties of fine and coarse rice in vast quantities,along with major economic crops like jute. The livelihood profile of Uttar Dinajpur district has evolved inassociation with these old agricultural patterns, and more than two-thirds of its active workforce still drawslivelihoods directly from agriculture and related occupations. Apart from a Government-sector spinningmill established near Raiganj in 1975 long before West Dinajpur had been bifurcated into its two modernconstituent districts, there had been no visible trend towards industrialisation in Uttar Dinajpur until fairlyrecently. Lately, there has been a proliferation of bought-leaf tea [BLT] factories following the expansion ofsmall-grower tea plantations across Chopra, Islampur and parts of Goalpokhar-1, while rice and mustardoil processing clusters have gradually formed in the vicinity of the townships of Kaliaganj, Raiganj andIslampur. However, although fast urbanisation at the commercial and transportation hubs at Raiganj andIslampur has fuelled the growth of tertiary economic activity based on trade and services, the economy ofUttar Dinajpur still remains intensely agricultural.
With the composition of soils and the distribution of accessible water resources in Uttar Dinajpur beinghighly uneven, intensive cultivation occurs within well defined pockets along the Mahananda aquifer andis relatively rare outside this region. Where groundwater based irrigation has advanced and multiple cropsof rice can be grown, there is little diversification to other non-traditional cropping patterns. Agriculturallabour demands in these areas thus coincide with the activity patterns and seasonality associated with therice economy. In drier conditions elsewhere, with less access to groundwater based irrigation, croppingpatterns are more diversified and include rabi crops of pulses and oilseeds. Lower agricultural yields insuch areas however limit the absorption of hired agricultural labour. Commercial cultivation of jute largelyoccurs within a relatively narrow chain of marshy lands in the central region of Uttar Dinajpur, wheresurface waterflows are impeded by natural obstructions. The impounding of water that results allows theretting demands of jute processing to be met. In the undulating topography of alternating dangi terraces andnichan lowlands in the terai areas at the northern end of the district, wet crops like rice can only be grownin patches. The upland areas here which had previously grown semi-permanent horticultural crops likepineapples have now switched over largely to tea grown in small-grower plantations, allowing steadyabsorption of labour through the greater part of the year.
Variations of this kind in regional cropping patterns within the district affect regional labour absorptionpatterns significantly, and while labour demand touches high seasonal peaks, it remains dormant for aconsiderable part of the year. Thus although nearly 70 percent of the Uttar Dinajpur workforce is engagedin the agricultural sector, around one-fifth are marginal workers who work at some point during the yearfor total durations of less than six months and may be regarded as underemployed. Even though half theworkforce comprises main agricultural workers, the annual period of activity for them extends from sixmonths to a year and does not necessarily involve full time engagement. The paucity of year-round workopportunities relative to the large size of the rural workforce also keeps agricultural wages low in UttarDinajpur district.
With around 2.54 lakh hectare of land under agricultural holdings (Agricultural Census 2001), Uttar Dinajpuraccounted for a cultivable area of 2.22 lakh hectare, net sown area of 1.59 lakh hectare and a net irrigatedarea of 0.73 lakh hectare (3rd Minor Irrigation Census 2001). At such ratios, over four-fifths of the land areaof the district was covered by agricultural holdings, half of which was actually sown and a third of whichwas actually under irrigation. Although agriculture provided the mainstay to the livelihoods of 6.48 lakh
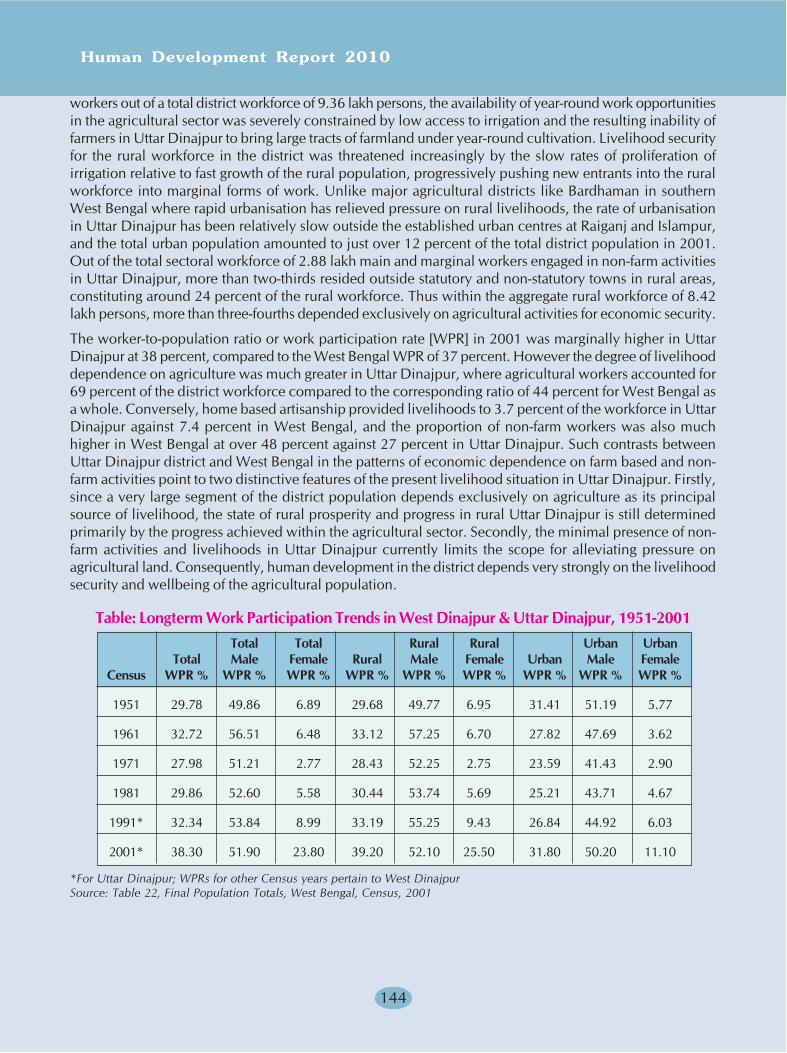
Human Development Report 2010
144
workers out of a total district workforce of 9.36 lakh persons, the availability of year-round work opportunitiesin the agricultural sector was severely constrained by low access to irrigation and the resulting inability offarmers in Uttar Dinajpur to bring large tracts of farmland under year-round cultivation. Livelihood securityfor the rural workforce in the district was threatened increasingly by the slow rates of proliferation ofirrigation relative to fast growth of the rural population, progressively pushing new entrants into the ruralworkforce into marginal forms of work. Unlike major agricultural districts like Bardhaman in southernWest Bengal where rapid urbanisation has relieved pressure on rural livelihoods, the rate of urbanisationin Uttar Dinajpur has been relatively slow outside the established urban centres at Raiganj and Islampur,and the total urban population amounted to just over 12 percent of the total district population in 2001.Out of the total sectoral workforce of 2.88 lakh main and marginal workers engaged in non-farm activitiesin Uttar Dinajpur, more than two-thirds resided outside statutory and non-statutory towns in rural areas,constituting around 24 percent of the rural workforce. Thus within the aggregate rural workforce of 8.42lakh persons, more than three-fourths depended exclusively on agricultural activities for economic security.
The worker-to-population ratio or work participation rate [WPR] in 2001 was marginally higher in UttarDinajpur at 38 percent, compared to the West Bengal WPR of 37 percent. However the degree of livelihooddependence on agriculture was much greater in Uttar Dinajpur, where agricultural workers accounted for69 percent of the district workforce compared to the corresponding ratio of 44 percent for West Bengal asa whole. Conversely, home based artisanship provided livelihoods to 3.7 percent of the workforce in UttarDinajpur against 7.4 percent in West Bengal, and the proportion of non-farm workers was also muchhigher in West Bengal at over 48 percent against 27 percent in Uttar Dinajpur. Such contrasts betweenUttar Dinajpur district and West Bengal in the patterns of economic dependence on farm based and non-farm activities point to two distinctive features of the present livelihood situation in Uttar Dinajpur. Firstly,since a very large segment of the district population depends exclusively on agriculture as its principalsource of livelihood, the state of rural prosperity and progress in rural Uttar Dinajpur is still determinedprimarily by the progress achieved within the agricultural sector. Secondly, the minimal presence of non-farm activities and livelihoods in Uttar Dinajpur currently limits the scope for alleviating pressure onagricultural land. Consequently, human development in the district depends very strongly on the livelihoodsecurity and wellbeing of the agricultural population.
Table: Longterm Work Participation Trends in West Dinajpur & Uttar Dinajpur, 1951-2001Total Total Rural Rural Urban Urban
Total Male Female Rural Male Female Urban Male FemaleCensus WPR % WPR % WPR % WPR % WPR % WPR % WPR % WPR % WPR %
1951 29.78 49.86 6.89 29.68 49.77 6.95 31.41 51.19 5.77
1961 32.72 56.51 6.48 33.12 57.25 6.70 27.82 47.69 3.62
1971 27.98 51.21 2.77 28.43 52.25 2.75 23.59 41.43 2.90
1981 29.86 52.60 5.58 30.44 53.74 5.69 25.21 43.71 4.67
1991* 32.34 53.84 8.99 33.19 55.25 9.43 26.84 44.92 6.03
2001* 38.30 51.90 23.80 39.20 52.10 25.50 31.80 50.20 11.10
*For Uttar Dinajpur; WPRs for other Census years pertain to West DinajpurSource: Table 22, Final Population Totals, West Bengal, Census, 2001

Uttar Dinajpur
145
0
10
20
30
40
50
60
70
WPR % Rural WPR %
Urban WPR %
W PR % Ru ral WPR %
Urban WPR %
W PR % Rura l WPR %
Urban WPR %
19 51
19 61
19 71
19 81
19 91
20 01
Changing Work Participat ion Trends in West Dinajpur & Uttar Dinajpur 1951-2001
Total WPRs Ma le WPRs Fema le WPRs
A preliminary assessment of changing work participation trends in the Uttar & Dakshin Dinajpur regionbetween 1951-2001 can be obtained from the compilation table for West Bengal districts released with theCensus 2001 results. Although the alternately rising and falling WPRs between 1951-71 are partiallyinfluenced by changes in the census definitions of workers, the census classifications of main and marginalworkers have stabilised thereafter. In terms of overall trends, work participation in the region showssubstantial longterm increase especially in rural areas, with a sizeable jump in rural WPRs between 1991and 2001, because of strongly increased work participation by rural women. Thus although the WPRs formen are much higher than those for women in both rural and urban areas, women’s work participation inthe region has risen at a faster rate than that of men. In rural areas, women workers have virtually steppedinto the shoes of men, as a result of which male WPRs in rural Uttar Dinajpur have declined after peaklevels were recorded in 1991. Urban WPRs have however risen steadily among both men and women,with strong increases in urban work participation after 1991.
However, despite strong escalation in WPRs in rural areas where three-fourths of the workers depend onagricultural activity for livelihood, the economic importance of the agricultural sector in Uttar Dinajpur hasdeclined considerably in terms of the total value produced. This is borne out by changes in the currentvalue of contribution made by different economic sectors to the total net district domestic product [NDDP]in Uttar Dinajpur, recent estimates of which are available from the Bureau of Applied Economics & Statistics,GoWB.
Table: Net District Domestic Product in Uttar Dinajpur by Sectoral Origin,1993-94 to 2003-04 At Current Prices
1993- 1994- 1995- 1996- 1997- 1998- 1999- 2000- 2001- 2002- 2003-Uttar Dinajpur 1994 1995 1996 1997 1998 1999 2000 2001 2002 2003 2004
Total Primary Sector 51812 66646 73184 87032 99680 130347 123199 123837 124647 135611 155699
Agriculture 47568 61731 66979 81552 91465 121582 112045 110610 110905 126878 145945
Forestry 908 987 1220 1508 1952 2174 3239 3620 3370 3585 3630
Fishery 3335 3927 4984 3971 6263 6591 7915 9607 10372 5148 6118
Mining & Quarrying 1 1 1 1 0 0 0 0 0 0 6
Total Secondary Sector 8737 9558 11917 13687 16053 18427 22293 25911 28484 29760 35509
Registered Manufacturing 284 304 389 459 293 327 768 258 262 297 333
Unregistered4212 4653 5947 7276 8014 8798 11050 11841 13272 12513 14267Manufacturing
Construction 3765 4019 4921 5276 7096 8642 9292 12343 13577 15347 18739
Electricity, Gas & 476 582 660 676 650 660 1183 1469 1373 1603 2170Water Supply
% W
PR

Human Development Report 2010
146
Table: Net District Domestic Product in Uttar Dinajpur by Sectoral Origin1993-94 to 2003-04 At Current Prices (Contd.)
1993 1994 1995 1996 1997 1998 1999 2000 2001 2002 2003Uttar Dinajpur 1994 1995 1996 1997 1998 1999 2000 2001 2002 2003 2004
Total Tertiary Sector 37152 44319 52456 61016 71881 87330 108232 122603 135110 153201 174883
Railways 321 442 478 550 651 758 951 1133 1582 1967 2454
Transport by Other 1990 2333 1909 2387 3684 4463 3917 4527 5244 6204 7431Means & Storage
Communications 596 702 904 1164 1197 1415 1614 1897 2121 2427 2810
Trade, Hotels & 8243 10256 11698 14704 17530 22432 22139 22628 24974 28056 33536Restaurants
Banking & Insurance 5526 7666 10372 10736 13638 15123 23140 27276 29759 35265 37717
Real Estate, Ownership 7478 8109 8680 9200 10360 11163 14930 19131 20852 24354 28677of Dwellings & BusinessServices
Public Administration 3936 4218 5392 6386 7605 9762 11478 12651 13231 14134 15006
Other Services 9062 10593 13023 15889 17216 22214 30063 33360 37347 40794 47252
Net District Domestic 97701 120523 137557 161735 187614 236104 253724 272351 288241 318572 366091Product [in Rs.lakh]
NDDP per Capita [in Rs] 4646.7 5567.7 6172.3 7048.9 7942.2 9708.1 10769.1 11264.311632.0 12535.5 14046.3
% of % of % of % of % of % of % of % of % of % of % ofNDDP NDDP NDDP NDDP NDDP NDDP NDDP NDDP NDDP NDDP NDDP1993 1994 1995 1996 1997 1998 1999 2000 2001 2002 2003
Uttar Dinajpur 1994 1995 1996 1997 1998 1999 2000 2001 2002 2003 2004
Total Primary Sector 53.03 55.30 53.20 53.81 53.13 55.21 48.56 45.47 43.24 42.57 42.53
Agriculture 48.69 51.22 48.69 50.42 48.75 51.50 44.16 40.61 38.48 39.83 39.87
Forestry 0.93 0.82 0.89 0.93 1.04 0.92 1.28 1.33 1.17 1.13 0.99
Fishery 3.41 3.26 3.62 2.46 3.34 2.79 3.12 3.53 3.60 1.62 1.67
Mining & Quarrying 0.00 0.00 0.00 0.00 0.00 0.00 0.00 0.00 0.00 0.00 0.00
Total Secondary Sector 8.94 7.93 8.66 8.46 8.56 7.80 8.79 9.51 9.88 9.34 9.70
Registered Manufacturing 0.29 0.25 0.28 0.28 0.16 0.14 0.30 0.09 0.09 0.09 0.09
Unregistered 4.31 3.86 4.32 4.50 4.27 3.73 4.36 4.35 4.60 3.93 3.90Manufacturing
Construction 3.85 3.33 3.58 3.26 3.78 3.66 3.66 4.53 4.71 4.82 5.12
Electricity, Gas & 0.49 0.48 0.48 0.42 0.35 0.28 0.47 0.54 0.48 0.50 0.59Water Supply
Total Tertiary Sector 38.03 36.77 38.13 37.73 38.31 36.99 42.66 45.02 46.87 48.09 47.77
Railways 0.33 0.37 0.35 0.34 0.35 0.32 0.37 0.42 0.55 0.62 0.67
Transport by Other 2.04 1.94 1.39 1.48 1.96 1.89 1.54 1.66 1.82 1.95 2.03Means & Storage
Communications 0.61 0.58 0.66 0.72 0.64 0.60 0.64 0.70 0.74 0.76 0.77
Trade, Hotels & 8.44 8.51 8.50 9.09 9.34 9.50 8.73 8.31 8.66 8.81 9.16Restaurants
Banking & Insurance 5.66 6.36 7.54 6.64 7.27 6.41 9.12 10.02 10.32 11.07 10.30
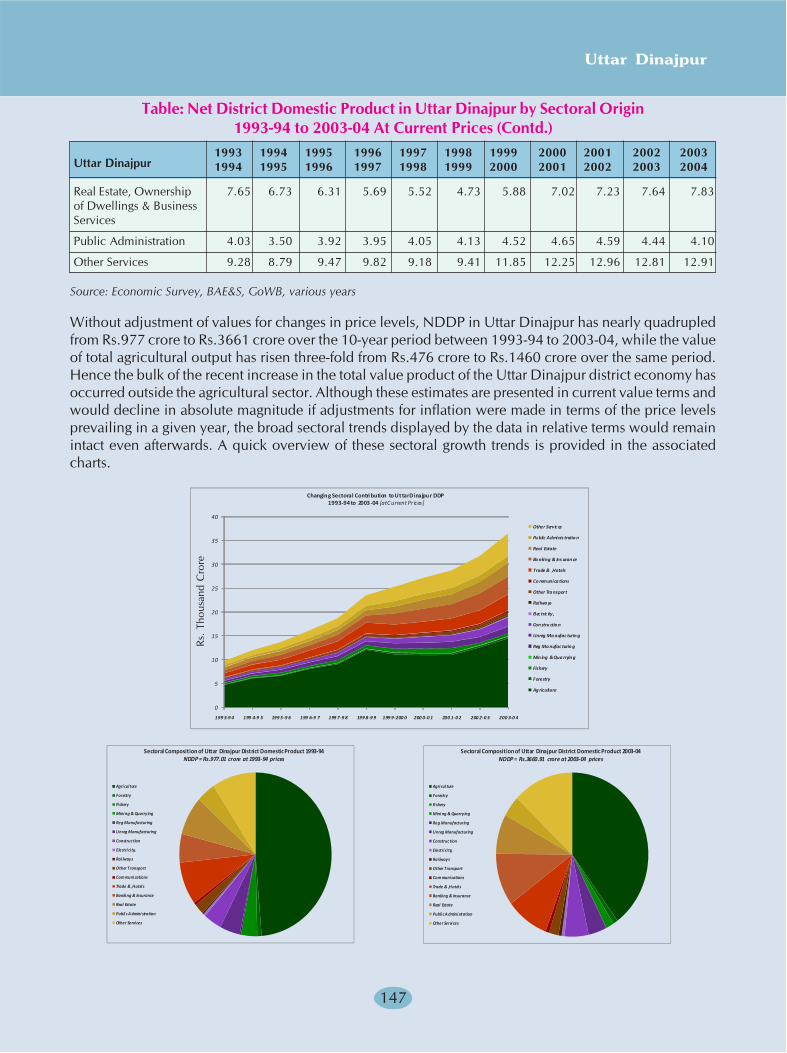
Uttar Dinajpur
147
Table: Net District Domestic Product in Uttar Dinajpur by Sectoral Origin1993-94 to 2003-04 At Current Prices (Contd.)
1993 1994 1995 1996 1997 1998 1999 2000 2001 2002 2003Uttar Dinajpur 1994 1995 1996 1997 1998 1999 2000 2001 2002 2003 2004
Real Estate, Ownership 7.65 6.73 6.31 5.69 5.52 4.73 5.88 7.02 7.23 7.64 7.83of Dwellings & BusinessServices
Public Administration 4.03 3.50 3.92 3.95 4.05 4.13 4.52 4.65 4.59 4.44 4.10
Other Services 9.28 8.79 9.47 9.82 9.18 9.41 11.85 12.25 12.96 12.81 12.91
Source: Economic Survey, BAE&S, GoWB, various years
Without adjustment of values for changes in price levels, NDDP in Uttar Dinajpur has nearly quadrupledfrom Rs.977 crore to Rs.3661 crore over the 10-year period between 1993-94 to 2003-04, while the valueof total agricultural output has risen three-fold from Rs.476 crore to Rs.1460 crore over the same period.Hence the bulk of the recent increase in the total value product of the Uttar Dinajpur district economy hasoccurred outside the agricultural sector. Although these estimates are presented in current value terms andwould decline in absolute magnitude if adjustments for inflation were made in terms of the price levelsprevailing in a given year, the broad sectoral trends displayed by the data in relative terms would remainintact even afterwards. A quick overview of these sectoral growth trends is provided in the associatedcharts.
0
5
10
15
20
25
30
35
40
199 3-9 4 199 4-9 5 199 5-9 6 199 6-9 7 199 7-9 8 199 8-9 9 199 9-200 0 200 0-0 1 200 1-0 2 200 2-0 3 200 3-0 4
Other Servic es
Pu blic Adminis tratio n
Real Estate
Ba nking & Ins uran ce
Trade & ,Hotels
Co mmunica tions
Other Tra nsport
Railwa ys
Elec tric ity,
Con stru ctio n
Unreg Ma nufac turin g
Reg Ma nufac turin g
Min ing & Qua rryin g
Fishery
Forestry
Ag riculture
Changing Sectoral Contri bution to Uttar Dinajpur DDP 1993-94 to 2003 -04 [at C urrent Pr ices]
Sectoral Composition of Uttar Dinajpur District Domestic Product 1993-94NDDP = Rs.977.01 crore at 1993-94 prices
Agricul ture
Forestry
Fi shery
Mining & Quarrying
Reg Manufacturing
Unreg Manufacturing
Construc tion
Electri ci ty,
Rai lways
Other Transport
Communications
Trade & ,Hotel s
Banki ng & Insurance
Real Estate
Publi c A dmini stration
Other Servi ces
Sectoral Composition of Uttar Dinajpur District Domestic Product 2003-04NDDP = Rs.3660.91 crore at 2003-04 prices
Agricul ture
Forestry
Fi shery
Mini ng & Quarrying
Reg Manufacturing
Unreg Manufacturing
Construc tion
Electri ci ty,
Rai lways
Other Transport
Communications
Trade & ,Hotel s
Banking & Insurance
Real Estate
Publi c A dministration
Other Servi ces
Rs.
Tho
usan
d C
rore
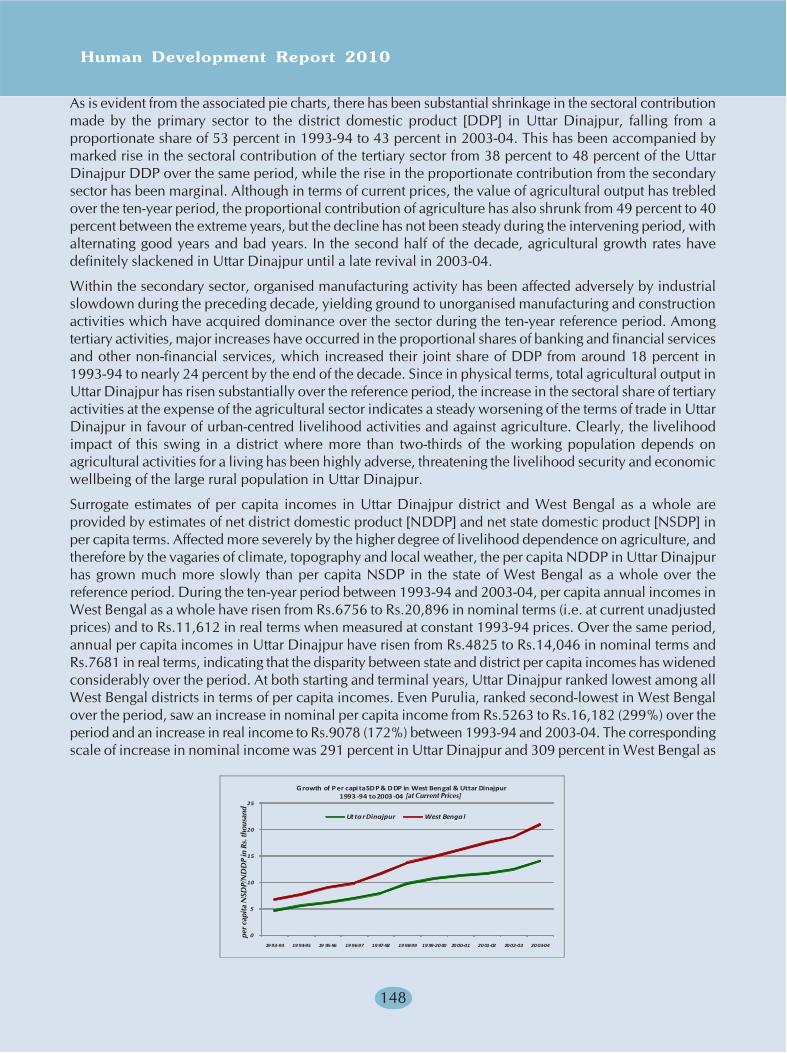
Human Development Report 2010
148
As is evident from the associated pie charts, there has been substantial shrinkage in the sectoral contributionmade by the primary sector to the district domestic product [DDP] in Uttar Dinajpur, falling from aproportionate share of 53 percent in 1993-94 to 43 percent in 2003-04. This has been accompanied bymarked rise in the sectoral contribution of the tertiary sector from 38 percent to 48 percent of the UttarDinajpur DDP over the same period, while the rise in the proportionate contribution from the secondarysector has been marginal. Although in terms of current prices, the value of agricultural output has trebledover the ten-year period, the proportional contribution of agriculture has also shrunk from 49 percent to 40percent between the extreme years, but the decline has not been steady during the intervening period, withalternating good years and bad years. In the second half of the decade, agricultural growth rates havedefinitely slackened in Uttar Dinajpur until a late revival in 2003-04.
Within the secondary sector, organised manufacturing activity has been affected adversely by industrialslowdown during the preceding decade, yielding ground to unorganised manufacturing and constructionactivities which have acquired dominance over the sector during the ten-year reference period. Amongtertiary activities, major increases have occurred in the proportional shares of banking and financial servicesand other non-financial services, which increased their joint share of DDP from around 18 percent in1993-94 to nearly 24 percent by the end of the decade. Since in physical terms, total agricultural output inUttar Dinajpur has risen substantially over the reference period, the increase in the sectoral share of tertiaryactivities at the expense of the agricultural sector indicates a steady worsening of the terms of trade in UttarDinajpur in favour of urban-centred livelihood activities and against agriculture. Clearly, the livelihoodimpact of this swing in a district where more than two-thirds of the working population depends onagricultural activities for a living has been highly adverse, threatening the livelihood security and economicwellbeing of the large rural population in Uttar Dinajpur.
Surrogate estimates of per capita incomes in Uttar Dinajpur district and West Bengal as a whole areprovided by estimates of net district domestic product [NDDP] and net state domestic product [NSDP] inper capita terms. Affected more severely by the higher degree of livelihood dependence on agriculture, andtherefore by the vagaries of climate, topography and local weather, the per capita NDDP in Uttar Dinajpurhas grown much more slowly than per capita NSDP in the state of West Bengal as a whole over thereference period. During the ten-year period between 1993-94 and 2003-04, per capita annual incomes inWest Bengal as a whole have risen from Rs.6756 to Rs.20,896 in nominal terms (i.e. at current unadjustedprices) and to Rs.11,612 in real terms when measured at constant 1993-94 prices. Over the same period,annual per capita incomes in Uttar Dinajpur have risen from Rs.4825 to Rs.14,046 in nominal terms andRs.7681 in real terms, indicating that the disparity between state and district per capita incomes has widenedconsiderably over the period. At both starting and terminal years, Uttar Dinajpur ranked lowest among allWest Bengal districts in terms of per capita incomes. Even Purulia, ranked second-lowest in West Bengalover the period, saw an increase in nominal per capita income from Rs.5263 to Rs.16,182 (299%) over theperiod and an increase in real income to Rs.9078 (172%) between 1993-94 and 2003-04. The correspondingscale of increase in nominal income was 291 percent in Uttar Dinajpur and 309 percent in West Bengal as
0
5
10
15
20
25
19 93-94 19 94-95 19 95-96 19 96-97 19 97-98 19 98-99 19 99-20 00 20 00-01 20 01-02 20 02-03 20 03-04
Uttar Dinajpur West Bengal
Growth of Per capi ta SDP & DDP in West Bengal & Uttar Dinajpur1993 -94 to 2003 -04 [a t Curren t Prices]
per c
apita
NSD
P/N
DD
P in
Rs.
thou
sand
[at Current Prices]
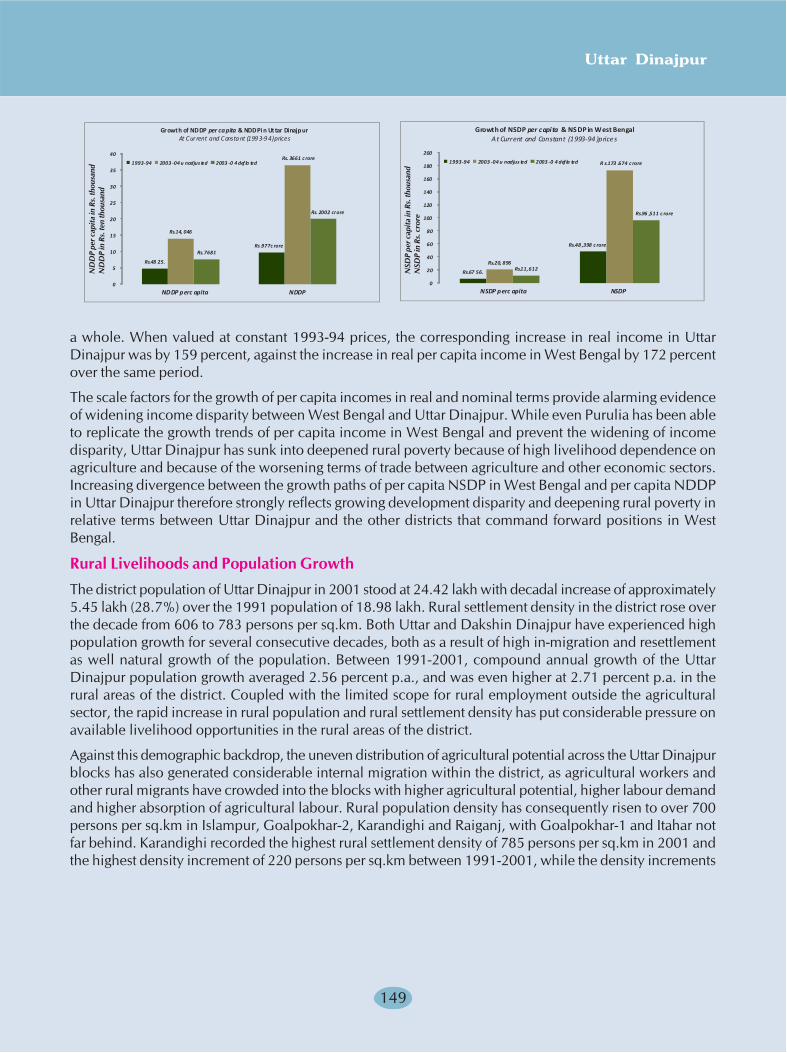
Uttar Dinajpur
149
Rs.48 25.
Rs .977c rore
Rs.14, 046
Rs. 3661 c rore
Rs.7681
Rs. 2002 crore
0
5
10
15
20
25
30
35
40
1993-94 2003 -04 u nadjus ted 2003 -0 4 def la ted
Growth of NDDP per capita & NDDP i n Ut tar DinajpurAt C ur rent and C onsta nt (199 3-9 4 )prices
NDDP per c apita NDDP
Rs.67 56.
Rs.48 ,398 c rore
Rs.20, 896
R s.173 .674 c rore
Rs.11,612
Rs.96 ,511 c rore
0
20
40
60
80
100
120
140
160
180
200
1993-94 2003 -04 u nadjus ted 2003 -0 4 def la ted
Growth of NSDP per capita & NS DP in West BengalAt Current and Constant (1993-94 )prices
NSDP per c apita NSDP
a whole. When valued at constant 1993-94 prices, the corresponding increase in real income in UttarDinajpur was by 159 percent, against the increase in real per capita income in West Bengal by 172 percentover the same period.
The scale factors for the growth of per capita incomes in real and nominal terms provide alarming evidenceof widening income disparity between West Bengal and Uttar Dinajpur. While even Purulia has been ableto replicate the growth trends of per capita income in West Bengal and prevent the widening of incomedisparity, Uttar Dinajpur has sunk into deepened rural poverty because of high livelihood dependence onagriculture and because of the worsening terms of trade between agriculture and other economic sectors.Increasing divergence between the growth paths of per capita NSDP in West Bengal and per capita NDDPin Uttar Dinajpur therefore strongly reflects growing development disparity and deepening rural poverty inrelative terms between Uttar Dinajpur and the other districts that command forward positions in WestBengal.
Rural Livelihoods and Population Growth
The district population of Uttar Dinajpur in 2001 stood at 24.42 lakh with decadal increase of approximately5.45 lakh (28.7%) over the 1991 population of 18.98 lakh. Rural settlement density in the district rose overthe decade from 606 to 783 persons per sq.km. Both Uttar and Dakshin Dinajpur have experienced highpopulation growth for several consecutive decades, both as a result of high in-migration and resettlementas well natural growth of the population. Between 1991-2001, compound annual growth of the UttarDinajpur population growth averaged 2.56 percent p.a., and was even higher at 2.71 percent p.a. in therural areas of the district. Coupled with the limited scope for rural employment outside the agriculturalsector, the rapid increase in rural population and rural settlement density has put considerable pressure onavailable livelihood opportunities in the rural areas of the district.
Against this demographic backdrop, the uneven distribution of agricultural potential across the Uttar Dinajpurblocks has also generated considerable internal migration within the district, as agricultural workers andother rural migrants have crowded into the blocks with higher agricultural potential, higher labour demandand higher absorption of agricultural labour. Rural population density has consequently risen to over 700persons per sq.km in Islampur, Goalpokhar-2, Karandighi and Raiganj, with Goalpokhar-1 and Itahar notfar behind. Karandighi recorded the highest rural settlement density of 785 persons per sq.km in 2001 andthe highest density increment of 220 persons per sq.km between 1991-2001, while the density increments
ND
DP
per c
apita
in R
s. th
ousa
ndN
DD
P in
Rs.
ten
thou
sand
NSD
P pe
r cap
ita in
Rs.
thou
sand
NSD
P in
Rs.
cro
re
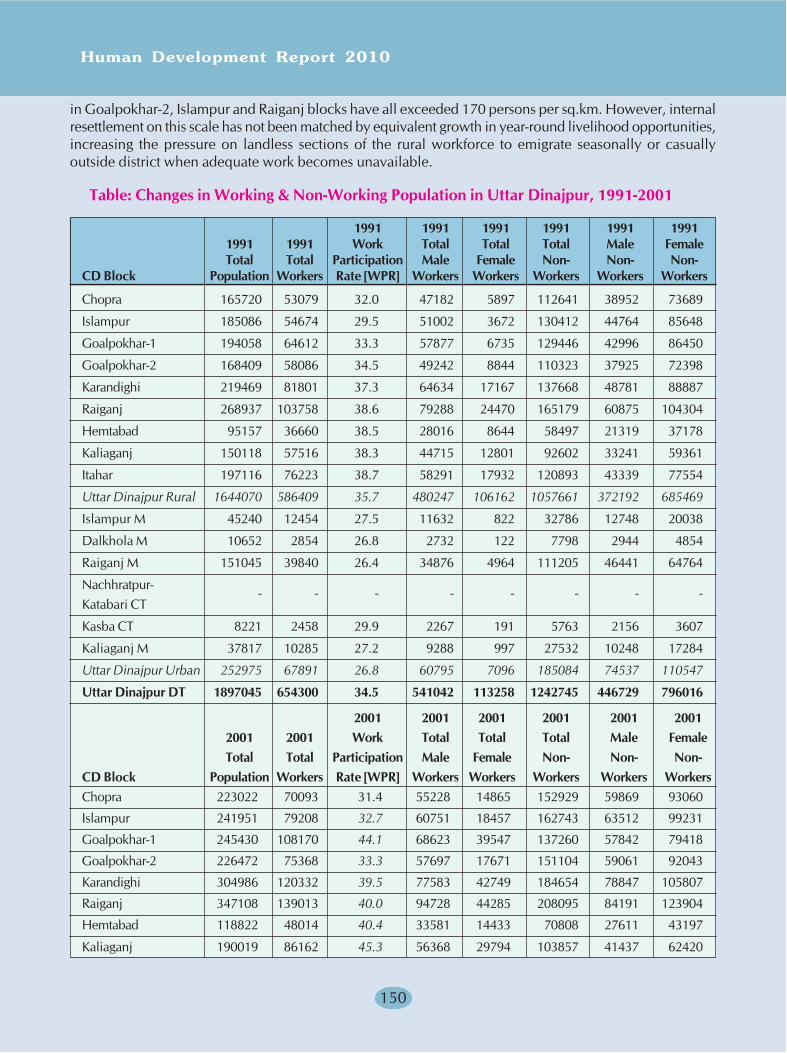
Human Development Report 2010
150
in Goalpokhar-2, Islampur and Raiganj blocks have all exceeded 170 persons per sq.km. However, internalresettlement on this scale has not been matched by equivalent growth in year-round livelihood opportunities,increasing the pressure on landless sections of the rural workforce to emigrate seasonally or casuallyoutside district when adequate work becomes unavailable.
Table: Changes in Working & Non-Working Population in Uttar Dinajpur, 1991-2001
1991 1991 1991 1991 1991 19911991 1991 Work Total Total Total Male FemaleTotal Total Participation Male Female Non- Non- Non-
CD Block Population Workers Rate [WPR] Workers Workers Workers Workers Workers
Chopra 165720 53079 32.0 47182 5897 112641 38952 73689
Islampur 185086 54674 29.5 51002 3672 130412 44764 85648
Goalpokhar-1 194058 64612 33.3 57877 6735 129446 42996 86450
Goalpokhar-2 168409 58086 34.5 49242 8844 110323 37925 72398
Karandighi 219469 81801 37.3 64634 17167 137668 48781 88887
Raiganj 268937 103758 38.6 79288 24470 165179 60875 104304
Hemtabad 95157 36660 38.5 28016 8644 58497 21319 37178
Kaliaganj 150118 57516 38.3 44715 12801 92602 33241 59361
Itahar 197116 76223 38.7 58291 17932 120893 43339 77554
Uttar Dinajpur Rural 1644070 586409 35.7 480247 106162 1057661 372192 685469
Islampur M 45240 12454 27.5 11632 822 32786 12748 20038
Dalkhola M 10652 2854 26.8 2732 122 7798 2944 4854
Raiganj M 151045 39840 26.4 34876 4964 111205 46441 64764
Nachhratpur-Katabari CT
- - - - - - - -
Kasba CT 8221 2458 29.9 2267 191 5763 2156 3607
Kaliaganj M 37817 10285 27.2 9288 997 27532 10248 17284
Uttar Dinajpur Urban 252975 67891 26.8 60795 7096 185084 74537 110547
Uttar Dinajpur DT 1897045 654300 34.5 541042 113258 1242745 446729 796016
2001 2001 2001 2001 2001 20012001 2001 Work Total Total Total Male FemaleTotal Total Participation Male Female Non- Non- Non-
CD Block Population Workers Rate [WPR] Workers Workers Workers Workers WorkersChopra 223022 70093 31.4 55228 14865 152929 59869 93060
Islampur 241951 79208 32.7 60751 18457 162743 63512 99231
Goalpokhar-1 245430 108170 44.1 68623 39547 137260 57842 79418
Goalpokhar-2 226472 75368 33.3 57697 17671 151104 59061 92043
Karandighi 304986 120332 39.5 77583 42749 184654 78847 105807
Raiganj 347108 139013 40.0 94728 44285 208095 84191 123904
Hemtabad 118822 48014 40.4 33581 14433 70808 27611 43197
Kaliaganj 190019 86162 45.3 56368 29794 103857 41437 62420

Uttar Dinajpur
151
Table: Changes in Working & Non-Working Population in UttarDinajpur, 1991-2001 (Contd.)
2001 2001 2001 2001 2001 20012001 2001 Work Total Total Total Male FemaleTotal Total Participation Male Female Non- Non- Non-
CD Block Population Workers Rate [WPR] Workers Workers Workers Workers Workers
Itahar 249541 115623 46.3 71010 44613 133918 56285 77633
Uttar Dinajpur Rural 2147351 841983 39.2 575569 266414 1305368 528655 776713
Islampur M 52738 15858 30.1 13631 2227 36880 14514 22366
Dalkhola M 13895 3714 26.7 3435 279 10181 3946 6235
Raiganj M 165212 52508 31.8 43295 9213 112704 44163 68541
Nachhratpur-Katabari CT 5113 1889 36.9 1439 450 3224 1245 1979
Kasba CT 9835 3303 33.6 2852 451 6532 2393 4139
Kaliaganj M 47650 16269 34.1 13456 2813 31381 11144 20237
Uttar Dinajpur Urban 294443 93541 31.8 78108 15433 200902 77405 123497
Uttar Dinajpur DT 2441794 935524 38.3 653677 281847 1506270 606060 900210
Source: Census, 1991 & 2001
0
50
100
150
200
250
300
350
400
1991
RU
RAL
Chop
ra
Islam
pur
Goal
pokh
ar-1
Goal
pokh
ar-2
Kara
ndig
hi
Raig
anj
Hem
taba
d
Kalia
ganj
Itaha
r
2001
RU
RAL
Chop
ra
Islam
pur
Goal
pokh
ar-1
Goal
pokh
ar-2
Kara
ndig
hi
Raig
anj
Hem
taba
d
Kalia
ganj
Itaha
r
Thou
sand
s
Workers Nonworkers
Working & Nonworking Population in Rural Uttar Dinajpur1991 & 2001
20011991
0
50
100
150
200
250
300
350
400
1991
URBA
N
Islamp
ur M
Dalko
la M
Raiga
nj M
Nach
hratp
ur-…
Kasb
a CT
Kalia
ganj
M
2001
URBA
N
Islamp
ur M
Dalko
la M
Raiga
nj M
Nach
hratp
ur-…
Kasb
a CT
Kalia
ganj
M
Thou
sand
s
Workers Nonworkers
Working & Nonworking Population in Urban Uttar Dinajpur1991 & 2001
20011991
0
50
100
150
200
250
1991
RU
RAL
Chop
ra
Islam
pur
Goal
pokh
ar-1
Goal
pokh
ar-2
Kara
ndig
hi
Raig
anj
Hem
taba
d
Kalia
ganj
Itaha
r
2001
RU
RAL
Chop
ra
Islam
pur
Goal
pokh
ar-1
Goal
pokh
ar-2
Kara
ndig
hi
Raig
anj
Hem
taba
d
Kalia
ganj
Itaha
r
Thou
sand
s
Male Workers Female Workers
Male & Female Working Population in Rural Uttar Dinajpur1991 & 2001
20011991
0
50
100
150
200
250
1991
URB
AN
Islam
pur M
Dalko
la M
Raiga
nj M
Nach
hrat
pur-…
Kasb
a CT
Kalia
ganj
M
2001
URB
AN
Islam
pur M
Dalko
la M
Raiga
nj M
Nach
hrat
pur-…
Kasb
a CT
Kalia
ganj
M
Thou
sand
s
Male Workers Female Workers
Male & Female Working Population in Urban Uttar Dinajpur1991 & 2001
20011991
0
50
100
150
200
250
1991
RU
RAL
Chop
ra
Islam
pur
Goal
pokh
ar-1
Goal
pokh
ar-2
Kara
ndig
hi
Raig
anj
Hem
taba
d
Kalia
ganj
Itaha
r
2001
RU
RAL
Chop
ra
Islam
pur
Goal
pokh
ar-1
Goal
pokh
ar-2
Kara
ndig
hi
Raig
anj
Hem
taba
d
Kalia
ganj
Itaha
r
Thou
sand
s
Male Nonworkers Female Nonworkers
Male & Female Nonworking Population in Rural Uttar Dinajpur1991 & 2001
20011991
0
50
100
150
200
250
1991
URB
AN
Islam
pur M
Dalko
la M
Raiga
nj M
Nach
hrat
pur-…
Kasb
a CT
Kalia
ganj
M
2001
URB
AN
Islam
pur M
Dalko
la M
Raiga
nj M
Nach
hrat
pur-…
Kasb
a CT
Kalia
ganj
M
Thou
sand
s
Male Nonworkers Female Nonworkers
Male & Female Nonworking Population in Urban Uttar Dinajpur1991 & 2001
20011991

Human Development Report 2010
152
Between 1991-2001, the working population in Uttar Dinajpur district rose substantially by 2.81 lakh froma total workforce size of 6.54 lakh workers in 1991 to 9.36 lakh in 2001. Nine-tenths of the increaseoccurred in the rural areas of the district, where the workforce grew by 2.56 lakh while the workforce inurban areas grew from 0.68 lakh to 0.94 lakh. The largest increase in the working population occurred inGoalpokhar-1 where the rural workforce grew by 0.44 lakh, followed by Raiganj, Karandighi and Itaharwith working population increases ranging from 0.38-0.39 lakh. Hemtabad at the other end of the scalesaw its working population increase by just over 0.11 lakh, while Chopra and Goalpokhar-2 experiencedincreases of just over 0.17 lakh, and Islampur and Kaliaganj experienced increases ranging from 0.25-0.29lakh. Low-to-moderate increases in the working population in Chopra, Goalpokhar-2 and Islampur wereaccompanied by large increases in the dependent non-working population in the range 0.32-0.41 lakh,implying a strong increase in their dependency ratios. In Hemtabad and Kaliaganj on the other hand, theincrease in dependency was modest. In Raiganj and Karandighi, the rise in dependency outweighed thestrong increase in the working population, while Itahar and Goalpokhar-1 both experienced low increasein dependency, accompanying high increases in their working population.
As seen earlier, female work participation in Uttar Dinajpur had traditionally been low compared to malework participation. However, in all blocks in Uttar Dinajpur between 1991-2001, female workingpopulations rose faster than male working populations, as more and more women entered the workforce.The increases in the female working population thus ranged from 0.06 lakh in Hemtabad to 0.33 lakh inGoalpokhar-1, while the corresponding increases in male working population were within a much narrowerrange from 0.06 lakh in Hemtabad to 0.15 lakh in Raiganj. Because of this, dependency within the malepopulation rose faster than in the female population, while in Goalpokhar-1 which experienced the highestincrease in working population between 1991-2001, the extent of female dependency actually declined. Inurban Uttar Dinajpur on the other hand, where traditional gender patterns were better preserved, the maleworkforce rose by 0.17 lakh against a corresponding increase of 0.08 lakh in the female workforce.
Rather than being uniform across the district, the current patterns of work-search and dependency in UttarDinajpur clearly define three distinct sub-regions each of which is confronted by livelihood pressures of adistinctive kind. Forming a sub-regional cluster at the centre of the district, the densely populated blocks ofRaiganj and Karandighi have experienced sharp increases in working population along with relativelysharp increases in male and female dependency. To the north of the district too, these characteristics alsoapply to Islampur blocks. On the other hand, with lower overall settlement densities, blocks like Itahar,Kaliaganj and Goalpokhar-1 have been able to draw in a large group of rural women into their activeworkforce and have thus accommodated large increases in their working populations without substantialincrease in dependency. Elsewhere in the district, in blocks where the capacity to absorb new workers hasbeen low either because of the saturation of work opportunities or because of the lack of livelihooddiversification, the increase in dependency too has remained low, because of slow growth of the blockpopulations. Clearly therefore, the work-patterns in the first two subregions are strongly affected by work-related migration, while the work patterns of the third non-contiguous subregion are affected by its absence.
Work Participation in Uttar Dinajpur
Since 1981, the standard Census definition of work covers engagement in economically productive activitiesof a physical or mental nature, including the supervision and direction of work. The distinction betweenmain and marginal workers is based on a time criterion that specifies the duration of such engagement.While workers who work for the major part of the year, i.e. for periods exceeding six months or 183 days,come under the description of main workers, others who work at some point during the year for shorterdurations come under the description of marginal workers. It would stand to reason that any householdwould require economic support from at least one main worker who works for a significant part of theyear, in order to survive. Other household members, including women who are otherwise engaged inunpaid domestic work, may also supplement household earnings by working at some point during the year
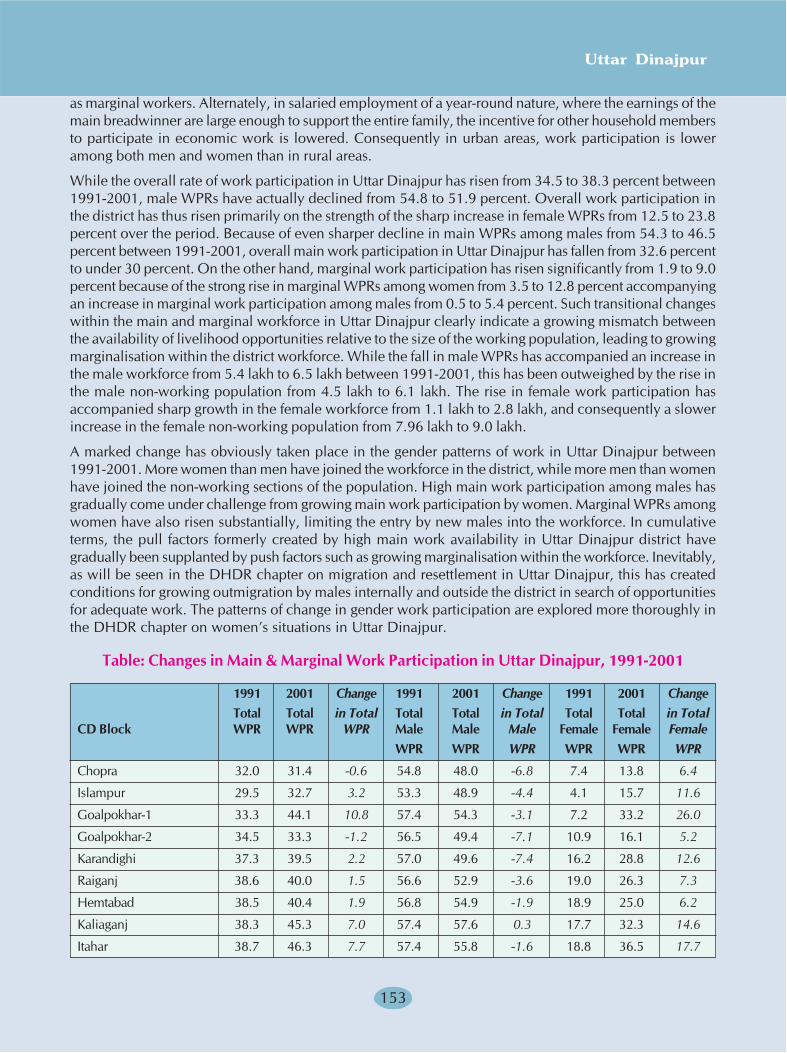
Uttar Dinajpur
153
as marginal workers. Alternately, in salaried employment of a year-round nature, where the earnings of themain breadwinner are large enough to support the entire family, the incentive for other household membersto participate in economic work is lowered. Consequently in urban areas, work participation is loweramong both men and women than in rural areas.
While the overall rate of work participation in Uttar Dinajpur has risen from 34.5 to 38.3 percent between1991-2001, male WPRs have actually declined from 54.8 to 51.9 percent. Overall work participation inthe district has thus risen primarily on the strength of the sharp increase in female WPRs from 12.5 to 23.8percent over the period. Because of even sharper decline in main WPRs among males from 54.3 to 46.5percent between 1991-2001, overall main work participation in Uttar Dinajpur has fallen from 32.6 percentto under 30 percent. On the other hand, marginal work participation has risen significantly from 1.9 to 9.0percent because of the strong rise in marginal WPRs among women from 3.5 to 12.8 percent accompanyingan increase in marginal work participation among males from 0.5 to 5.4 percent. Such transitional changeswithin the main and marginal workforce in Uttar Dinajpur clearly indicate a growing mismatch betweenthe availability of livelihood opportunities relative to the size of the working population, leading to growingmarginalisation within the district workforce. While the fall in male WPRs has accompanied an increase inthe male workforce from 5.4 lakh to 6.5 lakh between 1991-2001, this has been outweighed by the rise inthe male non-working population from 4.5 lakh to 6.1 lakh. The rise in female work participation hasaccompanied sharp growth in the female workforce from 1.1 lakh to 2.8 lakh, and consequently a slowerincrease in the female non-working population from 7.96 lakh to 9.0 lakh.
A marked change has obviously taken place in the gender patterns of work in Uttar Dinajpur between1991-2001. More women than men have joined the workforce in the district, while more men than womenhave joined the non-working sections of the population. High main work participation among males hasgradually come under challenge from growing main work participation by women. Marginal WPRs amongwomen have also risen substantially, limiting the entry by new males into the workforce. In cumulativeterms, the pull factors formerly created by high main work availability in Uttar Dinajpur district havegradually been supplanted by push factors such as growing marginalisation within the workforce. Inevitably,as will be seen in the DHDR chapter on migration and resettlement in Uttar Dinajpur, this has createdconditions for growing outmigration by males internally and outside the district in search of opportunitiesfor adequate work. The patterns of change in gender work participation are explored more thoroughly inthe DHDR chapter on women’s situations in Uttar Dinajpur.
Table: Changes in Main & Marginal Work Participation in Uttar Dinajpur, 1991-2001
1991 2001 Change 1991 2001 Change 1991 2001 ChangeTotal Total in Total Total Total in Total Total Total in Total
CD Block WPR WPR WPR Male Male Male Female Female FemaleWPR WPR WPR WPR WPR WPR
Chopra 32.0 31.4 -0.6 54.8 48.0 -6.8 7.4 13.8 6.4
Islampur 29.5 32.7 3.2 53.3 48.9 -4.4 4.1 15.7 11.6
Goalpokhar-1 33.3 44.1 10.8 57.4 54.3 -3.1 7.2 33.2 26.0
Goalpokhar-2 34.5 33.3 -1.2 56.5 49.4 -7.1 10.9 16.1 5.2
Karandighi 37.3 39.5 2.2 57.0 49.6 -7.4 16.2 28.8 12.6
Raiganj 38.6 40.0 1.5 56.6 52.9 -3.6 19.0 26.3 7.3
Hemtabad 38.5 40.4 1.9 56.8 54.9 -1.9 18.9 25.0 6.2
Kaliaganj 38.3 45.3 7.0 57.4 57.6 0.3 17.7 32.3 14.6
Itahar 38.7 46.3 7.7 57.4 55.8 -1.6 18.8 36.5 17.7
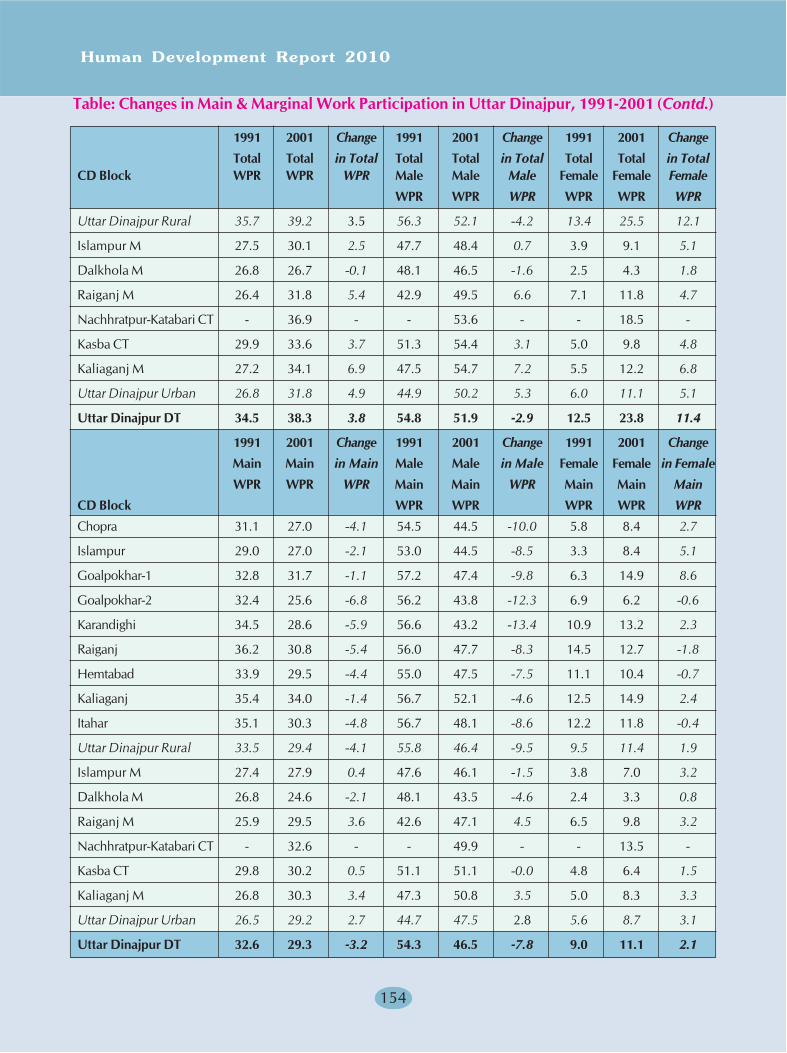
Human Development Report 2010
154
Table: Changes in Main & Marginal Work Participation in Uttar Dinajpur, 1991-2001 (Contd.)
1991 2001 Change 1991 2001 Change 1991 2001 Change
Total Total in Total Total Total in Total Total Total in TotalCD Block WPR WPR WPR Male Male Male Female Female Female
WPR WPR WPR WPR WPR WPR
Uttar Dinajpur Rural 35.7 39.2 3.5 56.3 52.1 -4.2 13.4 25.5 12.1
Islampur M 27.5 30.1 2.5 47.7 48.4 0.7 3.9 9.1 5.1
Dalkhola M 26.8 26.7 -0.1 48.1 46.5 -1.6 2.5 4.3 1.8
Raiganj M 26.4 31.8 5.4 42.9 49.5 6.6 7.1 11.8 4.7
Nachhratpur-Katabari CT - 36.9 - - 53.6 - - 18.5 -
Kasba CT 29.9 33.6 3.7 51.3 54.4 3.1 5.0 9.8 4.8
Kaliaganj M 27.2 34.1 6.9 47.5 54.7 7.2 5.5 12.2 6.8
Uttar Dinajpur Urban 26.8 31.8 4.9 44.9 50.2 5.3 6.0 11.1 5.1
Uttar Dinajpur DT 34.5 38.3 3.8 54.8 51.9 -2.9 12.5 23.8 11.4
1991 2001 Change 1991 2001 Change 1991 2001 Change
Main Main in Main Male Male in Male Female Female in Female
WPR WPR WPR Main Main WPR Main Main Main
CD Block WPR WPR WPR WPR WPR
Chopra 31.1 27.0 -4.1 54.5 44.5 -10.0 5.8 8.4 2.7
Islampur 29.0 27.0 -2.1 53.0 44.5 -8.5 3.3 8.4 5.1
Goalpokhar-1 32.8 31.7 -1.1 57.2 47.4 -9.8 6.3 14.9 8.6
Goalpokhar-2 32.4 25.6 -6.8 56.2 43.8 -12.3 6.9 6.2 -0.6
Karandighi 34.5 28.6 -5.9 56.6 43.2 -13.4 10.9 13.2 2.3
Raiganj 36.2 30.8 -5.4 56.0 47.7 -8.3 14.5 12.7 -1.8
Hemtabad 33.9 29.5 -4.4 55.0 47.5 -7.5 11.1 10.4 -0.7
Kaliaganj 35.4 34.0 -1.4 56.7 52.1 -4.6 12.5 14.9 2.4
Itahar 35.1 30.3 -4.8 56.7 48.1 -8.6 12.2 11.8 -0.4
Uttar Dinajpur Rural 33.5 29.4 -4.1 55.8 46.4 -9.5 9.5 11.4 1.9
Islampur M 27.4 27.9 0.4 47.6 46.1 -1.5 3.8 7.0 3.2
Dalkhola M 26.8 24.6 -2.1 48.1 43.5 -4.6 2.4 3.3 0.8
Raiganj M 25.9 29.5 3.6 42.6 47.1 4.5 6.5 9.8 3.2
Nachhratpur-Katabari CT - 32.6 - - 49.9 - - 13.5 -
Kasba CT 29.8 30.2 0.5 51.1 51.1 -0.0 4.8 6.4 1.5
Kaliaganj M 26.8 30.3 3.4 47.3 50.8 3.5 5.0 8.3 3.3
Uttar Dinajpur Urban 26.5 29.2 2.7 44.7 47.5 2.8 5.6 8.7 3.1
Uttar Dinajpur DT 32.6 29.3 -3.2 54.3 46.5 -7.8 9.0 11.1 2.1
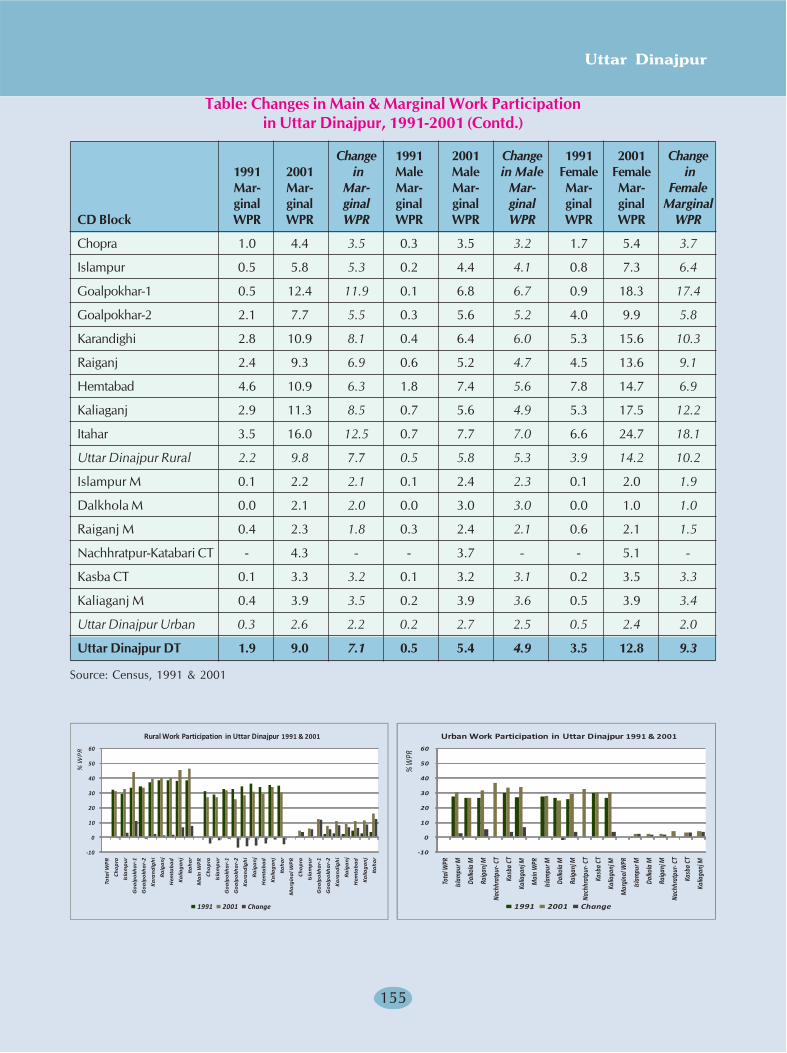
Uttar Dinajpur
155
Table: Changes in Main & Marginal Work Participationin Uttar Dinajpur, 1991-2001 (Contd.)
Change 1991 2001 Change 1991 2001 Change1991 2001 in Male Male in Male Female Female inMar- Mar- Mar- Mar- Mar- Mar- Mar- Mar- Femaleginal ginal ginal ginal ginal ginal ginal ginal Marginal
CD Block WPR WPR WPR WPR WPR WPR WPR WPR WPR
Chopra 1.0 4.4 3.5 0.3 3.5 3.2 1.7 5.4 3.7
Islampur 0.5 5.8 5.3 0.2 4.4 4.1 0.8 7.3 6.4
Goalpokhar-1 0.5 12.4 11.9 0.1 6.8 6.7 0.9 18.3 17.4
Goalpokhar-2 2.1 7.7 5.5 0.3 5.6 5.2 4.0 9.9 5.8
Karandighi 2.8 10.9 8.1 0.4 6.4 6.0 5.3 15.6 10.3
Raiganj 2.4 9.3 6.9 0.6 5.2 4.7 4.5 13.6 9.1
Hemtabad 4.6 10.9 6.3 1.8 7.4 5.6 7.8 14.7 6.9
Kaliaganj 2.9 11.3 8.5 0.7 5.6 4.9 5.3 17.5 12.2
Itahar 3.5 16.0 12.5 0.7 7.7 7.0 6.6 24.7 18.1
Uttar Dinajpur Rural 2.2 9.8 7.7 0.5 5.8 5.3 3.9 14.2 10.2
Islampur M 0.1 2.2 2.1 0.1 2.4 2.3 0.1 2.0 1.9
Dalkhola M 0.0 2.1 2.0 0.0 3.0 3.0 0.0 1.0 1.0
Raiganj M 0.4 2.3 1.8 0.3 2.4 2.1 0.6 2.1 1.5
Nachhratpur-Katabari CT - 4.3 - - 3.7 - - 5.1 -
Kasba CT 0.1 3.3 3.2 0.1 3.2 3.1 0.2 3.5 3.3
Kaliaganj M 0.4 3.9 3.5 0.2 3.9 3.6 0.5 3.9 3.4
Uttar Dinajpur Urban 0.3 2.6 2.2 0.2 2.7 2.5 0.5 2.4 2.0
Uttar Dinajpur DT 1.9 9.0 7.1 0.5 5.4 4.9 3.5 12.8 9.3
Source: Census, 1991 & 2001
-10
0
10
20
30
40
50
60
Tota
l WP
R
Ch
op
ra
Isla
mp
ur
Go
alp
okh
ar-
1
Go
alp
okh
ar-
2
Ka
ran
dig
hi
Ra
iga
nj
Hem
tab
ad
Ka
liag
an
j
Ita
ha
r
Ma
in W
PR
Ch
op
ra
Isla
mp
ur
Go
alp
okh
ar-
1
Go
alp
okh
ar-
2
Ka
ran
dig
hi
Ra
iga
nj
Hem
tab
ad
Ka
liag
an
j
Ita
ha
r
Ma
rgin
al W
PR
Ch
op
ra
Isla
mp
ur
Go
alp
okh
ar-
1
Go
alp
okh
ar-
2
Ka
ran
dig
hi
Ra
iga
nj
Hem
tab
ad
Ka
liag
an
j
Ita
ha
r
1991 2001 Change
Rural Work Participation in Uttar Dinajpur 1991 & 2001
% W
PR
-10
0
10
20
30
40
50
60
Tota
l WPR
Islam
pur M
Dalko
la M
Raig
anj M
Nach
hrat
pur-
CT
Kasb
a CT
Kalia
ganj
M
Mai
n W
PR
Islam
pur M
Dalko
la M
Raig
anj M
Nach
hrat
pur-
CT
Kasb
a CT
Kalia
ganj
M
Mar
gina
l WPR
Islam
pur M
Dalko
la M
Raig
anj M
Nach
hrat
pur-
CT
Kasb
a CT
Kalia
ganj
M
1991 2001 Change
Urban Work Participation in Uttar Dinajpur 1991 & 2001
% W
PR

Human Development Report 2010
156
The regional patterns of change in main and marginal work participation are summarised in the associatedcharts, which clearly show that the moderate-to-sharp falls in main WPRs that have occurred in all UttarDinajpur blocks have been accompanied by moderate-to-sharp increases in marginal WPRs. In all blocksexcept Chopra and Goalpokhar-2, the increase in marginal work participation has been strong enough tooutweigh the fall in main work participation and thus produce relative increases in the block WPRs. Therise in overall WPRs has been strongest in Goalpokhar-1 (10.8%), Itahar (7.7%) and Kaliaganj (7%) becauseof strong escalation ranging between 8.5-12.5 percent in marginal WPRs. While these have compensatedrelatively modest declines in main work participation in Goapokhar-1 and Kaliaganj, the more severedecline in main work participation in Itahar has been outweighed by the remarkably strong increase inmarginal WPR from 3.5 percent to 16.5 percent between 1991-2001. The strongest declines in main workparticipation have however occurred in the principal agricultural blocks of Raiganj, Karandighi andGoalpokhar-2, and have been accompanied by relatively strong increases in marginal work participation.In the resulting switch from main work to marginal work, overall WPRs in these blocks have increased. Onthe other hand, increases in overall WPRs in the urban areas of Uttar Dinajpur reflect growing main workparticipation. Consequently, marginal WPRs in the urban areas have remained low between 1991-2001.
Clearly, therefore, the dynamics of work participation differ strongly between rural and urban Uttar Dinajpur.Holding more than two-thirds of the district workforce, the rural areas have been subject to much strongerlivelihood pressures arising out of the relative decline in main work availability, which has forced a switchoverfrom main work to marginal work for new entrants into the rural workforce. While rural work participationhas increased in overall terms, higher engagement of women as main and marginal workers has restrictedthe main work opportunities accessible to rural males. Consequently, a gradual footlooseness has evolvedamong rural male wage-workers, encouraging them to shift locations whenever they can find better workopportunities. Labour dynamics of a similar kind have long been in evidence in the neighbouring state ofBihar. Their recent emergence in Uttar Dinajpur raises serious concerns about rural livelihood security inthe district.
The regional work participation patterns identified above can be explored more closely in the associatedregional maps. As can be seen from the regional comparisons, Karandighi has experienced the highestincrease in the main workforce between 1991-2001 because of strong growth in the male and female mainworkforce. Goalpokhar-1 on the other hand, has experienced the strongest increase in the female mainworkforce while the growth of the male main workforce has been limited. In Raiganj block, the oppositehas been true with strong growth in the male main workforce and modest growth in the number of femalemain workers. Thus although the three blocks together account for the bulk of the increase in the mainworkforce in Uttar Dinajpur, Karandighi is the only block where main work opportunities have risenappreciably for both male and female workers. The growth in the female main workforce has also beenmore widespread across Islampur SD where most blocks except Goalpokhar-2 show relatively high increasesin female main workers. Kaliaganj is the only block in Raiganj SD where the increase in female mainworkers has been appreciable. The growth of the main workforce is much more localised around Raiganj,Karandighi and, to a more limited extent, Kaliaganj.
The increase in the marginal workforce has been better dispersed across Uttar Dinajpur, with most blocksshowing sizeable increases in male and female marginal workers. Besides, the large increase in the mainworkforce, Karandighi has also experienced large increases in the number of male and female marginalworkers, while in Itahar, the growth of the marginal workforce has been strongest among both males andfemales. In general, except for Karandighi in the case of male marginal workers and Goalpokhar-1in thecase of female marginal workers, most Islampur SD blocks have experienced less marginalisation withinthe workforce and are also able to offer more work opportunities to male and female main workers.Outside Raiganj block, the opportunities for main work are limited in the Raiganj SD blocks, and consequentlymore workers there have to depend on marginal work opportunities.
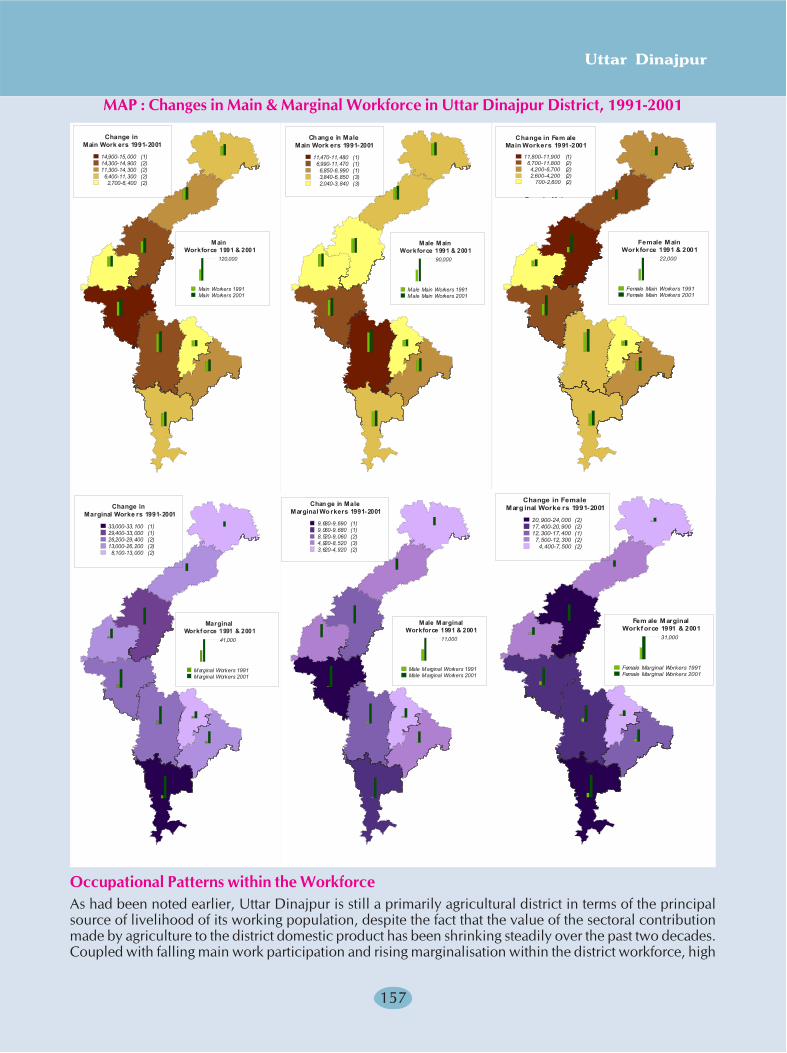
Uttar Dinajpur
157
Change inMain Work ers 1991-2001
14,900-15,000 (1)14,300-14,900 (2)11,300-14,300 (2)
6,400-11,300 (2)2,700-6,400 (2)
MainWorkforce 1991 & 2001
120,000
Main Workers 1991Main Workers 2001
Ch ang e in MaleMain Work ers 1991-2001
11,470-11,480 (1)6,990-11,470 (1)
6,850-6,990 (1)3,840-6,850 (3)2,040-3,840 (3)
Male M ainWorkforce 1991 & 2001
90,000
Male Main Workers 1991Male Main Workers 2001
F l M i
Change in Fem aleMain Workers 1991-2001
11,800-11,900 (1)6,700-11,800 (2)4,200-6,700 (2)2,600-4,200 (2)
700-2,600 (2)
Female MainWorkforce 1991 & 2001
22,000
Female Main Workers 1991Female Main Workers 2001
M i l
Change inMarginal Worke rs 1991-2001
33,000-33,100 (1)29,400-33,000 (1)26,200-29,400 (2)13,000-26,200 (3)8,100-13,000 (2)
MarginalWorkf orce 1991 & 2001
41,000
Marginal Workers 1991Marginal Workers 2001
Chan ge in MaleMarginal Wo rkers 1991-2001
9,680-9,690 (1)9,060-9,680 (1)8,520-9,060 (2)4,920-8,520 (3)3,620-4,920 (2)
Male MarginalWorkforce 1991 & 2001
11,000
Male Marginal Workers 1991Male Marginal Workers 2001
Change in FemaleMarg inal Worke rs 1991-2001
20,900-24,000 (2)17,400-20,900 (2)12,300-17,400 (1)7,500-12,300 (2)
4,400-7,500 (2)
Fem ale MarginalWorkf orce 1991 & 2001
31,000
Female Marginal Workers 1991Female Marginal Workers 2001
MAP : Changes in Main & Marginal Workforce in Uttar Dinajpur District, 1991-2001
Occupational Patterns within the WorkforceAs had been noted earlier, Uttar Dinajpur is still a primarily agricultural district in terms of the principalsource of livelihood of its working population, despite the fact that the value of the sectoral contributionmade by agriculture to the district domestic product has been shrinking steadily over the past two decades.Coupled with falling main work participation and rising marginalisation within the district workforce, high
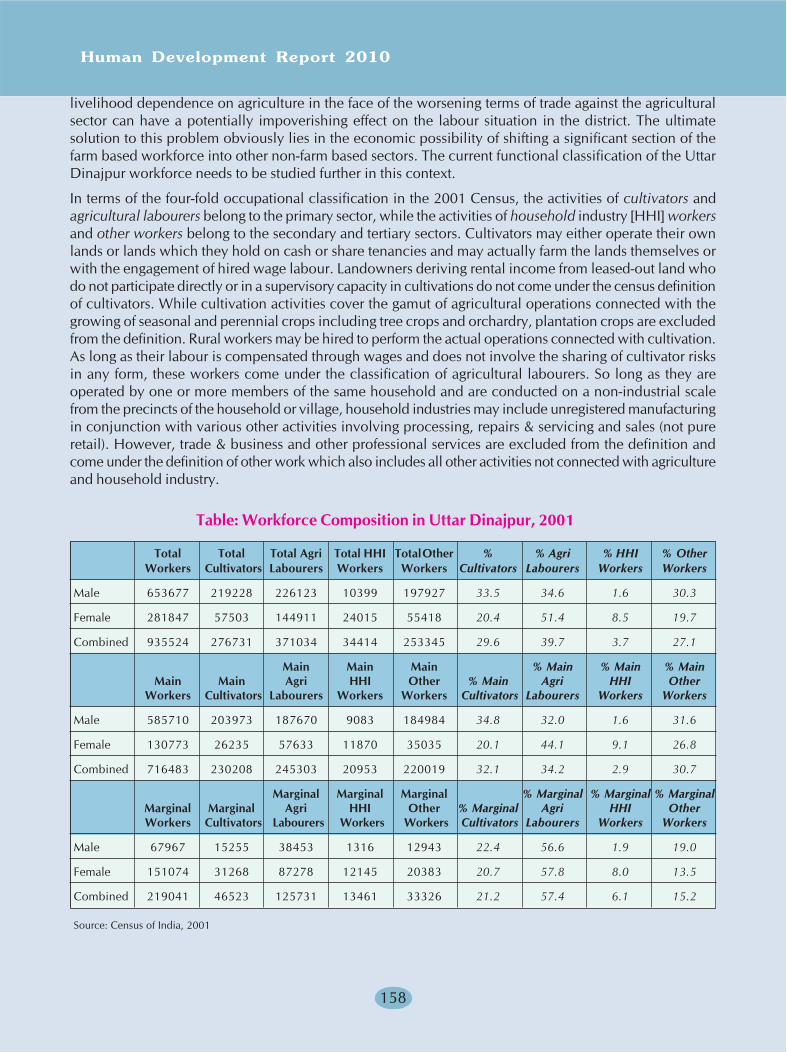
Human Development Report 2010
158
livelihood dependence on agriculture in the face of the worsening terms of trade against the agriculturalsector can have a potentially impoverishing effect on the labour situation in the district. The ultimatesolution to this problem obviously lies in the economic possibility of shifting a significant section of thefarm based workforce into other non-farm based sectors. The current functional classification of the UttarDinajpur workforce needs to be studied further in this context.
In terms of the four-fold occupational classification in the 2001 Census, the activities of cultivators andagricultural labourers belong to the primary sector, while the activities of household industry [HHI] workersand other workers belong to the secondary and tertiary sectors. Cultivators may either operate their ownlands or lands which they hold on cash or share tenancies and may actually farm the lands themselves orwith the engagement of hired wage labour. Landowners deriving rental income from leased-out land whodo not participate directly or in a supervisory capacity in cultivations do not come under the census definitionof cultivators. While cultivation activities cover the gamut of agricultural operations connected with thegrowing of seasonal and perennial crops including tree crops and orchardry, plantation crops are excludedfrom the definition. Rural workers may be hired to perform the actual operations connected with cultivation.As long as their labour is compensated through wages and does not involve the sharing of cultivator risksin any form, these workers come under the classification of agricultural labourers. So long as they areoperated by one or more members of the same household and are conducted on a non-industrial scalefrom the precincts of the household or village, household industries may include unregistered manufacturingin conjunction with various other activities involving processing, repairs & servicing and sales (not pureretail). However, trade & business and other professional services are excluded from the definition andcome under the definition of other work which also includes all other activities not connected with agricultureand household industry.
Table: Workforce Composition in Uttar Dinajpur, 2001
Total Total Total Agri Total HHI Total Other % % Agri % HHI % OtherWorkers Cultivators Labourers Workers Workers Cultivators Labourers Workers Workers
Male 653677 219228 226123 10399 197927 33.5 34.6 1.6 30.3
Female 281847 57503 144911 24015 55418 20.4 51.4 8.5 19.7
Combined 935524 276731 371034 34414 253345 29.6 39.7 3.7 27.1
Main Main Main % Main % Main % MainMain Main Agri HHI Other % Main Agri HHI Other
Workers Cultivators Labourers Workers Workers Cultivators Labourers Workers Workers
Male 585710 203973 187670 9083 184984 34.8 32.0 1.6 31.6
Female 130773 26235 57633 11870 35035 20.1 44.1 9.1 26.8
Combined 716483 230208 245303 20953 220019 32.1 34.2 2.9 30.7
Marginal Marginal Marginal % Marginal % Marginal % MarginalMarginal Marginal Agri HHI Other % Marginal Agri HHI OtherWorkers Cultivators Labourers Workers Workers Cultivators Labourers Workers Workers
Male 67967 15255 38453 1316 12943 22.4 56.6 1.9 19.0
Female 151074 31268 87278 12145 20383 20.7 57.8 8.0 13.5
Combined 219041 46523 125731 13461 33326 21.2 57.4 6.1 15.2
Source: Census of India, 2001
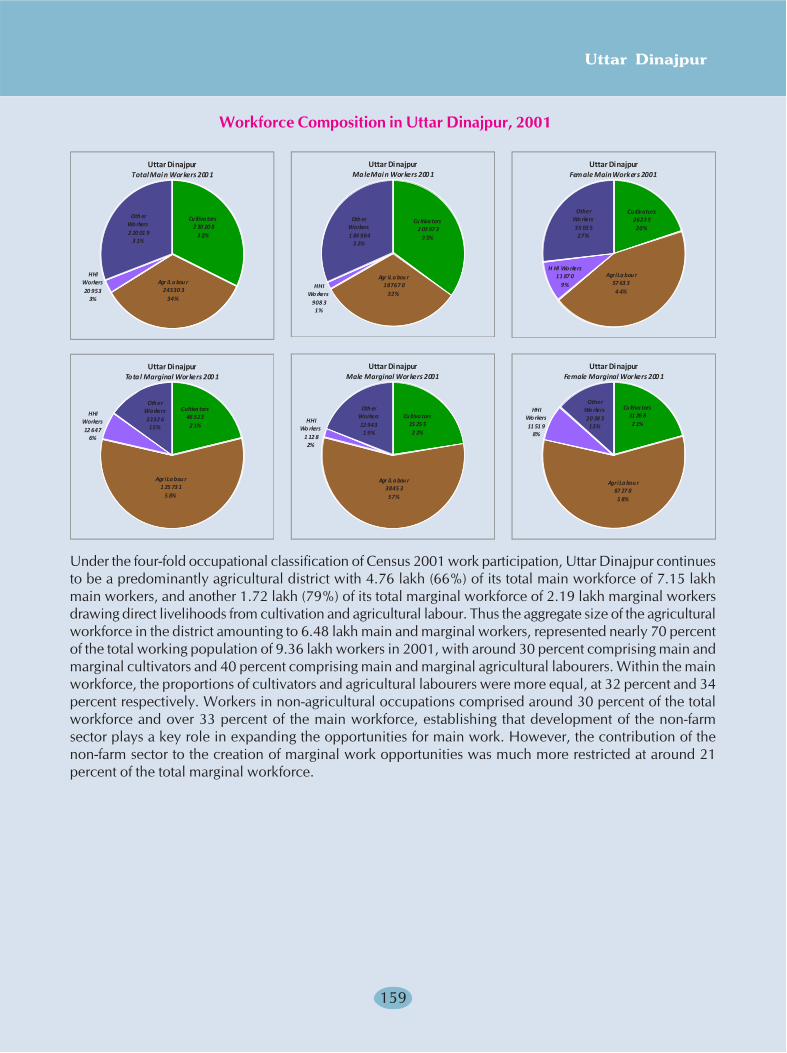
Uttar Dinajpur
159
Cu ltiva tors2 30 20 8
3 2%
Agr i L a bou r24530 3
34%
HHI Workers20 953
3%
Oth er Wo rkers2 20 01 9
3 1%
Uttar DinajpurTotal Mai n Workers 200 1
Cu ltiva tors2 03 97 3
3 5%
Agr i L a bou r18767 0
32%HHI
Wo rkers908 31%
Oth er Workers1 84 984
3 2%
Uttar DinajpurMa le Mai n Workers 200 1
Cu ltivators2623 520%
Agri La bou r57 63 34 4%
H HI Wo rkers11 87 0
9%
Other Wo rkers35 03 527%
Uttar DinajpurFemale Main Workers 2001
Cultiva tors46 523
2 1%
Agri La bou r1 25 73 1
5 8%
HHI Workers12 647
6%
Oth er Wo rkers3332 615%
Uttar DinajpurTotal Marginal Workers 200 1
Cu ltiva tors15 25 52 2%
Agr i L a bou r3845 357%
HHI Wo rkers
1 12 82%
Oth er Workers12 943
1 9%
Uttar DinajpurMale Marginal Workers 2001
Cu ltiva tors31 26 82 1%
Agri La bou r87 27 85 8%
HHI Wo rkers11 51 9
8%
Other Wo rkers20 38 313%
Uttar DinajpurFemale Marginal Workers 200 1
Under the four-fold occupational classification of Census 2001 work participation, Uttar Dinajpur continuesto be a predominantly agricultural district with 4.76 lakh (66%) of its total main workforce of 7.15 lakhmain workers, and another 1.72 lakh (79%) of its total marginal workforce of 2.19 lakh marginal workersdrawing direct livelihoods from cultivation and agricultural labour. Thus the aggregate size of the agriculturalworkforce in the district amounting to 6.48 lakh main and marginal workers, represented nearly 70 percentof the total working population of 9.36 lakh workers in 2001, with around 30 percent comprising main andmarginal cultivators and 40 percent comprising main and marginal agricultural labourers. Within the mainworkforce, the proportions of cultivators and agricultural labourers were more equal, at 32 percent and 34percent respectively. Workers in non-agricultural occupations comprised around 30 percent of the totalworkforce and over 33 percent of the main workforce, establishing that development of the non-farmsector plays a key role in expanding the opportunities for main work. However, the contribution of thenon-farm sector to the creation of marginal work opportunities was much more restricted at around 21percent of the total marginal workforce.
Workforce Composition in Uttar Dinajpur, 2001
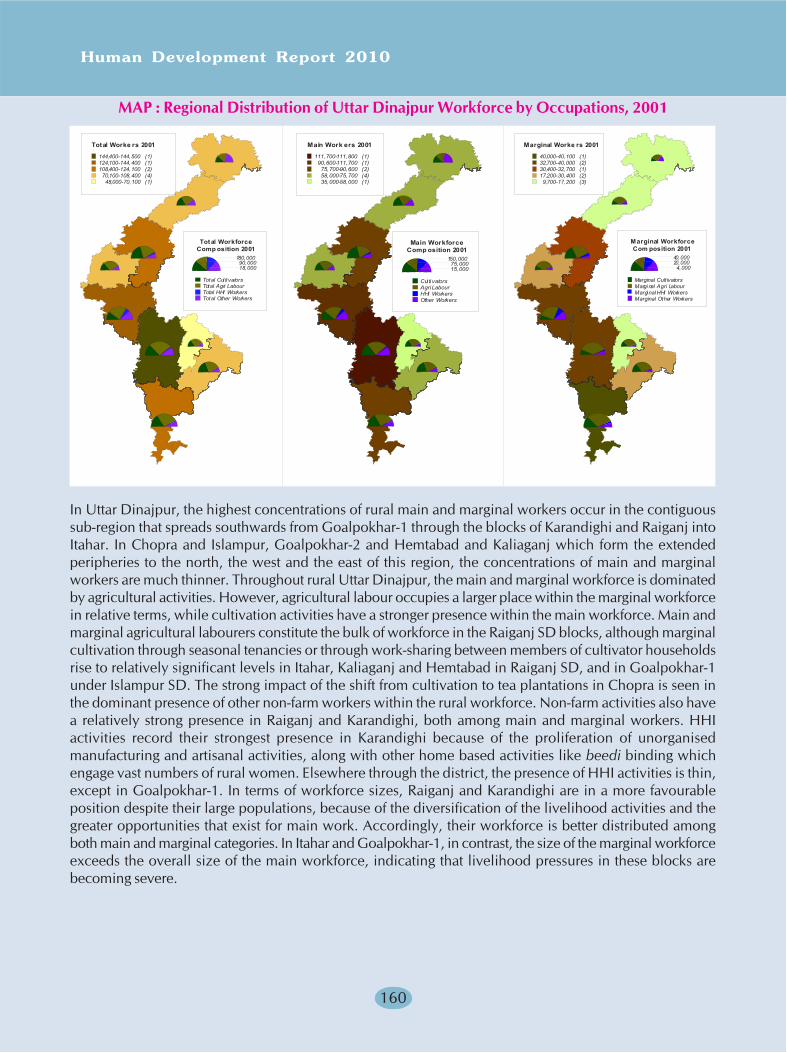
Human Development Report 2010
160
MAP : Regional Distribution of Uttar Dinajpur Workforce by Occupations, 2001
In Uttar Dinajpur, the highest concentrations of rural main and marginal workers occur in the contiguoussub-region that spreads southwards from Goalpokhar-1 through the blocks of Karandighi and Raiganj intoItahar. In Chopra and Islampur, Goalpokhar-2 and Hemtabad and Kaliaganj which form the extendedperipheries to the north, the west and the east of this region, the concentrations of main and marginalworkers are much thinner. Throughout rural Uttar Dinajpur, the main and marginal workforce is dominatedby agricultural activities. However, agricultural labour occupies a larger place within the marginal workforcein relative terms, while cultivation activities have a stronger presence within the main workforce. Main andmarginal agricultural labourers constitute the bulk of workforce in the Raiganj SD blocks, although marginalcultivation through seasonal tenancies or through work-sharing between members of cultivator householdsrise to relatively significant levels in Itahar, Kaliaganj and Hemtabad in Raiganj SD, and in Goalpokhar-1under Islampur SD. The strong impact of the shift from cultivation to tea plantations in Chopra is seen inthe dominant presence of other non-farm workers within the rural workforce. Non-farm activities also havea relatively strong presence in Raiganj and Karandighi, both among main and marginal workers. HHIactivities record their strongest presence in Karandighi because of the proliferation of unorganisedmanufacturing and artisanal activities, along with other home based activities like beedi binding whichengage vast numbers of rural women. Elsewhere through the district, the presence of HHI activities is thin,except in Goalpokhar-1. In terms of workforce sizes, Raiganj and Karandighi are in a more favourableposition despite their large populations, because of the diversification of the livelihood activities and thegreater opportunities that exist for main work. Accordingly, their workforce is better distributed amongboth main and marginal categories. In Itahar and Goalpokhar-1, in contrast, the size of the marginal workforceexceeds the overall size of the main workforce, indicating that livelihood pressures in these blocks arebecoming severe.
Total Worke rs 2001
144,400-144,500 (1)124,100-144,400 (1)108,400-124,100 (2)
70,100-108,400 (4)48,000-70,100 (1)
Total WorkforceComp osition 2001
180,00090,00018,000
Total Cul ti vatorsTotal Agri LabourTotal HHI WorkersTotal Other Workers
Main Work ers 2001
111,700-111,800 (1)90,600-111,700 (1)
75,700-90,600 (2)58,000-75,700 (4)35,000-58,000 (1)
Main WorkforceComp osition 2001
150,00075,00015,000
Cul ti vatorsAgri LabourHHI WorkersOther Workers
Marginal Worke rs 2001
40,000-40,100 (1)32,700-40,000 (2)30,400-32,700 (1)17,200-30,400 (2)9,700-17,200 (3)
Marginal WorkforceCom position 2001
40,00020,0004,000
Marginal CultivatorsMarginal Agri LabourMarginal HHI WorkersMarginal Other Workers
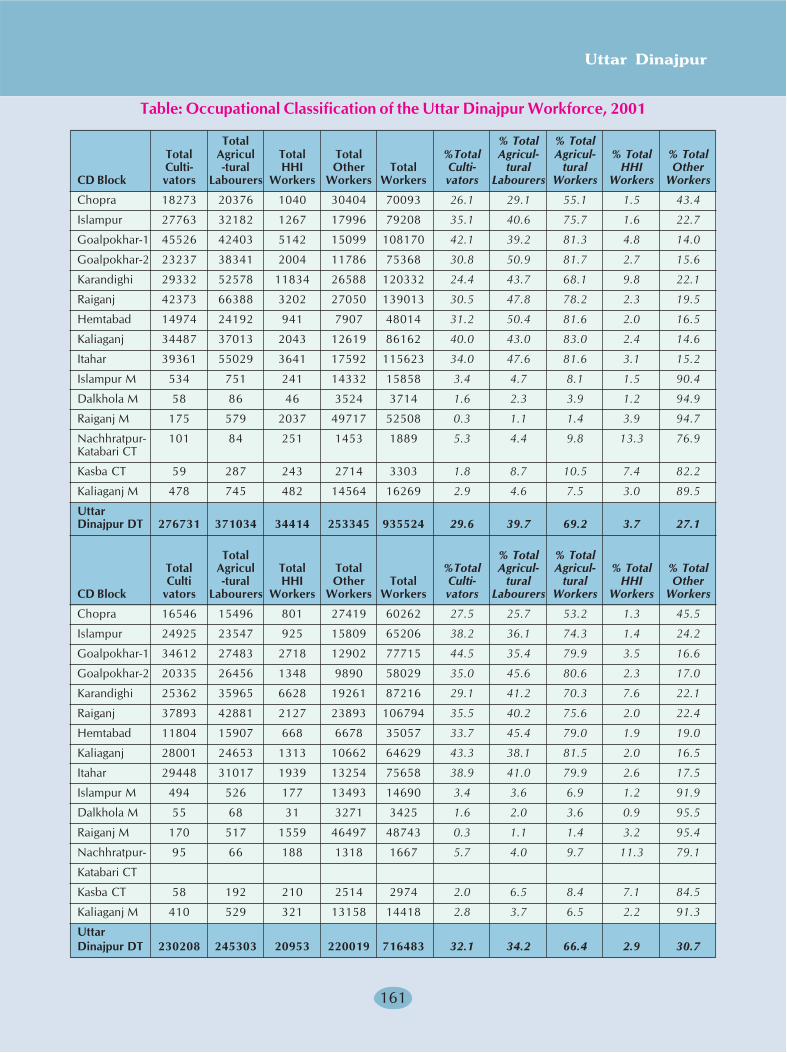
Uttar Dinajpur
161
Table: Occupational Classification of the Uttar Dinajpur Workforce, 2001
Total % Total % TotalTotal Agricul Total Total %Total Agricul- Agricul- % Total % TotalCulti- -tural HHI Other Total Culti- tural tural HHI Other
CD Block vators Labourers Workers Workers Workers vators Labourers Workers Workers Workers
Chopra 18273 20376 1040 30404 70093 26.1 29.1 55.1 1.5 43.4
Islampur 27763 32182 1267 17996 79208 35.1 40.6 75.7 1.6 22.7
Goalpokhar-1 45526 42403 5142 15099 108170 42.1 39.2 81.3 4.8 14.0
Goalpokhar-2 23237 38341 2004 11786 75368 30.8 50.9 81.7 2.7 15.6
Karandighi 29332 52578 11834 26588 120332 24.4 43.7 68.1 9.8 22.1
Raiganj 42373 66388 3202 27050 139013 30.5 47.8 78.2 2.3 19.5
Hemtabad 14974 24192 941 7907 48014 31.2 50.4 81.6 2.0 16.5
Kaliaganj 34487 37013 2043 12619 86162 40.0 43.0 83.0 2.4 14.6
Itahar 39361 55029 3641 17592 115623 34.0 47.6 81.6 3.1 15.2
Islampur M 534 751 241 14332 15858 3.4 4.7 8.1 1.5 90.4
Dalkhola M 58 86 46 3524 3714 1.6 2.3 3.9 1.2 94.9
Raiganj M 175 579 2037 49717 52508 0.3 1.1 1.4 3.9 94.7
Nachhratpur- 101 84 251 1453 1889 5.3 4.4 9.8 13.3 76.9Katabari CT
Kasba CT 59 287 243 2714 3303 1.8 8.7 10.5 7.4 82.2
Kaliaganj M 478 745 482 14564 16269 2.9 4.6 7.5 3.0 89.5
UttarDinajpur DT 276731 371034 34414 253345 935524 29.6 39.7 69.2 3.7 27.1
Total % Total % TotalTotal Agricul Total Total %Total Agricul- Agricul- % Total % TotalCulti -tural HHI Other Total Culti- tural tural HHI Other
CD Block vators Labourers Workers Workers Workers vators Labourers Workers Workers Workers
Chopra 16546 15496 801 27419 60262 27.5 25.7 53.2 1.3 45.5
Islampur 24925 23547 925 15809 65206 38.2 36.1 74.3 1.4 24.2
Goalpokhar-1 34612 27483 2718 12902 77715 44.5 35.4 79.9 3.5 16.6
Goalpokhar-2 20335 26456 1348 9890 58029 35.0 45.6 80.6 2.3 17.0
Karandighi 25362 35965 6628 19261 87216 29.1 41.2 70.3 7.6 22.1
Raiganj 37893 42881 2127 23893 106794 35.5 40.2 75.6 2.0 22.4
Hemtabad 11804 15907 668 6678 35057 33.7 45.4 79.0 1.9 19.0
Kaliaganj 28001 24653 1313 10662 64629 43.3 38.1 81.5 2.0 16.5
Itahar 29448 31017 1939 13254 75658 38.9 41.0 79.9 2.6 17.5
Islampur M 494 526 177 13493 14690 3.4 3.6 6.9 1.2 91.9
Dalkhola M 55 68 31 3271 3425 1.6 2.0 3.6 0.9 95.5
Raiganj M 170 517 1559 46497 48743 0.3 1.1 1.4 3.2 95.4
Nachhratpur- 95 66 188 1318 1667 5.7 4.0 9.7 11.3 79.1
Katabari CT
Kasba CT 58 192 210 2514 2974 2.0 6.5 8.4 7.1 84.5
Kaliaganj M 410 529 321 13158 14418 2.8 3.7 6.5 2.2 91.3
UttarDinajpur DT 230208 245303 20953 220019 716483 32.1 34.2 66.4 2.9 30.7
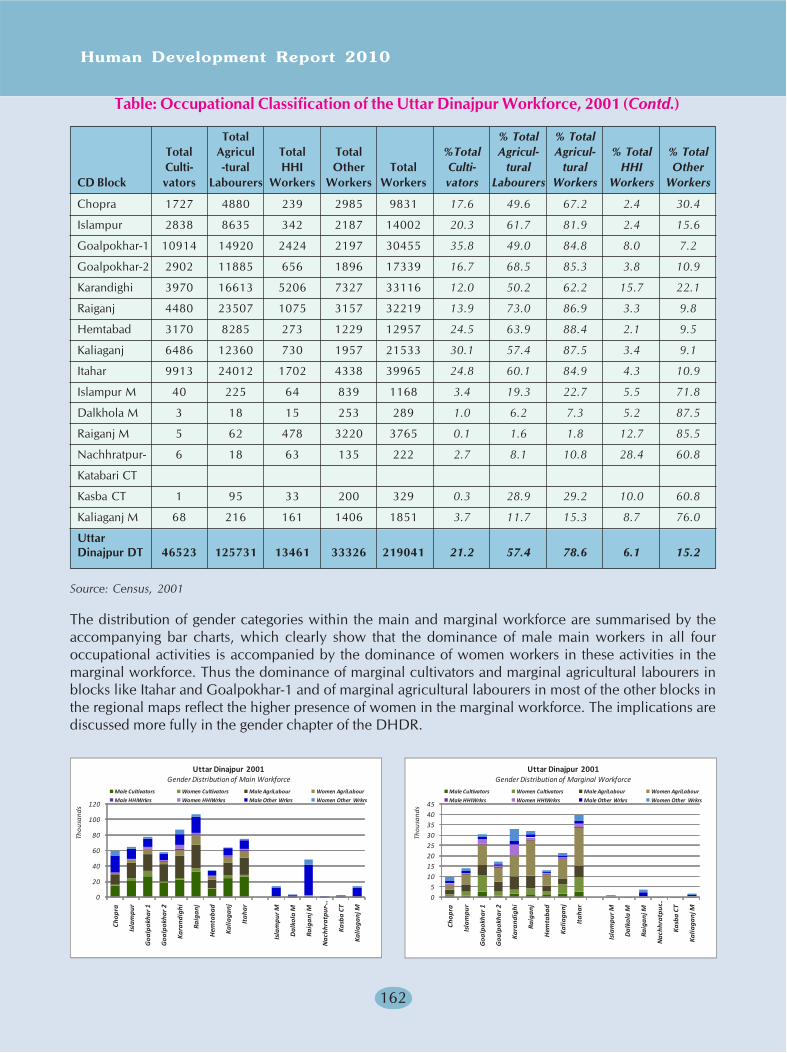
Human Development Report 2010
162
Table: Occupational Classification of the Uttar Dinajpur Workforce, 2001 (Contd.)
Total % Total % TotalTotal Agricul Total Total %Total Agricul- Agricul- % Total % TotalCulti- -tural HHI Other Total Culti- tural tural HHI Other
CD Block vators Labourers Workers Workers Workers vators Labourers Workers Workers Workers
Chopra 1727 4880 239 2985 9831 17.6 49.6 67.2 2.4 30.4
Islampur 2838 8635 342 2187 14002 20.3 61.7 81.9 2.4 15.6
Goalpokhar-1 10914 14920 2424 2197 30455 35.8 49.0 84.8 8.0 7.2
Goalpokhar-2 2902 11885 656 1896 17339 16.7 68.5 85.3 3.8 10.9
Karandighi 3970 16613 5206 7327 33116 12.0 50.2 62.2 15.7 22.1
Raiganj 4480 23507 1075 3157 32219 13.9 73.0 86.9 3.3 9.8
Hemtabad 3170 8285 273 1229 12957 24.5 63.9 88.4 2.1 9.5
Kaliaganj 6486 12360 730 1957 21533 30.1 57.4 87.5 3.4 9.1
Itahar 9913 24012 1702 4338 39965 24.8 60.1 84.9 4.3 10.9
Islampur M 40 225 64 839 1168 3.4 19.3 22.7 5.5 71.8
Dalkhola M 3 18 15 253 289 1.0 6.2 7.3 5.2 87.5
Raiganj M 5 62 478 3220 3765 0.1 1.6 1.8 12.7 85.5
Nachhratpur- 6 18 63 135 222 2.7 8.1 10.8 28.4 60.8
Katabari CT
Kasba CT 1 95 33 200 329 0.3 28.9 29.2 10.0 60.8
Kaliaganj M 68 216 161 1406 1851 3.7 11.7 15.3 8.7 76.0
UttarDinajpur DT 46523 125731 13461 33326 219041 21.2 57.4 78.6 6.1 15.2
Source: Census, 2001
The distribution of gender categories within the main and marginal workforce are summarised by theaccompanying bar charts, which clearly show that the dominance of male main workers in all fouroccupational activities is accompanied by the dominance of women workers in these activities in themarginal workforce. Thus the dominance of marginal cultivators and marginal agricultural labourers inblocks like Itahar and Goalpokhar-1 and of marginal agricultural labourers in most of the other blocks inthe regional maps reflect the higher presence of women in the marginal workforce. The implications arediscussed more fully in the gender chapter of the DHDR.
0
20
40
60
80
100
120
Chop
ra
Isla
mpu
r
Goa
lpok
har 1
Goa
lpok
har 2
Kara
ndig
hi
Raig
anj
Hem
taba
d
Kalia
ganj
Itah
ar
Isla
mpu
r M
Dal
kola
M
Raig
anj M
Nac
hhra
tpur
-…
Kasb
a CT
Kalia
ganj
M
Thou
sand
s
Male Cultivators Women Cultivators Male AgriLabour Women AgriLabour
Male HHIWrkrs Women HHIWrkrs Male Other Wrkrs Women Other Wrkrs
Uttar Dinajpur 2001Gender Distribution of Main Workforce
05
1015202530354045
Chop
ra
Isla
mpu
r
Goa
lpok
har 1
Goa
lpok
har 2
Kara
ndig
hi
Raig
anj
Hem
taba
d
Kalia
ganj
Itah
ar
Isla
mpu
r M
Dal
kola
M
Raig
anj M
Nac
hhra
tpur
…
Kasb
a CT
Kalia
ganj
M
Thou
sand
s
Male Cultivators Women Cultivators Male AgriLabour Women AgriLabour
Male HHIWrkrs Women HHIWrkrs Male Other Wrkrs Women Other Wrkrs
Uttar Dinajpur 2001Gender Distribution of Marginal Workforce
Uttar Dinajpur
163
Sectoral Workforce in Uttar Dinajpur
Although the overall WPR for rural workers in Uttar Dinajpur rose significantly from 35 to 38 percentbetween 1991-2001, the extent of main work participation declined from around 33 percent in 1991 toless than 30 percent in 2001. The apparent increase in rural work participation thus occurred principallybecause of escalation in the proportion of marginal workers from 1.9 percent of the rural workforce in1991 to over 8 percent in 2001. Since the aggregate size of the rural workforce also rose considerably inabsolute terms between 1991-2001, this would imply that a substantial proportion of the new entrants intothe Uttar Dinajpur rural workforce have only been able to find short term or casual work opportunities.Under such circumstances, the rise in overall rural WPR in the district suggests that the expansion in therural workforce and the entry of new workers has resulted from the intensification of livelihood pressuresin Uttar Dinajpur, rather than because of the expansion of livelihood opportunities overall.
Till 1991, the expansion of main work opportunities in Uttar Dinajpur had generally kept an even pacewith the growth of the rural workforce. As a result, out of the aggregate rural workforce of 5.86 lakhworkers in 1991, 94 percent were engaged as main workers in activities like cultivation (42.6%), agriculturallabour (38.3%), HHI industries (1.5%) and other non-farm work (11.6%), while only 6 percent had comprisedthe marginal workforce. With the sharp increase in the district population between 1991-2001 and theslow expansion of work opportunities, the size of the main workforce had shrunk to 75 percent of theaggregate rural workforce of 8.42 lakh, while another 14.9 percent were engaged as marginal workers.Thus while the aggregate workforce engaged in farm based activities rose to over 6.43 lakh, nearly 27percent of it comprised marginal workers. Similar declines in main work participation did not howeveroccur in non-farm activities. Main work participation in HHI activities almost doubled from 1.6 percent in1991 to around 3 percent in 2001, and rose from 12 percent to 22 percent over the same period in the caseof other non-farm activities.
Clearly, therefore, the alleviation of current rural livelihood pressures in the district requires either theintensification of multi-crop agriculture across all Uttar Dinajpur blocks, or alternatively the diversificationof rural non-farm livelihoods on a massive scale throughout the district. Neither alternative is easy toachieve. Agricultural intensification requires the provision of agricultural inputs like improved irrigation onan equally massive scale, as well as a shift to more labour intensive cropping patterns. The absolute limitsto this are obviously set by local agroclimatic and soil conditions and water resource endowments, as wellas by purely economic determinants such as the prevailing levels of agricultural wages and prices. Highwage levels may encourage farm mechanisation and trigger labour displacement, while low wage levelscan encourage increased labour engagement without commensurate improvements in rural incomes. Highprice levels can reduce the offtake in agricultural markets, while low price levels can render crop operationsunremunerative. Conversely, the diversification of non-farm activities requires triggers like acceleratedurbanisation as well as the provision of infrastructural amenities like improved access to roads and powerand markets, as well as to augmented credit facilities. Neither solution can be imposed from outside,without first reading the recent signals that have been emanating from the Uttar Dinajpur district economy.The core signals that need to be read pertain to the current disposition of farm based and non-farm activitiesacross the district.
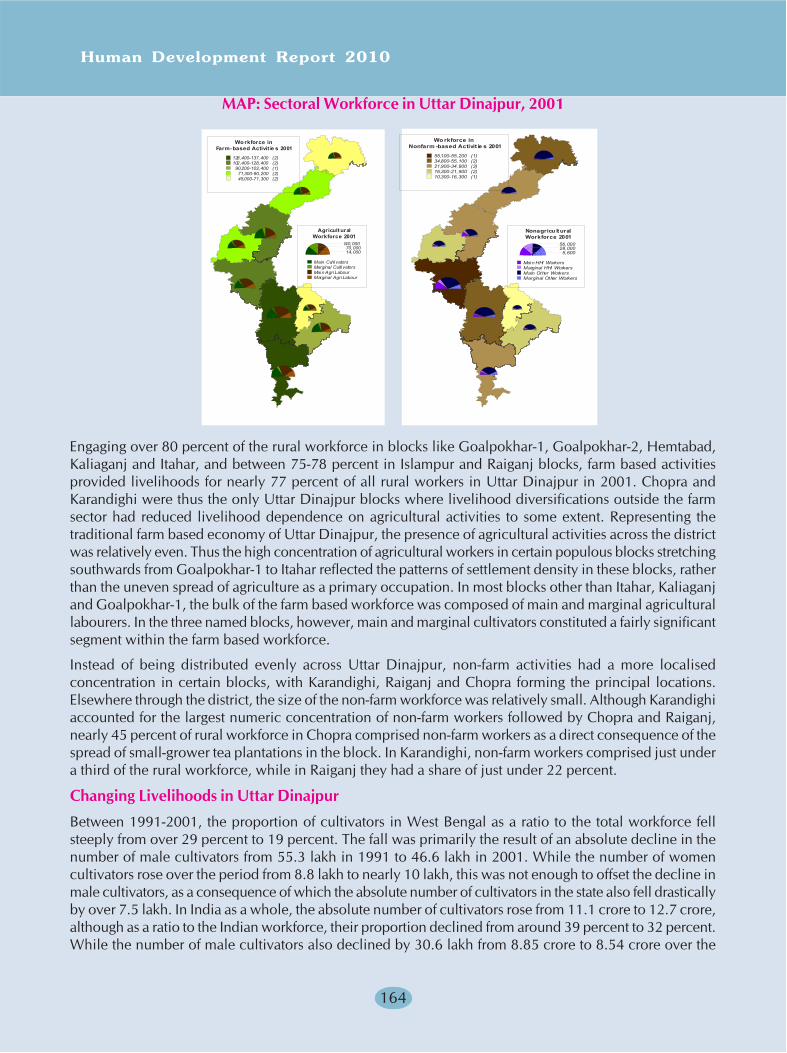
Human Development Report 2010
164
MAP: Sectoral Workforce in Uttar Dinajpur, 2001
Wo rkforce inFarm-based Activit ie s 2001
128 ,400-137,400 (2)102 ,400-128,400 (2)90,200-102,400 (1)71,300-90,200 (2)45,000-71,300 (2)
Agricult uralWorkforce 2001
140,00070,00014,000
Main Cul ti vatorsMarginal Culti vatorsMain Agri LabourMarginal Agri Labour
Wo rkforce inNonfarm -based Activit ie s 2001
55,100-55,200 (1)34,800-55,100 (2)21,900-34,800 (3)16,300-21,900 (2)10,300-16,300 (1)
Nonagricu lt uralWorkforce 2001
56,00028,000
5,600
Main HHI WorkersMarginal HHI WorkersMain Other WorkersMarginal Other Workers
Engaging over 80 percent of the rural workforce in blocks like Goalpokhar-1, Goalpokhar-2, Hemtabad,Kaliaganj and Itahar, and between 75-78 percent in Islampur and Raiganj blocks, farm based activitiesprovided livelihoods for nearly 77 percent of all rural workers in Uttar Dinajpur in 2001. Chopra andKarandighi were thus the only Uttar Dinajpur blocks where livelihood diversifications outside the farmsector had reduced livelihood dependence on agricultural activities to some extent. Representing thetraditional farm based economy of Uttar Dinajpur, the presence of agricultural activities across the districtwas relatively even. Thus the high concentration of agricultural workers in certain populous blocks stretchingsouthwards from Goalpokhar-1 to Itahar reflected the patterns of settlement density in these blocks, ratherthan the uneven spread of agriculture as a primary occupation. In most blocks other than Itahar, Kaliaganjand Goalpokhar-1, the bulk of the farm based workforce was composed of main and marginal agriculturallabourers. In the three named blocks, however, main and marginal cultivators constituted a fairly significantsegment within the farm based workforce.
Instead of being distributed evenly across Uttar Dinajpur, non-farm activities had a more localisedconcentration in certain blocks, with Karandighi, Raiganj and Chopra forming the principal locations.Elsewhere through the district, the size of the non-farm workforce was relatively small. Although Karandighiaccounted for the largest numeric concentration of non-farm workers followed by Chopra and Raiganj,nearly 45 percent of rural workforce in Chopra comprised non-farm workers as a direct consequence of thespread of small-grower tea plantations in the block. In Karandighi, non-farm workers comprised just undera third of the rural workforce, while in Raiganj they had a share of just under 22 percent.
Changing Livelihoods in Uttar Dinajpur
Between 1991-2001, the proportion of cultivators in West Bengal as a ratio to the total workforce fellsteeply from over 29 percent to 19 percent. The fall was primarily the result of an absolute decline in thenumber of male cultivators from 55.3 lakh in 1991 to 46.6 lakh in 2001. While the number of womencultivators rose over the period from 8.8 lakh to nearly 10 lakh, this was not enough to offset the decline inmale cultivators, as a consequence of which the absolute number of cultivators in the state also fell drasticallyby over 7.5 lakh. In India as a whole, the absolute number of cultivators rose from 11.1 crore to 12.7 crore,although as a ratio to the Indian workforce, their proportion declined from around 39 percent to 32 percent.While the number of male cultivators also declined by 30.6 lakh from 8.85 crore to 8.54 crore over the
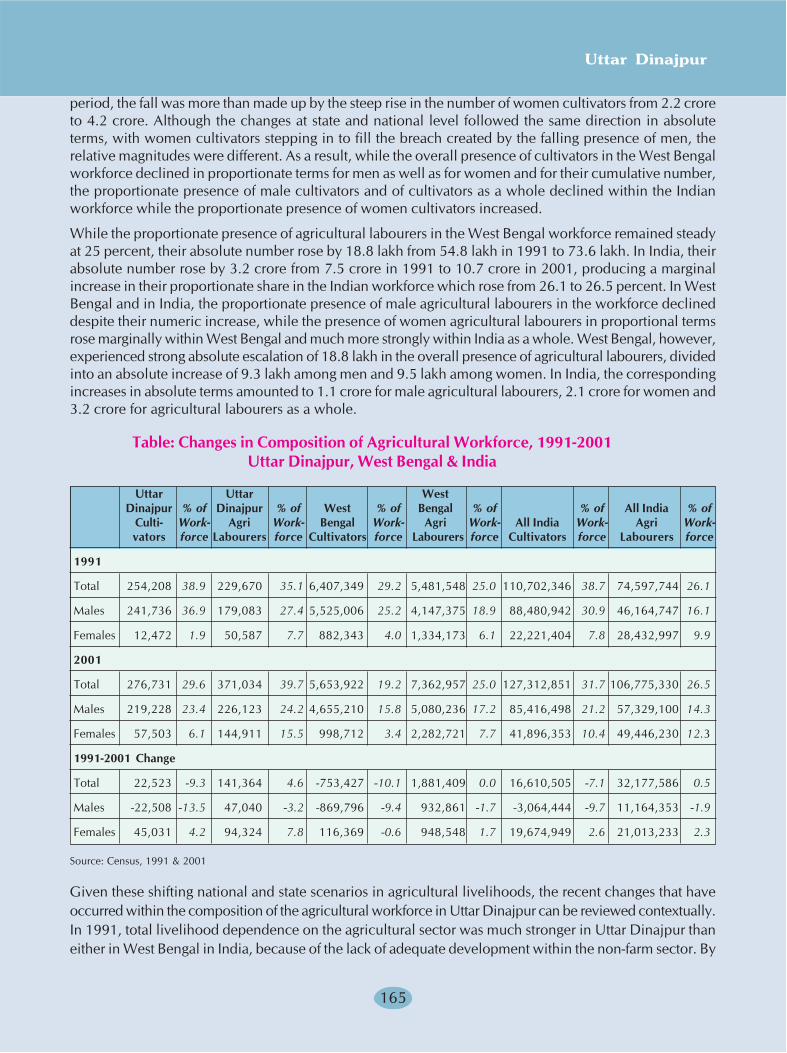
Uttar Dinajpur
165
period, the fall was more than made up by the steep rise in the number of women cultivators from 2.2 croreto 4.2 crore. Although the changes at state and national level followed the same direction in absoluteterms, with women cultivators stepping in to fill the breach created by the falling presence of men, therelative magnitudes were different. As a result, while the overall presence of cultivators in the West Bengalworkforce declined in proportionate terms for men as well as for women and for their cumulative number,the proportionate presence of male cultivators and of cultivators as a whole declined within the Indianworkforce while the proportionate presence of women cultivators increased.
While the proportionate presence of agricultural labourers in the West Bengal workforce remained steadyat 25 percent, their absolute number rose by 18.8 lakh from 54.8 lakh in 1991 to 73.6 lakh. In India, theirabsolute number rose by 3.2 crore from 7.5 crore in 1991 to 10.7 crore in 2001, producing a marginalincrease in their proportionate share in the Indian workforce which rose from 26.1 to 26.5 percent. In WestBengal and in India, the proportionate presence of male agricultural labourers in the workforce declineddespite their numeric increase, while the presence of women agricultural labourers in proportional termsrose marginally within West Bengal and much more strongly within India as a whole. West Bengal, however,experienced strong absolute escalation of 18.8 lakh in the overall presence of agricultural labourers, dividedinto an absolute increase of 9.3 lakh among men and 9.5 lakh among women. In India, the correspondingincreases in absolute terms amounted to 1.1 crore for male agricultural labourers, 2.1 crore for women and3.2 crore for agricultural labourers as a whole.
Table: Changes in Composition of Agricultural Workforce, 1991-2001Uttar Dinajpur, West Bengal & India
Uttar Uttar WestDinajpur % of Dinajpur % of West % of Bengal % of % of All India % of
Culti- Work- Agri Work- Bengal Work- Agri Work- All India Work- Agri Work-vators force Labourers force Cultivators force Labourers force Cultivators force Labourers force
1991
Total 254,208 38.9 229,670 35.1 6,407,349 29.2 5,481,548 25.0 110,702,346 38.7 74,597,744 26.1
Males 241,736 36.9 179,083 27.4 5,525,006 25.2 4,147,375 18.9 88,480,942 30.9 46,164,747 16.1
Females 12,472 1.9 50,587 7.7 882,343 4.0 1,334,173 6.1 22,221,404 7.8 28,432,997 9.9
2001
Total 276,731 29.6 371,034 39.7 5,653,922 19.2 7,362,957 25.0 127,312,851 31.7 106,775,330 26.5
Males 219,228 23.4 226,123 24.2 4,655,210 15.8 5,080,236 17.2 85,416,498 21.2 57,329,100 14.3
Females 57,503 6.1 144,911 15.5 998,712 3.4 2,282,721 7.7 41,896,353 10.4 49,446,230 12.3
1991-2001 Change
Total 22,523 -9.3 141,364 4.6 -753,427 -10.1 1,881,409 0.0 16,610,505 -7.1 32,177,586 0.5
Males -22,508 -13.5 47,040 -3.2 -869,796 -9.4 932,861 -1.7 -3,064,444 -9.7 11,164,353 -1.9
Females 45,031 4.2 94,324 7.8 116,369 -0.6 948,548 1.7 19,674,949 2.6 21,013,233 2.3
Source: Census, 1991 & 2001
Given these shifting national and state scenarios in agricultural livelihoods, the recent changes that haveoccurred within the composition of the agricultural workforce in Uttar Dinajpur can be reviewed contextually.In 1991, total livelihood dependence on the agricultural sector was much stronger in Uttar Dinajpur thaneither in West Bengal in India, because of the lack of adequate development within the non-farm sector. By
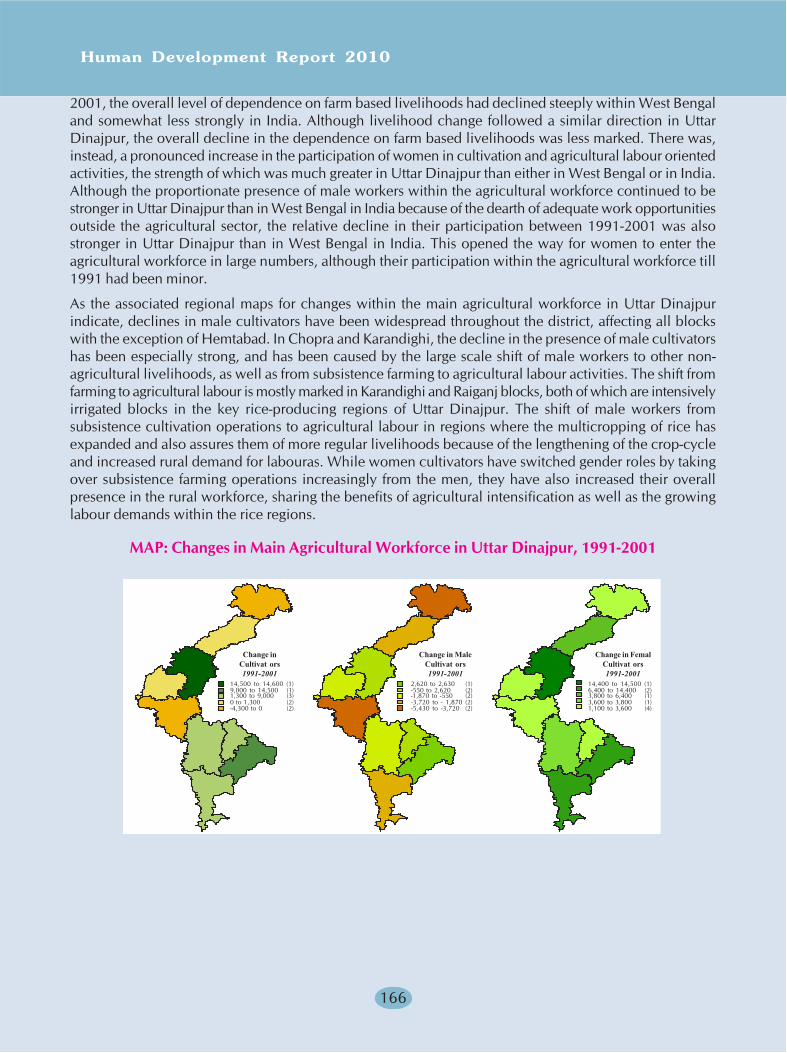
Human Development Report 2010
166
2001, the overall level of dependence on farm based livelihoods had declined steeply within West Bengaland somewhat less strongly in India. Although livelihood change followed a similar direction in UttarDinajpur, the overall decline in the dependence on farm based livelihoods was less marked. There was,instead, a pronounced increase in the participation of women in cultivation and agricultural labour orientedactivities, the strength of which was much greater in Uttar Dinajpur than either in West Bengal or in India.Although the proportionate presence of male workers within the agricultural workforce continued to bestronger in Uttar Dinajpur than in West Bengal in India because of the dearth of adequate work opportunitiesoutside the agricultural sector, the relative decline in their participation between 1991-2001 was alsostronger in Uttar Dinajpur than in West Bengal in India. This opened the way for women to enter theagricultural workforce in large numbers, although their participation within the agricultural workforce till1991 had been minor.
As the associated regional maps for changes within the main agricultural workforce in Uttar Dinajpurindicate, declines in male cultivators have been widespread throughout the district, affecting all blockswith the exception of Hemtabad. In Chopra and Karandighi, the decline in the presence of male cultivatorshas been especially strong, and has been caused by the large scale shift of male workers to other non-agricultural livelihoods, as well as from subsistence farming to agricultural labour activities. The shift fromfarming to agricultural labour is mostly marked in Karandighi and Raiganj blocks, both of which are intensivelyirrigated blocks in the key rice-producing regions of Uttar Dinajpur. The shift of male workers fromsubsistence cultivation operations to agricultural labour in regions where the multicropping of rice hasexpanded and also assures them of more regular livelihoods because of the lengthening of the crop-cycleand increased rural demand for labouras. While women cultivators have switched gender roles by takingover subsistence farming operations increasingly from the men, they have also increased their overallpresence in the rural workforce, sharing the benefits of agricultural intensification as well as the growinglabour demands within the rice regions.
MAP: Changes in Main Agricultural Workforce in Uttar Dinajpur, 1991-2001
Change inCultivat ors1991-2001
14,500 to 14,600 (1)9,000 to 14,500 (1)1,300 to 9,000 (3)0 to 1,300 (2)-4,300 to 0 (2)
Change in MaleCultivat ors1991-2001
2,620 to 2,630 (1)-550 to 2,620 (2)-1,870 to -550 (2)-3,720 to - 1,870 (2)-5,430 to -3,720 (2)
Change in FemalCultivat ors1991-2001
14,400 to 14,500 (1)6,400 to 14,400 (2)3,800 to 6,400 (1)3,600 to 3,800 (1)1,100 to 3,600 (4)
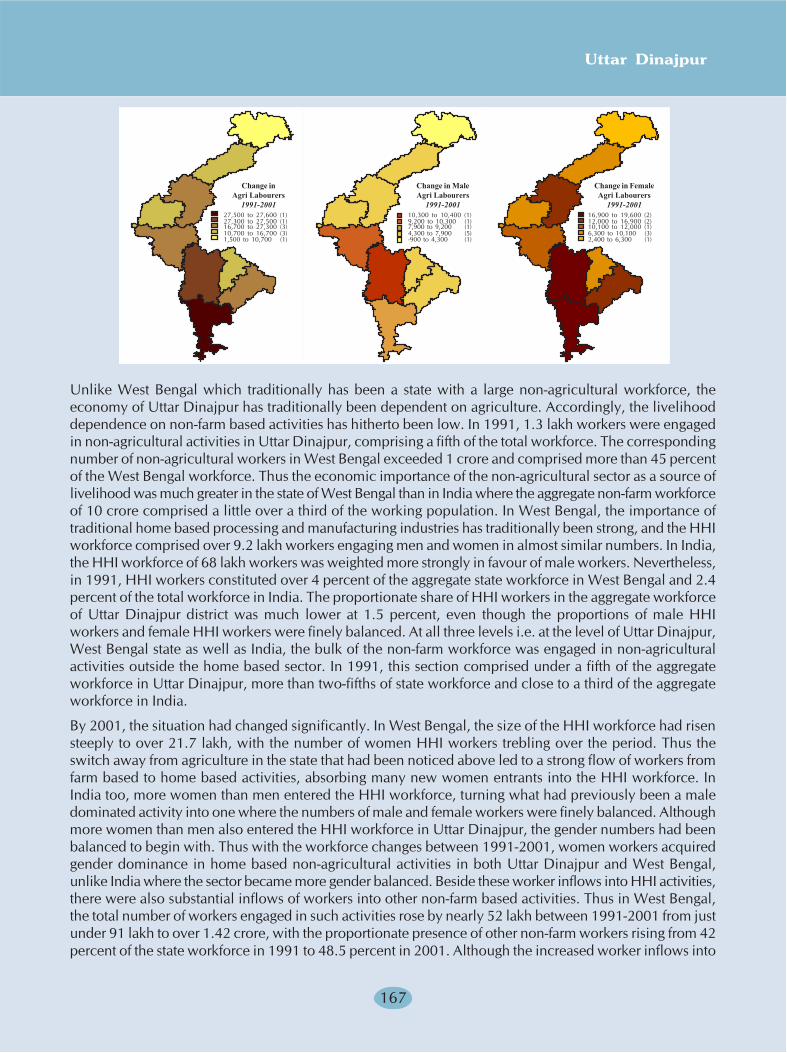
Uttar Dinajpur
167
Unlike West Bengal which traditionally has been a state with a large non-agricultural workforce, theeconomy of Uttar Dinajpur has traditionally been dependent on agriculture. Accordingly, the livelihooddependence on non-farm based activities has hitherto been low. In 1991, 1.3 lakh workers were engagedin non-agricultural activities in Uttar Dinajpur, comprising a fifth of the total workforce. The correspondingnumber of non-agricultural workers in West Bengal exceeded 1 crore and comprised more than 45 percentof the West Bengal workforce. Thus the economic importance of the non-agricultural sector as a source oflivelihood was much greater in the state of West Bengal than in India where the aggregate non-farm workforceof 10 crore comprised a little over a third of the working population. In West Bengal, the importance oftraditional home based processing and manufacturing industries has traditionally been strong, and the HHIworkforce comprised over 9.2 lakh workers engaging men and women in almost similar numbers. In India,the HHI workforce of 68 lakh workers was weighted more strongly in favour of male workers. Nevertheless,in 1991, HHI workers constituted over 4 percent of the aggregate state workforce in West Bengal and 2.4percent of the total workforce in India. The proportionate share of HHI workers in the aggregate workforceof Uttar Dinajpur district was much lower at 1.5 percent, even though the proportions of male HHIworkers and female HHI workers were finely balanced. At all three levels i.e. at the level of Uttar Dinajpur,West Bengal state as well as India, the bulk of the non-farm workforce was engaged in non-agriculturalactivities outside the home based sector. In 1991, this section comprised under a fifth of the aggregateworkforce in Uttar Dinajpur, more than two-fifths of state workforce and close to a third of the aggregateworkforce in India.
By 2001, the situation had changed significantly. In West Bengal, the size of the HHI workforce had risensteeply to over 21.7 lakh, with the number of women HHI workers trebling over the period. Thus theswitch away from agriculture in the state that had been noticed above led to a strong flow of workers fromfarm based to home based activities, absorbing many new women entrants into the HHI workforce. InIndia too, more women than men entered the HHI workforce, turning what had previously been a maledominated activity into one where the numbers of male and female workers were finely balanced. Althoughmore women than men also entered the HHI workforce in Uttar Dinajpur, the gender numbers had beenbalanced to begin with. Thus with the workforce changes between 1991-2001, women workers acquiredgender dominance in home based non-agricultural activities in both Uttar Dinajpur and West Bengal,unlike India where the sector became more gender balanced. Beside these worker inflows into HHI activities,there were also substantial inflows of workers into other non-farm based activities. Thus in West Bengal,the total number of workers engaged in such activities rose by nearly 52 lakh between 1991-2001 from justunder 91 lakh to over 1.42 crore, with the proportionate presence of other non-farm workers rising from 42percent of the state workforce in 1991 to 48.5 percent in 2001. Although the increased worker inflows into
Change in FemaleAgri Labourers1991-2001
16,900 to 19,600 (2)12,000 to 16,900 (2)10,100 to 12,000 (1)6,300 to 10,100 (3)2,400 to 6,300 (1)
Change inAgri Labourers1991-2001
27,500 to 27,600 (1)27,300 to 27,500 (1)16,700 to 27,300 (3)10,700 to 16,700 (3)1,500 to 10,700 (1)
Change in MaleAgri Labourers1991-2001
10,300 to 10,400 (1)9,200 to 10,300 (1)7,900 to 9,200 (1)4,300 to 7,900 (5)-900 to 4,300 (1)
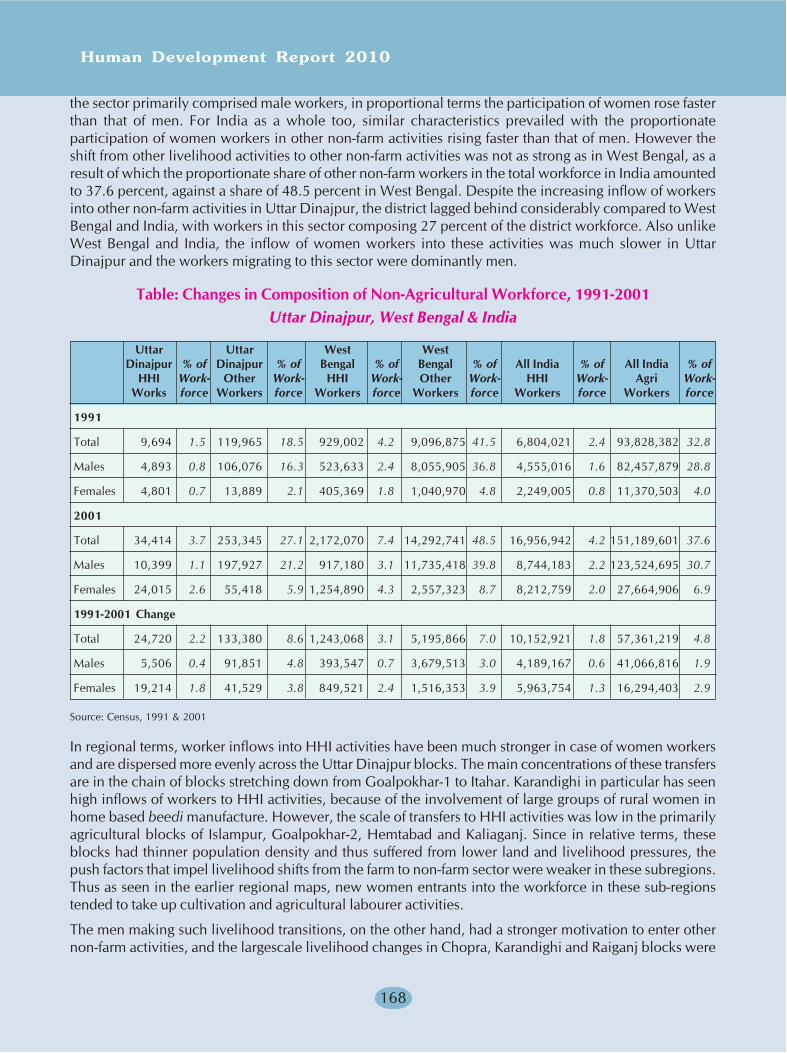
Human Development Report 2010
168
the sector primarily comprised male workers, in proportional terms the participation of women rose fasterthan that of men. For India as a whole too, similar characteristics prevailed with the proportionateparticipation of women workers in other non-farm activities rising faster than that of men. However theshift from other livelihood activities to other non-farm activities was not as strong as in West Bengal, as aresult of which the proportionate share of other non-farm workers in the total workforce in India amountedto 37.6 percent, against a share of 48.5 percent in West Bengal. Despite the increasing inflow of workersinto other non-farm activities in Uttar Dinajpur, the district lagged behind considerably compared to WestBengal and India, with workers in this sector composing 27 percent of the district workforce. Also unlikeWest Bengal and India, the inflow of women workers into these activities was much slower in UttarDinajpur and the workers migrating to this sector were dominantly men.
Table: Changes in Composition of Non-Agricultural Workforce, 1991-2001Uttar Dinajpur, West Bengal & India
Uttar Uttar West WestDinajpur % of Dinajpur % of Bengal % of Bengal % of All India % of All India % of
HHI Work- Other Work- HHI Work- Other Work- HHI Work- Agri Work-Works force Workers force Workers force Workers force Workers force Workers force
1991
Total 9,694 1.5 119,965 18.5 929,002 4.2 9,096,875 41.5 6,804,021 2.4 93,828,382 32.8
Males 4,893 0.8 106,076 16.3 523,633 2.4 8,055,905 36.8 4,555,016 1.6 82,457,879 28.8
Females 4,801 0.7 13,889 2.1 405,369 1.8 1,040,970 4.8 2,249,005 0.8 11,370,503 4.0
2001
Total 34,414 3.7 253,345 27.1 2,172,070 7.4 14,292,741 48.5 16,956,942 4.2 151,189,601 37.6
Males 10,399 1.1 197,927 21.2 917,180 3.1 11,735,418 39.8 8,744,183 2.2 123,524,695 30.7
Females 24,015 2.6 55,418 5.9 1,254,890 4.3 2,557,323 8.7 8,212,759 2.0 27,664,906 6.9
1991-2001 Change
Total 24,720 2.2 133,380 8.6 1,243,068 3.1 5,195,866 7.0 10,152,921 1.8 57,361,219 4.8
Males 5,506 0.4 91,851 4.8 393,547 0.7 3,679,513 3.0 4,189,167 0.6 41,066,816 1.9
Females 19,214 1.8 41,529 3.8 849,521 2.4 1,516,353 3.9 5,963,754 1.3 16,294,403 2.9
Source: Census, 1991 & 2001
In regional terms, worker inflows into HHI activities have been much stronger in case of women workersand are dispersed more evenly across the Uttar Dinajpur blocks. The main concentrations of these transfersare in the chain of blocks stretching down from Goalpokhar-1 to Itahar. Karandighi in particular has seenhigh inflows of workers to HHI activities, because of the involvement of large groups of rural women inhome based beedi manufacture. However, the scale of transfers to HHI activities was low in the primarilyagricultural blocks of Islampur, Goalpokhar-2, Hemtabad and Kaliaganj. Since in relative terms, theseblocks had thinner population density and thus suffered from lower land and livelihood pressures, thepush factors that impel livelihood shifts from the farm to non-farm sector were weaker in these subregions.Thus as seen in the earlier regional maps, new women entrants into the workforce in these sub-regionstended to take up cultivation and agricultural labourer activities.
The men making such livelihood transitions, on the other hand, had a stronger motivation to enter othernon-farm activities, and the largescale livelihood changes in Chopra, Karandighi and Raiganj blocks were
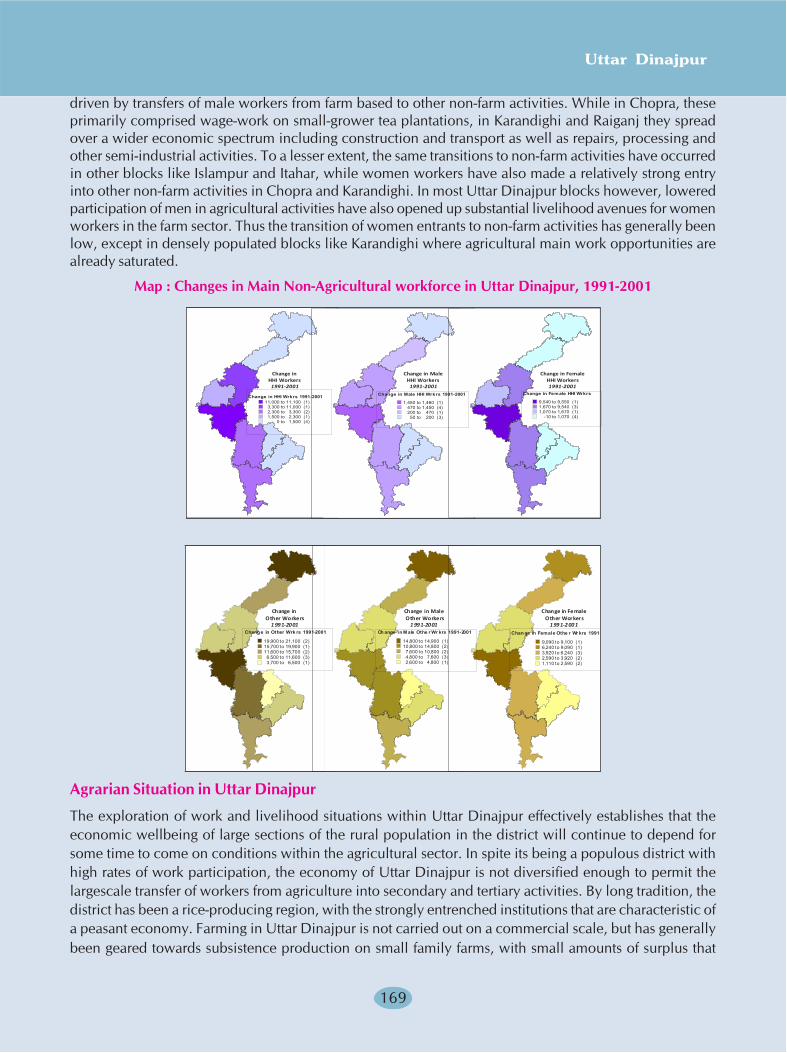
Uttar Dinajpur
169
driven by transfers of male workers from farm based to other non-farm activities. While in Chopra, theseprimarily comprised wage-work on small-grower tea plantations, in Karandighi and Raiganj they spreadover a wider economic spectrum including construction and transport as well as repairs, processing andother semi-industrial activities. To a lesser extent, the same transitions to non-farm activities have occurredin other blocks like Islampur and Itahar, while women workers have also made a relatively strong entryinto other non-farm activities in Chopra and Karandighi. In most Uttar Dinajpur blocks however, loweredparticipation of men in agricultural activities have also opened up substantial livelihood avenues for womenworkers in the farm sector. Thus the transition of women entrants to non-farm activities has generally beenlow, except in densely populated blocks like Karandighi where agricultural main work opportunities arealready saturated.
Map : Changes in Main Non-Agricultural workforce in Uttar Dinajpur, 1991-2001
Chang e in Other Wrk rs 1991-2001
19,900 to 21,100 (2)15,700 to 19,900 (1)11,600 to 15,700 (2)6,500 to 11,600 (3)3,700 to 6,500 (1)
Ch ange in M ale Othe r Wr krs 1991-2001
14,800 to 14,900 (1)10,800 to 14,800 (2)7,600 to 10,800 (2)4,800 to 7,600 (3)2,600 to 4,800 (1)
Chan ge in Female Othe r Wr krs 1991-
9,090 to 9,100 (1)6,240 to 9,090 (1)3,920 to 6,240 (3)2,590 to 3,920 (2)1,110 to 2,590 (2)
Change in Change in Male Change in Fe maleOther Worke rs Other Worke rs Other Workers
1991-2001 1 991-2001 199 1-2 00 1
Agrarian Situation in Uttar Dinajpur
The exploration of work and livelihood situations within Uttar Dinajpur effectively establishes that theeconomic wellbeing of large sections of the rural population in the district will continue to depend forsome time to come on conditions within the agricultural sector. In spite its being a populous district withhigh rates of work participation, the economy of Uttar Dinajpur is not diversified enough to permit thelargescale transfer of workers from agriculture into secondary and tertiary activities. By long tradition, thedistrict has been a rice-producing region, with the strongly entrenched institutions that are characteristic ofa peasant economy. Farming in Uttar Dinajpur is not carried out on a commercial scale, but has generallybeen geared towards subsistence production on small family farms, with small amounts of surplus that
Change in HHI Wrkrs 1991-200111,000 to 11,100 (1)
3,300 to 11,000 (1)2,300 to 3,300 (2)1,500 to 2,300 (1)
0 to 1,500 (4)
Change in Male HHI Wrkrs 1991-2001
1,450 to 1,460 (1)470 to 1,450 (4)200 to 470 (1)50 to 200 (3)
Change in Female HHI Wrkrs
9,540 to 9,550 (1)1,670 to 9,540 (3)1,070 to 1,670 (1)
-10 to 1,070 (4)
Change in Change in Male Change in FemaleHHI Workers HHI Workers HHI Workers
1991-2001 1991-2001 1991-2001
Human Development Report 2010
170
enter the marketing chain through the widespread network of primary rural haats and other assemblymarkets. Nevertheless, the migration into Uttar Dinajpur of cultivators endowed with a superior set of landmanagement skills, drawn in initially by easy prospects of securing land on purchase or lease, and morelately by the growing accessibility of groundwater based irrigation on a sizeable scale has gradually alteredthe institutional character of agriculture in the district. Stabilisation of land relations through the recordingof barga tenancies, which has controlled the problem of tenant evictions, has also strengthened the stakesfor agricultural advancement in the district.
The rapid spread of boro rice cultivation through Uttar Dinajpur, despite its being a relatively late arrival inNorth Bengal, offers a strong instance of the vast potential for agriculture based development that still existswithin the district. Grown as a commercial rice crop under entirely irrigated conditions by farmers with astrong entrepreneurial response, the spread of boro cultivation has been accelerated by the institution ofunrecorded seasonal tenancies which allows small farmers with private access to groundwater irrigationto expand their operational holdings by leasing in unused lands from farmers around them for the intendedduration of the boro season. Data from the Agricultural Census 2000-01 show for instance that nearly 97percent of the cultivators who operate partly leased-in agricultural holdings in Uttar Dinajpur belong to thesmall and marginal farmer groups, collectively accounting for about three-fourths of the land acquired onpartial tenancies. This enables marginal farmers with an average ownership holding of 0.41ha to expandtheir agricultural operations over an average operational holding to 0.73ha. Small farmers with an averageownership holding of 1.2ha comprise around 18 percent of the cultivators who operate partially tenantedholdings, but collectively lease-in nearly 28 percent of the land held on partial tenancy. This enables themto extend agricultural operations over a total area exceeding 1.8ha. The accessibility of land through tenancyin various forms from indigenous farmers who either lack the entrepreneurship or the financial means tomount intensive agricultural operations involving the growing of marketable crops has been one of theprime reasons for the migration of outside agriculturists into the rural areas of Uttar Dinajpur.
However, the potential for agricultural advancement is not distributed uniformly throughout Uttar Dinajpur.The net area available for cultivation varies considerably between the blocks, partly reflecting relativevariations in block-size, and also regional variations in land capability and land use. As stated earlier, thealluvial plains in Karandighi and Raiganj SD have higher land capability than the other blocks in theIslampur SD terai. Collectively, the alluvial blocks account for around 55 percent of the net cultivable area[NCA] and net sown area [NSA] in Uttar Dinajpur, but hold nearly 60 percent of the gross cropped area[GCA] available for multiple cropping and over three-fourths of the irrigated GCA. In contrast, the otherIslampur SD blocks face greater agricultural constraints in the form of low NCA and NSA and limitedirrigation access, lowering the overall potential for agricultural expansion. Favourable agrarian conditionsin the alluvial region also favour the prospects for agricultural livelihoods. Thus the five Uttar Dinajpurblocks stretching from Karandighi to Itahar collectively account for nearly 59 percent of the district’s cultivatorsand over 63 percent of Uttar Dinajpur’s agricultural labourers.

Uttar Dinajpur
171
Table: Land, Labour & Agricultural Productivity Relations in Uttar Dinajpur
NCA GCA Irri GCA NSAIrrigated NCA per per Agri per Agri per Agri per Agri
2001 NCA NSA GCA GCA capita Worker Worker Worker WorkerCD Block Population [ha] [ha] [ha] [ha] [ha] [ha] [ha] [ha] [ha]
Chopra 223022 26711 26686 45002 3680 0.120 0.691 1.164 0.095 0.690
Islampur 241951 24910 24868 44431 7542 0.103 0.416 0.741 0.126 0.415
Goalpokhar-1 245430 33102 32916 57246 11491 0.135 0.376 0.651 0.131 0.374
Goalpokhar-2 226472 26879 26647 52384 29639 0.119 0.437 0.851 0.481 0.433
Karandighi 304986 28356 27788 62150 36189 0.093 0.346 0.759 0.442 0.339
Raiganj 347108 37027 36904 77952 47275 0.107 0.340 0.717 0.435 0.339
Hemtabad 118822 13513 13490 28760 13921 0.114 0.345 0.734 0.355 0.344
Kaliaganj 190019 26616 26348 54331 24811 0.140 0.372 0.760 0.347 0.369
Itahar 249541 30739 30636 56857 38258 0.123 0.326 0.602 0.405 0.325
U Dinajpur 2147351 247853 246283 479113 212806 0.115 0.385 0.744 0.331 0.383Rural
2001 Labour Labour Total Total Rice Avg Rice2001 Total per ha per ha Rice Rice Sown Rice Yield in
2001 Agri Agri NCA NCA Area Output ha/Agri Yield kg/AgriCD Block Cultivators Labour Workers Cultivators Agri [ha] [MT] Worker kg/ha Worker
Labour
Chopra 18273 20376 38649 0.684 0.763 24260 45961 0.628 1895 1189
Islampur 27763 32182 59945 1.115 1.292 25635 45725 0.428 1784 763
Goalpokhar-1 45526 42403 87929 1.375 1.281 31010 72272 0.353 2331 822
Goalpokhar-2 23237 38341 61578 0.865 1.426 23885 58645 0.388 2455 952
Karandighi 29332 52578 81910 1.034 1.854 45480 128390 0.555 2823 1567
Raiganj 42373 66388 108761 1.144 1.793 44040 109970 0.405 2497 1011
Hemtabad 14974 24192 39166 1.108 1.790 19615 51145 0.501 2607 1306
Kaliaganj 34487 37013 71500 1.296 1.391 39240 88820 0.549 2264 1242
Itahar 39361 55029 94390 1.280 1.790 42455 98915 0.450 2330 1048
U Dinajpur 275326 368502 643828 1.111 1.487 295620 699843 0.459 2367 1087Rural
Source: Complied from Census 2001, Agricultural Census 2001, & BAE&S, GoWB
Pro rata land availability ratios give further indication of the differences in regional agricultural potentialwithin Uttar Dinajpur. Throughout the alluvial blocks, the net availability of cultivable land is low in percapita terms because of relatively high density of settlement, and does not exceed 0.37ha per agriculturalworker (i.e. in ratio to the sum of cultivators + agricultural labourers). In the northern blocks in comparison,the ratio of NCA per agricultural worker uniformly exceeds 0.38ha, rising to 0.69ha per worker in Chopra.However, despite the apparent human crowding on agricultural lands in the alluvial tract, the GCA perworker uniformly surpasses 0.72ha in each block in this region, with the exception of Itahar where thepopulation pressure on agricultural land is very high. Coupled with better irrigation conditions that renderintensive multiple cropping possible, the labour absorption capacity of cultivable lands in the alluvial tractis much higher than in the terai tract. Of the average GCA surpassing 0.72ha per worker in all alluvial
Human Development Report 2010
172
blocks except Itahar, more than 0.4ha per worker is irrigated throughout this tract. Hence the net sownareas per agricultural worker remain uniformly high, touching 98-99 percent of the NCA per workerthroughout the alluvial region. Since the cropping intensity (i.e. the ratio of gross cropped land to netcropped land) exceeds 200 percent in all alluvial blocks with the exception of Itahar, the total availability ofagricultural work in this region greatly surpasses that in the terai, with the added advantage of beingavailable for a longer duration through the year because of intensive multiple cropping. Itahar is the onlyalluvial block that has begun to show agrarian stress, not because the land is less productive but becausethe pressure of labour on land is too high.
Since rice is the principal crop of the district, an illustrative analysis may be made of the characteristicreturns from rice cultivation in the alluvial and terai blocks. Each hectare of agricultural land in the alluvialregion supports between 1-1.3 main cultivators, in addition to which it absorbs between 1.4 (Kaliaganj) to1.9 (Karandighi) hired main agricultural labourers per ha. Agriculture in the alluvial region thus offerslivelihood support to 2.5-3 agricultural workers per ha, which is considerably higher than in the terai tract.Averaging the annual returns from rice cultivation on these land and labour ratios through all paddy seasonsin 2004, the rice area sown per agricultural worker ranges between 0.41-0.56ha throughout the alluvialblocks despite the fact that the agricultural workforce here s much larger. Sown areas under rice are unevenin the terai blocks, and also reflect less favourable agricultural conditions. In Chopra for instance, wherethe rice area sown per agricultural worker appears favourable and surpasses 0.7ha, the extent of irrigationis minimal. The annual rice productivity per ha is uniformly higher in the alluvial region, and the productivityper agricultural worker is also uniformly high, despite there being many more workers drawing agriculturallivelihoods per hectare of land.
The analysis of land, labour and agricultural productivity in Uttar Dinajpur thus helps to pinpoint certainissues that are critical to livelihood concerns. Agriculture continues to absorb the overwhelming mass ofrural workers in the district. However unlike the alluvial region where the returns from agricultural operationsare also commensurate to high labour engagement, thus offering main work opportunities for a considerablepart of the year, high labour engagement in agriculture in the terai blocks occurs because of the lack ofeconomic alternatives. Chopra offers a notable instance where the advent of BLF tea factories caused animmediate switchover to small-grower tea plantations. While the switchover to tea in Chopra was mainlyfrom horticultural crops like pineapples and also reflected other unfavourable land features such astopography, the subsequent spread of small-grower plantations southwards into Islampur and Goalpokhar-1 blocks indicates that seasonal crop-farming operations throughout Islampur SD can come under similarcommercial pressure from perennial plantation crops. While making apparent economic sense to thelandowners, these real costs of such switchovers need to be measured in terms of the reduced labourabsorption capacity of plantation land and the largescale displacement of marginal farmers and landlessagricultural workers that would result. The marginal quality of farmland in the terai is evident in the smallerproportionate extent of NCA and the spread of 228ha of forest tracts and 117ha of unculturable wastelandthrough Chopra and Islamput blocks. Unless major irrigation projects like the Tista Barrage Project [TBP]canals can create an agricultural turnaround similar to the one that has occurred with the introduction ofthe boro crop in the southern blocks of Uttar Dinajpur, livelihood situations in Islampur SD will remainsubject to the seasonal swings that produce periodic outmigration outside the region.
Land Distribution & Land ReformsThe process of institutional reforms through which power has devolved to primary, secondary and tertiaryPanchayati Raj institutions in West Bengal was preceded by effective agrarian reforms that loosened thegrip of rural elites over the local governance system, securing rightful representation for the small peasantsand landless cultivators who actually tilled the land. The package of agrarian reforms implemented vigorouslyfrom 1978 onwards provided for strict implementation of ceiling regulations under the West Bengal LandReforms Act [WBLRA] of 1955 coupled with the redistribution of ceiling-surplus vested lands to the landless,
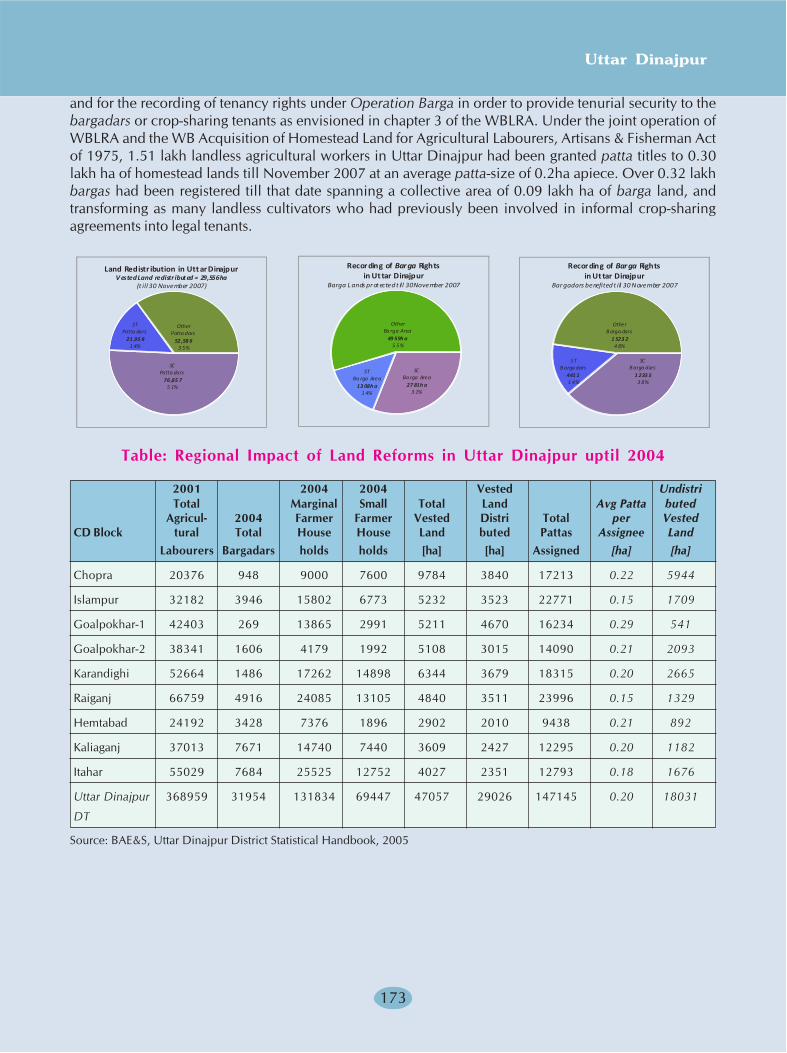
Uttar Dinajpur
173
and for the recording of tenancy rights under Operation Barga in order to provide tenurial security to thebargadars or crop-sharing tenants as envisioned in chapter 3 of the WBLRA. Under the joint operation ofWBLRA and the WB Acquisition of Homestead Land for Agricultural Labourers, Artisans & Fisherman Actof 1975, 1.51 lakh landless agricultural workers in Uttar Dinajpur had been granted patta titles to 0.30lakh ha of homestead lands till November 2007 at an average patta-size of 0.2ha apiece. Over 0.32 lakhbargas had been registered till that date spanning a collective area of 0.09 lakh ha of barga land, andtransforming as many landless cultivators who had previously been involved in informal crop-sharingagreements into legal tenants.
SC Patta dars
76 ,85 75 1%
ST Patta dars
21 ,95 81 4%
Other Patta dars
52 ,58 63 5%
Land Redistr ibution in Utt ar DinajpurV ested Land redistr ibuted = 29,556ha
(t ill 30 November 2007)
SC Ba rga Area
27 81h a3 1%
ST Ba rga Area
13 08h a1 4%
Other Ba rga Area
49 59h a5 5%
Recording of Barga Rights in Ut tar Dinajpur
Barga L ands pr ot ected t ill 30 November 2007
SC B arga dars
1 233 53 8%
ST Barga dars
441 11 4%
Other B arga dars
1 523 24 8%
Recording of Barga Rights in Ut tar Dinajpur
Bar gadars benefited t ill 30 November 2007
Table: Regional Impact of Land Reforms in Uttar Dinajpur uptil 2004
2001 2004 2004 Vested UndistriTotal Marginal Small Total Land Avg Patta buted
Agricul- 2004 Farmer Farmer Vested Distri Total per VestedCD Block tural Total House House Land buted Pattas Assignee Land
Labourers Bargadars holds holds [ha] [ha] Assigned [ha] [ha]
Chopra 20376 948 9000 7600 9784 3840 17213 0.22 5944
Islampur 32182 3946 15802 6773 5232 3523 22771 0.15 1709
Goalpokhar-1 42403 269 13865 2991 5211 4670 16234 0.29 541
Goalpokhar-2 38341 1606 4179 1992 5108 3015 14090 0.21 2093
Karandighi 52664 1486 17262 14898 6344 3679 18315 0.20 2665
Raiganj 66759 4916 24085 13105 4840 3511 23996 0.15 1329
Hemtabad 24192 3428 7376 1896 2902 2010 9438 0.21 892
Kaliaganj 37013 7671 14740 7440 3609 2427 12295 0.20 1182
Itahar 55029 7684 25525 12752 4027 2351 12793 0.18 1676
Uttar Dinajpur 368959 31954 131834 69447 47057 29026 147145 0.20 18031
DT
Source: BAE&S, Uttar Dinajpur District Statistical Handbook, 2005
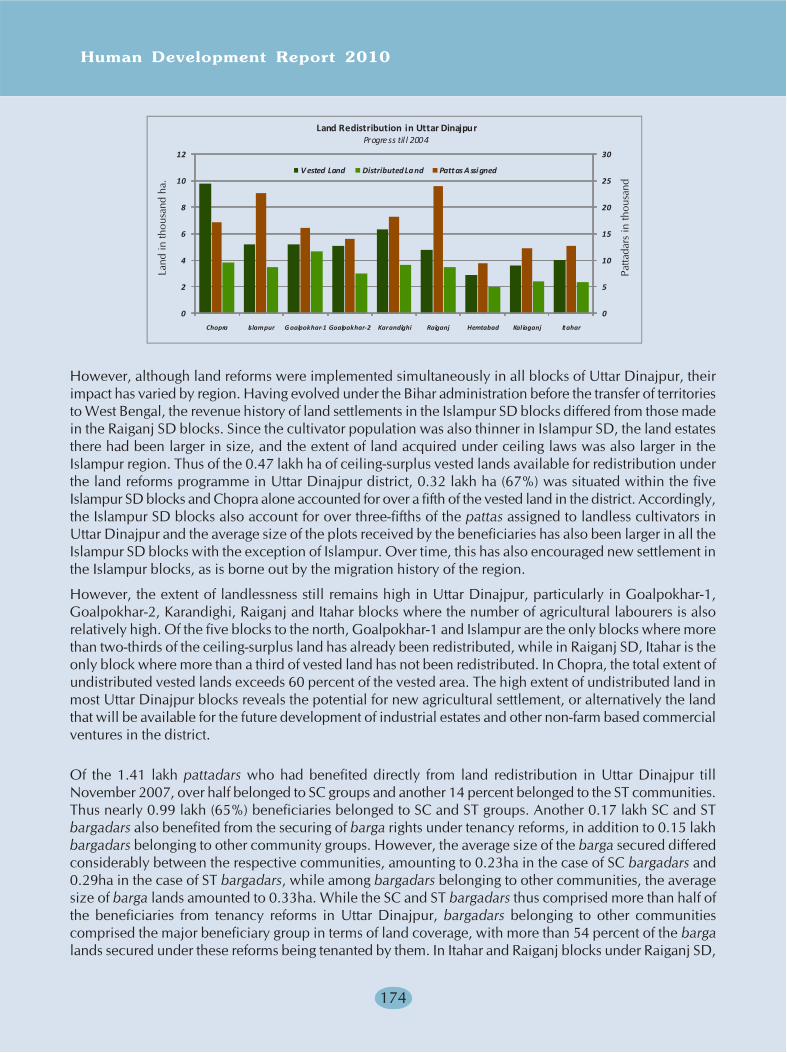
Human Development Report 2010
174
0
5
10
15
20
25
30
0
2
4
6
8
10
12
Chopra Islampur G oalpokhar-1 Goalpokhar-2 Karandighi Raiganj Hemtabad Kaliaganj Itahar
V ested Land Distributed Land Pattas A ssi gned
Land Redistribution in Uttar DinajpurProgress til l 2004
However, although land reforms were implemented simultaneously in all blocks of Uttar Dinajpur, theirimpact has varied by region. Having evolved under the Bihar administration before the transfer of territoriesto West Bengal, the revenue history of land settlements in the Islampur SD blocks differed from those madein the Raiganj SD blocks. Since the cultivator population was also thinner in Islampur SD, the land estatesthere had been larger in size, and the extent of land acquired under ceiling laws was also larger in theIslampur region. Thus of the 0.47 lakh ha of ceiling-surplus vested lands available for redistribution underthe land reforms programme in Uttar Dinajpur district, 0.32 lakh ha (67%) was situated within the fiveIslampur SD blocks and Chopra alone accounted for over a fifth of the vested land in the district. Accordingly,the Islampur SD blocks also account for over three-fifths of the pattas assigned to landless cultivators inUttar Dinajpur and the average size of the plots received by the beneficiaries has also been larger in all theIslampur SD blocks with the exception of Islampur. Over time, this has also encouraged new settlement inthe Islampur blocks, as is borne out by the migration history of the region.
However, the extent of landlessness still remains high in Uttar Dinajpur, particularly in Goalpokhar-1,Goalpokhar-2, Karandighi, Raiganj and Itahar blocks where the number of agricultural labourers is alsorelatively high. Of the five blocks to the north, Goalpokhar-1 and Islampur are the only blocks where morethan two-thirds of the ceiling-surplus land has already been redistributed, while in Raiganj SD, Itahar is theonly block where more than a third of vested land has not been redistributed. In Chopra, the total extent ofundistributed vested lands exceeds 60 percent of the vested area. The high extent of undistributed land inmost Uttar Dinajpur blocks reveals the potential for new agricultural settlement, or alternatively the landthat will be available for the future development of industrial estates and other non-farm based commercialventures in the district.
Of the 1.41 lakh pattadars who had benefited directly from land redistribution in Uttar Dinajpur tillNovember 2007, over half belonged to SC groups and another 14 percent belonged to the ST communities.Thus nearly 0.99 lakh (65%) beneficiaries belonged to SC and ST groups. Another 0.17 lakh SC and STbargadars also benefited from the securing of barga rights under tenancy reforms, in addition to 0.15 lakhbargadars belonging to other community groups. However, the average size of the barga secured differedconsiderably between the respective communities, amounting to 0.23ha in the case of SC bargadars and0.29ha in the case of ST bargadars, while among bargadars belonging to other communities, the averagesize of barga lands amounted to 0.33ha. While the SC and ST bargadars thus comprised more than half ofthe beneficiaries from tenancy reforms in Uttar Dinajpur, bargadars belonging to other communitiescomprised the major beneficiary group in terms of land coverage, with more than 54 percent of the bargalands secured under these reforms being tenanted by them. In Itahar and Raiganj blocks under Raiganj SD,
Land
in th
ousa
nd h
a.
Patta
dars
in th
ousa
nd
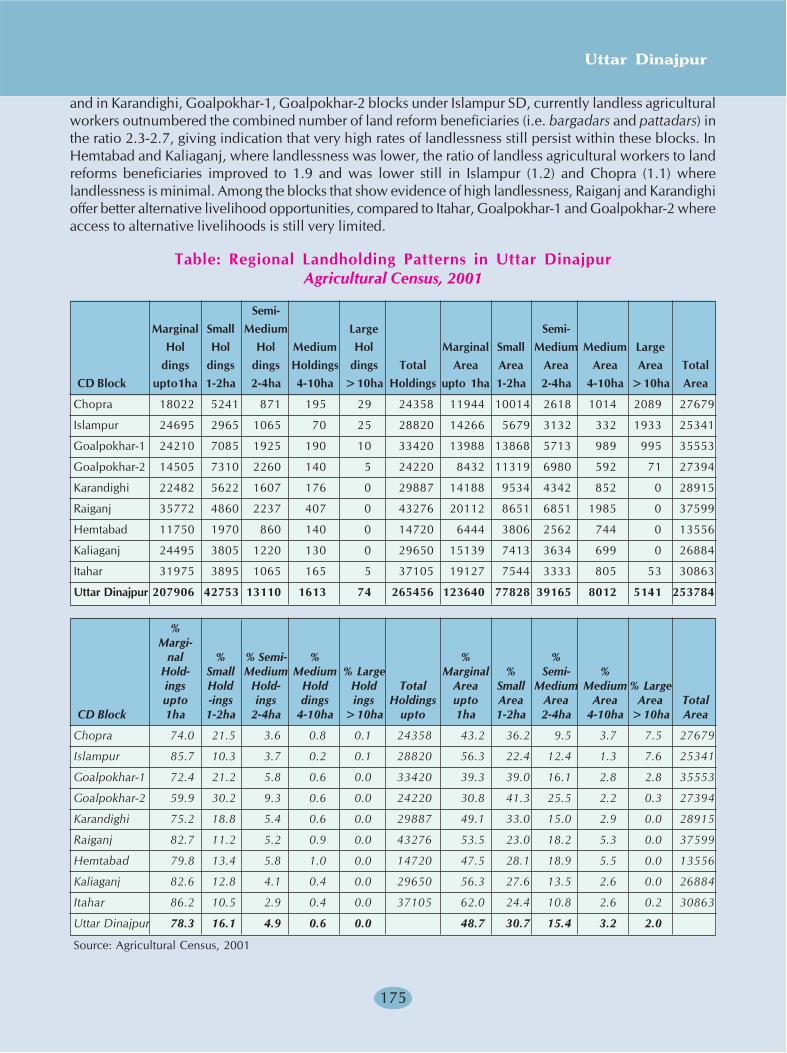
Uttar Dinajpur
175
and in Karandighi, Goalpokhar-1, Goalpokhar-2 blocks under Islampur SD, currently landless agriculturalworkers outnumbered the combined number of land reform beneficiaries (i.e. bargadars and pattadars) inthe ratio 2.3-2.7, giving indication that very high rates of landlessness still persist within these blocks. InHemtabad and Kaliaganj, where landlessness was lower, the ratio of landless agricultural workers to landreforms beneficiaries improved to 1.9 and was lower still in Islampur (1.2) and Chopra (1.1) wherelandlessness is minimal. Among the blocks that show evidence of high landlessness, Raiganj and Karandighioffer better alternative livelihood opportunities, compared to Itahar, Goalpokhar-1 and Goalpokhar-2 whereaccess to alternative livelihoods is still very limited.
Table: Regional Landholding Patterns in Uttar DinajpurAgricultural Census, 2001
Semi-Marginal Small Medium Large Semi-
Hol Hol Hol Medium Hol Marginal Small Medium Medium Largedings dings dings Holdings dings Total Area Area Area Area Area Total
CD Block upto1ha 1-2ha 2-4ha 4-10ha >10ha Holdings upto 1ha 1-2ha 2-4ha 4-10ha >10ha Area
Chopra 18022 5241 871 195 29 24358 11944 10014 2618 1014 2089 27679
Islampur 24695 2965 1065 70 25 28820 14266 5679 3132 332 1933 25341
Goalpokhar-1 24210 7085 1925 190 10 33420 13988 13868 5713 989 995 35553
Goalpokhar-2 14505 7310 2260 140 5 24220 8432 11319 6980 592 71 27394
Karandighi 22482 5622 1607 176 0 29887 14188 9534 4342 852 0 28915
Raiganj 35772 4860 2237 407 0 43276 20112 8651 6851 1985 0 37599
Hemtabad 11750 1970 860 140 0 14720 6444 3806 2562 744 0 13556
Kaliaganj 24495 3805 1220 130 0 29650 15139 7413 3634 699 0 26884
Itahar 31975 3895 1065 165 5 37105 19127 7544 3333 805 53 30863
Uttar Dinajpur 207906 42753 13110 1613 74 265456 123640 77828 39165 8012 5141 253784
%Margi-
nal % % Semi- % % %Hold- Small Medium Medium % Large Marginal % Semi- %ings Hold Hold- Hold Hold Total Area Small Medium Medium % Largeupto -ings ings dings ings Holdings upto Area Area Area Area Total
CD Block 1ha 1-2ha 2-4ha 4-10ha >10ha upto 1ha 1-2ha 2-4ha 4-10ha >10ha Area
Chopra 74.0 21.5 3.6 0.8 0.1 24358 43.2 36.2 9.5 3.7 7.5 27679
Islampur 85.7 10.3 3.7 0.2 0.1 28820 56.3 22.4 12.4 1.3 7.6 25341
Goalpokhar-1 72.4 21.2 5.8 0.6 0.0 33420 39.3 39.0 16.1 2.8 2.8 35553
Goalpokhar-2 59.9 30.2 9.3 0.6 0.0 24220 30.8 41.3 25.5 2.2 0.3 27394
Karandighi 75.2 18.8 5.4 0.6 0.0 29887 49.1 33.0 15.0 2.9 0.0 28915
Raiganj 82.7 11.2 5.2 0.9 0.0 43276 53.5 23.0 18.2 5.3 0.0 37599
Hemtabad 79.8 13.4 5.8 1.0 0.0 14720 47.5 28.1 18.9 5.5 0.0 13556
Kaliaganj 82.6 12.8 4.1 0.4 0.0 29650 56.3 27.6 13.5 2.6 0.0 26884
Itahar 86.2 10.5 2.9 0.4 0.0 37105 62.0 24.4 10.8 2.6 0.2 30863
Uttar Dinajpur 78.3 16.1 4.9 0.6 0.0 48.7 30.7 15.4 3.2 2.0
Source: Agricultural Census, 2001
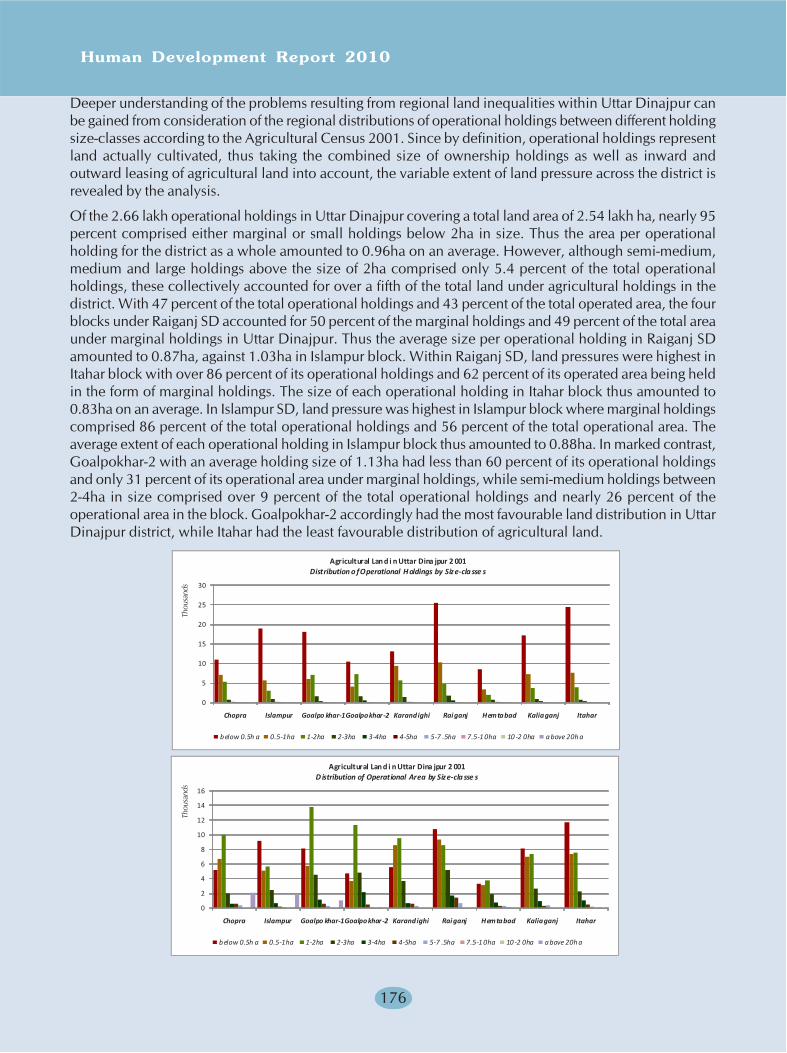
Human Development Report 2010
176
Deeper understanding of the problems resulting from regional land inequalities within Uttar Dinajpur canbe gained from consideration of the regional distributions of operational holdings between different holdingsize-classes according to the Agricultural Census 2001. Since by definition, operational holdings representland actually cultivated, thus taking the combined size of ownership holdings as well as inward andoutward leasing of agricultural land into account, the variable extent of land pressure across the district isrevealed by the analysis.
Of the 2.66 lakh operational holdings in Uttar Dinajpur covering a total land area of 2.54 lakh ha, nearly 95percent comprised either marginal or small holdings below 2ha in size. Thus the area per operationalholding for the district as a whole amounted to 0.96ha on an average. However, although semi-medium,medium and large holdings above the size of 2ha comprised only 5.4 percent of the total operationalholdings, these collectively accounted for over a fifth of the total land under agricultural holdings in thedistrict. With 47 percent of the total operational holdings and 43 percent of the total operated area, the fourblocks under Raiganj SD accounted for 50 percent of the marginal holdings and 49 percent of the total areaunder marginal holdings in Uttar Dinajpur. Thus the average size per operational holding in Raiganj SDamounted to 0.87ha, against 1.03ha in Islampur block. Within Raiganj SD, land pressures were highest inItahar block with over 86 percent of its operational holdings and 62 percent of its operated area being heldin the form of marginal holdings. The size of each operational holding in Itahar block thus amounted to0.83ha on an average. In Islampur SD, land pressure was highest in Islampur block where marginal holdingscomprised 86 percent of the total operational holdings and 56 percent of the total operational area. Theaverage extent of each operational holding in Islampur block thus amounted to 0.88ha. In marked contrast,Goalpokhar-2 with an average holding size of 1.13ha had less than 60 percent of its operational holdingsand only 31 percent of its operational area under marginal holdings, while semi-medium holdings between2-4ha in size comprised over 9 percent of the total operational holdings and nearly 26 percent of theoperational area in the block. Goalpokhar-2 accordingly had the most favourable land distribution in UttarDinajpur district, while Itahar had the least favourable distribution of agricultural land.
0
5
10
15
20
25
30
Chopra Islampur Goalpo khar-1Goalpokhar-2 Karandighi Rai ganj Hemtabad Kaliaganj Itahar
b elow 0.5h a 0.5-1ha 1-2ha 2-3ha 3-4ha 4-5ha 5-7 .5ha 7.5-1 0ha 10 -2 0ha a bove 20h a
Agricultural Lan d i n Uttar Dina jpur 2 001Distribution o f Operational H oldings by Size-cla sse s
0
2
4
6
8
10
12
14
16
Chopra Islampur Goalpo khar-1Goalpokhar-2 Karandighi Rai ganj Hemtabad Kaliaganj Itahar
b elow 0.5h a 0.5-1ha 1-2ha 2-3ha 3-4ha 4-5ha 5-7 .5ha 7.5-1 0ha 10 -2 0ha a bove 20h a
Agricultural Lan d i n Uttar Dina jpur 2 001D istribution of Operational Area by Size-cla sse s
Thou
sand
sTh
ousa
nds

Uttar Dinajpur
177
The degree of current land inequality in different blocks of Uttar Dinajpur can be measured visually throughLorenz curves which plot the cumulative percentage of operational area against the cumulative percentageof landholdings falling in different size-classes for the nine blocks in the district. Since the diagonal or 45?
line in each of the succeeding graphs represents the uniform or equiproportionate distribution of the landarea by successive operational landholding classes, the actual extent of land inequality that prevails in eachblock may be assessed from the degree of deviation of the Lorenz curve for operational landholdings ineach block from the 45? line. Thus, the greater the deviation, the higher the extent of land inequality in theconcerned block. Alternatively, the degree of land inequalities in the Uttar Dinajpur blocks can be measuredby means of Gini coefficients which are calculated on the basis of the area between the Lorenz curve andthe 45? diagonal. Since the Gini coefficient for the equiproportionate land distribution given by the 45? linewould be equal to 0, higher calculated values for Gini coefficients for the different Uttar Dinajpur blocksindicate higher degrees of inequality in the land distributions for those blocks. As seen in the associatedtable, the Gini coefficients for operational land distributions in the Uttar Dinajpur blocks are highest inItahar (0.652) and lowest in Hemtabad (0.572), both located in Raiganj sub-division.
Table: Land Inequalities in Uttar DinajpurAgricultural Census, 2001
TotalOpera- Hol- Hol- Hol- Hol-tional dings Hol- Hol- Hol- Hol- Hol- Hol- dings dings dingsHol- below dings dings dings dings dings dings 7.5- 10-20 above
CD Block dings 0.5ha 0.5-1ha 1-2ha 2-3ha 3-4ha 4-5ha 5-7.5ha 10ha ha 20ha
Chopra 24358 10968 7054 5241 716 155 126 63 6 0 29
Islampur 28820 19050 5645 2965 875 190 50 15 5 5 20
Goalpokhar-1 33420 18100 6110 7085 1605 320 125 55 10 0 10
Goalpokhar-2 24220 10490 4015 7310 1675 585 125 15 0 5 0
Karandighi 29887 13102 9380 5622 1416 191 123 53 0 0 0
Raiganj 43276 25480 10292 4860 1777 460 307 100 0 0 0
Hemtabad 14720 8445 3305 1970 670 190 70 55 15 0 0
Kaliaganj 29650 17290 7205 3805 935 285 65 60 5 0 0
Itahar 37105 24415 7560 3895 795 270 120 35 10 5 0
Uttar Dinajpur 265456 147340 60566 42753 10464 2646 1111 451 51 15 59
TotalOpera-tional Area Area Area Area GiniArea below Area Area Area Area Area Area 7.5- 10-20 above Coeffi-
CD Block [ha] 0.5ha 0.5-1ha 1-2ha 2-3ha 3-4ha 4-5ha 5-7.5ha 10ha ha 20ha cients
Chopra 24358 10968 7054 5241 716 155 126 63 6 0 29
Chopra 27679 5237 6707 10014 2017 601 591 377 46 0 2089 0.603
Islampur 25341 9139 5127 5679 2488 644 210 81 41 61 1872 0.610
Goalpokhar-1 35553 8172 5816 13868 4587 1126 587 315 87 0 995 0.622
Goalpokhar-2 27394 4756 3676 11319 4830 2150 505 87 0 71 0 0.626
Karandighi 28915 5572 8616 9534 3674 668 544 308 0 0 0 0.637
Raiganj 37599 10764 9348 8651 5182 1669 1374 611 0 0 0 0.584
Hemtabad 13556 3319 3125 3806 1850 712 308 313 123 0 0 0.572
Kaliaganj 26884 8176 6963 7413 2653 981 296 363 40 0 0 0.624
Itahar 30863 11708 7419 7544 2307 1026 504 215 86 53 0 0.652
Uttar Dinajpur 253784 66843 56797 77828 29588 9577 4919 2670 423 185 4956
Source: Agricultural Census, 2001

Human Development Report 2010
178
0
10
20
30
40
50
60
70
80
90
100
0 10 20 30 40 50 60 70 80 90 100
Chopra Is lampur Goalpokhar-1 G oalpokhar-2 Karandighi
Land Ine quality in Ut tar DinajpurLorenz Curves for Islampur S D Blocks
% of Operational Holdings
0
10
20
30
40
50
60
70
80
90
100
0 10 20 30 40 50 60 70 80 90 100
Raiganj Hemtabad Kaliaganj Itahar
Land Ine quality in Ut tar DinajpurLorenz Curves for R aiganj S D Blocks
% of Operati onal Holdings
As is evident from the table, land inequalities are generally wider within the Islampur SD blocks where theGini coefficients invariably surpass 0.60, reaching a high of 0.637 in Karandighi. With the spread of small-grower tea plantations, Chopra, Islampur and also Goalpokhar-1 to a lesser extent have several large landestates exceeding 20ha in size. With a Gini coefficient of 0.603, Chopra nevertheless has the lowest degreeof land inequality within Islampur SD because of the lower degree of land pressure. Since the five IslampurSD blocks collectively hold 53 percent of the total operational holdings and 57 percent of the total operationalarea in Uttar Dinajpur, these existing land inequalities are multiplied among a larger number of cultivators.In the Raiganj SD blocks in contrast, land inequalities are high in Kaliaganj and Itahar (Ginicoefficients>0.62) but are lower in Raiganj and Hemtabad (Gini coefficients<0.59). along with such landinequalities, land fragmentation has also been higher in Itahar and Karandighi. Thus while both blockshave a disproportionately large number of operational holdings in the small and marginal size-classes andsmaller proportions of holdings in the higher size-classes, the distribution of operational land by area isweighted much more strongly towards the median size-classes and away from marginal landholders,accounting for the high Gini coefficients that prevail within both blocks.
MAP: Regional Landholding Inequalities in Uttar Dinajpur
Concent ration
Tot al OperationalHoldings 2001
43,200-43,300 (1)33,400-43,200 (2)29,600-33,400 (2)28,800-29,600 (1)14,700-28,800 (3)
Concentrationof Holdings 2001
44,00022,0004,400
bel ow 0.5ha0.5-1ha1-2ha2-3ha3-4ha4-5ha5-7.5ha7.5-10ha10-20haabove 20ha
Tot al OperationalArea 2001
37,500-37,600 (1)35,500-37,500 (1)28,900-35,500 (2)25,300-28,900 (4)13,500-25,300 (1)
Concentrationby Op erat ion al Area
38,00019,000
3,800
bel ow 0.5ha0.5-1ha1-2ha2-3ha3-4ha4-5ha5-7.5ha7.5-10ha10-20haabove 20ha
% a
ge o
f Ope
ratio
nal A
rea
% a
ge o
f Ope
ratio
nal A
rea
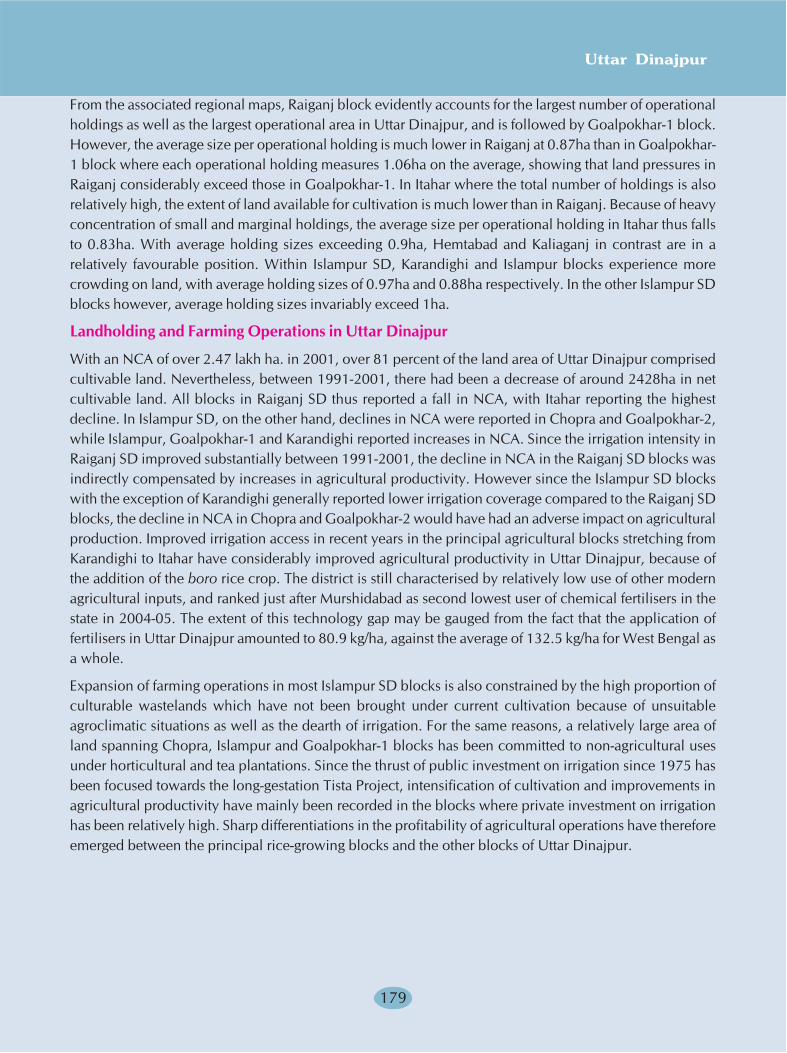
Uttar Dinajpur
179
From the associated regional maps, Raiganj block evidently accounts for the largest number of operationalholdings as well as the largest operational area in Uttar Dinajpur, and is followed by Goalpokhar-1 block.However, the average size per operational holding is much lower in Raiganj at 0.87ha than in Goalpokhar-1 block where each operational holding measures 1.06ha on the average, showing that land pressures inRaiganj considerably exceed those in Goalpokhar-1. In Itahar where the total number of holdings is alsorelatively high, the extent of land available for cultivation is much lower than in Raiganj. Because of heavyconcentration of small and marginal holdings, the average size per operational holding in Itahar thus fallsto 0.83ha. With average holding sizes exceeding 0.9ha, Hemtabad and Kaliaganj in contrast are in arelatively favourable position. Within Islampur SD, Karandighi and Islampur blocks experience morecrowding on land, with average holding sizes of 0.97ha and 0.88ha respectively. In the other Islampur SDblocks however, average holding sizes invariably exceed 1ha.
Landholding and Farming Operations in Uttar Dinajpur
With an NCA of over 2.47 lakh ha. in 2001, over 81 percent of the land area of Uttar Dinajpur comprisedcultivable land. Nevertheless, between 1991-2001, there had been a decrease of around 2428ha in netcultivable land. All blocks in Raiganj SD thus reported a fall in NCA, with Itahar reporting the highestdecline. In Islampur SD, on the other hand, declines in NCA were reported in Chopra and Goalpokhar-2,while Islampur, Goalpokhar-1 and Karandighi reported increases in NCA. Since the irrigation intensity inRaiganj SD improved substantially between 1991-2001, the decline in NCA in the Raiganj SD blocks wasindirectly compensated by increases in agricultural productivity. However since the Islampur SD blockswith the exception of Karandighi generally reported lower irrigation coverage compared to the Raiganj SDblocks, the decline in NCA in Chopra and Goalpokhar-2 would have had an adverse impact on agriculturalproduction. Improved irrigation access in recent years in the principal agricultural blocks stretching fromKarandighi to Itahar have considerably improved agricultural productivity in Uttar Dinajpur, because ofthe addition of the boro rice crop. The district is still characterised by relatively low use of other modernagricultural inputs, and ranked just after Murshidabad as second lowest user of chemical fertilisers in thestate in 2004-05. The extent of this technology gap may be gauged from the fact that the application offertilisers in Uttar Dinajpur amounted to 80.9 kg/ha, against the average of 132.5 kg/ha for West Bengal asa whole.
Expansion of farming operations in most Islampur SD blocks is also constrained by the high proportion ofculturable wastelands which have not been brought under current cultivation because of unsuitableagroclimatic situations as well as the dearth of irrigation. For the same reasons, a relatively large area ofland spanning Chopra, Islampur and Goalpokhar-1 blocks has been committed to non-agricultural usesunder horticultural and tea plantations. Since the thrust of public investment on irrigation since 1975 hasbeen focused towards the long-gestation Tista Project, intensification of cultivation and improvements inagricultural productivity have mainly been recorded in the blocks where private investment on irrigationhas been relatively high. Sharp differentiations in the profitability of agricultural operations have thereforeemerged between the principal rice-growing blocks and the other blocks of Uttar Dinajpur.
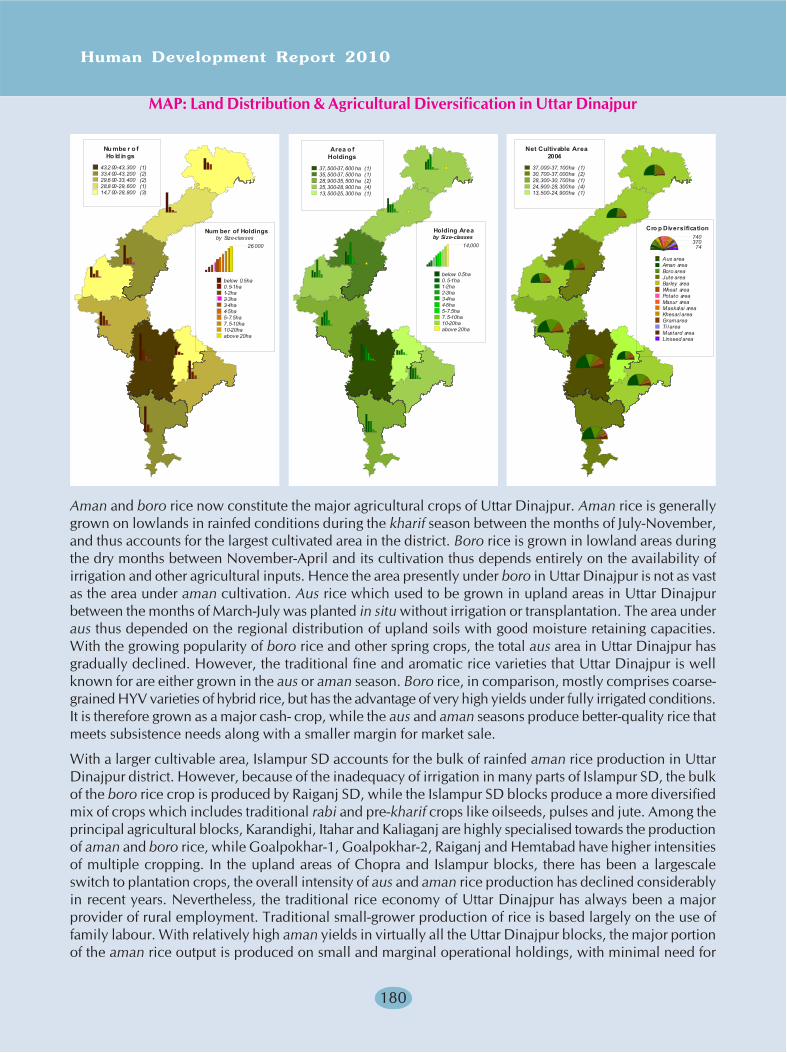
Human Development Report 2010
180
Nu mbe r o fHo ld in gs
43,2 00-43,300 (1)33,4 00-43,200 (2)29,6 00-33,400 (2)28,8 00-29,600 (1)14,7 00-28,800 (3)
Num ber of Holdingsby Size-classes
26,000
below 0.5ha0.5-1ha1-2ha2-3ha3-4ha4-5ha5-7.5ha7.5-10ha10-20haabove 20ha
Area o fHoldings
37,500-37,600 ha (1)35,500-37,500 ha (1)28,900-35,500 ha (2)25,300-28,900 ha (4)13,500-25,300 ha (1)
Holding Areaby Size-classes
14,000
below 0.5ha0.5-1ha1-2ha2-3ha3-4ha4-5ha5-7.5ha7.5-10ha10-20haabove 20ha
Net Cultivable Area2004
37,000-37,100ha (1)30,700-37,000ha (2)28,300-30,700ha (1)24,900-28,300ha (4)13,500-24,900ha (1)
Cro p Diversification740370
74
Aus areaAman areaBoro areaJute areaBarley areaWheat areaPotato areaMasur areaMaskal ai areaKhesari areaGram areaTi l areaMustard areaLinseed area
MAP: Land Distribution & Agricultural Diversification in Uttar Dinajpur
Aman and boro rice now constitute the major agricultural crops of Uttar Dinajpur. Aman rice is generallygrown on lowlands in rainfed conditions during the kharif season between the months of July-November,and thus accounts for the largest cultivated area in the district. Boro rice is grown in lowland areas duringthe dry months between November-April and its cultivation thus depends entirely on the availability ofirrigation and other agricultural inputs. Hence the area presently under boro in Uttar Dinajpur is not as vastas the area under aman cultivation. Aus rice which used to be grown in upland areas in Uttar Dinajpurbetween the months of March-July was planted in situ without irrigation or transplantation. The area underaus thus depended on the regional distribution of upland soils with good moisture retaining capacities.With the growing popularity of boro rice and other spring crops, the total aus area in Uttar Dinajpur hasgradually declined. However, the traditional fine and aromatic rice varieties that Uttar Dinajpur is wellknown for are either grown in the aus or aman season. Boro rice, in comparison, mostly comprises coarse-grained HYV varieties of hybrid rice, but has the advantage of very high yields under fully irrigated conditions.It is therefore grown as a major cash- crop, while the aus and aman seasons produce better-quality rice thatmeets subsistence needs along with a smaller margin for market sale.
With a larger cultivable area, Islampur SD accounts for the bulk of rainfed aman rice production in UttarDinajpur district. However, because of the inadequacy of irrigation in many parts of Islampur SD, the bulkof the boro rice crop is produced by Raiganj SD, while the Islampur SD blocks produce a more diversifiedmix of crops which includes traditional rabi and pre-kharif crops like oilseeds, pulses and jute. Among theprincipal agricultural blocks, Karandighi, Itahar and Kaliaganj are highly specialised towards the productionof aman and boro rice, while Goalpokhar-1, Goalpokhar-2, Raiganj and Hemtabad have higher intensitiesof multiple cropping. In the upland areas of Chopra and Islampur blocks, there has been a largescaleswitch to plantation crops, the overall intensity of aus and aman rice production has declined considerablyin recent years. Nevertheless, the traditional rice economy of Uttar Dinajpur has always been a majorprovider of rural employment. Traditional small-grower production of rice is based largely on the use offamily labour. With relatively high aman yields in virtually all the Uttar Dinajpur blocks, the major portionof the aman rice output is produced on small and marginal operational holdings, with minimal need for
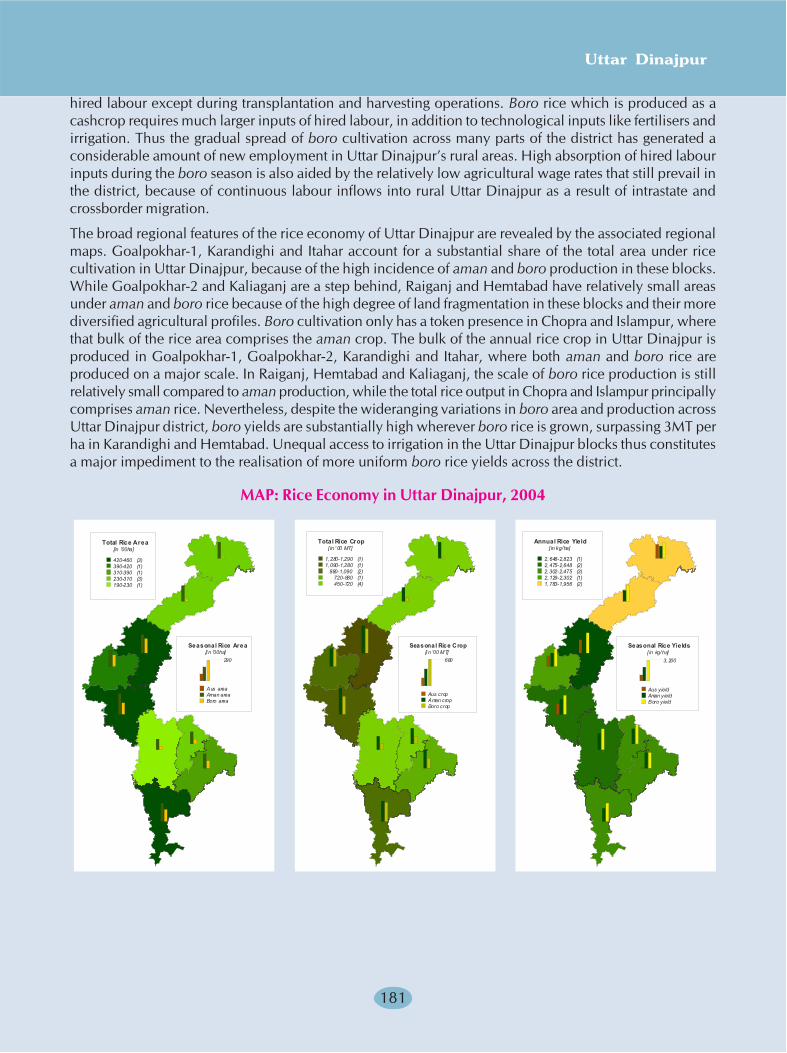
Uttar Dinajpur
181
hired labour except during transplantation and harvesting operations. Boro rice which is produced as acashcrop requires much larger inputs of hired labour, in addition to technological inputs like fertilisers andirrigation. Thus the gradual spread of boro cultivation across many parts of the district has generated aconsiderable amount of new employment in Uttar Dinajpur’s rural areas. High absorption of hired labourinputs during the boro season is also aided by the relatively low agricultural wage rates that still prevail inthe district, because of continuous labour inflows into rural Uttar Dinajpur as a result of intrastate andcrossborder migration.
The broad regional features of the rice economy of Uttar Dinajpur are revealed by the associated regionalmaps. Goalpokhar-1, Karandighi and Itahar account for a substantial share of the total area under ricecultivation in Uttar Dinajpur, because of the high incidence of aman and boro production in these blocks.While Goalpokhar-2 and Kaliaganj are a step behind, Raiganj and Hemtabad have relatively small areasunder aman and boro rice because of the high degree of land fragmentation in these blocks and their morediversified agricultural profiles. Boro cultivation only has a token presence in Chopra and Islampur, wherethat bulk of the rice area comprises the aman crop. The bulk of the annual rice crop in Uttar Dinajpur isproduced in Goalpokhar-1, Goalpokhar-2, Karandighi and Itahar, where both aman and boro rice areproduced on a major scale. In Raiganj, Hemtabad and Kaliaganj, the scale of boro rice production is stillrelatively small compared to aman production, while the total rice output in Chopra and Islampur principallycomprises aman rice. Nevertheless, despite the wideranging variations in boro area and production acrossUttar Dinajpur district, boro yields are substantially high wherever boro rice is grown, surpassing 3MT perha in Karandighi and Hemtabad. Unequal access to irrigation in the Uttar Dinajpur blocks thus constitutesa major impediment to the realisation of more uniform boro rice yields across the district.
MAP: Rice Economy in Uttar Dinajpur, 2004
S
Total Rice Area[in '00ha]
420-460 (3)390-420 (1)310-390 (1)230-310 (3)190-230 (1)
Seasonal Rice Area[i n '00ha]
290
Aus areaAman areaBoro area
Total Rice Crop[ in ' 00 MT]
1,280-1,290 (1)1,090-1,280 (1)
880-1,090 (2)720-880 (1)450-720 (4)
Seasonal Rice Crop[i n '00 MT]
680
Aus cropAman cropBoro crop
Annual Rice Yield[ in kg/ha]
2,648-2,823 (1)2,475-2,648 (2)2,302-2,475 (3)2,129-2,302 (1)1,783-1,956 (2)
Seasonal Rice Yie lds[ in kg/ha]
3,200
Aus yieldAman yieldBoro yield
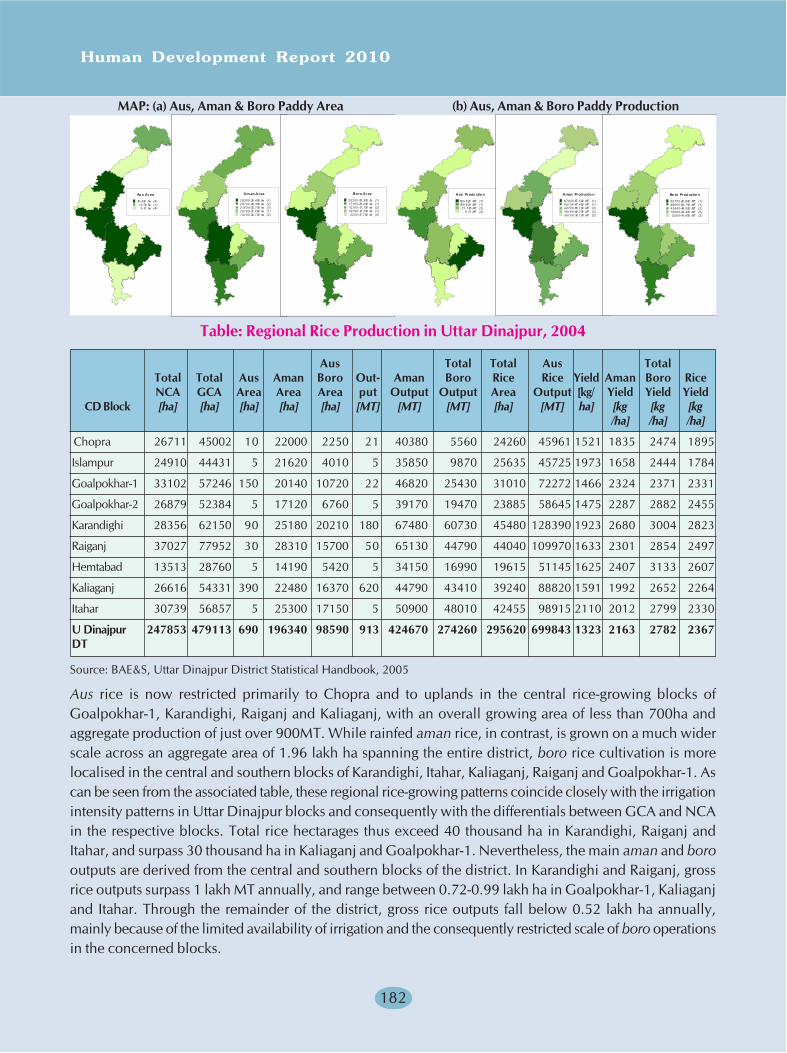
Human Development Report 2010
182
Au s Ar ea
30-390 ha (4)10-30 ha (1)5-10 ha (4)
Am an Ar ea
28,300-28,400 ha (1)25,100-28,300 ha (2)21,600-25,100 ha (3)20,100-21,600 ha (1)14,100-20,100 ha (2)
Bor o Ar ea
20,200-20,300 ha (1)17,100-20,200 ha (1)15,700-17,100 ha (2)10,700-15,700 ha (1)2,200-10,700 ha (4)
Aus Pr odu ctio n
620-620 MT (1)180-620 MT (1)21-180 MT (3)
5-21 MT (4)
Aman Pr od uctio n
67,400-67,500 MT (1)65,100-67,400 MT (1)44,700-65,100 MT (3)39,100-44,700 MT (2)34,100-39,100 MT (2)
Bo ro Pr od uctio n
60,700-60,800 MT (1)48,000-60,700 MT (1)43,400-48,000 MT (2)16,900-43,400 MT (3)5,500-16,900 MT (2)
Table: Regional Rice Production in Uttar Dinajpur, 2004
Aus Total Total Aus TotalTotal Total Aus Aman Boro Out- Aman Boro Rice Rice Yield Aman Boro RiceNCA GCA Area Area Area put Output Output Area Output [kg/ Yield Yield Yield
CD Block [ha] [ha] [ha] [ha] [ha] [MT] [MT] [MT] [ha] [MT] ha] [kg [kg [kg/ha] /ha] /ha]
Chopra 26711 45002 10 22000 2250 21 40380 5560 24260 45961 1521 1835 2474 1895
Islampur 24910 44431 5 21620 4010 5 35850 9870 25635 45725 1973 1658 2444 1784
Goalpokhar-1 33102 57246 150 20140 10720 22 46820 25430 31010 72272 1466 2324 2371 2331
Goalpokhar-2 26879 52384 5 17120 6760 5 39170 19470 23885 58645 1475 2287 2882 2455
Karandighi 28356 62150 90 25180 20210 180 67480 60730 45480 128390 1923 2680 3004 2823
Raiganj 37027 77952 30 28310 15700 50 65130 44790 44040 109970 1633 2301 2854 2497
Hemtabad 13513 28760 5 14190 5420 5 34150 16990 19615 51145 1625 2407 3133 2607
Kaliaganj 26616 54331 390 22480 16370 620 44790 43410 39240 88820 1591 1992 2652 2264
Itahar 30739 56857 5 25300 17150 5 50900 48010 42455 98915 2110 2012 2799 2330
U Dinajpur 247853 479113 690 196340 98590 913 424670 274260 295620 699843 1323 2163 2782 2367DT
Source: BAE&S, Uttar Dinajpur District Statistical Handbook, 2005
Aus rice is now restricted primarily to Chopra and to uplands in the central rice-growing blocks ofGoalpokhar-1, Karandighi, Raiganj and Kaliaganj, with an overall growing area of less than 700ha andaggregate production of just over 900MT. While rainfed aman rice, in contrast, is grown on a much widerscale across an aggregate area of 1.96 lakh ha spanning the entire district, boro rice cultivation is morelocalised in the central and southern blocks of Karandighi, Itahar, Kaliaganj, Raiganj and Goalpokhar-1. Ascan be seen from the associated table, these regional rice-growing patterns coincide closely with the irrigationintensity patterns in Uttar Dinajpur blocks and consequently with the differentials between GCA and NCAin the respective blocks. Total rice hectarages thus exceed 40 thousand ha in Karandighi, Raiganj andItahar, and surpass 30 thousand ha in Kaliaganj and Goalpokhar-1. Nevertheless, the main aman and borooutputs are derived from the central and southern blocks of the district. In Karandighi and Raiganj, grossrice outputs surpass 1 lakh MT annually, and range between 0.72-0.99 lakh ha in Goalpokhar-1, Kaliaganjand Itahar. Through the remainder of the district, gross rice outputs fall below 0.52 lakh ha annually,mainly because of the limited availability of irrigation and the consequently restricted scale of boro operationsin the concerned blocks.
MAP: (a) Aus, Aman & Boro Paddy Area (b) Aus, Aman & Boro Paddy Production

Uttar Dinajpur
183
MAP: Major Economic Crops in Uttar Dinajpur, 2004
Jut e Area
12-13 thousand ha (1)11-12 thousand ha (1)8-10 thousand ha (2)6-8 thousand ha (2)2-6 thousand ha (3)
Jute Production & Yie ld
Jute Producti onJute Yi eld
Potat o Area
above 1.8 thousand ha (1)1.4-1 .8 thousand ha (1)1.0-1 .4 thousand ha (2)0.9-1 .0 thousand ha (2)0.4-0 .9 thousand ha (3)
Potato Production & Yie ld
Potato Product ionPotato Yield
Tota l Oilseeds Area
7.9-8 .0 thousand ha (1)7.2-7 .9 thousand ha (1)4.4-7 .2 thousand ha (2)3.3-4 .4 thousand ha (4)2.2-3 .3 thousand ha (1)
Tota l Oilseeds Production & Yie ld
Total Oilseeds Producti onTotal Oilseeds Yield
The other major economic crops grown in Uttar Dinajpur comprise jute, potatoes and oilseeds. Amongthese, jute and oilseeds are traditional rabi and pre-kharif crops which are sown over areas ranging from 2-13 thousand ha in different blocks, while winter potatoes are a comparatively recent introduction and aregrown over in a restricted area ranging from 0.4-1.8 thousand ha in selected blocks of the district. The mainareas where jute is cultivated in Uttar Dinajpur include Chopra, Islampur, Raiganj and Itahar. Althoughboth tossa and white jute (sun-pat) varieties of jute are cultivated, the distribution of growing areas differsbetween the two varieties. Sun-pat or Bengal white jute (Corchorus capsularis) is grown primarily in theIslampur SD blocks, with Chopra, Islampur, Goalpokhar-2 and Karandighi accounting for the bulk of theproduction. Reddish-gold tossa jute (Corchorus olitorius) is grown primarily within Raiganj SD, with Raiganjand Itahar as the principal producing blocks. Besides being an important commercial fibre-crop, jute is alsoan important utility crop in the district, yielding fodder, fuel as well as fencing material for the use of ruralhouseholds. Thus despite frequent oscillation in fibre prices, the area under jute has remained relativelysteady in Uttar Dinajpur.
Although the yield rates for potatoes exceed 17 thousand kg/ha through most blocks in Uttar Dinajpur withthe exception of Goalpokhar-1 and Goalpokhar-2, potatoes are only cultivated on a wide scale in Raiganjand Chopra. Together with these two major producing blocks, Kaliaganj and Itahar currently account for60 percent of the potato hectarage and over two-thirds of the potato output in Uttar Dinajpur. Commercialcultivation of potatoes is highly input-intensive and is also subject to market risks, which have been majorimpediments to the expansion of potato cultivation in Uttar Dinajpur. Oilseeds are a traditional wintercrop in the district and are grown on a wider scale over a cumulative area of 0.42 lakh ha. The principalgrowing areas include Raiganj, Kaliaganj and Itahar within Raiganj SD, and Goalpokhar-1 in Islampur SD.Islampur, Goalpokhar-2 and Karandighi blocks also contribute fairly significantly to total oilseeds productionin Uttar Dinajpur. The largescale shift to boro cultivation in Uttar Dinajpur has been made at the cost oftraditional dry crops like pulses and oilseeds. The drier areas of the district that border the terai wereoriginally dry farming areas in the recent past. The switchover to less agroclimatically suitable crops in thiswater-scarce region has in fact reduced the total area under pulses and oilseeds, both of which are now indeficit in the district.
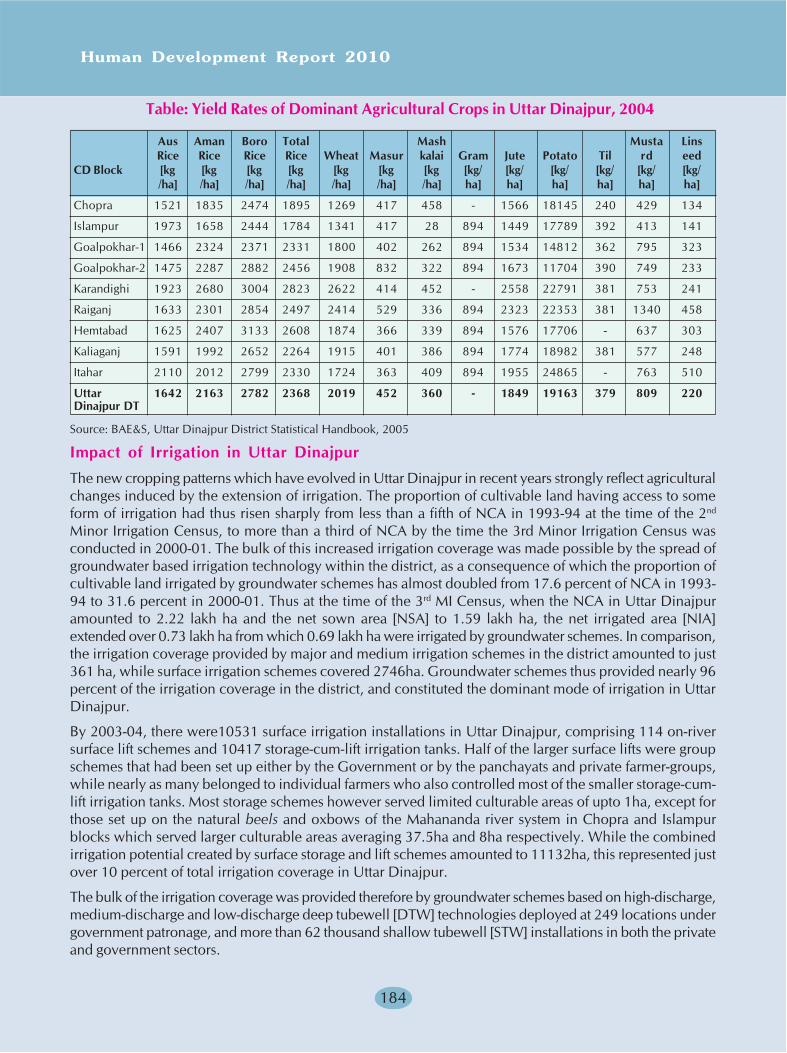
Human Development Report 2010
184
Table: Yield Rates of Dominant Agricultural Crops in Uttar Dinajpur, 2004
Aus Aman Boro Total Mash Musta LinsRice Rice Rice Rice Wheat Masur kalai Gram Jute Potato Til rd eed
CD Block [kg [kg [kg [kg [kg [kg [kg [kg/ [kg/ [kg/ [kg/ [kg/ [kg//ha] /ha] /ha] /ha] /ha] /ha] /ha] ha] ha] ha] ha] ha] ha]
Chopra 1521 1835 2474 1895 1269 417 458 - 1566 18145 240 429 134
Islampur 1973 1658 2444 1784 1341 417 28 894 1449 17789 392 413 141
Goalpokhar-1 1466 2324 2371 2331 1800 402 262 894 1534 14812 362 795 323
Goalpokhar-2 1475 2287 2882 2456 1908 832 322 894 1673 11704 390 749 233
Karandighi 1923 2680 3004 2823 2622 414 452 - 2558 22791 381 753 241
Raiganj 1633 2301 2854 2497 2414 529 336 894 2323 22353 381 1340 458
Hemtabad 1625 2407 3133 2608 1874 366 339 894 1576 17706 - 637 303
Kaliaganj 1591 1992 2652 2264 1915 401 386 894 1774 18982 381 577 248
Itahar 2110 2012 2799 2330 1724 363 409 894 1955 24865 - 763 510
Uttar 1642 2163 2782 2368 2019 452 360 - 1849 19163 379 809 220Dinajpur DT
Source: BAE&S, Uttar Dinajpur District Statistical Handbook, 2005
Impact of Irrigation in Uttar Dinajpur
The new cropping patterns which have evolved in Uttar Dinajpur in recent years strongly reflect agriculturalchanges induced by the extension of irrigation. The proportion of cultivable land having access to someform of irrigation had thus risen sharply from less than a fifth of NCA in 1993-94 at the time of the 2nd
Minor Irrigation Census, to more than a third of NCA by the time the 3rd Minor Irrigation Census wasconducted in 2000-01. The bulk of this increased irrigation coverage was made possible by the spread ofgroundwater based irrigation technology within the district, as a consequence of which the proportion ofcultivable land irrigated by groundwater schemes has almost doubled from 17.6 percent of NCA in 1993-94 to 31.6 percent in 2000-01. Thus at the time of the 3rd MI Census, when the NCA in Uttar Dinajpuramounted to 2.22 lakh ha and the net sown area [NSA] to 1.59 lakh ha, the net irrigated area [NIA]extended over 0.73 lakh ha from which 0.69 lakh ha were irrigated by groundwater schemes. In comparison,the irrigation coverage provided by major and medium irrigation schemes in the district amounted to just361 ha, while surface irrigation schemes covered 2746ha. Groundwater schemes thus provided nearly 96percent of the irrigation coverage in the district, and constituted the dominant mode of irrigation in UttarDinajpur.
By 2003-04, there were10531 surface irrigation installations in Uttar Dinajpur, comprising 114 on-riversurface lift schemes and 10417 storage-cum-lift irrigation tanks. Half of the larger surface lifts were groupschemes that had been set up either by the Government or by the panchayats and private farmer-groups,while nearly as many belonged to individual farmers who also controlled most of the smaller storage-cum-lift irrigation tanks. Most storage schemes however served limited culturable areas of upto 1ha, except forthose set up on the natural beels and oxbows of the Mahananda river system in Chopra and Islampurblocks which served larger culturable areas averaging 37.5ha and 8ha respectively. While the combinedirrigation potential created by surface storage and lift schemes amounted to 11132ha, this represented justover 10 percent of total irrigation coverage in Uttar Dinajpur.
The bulk of the irrigation coverage was provided therefore by groundwater schemes based on high-discharge,medium-discharge and low-discharge deep tubewell [DTW] technologies deployed at 249 locations undergovernment patronage, and more than 62 thousand shallow tubewell [STW] installations in both the privateand government sectors.
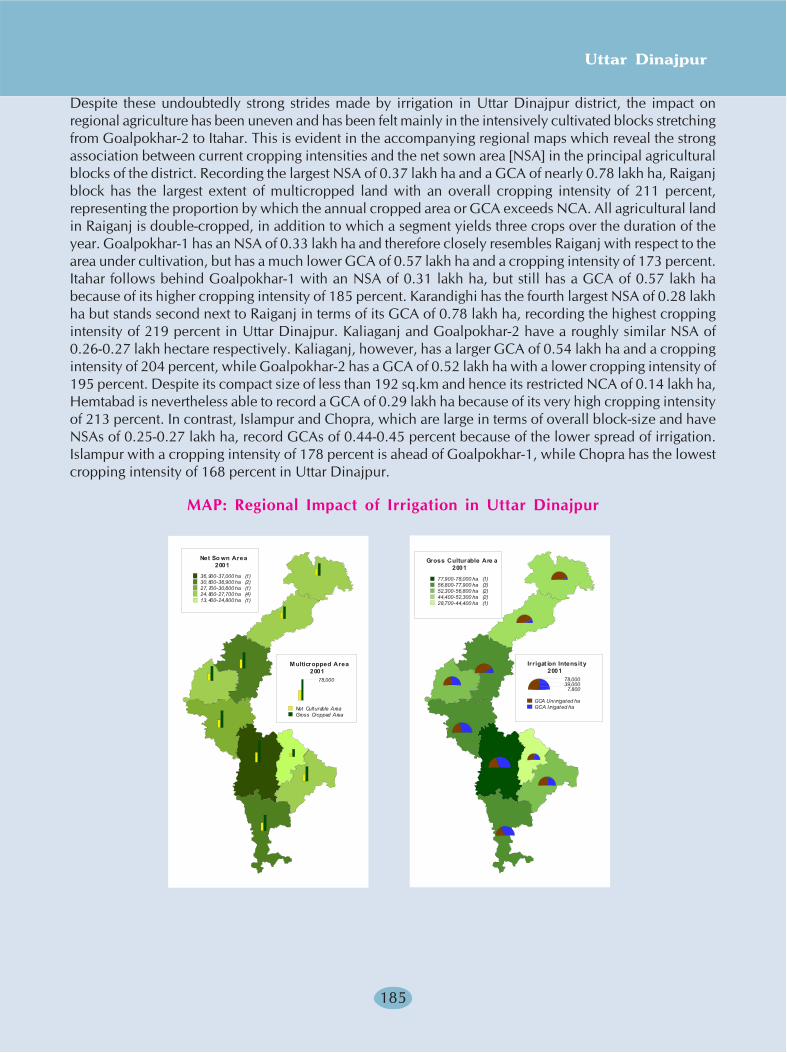
Uttar Dinajpur
185
Despite these undoubtedly strong strides made by irrigation in Uttar Dinajpur district, the impact onregional agriculture has been uneven and has been felt mainly in the intensively cultivated blocks stretchingfrom Goalpokhar-2 to Itahar. This is evident in the accompanying regional maps which reveal the strongassociation between current cropping intensities and the net sown area [NSA] in the principal agriculturalblocks of the district. Recording the largest NSA of 0.37 lakh ha and a GCA of nearly 0.78 lakh ha, Raiganjblock has the largest extent of multicropped land with an overall cropping intensity of 211 percent,representing the proportion by which the annual cropped area or GCA exceeds NCA. All agricultural landin Raiganj is double-cropped, in addition to which a segment yields three crops over the duration of theyear. Goalpokhar-1 has an NSA of 0.33 lakh ha and therefore closely resembles Raiganj with respect to thearea under cultivation, but has a much lower GCA of 0.57 lakh ha and a cropping intensity of 173 percent.Itahar follows behind Goalpokhar-1 with an NSA of 0.31 lakh ha, but still has a GCA of 0.57 lakh habecause of its higher cropping intensity of 185 percent. Karandighi has the fourth largest NSA of 0.28 lakhha but stands second next to Raiganj in terms of its GCA of 0.78 lakh ha, recording the highest croppingintensity of 219 percent in Uttar Dinajpur. Kaliaganj and Goalpokhar-2 have a roughly similar NSA of0.26-0.27 lakh hectare respectively. Kaliaganj, however, has a larger GCA of 0.54 lakh ha and a croppingintensity of 204 percent, while Goalpokhar-2 has a GCA of 0.52 lakh ha with a lower cropping intensity of195 percent. Despite its compact size of less than 192 sq.km and hence its restricted NCA of 0.14 lakh ha,Hemtabad is nevertheless able to record a GCA of 0.29 lakh ha because of its very high cropping intensityof 213 percent. In contrast, Islampur and Chopra, which are large in terms of overall block-size and haveNSAs of 0.25-0.27 lakh ha, record GCAs of 0.44-0.45 percent because of the lower spread of irrigation.Islampur with a cropping intensity of 178 percent is ahead of Goalpokhar-1, while Chopra has the lowestcropping intensity of 168 percent in Uttar Dinajpur.
MAP: Regional Impact of Irrigation in Uttar Dinajpur
Net So wn Area2001
36,900-37,000 ha (1)30,600-36,900 ha (2)27,700-30,600 ha (1)24,800-27,700 ha (4)13,400-24,800 ha (1)
Multicropped Area2001
78,000
Net Culturable AreaGross Cropped Area
Gross Culturable Are a2001
77,900-78,000 ha (1)56,800-77,900 ha (3)52,300-56,800 ha (2)44,400-52,300 ha (2)28,700-44,400 ha (1)
Irrigat ion Intensity2001
78,00039,000
7,800
GCA Uni rrigated haGCA Irrigated ha
Human Development Report 2010
186
Such differences in the extent of multicropping between the Uttar Dinajpur blocks strongly reflect currentregional differences between irrigation intensities within Uttar Dinajpur. Through the southwestern regionof the district stretching from Goalpokhar-2 to Itahar, the annual hectarage under intensively irrigated cropsincreases progressively, invariably extending over more than 50 percent of the GCA and touching a high ofover 67 percent in Itahar. Raiganj records an irrigation intensity close to 61 percent, while Goalpokhar-2and Karandighi record irrigation intensities between 57-58 percent. Despite their high cropping intensitiesexceeding 200 percent, Kaliaganj and Hemtabad have irrigation intensities of 46-48 percent, and thereforeare less capable of supporting intensively irrigated crops. Irrigation intensities fall off very sharply in thethree northern blocks to 20 percent in Goalpokhar-1, 17 percent in Islampur and 8 percent in Chopra. Thuswhile all blocks in Uttar Dinajpur with the exception of Chopra depend overwhelmingly on agriculture astheir primary economic activity, the potentials for agricultural intensification and economic growth differvery strongly between the northern, southwestern and southeastern regions in the district. Three principalfactors are responsible for these regional differences in irrigation access and irrigation intensity that currentlyexist within Uttar Dinajpur. While being conditioned by the uneven distribution of water resources withinthe three principal irrigation regions of the district, the regional differentials are also affected by the dominantforms of irrigation technology that have been deployed in each subregion and by the extent to which theseirrigation technologies are divisible. Relative irrigation access in Uttar Dinajpur is also influenced by theland distribution across agrarian classes, which influences the scale and the economic viability of irrigatedagriculture. All three factors have a combined impact on current irrigation intensities within Uttar Dinajpurdistrict.
Traditional systems of irrigation in Uttar Dinajpur had evolved around the utilisation of surface runoffaccumulated in the numerous natural waterbodies, marshlands and irrigation tanks which abound alongthe length of the district. However because of the rapid decline in precipitation from around 2800mm p.ain northern Chopra to less than 1500mm p.a in southern Itahar, traditional irrigation systems were moredeveloped in the intensively settled blocks under Raiganj SD than in the Islampur SD blocks that hadpreviously been part of Purnea district in Bihar. The regional breakthrough in irrigation came from the rapidmultiplication of groundwater based systems starting from the late 1970s onward, after the DTW and STWtechnologies that had heralded the Green Revolution were popularised in the rainfed regions with WorldBank lending support. While this inevitably drew attention away from surface irrigation schemes and alsofrom major irrigation initiatives like the Tista Barrage Project [TBP] in which Uttar Dinajpur is to be a majorbeneficiary, the easy replicability and divisibility of STW tubewell technology led to its adoption on a largescale through private farmer initiatives. Between 1986-87 and 1994-95 therefore, STW installations inUttar Dinajpur were estimated to have grown at a compound rate of over 34 percent p.a, with over 4256STWs being added every year (2nd MI Census, 1993-94). While the rate of growth of STWs slackened toaround 20 percent p.a between 1993-94 and 2000-01, annual STW additions over the period rose to over4330 per year (3rd MI Census, 2000-01). Most STWs were private installations made by individual farmerswishing to switchover to the cultivation of boro rice.
As indicated by the regional distribution of minor irrigation systems in Uttar Dinajpur at the time of the 3rd
MI Census, private STWs collectively accounted for 79 percent of the MI installations and 84 percent of theirrigated area in the district and played a dominant role in expanding the access to irrigation in every UttarDinajpur block. With another 4 percent of the total irrigated area being served by government DTWs,nearly nine-tenths of the irrigation coverage in Uttar Dinajpur was directly attributable to the application ofgroundwater based technologies. Goalpokhar-2, Karandighi, Raiganj and Itahar held around 47 percent ofthe area irrigated by government-sector groundwater installations, and Hemtabad and Kaliaganj accountedfor another 23 percent. The terai blocks comprising Chopra, Islampur and Goalpokhar-1 thus held around30 percent of the area irrigated by government groundwater schemes. In contrast, the irrigation potentialcreated through private initiatives was distributed much more unevenly across the district. Over 52 percentof the command area irrigated by private STWs was located within the western agricultural belt formed by
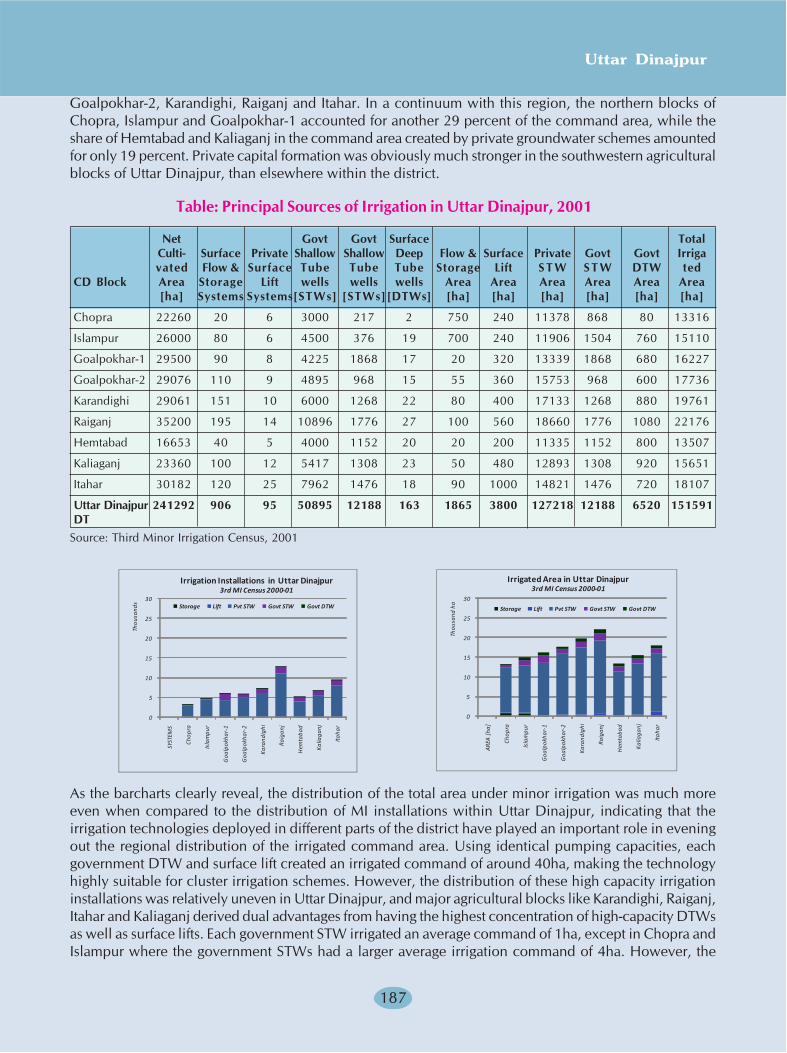
Uttar Dinajpur
187
Goalpokhar-2, Karandighi, Raiganj and Itahar. In a continuum with this region, the northern blocks ofChopra, Islampur and Goalpokhar-1 accounted for another 29 percent of the command area, while theshare of Hemtabad and Kaliaganj in the command area created by private groundwater schemes amountedfor only 19 percent. Private capital formation was obviously much stronger in the southwestern agriculturalblocks of Uttar Dinajpur, than elsewhere within the district.
Table: Principal Sources of Irrigation in Uttar Dinajpur, 2001
Net Govt Govt Surface TotalCulti- Surface Private Shallow Shallow Deep Flow & Surface Private Govt Govt Irrigavated Flow & Surface Tube Tube Tube Storage Lift S T W S T W DTW ted
CD Block Area Storage Lift wells wells wells Area Area Area Area Area Area[ha] Systems Systems[STWs] [STWs] [DTWs] [ha] [ha] [ha] [ha] [ha] [ha]
Chopra 22260 20 6 3000 217 2 750 240 11378 868 80 13316
Islampur 26000 80 6 4500 376 19 700 240 11906 1504 760 15110
Goalpokhar-1 29500 90 8 4225 1868 17 20 320 13339 1868 680 16227
Goalpokhar-2 29076 110 9 4895 968 15 55 360 15753 968 600 17736
Karandighi 29061 151 10 6000 1268 22 80 400 17133 1268 880 19761
Raiganj 35200 195 14 10896 1776 27 100 560 18660 1776 1080 22176
Hemtabad 16653 40 5 4000 1152 20 20 200 11335 1152 800 13507
Kaliaganj 23360 100 12 5417 1308 23 50 480 12893 1308 920 15651
Itahar 30182 120 25 7962 1476 18 90 1000 14821 1476 720 18107
Uttar Dinajpur 241292 906 95 50895 12188 163 1865 3800 127218 12188 6520 151591DT
Source: Third Minor Irrigation Census, 2001
As the barcharts clearly reveal, the distribution of the total area under minor irrigation was much moreeven when compared to the distribution of MI installations within Uttar Dinajpur, indicating that theirrigation technologies deployed in different parts of the district have played an important role in eveningout the regional distribution of the irrigated command area. Using identical pumping capacities, eachgovernment DTW and surface lift created an irrigated command of around 40ha, making the technologyhighly suitable for cluster irrigation schemes. However, the distribution of these high capacity irrigationinstallations was relatively uneven in Uttar Dinajpur, and major agricultural blocks like Karandighi, Raiganj,Itahar and Kaliaganj derived dual advantages from having the highest concentration of high-capacity DTWsas well as surface lifts. Each government STW irrigated an average command of 1ha, except in Chopra andIslampur where the government STWs had a larger average irrigation command of 4ha. However, the
0
5
10
15
20
25
30
SYST
EMS
Chop
ra
Isla
mpu
r
Goa
lpok
har-
1
Goa
lpok
har-
2
Kara
ndig
hi
Raig
anj
Hem
taba
d
Kalia
ganj
Itaha
r
Thou
sand
s
Storage Lift Pvt STW Govt STW Govt DTW
Irrigation Installations in Uttar Dinajpur3rd MI Census 2000-01
0
5
10
15
20
25
30
AREA
[ha
]
Chop
ra
Isla
mpu
r
Goa
lpok
har-
1
Goa
lpok
har-
2
Kara
ndig
hi
Raig
anj
Hem
taba
d
Kalia
ganj
Itaha
r
Thou
sand
ha
Storage Lift Pvt STW Govt STW Govt DTW
Irrigated Area in Uttar Dinajpur3rd MI Census 2000-01
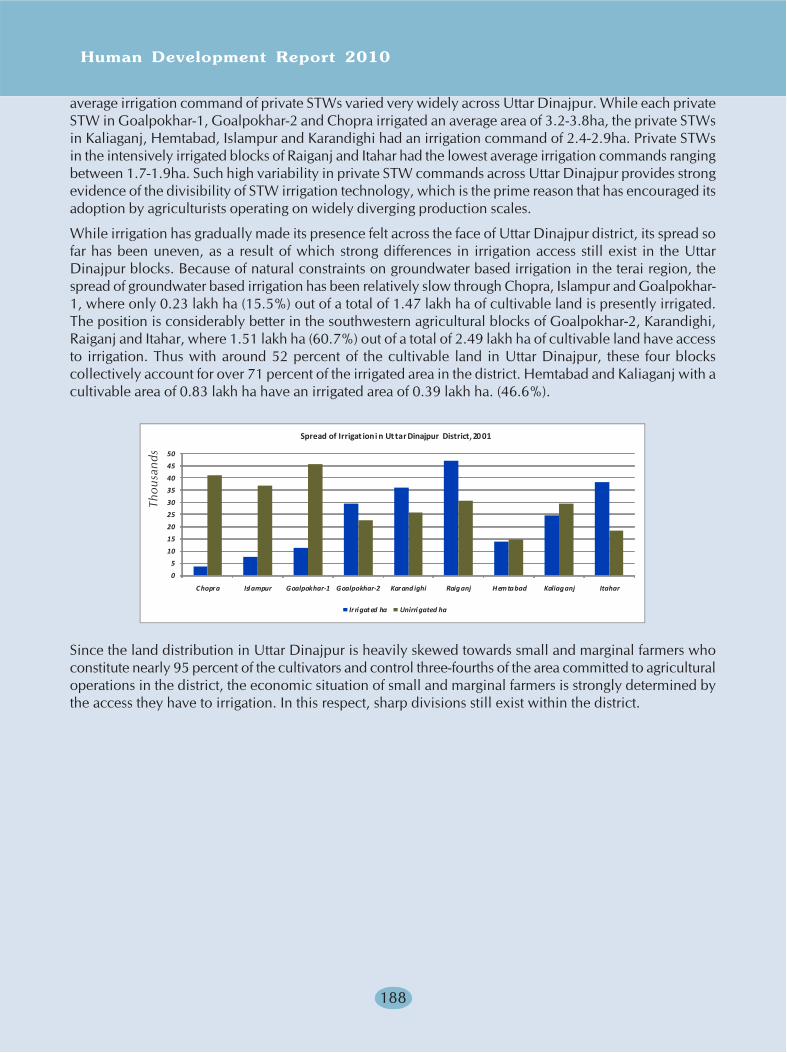
Human Development Report 2010
188
average irrigation command of private STWs varied very widely across Uttar Dinajpur. While each privateSTW in Goalpokhar-1, Goalpokhar-2 and Chopra irrigated an average area of 3.2-3.8ha, the private STWsin Kaliaganj, Hemtabad, Islampur and Karandighi had an irrigation command of 2.4-2.9ha. Private STWsin the intensively irrigated blocks of Raiganj and Itahar had the lowest average irrigation commands rangingbetween 1.7-1.9ha. Such high variability in private STW commands across Uttar Dinajpur provides strongevidence of the divisibility of STW irrigation technology, which is the prime reason that has encouraged itsadoption by agriculturists operating on widely diverging production scales.
While irrigation has gradually made its presence felt across the face of Uttar Dinajpur district, its spread sofar has been uneven, as a result of which strong differences in irrigation access still exist in the UttarDinajpur blocks. Because of natural constraints on groundwater based irrigation in the terai region, thespread of groundwater based irrigation has been relatively slow through Chopra, Islampur and Goalpokhar-1, where only 0.23 lakh ha (15.5%) out of a total of 1.47 lakh ha of cultivable land is presently irrigated.The position is considerably better in the southwestern agricultural blocks of Goalpokhar-2, Karandighi,Raiganj and Itahar, where 1.51 lakh ha (60.7%) out of a total of 2.49 lakh ha of cultivable land have accessto irrigation. Thus with around 52 percent of the cultivable land in Uttar Dinajpur, these four blockscollectively account for over 71 percent of the irrigated area in the district. Hemtabad and Kaliaganj with acultivable area of 0.83 lakh ha have an irrigated area of 0.39 lakh ha. (46.6%).
Since the land distribution in Uttar Dinajpur is heavily skewed towards small and marginal farmers whoconstitute nearly 95 percent of the cultivators and control three-fourths of the area committed to agriculturaloperations in the district, the economic situation of small and marginal farmers is strongly determined bythe access they have to irrigation. In this respect, sharp divisions still exist within the district.
0
5
10
15
20
25
30
35
40
45
50
Chopra Islampur Goalpokhar-1 Goalpokhar-2 Karand ighi Raig anj Hemtabad Kaliaganj Itahar
Irrigat ed ha Unirri gated ha
Spread of Irrigat ion i n Ut tar Dinajpur District 2001,
Thou
sand
s
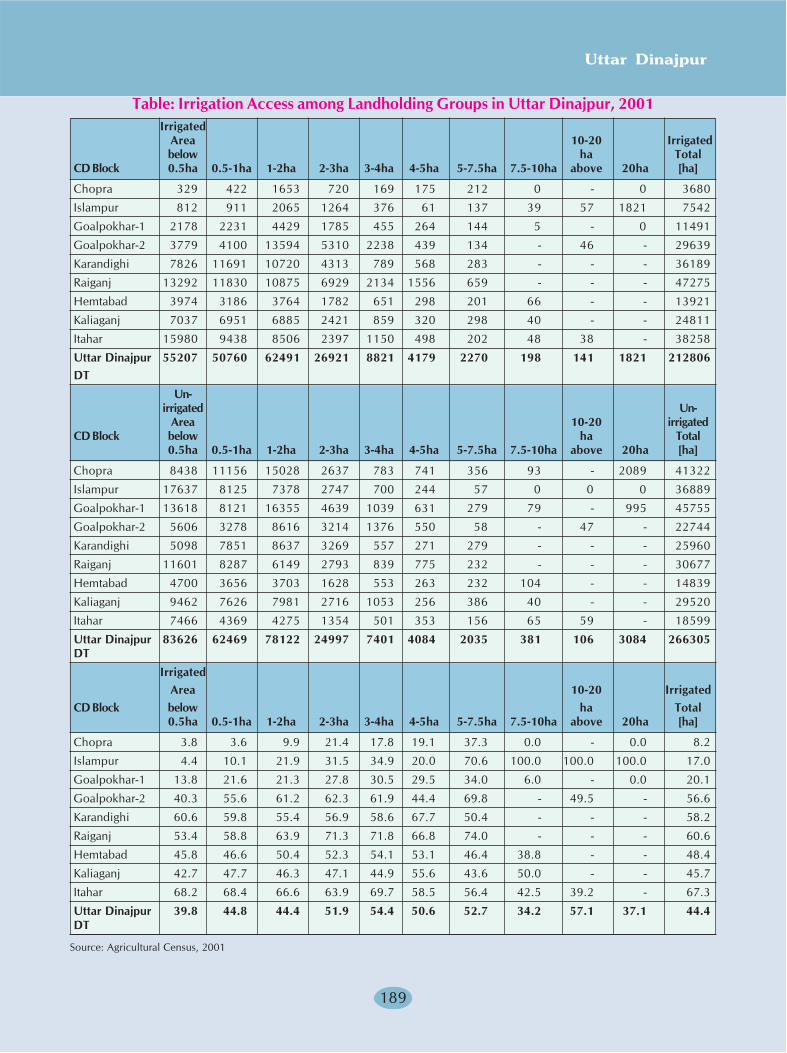
Uttar Dinajpur
189
Table: Irrigation Access among Landholding Groups in Uttar Dinajpur, 2001Irrigated
Area 10-20 Irrigatedbelow ha Total
CD Block 0.5ha 0.5-1ha 1-2ha 2-3ha 3-4ha 4-5ha 5-7.5ha 7.5-10ha above 20ha [ha]
Chopra 329 422 1653 720 169 175 212 0 - 0 3680
Islampur 812 911 2065 1264 376 61 137 39 57 1821 7542
Goalpokhar-1 2178 2231 4429 1785 455 264 144 5 - 0 11491
Goalpokhar-2 3779 4100 13594 5310 2238 439 134 - 46 - 29639
Karandighi 7826 11691 10720 4313 789 568 283 - - - 36189
Raiganj 13292 11830 10875 6929 2134 1556 659 - - - 47275
Hemtabad 3974 3186 3764 1782 651 298 201 66 - - 13921
Kaliaganj 7037 6951 6885 2421 859 320 298 40 - - 24811
Itahar 15980 9438 8506 2397 1150 498 202 48 38 - 38258
Uttar Dinajpur 55207 50760 62491 26921 8821 4179 2270 198 141 1821 212806DT
Un-irrigated Un-
Area 10-20 irrigatedCD Block below ha Total
0.5ha 0.5-1ha 1-2ha 2-3ha 3-4ha 4-5ha 5-7.5ha 7.5-10ha above 20ha [ha]
Chopra 8438 11156 15028 2637 783 741 356 93 - 2089 41322
Islampur 17637 8125 7378 2747 700 244 57 0 0 0 36889
Goalpokhar-1 13618 8121 16355 4639 1039 631 279 79 - 995 45755
Goalpokhar-2 5606 3278 8616 3214 1376 550 58 - 47 - 22744
Karandighi 5098 7851 8637 3269 557 271 279 - - - 25960
Raiganj 11601 8287 6149 2793 839 775 232 - - - 30677
Hemtabad 4700 3656 3703 1628 553 263 232 104 - - 14839
Kaliaganj 9462 7626 7981 2716 1053 256 386 40 - - 29520
Itahar 7466 4369 4275 1354 501 353 156 65 59 - 18599
Uttar Dinajpur 83626 62469 78122 24997 7401 4084 2035 381 106 3084 266305DT
IrrigatedArea 10-20 Irrigated
CD Block below ha Total0.5ha 0.5-1ha 1-2ha 2-3ha 3-4ha 4-5ha 5-7.5ha 7.5-10ha above 20ha [ha]
Chopra 3.8 3.6 9.9 21.4 17.8 19.1 37.3 0.0 - 0.0 8.2
Islampur 4.4 10.1 21.9 31.5 34.9 20.0 70.6 100.0 100.0 100.0 17.0
Goalpokhar-1 13.8 21.6 21.3 27.8 30.5 29.5 34.0 6.0 - 0.0 20.1
Goalpokhar-2 40.3 55.6 61.2 62.3 61.9 44.4 69.8 - 49.5 - 56.6
Karandighi 60.6 59.8 55.4 56.9 58.6 67.7 50.4 - - - 58.2
Raiganj 53.4 58.8 63.9 71.3 71.8 66.8 74.0 - - - 60.6
Hemtabad 45.8 46.6 50.4 52.3 54.1 53.1 46.4 38.8 - - 48.4
Kaliaganj 42.7 47.7 46.3 47.1 44.9 55.6 43.6 50.0 - - 45.7
Itahar 68.2 68.4 66.6 63.9 69.7 58.5 56.4 42.5 39.2 - 67.3
Uttar Dinajpur 39.8 44.8 44.4 51.9 54.4 50.6 52.7 34.2 57.1 37.1 44.4DT
Source: Agricultural Census, 2001
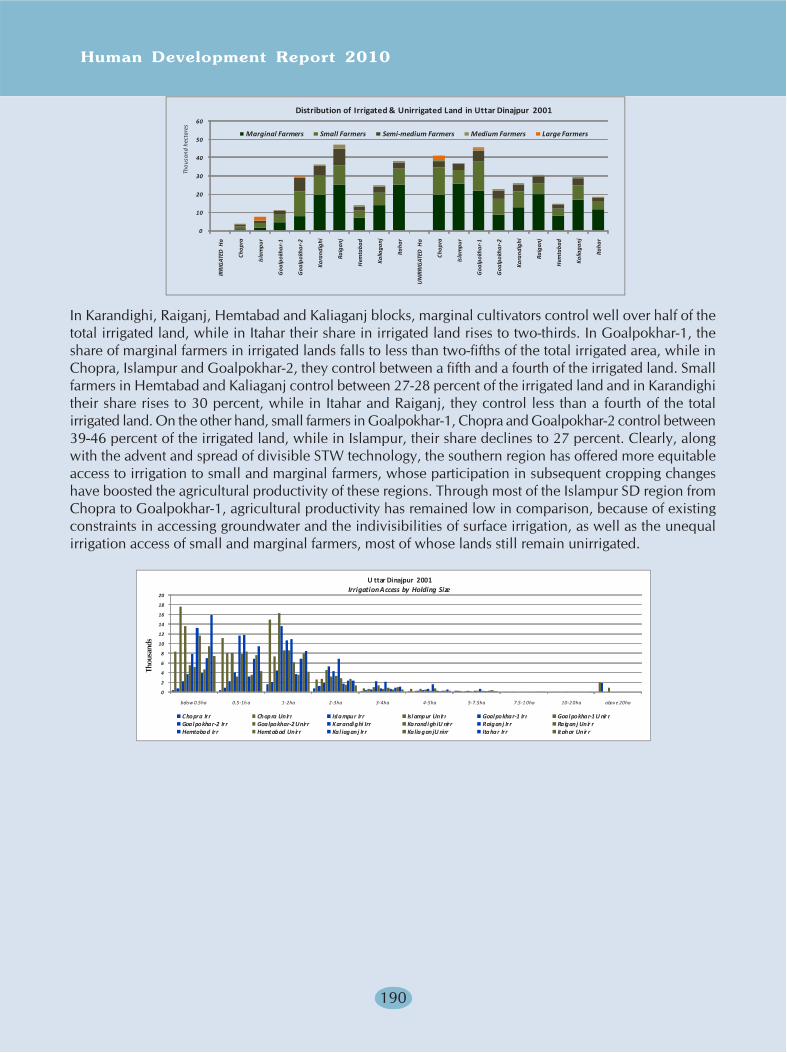
Human Development Report 2010
190
In Karandighi, Raiganj, Hemtabad and Kaliaganj blocks, marginal cultivators control well over half of thetotal irrigated land, while in Itahar their share in irrigated land rises to two-thirds. In Goalpokhar-1, theshare of marginal farmers in irrigated lands falls to less than two-fifths of the total irrigated area, while inChopra, Islampur and Goalpokhar-2, they control between a fifth and a fourth of the irrigated land. Smallfarmers in Hemtabad and Kaliaganj control between 27-28 percent of the irrigated land and in Karandighitheir share rises to 30 percent, while in Itahar and Raiganj, they control less than a fourth of the totalirrigated land. On the other hand, small farmers in Goalpokhar-1, Chopra and Goalpokhar-2 control between39-46 percent of the irrigated land, while in Islampur, their share declines to 27 percent. Clearly, alongwith the advent and spread of divisible STW technology, the southern region has offered more equitableaccess to irrigation to small and marginal farmers, whose participation in subsequent cropping changeshave boosted the agricultural productivity of these regions. Through most of the Islampur SD region fromChopra to Goalpokhar-1, agricultural productivity has remained low in comparison, because of existingconstraints in accessing groundwater and the indivisibilities of surface irrigation, as well as the unequalirrigation access of small and marginal farmers, most of whose lands still remain unirrigated.
0
2
4
6
8
10
12
14
16
18
20
below 0 .5ha 0.5-1h a 1-2ha 2-3ha 3-4ha 4-5ha 5-7.5ha 7.5-1 0ha 10-2 0ha abov e 20ha
C hopra Irr Chop ra Unirr Isl ampur Irr Isl ampur Unir r Goal pokhar-1 Irr Goal pokhar-1 U nir rGoal pokhar-2 Ir r Goalpokhar-2 Unirr Karandi ghi Irr Karandi ghi U nirr Raiganj Ir r Raiganj Unir rHemtabad Ir r Hemtabad Unirr Kal iaganj Ir r Kalia gan j U nirr Itahar Irr Itahar Unir r
U ttar Dinajpur 2001Irrigation Access by Holding Size
0
10
20
30
40
50
60
IRRI
GAT
ED H
a
Chop
ra
Isla
mpu
r
Goa
lpok
har-
1
Goa
lpok
har-
2
Kara
ndig
hi
Raig
anj
Hem
taba
d
Kalia
ganj
Itaha
r
UN
IRRI
GAT
ED H
a
Chop
ra
Isla
mpu
r
Goa
lpok
har-
1
Goa
lpok
har-
2
Kara
ndig
hi
Raig
anj
Hem
taba
d
Kalia
ganj
Itaha
r
Thou
sand
hec
tare
s
Marginal Farmers Small Farmers Semi-medium Farmers Medium Farmers Large Farmers
Distribution of Irrigated & Unirrigated Land in Uttar Dinajpur 2001
Thou
sand
s
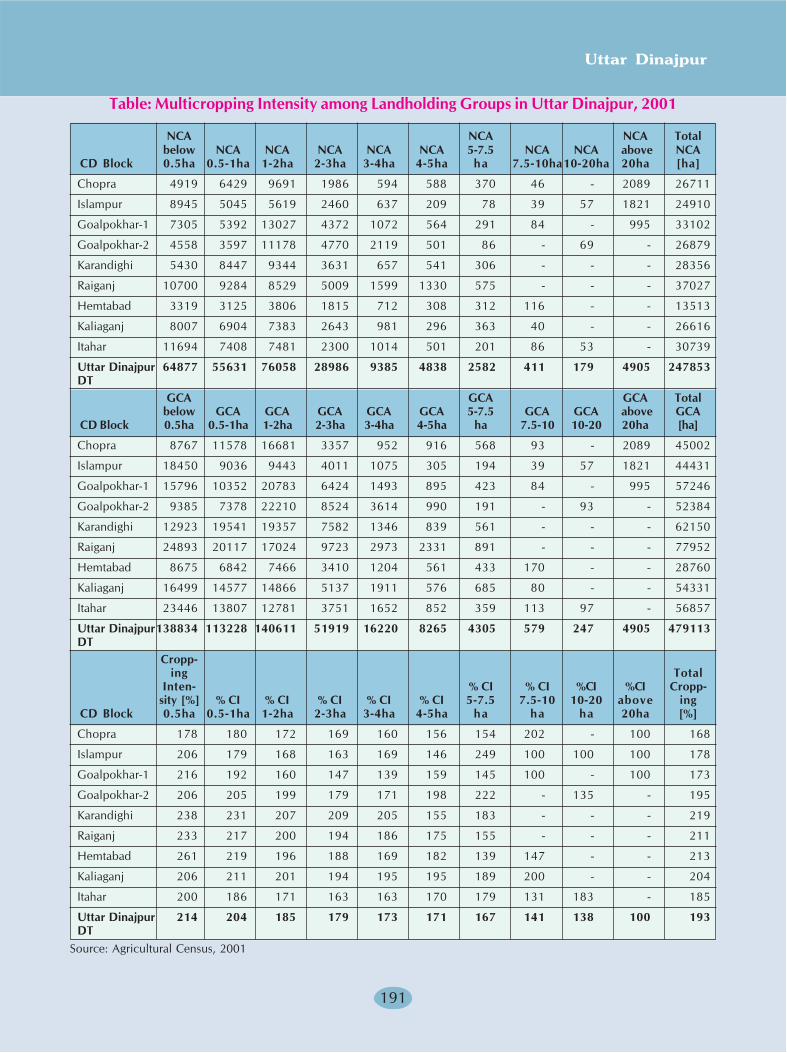
Uttar Dinajpur
191
Table: Multicropping Intensity among Landholding Groups in Uttar Dinajpur, 2001
NCA NCA NCA Totalbelow NCA NCA NCA NCA NCA 5-7.5 NCA NCA above NCA
CD Block 0.5ha 0.5-1ha 1-2ha 2-3ha 3-4ha 4-5ha ha 7.5-10ha10-20ha 20ha [ha]
Chopra 4919 6429 9691 1986 594 588 370 46 - 2089 26711
Islampur 8945 5045 5619 2460 637 209 78 39 57 1821 24910
Goalpokhar-1 7305 5392 13027 4372 1072 564 291 84 - 995 33102
Goalpokhar-2 4558 3597 11178 4770 2119 501 86 - 69 - 26879
Karandighi 5430 8447 9344 3631 657 541 306 - - - 28356
Raiganj 10700 9284 8529 5009 1599 1330 575 - - - 37027
Hemtabad 3319 3125 3806 1815 712 308 312 116 - - 13513
Kaliaganj 8007 6904 7383 2643 981 296 363 40 - - 26616
Itahar 11694 7408 7481 2300 1014 501 201 86 53 - 30739
Uttar Dinajpur 64877 55631 76058 28986 9385 4838 2582 411 179 4905 247853DT
GCA GCA GCA Totalbelow GCA GCA GCA GCA GCA 5-7.5 GCA GCA above GCA
CD Block 0.5ha 0.5-1ha 1-2ha 2-3ha 3-4ha 4-5ha ha 7.5-10 10-20 20ha [ha]
Chopra 8767 11578 16681 3357 952 916 568 93 - 2089 45002
Islampur 18450 9036 9443 4011 1075 305 194 39 57 1821 44431
Goalpokhar-1 15796 10352 20783 6424 1493 895 423 84 - 995 57246
Goalpokhar-2 9385 7378 22210 8524 3614 990 191 - 93 - 52384
Karandighi 12923 19541 19357 7582 1346 839 561 - - - 62150
Raiganj 24893 20117 17024 9723 2973 2331 891 - - - 77952
Hemtabad 8675 6842 7466 3410 1204 561 433 170 - - 28760
Kaliaganj 16499 14577 14866 5137 1911 576 685 80 - - 54331
Itahar 23446 13807 12781 3751 1652 852 359 113 97 - 56857
Uttar Dinajpur138834 113228 140611 51919 16220 8265 4305 579 247 4905 479113DT
Cropp-ing Total
Inten- % CI % CI %CI %CI Cropp-sity [%] % CI % CI % CI % CI % CI 5-7.5 7.5-10 10-20 above ing
CD Block 0.5ha 0.5-1ha 1-2ha 2-3ha 3-4ha 4-5ha ha ha ha 20ha [%]
Chopra 178 180 172 169 160 156 154 202 - 100 168
Islampur 206 179 168 163 169 146 249 100 100 100 178
Goalpokhar-1 216 192 160 147 139 159 145 100 - 100 173
Goalpokhar-2 206 205 199 179 171 198 222 - 135 - 195
Karandighi 238 231 207 209 205 155 183 - - - 219
Raiganj 233 217 200 194 186 175 155 - - - 211
Hemtabad 261 219 196 188 169 182 139 147 - - 213
Kaliaganj 206 211 201 194 195 195 189 200 - - 204
Itahar 200 186 171 163 163 170 179 131 183 - 185
Uttar Dinajpur 214 204 185 179 173 171 167 141 138 100 193DT
Source: Agricultural Census, 2001
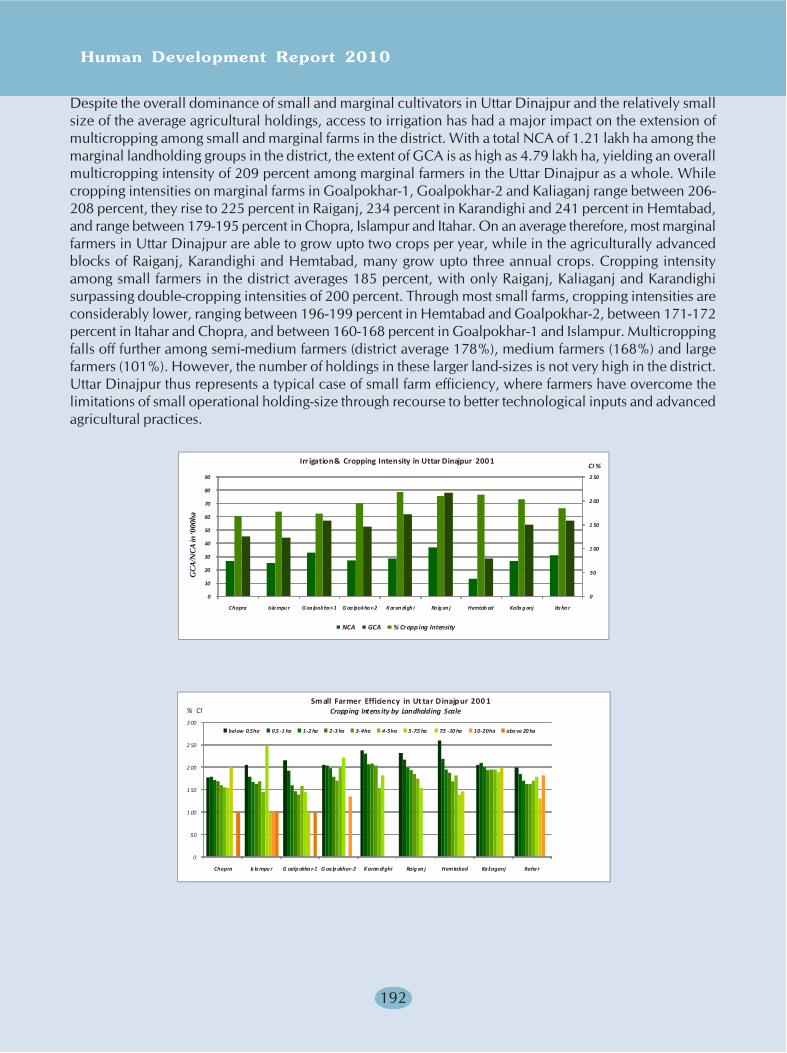
Human Development Report 2010
192
Despite the overall dominance of small and marginal cultivators in Uttar Dinajpur and the relatively smallsize of the average agricultural holdings, access to irrigation has had a major impact on the extension ofmulticropping among small and marginal farms in the district. With a total NCA of 1.21 lakh ha among themarginal landholding groups in the district, the extent of GCA is as high as 4.79 lakh ha, yielding an overallmulticropping intensity of 209 percent among marginal farmers in the Uttar Dinajpur as a whole. Whilecropping intensities on marginal farms in Goalpokhar-1, Goalpokhar-2 and Kaliaganj range between 206-208 percent, they rise to 225 percent in Raiganj, 234 percent in Karandighi and 241 percent in Hemtabad,and range between 179-195 percent in Chopra, Islampur and Itahar. On an average therefore, most marginalfarmers in Uttar Dinajpur are able to grow upto two crops per year, while in the agriculturally advancedblocks of Raiganj, Karandighi and Hemtabad, many grow upto three annual crops. Cropping intensityamong small farmers in the district averages 185 percent, with only Raiganj, Kaliaganj and Karandighisurpassing double-cropping intensities of 200 percent. Through most small farms, cropping intensities areconsiderably lower, ranging between 196-199 percent in Hemtabad and Goalpokhar-2, between 171-172percent in Itahar and Chopra, and between 160-168 percent in Goalpokhar-1 and Islampur. Multicroppingfalls off further among semi-medium farmers (district average 178%), medium farmers (168%) and largefarmers (101%). However, the number of holdings in these larger land-sizes is not very high in the district.Uttar Dinajpur thus represents a typical case of small farm efficiency, where farmers have overcome thelimitations of small operational holding-size through recourse to better technological inputs and advancedagricultural practices.
0
50
1 00
1 50
2 00
2 50
0
10
20
30
40
50
60
70
80
90
Chopra Isla mpu r G oa lpokha r-1 G oa lpokha r-2 Karan digh i Ra ig an j Hemtab ad Kalia g anj Ita ha r
NCA GCA % Cropping Intensity
CI %Irr igation & Cropping Intensity in Uttar Dinajpur 2001
0
50
1 00
1 50
2 00
2 50
3 00
Chopra Is la mpu r G oalp okha r-1 G oa lp okhar-2 K aran dighi Raig an j Hemtabad Ka liaganj Itaha r
below 0.5ha 0.5 -1 ha 1-2 ha 2-3 ha 3-4ha 4-5ha 5-7.5 ha 7.5 -10 ha 10-20ha abo ve 20 ha
Sm all Farmer Efficiency in Ut tar Dinajpur 200 1Cropping Intens ity by Landholding Scale% CI
GC
A/N
CA
in ‘0
00ha

Uttar Dinajpur
193
Subsidiary Rural Livelihood Activities
In marginal farmland areas where poorer land quality and limited access to water resources inhibit theintensification of agriculture, it is usual for mixed livelihood systems to evolve in which rural familiescombine farming operations with livestock based activities. The northern terai blocks of Chopra, Islampurand Goalpokhar-1 in Uttar Dinajpur, which still hold most of the district’s surviving forests and culturablewastelands, once specialised in such mixed livelihood activities. Two terai blocks, namely Goalpokhar-1and Chopra still hold nearly two-thirds of the non-agricultural lands in Uttar Dinajpur amounting to anaggregate area of 3387ha, within which Goalpokhar-1 alone accounts for 2426ha. Except in Raiganj blockwhich retains a fair proportion of the district’s protected and reserved forests, the non-agricultural areadeclines substantially in the southern blocks. Goalpokhar-1, Karandighi and Raiganj hold around 42 percentof the bovine livestock in Uttar Dinajpur which in 2004 amounted to 7.55 lakh heads of cattle and 0.34lakh buffaloes, with the average cattle holding per rural household in the district amounting to 1.83 livestockheads. The three blocks also held 48 percent of the livestock population of 6.83 lakh goats and 39 percentof the poultry population of 18.26 lakh birds. Over the long term however, the bovine population hasdeclined in Uttar Dinajpur, while the ovine and poultry population has risen over the same period. Withthe rise in human populations and increasing rural settlement across the district, there has been a substantialdecline in the accessibility of adequate pasturage. Rural households who engage in livestock based activitiesas a subsidiary form of livelihood have adapted to this change by shifting on a large scale from the rearingof larger livestock to the rearing of goats. Thus each rural household in the district now rears an average of1.66 goats, while in Goalpokhar-1 this average rises to 3.61 animals per household. Average backyardpoultry holdings in the district amount to 4.49 birds per household. While livestock activities based on therearing of goats and poultry involve smaller amounts of capital compared to bovine livestock, the milkeconomy is affected adversely in the rural areas. The shift from the milk economy to the meat economylargely benefits urban populations in Uttar Dinajpur and in the adjoining Siliguri area which relies onnorthern Uttar Dinajpur as its primary source for meat supplies. However, by reducing milk consumptionand nutritional levels among rural children, the shift has had an adverse impact on the health situation inUttar Dinajpur.
MAP: Livestock Economy in Uttar Dinajpur, 2004
Rural Households 2 00467-68 thousand (1)51-67 thousand (2)45-51 thousand (2)39-45 thousand (3)24-39 thousand (1)
Tot al Livestock310,000
Catt leBuffaloesGoatsPoul try
Rural Households 2 00467-68 thousand (1)51-67 thousand (2)45-51 thousand (2)39-45 thousand (3)24-39 thousand (1)
Livest ock per Household5.9
Cattle per hhBuffaloes per hhGoats per hhPoultry birds per h
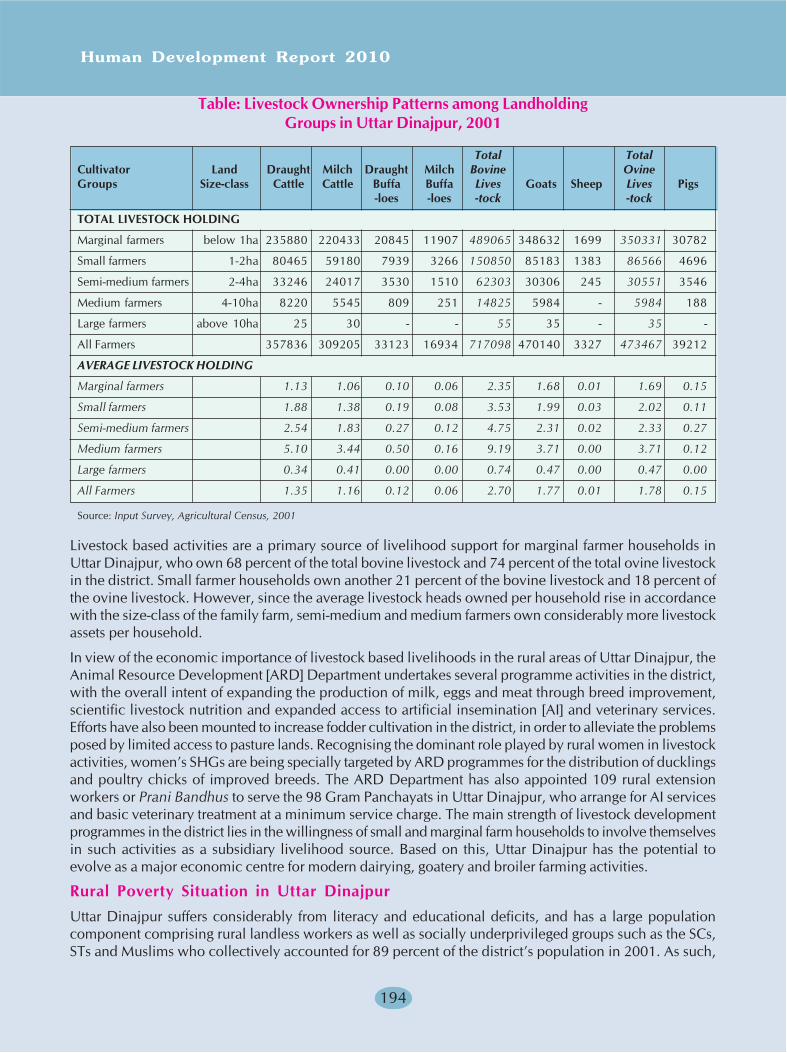
Human Development Report 2010
194
Table: Livestock Ownership Patterns among LandholdingGroups in Uttar Dinajpur, 2001
Total TotalCultivator Land Draught Milch Draught Milch Bovine OvineGroups Size-class Cattle Cattle Buffa Buffa Lives Goats Sheep Lives Pigs
-loes -loes -tock -tock
TOTAL LIVESTOCK HOLDING
Marginal farmers below 1ha 235880 220433 20845 11907 489065 348632 1699 350331 30782
Small farmers 1-2ha 80465 59180 7939 3266 150850 85183 1383 86566 4696
Semi-medium farmers 2-4ha 33246 24017 3530 1510 62303 30306 245 30551 3546
Medium farmers 4-10ha 8220 5545 809 251 14825 5984 - 5984 188
Large farmers above 10ha 25 30 - - 55 35 - 35 -
All Farmers 357836 309205 33123 16934 717098 470140 3327 473467 39212
AVERAGE LIVESTOCK HOLDING
Marginal farmers 1.13 1.06 0.10 0.06 2.35 1.68 0.01 1.69 0.15
Small farmers 1.88 1.38 0.19 0.08 3.53 1.99 0.03 2.02 0.11
Semi-medium farmers 2.54 1.83 0.27 0.12 4.75 2.31 0.02 2.33 0.27
Medium farmers 5.10 3.44 0.50 0.16 9.19 3.71 0.00 3.71 0.12
Large farmers 0.34 0.41 0.00 0.00 0.74 0.47 0.00 0.47 0.00
All Farmers 1.35 1.16 0.12 0.06 2.70 1.77 0.01 1.78 0.15
Source: Input Survey, Agricultural Census, 2001
Livestock based activities are a primary source of livelihood support for marginal farmer households inUttar Dinajpur, who own 68 percent of the total bovine livestock and 74 percent of the total ovine livestockin the district. Small farmer households own another 21 percent of the bovine livestock and 18 percent ofthe ovine livestock. However, since the average livestock heads owned per household rise in accordancewith the size-class of the family farm, semi-medium and medium farmers own considerably more livestockassets per household.
In view of the economic importance of livestock based livelihoods in the rural areas of Uttar Dinajpur, theAnimal Resource Development [ARD] Department undertakes several programme activities in the district,with the overall intent of expanding the production of milk, eggs and meat through breed improvement,scientific livestock nutrition and expanded access to artificial insemination [AI] and veterinary services.Efforts have also been mounted to increase fodder cultivation in the district, in order to alleviate the problemsposed by limited access to pasture lands. Recognising the dominant role played by rural women in livestockactivities, women’s SHGs are being specially targeted by ARD programmes for the distribution of ducklingsand poultry chicks of improved breeds. The ARD Department has also appointed 109 rural extensionworkers or Prani Bandhus to serve the 98 Gram Panchayats in Uttar Dinajpur, who arrange for AI servicesand basic veterinary treatment at a minimum service charge. The main strength of livestock developmentprogrammes in the district lies in the willingness of small and marginal farm households to involve themselvesin such activities as a subsidiary livelihood source. Based on this, Uttar Dinajpur has the potential toevolve as a major economic centre for modern dairying, goatery and broiler farming activities.
Rural Poverty Situation in Uttar DinajpurUttar Dinajpur suffers considerably from literacy and educational deficits, and has a large populationcomponent comprising rural landless workers as well as socially underprivileged groups such as the SCs,STs and Muslims who collectively accounted for 89 percent of the district’s population in 2001. As such,
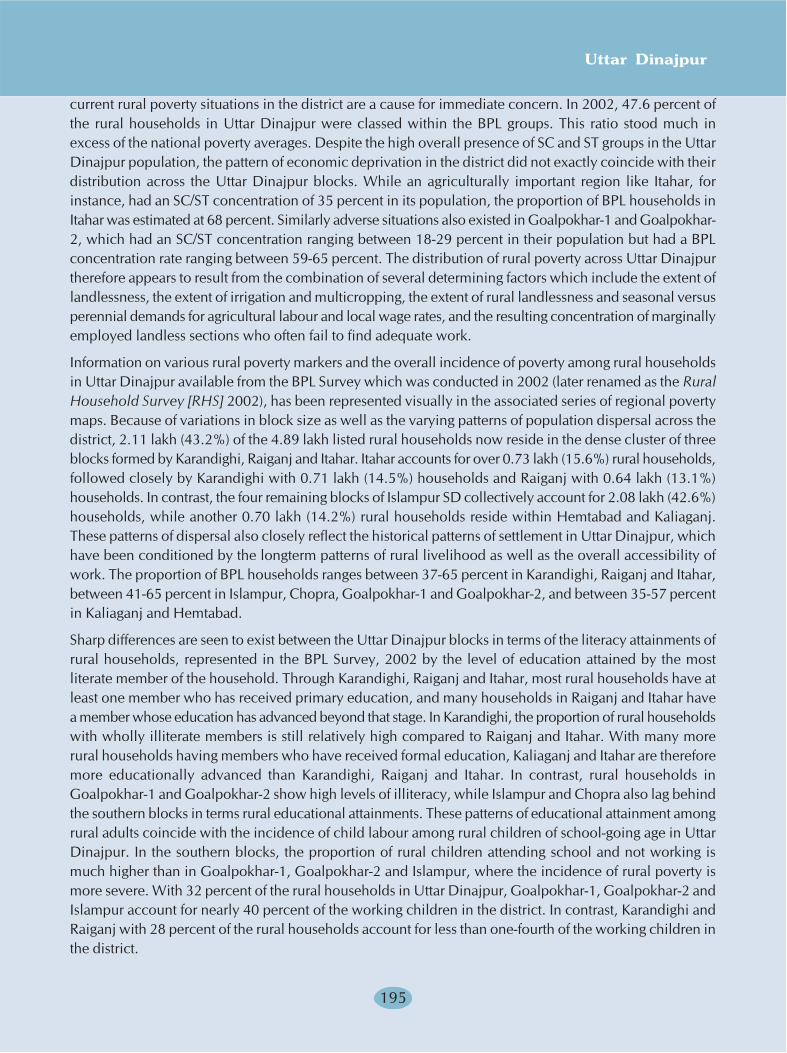
Uttar Dinajpur
195
current rural poverty situations in the district are a cause for immediate concern. In 2002, 47.6 percent ofthe rural households in Uttar Dinajpur were classed within the BPL groups. This ratio stood much inexcess of the national poverty averages. Despite the high overall presence of SC and ST groups in the UttarDinajpur population, the pattern of economic deprivation in the district did not exactly coincide with theirdistribution across the Uttar Dinajpur blocks. While an agriculturally important region like Itahar, forinstance, had an SC/ST concentration of 35 percent in its population, the proportion of BPL households inItahar was estimated at 68 percent. Similarly adverse situations also existed in Goalpokhar-1 and Goalpokhar-2, which had an SC/ST concentration ranging between 18-29 percent in their population but had a BPLconcentration rate ranging between 59-65 percent. The distribution of rural poverty across Uttar Dinajpurtherefore appears to result from the combination of several determining factors which include the extent oflandlessness, the extent of irrigation and multicropping, the extent of rural landlessness and seasonal versusperennial demands for agricultural labour and local wage rates, and the resulting concentration of marginallyemployed landless sections who often fail to find adequate work.
Information on various rural poverty markers and the overall incidence of poverty among rural householdsin Uttar Dinajpur available from the BPL Survey which was conducted in 2002 (later renamed as the RuralHousehold Survey [RHS] 2002), has been represented visually in the associated series of regional povertymaps. Because of variations in block size as well as the varying patterns of population dispersal across thedistrict, 2.11 lakh (43.2%) of the 4.89 lakh listed rural households now reside in the dense cluster of threeblocks formed by Karandighi, Raiganj and Itahar. Itahar accounts for over 0.73 lakh (15.6%) rural households,followed closely by Karandighi with 0.71 lakh (14.5%) households and Raiganj with 0.64 lakh (13.1%)households. In contrast, the four remaining blocks of Islampur SD collectively account for 2.08 lakh (42.6%)households, while another 0.70 lakh (14.2%) rural households reside within Hemtabad and Kaliaganj.These patterns of dispersal also closely reflect the historical patterns of settlement in Uttar Dinajpur, whichhave been conditioned by the longterm patterns of rural livelihood as well as the overall accessibility ofwork. The proportion of BPL households ranges between 37-65 percent in Karandighi, Raiganj and Itahar,between 41-65 percent in Islampur, Chopra, Goalpokhar-1 and Goalpokhar-2, and between 35-57 percentin Kaliaganj and Hemtabad.
Sharp differences are seen to exist between the Uttar Dinajpur blocks in terms of the literacy attainments ofrural households, represented in the BPL Survey, 2002 by the level of education attained by the mostliterate member of the household. Through Karandighi, Raiganj and Itahar, most rural households have atleast one member who has received primary education, and many households in Raiganj and Itahar havea member whose education has advanced beyond that stage. In Karandighi, the proportion of rural householdswith wholly illiterate members is still relatively high compared to Raiganj and Itahar. With many morerural households having members who have received formal education, Kaliaganj and Itahar are thereforemore educationally advanced than Karandighi, Raiganj and Itahar. In contrast, rural households inGoalpokhar-1 and Goalpokhar-2 show high levels of illiteracy, while Islampur and Chopra also lag behindthe southern blocks in terms rural educational attainments. These patterns of educational attainment amongrural adults coincide with the incidence of child labour among rural children of school-going age in UttarDinajpur. In the southern blocks, the proportion of rural children attending school and not working ismuch higher than in Goalpokhar-1, Goalpokhar-2 and Islampur, where the incidence of rural poverty ismore severe. With 32 percent of the rural households in Uttar Dinajpur, Goalpokhar-1, Goalpokhar-2 andIslampur account for nearly 40 percent of the working children in the district. In contrast, Karandighi andRaiganj with 28 percent of the rural households account for less than one-fourth of the working children inthe district.

Human Development Report 2010
196
MAP: Rural Educational Attainments & Child Labour in Uttar Dinajpur, 2002
Rural Househo ld s 2002
76,300 to 76,400 (1)71,100 to 76,300 (1)63,800 to 71,100 (1)50,600 to 63,800 (4)29,600 to 50,600 (2)
Most LiterateAd ults 2002
29,000
Ill iterateupto class 5upto class 10Graduate/Dipl omaPostgraduate/Professional
Rural Ho useho ld s 2002
76,300 to 76,400 (1)71,100 to 76,300 (1)63,800 to 71,100 (1)50,600 to 63,800 (4)29,600 to 50,600 (2)
Working Children (5-14y)2002
69,00034,5006,900
U nschooled & WorkingSchooled & WorkingSchooled & Not Working
The severity of regional poverty in Uttar Dinajpur is further substantiated by the poverty indicators usedduring the BPL Survey, 2002, which reveal the plural dimensions of rural poverty in the district. In thedensely populated blocks of Karandighi, Raiganj and Itahar, the major sources of poverty are rooted in thelack of adequate education and adequate opportunities for year-round work. The resulting pressure onchildren of school-going age to go out and work is also correspondingly high, particularly in Itahar andKarandighi. Labour out-migration in search of work is also present in Raiganj and Karandighi and reachesappreciable proportions in Itahar. The rural poor in Itahar also suffer from a greater degree of food insecurityand houselessness, and the insufficiency of clothing is common to the rural poor in all three blocks.Although the overall poverty situation improves in Hemtabad and Kaliaganj, the main cause of rural povertyin these blocks is the lack of adequate opportunities for work, which also results in seasonal labour out-migration. While pressure on children to work also prevails among the poorer sections of the rural populationin both blocks, under-education is more of a problem in Kaliaganj and does not affect Hemtabad to thesame extent. Uttar Dinajpur occupies an adverse position with regard to the provision of basic entitlements,including food, shelter and clothing to the rural population. Throughout the northern blocks of IslampurSD, rural poverty is rooted in the casual nature of rural work opportunities and in the inadequate educationalattainments of the rural population. The pressure on children to work is also relatively high, particularly inGoalpokhar-1 and Goalpokhar-2. With the exception of Islampur block, the pressure for rural workers tomigrate in search of work is also high, even in Chopra where diversified work opportunities are availableoutside the agricultural sector. A significant section among the rural poor in Goalpokhar-1 and Goalpokhar-2 is also houseless and food-insecure.
Indebtedness among the rural poor is a phenomenon that prevails widely in rural regions. Even thoughindebtedness levels vary across the district, sizeable sections of the rural population in the Uttar Dinajpurblocks incur debt both for meeting consumption expenditure as well as for other productive purposes.Consumption loans are nearly as important as production loans in most rural areas of Uttar Dinajpur.Significantly, few rural borrowers across the district, other than a small section of rural households living inRaiganj and Karandighi near the headquarters region, are able secure such loans from formal credit institutionsin the public and cooperative sector, and have to depend therefore on high interest bearing loans taken
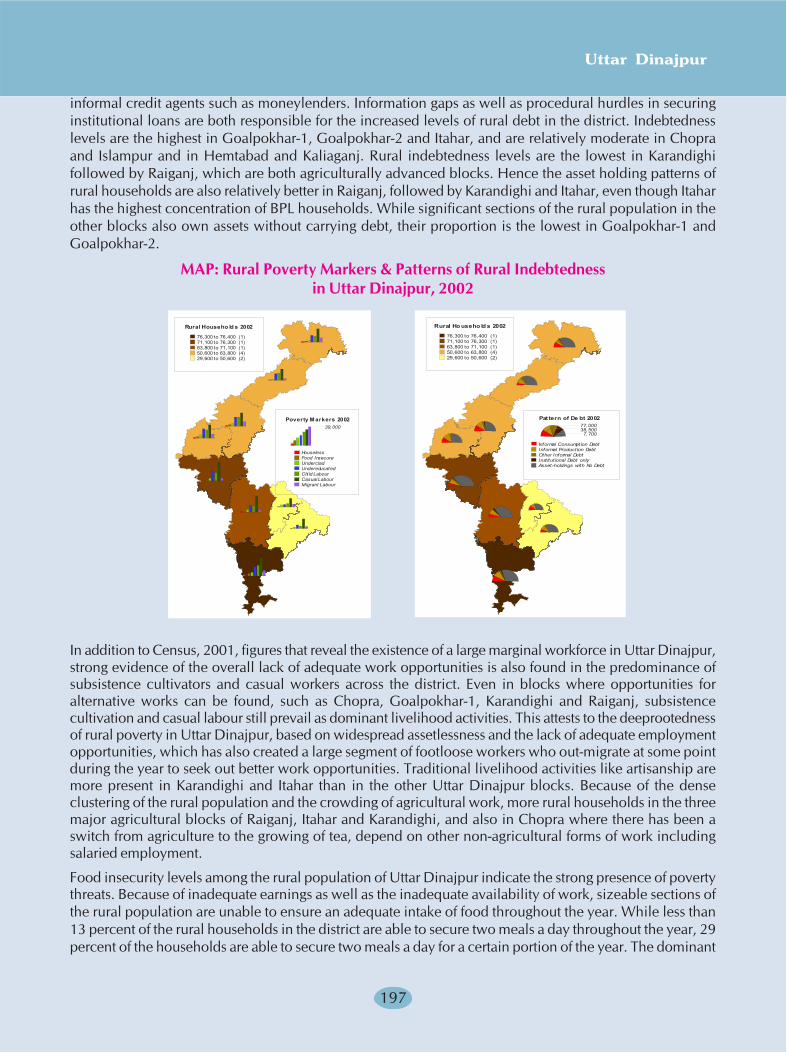
Uttar Dinajpur
197
informal credit agents such as moneylenders. Information gaps as well as procedural hurdles in securinginstitutional loans are both responsible for the increased levels of rural debt in the district. Indebtednesslevels are the highest in Goalpokhar-1, Goalpokhar-2 and Itahar, and are relatively moderate in Chopraand Islampur and in Hemtabad and Kaliaganj. Rural indebtedness levels are the lowest in Karandighifollowed by Raiganj, which are both agriculturally advanced blocks. Hence the asset holding patterns ofrural households are also relatively better in Raiganj, followed by Karandighi and Itahar, even though Itaharhas the highest concentration of BPL households. While significant sections of the rural population in theother blocks also own assets without carrying debt, their proportion is the lowest in Goalpokhar-1 andGoalpokhar-2.
MAP: Rural Poverty Markers & Patterns of Rural Indebtednessin Uttar Dinajpur, 2002
Rural Househo ld s 2002
76,300 to 76,400 (1)71,100 to 76,300 (1)63,800 to 71,100 (1)50,600 to 63,800 (4)29,600 to 50,600 (2)
Poverty Markers 200239,000
HouselessFood InsecureUndercladUndereducatedChi ld LabourCasual LabourMigrant Labour
Rural Ho useho ld s 2002
76,300 to 76,400 (1)71,100 to 76,300 (1)63,800 to 71,100 (1)50,600 to 63,800 (4)29,600 to 50,600 (2)
Pat tern of De bt 200277,00038,5007,700
Informal Consumption DebtInformal Production DebtOther Informal DebtInstitutional Debt onlyAsset-holdings with No Debt
In addition to Census, 2001, figures that reveal the existence of a large marginal workforce in Uttar Dinajpur,strong evidence of the overall lack of adequate work opportunities is also found in the predominance ofsubsistence cultivators and casual workers across the district. Even in blocks where opportunities foralternative works can be found, such as Chopra, Goalpokhar-1, Karandighi and Raiganj, subsistencecultivation and casual labour still prevail as dominant livelihood activities. This attests to the deeprootednessof rural poverty in Uttar Dinajpur, based on widespread assetlessness and the lack of adequate employmentopportunities, which has also created a large segment of footloose workers who out-migrate at some pointduring the year to seek out better work opportunities. Traditional livelihood activities like artisanship aremore present in Karandighi and Itahar than in the other Uttar Dinajpur blocks. Because of the denseclustering of the rural population and the crowding of agricultural work, more rural households in the threemajor agricultural blocks of Raiganj, Itahar and Karandighi, and also in Chopra where there has been aswitch from agriculture to the growing of tea, depend on other non-agricultural forms of work includingsalaried employment.
Food insecurity levels among the rural population of Uttar Dinajpur indicate the strong presence of povertythreats. Because of inadequate earnings as well as the inadequate availability of work, sizeable sections ofthe rural population are unable to ensure an adequate intake of food throughout the year. While less than13 percent of the rural households in the district are able to secure two meals a day throughout the year, 29percent of the households are able to secure two meals a day for a certain portion of the year. The dominant

Human Development Report 2010
198
section, comprising 36 percent of the rural households in Uttar Dinajpur, can only ensure the availabilityof one meal a day throughout the year, and around one-fourth of the rural households are highly foodinsecure. Thus with more than four-fifths of the rural households not being assured of two square meals perday throughout the year, rural Uttar Dinajpur is still a long way from being food secure. Food insecurityreaches severe levels in Goalpokhar-1 and Goalpokhar-2, where more than 90 percent of the ruralhouseholds are not assured of two square meals per day throughout the year, over two-thirds are notassured of two daily meals at any point during the year, and close to one-third cannot secure one daily mealthroughout the year. Chronic food insecurity, which exists in situations where the earnings of the householdare not adequate to be assured even one daily meal through most of the year, affects around 8 percent of therural households in Goalpokhar-1, Goalpokhar-2 and Itahar, around 6-7 percent of the households inRaiganj and Hemtabad, and around 3-5 percent of the households through the rest of the district. Withmore work opportunities outside the farm sector and relatively high work participation rates, Karandighi ismost favourably placed in terms of its low rate of chronic food insecurity. Nonavailability of year-roundwork also creates a link between food insecurity and rural indebtedness in the district. The proportion ofloans taken for consumption purposes is relatively high through most Uttar Dinajpur blocks, since theseloans provide the households with a means during periods of seasonal slack and food deprivation. Thepaucity of year-round work opportunities through most of the rural Uttar Dinajpur, therefore, extracts amultiple price.
MAP: Work & Food Security in Uttar Dinajpur
Rural Househ olds 2002
76,300 to 76,400 (1)71,100 to 76,300 (1)63,800 to 71,100 (1)50,600 to 63,800 (4)29,600 to 50,600 (2)
Ru ral Occupation s 200239,000
Casual LabourSubsis tence CultivationArtisanshipSalaried WorkOther Work
Rural Ho useho ld s 2002
76,300 to 76,400 (1)71,100 to 76,300 (1)63,800 to 71,100 (1)50,600 to 63,800 (4)29,600 to 50,600 (2)
Food Security St atus 200277,00038,500
7,700
<1 meal/day most of the year1 meal/day most of the year1 meal/day all of the year2 meals/day most of the year2 meals/day all of the year
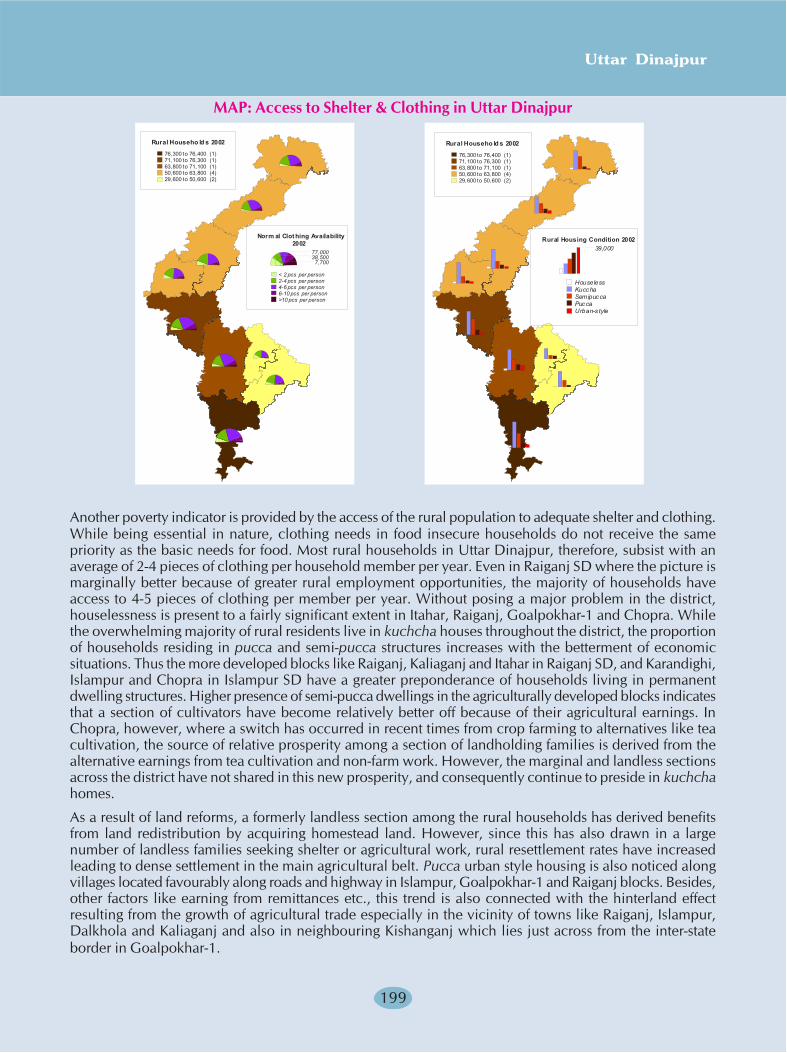
Uttar Dinajpur
199
Rural Househo ld s 2002
76,300 to 76,400 (1)71,100 to 76,300 (1)63,800 to 71,100 (1)50,600 to 63,800 (4)29,600 to 50,600 (2)
Norm al Clot hing Availability2002
77,00038,500
7,700
< 2 pcs per person2-4 pcs per person4-6 pcs per person6-10 pcs per person>10 pcs per person
Rural Househo ld s 2002
76,300 to 76,400 (1)71,100 to 76,300 (1)63,800 to 71,100 (1)50,600 to 63,800 (4)29,600 to 50,600 (2)
Rural Housing Condition 200239,000
HouselessKucchaSemipuccaPuccaUrban-s tyle
MAP: Access to Shelter & Clothing in Uttar Dinajpur
Another poverty indicator is provided by the access of the rural population to adequate shelter and clothing.While being essential in nature, clothing needs in food insecure households do not receive the samepriority as the basic needs for food. Most rural households in Uttar Dinajpur, therefore, subsist with anaverage of 2-4 pieces of clothing per household member per year. Even in Raiganj SD where the picture ismarginally better because of greater rural employment opportunities, the majority of households haveaccess to 4-5 pieces of clothing per member per year. Without posing a major problem in the district,houselessness is present to a fairly significant extent in Itahar, Raiganj, Goalpokhar-1 and Chopra. Whilethe overwhelming majority of rural residents live in kuchcha houses throughout the district, the proportionof households residing in pucca and semi-pucca structures increases with the betterment of economicsituations. Thus the more developed blocks like Raiganj, Kaliaganj and Itahar in Raiganj SD, and Karandighi,Islampur and Chopra in Islampur SD have a greater preponderance of households living in permanentdwelling structures. Higher presence of semi-pucca dwellings in the agriculturally developed blocks indicatesthat a section of cultivators have become relatively better off because of their agricultural earnings. InChopra, however, where a switch has occurred in recent times from crop farming to alternatives like teacultivation, the source of relative prosperity among a section of landholding families is derived from thealternative earnings from tea cultivation and non-farm work. However, the marginal and landless sectionsacross the district have not shared in this new prosperity, and consequently continue to preside in kuchchahomes.
As a result of land reforms, a formerly landless section among the rural households has derived benefitsfrom land redistribution by acquiring homestead land. However, since this has also drawn in a largenumber of landless families seeking shelter or agricultural work, rural resettlement rates have increasedleading to dense settlement in the main agricultural belt. Pucca urban style housing is also noticed alongvillages located favourably along roads and highway in Islampur, Goalpokhar-1 and Raiganj blocks. Besides,other factors like earning from remittances etc., this trend is also connected with the hinterland effectresulting from the growth of agricultural trade especially in the vicinity of towns like Raiganj, Islampur,Dalkhola and Kaliaganj and also in neighbouring Kishanganj which lies just across from the inter-stateborder in Goalpokhar-1.
Human Development Report 2010
200
Non-Farm Livelihoods in Uttar DinajpurAlthough agriculture continues to be the principal provider of rural livelihoods in Uttar Dinajpur, escalatingpressure on land and rising competition among wage-labourer has greatly reduced livelihood securitywithin the agricultural sector, deepening the incidence of rural poverty in the district. Technological advanceslike intensified groundwater irrigation and multicropping which had previously expanded agriculturalemployment have gradually reached their physical limits. Hence the amelioration of the rural livelihoodcrisis in Uttar Dinajpur will depend ultimately on the growth of non-farm employment on a suitable scale.Although lacking in medium or large-scale industries with the exception of the ailing West Dinajpur SpinningMills at Raiganj, Uttar Dinajpur has traditionally had a base of rural non-farm activities that include homebased industry and artisanship, crafts & cottage industries and small-scale agro processing units in theunorganised sector. In blocks like Itahar, Raiganj and Karandighi where land pressures the highest, thesetraditional activities have formed a livelihood substitute for rural households which combine non-farmemployment with part-time or seasonal engagement as wage labourer. The spread of tea plantations in thenorthern blocks has also encouraged a switch from agriculture to non-agricultural employment in theplantations and bought leaf factories in several parts of Chopra, Islampur and Goalpokhar-1. A flourishingbeedi binding industry has taken root in Karandighi which engages vast numbers of rural women as informalhome based workers. More than eleven hundred rural households across the district are engaged in traditionalcrafts based industries, among which dhokra mat making, terracotta, village pottery and bamboo craft inthe Goalpokhar-1 and Kaliaganj regions are notable. Concentrations of small and micro enterprises engagedin various manufacturing services also exist at several places within Uttar Dinajpur, among which thosearound Raiganj and Kaliaganj are most significant.
Although many places in rural Uttar Dinajpur have difficult communications because of their proximity tothe long international border, the district in itself forms an arterial link between the northernmost districtsof West Bengal and the southern region. Railways touch several important points in Islampur SD, linkingthem to Siliguri and Kishanganj. The railway transit corridor between Barsoi in Bihar and Radhikapur onthe international border in Kaliaganj block passes through Raiganj and has recently been upgraded toprovide direct railway connectivity to the city of Raiganj. Two busy national highways pass through thedistrict, of which NH31 connects Uttar Dinajpur to Guwahati and the Northeast and transits into Bihar,while NH34 connects the district to Kolkata, with Dalkola serving as the junction point of the two highways.With such high arterial connectivity, Uttar Dinajpur has the potential to emerge as a major manufacturingand processing area particularly for agro based industry, since it also has a large labourforce with lowwage demands. Jute, pineapples and tea are already being produced in the district on a commercial scale,in addition to vast quantities of rice. Thus industrialisation in the district is not a distant possibility, and canbe accelerated over the near future if the right combinations of public and private investment decisions aremade.
Crafts based livelihood activities in Uttar Dinajpur can be looked at as a step within the traditional ruralindustrialisation process, where rural community groups that have little control over agricultural land havesupplemented wage-labourer earnings with earnings acquired from the efficient practice of specific artisanalskills in conjunction with locally available materials and resources. As enterprise activities, artisanship andcraftsmanship are thus very similar to industrial processes. Because of its antiquity, the Dinajpur region hasa long historical tradition of fine craftsmanship and artisanal trades. Artisan groups comprise sizeablesections of the SC and OBC communities in Uttar Dinajpur, some of whom have migrated into the districtfrom East Bengal in the wake of Partition while others have been resident in the district for a longer lengthof time. All Uttar Dinajpur blocks with the exception of Goalpokhar-2 thus have artisanal clusters in theirmidst, where large groups of artisan households practising the same craft live in close proximity to eachother. Like any modern industrial complex, the clustered location of artisanal crafts in the district extendsthe benefits of economies of scale to each artisan household by reducing organisational and marketingcosts considerably. Extension of credit and technical support under various government schemes also
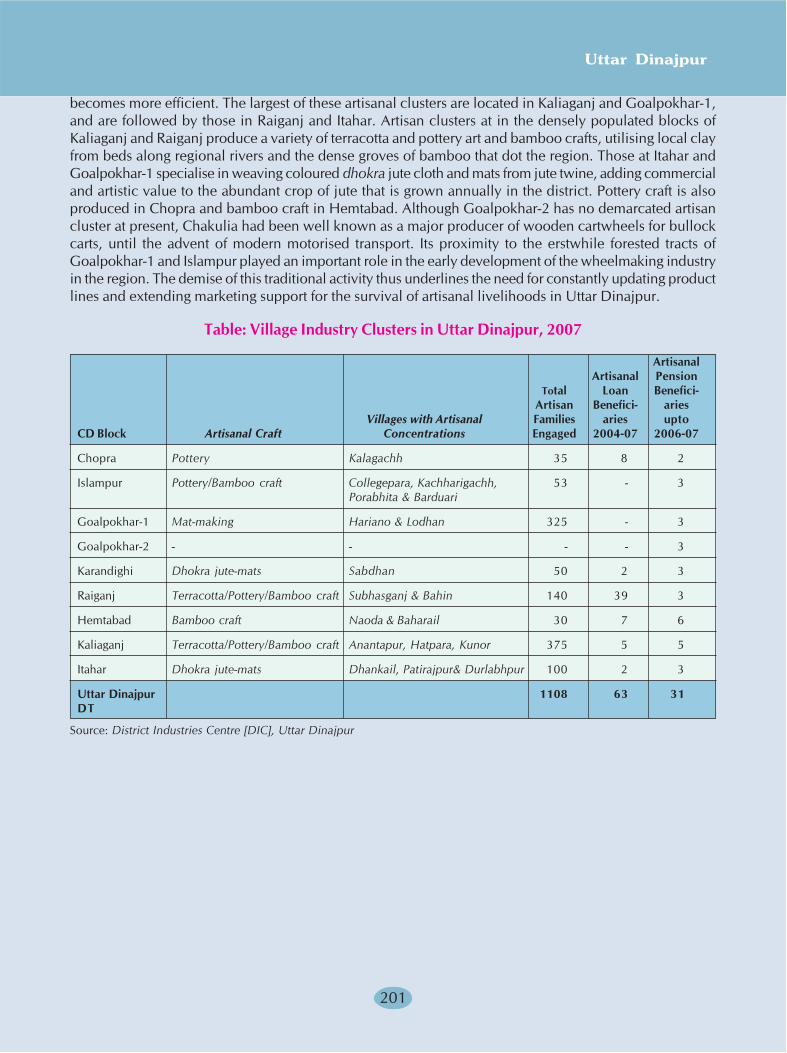
Uttar Dinajpur
201
becomes more efficient. The largest of these artisanal clusters are located in Kaliaganj and Goalpokhar-1,and are followed by those in Raiganj and Itahar. Artisan clusters at in the densely populated blocks ofKaliaganj and Raiganj produce a variety of terracotta and pottery art and bamboo crafts, utilising local clayfrom beds along regional rivers and the dense groves of bamboo that dot the region. Those at Itahar andGoalpokhar-1 specialise in weaving coloured dhokra jute cloth and mats from jute twine, adding commercialand artistic value to the abundant crop of jute that is grown annually in the district. Pottery craft is alsoproduced in Chopra and bamboo craft in Hemtabad. Although Goalpokhar-2 has no demarcated artisancluster at present, Chakulia had been well known as a major producer of wooden cartwheels for bullockcarts, until the advent of modern motorised transport. Its proximity to the erstwhile forested tracts ofGoalpokhar-1 and Islampur played an important role in the early development of the wheelmaking industryin the region. The demise of this traditional activity thus underlines the need for constantly updating productlines and extending marketing support for the survival of artisanal livelihoods in Uttar Dinajpur.
Table: Village Industry Clusters in Uttar Dinajpur, 2007
ArtisanalArtisanal Pension
Total Loan Benefici-Artisan Benefici- aries
Villages with Artisanal Families aries uptoCD Block Artisanal Craft Concentrations Engaged 2004-07 2006-07
Chopra Pottery Kalagachh 35 8 2
Islampur Pottery/Bamboo craft Collegepara, Kachharigachh, 53 - 3Porabhita & Barduari
Goalpokhar-1 Mat-making Hariano & Lodhan 325 - 3
Goalpokhar-2 - - - - 3
Karandighi Dhokra jute-mats Sabdhan 50 2 3
Raiganj Terracotta/Pottery/Bamboo craft Subhasganj & Bahin 140 39 3
Hemtabad Bamboo craft Naoda & Baharail 30 7 6
Kaliaganj Terracotta/Pottery/Bamboo craft Anantapur, Hatpara, Kunor 375 5 5
Itahar Dhokra jute-mats Dhankail, Patirajpur& Durlabhpur 100 2 3
Uttar Dinajpur 1108 63 31DT
Source: District Industries Centre [DIC], Uttar Dinajpur
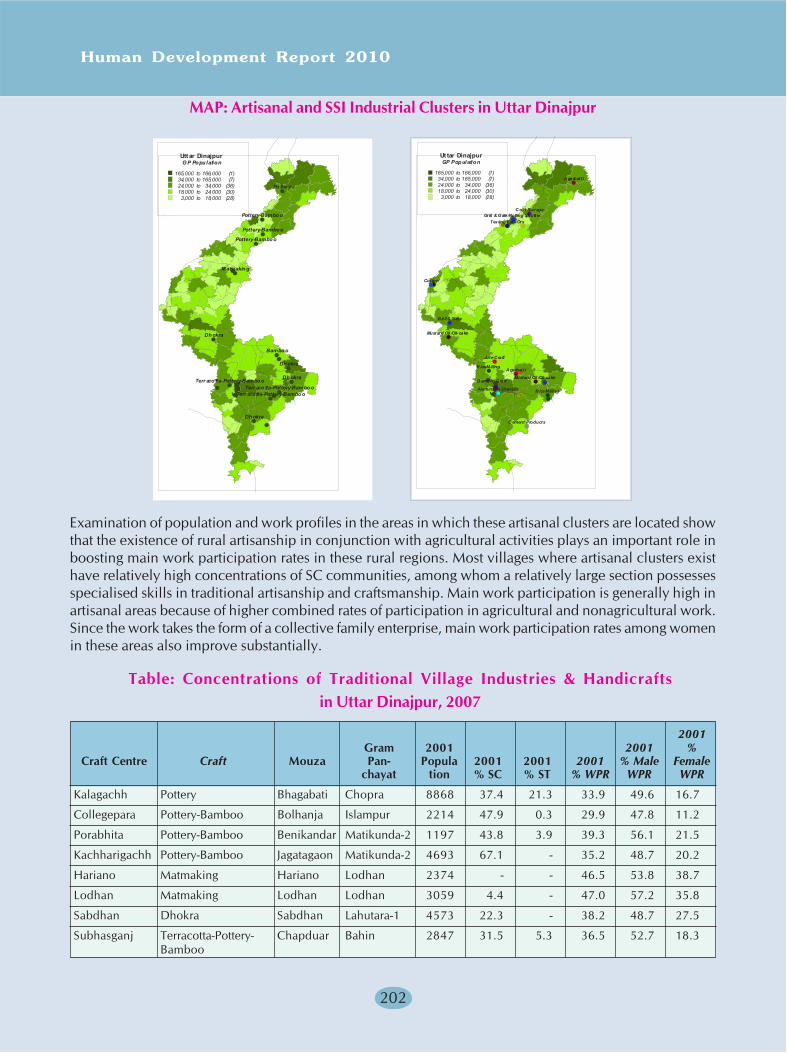
Human Development Report 2010
202
MAP: Artisanal and SSI Industrial Clusters in Uttar Dinajpur
HealthcareAccessib ilityUtt ar Dinajpur
G P Population
165,000 to 166,000 (1)34,000 to 165,000 (7)24,000 to 34,000 (36)18,000 to 24,000 (30)3,000 to 18,000 (28)
Po ttery
Pottery-Bambo o
Pottery-Bambo o
Pottery-Bamboo
Matmaking
Dh okra
Terr aco tta-Pottery-Bambo o
Bambo o
Dh okra
Dh okra
Terr aco tta-Pottery-Bambo oTerr aco tta-Pottery-Bambo o
Dh okra
HealthcareAccessib ility
A garbatt i
C old Storage
Testing Lab-OrsGrill & Gate /Rolling Shutter
Cotton
Mustard Oil /Oil-cake
Gri ll & Gate
Jute C raft
Aluminium Utensils
B amboo C raft
R ice MillingA garbatt i
R ice Milling
Mustard Oil /Oil-cake
C ement Products
Ut tar DinajpurGP Population
165,000 to 166,000 (1)34,000 to 165,000 (7)24,000 to 34,000 (36)18,000 to 24,000 (30)
3,000 to 18,000 (28)
Examination of population and work profiles in the areas in which these artisanal clusters are located showthat the existence of rural artisanship in conjunction with agricultural activities plays an important role inboosting main work participation rates in these rural regions. Most villages where artisanal clusters existhave relatively high concentrations of SC communities, among whom a relatively large section possessesspecialised skills in traditional artisanship and craftsmanship. Main work participation is generally high inartisanal areas because of higher combined rates of participation in agricultural and nonagricultural work.Since the work takes the form of a collective family enterprise, main work participation rates among womenin these areas also improve substantially.
Table: Concentrations of Traditional Village Industries & Handicraftsin Uttar Dinajpur, 2007
2001Gram 2001 2001 %
Craft Centre Craft Mouza Pan- Popula 2001 2001 2001 % Male Femalechayat tion % SC % ST % WPR WPR WPR
Kalagachh Pottery Bhagabati Chopra 8868 37.4 21.3 33.9 49.6 16.7
Collegepara Pottery-Bamboo Bolhanja Islampur 2214 47.9 0.3 29.9 47.8 11.2
Porabhita Pottery-Bamboo Benikandar Matikunda-2 1197 43.8 3.9 39.3 56.1 21.5
Kachharigachh Pottery-Bamboo Jagatagaon Matikunda-2 4693 67.1 - 35.2 48.7 20.2
Hariano Matmaking Hariano Lodhan 2374 - - 46.5 53.8 38.7
Lodhan Matmaking Lodhan Lodhan 3059 4.4 - 47.0 57.2 35.8
Sabdhan Dhokra Sabdhan Lahutara-1 4573 22.3 - 38.2 48.7 27.5
Subhasganj Terracotta-Pottery- Chapduar Bahin 2847 31.5 5.3 36.5 52.7 18.3Bamboo

Uttar Dinajpur
203
Table: Concentrations of Traditional Village Industries & Handicraftsin Uttar Dinajpur, 2007 (Contd.)
2001Gram 2001 2001 %
Craft Centre Craft Mouza Pan- Popula 2001 2001 2001 % Male Femalechayat tion % SC % ST % WPR WPR WPR
Bahin Terracotta-Pottery- Bahin Bahin 2251 14.6 - 32.1 48.5 15.1Bamboo
Baharail Bamboo Baharail Bishnupur 1092 49.0 6.3 47.5 60.3 34.1
Naoda Bamboo Naoda Naoda 2856 43.9 5.4 40.7 54.5 25.9
Anantapur Dhokra Anantapur Anantapur 1605 65.5 0.8 59.5 67.4 51.3
Dhanakail DhokraDhankail Dhankail 2179 82.2 2.4 36.8 56.5 15.8
Mustafanagar Terracotta-Pottery- Mustafa- Mustafa- 3695 59.5 21.6 37.9 48.9 25.8Bamboo nagar nagar
Hatpara Terracotta-Pottery- Hatpara Mustafa- 1019 58.5 - 44.1 56.3 31.5Bamboo nagar
Kunor Terracotta-Pottery- Kunor Mustafa- 3878 22.6 5.8 50.1 57.0 42.4Bamboo nagar
Durlabhpur Dhokra Purba Durlabhpur 1962 16.2 - 44.4 54.5 34.4Durlabhpur
Patirajpur Dhokra Patirajpur Patirajpur 1343 46.4 8.1 43.7 58.7 27.4
2001 20012001 2001 % 2001 Total 2001
2001 2001 2001 % % Male Female Total Non- 2001 % NonTotal HHI Other Margi- Margi- Margi- Agri Agri % Agri -AgriWor- Wor- Wor- nal nal nal Wor- Wor- Wor- Wor-
Craft Centre Mouza kers kers kers WPR WPR WPR kers kers kers kers
Kalagachh Bhagabati 3004 65 2186 4.4 4.9 3.9 753 2251 25.1 74.9
Collegepara Bolhanja 663 49 355 6.7 6.7 6.8 259 404 39.1 60.9
Porabhita Benikandar 471 3 249 1.7 2.1 1.2 219 252 46.5 53.5
Kachharigachh Jagatagaon 1651 33 406 4.9 2.7 7.3 1212 439 73.4 26.6
Hariano Hariano 1104 188 64 10.7 2.4 19.5 852 252 77.2 22.8
Lodhan Lodhan 1437 255 163 12.7 6.4 19.5 1019 418 70.9 29.1
Sabdhan Sabdhan 1745 23 396 12.8 5.5 20.2 1326 419 76.0 24.0
Subhasganj Chapduar 1038 10 445 5.6 2.6 8.9 583 455 56.2 43.8
Bahin Bahin 722 191 128 5.2 6.2 4.2 403 319 55.8 44.2
Baharail Baharail 519 1 86 8.6 6.3 11.1 432 87 83.2 16.8
Naoda Naoda 1161 108 205 3.5 1.6 5.6 848 313 73.0 27.0
Anantapur Anantapur 955 4 97 26.2 14.1 38.7 854 101 89.4 10.6
Dhankail Dhankail 801 23 517 4.7 4.6 4.7 261 540 32.6 67.4
Mustafanagar Mustafanagar 1400 117 224 3.2 1.2 5.3 1059 341 75.6 24.4
Hatpara Hatpara 449 76 144 5.5 1.6 9.5 229 220 51.0 49.0
Kunor Kunor 1943 109 443 9.6 3.9 16.0 1391 552 71.6 28.4
Durlabhpur Purba Durlabhpur 871 55 100 9.6 1.7 17.4 716 155 82.2 17.8
Patirajpur Patirajpur 587 46 256 2.4 2.9 1.9 285 302 48.6 51.4
Source: Census, 2001
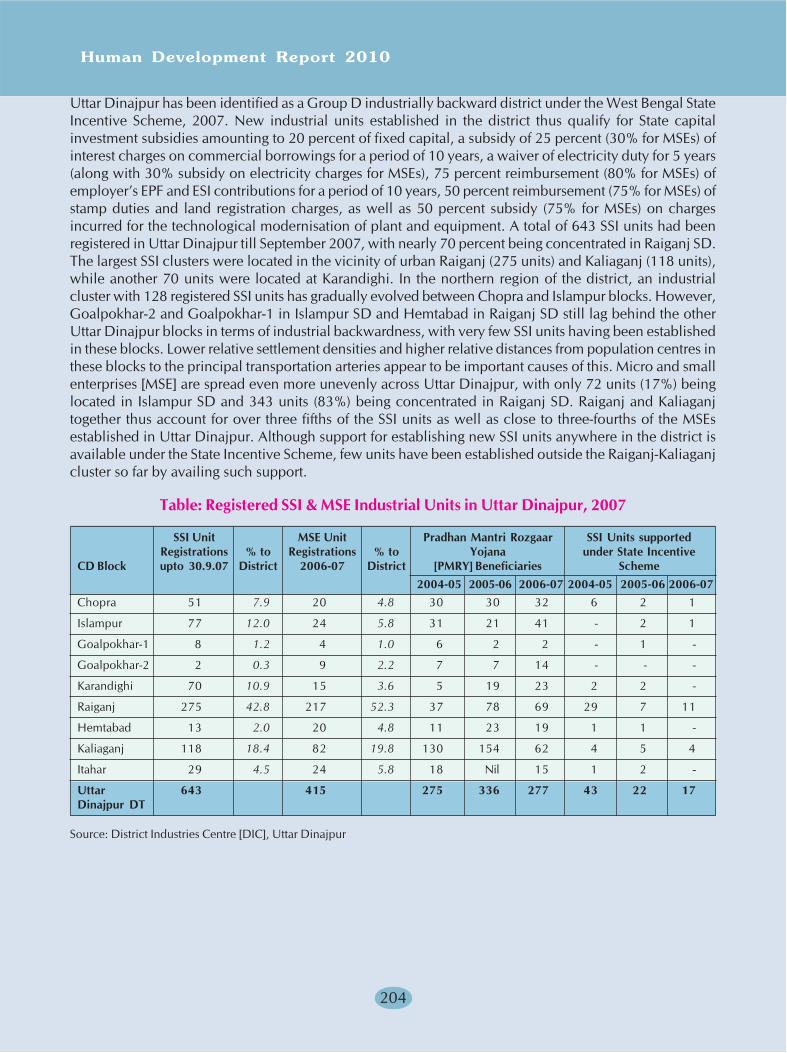
Human Development Report 2010
204
Uttar Dinajpur has been identified as a Group D industrially backward district under the West Bengal StateIncentive Scheme, 2007. New industrial units established in the district thus qualify for State capitalinvestment subsidies amounting to 20 percent of fixed capital, a subsidy of 25 percent (30% for MSEs) ofinterest charges on commercial borrowings for a period of 10 years, a waiver of electricity duty for 5 years(along with 30% subsidy on electricity charges for MSEs), 75 percent reimbursement (80% for MSEs) ofemployer’s EPF and ESI contributions for a period of 10 years, 50 percent reimbursement (75% for MSEs) ofstamp duties and land registration charges, as well as 50 percent subsidy (75% for MSEs) on chargesincurred for the technological modernisation of plant and equipment. A total of 643 SSI units had beenregistered in Uttar Dinajpur till September 2007, with nearly 70 percent being concentrated in Raiganj SD.The largest SSI clusters were located in the vicinity of urban Raiganj (275 units) and Kaliaganj (118 units),while another 70 units were located at Karandighi. In the northern region of the district, an industrialcluster with 128 registered SSI units has gradually evolved between Chopra and Islampur blocks. However,Goalpokhar-2 and Goalpokhar-1 in Islampur SD and Hemtabad in Raiganj SD still lag behind the otherUttar Dinajpur blocks in terms of industrial backwardness, with very few SSI units having been establishedin these blocks. Lower relative settlement densities and higher relative distances from population centres inthese blocks to the principal transportation arteries appear to be important causes of this. Micro and smallenterprises [MSE] are spread even more unevenly across Uttar Dinajpur, with only 72 units (17%) beinglocated in Islampur SD and 343 units (83%) being concentrated in Raiganj SD. Raiganj and Kaliaganjtogether thus account for over three fifths of the SSI units as well as close to three-fourths of the MSEsestablished in Uttar Dinajpur. Although support for establishing new SSI units anywhere in the district isavailable under the State Incentive Scheme, few units have been established outside the Raiganj-Kaliaganjcluster so far by availing such support.
Table: Registered SSI & MSE Industrial Units in Uttar Dinajpur, 2007
SSI Unit MSE Unit Pradhan Mantri Rozgaar SSI Units supportedRegistrations % to Registrations % to Yojana under State Incentive
CD Block upto 30.9.07 District 2006-07 District [PMRY] Beneficiaries Scheme2004-05 2005-06 2006-07 2004-05 2005-06 2006-07
Chopra 51 7.9 20 4.8 30 30 32 6 2 1
Islampur 77 12.0 24 5.8 31 21 41 - 2 1
Goalpokhar-1 8 1.2 4 1.0 6 2 2 - 1 -
Goalpokhar-2 2 0.3 9 2.2 7 7 14 - - -
Karandighi 70 10.9 15 3.6 5 19 23 2 2 -
Raiganj 275 42.8 217 52.3 37 78 69 29 7 11
Hemtabad 13 2.0 20 4.8 11 23 19 1 1 -
Kaliaganj 118 18.4 82 19.8 130 154 62 4 5 4
Itahar 29 4.5 24 5.8 18 Nil 15 1 2 -
Uttar 643 415 275 336 277 43 22 17Dinajpur DT
Source: District Industries Centre [DIC], Uttar Dinajpur

Uttar Dinajpur
205
Nevertheless, as the barchart shows, along with the rapid growth of MSE registrations in Uttar Dinajpurstarting from the 1990s, there has also been considerable diversification in their activity spheres. Microenterprise in the district commenced with the registration of the first bamboo craft and pottery units in thelate 1960s, which are now listed under the manufacture of wood & straw products etc. and other mineralbased products under the National Industrial Classification codes of 1998 [NIC98]. Building on the artisanalbase of the district, the units in these two large groups have multiplied in number, while diversifying intothe manufacture of jute textile and cement products. Meanwhile a large group of primary food processingand milling units has also come onstream, producing mustard oil and pulses along with wheat and rice.Diversification has also taken place at the secondary and tertiary level into the manufacture of chemicalproducts, fabricated steel products, as well as woodcraft and storage units. Thus the process of industrialdiversification that Uttar Dinajpur has seen offers ample evidence that a policy of judicious State support toartisanal activities ultimately encourages the proliferation and diversification of economic enterprise into amuch wider range of industrial activities. While this process so far has mainly been seen within the Raiganj-Kaliaganj cluster, it can now be widened into several other regions within Uttar Dinajpur that are well-linked by the transportation network.
Of the 293 industrial manufacturing establishments that were functioning in Uttar Dinajpur in 2007, 121were located in the four municipal towns while 172 were dispersed over the rural areas in the district.While Raiganj block accounted for a little more than a third of the rural establishments, Raiganj municipalityheld nearly two-thirds of the existing urban industrial establishments in the district. However, althoughless than 10 percent of the manufacturing establishments qualified for registration under the Factories Act,25 of these registered factories were located in rural areas and only 3 within municipal limits. Because ofthe proliferation of tea plantations and BLFs, Chopra accounted for 10 registered factories and 8 unregisteredestablishments with a total employment of 609, at the relatively high employment and fixed investmentscale of 34 workers per unit and Rs.83 lakh per establishment or Rs.2.46 lakh per worker. While Islampurand Goalpokhar-1 followed in sequence in terms of investment and employment scales, because of theproliferation of BLFs and small grower plantations, manufacturing activity through the rest of Uttar Dinajpurwas less capital intensive, with fixed investments that were generally well below Rs. 1 lakh per worker.Since the labour intensity of manufacturing activities was particularly high in urban Raiganj, each industrialunit there employed an average of 21 workers. Thus the average worker employment at each manufacturingestablishment in Raiganj municipality was higher than that of any other establishment anywhere in UttarDinajpur, with the exception of those located at Chopra. While manufacturing establishments at Goalpokhar-1, Goalpokhar-2, Karandighi, Hemtabad and urban Kaliaganj absorbed a distinctly low average of workersper unit, most other rural establishments outside the tea region absorbed between 10-12 workers per unit.
0
10
20
30
40
50
60
70
80
1968
1969
1970
1971
1972
1973
1974
1975
1976
1977
1978
1979
1980
1981
1982
1983
1984
1985
1986
1987
1988
1989
1990
1991
1992
1993
1994
1995
1996
1997
1998
1999
2000
2001
2002
2003
2004
2005
2006
2007
StorageFurniture etc NECFabricated Metal Products
Mineral-based ProductsChemical Products
Wood/Straw Products etcTextile ProductsFood/Beverage Products
Growth of Micro & Small Enterprise [MSE] Units in Uttar Dinajpur 1968-2007
Regi
ster
ed M
SE U
nits
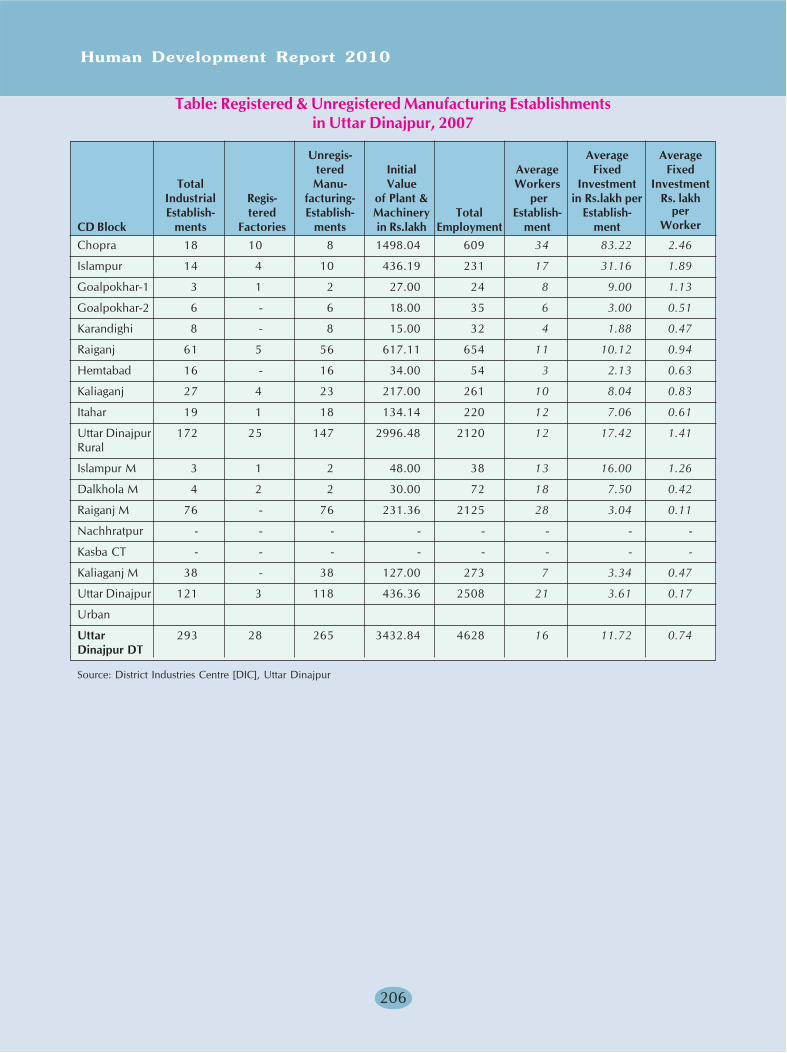
Human Development Report 2010
206
Table: Registered & Unregistered Manufacturing Establishmentsin Uttar Dinajpur, 2007
Unregis- Average Averagetered Initial Average Fixed Fixed
Total Manu- Value Workers Investment InvestmentIndustrial Regis- facturing- of Plant & per in Rs.lakh per Rs. lakhEstablish- tered Establish- Machinery Total Establish- Establish-
WorkerCD Block ments Factories ments in Rs.lakh Employment ment mentChopra 18 10 8 1498.04 609 34 83.22 2.46
Islampur 14 4 10 436.19 231 17 31.16 1.89
Goalpokhar-1 3 1 2 27.00 24 8 9.00 1.13
Goalpokhar-2 6 - 6 18.00 35 6 3.00 0.51
Karandighi 8 - 8 15.00 32 4 1.88 0.47
Raiganj 61 5 56 617.11 654 11 10.12 0.94
Hemtabad 16 - 16 34.00 54 3 2.13 0.63
Kaliaganj 27 4 23 217.00 261 10 8.04 0.83
Itahar 19 1 18 134.14 220 12 7.06 0.61
Uttar Dinajpur 172 25 147 2996.48 2120 12 17.42 1.41Rural
Islampur M 3 1 2 48.00 38 13 16.00 1.26
Dalkhola M 4 2 2 30.00 72 18 7.50 0.42
Raiganj M 76 - 76 231.36 2125 28 3.04 0.11
Nachhratpur - - - - - - - -
Kasba CT - - - - - - - -
Kaliaganj M 38 - 38 127.00 273 7 3.34 0.47
Uttar Dinajpur 121 3 118 436.36 2508 21 3.61 0.17
Urban
Uttar 293 28 265 3432.84 4628 16 11.72 0.74Dinajpur DT
Source: District Industries Centre [DIC], Uttar Dinajpur
per
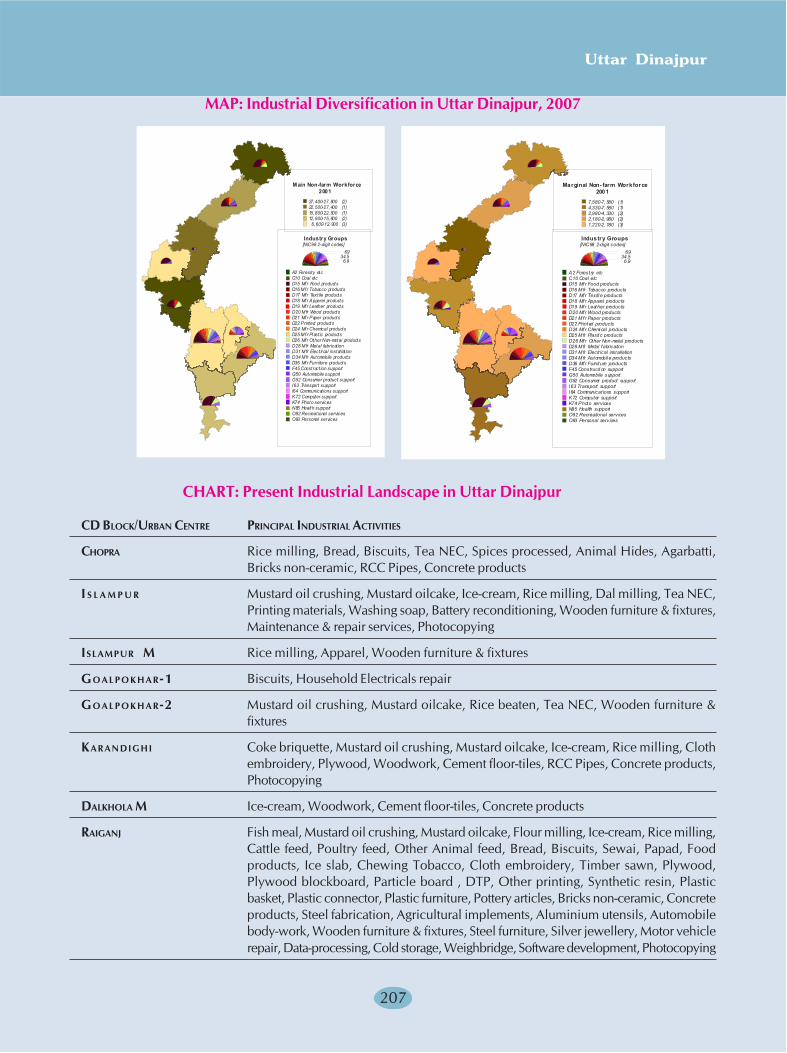
Uttar Dinajpur
207
Industry Groups[NIC98 2-digit codes]
6934.5
6.9
A2 Forestry etcC10 Coal etcD15 Mfr Food productsD16 Mfr Tobacco productsD17 Mfr Textile productsD18 Mfr Apparel productsD19 Mfr Leather productsD20 Mfr Wood productsD21 Mfr Paper productsD22 Printed productsD24 Mfr Chemical productsD25 Mfr Pl ast ic productsD26 Mfr Other Non-metal productsD28 Mfr Metal fabricationD31 Mfr Electri cal instal lat ionD34 Mfr Automobile productsD36 Mfr Furniture productsF45 Construct ion supportG50 Automobile supportG52 Consumer product supportI63 Transport supportI64 Communicat ions supportK72 Computer supportK74 Photo servicesN85 Health supportO92 Recreational servicesO93 Personal services
M ain Non-farm Workforce2001
27,400-27,800 (2)22,500-27,400 (1)15,800-22,500 (1)12,900-15,800 (2)6,600-12,900 (3)
MAP: Industrial Diversification in Uttar Dinajpur, 2007
Marginal Non- farm Workforce2001
7,580-7,580 (1)4,330-7,580 (1)2,980-4,330 (2)2,180-2,980 (2)1,220-2,180 (3)
Industry Groups[NIC98 2-digit codes]
6934.5
6.9
A2 Forestry etcC10 Coal etcD15 Mfr Food productsD16 Mfr Tobacco productsD17 Mfr Textil e productsD18 Mfr Apparel productsD19 Mfr Leather productsD20 Mfr Wood productsD21 Mfr Paper productsD22 Printed productsD24 Mfr Chemi cal productsD25 Mfr Plasti c productsD26 Mfr Other Non-metal productsD28 Mfr Metal fabricationD31 Mfr Electrical installationD34 Mfr Automobil e productsD36 Mfr Furniture productsF45 Constructi on supportG50 Automobile supportG52 Consumer product supportI63 Transport supportI64 Communicat ions supportK72 Computer supportK74 Photo servicesN85 Health supportO92 Recreational servicesO93 Personal services
CHART: Present Industrial Landscape in Uttar Dinajpur
CD BLOCK/URBAN CENTRE PRINCIPAL INDUSTRIAL ACTIVITIES
CHOPRA Rice milling, Bread, Biscuits, Tea NEC, Spices processed, Animal Hides, Agarbatti,Bricks non-ceramic, RCC Pipes, Concrete products
I S L A M P U R Mustard oil crushing, Mustard oilcake, Ice-cream, Rice milling, Dal milling, Tea NEC,Printing materials, Washing soap, Battery reconditioning, Wooden furniture & fixtures,Maintenance & repair services, Photocopying
ISLAMPUR M Rice milling, Apparel, Wooden furniture & fixtures
GOALPOKHAR-1 Biscuits, Household Electricals repair
GOALPOKHAR-2 Mustard oil crushing, Mustard oilcake, Rice beaten, Tea NEC, Wooden furniture &fixtures
KARANDIGHI Coke briquette, Mustard oil crushing, Mustard oilcake, Ice-cream, Rice milling, Clothembroidery, Plywood, Woodwork, Cement floor-tiles, RCC Pipes, Concrete products,Photocopying
DALKHOLA M Ice-cream, Woodwork, Cement floor-tiles, Concrete products
RAIGANJ Fish meal, Mustard oil crushing, Mustard oilcake, Flour milling, Ice-cream, Rice milling,Cattle feed, Poultry feed, Other Animal feed, Bread, Biscuits, Sewai, Papad, Foodproducts, Ice slab, Chewing Tobacco, Cloth embroidery, Timber sawn, Plywood,Plywood blockboard, Particle board , DTP, Other printing, Synthetic resin, Plasticbasket, Plastic connector, Plastic furniture, Pottery articles, Bricks non-ceramic, Concreteproducts, Steel fabrication, Agricultural implements, Aluminium utensils, Automobilebody-work, Wooden furniture & fixtures, Steel furniture, Silver jewellery, Motor vehiclerepair, Data-processing, Cold storage, Weighbridge, Software development, Photocopying
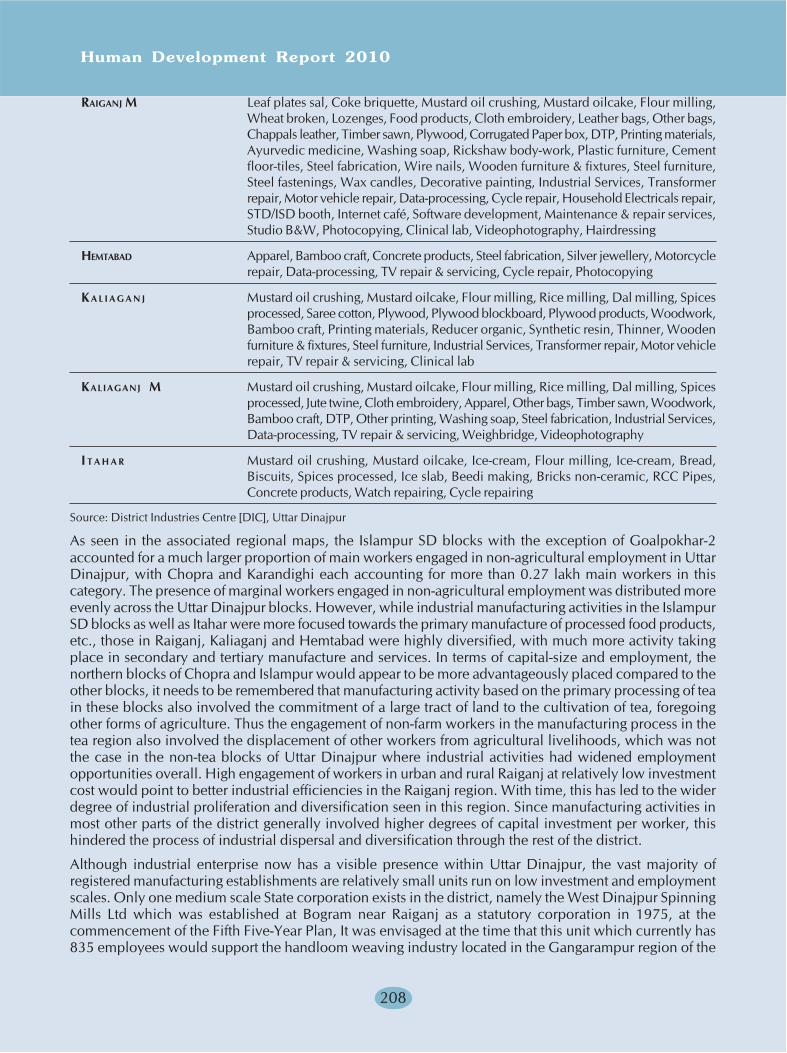
Human Development Report 2010
208
RAIGANJ M Leaf plates sal, Coke briquette, Mustard oil crushing, Mustard oilcake, Flour milling,Wheat broken, Lozenges, Food products, Cloth embroidery, Leather bags, Other bags,Chappals leather, Timber sawn, Plywood, Corrugated Paper box, DTP, Printing materials,Ayurvedic medicine, Washing soap, Rickshaw body-work, Plastic furniture, Cementfloor-tiles, Steel fabrication, Wire nails, Wooden furniture & fixtures, Steel furniture,Steel fastenings, Wax candles, Decorative painting, Industrial Services, Transformerrepair, Motor vehicle repair, Data-processing, Cycle repair, Household Electricals repair,STD/ISD booth, Internet café, Software development, Maintenance & repair services,Studio B&W, Photocopying, Clinical lab, Videophotography, Hairdressing
HEMTABAD Apparel, Bamboo craft, Concrete products, Steel fabrication, Silver jewellery, Motorcyclerepair, Data-processing, TV repair & servicing, Cycle repair, Photocopying
KA L I A G A N J Mustard oil crushing, Mustard oilcake, Flour milling, Rice milling, Dal milling, Spicesprocessed, Saree cotton, Plywood, Plywood blockboard, Plywood products, Woodwork,Bamboo craft, Printing materials, Reducer organic, Synthetic resin, Thinner, Woodenfurniture & fixtures, Steel furniture, Industrial Services, Transformer repair, Motor vehiclerepair, TV repair & servicing, Clinical lab
KALIAGANJ M Mustard oil crushing, Mustard oilcake, Flour milling, Rice milling, Dal milling, Spicesprocessed, Jute twine, Cloth embroidery, Apparel, Other bags, Timber sawn, Woodwork,Bamboo craft, DTP, Other printing, Washing soap, Steel fabrication, Industrial Services,Data-processing, TV repair & servicing, Weighbridge, Videophotography
I T A H A R Mustard oil crushing, Mustard oilcake, Ice-cream, Flour milling, Ice-cream, Bread,Biscuits, Spices processed, Ice slab, Beedi making, Bricks non-ceramic, RCC Pipes,Concrete products, Watch repairing, Cycle repairing
Source: District Industries Centre [DIC], Uttar Dinajpur
As seen in the associated regional maps, the Islampur SD blocks with the exception of Goalpokhar-2accounted for a much larger proportion of main workers engaged in non-agricultural employment in UttarDinajpur, with Chopra and Karandighi each accounting for more than 0.27 lakh main workers in thiscategory. The presence of marginal workers engaged in non-agricultural employment was distributed moreevenly across the Uttar Dinajpur blocks. However, while industrial manufacturing activities in the IslampurSD blocks as well as Itahar were more focused towards the primary manufacture of processed food products,etc., those in Raiganj, Kaliaganj and Hemtabad were highly diversified, with much more activity takingplace in secondary and tertiary manufacture and services. In terms of capital-size and employment, thenorthern blocks of Chopra and Islampur would appear to be more advantageously placed compared to theother blocks, it needs to be remembered that manufacturing activity based on the primary processing of teain these blocks also involved the commitment of a large tract of land to the cultivation of tea, foregoingother forms of agriculture. Thus the engagement of non-farm workers in the manufacturing process in thetea region also involved the displacement of other workers from agricultural livelihoods, which was notthe case in the non-tea blocks of Uttar Dinajpur where industrial activities had widened employmentopportunities overall. High engagement of workers in urban and rural Raiganj at relatively low investmentcost would point to better industrial efficiencies in the Raiganj region. With time, this has led to the widerdegree of industrial proliferation and diversification seen in this region. Since manufacturing activities inmost other parts of the district generally involved higher degrees of capital investment per worker, thishindered the process of industrial dispersal and diversification through the rest of the district.
Although industrial enterprise now has a visible presence within Uttar Dinajpur, the vast majority ofregistered manufacturing establishments are relatively small units run on low investment and employmentscales. Only one medium scale State corporation exists in the district, namely the West Dinajpur SpinningMills Ltd which was established at Bogram near Raiganj as a statutory corporation in 1975, at thecommencement of the Fifth Five-Year Plan, It was envisaged at the time that this unit which currently has835 employees would support the handloom weaving industry located in the Gangarampur region of the

Uttar Dinajpur
209
undivided district. However because of constant difficulties in marketing its yarn, the spinning mill wasrunning a perpetual loss and had accumulated a total debt of over Rs. 76 crore by the year 2007 on its totalpaid-up capital of Rs.8.89 crore. On the annual turnover of Rs.16.32 crore that year, the operating lossamounted to Rs.7.57 crore. Thus in 2008, the State Government decided to dilute its equity stake in thespinning mill to the level of 26 percent, and has since put it up before the Public Enterprises & IndustrialReconstruction [PEIR] Department so that a suitable private partner can be found. While this matter is stillawaiting a satisfactory conclusion because of the high scale of the investment involved, the SSI and MSEsectors in Uttar Dinajpur have shown more promising results in recent years. The district has one commercialestate under the West Bengal Industrial Development Corporation [WBIDC] at Mohanbari near Raiganj, inaddition to which another industrial estate specialising in leather processing has been established in 2008at Panjipara in Goalpokhar-1 block which will utilise the animal hides that the district produces in abundance.Two more industrial estates to be established by the West Bengal Small Industries Development Corporation[WBSIDC] have been proposed for the district, which will be located at Iluabari near Islampur and atItahar. Along with the Iluabari complex, another industrial estate at Kaliaganj will specialise in makingdiversified jute products. The establishment of these estates will go a long way in evening out the existingindustrial disparities in the district.
NREGA in Uttar DinajpurUttar Dinajpur was among the 200 Indian districts where the first phase of the National Rural EmploymentGuarantee Scheme [NREGS] was initially launched in February 2006, under the terms set in the NationalRural Employment Guarantee Act [NREGA] of 2005. As a flagship rural employment intervention programmeof the Government, job creation under NREGS holds critical significance for Uttar Dinajpur district wherethere is presently a gross mismatch between the size of the rural workforce and the available opportunitiesfor regular rural wage-work. However although NREGS has now entered in its fourth year of implementationin the district and Uttar Dinajpur ranks 13th among the West Bengal districts in terms of the issuance ofNREGS jobcards with over 4.31 lakh jobcards being issued till June 2009, it ranks 17th in terms of the totalpersondays of rural employment that have been generated under NREGS. While Uttar Dinajpur thus appearsto have lagged behind in the implementation of the scheme, the West Bengal districts that joined NREGSsubsequently after the implementation of its second phase now stand well ahead of Uttar Dinajpur inoverall performance.
Table: Comparative NREGS Performance in Uttar Dinajpur,West Bengal & India, 2008-09
NREGS Performance Indicator Uttar West AllDinajpur Bengal India
Total Rural Households provided Employment [lakh] 0.57 30.26 449.0Total Employment [lakh persondays] 13.71 786.61 21610Employment provided to SCs [lakh persondays] 6.21 294.55 6343Employment provided to STs [lakh persondays] 1.23 116.53 5481Employment provided to Women [lakh persondays] 5.03 208.66 10342Employment provided to Other Persons [lakh persondays] 6.27 375.52 9786Employment provided to SCs [%] 45.3 37.4 29.4Employment provided to STs [%] 9.0 14.8 25.4Employment provided to Women [%] 36.7 26.5 47.9Employment provided to Other Persons [%] 45.7 47.7 45.3Total NREGS Fund [Rs.crore] 31.10 1279.19 naTotal NREGS Expenditure [Rs.crore] 16.57 940.38 naNREGS Works completed [thousand] 1.24 54.53 1209NREGS Works in progress [thousand] 0.18 45.54 1511Total NREGS Works [thousand] 1.42 100.01 2720
Source: Department of Rural Development, Ministry of Rural Development, GoI
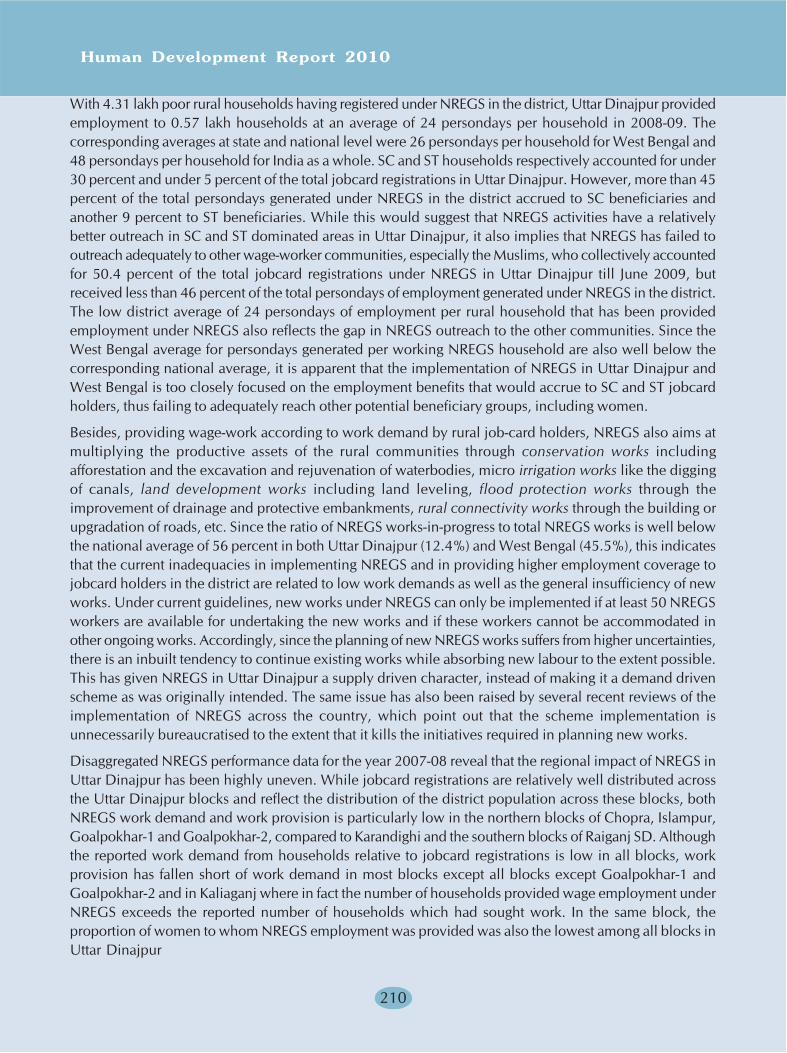
Human Development Report 2010
210
With 4.31 lakh poor rural households having registered under NREGS in the district, Uttar Dinajpur providedemployment to 0.57 lakh households at an average of 24 persondays per household in 2008-09. Thecorresponding averages at state and national level were 26 persondays per household for West Bengal and48 persondays per household for India as a whole. SC and ST households respectively accounted for under30 percent and under 5 percent of the total jobcard registrations in Uttar Dinajpur. However, more than 45percent of the total persondays generated under NREGS in the district accrued to SC beneficiaries andanother 9 percent to ST beneficiaries. While this would suggest that NREGS activities have a relativelybetter outreach in SC and ST dominated areas in Uttar Dinajpur, it also implies that NREGS has failed tooutreach adequately to other wage-worker communities, especially the Muslims, who collectively accountedfor 50.4 percent of the total jobcard registrations under NREGS in Uttar Dinajpur till June 2009, butreceived less than 46 percent of the total persondays of employment generated under NREGS in the district.The low district average of 24 persondays of employment per rural household that has been providedemployment under NREGS also reflects the gap in NREGS outreach to the other communities. Since theWest Bengal average for persondays generated per working NREGS household are also well below thecorresponding national average, it is apparent that the implementation of NREGS in Uttar Dinajpur andWest Bengal is too closely focused on the employment benefits that would accrue to SC and ST jobcardholders, thus failing to adequately reach other potential beneficiary groups, including women.
Besides, providing wage-work according to work demand by rural job-card holders, NREGS also aims atmultiplying the productive assets of the rural communities through conservation works includingafforestation and the excavation and rejuvenation of waterbodies, micro irrigation works like the diggingof canals, land development works including land leveling, flood protection works through theimprovement of drainage and protective embankments, rural connectivity works through the building orupgradation of roads, etc. Since the ratio of NREGS works-in-progress to total NREGS works is well belowthe national average of 56 percent in both Uttar Dinajpur (12.4%) and West Bengal (45.5%), this indicatesthat the current inadequacies in implementing NREGS and in providing higher employment coverage tojobcard holders in the district are related to low work demands as well as the general insufficiency of newworks. Under current guidelines, new works under NREGS can only be implemented if at least 50 NREGSworkers are available for undertaking the new works and if these workers cannot be accommodated inother ongoing works. Accordingly, since the planning of new NREGS works suffers from higher uncertainties,there is an inbuilt tendency to continue existing works while absorbing new labour to the extent possible.This has given NREGS in Uttar Dinajpur a supply driven character, instead of making it a demand drivenscheme as was originally intended. The same issue has also been raised by several recent reviews of theimplementation of NREGS across the country, which point out that the scheme implementation isunnecessarily bureaucratised to the extent that it kills the initiatives required in planning new works.
Disaggregated NREGS performance data for the year 2007-08 reveal that the regional impact of NREGS inUttar Dinajpur has been highly uneven. While jobcard registrations are relatively well distributed acrossthe Uttar Dinajpur blocks and reflect the distribution of the district population across these blocks, bothNREGS work demand and work provision is particularly low in the northern blocks of Chopra, Islampur,Goalpokhar-1 and Goalpokhar-2, compared to Karandighi and the southern blocks of Raiganj SD. Althoughthe reported work demand from households relative to jobcard registrations is low in all blocks, workprovision has fallen short of work demand in most blocks except all blocks except Goalpokhar-1 andGoalpokhar-2 and in Kaliaganj where in fact the number of households provided wage employment underNREGS exceeds the reported number of households which had sought work. In the same block, theproportion of women to whom NREGS employment was provided was also the lowest among all blocks inUttar Dinajpur
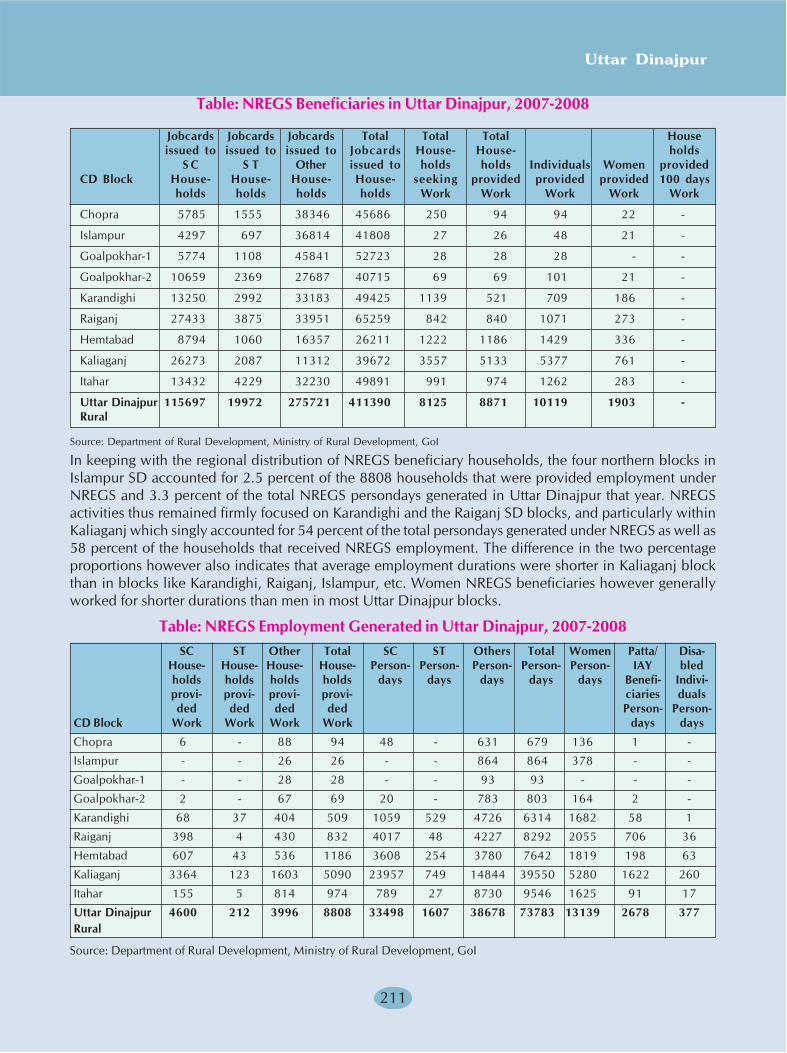
Uttar Dinajpur
211
Table: NREGS Beneficiaries in Uttar Dinajpur, 2007-2008
Jobcards Jobcards Jobcards Total Total Total Houseissued to issued to issued to Jobcards House- House- holds
S C S T Other issued to holds holds Individuals Women providedCD Block House- House- House- House- seeking provided provided provided 100 days
holds holds holds holds Work Work Work Work Work
Chopra 5785 1555 38346 45686 250 94 94 22 -
Islampur 4297 697 36814 41808 27 26 48 21 -
Goalpokhar-1 5774 1108 45841 52723 28 28 28 - -
Goalpokhar-2 10659 2369 27687 40715 69 69 101 21 -
Karandighi 13250 2992 33183 49425 1139 521 709 186 -
Raiganj 27433 3875 33951 65259 842 840 1071 273 -
Hemtabad 8794 1060 16357 26211 1222 1186 1429 336 -
Kaliaganj 26273 2087 11312 39672 3557 5133 5377 761 -
Itahar 13432 4229 32230 49891 991 974 1262 283 -
Uttar Dinajpur 115697 19972 275721 411390 8125 8871 10119 1903 -Rural
Source: Department of Rural Development, Ministry of Rural Development, GoI
In keeping with the regional distribution of NREGS beneficiary households, the four northern blocks inIslampur SD accounted for 2.5 percent of the 8808 households that were provided employment underNREGS and 3.3 percent of the total NREGS persondays generated in Uttar Dinajpur that year. NREGSactivities thus remained firmly focused on Karandighi and the Raiganj SD blocks, and particularly withinKaliaganj which singly accounted for 54 percent of the total persondays generated under NREGS as well as58 percent of the households that received NREGS employment. The difference in the two percentageproportions however also indicates that average employment durations were shorter in Kaliaganj blockthan in blocks like Karandighi, Raiganj, Islampur, etc. Women NREGS beneficiaries however generallyworked for shorter durations than men in most Uttar Dinajpur blocks.
Table: NREGS Employment Generated in Uttar Dinajpur, 2007-2008SC ST Other Total SC ST Others Total Women Patta/ Disa-
House- House- House- House- Person- Person- Person- Person- Person- IAY bledholds holds holds holds days days days days days Benefi- Indivi-provi- provi- provi- provi- ciaries dualsded ded ded ded Person- Person-
CD Block Work Work Work Work days days
Chopra 6 - 88 94 48 - 631 679 136 1 -
Islampur - - 26 26 - - 864 864 378 - -
Goalpokhar-1 - - 28 28 - - 93 93 - - -
Goalpokhar-2 2 - 67 69 20 - 783 803 164 2 -
Karandighi 68 37 404 509 1059 529 4726 6314 1682 58 1
Raiganj 398 4 430 832 4017 48 4227 8292 2055 706 36
Hemtabad 607 43 536 1186 3608 254 3780 7642 1819 198 63
Kaliaganj 3364 123 1603 5090 23957 749 14844 39550 5280 1622 260
Itahar 155 5 814 974 789 27 8730 9546 1625 91 17
Uttar Dinajpur 4600 212 3996 8808 33498 1607 38678 73783 13139 2678 377Rural
Source: Department of Rural Development, Ministry of Rural Development, GoI
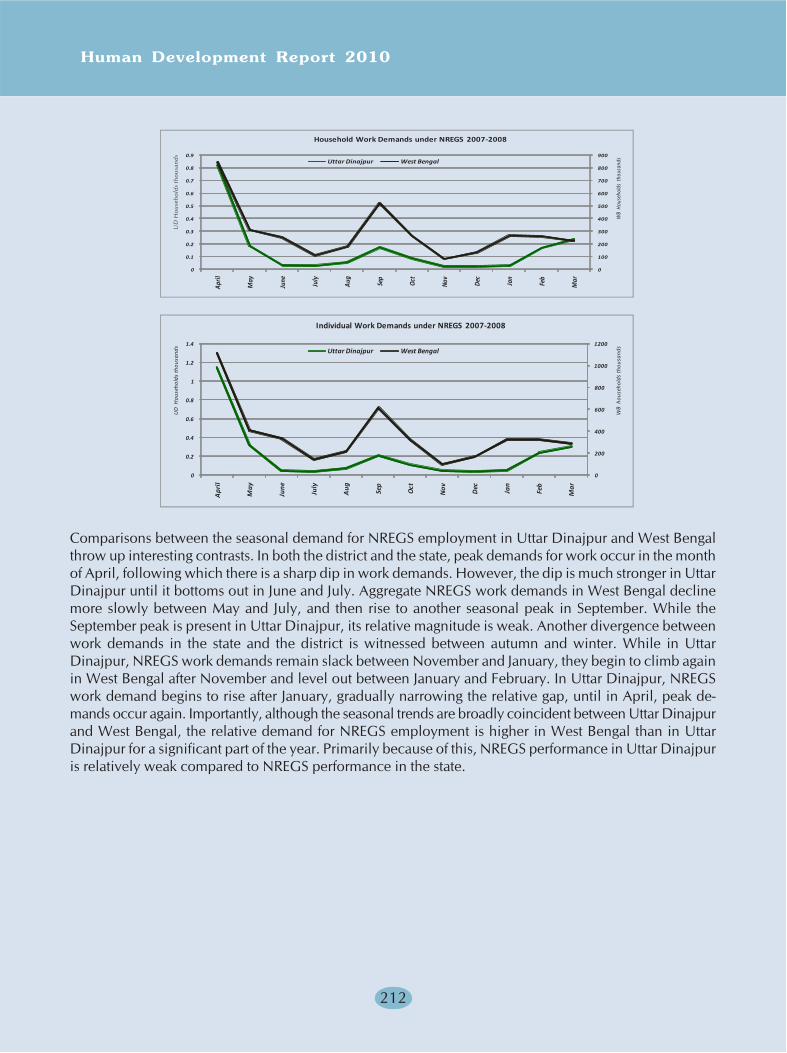
Human Development Report 2010
212
Comparisons between the seasonal demand for NREGS employment in Uttar Dinajpur and West Bengalthrow up interesting contrasts. In both the district and the state, peak demands for work occur in the monthof April, following which there is a sharp dip in work demands. However, the dip is much stronger in UttarDinajpur until it bottoms out in June and July. Aggregate NREGS work demands in West Bengal declinemore slowly between May and July, and then rise to another seasonal peak in September. While theSeptember peak is present in Uttar Dinajpur, its relative magnitude is weak. Another divergence betweenwork demands in the state and the district is witnessed between autumn and winter. While in UttarDinajpur, NREGS work demands remain slack between November and January, they begin to climb againin West Bengal after November and level out between January and February. In Uttar Dinajpur, NREGSwork demand begins to rise after January, gradually narrowing the relative gap, until in April, peak de-mands occur again. Importantly, although the seasonal trends are broadly coincident between Uttar Dinajpurand West Bengal, the relative demand for NREGS employment is higher in West Bengal than in UttarDinajpur for a significant part of the year. Primarily because of this, NREGS performance in Uttar Dinajpuris relatively weak compared to NREGS performance in the state.
0
100
200
300
400
500
600
700
800
900
0
0.1
0.2
0.3
0.4
0.5
0.6
0.7
0.8
0.9
April
May
June
July
Aug
Sep
Oct
Nov
Dec
Jan
Feb
Mar
WB
Hou
seho
lds
thou
sand
s
UD
Hous
ehol
ds yh
ousa
nds
Uttar Dinajpur West Bengal
Household Work Demands under NREGS 2007-2008
0
200
400
600
800
1000
1200
0
0.2
0.4
0.6
0.8
1
1.2
1.4
Apr
il
May
June
July
Aug Sep
Oct
Nov Dec Jan
Feb
Mar
WB
hou
seho
lds
thou
sand
s
UD
Hou
seho
lds
thou
sand
s
Uttar Dinajpur West Bengal
Individual Work Demands under NREGS 2007-2008
UD
Hou
seho
lds
thou
sand
s
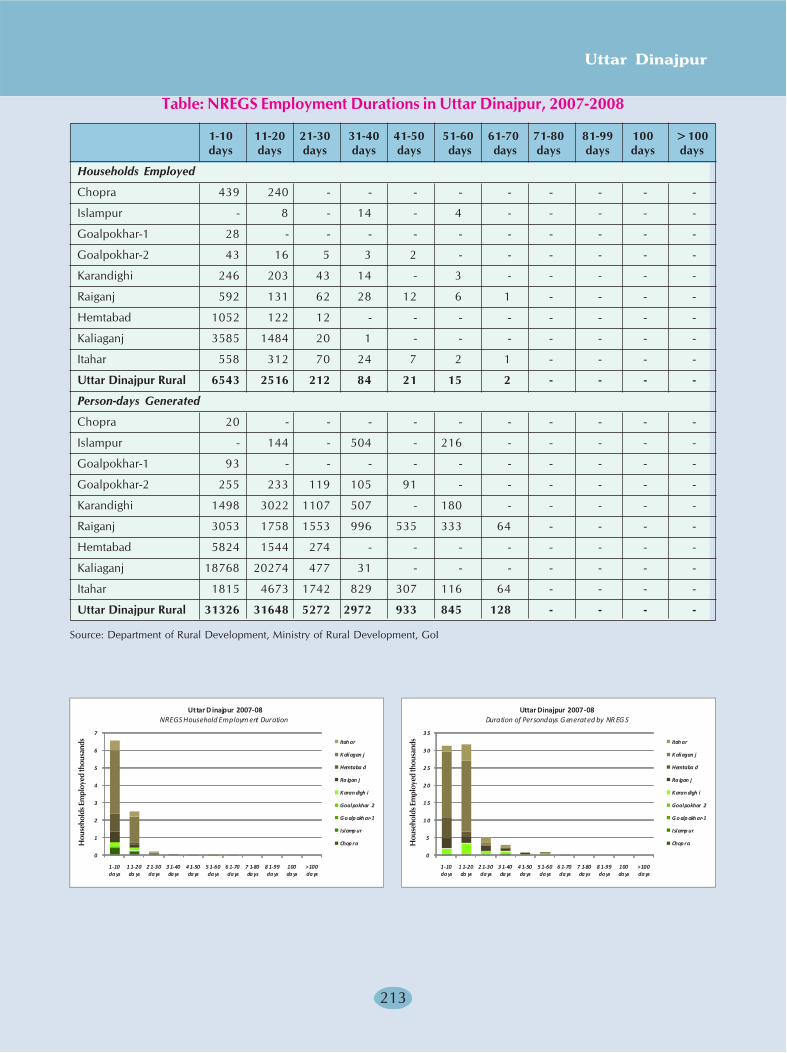
Uttar Dinajpur
213
Table: NREGS Employment Durations in Uttar Dinajpur, 2007-2008
1-10 11-20 21-30 31-40 41-50 51-60 61-70 71-80 81-99 100 >100days days days days days days days days days days days
Households Employed
Chopra 439 240 - - - - - - - - -
Islampur - 8 - 14 - 4 - - - - -
Goalpokhar-1 28 - - - - - - - - - -
Goalpokhar-2 43 16 5 3 2 - - - - - -
Karandighi 246 203 43 14 - 3 - - - - -
Raiganj 592 131 62 28 12 6 1 - - - -
Hemtabad 1052 122 12 - - - - - - - -
Kaliaganj 3585 1484 20 1 - - - - - - -
Itahar 558 312 70 24 7 2 1 - - - -
Uttar Dinajpur Rural 6543 2516 212 84 21 15 2 - - - -
Person-days Generated
Chopra 20 - - - - - - - - - -
Islampur - 144 - 504 - 216 - - - - -
Goalpokhar-1 93 - - - - - - - - - -
Goalpokhar-2 255 233 119 105 91 - - - - - -
Karandighi 1498 3022 1107 507 - 180 - - - - -
Raiganj 3053 1758 1553 996 535 333 64 - - - -
Hemtabad 5824 1544 274 - - - - - - - -
Kaliaganj 18768 20274 477 31 - - - - - - -
Itahar 1815 4673 1742 829 307 116 64 - - - -
Uttar Dinajpur Rural 31326 31648 5272 2972 933 845 128 - - - -
Source: Department of Rural Development, Ministry of Rural Development, GoI
0
1
2
3
4
5
6
7
1-10 da ys
1 1-20 da ys
2 1-30 da ys
3 1-40 da ys
4 1-50 da ys
5 1-60 da ys
6 1-70 da ys
7 1-80 da ys
8 1-99 da ys
100 da ys
>100 da ys
Itah ar
K aliagan j
Hemtaba d
Ra igan j
K aran digh i
Goalpokhar 2
G o alp okh ar-1
Islamp ur
Chop ra
Uttar Dinajpur 2007-08NREGS Household Employm ent Duration
0
5
1 0
1 5
2 0
2 5
3 0
3 5
1-10 da ys
1 1-20 da ys
2 1-30 da ys
3 1-40 da ys
4 1-50 da ys
5 1-60 da ys
6 1-70 da ys
7 1-80 da ys
8 1-99 da ys
100 da ys
>100 da ys
Itah ar
K aliagan j
Hemtaba d
Ra igan j
K aran digh i
Goalpokhar 2
G o alp okh ar-1
Islamp ur
Chop ra
Uttar Dinajpur 2007-08Duration of Persondays G enerated by NR EG S
Hou
seho
lds E
mpl
oyed
thou
sand
s
Hou
seho
lds E
mpl
oyed
thou
sand
s
Human Development Report 2010
214
Another reason for the comparatively slack performance of NREGS in Uttar Dinajpur relates to the durationfor which NREGS employment is provided in different parts of the district. Nearly 70 percent of thehouseholds that were provided NREGS work in Uttar Dinajpur in 2007-08, were provided between 1-10days of employment. Since another 27 percent secured between 11-20 days of work, less than 4 percent ofthe households seeking NREGS work in Uttar Dinajpur secure employment for durations longer than 20days. Nevertheless, in blocks like Karandighi, Raiganj and Kaliaganj, the average duration of NREGSemployment was more widely dispersed over different time categories. The range of dispersion of NREGSemployment in terms of person-days generated was even wider in these three blocks, with 57 percent ofthe households securing employment for durations of 11 persondays or longer at a stretch, while 14percent secured 21 or more person-days of NREGS employment. Since some Uttar Dinajpur blocks haveobviously performed better than others, the reasons behind the varying regional performance of NREGS inUttar Dinajpur therefore need to be properly probed.
In June, 2009, 78 of the 98 Gram Panchayats [GPs] in Uttar Dinajpur reported no ongoing NREGS activities.Thus NREGA activities were currently being implemented in only 20 GPs, 6 of which were located inKarandighi, 4 in Hemtabad, 3 in Kaliaganj, 2 in Itahar, while only 1 GP each was active in the five remainingblocks in Uttar Dinajpur. Among its 59 GPs, Islampur SD thus had 10 active GPs and 49 inactive GPs,while Raiganj SD with 39 GPs had 10 active and 29 inactive GPs. While 175 NREGS works had beenexecuted by the Uttar Dinajpur GPs through the year 2008-09, only 61 of these works were implementedin Islampur SD, of which 51 were implemented in the Karandighi GPs. In contrast, 114 NREGS workswere executed by the GPs in Raiganj SD, of which 44 works were implemented in Kaliaganj. The regionalanomalies in NREGS performance in Uttar Dinajpur are thus closely related to the distribution of NREGSworks across GPs. Issues like low work demands, low NREGS employment generation and the inability toprovide registered NREGS jobcard holders with the statutory 100 days of work all arise in Uttar Dinajpurbecause of the paucity of current NREGS work-schemes. Of the 111 NREGS works in progress in UttarDinajpur through 2008-09, as many as 68 were rural connectivity works involving road building, 19 werewater conservation works and 10 involved the rejuvenation of existing waterbodies. Another 10 of the 21NREGS works completed that year and 23 of the NREGS works on shelf also involved rural connectivity.While no irrigation related works were either ongoing or on shelf, flood control and drought proofingworks also had token presence, with almost single-minded emphasis being placed on road-building activities.More than 80 percent of the completed rural connectivity works, and close to 95 percent of the currentrural connectivity works in progress and on shelf, were located in Karandighi and the four Islampur SDblocks, implying an obviously strong regional bias in the implementation of NREGS in Uttar Dinajpur. Thelargescale exclusion of the Islampur SD GPs from NREGS implementation has greatly limited the impact ofNREGS in the district.
During 2007-07, i.e. the first year of implementation of NREGS in Uttar Dinajpur, a slew of NREGSactivities involving plant nurseries, pond excavation, road-building, building construction and other workshad been proposed by the GPs in Uttar Dinajpur for inclusion in the consolidated NREGS perspective planfor the district. These involved 2171 works to be taken up by the Panchayat Samities and another 28,994works to be undertaken at the Uttar Dinajpur GPs. Nearly 29 percent of these potential NREGS worksinvolved water conservation and 32 percent involved rural connectivity, while the rest of the proposalswere split up between afforestation, building construction and other activities. Analysis of these NREGSproposals that are still to be implemented reveals the potential for conducting a wide range of NREGSworks across Uttar Dinajpur.
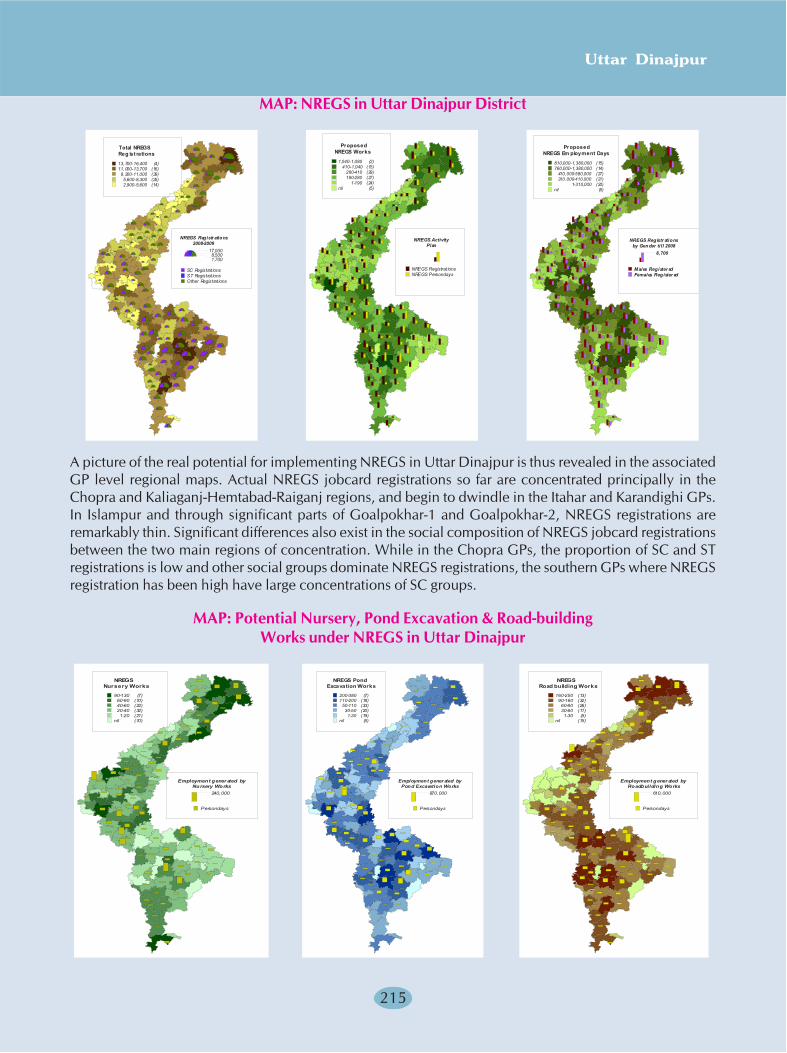
Uttar Dinajpur
215
MAP: NREGS in Uttar Dinajpur District
Total NREGSReg ist rations
13,700-16,400 (4)11,000-13,700 (16)8,300-11,000 (39)5,600-8,300 (25)2,900-5,600 (14)
NREGS Registr ations2008-2009
17,0008,5001,700
SC Registrat ionsST Registrat ionsOther Registrations
ProposedNREGS Works
1,040-1,080 (2)410-1,040 (15)
280-410 (29)190-280 (27)
1-190 (24)nil (5)
NREGS ActivityPlan
NREGS RegistrationsNREGS Persondays
ProposedNREGS Em ployment Days
810,000-1,380,000 (15)760,000-1,380,000 (14)
410,000-580,000 (27)310,000-410,000 (21)
1-310,000 (20)nil (5)
NREGS Registr ationsby Gender ti ll 2008
8,700
Males Register edFemales Register ed
A picture of the real potential for implementing NREGS in Uttar Dinajpur is thus revealed in the associatedGP level regional maps. Actual NREGS jobcard registrations so far are concentrated principally in theChopra and Kaliaganj-Hemtabad-Raiganj regions, and begin to dwindle in the Itahar and Karandighi GPs.In Islampur and through significant parts of Goalpokhar-1 and Goalpokhar-2, NREGS registrations areremarkably thin. Significant differences also exist in the social composition of NREGS jobcard registrationsbetween the two main regions of concentration. While in the Chopra GPs, the proportion of SC and STregistrations is low and other social groups dominate NREGS registrations, the southern GPs where NREGSregistration has been high have large concentrations of SC groups.
MAP: Potential Nursery, Pond Excavation & Road-buildingWorks under NREGS in Uttar Dinajpur
NREGSNursery Works
90-130 (7)60-90 (10)40-60 (22)20-40 (32)1-20 (21)
nil (10)
Employment gener ated byNursery Works
240,000
Persondays
NREGS PondExcavation Works
200-380 (7)110-200 (18)
50-110 (33)30-50 (20)
1-30 (19)nil (5)
Employment generated byPond Excavation Works
870,000
Persondays
NREGSRoad building Works
160-250 (13)90-160 (32)
60-90 (26)30-60 (11)1-30 (5)
nil (15)
Employment gener ated byRoadbuilding Works
610,000
Persondays

Human Development Report 2010
216
NREGS BuildingConstruction Works
90-120 (2)20-90 (11)10-20 (5)1-10 (16)
nil (68)
Employment gener ated byBuilding Works
130,000
Persondays
NREGS WorksOt her Categories
420-530 (2)130-420 (12)60-130 (32)30-60 (21)
1-30 (20)nil (15)
Employment gener ated byOther NREGS Works
530
Persondays
MAP: Potential Building Construction & Other Works underNREGS in Uttar Dinajpur
Although the distribution of potential NREGS works is broadly reflected in the regional patterns of NREGSregistrations, the works suggested are distributed more evenly across the most of the district, except for afew thinner patches in Islampur, Goalpokhar-2 and Kaliaganj blocks. The potential employment that canbe generated through these NREGS activities has broad conformity with the regional distribution of NREGSregistrations, except in a few thinner patches in Islampur, Goalpokhar-2 and Kaliaganj blocks where thepaucity of possible NREGS works leads to potentially low employment creation, when compared to thenumber of NREGS registrations that have taken place. The potential for NREGS employment is distributedacross the entire district, with regions of high and low concentration in almost every block. Actual maleregistrations under NREGS are generally a little higher than the registration of females. However, in severalGPs of Muslim-dominated Islampur and Goalpokhar-1, Goalpokhar-2 and Itahar, both male and femaleregistrations have been low even though the males stay well ahead of the females. The Muslim dominatedblocks form a composite region from which periodic male outmigration outside the district has been thehighest. As a result, the current levels of work demand are low in some GPs within this area.
While the potential to undertake nursery works under NREGS is confined largely to the terai GPs inChopra and Islampur as well as to some extent in Goalpokhar-2 and Karandighi, the potential to undertakepond excavation works is spread widely across the length of the district, with particularly strong concentrationin the southern GPs covering Hemtabad and Raiganj blocks. Since the strength of agriculture in the districthas been built on the access to irrigation, the regional concentration of NREGS proposals for such waterconservation works indicate the presence of a strongly felt need to diversify surface water access in thisintensively cultivated region. The potential for undertaking NREGS rural connectivity works is also spreadwidely across the district, with high concentration in the Chopra and Raiganj GPs. The patterns of ruralconnectivity that can potentially be created in Uttar Dinajpur through such NREGS road-building worksillustrates the strong need for establishing better economic and infrastructural inter-linkages between ruralareas across the entire district, without which the economic potential of Uttar Dinajpur remains unexplored.In contrast, proposals for building construction works under NREGS are confined to a relatively narrow
Uttar Dinajpur
217
band of GPs in Raiganj, Hemtabad and Itahar. This would indicate that NREGS has created strong ruraldevelopment aspirations in this region, which is already relatively better served by infrastructure. Elsewherethrough the district, the building of basic infrastructure such as rural roads is a more pressing necessity.Miscellaneous NREGS works of a type not included in the former categories have been proposed for GPsacross the entire length of the district. In Islampur SD, these NREGS potentials mainly emanate from thedifficult area along the international border where economic activity and livelihood opportunities are severelyconstrained. Since many of these proposals in Raiganj SD serve the hinter-land surrounding the districtheadquarters, they may be seen as a way of improving livelihood equity in the region which alreadyattracts a large stream of inmigration because of its higher levels of socio-economic and agriculturaldevelopment.
Although the performance of NREGS so far in Uttar Dinajpur district has been relatively weak, this weaknessthus essentially stems from the insufficiency of approved NREGS works and the limited spread of NREGSacross the 98 GPs of the district. The need to change this is very strong, as indicated by the spread ofNREGS works proposals across the entire district. However the process of approval and enlistment ofNREGS works is too cumbersome to serve the livelihood needs that exist across the rural areas of UttarDinajpur, and presently deprives a considerable part of the district of equitable rural employment support.It needs to be appreciated that a rural intervention programme of scale and complexity of NREGS cannot beplanned centrally at either the national or state capitals or at the respective district headquarters. Since theNREGS works must serve local communities and must be carried out with local human capital resourcesand local information on local public lands, it is evident NREGS activities would be best executed withina decentralised framework that empowers the local panchayats to formulate and supervise their own assetbuilding and employment generation needs.
BOX TEXT
SMALL TEA PLANTATIONS IN UTTAR DINAJPUR
Pineapple growers in Uttar Dinajpur began to switch over to tea cultivation in the late 1980s and 1990s.Chopra, where around 4-5 large tea estates had already existed since pre-Independence times, is thusconsidered the birthplace of small tea plantations. Settlement in Chopra had begun to expand following thetransfer of territories from Bihar to West Bengal in 1956 and post-Partition migration. Migrant farmers whoresettled in the region found the land to be of inferior quality and their landholdings to be small anduneconomic. The cultivation of pineapples was therefore introduced as an alternative model of commercialfarming at the end of the 1950s. By the early 1980s pineapple cultivation had spread over a vast area, anda marketing crisis ensued. Being highly perishable, table-ready pineapples cannot be kept in storage andhave to be transported immediately over long distances. Most of the pineapples produced in Uttar Dinajpurhad to reach distant markets in cities like Delhi, Kanpur, Agra, Nagpur and Kolkata. This involved an armyof middlemen, each of whom took a cut out of the profits imposing a high burden of transactions costs onthe pineapple farmers without an assured return. These adverse conditions gradually persuaded pineapplefarmers to look for an alternative product. Finally, during the tea boom in the 1980s, pineapple farmersbegan to switch over experimentally to the growing of tea. By 2003, small tea plantations and bought leaffactories [BLFs] the North Bengal Terai and Duars were already producing nearly a fifth of the total processedtea produced within the region. While the number of BLFs had expanded to 62 in 2003 from 28 in 1999,production of tea by small growers in the region had risen from 13.1 million kg to 36.5 million kg over thesame period.
During the initial phase of development of small tea plantations in North Bengal, problems had arisenbecause of the purchase or leasing of agricultural land by the agents of big corporate tea companies, underthe nomenclature of project tea gardens. Besides high lands or dangis which were unsuitable for agriculture,agricultural lowlands or nichanparas were also sold to the corporate tea companies on the assurance thatthe farming households that transferred such land would be provided regular employment on the new teagardens at the rate of one job for every hectare of land that was transferred. The deep trenches that were cut
Human Development Report 2010
218
to drain the new plantations also lowered the water table in surrounding farmlands, forcing other farmersto sell or transfer their holdings. In a chain reaction, the switchover from farming to tea gradually affecteda longitudinal region stretching from the Daspara area in Chopra block upto Patagora in Islampur. As wetrice cultivation was also affected adversely by such changes, a strong agrarian movement against furthertransfer of farmlands to tea ensued in the region in 1989-90. In 1990, the Government of West Bengalarticulated a policy regulating the conversion of farmlands to tea, which barred such transfers from takingplace on prime agricultural land, on lands under forest and tribal lands, and on lands falling within thecommand area of the Tista Project. Under the policy, issuance of a No-Objection Certificate [NOC] by theState Government became compulsory before undertaking new tea plantation. Although this partially checkedthe unregulated expansion of ‘project gardens’ or small tea plantations over areas of less than 25 acres(10.12ha) by established tea companies to escape the statutory provisions of the Plantation Labour Act1951, a new model emerged under which small tea growers [STGs] voluntarily took over the primaryproduction of tea, selling the green leaves to nearby BLF tea factories. With the policies of trade liberalisationclearing the way for the mushrooming of BLFs in the district, land conversion began to accelerate again,until the new tea crisis of 2002.
Although the establishment of a tea plantation is a highly capital-intensive process, the pineapple growersof Uttar Dinajpur initially had to finance this from their own resources without the support of the institutionalcredit system. After the introduction of the NOC system, a new tea grower has to secure prior clearance ofthe Land Revenue Department, GoWB, through the District Land and Land Reforms Officer [DLLRO],before applying to the Tea Board for registration of the small tea plantation. Under the GoWB notice of 21August 1998, owners of new tea gardens covering an area of upto 9.79ha (24.2 acres) are classified as teacultivators and are issued a Certificate for Cultivation of Tea. If the plantation exceeds a size of 7ha (17.3acres), the owner is also required to apply to GoWB through the DLLRO for permission to hold land inexcess of the statutory land ceiling. Since the process is time-consuming, less than 30 percent of existingSTGs in the North Bengal Terai and Duars are estimated to have received the required NOCs from the StateGovernment till July 2001. In the Uttar Dinajpur terai blocks, where only 249 out of 2005 applicants hadbeen issued NOCs, the estimated proportion is even lower at less than 13 percent of those located. OtherSTGs in the region have the status of applicants, but carry on their tea growing operations without officialimpediment.
Initially the green leaves produced by the STGs were purchased by nearby estate sector factories. With thelater advent of BLFs, the bulk of the tea produced by the STGs passes onto them. Green leaf purchases areexecuted by farias or leaf agents and the prices paid for green leaves are arbitrary. Since the new tea crisiserupted in 2002, price realisation has been relatively poor, leading to mass agitation by STGs through2002-03. The Department of Commerce & Industries, GoWB, therefore suggested that the Tea Boardshould lay down a price-sharing formula, on the basis of which the sale proceeds from made tea producedby the BLFs would be shared proportionally between the STGs and BLFs. It was also suggested that a one-on-one linkage be established between each BLF and the STGs located within its surroundings to stabilisegreen leaf prices, so that no leaf purchases could be made by or from other sources. In order to ensuretransparency in the price realisations for made tea, it was suggested that private sales should be prohibitedand all tea produced by the BLFs should be sold only by auction.
The Tea Board subsequently announced a price-sharing formula in 2004, under which the sale proceedsfrom BLF sales of made tea should be apportioned in the standard ratio 60:40 between the green leaf andmade tea producers. However, there is little evidence that this is being adhered to, since only a minorfraction of the 74 BLFs operating in North Bengal in 2005 submit regular audited returns to the Tea Board.Persistent disregard of official orders and regulations places the livelihoods of STGs and tea workers inUttar Dinajpur in considerable jeopardy. Besides being unorganised, the STGs suffer from low economiesof scale, interior or remote location, and low bargaining power, and are often at the receiving end of unfairtrade practices by the BLFs and the mushrooming leaf agents. To overcome such constraints and to improveorganisation and cultivation practices, an effort has lately been launched to give a federating structure toSTGs across India. The final outcome of this new effort is still awaited.
Uttar Dinajpur
219
Chapter 5WOMEN'S SITUATIONS IN UTTAR DINAJPUR DISTRICT
Gender Equity as a Human Development Strategy
Gender equity represents a state of social evolution where the entitlements, capabilities and opportunitiesthat qualify the standard of people's lives are no longer defined by whether their subjects are male orfemale. Holding equal relevance for men and women caught in socially stratified situations, gender justicematerialises when the achievement of economic, political and cultural freedom allows each individual toattain his or her full potential. Conversely, gender disparities arise when the rights of one set of individualsare encroached upon by the hierarchies and privilege structures that empower others from the oppositegender. Denial of equal access to basic human entitlements such as education, healthcare and nutrition aswell as fair livelihood have been the traditional means for subjugating women and perpetuating theirsubordination. Recognising that women are too frequently found among the ranks of the poor, the lessliterate and the socially insecure, the human development approach seeks to liberate women from theirunequal situations by identifying the systemic biases that operate against women, binding them to inferiorpositions within society.
Commencing with International Women's Year in 1975, issues relating to gender and women's situationshad gradually entered national and international development agendas that sought to address the problemof human poverty and provide for the fulfilment of basic human needs. The formulation of the MillenniumDevelopment Goals [MDGs] strategy has led to a penetrating analysis of the origins of poverty, identifyingits roots in social injustice and gender inequality. Major initiatives launched by the global women's movementsuch as CEDAW [Convention for Elimination of All Forms of Discrimination against Women] and theBeijing Platform for Action [PfA 1995] were ratified in National Plans for gender equity and women'sdevelopment. Setting time-bound and measurable targets to be met by the year 2015 in order to eliminatehuman poverty, the MDGs drew focus to many development issues with direct impacts on women inIndian society, among which are
- improved nutritional standards that end nutritional discrimination against children.
- universalisation of elementary education [UEE] that raises school enrolment and literacy amonggirl children.
- improvement of women's representation within the non-agricultural workforce and withineconomic and political processes.
- reduction of child mortality through improved delivery of immunisation and preventivehealthcare.
- improvement of maternal health through supervised and safe deliveries.
- reduction of the burden of communicable diseases such as HIV/AIDS, etc. through effectivemonitoring and better standards of reproductive health.
- sustainable environmental standards including equitable access to energy, water and landresources, which saves women from having to bear the unequal cost of environmentaldegradation.
The invisible gender structures that operate within society in Uttar Dinajpur today can thus be made visibleby identifying existing disparities in literacy and education, unequal health and nutritional standards and
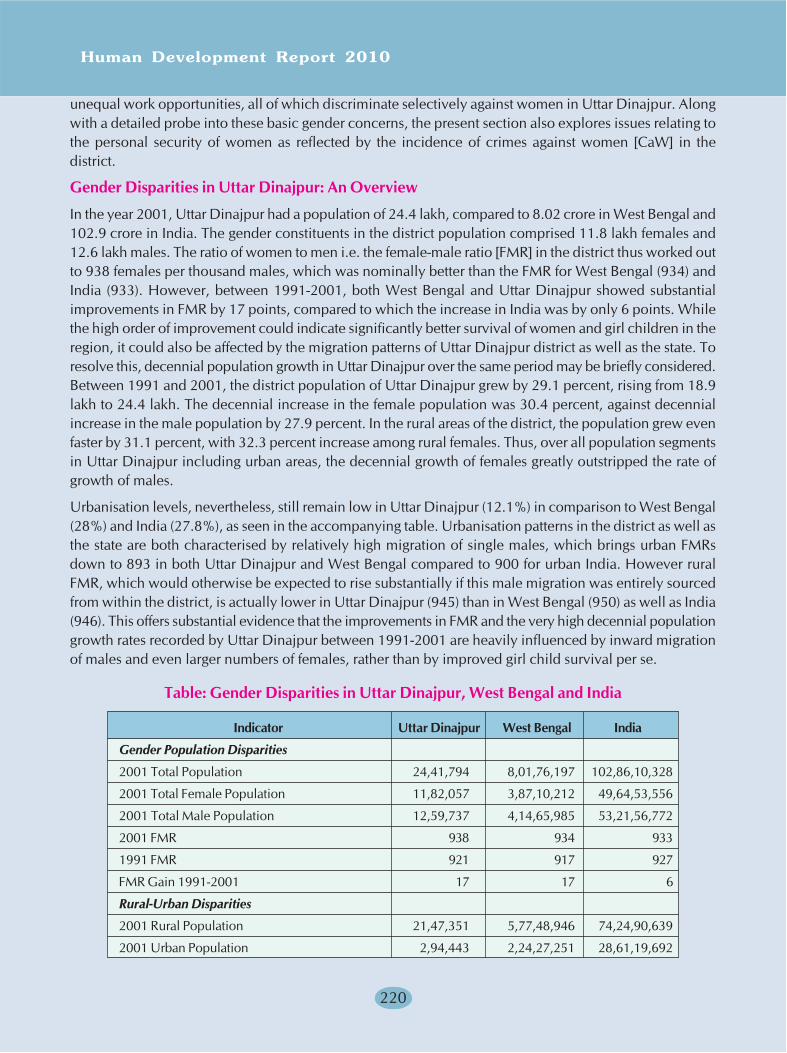
Human Development Report 2010
220
unequal work opportunities, all of which discriminate selectively against women in Uttar Dinajpur. Alongwith a detailed probe into these basic gender concerns, the present section also explores issues relating tothe personal security of women as reflected by the incidence of crimes against women [CaW] in thedistrict.
Gender Disparities in Uttar Dinajpur: An Overview
In the year 2001, Uttar Dinajpur had a population of 24.4 lakh, compared to 8.02 crore in West Bengal and102.9 crore in India. The gender constituents in the district population comprised 11.8 lakh females and12.6 lakh males. The ratio of women to men i.e. the female-male ratio [FMR] in the district thus worked outto 938 females per thousand males, which was nominally better than the FMR for West Bengal (934) andIndia (933). However, between 1991-2001, both West Bengal and Uttar Dinajpur showed substantialimprovements in FMR by 17 points, compared to which the increase in India was by only 6 points. Whilethe high order of improvement could indicate significantly better survival of women and girl children in theregion, it could also be affected by the migration patterns of Uttar Dinajpur district as well as the state. Toresolve this, decennial population growth in Uttar Dinajpur over the same period may be briefly considered.Between 1991 and 2001, the district population of Uttar Dinajpur grew by 29.1 percent, rising from 18.9lakh to 24.4 lakh. The decennial increase in the female population was 30.4 percent, against decennialincrease in the male population by 27.9 percent. In the rural areas of the district, the population grew evenfaster by 31.1 percent, with 32.3 percent increase among rural females. Thus, over all population segmentsin Uttar Dinajpur including urban areas, the decennial growth of females greatly outstripped the rate ofgrowth of males.
Urbanisation levels, nevertheless, still remain low in Uttar Dinajpur (12.1%) in comparison to West Bengal(28%) and India (27.8%), as seen in the accompanying table. Urbanisation patterns in the district as well asthe state are both characterised by relatively high migration of single males, which brings urban FMRsdown to 893 in both Uttar Dinajpur and West Bengal compared to 900 for urban India. However ruralFMR, which would otherwise be expected to rise substantially if this male migration was entirely sourcedfrom within the district, is actually lower in Uttar Dinajpur (945) than in West Bengal (950) as well as India(946). This offers substantial evidence that the improvements in FMR and the very high decennial populationgrowth rates recorded by Uttar Dinajpur between 1991-2001 are heavily influenced by inward migrationof males and even larger numbers of females, rather than by improved girl child survival per se.
Table: Gender Disparities in Uttar Dinajpur, West Bengal and India
Indicator Uttar Dinajpur West Bengal India
Gender Population Disparities
2001 Total Population 24,41,794 8,01,76,197 102,86,10,328
2001 Total Female Population 11,82,057 3,87,10,212 49,64,53,556
2001 Total Male Population 12,59,737 4,14,65,985 53,21,56,772
2001 FMR 938 934 933
1991 FMR 921 917 927
FMR Gain 1991-2001 17 17 6
Rural-Urban Disparities
2001 Rural Population 21,47,351 5,77,48,946 74,24,90,639
2001 Urban Population 2,94,443 2,24,27,251 28,61,19,692
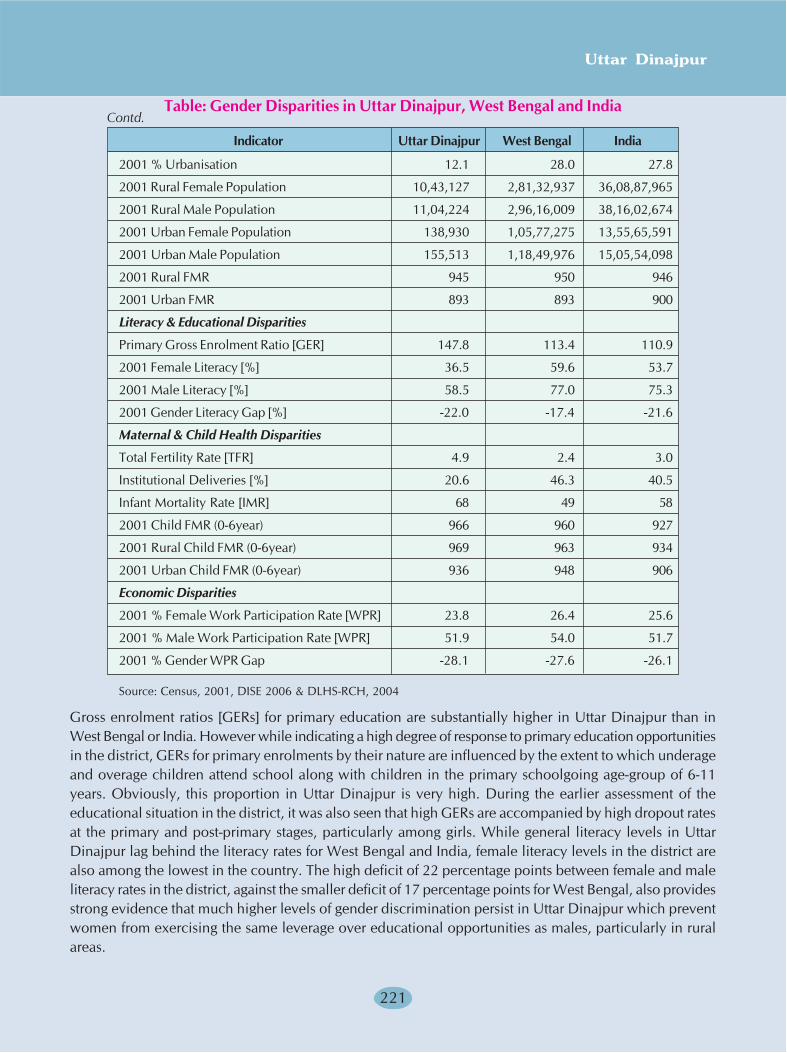
Uttar Dinajpur
221
2001 % Urbanisation 12.1 28.0 27.8
2001 Rural Female Population 10,43,127 2,81,32,937 36,08,87,965
2001 Rural Male Population 11,04,224 2,96,16,009 38,16,02,674
2001 Urban Female Population 138,930 1,05,77,275 13,55,65,591
2001 Urban Male Population 155,513 1,18,49,976 15,05,54,098
2001 Rural FMR 945 950 946
2001 Urban FMR 893 893 900
Literacy & Educational Disparities
Primary Gross Enrolment Ratio [GER] 147.8 113.4 110.9
2001 Female Literacy [%] 36.5 59.6 53.7
2001 Male Literacy [%] 58.5 77.0 75.3
2001 Gender Literacy Gap [%] -22.0 -17.4 -21.6
Maternal & Child Health Disparities
Total Fertility Rate [TFR] 4.9 2.4 3.0
Institutional Deliveries [%] 20.6 46.3 40.5
Infant Mortality Rate [IMR] 68 49 58
2001 Child FMR (0-6year) 966 960 927
2001 Rural Child FMR (0-6year) 969 963 934
2001 Urban Child FMR (0-6year) 936 948 906
Economic Disparities
2001 % Female Work Participation Rate [WPR] 23.8 26.4 25.6
2001 % Male Work Participation Rate [WPR] 51.9 54.0 51.7
2001 % Gender WPR Gap -28.1 -27.6 -26.1
Source: Census, 2001, DISE 2006 & DLHS-RCH, 2004
Gross enrolment ratios [GERs] for primary education are substantially higher in Uttar Dinajpur than inWest Bengal or India. However while indicating a high degree of response to primary education opportunitiesin the district, GERs for primary enrolments by their nature are influenced by the extent to which underageand overage children attend school along with children in the primary schoolgoing age-group of 6-11years. Obviously, this proportion in Uttar Dinajpur is very high. During the earlier assessment of theeducational situation in the district, it was also seen that high GERs are accompanied by high dropout ratesat the primary and post-primary stages, particularly among girls. While general literacy levels in UttarDinajpur lag behind the literacy rates for West Bengal and India, female literacy levels in the district arealso among the lowest in the country. The high deficit of 22 percentage points between female and maleliteracy rates in the district, against the smaller deficit of 17 percentage points for West Bengal, also providesstrong evidence that much higher levels of gender discrimination persist in Uttar Dinajpur which preventwomen from exercising the same leverage over educational opportunities as males, particularly in ruralareas.
Table: Gender Disparities in Uttar Dinajpur, West Bengal and India
Indicator Uttar Dinajpur West Bengal India
Contd.
Human Development Report 2010
222
More evidence of the impositions that strong patriarchal structures within rural communities make on thereproductive health of women is seen in the very high total fertility rate [TFR] of 4.9 per woman in thedistrict, differing sharply from 2.4 in West Bengal and 3.0 in India as a whole. The impacts of high fertilityand multiple pregnancies on the health of women and children in Uttar Dinajpur are also visible in the lowrate of institutionalised deliveries and high levels of infant mortality, in contrast to the rates for West Bengaland India. Using a more scientific methodology to assess this, the DLHS-RHS survey conducted in 2004estimated IMR in Uttar Dinajpur to be as high as 122 per thousand live births. The immediate fallout of lowhealthcare coverage, poor reproductive rights and the limited autonomy that women exercise as mothers isfelt in the lower probability of child survival in Uttar Dinajpur, which reinforces high TFR. Evidence of thisis seen in the sharp decline in the proportion of females in the Uttar Dinajpur population from the childFMR of 966 in the age-group 0-6years to the FMR of 936 in the general population. Sharp attritions in FMRafter infancy, which reflect higher differential mortality among women and girl children, are caused primarilyby nutritional discrimination as well as unequal gender access to healthcare. In rural Uttar Dinajpur, therate of attrition is much higher, sharply exceeding the attrition rates in West Bengal and India.
One reason why men have higher earnings than women is because they accumulate more human capitalthrough education and experience, and also receive higher returns to education compared to women in theform of gender wage differentials. While no direct gender wage data are available in Uttar Dinajpur tosubstantiate this, comparison of gender work participation rates provides enough evidence of workdiscrimination between men and women in the district. Work participation rates among women in UttarDinajpur are much lower than the corresponding rates for West Bengal or India. Thus while less than aquarter of the women in the district directly participate in economic work, male work participation rates inUttar Dinajpur exceed the rates in India as a whole and are only marginally behind the male workparticipation rates in West Bengal.
Even from preliminary study of a few selected indicators, it becomes evident that women in Uttar Dinajpurface considerable discrimination within their social, economic and personal spheres. Coupled with highlandlessness, illiteracy and poverty in the district, women bear the added brunt of gender injustice andsubordination. While economic upliftment can come in the course of economic development, it can onlytouch the lives of women meaningfully if it also augments their opportunities and freedoms. Hence a moredetailed examination of women's situations in Uttar Dinajpur district must be made to identify specificregions and sector where gender discrimination is strongest. From the extent of the gender gap seen in theforegoing indicators, the first area for focused study is gender literacy.
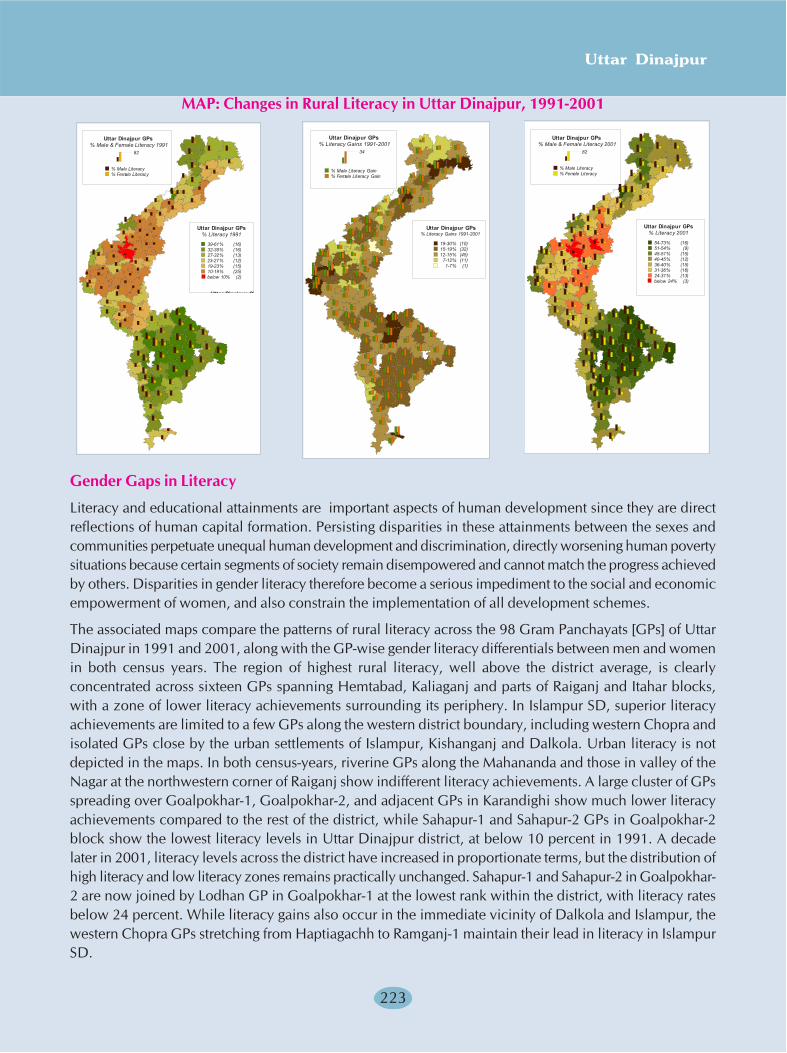
Uttar Dinajpur
223
MAP: Changes in Rural Literacy in Uttar Dinajpur, 1991-2001
Gender Gaps in Literacy
Literacy and educational attainments are important aspects of human development since they are directreflections of human capital formation. Persisting disparities in these attainments between the sexes andcommunities perpetuate unequal human development and discrimination, directly worsening human povertysituations because certain segments of society remain disempowered and cannot match the progress achievedby others. Disparities in gender literacy therefore become a serious impediment to the social and economicempowerment of women, and also constrain the implementation of all development schemes.
The associated maps compare the patterns of rural literacy across the 98 Gram Panchayats [GPs] of UttarDinajpur in 1991 and 2001, along with the GP-wise gender literacy differentials between men and womenin both census years. The region of highest rural literacy, well above the district average, is clearlyconcentrated across sixteen GPs spanning Hemtabad, Kaliaganj and parts of Raiganj and Itahar blocks,with a zone of lower literacy achievements surrounding its periphery. In Islampur SD, superior literacyachievements are limited to a few GPs along the western district boundary, including western Chopra andisolated GPs close by the urban settlements of Islampur, Kishanganj and Dalkola. Urban literacy is notdepicted in the maps. In both census-years, riverine GPs along the Mahananda and those in valley of theNagar at the northwestern corner of Raiganj show indifferent literacy achievements. A large cluster of GPsspreading over Goalpokhar-1, Goalpokhar-2, and adjacent GPs in Karandighi show much lower literacyachievements compared to the rest of the district, while Sahapur-1 and Sahapur-2 GPs in Goalpokhar-2block show the lowest literacy levels in Uttar Dinajpur district, at below 10 percent in 1991. A decadelater in 2001, literacy levels across the district have increased in proportionate terms, but the distribution ofhigh literacy and low literacy zones remains practically unchanged. Sahapur-1 and Sahapur-2 in Goalpokhar-2 are now joined by Lodhan GP in Goalpokhar-1 at the lowest rank within the district, with literacy ratesbelow 24 percent. While literacy gains also occur in the immediate vicinity of Dalkola and Islampur, thewestern Chopra GPs stretching from Haptiagachh to Ramganj-1 maintain their lead in literacy in IslampurSD.
Uttar Dinajpur GP
Uttar Dinajpur GPs% Literacy 1991
39-61% (16)32-39% (16)27-32% (13)23-27% (12)19-23% (15)10-19% (25)below 10% (2)
Uttar Dinajpur GPs% Male & Female Literacy 1991
82
% Male Literacy% Female Literacy
Uttar Dinajpur GPs% Literacy Gains 1991-2001
19-30% (10)15-19% (32)12-15% (45)
7-12% (11)1-7% (1)
Uttar Dinajpur GPs% Literacy Gains 1991-2001
34
% Male Literacy Gain% Female Literacy Gain
Uttar Dinajpur GPs% Male & Female Literacy 2001
82
% Male Literacy% Female Literacy
Uttar Dinajpur GPs% Literacy 2001
54-73% (16)51-54% (9)45-51% (15)40-45% (12)36-40% (15)31-36% (16)24-31% (13)below 24% (3)
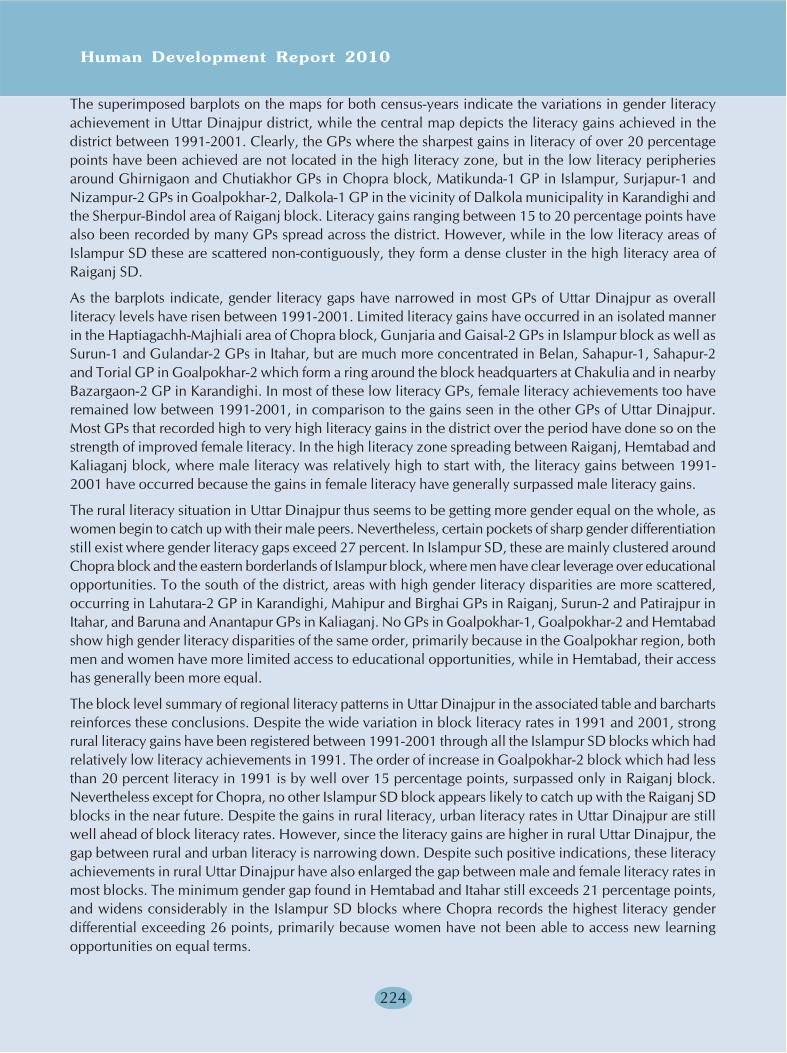
Human Development Report 2010
224
The superimposed barplots on the maps for both census-years indicate the variations in gender literacyachievement in Uttar Dinajpur district, while the central map depicts the literacy gains achieved in thedistrict between 1991-2001. Clearly, the GPs where the sharpest gains in literacy of over 20 percentagepoints have been achieved are not located in the high literacy zone, but in the low literacy peripheriesaround Ghirnigaon and Chutiakhor GPs in Chopra block, Matikunda-1 GP in Islampur, Surjapur-1 andNizampur-2 GPs in Goalpokhar-2, Dalkola-1 GP in the vicinity of Dalkola municipality in Karandighi andthe Sherpur-Bindol area of Raiganj block. Literacy gains ranging between 15 to 20 percentage points havealso been recorded by many GPs spread across the district. However, while in the low literacy areas ofIslampur SD these are scattered non-contiguously, they form a dense cluster in the high literacy area ofRaiganj SD.
As the barplots indicate, gender literacy gaps have narrowed in most GPs of Uttar Dinajpur as overallliteracy levels have risen between 1991-2001. Limited literacy gains have occurred in an isolated mannerin the Haptiagachh-Majhiali area of Chopra block, Gunjaria and Gaisal-2 GPs in Islampur block as well asSurun-1 and Gulandar-2 GPs in Itahar, but are much more concentrated in Belan, Sahapur-1, Sahapur-2and Torial GP in Goalpokhar-2 which form a ring around the block headquarters at Chakulia and in nearbyBazargaon-2 GP in Karandighi. In most of these low literacy GPs, female literacy achievements too haveremained low between 1991-2001, in comparison to the gains seen in the other GPs of Uttar Dinajpur.Most GPs that recorded high to very high literacy gains in the district over the period have done so on thestrength of improved female literacy. In the high literacy zone spreading between Raiganj, Hemtabad andKaliaganj block, where male literacy was relatively high to start with, the literacy gains between 1991-2001 have occurred because the gains in female literacy have generally surpassed male literacy gains.
The rural literacy situation in Uttar Dinajpur thus seems to be getting more gender equal on the whole, aswomen begin to catch up with their male peers. Nevertheless, certain pockets of sharp gender differentiationstill exist where gender literacy gaps exceed 27 percent. In Islampur SD, these are mainly clustered aroundChopra block and the eastern borderlands of Islampur block, where men have clear leverage over educationalopportunities. To the south of the district, areas with high gender literacy disparities are more scattered,occurring in Lahutara-2 GP in Karandighi, Mahipur and Birghai GPs in Raiganj, Surun-2 and Patirajpur inItahar, and Baruna and Anantapur GPs in Kaliaganj. No GPs in Goalpokhar-1, Goalpokhar-2 and Hemtabadshow high gender literacy disparities of the same order, primarily because in the Goalpokhar region, bothmen and women have more limited access to educational opportunities, while in Hemtabad, their accesshas generally been more equal.
The block level summary of regional literacy patterns in Uttar Dinajpur in the associated table and barchartsreinforces these conclusions. Despite the wide variation in block literacy rates in 1991 and 2001, strongrural literacy gains have been registered between 1991-2001 through all the Islampur SD blocks which hadrelatively low literacy achievements in 1991. The order of increase in Goalpokhar-2 block which had lessthan 20 percent literacy in 1991 is by well over 15 percentage points, surpassed only in Raiganj block.Nevertheless except for Chopra, no other Islampur SD block appears likely to catch up with the Raiganj SDblocks in the near future. Despite the gains in rural literacy, urban literacy rates in Uttar Dinajpur are stillwell ahead of block literacy rates. However, since the literacy gains are higher in rural Uttar Dinajpur, thegap between rural and urban literacy is narrowing down. Despite such positive indications, these literacyachievements in rural Uttar Dinajpur have also enlarged the gap between male and female literacy rates inmost blocks. The minimum gender gap found in Hemtabad and Itahar still exceeds 21 percentage points,and widens considerably in the Islampur SD blocks where Chopra records the highest literacy genderdifferential exceeding 26 points, primarily because women have not been able to access new learningopportunities on equal terms.
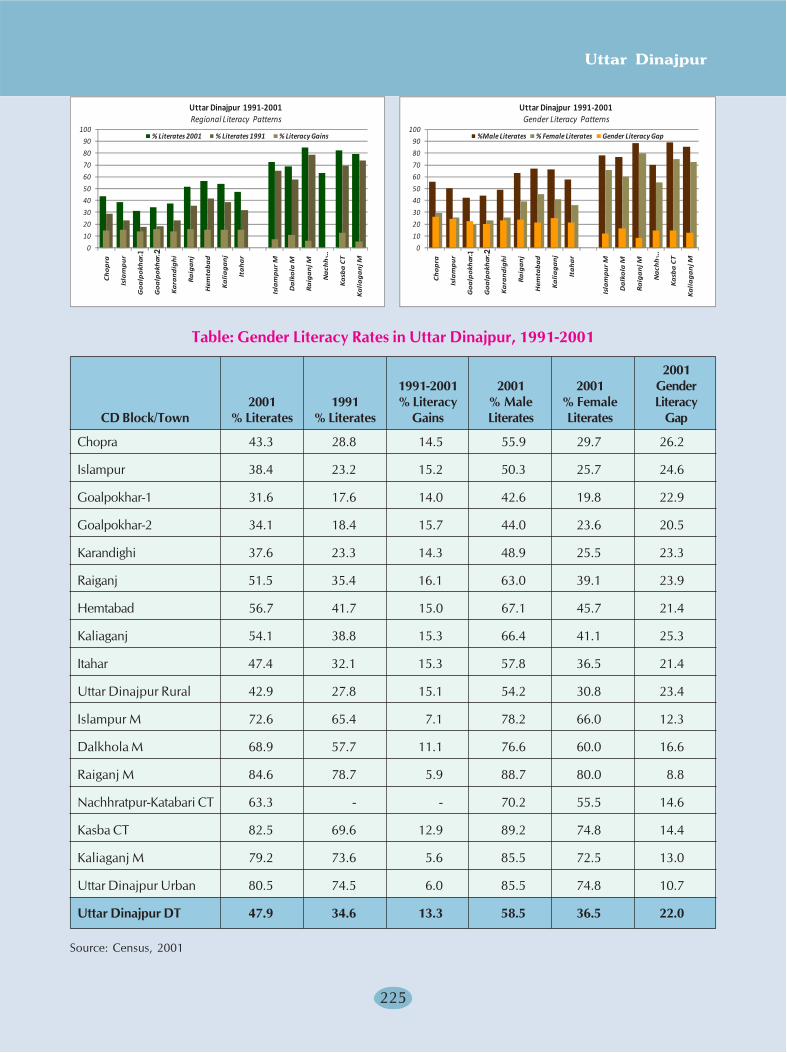
Uttar Dinajpur
225
0
10
20
30
40
50
60
70
80
90
100
Ch
op
ra
Isla
mp
ur
Go
alp
okh
ar…
Go
alp
okh
ar…
Ka
ran
dig
hi
Ra
iga
nj
Hem
tab
ad
Ka
lia
ga
nj
Ita
ha
r
Isla
mp
ur
M
Da
lko
la M
Ra
iga
nj M
Na
chh
-…
Ka
sba
CT
Ka
lia
ga
nj M
% Literates 2001 % Literates 1991 % Literacy Gains
Uttar Dinajpur 1991-2001Regional Literacy Patterns
0
10
20
30
40
50
60
70
80
90
100
Ch
op
ra
Isla
mp
ur
Go
alp
okh
ar…
Go
alp
okh
ar…
Ka
ran
dig
hi
Ra
iga
nj
Hem
tab
ad
Ka
lia
ga
nj
Ita
ha
r
Isla
mp
ur
M
Da
lko
la M
Ra
iga
nj M
Na
chh
-…
Ka
sba
CT
Ka
lia
ga
nj M
%Male Literates % Female Literates Gender Literacy Gap
Uttar Dinajpur 1991-2001Gender Literacy Patterns
Table: Gender Literacy Rates in Uttar Dinajpur, 1991-2001
20011991-2001 2001 2001 Gender
2001 1991 % Literacy % Male % Female LiteracyCD Block/Town % Literates % Literates Gains Literates Literates Gap
Chopra 43.3 28.8 14.5 55.9 29.7 26.2
Islampur 38.4 23.2 15.2 50.3 25.7 24.6
Goalpokhar-1 31.6 17.6 14.0 42.6 19.8 22.9
Goalpokhar-2 34.1 18.4 15.7 44.0 23.6 20.5
Karandighi 37.6 23.3 14.3 48.9 25.5 23.3
Raiganj 51.5 35.4 16.1 63.0 39.1 23.9
Hemtabad 56.7 41.7 15.0 67.1 45.7 21.4
Kaliaganj 54.1 38.8 15.3 66.4 41.1 25.3
Itahar 47.4 32.1 15.3 57.8 36.5 21.4
Uttar Dinajpur Rural 42.9 27.8 15.1 54.2 30.8 23.4
Islampur M 72.6 65.4 7.1 78.2 66.0 12.3
Dalkhola M 68.9 57.7 11.1 76.6 60.0 16.6
Raiganj M 84.6 78.7 5.9 88.7 80.0 8.8
Nachhratpur-Katabari CT 63.3 - - 70.2 55.5 14.6
Kasba CT 82.5 69.6 12.9 89.2 74.8 14.4
Kaliaganj M 79.2 73.6 5.6 85.5 72.5 13.0
Uttar Dinajpur Urban 80.5 74.5 6.0 85.5 74.8 10.7
Uttar Dinajpur DT 47.9 34.6 13.3 58.5 36.5 22.0
Source: Census, 2001
1 2 1 2
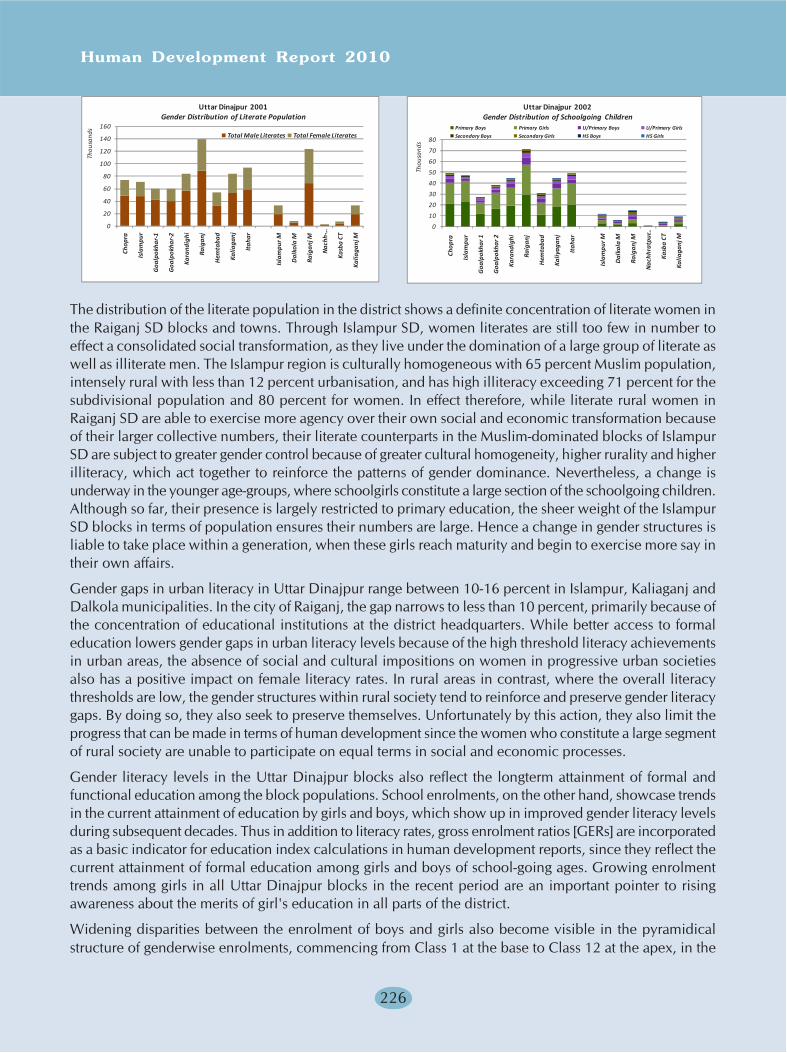
Human Development Report 2010
226
0
20
40
60
80
100
120
140
160Ch
opra
Isla
mpu
r
Goa
lpok
har-
1
Goa
lpok
har-
2
Kara
ndig
hi
Raig
anj
Hem
taba
d
Kalia
ganj
Itah
ar
Isla
mpu
r M
Dal
kola
M
Raig
anj M
Nac
hh-…
Kasb
a CT
Kalia
ganj
M
Thou
sand
s
Total Male Literates Total Female Literates
Uttar Dinajpur 2001Gender Distribution of Literate Population
0
10
20
30
40
50
60
70
80
Chop
ra
Isla
mpu
r
Goa
lpok
har 1
Goa
lpok
har 2
Kara
ndig
hi
Raig
anj
Hem
taba
d
Kaliy
agan
j
Itah
ar
Isla
mpu
r M
Dal
kola
M
Raig
anj M
Nac
hhra
tpur
…
Kasb
a CT
Kalia
ganj
M
Thou
sand
s
Primary Boys Primary Girls U/Primary Boys U/Primary Girls
Secondary Boys Secondary Girls HS Boys HS Girls
Uttar Dinajpur 2002Gender Distribution of Schoolgoing Children
The distribution of the literate population in the district shows a definite concentration of literate women inthe Raiganj SD blocks and towns. Through Islampur SD, women literates are still too few in number toeffect a consolidated social transformation, as they live under the domination of a large group of literate aswell as illiterate men. The Islampur region is culturally homogeneous with 65 percent Muslim population,intensely rural with less than 12 percent urbanisation, and has high illiteracy exceeding 71 percent for thesubdivisional population and 80 percent for women. In effect therefore, while literate rural women inRaiganj SD are able to exercise more agency over their own social and economic transformation becauseof their larger collective numbers, their literate counterparts in the Muslim-dominated blocks of IslampurSD are subject to greater gender control because of greater cultural homogeneity, higher rurality and higherilliteracy, which act together to reinforce the patterns of gender dominance. Nevertheless, a change isunderway in the younger age-groups, where schoolgirls constitute a large section of the schoolgoing children.Although so far, their presence is largely restricted to primary education, the sheer weight of the IslampurSD blocks in terms of population ensures their numbers are large. Hence a change in gender structures isliable to take place within a generation, when these girls reach maturity and begin to exercise more say intheir own affairs.
Gender gaps in urban literacy in Uttar Dinajpur range between 10-16 percent in Islampur, Kaliaganj andDalkola municipalities. In the city of Raiganj, the gap narrows to less than 10 percent, primarily because ofthe concentration of educational institutions at the district headquarters. While better access to formaleducation lowers gender gaps in urban literacy levels because of the high threshold literacy achievementsin urban areas, the absence of social and cultural impositions on women in progressive urban societiesalso has a positive impact on female literacy rates. In rural areas in contrast, where the overall literacythresholds are low, the gender structures within rural society tend to reinforce and preserve gender literacygaps. By doing so, they also seek to preserve themselves. Unfortunately by this action, they also limit theprogress that can be made in terms of human development since the women who constitute a large segmentof rural society are unable to participate on equal terms in social and economic processes.
Gender literacy levels in the Uttar Dinajpur blocks also reflect the longterm attainment of formal andfunctional education among the block populations. School enrolments, on the other hand, showcase trendsin the current attainment of education by girls and boys, which show up in improved gender literacy levelsduring subsequent decades. Thus in addition to literacy rates, gross enrolment ratios [GERs] are incorporatedas a basic indicator for education index calculations in human development reports, since they reflect thecurrent attainment of formal education among girls and boys of school-going ages. Growing enrolmenttrends among girls in all Uttar Dinajpur blocks in the recent period are an important pointer to risingawareness about the merits of girl's education in all parts of the district.
Widening disparities between the enrolment of boys and girls also become visible in the pyramidicalstructure of genderwise enrolments, commencing from Class 1 at the base to Class 12 at the apex, in the
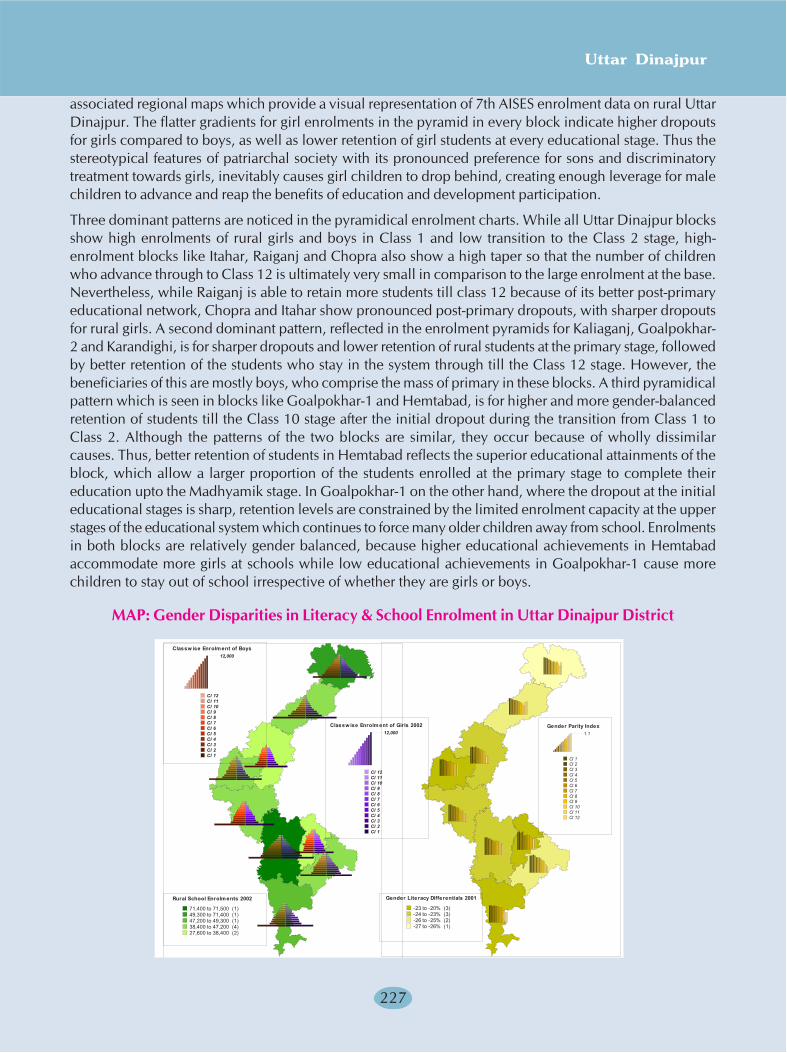
Uttar Dinajpur
227
associated regional maps which provide a visual representation of 7th AISES enrolment data on rural UttarDinajpur. The flatter gradients for girl enrolments in the pyramid in every block indicate higher dropoutsfor girls compared to boys, as well as lower retention of girl students at every educational stage. Thus thestereotypical features of patriarchal society with its pronounced preference for sons and discriminatorytreatment towards girls, inevitably causes girl children to drop behind, creating enough leverage for malechildren to advance and reap the benefits of education and development participation.
Three dominant patterns are noticed in the pyramidical enrolment charts. While all Uttar Dinajpur blocksshow high enrolments of rural girls and boys in Class 1 and low transition to the Class 2 stage, high-enrolment blocks like Itahar, Raiganj and Chopra also show a high taper so that the number of childrenwho advance through to Class 12 is ultimately very small in comparison to the large enrolment at the base.Nevertheless, while Raiganj is able to retain more students till class 12 because of its better post-primaryeducational network, Chopra and Itahar show pronounced post-primary dropouts, with sharper dropoutsfor rural girls. A second dominant pattern, reflected in the enrolment pyramids for Kaliaganj, Goalpokhar-2 and Karandighi, is for sharper dropouts and lower retention of rural students at the primary stage, followedby better retention of the students who stay in the system through till the Class 12 stage. However, thebeneficiaries of this are mostly boys, who comprise the mass of primary in these blocks. A third pyramidicalpattern which is seen in blocks like Goalpokhar-1 and Hemtabad, is for higher and more gender-balancedretention of students till the Class 10 stage after the initial dropout during the transition from Class 1 toClass 2. Although the patterns of the two blocks are similar, they occur because of wholly dissimilarcauses. Thus, better retention of students in Hemtabad reflects the superior educational attainments of theblock, which allow a larger proportion of the students enrolled at the primary stage to complete theireducation upto the Madhyamik stage. In Goalpokhar-1 on the other hand, where the dropout at the initialeducational stages is sharp, retention levels are constrained by the limited enrolment capacity at the upperstages of the educational system which continues to force many older children away from school. Enrolmentsin both blocks are relatively gender balanced, because higher educational achievements in Hemtabadaccommodate more girls at schools while low educational achievements in Goalpokhar-1 cause morechildren to stay out of school irrespective of whether they are girls or boys.
MAP: Gender Disparities in Literacy & School Enrolment in Uttar Dinajpur District
Gender Parity Index1.1
Cl 1Cl 2Cl 3Cl 4Cl 5Cl 6Cl 7Cl 8Cl 9Cl 10Cl 11Cl 12
Gender Literacy Differentials 2001
-23 to -20% (3)-24 to -23% (3)-26 to -25% (2)-27 to -26% (1)
Rural School Enrolm ents 2002
71,400 to 71,500 (1)49,300 to 71,400 (1)47,200 to 49,300 (1)38,400 to 47,200 (4)27,600 to 38,400 (2)
Classw ise Enrolm ent of Girls 200212,000
Cl 12Cl 11Cl 10Cl 9Cl 8Cl 7Cl 6Cl 5Cl 4Cl 3Cl 2Cl 1
Classw ise Enrolm ent of Boys12,000
Cl 12Cl 11Cl 10Cl 9Cl 8Cl 7Cl 6Cl 5Cl 4Cl 3Cl 2Cl 1
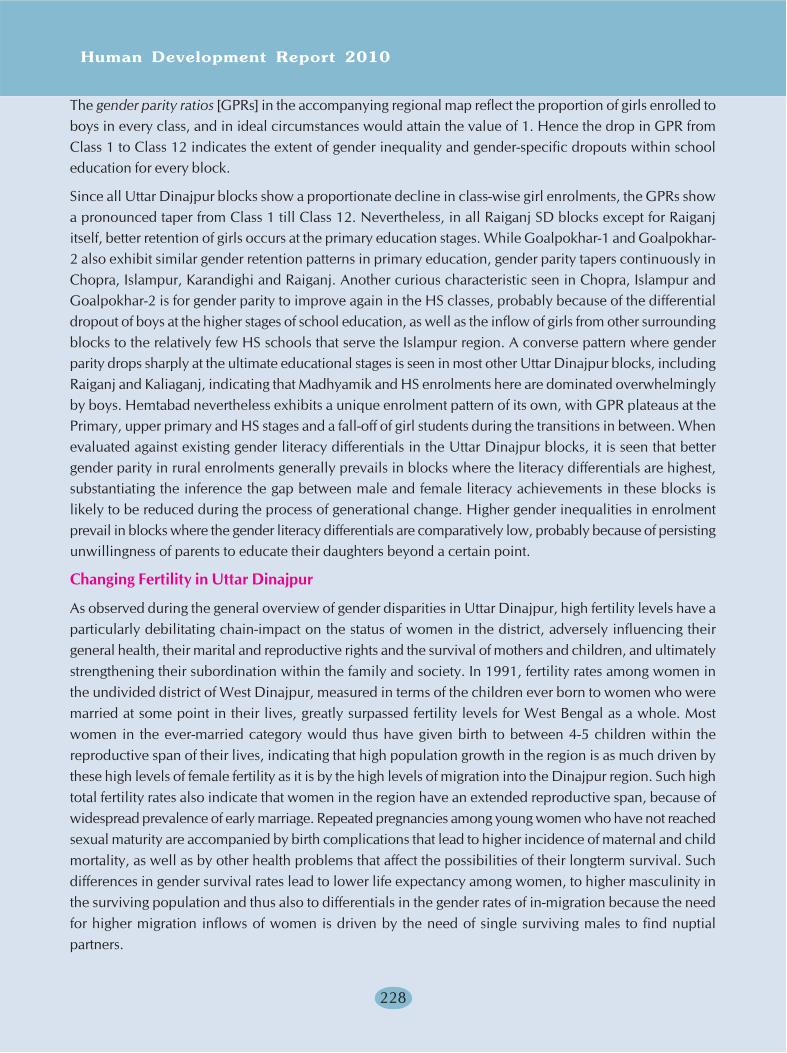
Human Development Report 2010
228
The gender parity ratios [GPRs] in the accompanying regional map reflect the proportion of girls enrolled toboys in every class, and in ideal circumstances would attain the value of 1. Hence the drop in GPR fromClass 1 to Class 12 indicates the extent of gender inequality and gender-specific dropouts within schooleducation for every block.
Since all Uttar Dinajpur blocks show a proportionate decline in class-wise girl enrolments, the GPRs showa pronounced taper from Class 1 till Class 12. Nevertheless, in all Raiganj SD blocks except for Raiganjitself, better retention of girls occurs at the primary education stages. While Goalpokhar-1 and Goalpokhar-2 also exhibit similar gender retention patterns in primary education, gender parity tapers continuously inChopra, Islampur, Karandighi and Raiganj. Another curious characteristic seen in Chopra, Islampur andGoalpokhar-2 is for gender parity to improve again in the HS classes, probably because of the differentialdropout of boys at the higher stages of school education, as well as the inflow of girls from other surroundingblocks to the relatively few HS schools that serve the Islampur region. A converse pattern where genderparity drops sharply at the ultimate educational stages is seen in most other Uttar Dinajpur blocks, includingRaiganj and Kaliaganj, indicating that Madhyamik and HS enrolments here are dominated overwhelminglyby boys. Hemtabad nevertheless exhibits a unique enrolment pattern of its own, with GPR plateaus at thePrimary, upper primary and HS stages and a fall-off of girl students during the transitions in between. Whenevaluated against existing gender literacy differentials in the Uttar Dinajpur blocks, it is seen that bettergender parity in rural enrolments generally prevails in blocks where the literacy differentials are highest,substantiating the inference the gap between male and female literacy achievements in these blocks islikely to be reduced during the process of generational change. Higher gender inequalities in enrolmentprevail in blocks where the gender literacy differentials are comparatively low, probably because of persistingunwillingness of parents to educate their daughters beyond a certain point.
Changing Fertility in Uttar Dinajpur
As observed during the general overview of gender disparities in Uttar Dinajpur, high fertility levels have aparticularly debilitating chain-impact on the status of women in the district, adversely influencing theirgeneral health, their marital and reproductive rights and the survival of mothers and children, and ultimatelystrengthening their subordination within the family and society. In 1991, fertility rates among women inthe undivided district of West Dinajpur, measured in terms of the children ever born to women who weremarried at some point in their lives, greatly surpassed fertility levels for West Bengal as a whole. Mostwomen in the ever-married category would thus have given birth to between 4-5 children within thereproductive span of their lives, indicating that high population growth in the region is as much driven bythese high levels of female fertility as it is by the high levels of migration into the Dinajpur region. Such hightotal fertility rates also indicate that women in the region have an extended reproductive span, because ofwidespread prevalence of early marriage. Repeated pregnancies among young women who have not reachedsexual maturity are accompanied by birth complications that lead to higher incidence of maternal and childmortality, as well as by other health problems that affect the possibilities of their longterm survival. Suchdifferences in gender survival rates lead to lower life expectancy among women, to higher masculinity inthe surviving population and thus also to differentials in the gender rates of in-migration because the needfor higher migration inflows of women is driven by the need of single surviving males to find nuptialpartners.
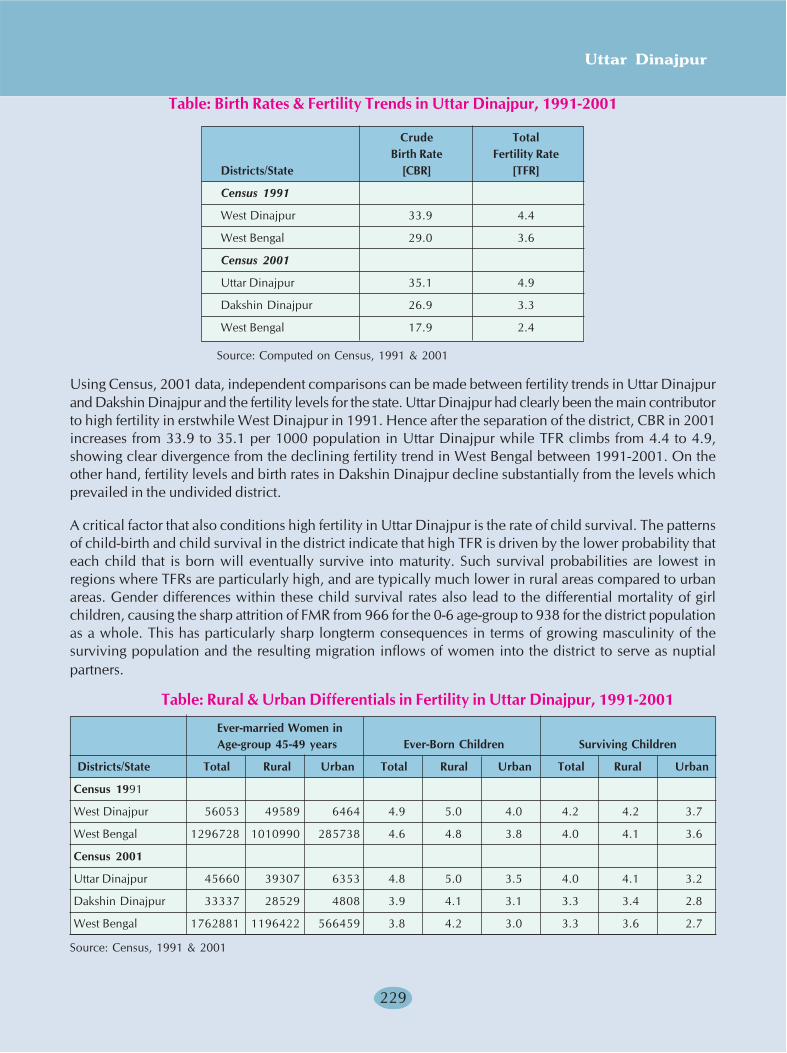
Uttar Dinajpur
229
Table: Birth Rates & Fertility Trends in Uttar Dinajpur, 1991-2001
Crude TotalBirth Rate Fertility Rate
Districts/State [CBR] [TFR]
Census 1991
West Dinajpur 33.9 4.4
West Bengal 29.0 3.6
Census 2001
Uttar Dinajpur 35.1 4.9
Dakshin Dinajpur 26.9 3.3
West Bengal 17.9 2.4
Source: Computed on Census, 1991 & 2001
Using Census, 2001 data, independent comparisons can be made between fertility trends in Uttar Dinajpurand Dakshin Dinajpur and the fertility levels for the state. Uttar Dinajpur had clearly been the main contributorto high fertility in erstwhile West Dinajpur in 1991. Hence after the separation of the district, CBR in 2001increases from 33.9 to 35.1 per 1000 population in Uttar Dinajpur while TFR climbs from 4.4 to 4.9,showing clear divergence from the declining fertility trend in West Bengal between 1991-2001. On theother hand, fertility levels and birth rates in Dakshin Dinajpur decline substantially from the levels whichprevailed in the undivided district.
A critical factor that also conditions high fertility in Uttar Dinajpur is the rate of child survival. The patternsof child-birth and child survival in the district indicate that high TFR is driven by the lower probability thateach child that is born will eventually survive into maturity. Such survival probabilities are lowest inregions where TFRs are particularly high, and are typically much lower in rural areas compared to urbanareas. Gender differences within these child survival rates also lead to the differential mortality of girlchildren, causing the sharp attrition of FMR from 966 for the 0-6 age-group to 938 for the district populationas a whole. This has particularly sharp longterm consequences in terms of growing masculinity of thesurviving population and the resulting migration inflows of women into the district to serve as nuptialpartners.
Table: Rural & Urban Differentials in Fertility in Uttar Dinajpur, 1991-2001
Ever-married Women inAge-group 45-49 years Ever-Born Children Surviving Children
Districts/State Total Rural Urban Total Rural Urban Total Rural Urban
Census 1991
West Dinajpur 56053 49589 6464 4.9 5.0 4.0 4.2 4.2 3.7
West Bengal 1296728 1010990 285738 4.6 4.8 3.8 4.0 4.1 3.6
Census 2001
Uttar Dinajpur 45660 39307 6353 4.8 5.0 3.5 4.0 4.1 3.2
Dakshin Dinajpur 33337 28529 4808 3.9 4.1 3.1 3.3 3.4 2.8
West Bengal 1762881 1196422 566459 3.8 4.2 3.0 3.3 3.6 2.7
Source: Census, 1991 & 2001
Human Development Report 2010
230
In 1991, 4 children survived out of every 4.6 children ever-born in West Bengal. Child survival probabilitieswere lower in West Dinajpur, where 4.2 children survived out of 4.9 children ever-born. The main sourcesfor low child survival were the rural areas of the undivided district, where the survival probability was evenlower. In urban areas, where fertility levels were lower, child survival also improved. Compared to the1991 levels for undivided West Dinajpur, rural birth rates and child survival rates in Uttar Dinajpur in2001 scarcely show evidence of any change, while urban rates improve significantly. Dakshin Dinajpurdistrict again stands in marked contrast. Both in urban and rural areas, child survival is substantially better,bringing about a strong fertility decline.
High levels of child mortality are usually the result of a mix of cultural and demographic factors, such aslow levels of institutional deliveries, lower survival rates of girl children who suffer disproportionatelyfrom neglect and malnourishment, and higher gender-specific mortality risks like maternal mortality, whichalso cause the neglect of surviving children. A study conducted recently by the Centre for Women's Studies,North Bengal University, for the Government of West Bengal on child marriage, dowry offences andtrafficking of women in the North Bengal districts, revealed that the usual age at marriage ranged between14-16 years in the rural areas of most districts. In case of Uttar Dinajpur, early marriages at the age of 11-12 years were still fairly common among certain rural communities. Early marriage resulted in a lengtheningof the reproductive span as well as high-risk pregnancies, ultimately raising the incidence of maternalmortality and infant mortality rates, and perpetuating the cycle of high TFR.
Paradoxically, such demographic characteristics that have adverse consequences on the survival of womendo not improve the social position of women but are in fact responsible for worsening it. The social valuegiven to women is higher when male survival is low, because it leads to higher social and economicvaluation being attached to their labour. Increased male survival makes the labour of women redundantexcept as unpaid work-agents, because a larger male workforce becomes available for all economic formsof work. Since women are gradually reduced to work within the household, their power declines especiallyin terms of economic and property relations, making them more and more subservient to social and economiccontrol by men. Rural women who share in livelihoods and economic work have no control over theirown earning contributions, because of the social control exercised over them by their spouses. Since thesepersonal earnings constitute the most basic form of property, women become more and more dispossessed,in spite of the valuable contribution they make to the survival of the home and family. An indication of theirdiminishing social worth is also found in the institution of dowry, which actually measures the premiumcommanded by males because of their greater economic and social power. Eventually, marriage is seen asa means for augmenting the economic assets of the male and his family through the extension of this socialpower over the family of the girl who marries into the male's family, thereby buying a share in the socialprivileges and power possessed by the male.
Reproductive & Child Healthcare [RCH]
The RCH programme is an integrated healthcare intervention, aimed towards improving mother and childsurvival and ultimately lowering the levels of rural fertility. Women's situations can also be redressedindirectly by a host of other development interventions that advance their social and mental well-being,like improved rural access to safe drinking water and electricity, higher standards of education and ruralliteracy, widened access to economic livelihoods and so on. However, RCH interventions which aimdirectly at raising the mean age at marriage, improving maternal health through proper antenatal and post-partum care and supplementary nutrition, institutionalising maternity services and ensuring safe deliveries,reducing birth-order through proper birth spacing, serving unmet needs for family planning, etc. reach outspecifically towards women, addressing them in their personal sphere as mothers, and advancing theirphysical well-being.
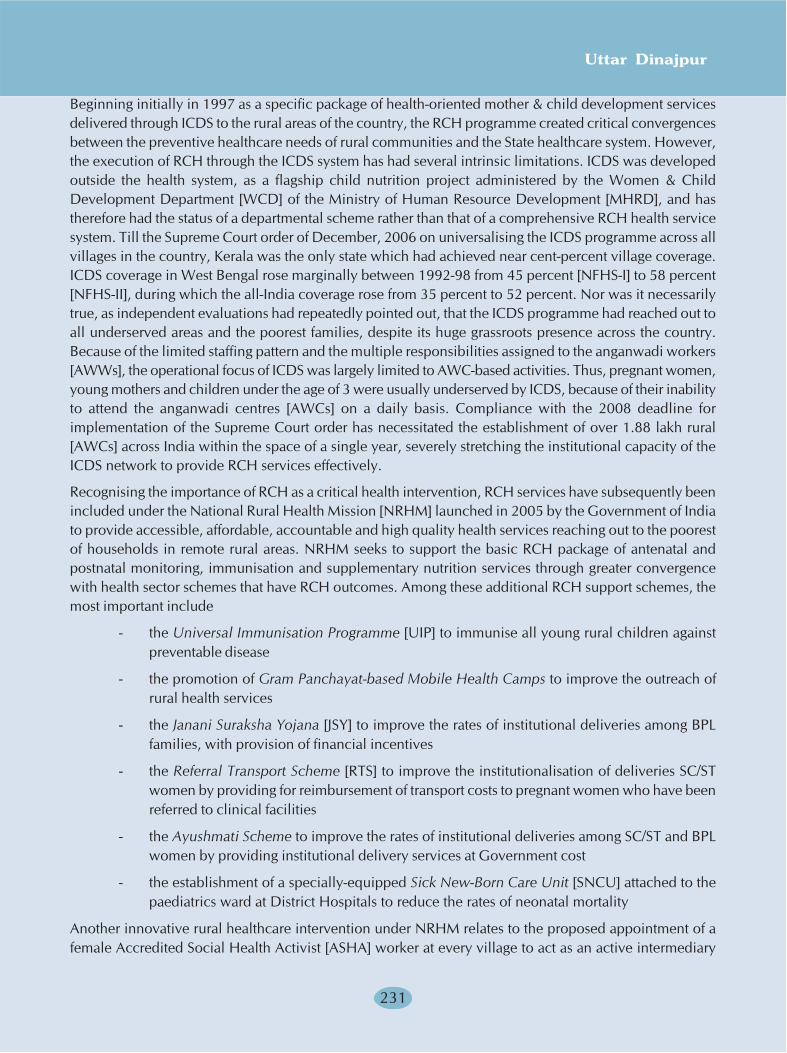
Uttar Dinajpur
231
Beginning initially in 1997 as a specific package of health-oriented mother & child development servicesdelivered through ICDS to the rural areas of the country, the RCH programme created critical convergencesbetween the preventive healthcare needs of rural communities and the State healthcare system. However,the execution of RCH through the ICDS system has had several intrinsic limitations. ICDS was developedoutside the health system, as a flagship child nutrition project administered by the Women & ChildDevelopment Department [WCD] of the Ministry of Human Resource Development [MHRD], and hastherefore had the status of a departmental scheme rather than that of a comprehensive RCH health servicesystem. Till the Supreme Court order of December, 2006 on universalising the ICDS programme across allvillages in the country, Kerala was the only state which had achieved near cent-percent village coverage.ICDS coverage in West Bengal rose marginally between 1992-98 from 45 percent [NFHS-I] to 58 percent[NFHS-II], during which the all-India coverage rose from 35 percent to 52 percent. Nor was it necessarilytrue, as independent evaluations had repeatedly pointed out, that the ICDS programme had reached out toall underserved areas and the poorest families, despite its huge grassroots presence across the country.Because of the limited staffing pattern and the multiple responsibilities assigned to the anganwadi workers[AWWs], the operational focus of ICDS was largely limited to AWC-based activities. Thus, pregnant women,young mothers and children under the age of 3 were usually underserved by ICDS, because of their inabilityto attend the anganwadi centres [AWCs] on a daily basis. Compliance with the 2008 deadline forimplementation of the Supreme Court order has necessitated the establishment of over 1.88 lakh rural[AWCs] across India within the space of a single year, severely stretching the institutional capacity of theICDS network to provide RCH services effectively.
Recognising the importance of RCH as a critical health intervention, RCH services have subsequently beenincluded under the National Rural Health Mission [NRHM] launched in 2005 by the Government of Indiato provide accessible, affordable, accountable and high quality health services reaching out to the poorestof households in remote rural areas. NRHM seeks to support the basic RCH package of antenatal andpostnatal monitoring, immunisation and supplementary nutrition services through greater convergencewith health sector schemes that have RCH outcomes. Among these additional RCH support schemes, themost important include
- the Universal Immunisation Programme [UIP] to immunise all young rural children againstpreventable disease
- the promotion of Gram Panchayat-based Mobile Health Camps to improve the outreach ofrural health services
- the Janani Suraksha Yojana [JSY] to improve the rates of institutional deliveries among BPLfamilies, with provision of financial incentives
- the Referral Transport Scheme [RTS] to improve the institutionalisation of deliveries SC/STwomen by providing for reimbursement of transport costs to pregnant women who have beenreferred to clinical facilities
- the Ayushmati Scheme to improve the rates of institutional deliveries among SC/ST and BPLwomen by providing institutional delivery services at Government cost
- the establishment of a specially-equipped Sick New-Born Care Unit [SNCU] attached to thepaediatrics ward at District Hospitals to reduce the rates of neonatal mortality
Another innovative rural healthcare intervention under NRHM relates to the proposed appointment of afemale Accredited Social Health Activist [ASHA] worker at every village to act as an active intermediary
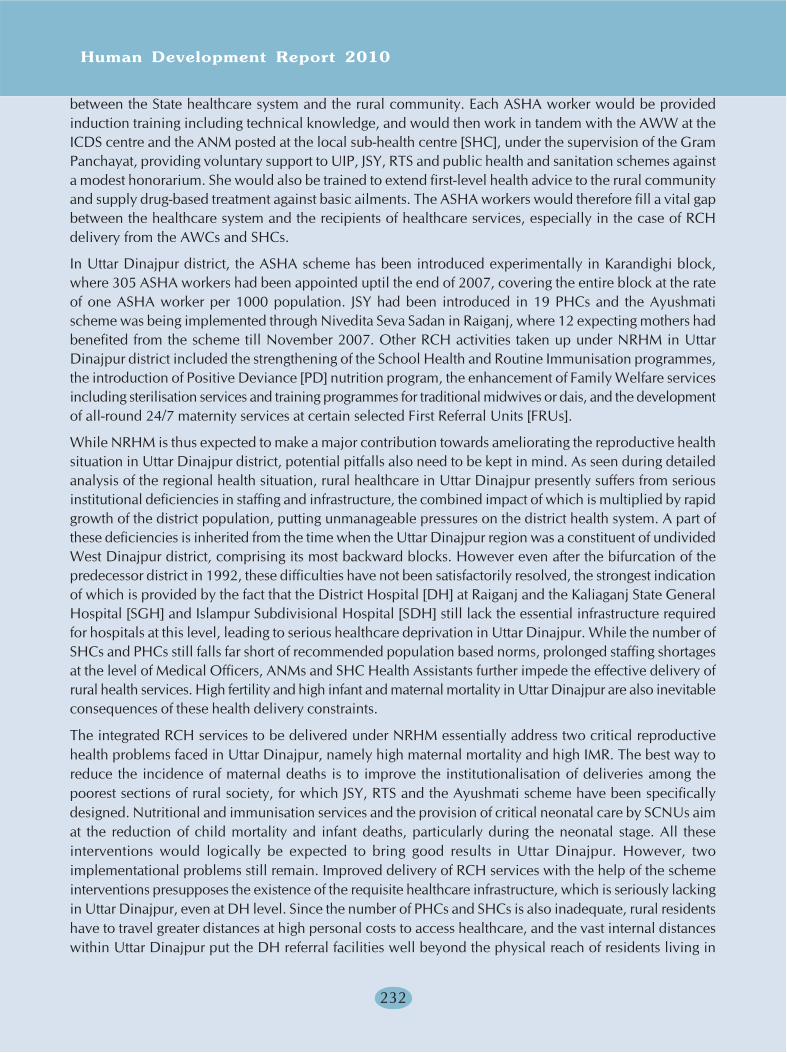
Human Development Report 2010
232
between the State healthcare system and the rural community. Each ASHA worker would be providedinduction training including technical knowledge, and would then work in tandem with the AWW at theICDS centre and the ANM posted at the local sub-health centre [SHC], under the supervision of the GramPanchayat, providing voluntary support to UIP, JSY, RTS and public health and sanitation schemes againsta modest honorarium. She would also be trained to extend first-level health advice to the rural communityand supply drug-based treatment against basic ailments. The ASHA workers would therefore fill a vital gapbetween the healthcare system and the recipients of healthcare services, especially in the case of RCHdelivery from the AWCs and SHCs.
In Uttar Dinajpur district, the ASHA scheme has been introduced experimentally in Karandighi block,where 305 ASHA workers had been appointed uptil the end of 2007, covering the entire block at the rateof one ASHA worker per 1000 population. JSY had been introduced in 19 PHCs and the Ayushmatischeme was being implemented through Nivedita Seva Sadan in Raiganj, where 12 expecting mothers hadbenefited from the scheme till November 2007. Other RCH activities taken up under NRHM in UttarDinajpur district included the strengthening of the School Health and Routine Immunisation programmes,the introduction of Positive Deviance [PD] nutrition program, the enhancement of Family Welfare servicesincluding sterilisation services and training programmes for traditional midwives or dais, and the developmentof all-round 24/7 maternity services at certain selected First Referral Units [FRUs].
While NRHM is thus expected to make a major contribution towards ameliorating the reproductive healthsituation in Uttar Dinajpur district, potential pitfalls also need to be kept in mind. As seen during detailedanalysis of the regional health situation, rural healthcare in Uttar Dinajpur presently suffers from seriousinstitutional deficiencies in staffing and infrastructure, the combined impact of which is multiplied by rapidgrowth of the district population, putting unmanageable pressures on the district health system. A part ofthese deficiencies is inherited from the time when the Uttar Dinajpur region was a constituent of undividedWest Dinajpur district, comprising its most backward blocks. However even after the bifurcation of thepredecessor district in 1992, these difficulties have not been satisfactorily resolved, the strongest indicationof which is provided by the fact that the District Hospital [DH] at Raiganj and the Kaliaganj State GeneralHospital [SGH] and Islampur Subdivisional Hospital [SDH] still lack the essential infrastructure requiredfor hospitals at this level, leading to serious healthcare deprivation in Uttar Dinajpur. While the number ofSHCs and PHCs still falls far short of recommended population based norms, prolonged staffing shortagesat the level of Medical Officers, ANMs and SHC Health Assistants further impede the effective delivery ofrural health services. High fertility and high infant and maternal mortality in Uttar Dinajpur are also inevitableconsequences of these health delivery constraints.
The integrated RCH services to be delivered under NRHM essentially address two critical reproductivehealth problems faced in Uttar Dinajpur, namely high maternal mortality and high IMR. The best way toreduce the incidence of maternal deaths is to improve the institutionalisation of deliveries among thepoorest sections of rural society, for which JSY, RTS and the Ayushmati scheme have been specificallydesigned. Nutritional and immunisation services and the provision of critical neonatal care by SCNUs aimat the reduction of child mortality and infant deaths, particularly during the neonatal stage. All theseinterventions would logically be expected to bring good results in Uttar Dinajpur. However, twoimplementational problems still remain. Improved delivery of RCH services with the help of the schemeinterventions presupposes the existence of the requisite healthcare infrastructure, which is seriously lackingin Uttar Dinajpur, even at DH level. Since the number of PHCs and SHCs is also inadequate, rural residentshave to travel greater distances at high personal costs to access healthcare, and the vast internal distanceswithin Uttar Dinajpur put the DH referral facilities well beyond the physical reach of residents living in
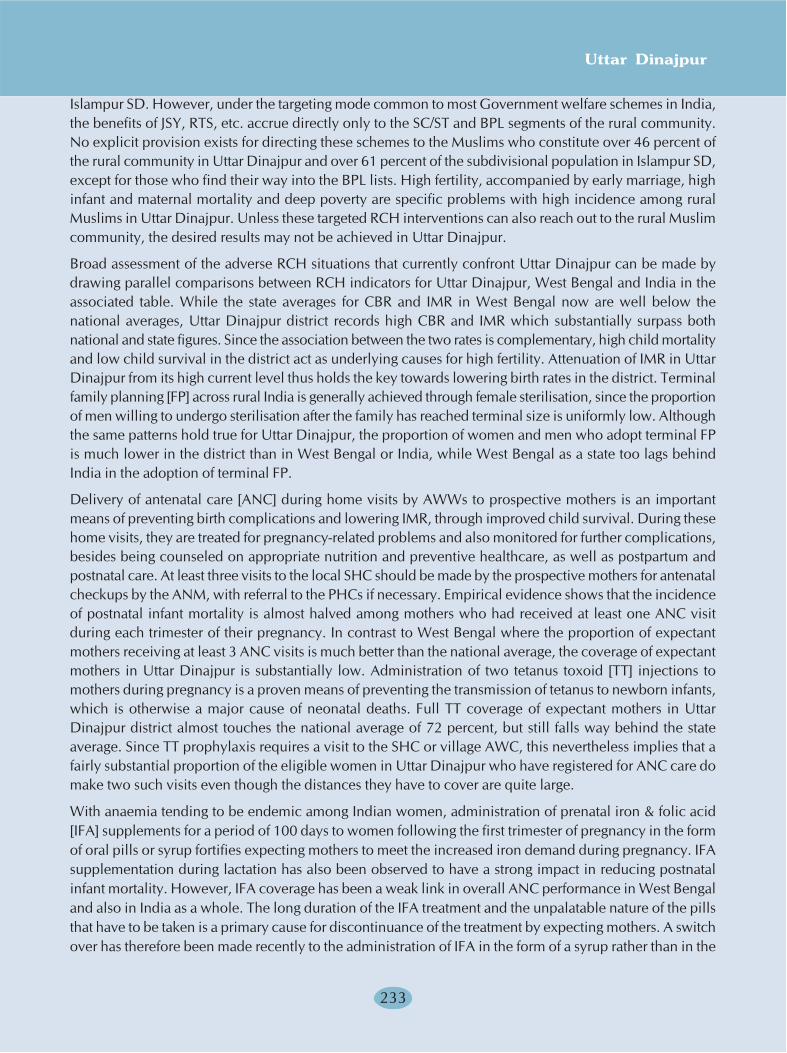
Uttar Dinajpur
233
Islampur SD. However, under the targeting mode common to most Government welfare schemes in India,the benefits of JSY, RTS, etc. accrue directly only to the SC/ST and BPL segments of the rural community.No explicit provision exists for directing these schemes to the Muslims who constitute over 46 percent ofthe rural community in Uttar Dinajpur and over 61 percent of the subdivisional population in Islampur SD,except for those who find their way into the BPL lists. High fertility, accompanied by early marriage, highinfant and maternal mortality and deep poverty are specific problems with high incidence among ruralMuslims in Uttar Dinajpur. Unless these targeted RCH interventions can also reach out to the rural Muslimcommunity, the desired results may not be achieved in Uttar Dinajpur.
Broad assessment of the adverse RCH situations that currently confront Uttar Dinajpur can be made bydrawing parallel comparisons between RCH indicators for Uttar Dinajpur, West Bengal and India in theassociated table. While the state averages for CBR and IMR in West Bengal now are well below thenational averages, Uttar Dinajpur district records high CBR and IMR which substantially surpass bothnational and state figures. Since the association between the two rates is complementary, high child mortalityand low child survival in the district act as underlying causes for high fertility. Attenuation of IMR in UttarDinajpur from its high current level thus holds the key towards lowering birth rates in the district. Terminalfamily planning [FP] across rural India is generally achieved through female sterilisation, since the proportionof men willing to undergo sterilisation after the family has reached terminal size is uniformly low. Althoughthe same patterns hold true for Uttar Dinajpur, the proportion of women and men who adopt terminal FPis much lower in the district than in West Bengal or India, while West Bengal as a state too lags behindIndia in the adoption of terminal FP.
Delivery of antenatal care [ANC] during home visits by AWWs to prospective mothers is an importantmeans of preventing birth complications and lowering IMR, through improved child survival. During thesehome visits, they are treated for pregnancy-related problems and also monitored for further complications,besides being counseled on appropriate nutrition and preventive healthcare, as well as postpartum andpostnatal care. At least three visits to the local SHC should be made by the prospective mothers for antenatalcheckups by the ANM, with referral to the PHCs if necessary. Empirical evidence shows that the incidenceof postnatal infant mortality is almost halved among mothers who had received at least one ANC visitduring each trimester of their pregnancy. In contrast to West Bengal where the proportion of expectantmothers receiving at least 3 ANC visits is much better than the national average, the coverage of expectantmothers in Uttar Dinajpur is substantially low. Administration of two tetanus toxoid [TT] injections tomothers during pregnancy is a proven means of preventing the transmission of tetanus to newborn infants,which is otherwise a major cause of neonatal deaths. Full TT coverage of expectant mothers in UttarDinajpur district almost touches the national average of 72 percent, but still falls way behind the stateaverage. Since TT prophylaxis requires a visit to the SHC or village AWC, this nevertheless implies that afairly substantial proportion of the eligible women in Uttar Dinajpur who have registered for ANC care domake two such visits even though the distances they have to cover are quite large.
With anaemia tending to be endemic among Indian women, administration of prenatal iron & folic acid[IFA] supplements for a period of 100 days to women following the first trimester of pregnancy in the formof oral pills or syrup fortifies expecting mothers to meet the increased iron demand during pregnancy. IFAsupplementation during lactation has also been observed to have a strong impact in reducing postnatalinfant mortality. However, IFA coverage has been a weak link in overall ANC performance in West Bengaland also in India as a whole. The long duration of the IFA treatment and the unpalatable nature of the pillsthat have to be taken is a primary cause for discontinuance of the treatment by expecting mothers. A switchover has therefore been made recently to the administration of IFA in the form of a syrup rather than in the
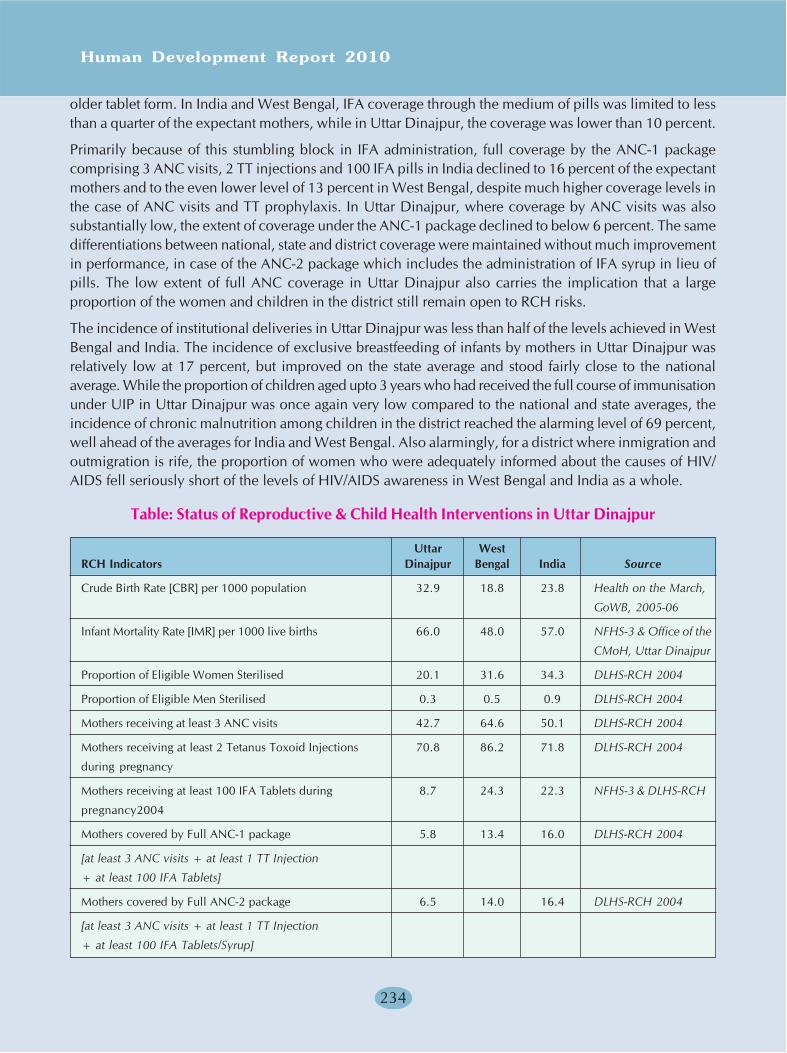
Human Development Report 2010
234
older tablet form. In India and West Bengal, IFA coverage through the medium of pills was limited to lessthan a quarter of the expectant mothers, while in Uttar Dinajpur, the coverage was lower than 10 percent.
Primarily because of this stumbling block in IFA administration, full coverage by the ANC-1 packagecomprising 3 ANC visits, 2 TT injections and 100 IFA pills in India declined to 16 percent of the expectantmothers and to the even lower level of 13 percent in West Bengal, despite much higher coverage levels inthe case of ANC visits and TT prophylaxis. In Uttar Dinajpur, where coverage by ANC visits was alsosubstantially low, the extent of coverage under the ANC-1 package declined to below 6 percent. The samedifferentiations between national, state and district coverage were maintained without much improvementin performance, in case of the ANC-2 package which includes the administration of IFA syrup in lieu ofpills. The low extent of full ANC coverage in Uttar Dinajpur also carries the implication that a largeproportion of the women and children in the district still remain open to RCH risks.
The incidence of institutional deliveries in Uttar Dinajpur was less than half of the levels achieved in WestBengal and India. The incidence of exclusive breastfeeding of infants by mothers in Uttar Dinajpur wasrelatively low at 17 percent, but improved on the state average and stood fairly close to the nationalaverage. While the proportion of children aged upto 3 years who had received the full course of immunisationunder UIP in Uttar Dinajpur was once again very low compared to the national and state averages, theincidence of chronic malnutrition among children in the district reached the alarming level of 69 percent,well ahead of the averages for India and West Bengal. Also alarmingly, for a district where inmigration andoutmigration is rife, the proportion of women who were adequately informed about the causes of HIV/AIDS fell seriously short of the levels of HIV/AIDS awareness in West Bengal and India as a whole.
Table: Status of Reproductive & Child Health Interventions in Uttar Dinajpur
Uttar WestRCH Indicators Dinajpur Bengal India Source
Crude Birth Rate [CBR] per 1000 population 32.9 18.8 23.8 Health on the March,
GoWB, 2005-06
Infant Mortality Rate [IMR] per 1000 live births 66.0 48.0 57.0 NFHS-3 & Office of the
CMoH, Uttar Dinajpur
Proportion of Eligible Women Sterilised 20.1 31.6 34.3 DLHS-RCH 2004
Proportion of Eligible Men Sterilised 0.3 0.5 0.9 DLHS-RCH 2004
Mothers receiving at least 3 ANC visits 42.7 64.6 50.1 DLHS-RCH 2004
Mothers receiving at least 2 Tetanus Toxoid Injections 70.8 86.2 71.8 DLHS-RCH 2004
during pregnancy
Mothers receiving at least 100 IFA Tablets during 8.7 24.3 22.3 NFHS-3 & DLHS-RCH
pregnancy2004
Mothers covered by Full ANC-1 package 5.8 13.4 16.0 DLHS-RCH 2004
[at least 3 ANC visits + at least 1 TT Injection
+ at least 100 IFA Tablets]
Mothers covered by Full ANC-2 package 6.5 14.0 16.4 DLHS-RCH 2004
[at least 3 ANC visits + at least 1 TT Injection
+ at least 100 IFA Tablets/Syrup]
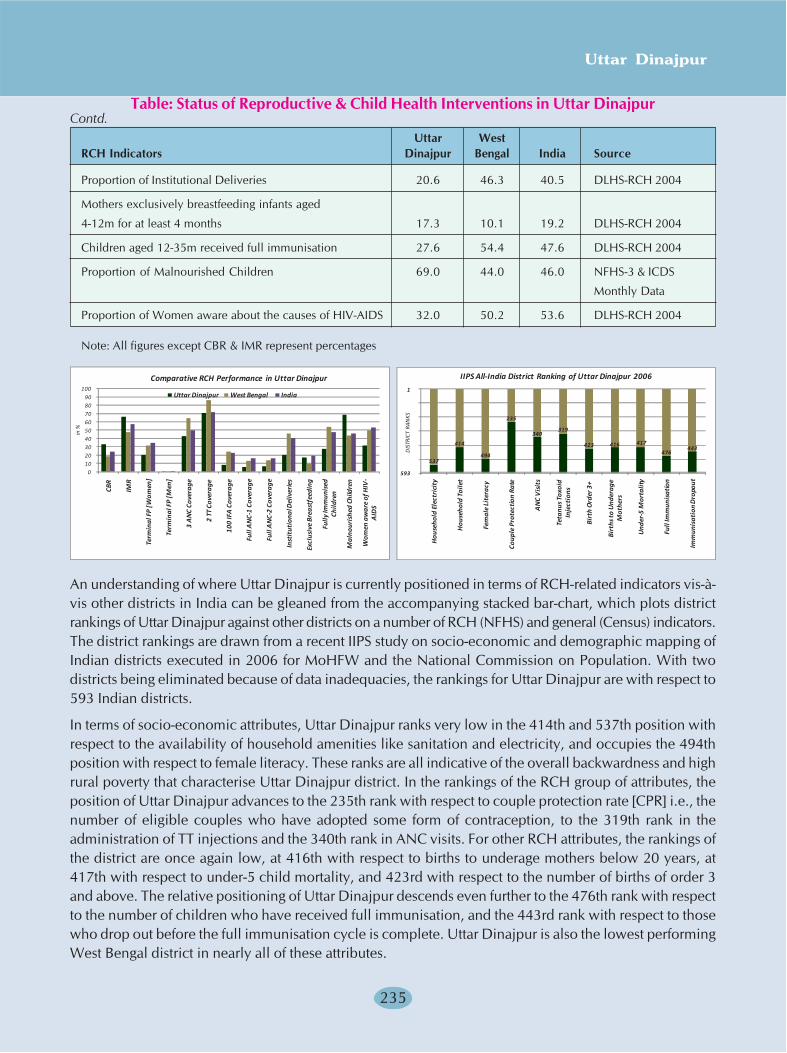
Uttar Dinajpur
235
Proportion of Institutional Deliveries 20.6 46.3 40.5 DLHS-RCH 2004
Mothers exclusively breastfeeding infants aged
4-12m for at least 4 months 17.3 10.1 19.2 DLHS-RCH 2004
Children aged 12-35m received full immunisation 27.6 54.4 47.6 DLHS-RCH 2004
Proportion of Malnourished Children 69.0 44.0 46.0 NFHS-3 & ICDS
Monthly Data
Proportion of Women aware about the causes of HIV-AIDS 32.0 50.2 53.6 DLHS-RCH 2004
Note: All figures except CBR & IMR represent percentages
An understanding of where Uttar Dinajpur is currently positioned in terms of RCH-related indicators vis-à-vis other districts in India can be gleaned from the accompanying stacked bar-chart, which plots districtrankings of Uttar Dinajpur against other districts on a number of RCH (NFHS) and general (Census) indicators.The district rankings are drawn from a recent IIPS study on socio-economic and demographic mapping ofIndian districts executed in 2006 for MoHFW and the National Commission on Population. With twodistricts being eliminated because of data inadequacies, the rankings for Uttar Dinajpur are with respect to593 Indian districts.
In terms of socio-economic attributes, Uttar Dinajpur ranks very low in the 414th and 537th position withrespect to the availability of household amenities like sanitation and electricity, and occupies the 494thposition with respect to female literacy. These ranks are all indicative of the overall backwardness and highrural poverty that characterise Uttar Dinajpur district. In the rankings of the RCH group of attributes, theposition of Uttar Dinajpur advances to the 235th rank with respect to couple protection rate [CPR] i.e., thenumber of eligible couples who have adopted some form of contraception, to the 319th rank in theadministration of TT injections and the 340th rank in ANC visits. For other RCH attributes, the rankings ofthe district are once again low, at 416th with respect to births to underage mothers below 20 years, at417th with respect to under-5 child mortality, and 423rd with respect to the number of births of order 3and above. The relative positioning of Uttar Dinajpur descends even further to the 476th rank with respectto the number of children who have received full immunisation, and the 443rd rank with respect to thosewho drop out before the full immunisation cycle is complete. Uttar Dinajpur is also the lowest performingWest Bengal district in nearly all of these attributes.
Table: Status of Reproductive & Child Health Interventions in Uttar Dinajpur
Uttar WestRCH Indicators Dinajpur Bengal India Source
0102030405060708090
100
CBR
IMR
Term
inal
FP
[Wom
en]
Term
inal
FP
[Men
]
3 A
NC
Cove
rage
2 TT
Cov
erag
e
100
IFA
Cov
erag
e
Full
AN
C-1
Cove
rage
Full
AN
C-2
Cove
rage
Inst
itut
iona
l Del
iver
ies
Excl
usiv
e Br
east
feed
ing
Fully
Imm
unis
ed
Child
ren
Mal
nour
ishe
d Ch
ildre
n
Wom
en a
war
e of
HIV
-A
IDS
Uttar Dinajpur West Bengal India
in %
Comparative RCH Performance in Uttar Dinajpur
537
414
494
235
340319
423 416 417
476443
-7
93
193
293
393
493
593
Hou
seho
ld E
lect
rici
ty
Hou
seho
ld T
oile
t
Fem
ale
Lite
racy
Coup
le P
rote
ctio
n Ra
te
AN
C V
isit
s
Teta
nus T
oxoi
d In
ject
ions
Birt
h O
rder
3+
Birt
hs to
Und
erag
e M
othe
rs
Und
er-5
Mor
talit
y
Full
Imm
unis
atio
n
Imm
unis
atio
n D
ropo
ut
IIPS All-India District Ranking of Uttar Dinajpur 2006
1
593
DIS
TRIC
T RA
NKS
Contd.
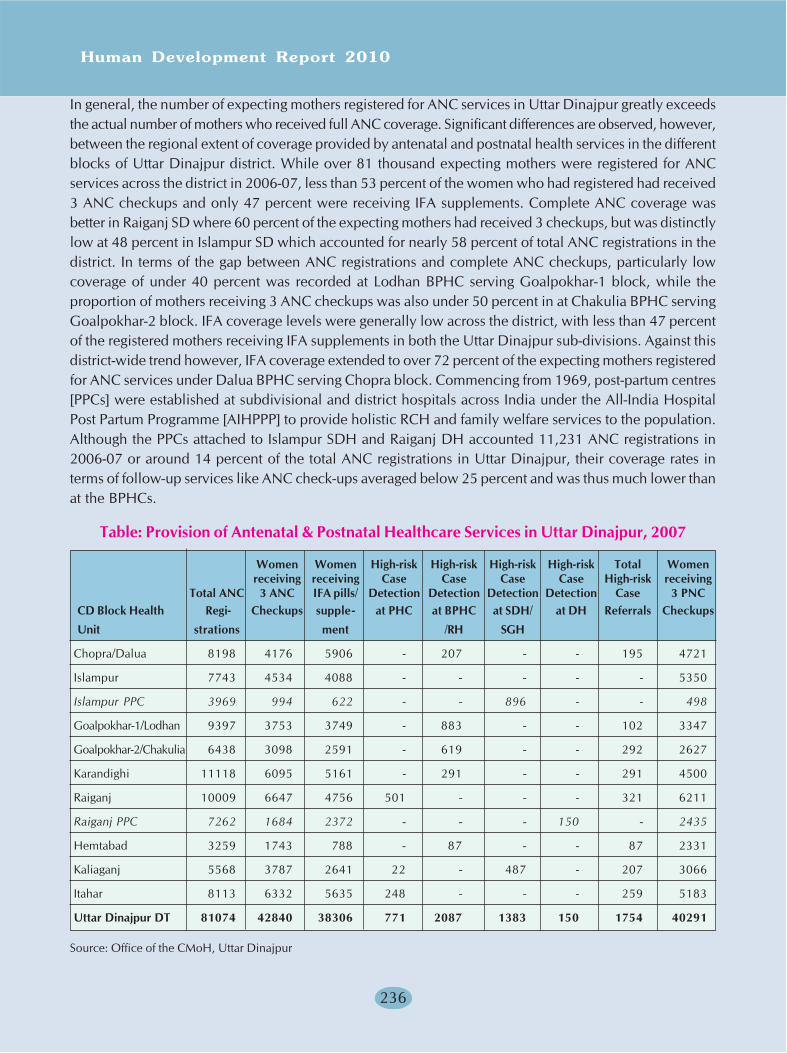
Human Development Report 2010
236
In general, the number of expecting mothers registered for ANC services in Uttar Dinajpur greatly exceedsthe actual number of mothers who received full ANC coverage. Significant differences are observed, however,between the regional extent of coverage provided by antenatal and postnatal health services in the differentblocks of Uttar Dinajpur district. While over 81 thousand expecting mothers were registered for ANCservices across the district in 2006-07, less than 53 percent of the women who had registered had received3 ANC checkups and only 47 percent were receiving IFA supplements. Complete ANC coverage wasbetter in Raiganj SD where 60 percent of the expecting mothers had received 3 checkups, but was distinctlylow at 48 percent in Islampur SD which accounted for nearly 58 percent of total ANC registrations in thedistrict. In terms of the gap between ANC registrations and complete ANC checkups, particularly lowcoverage of under 40 percent was recorded at Lodhan BPHC serving Goalpokhar-1 block, while theproportion of mothers receiving 3 ANC checkups was also under 50 percent in at Chakulia BPHC servingGoalpokhar-2 block. IFA coverage levels were generally low across the district, with less than 47 percentof the registered mothers receiving IFA supplements in both the Uttar Dinajpur sub-divisions. Against thisdistrict-wide trend however, IFA coverage extended to over 72 percent of the expecting mothers registeredfor ANC services under Dalua BPHC serving Chopra block. Commencing from 1969, post-partum centres[PPCs] were established at subdivisional and district hospitals across India under the All-India HospitalPost Partum Programme [AIHPPP] to provide holistic RCH and family welfare services to the population.Although the PPCs attached to Islampur SDH and Raiganj DH accounted 11,231 ANC registrations in2006-07 or around 14 percent of the total ANC registrations in Uttar Dinajpur, their coverage rates interms of follow-up services like ANC check-ups averaged below 25 percent and was thus much lower thanat the BPHCs.
Table: Provision of Antenatal & Postnatal Healthcare Services in Uttar Dinajpur, 2007
Women Women High-risk High-risk High-risk High-risk Total Womenreceiving receiving Case Case Case Case High-risk receiving
Total ANC 3 ANC IFA pills/ Detection Detection Detection Detection Case 3 PNCCD Block Health Regi- Checkups supple- at PHC at BPHC at SDH/ at DH Referrals Checkups
Unit strations ment /RH SGH
Chopra/Dalua 8198 4176 5906 - 207 - - 195 4721
Islampur 7743 4534 4088 - - - - - 5350
Islampur PPC 3969 994 622 - - 896 - - 498
Goalpokhar-1/Lodhan 9397 3753 3749 - 883 - - 102 3347
Goalpokhar-2/Chakulia 6438 3098 2591 - 619 - - 292 2627
Karandighi 11118 6095 5161 - 291 - - 291 4500
Raiganj 10009 6647 4756 501 - - - 321 6211
Raiganj PPC 7262 1684 2372 - - - 150 - 2435
Hemtabad 3259 1743 788 - 87 - - 87 2331
Kaliaganj 5568 3787 2641 22 - 487 - 207 3066
Itahar 8113 6332 5635 248 - - - 259 5183
Uttar Dinajpur DT 81074 42840 38306 771 2087 1383 150 1754 40291
Source: Office of the CMoH, Uttar Dinajpur
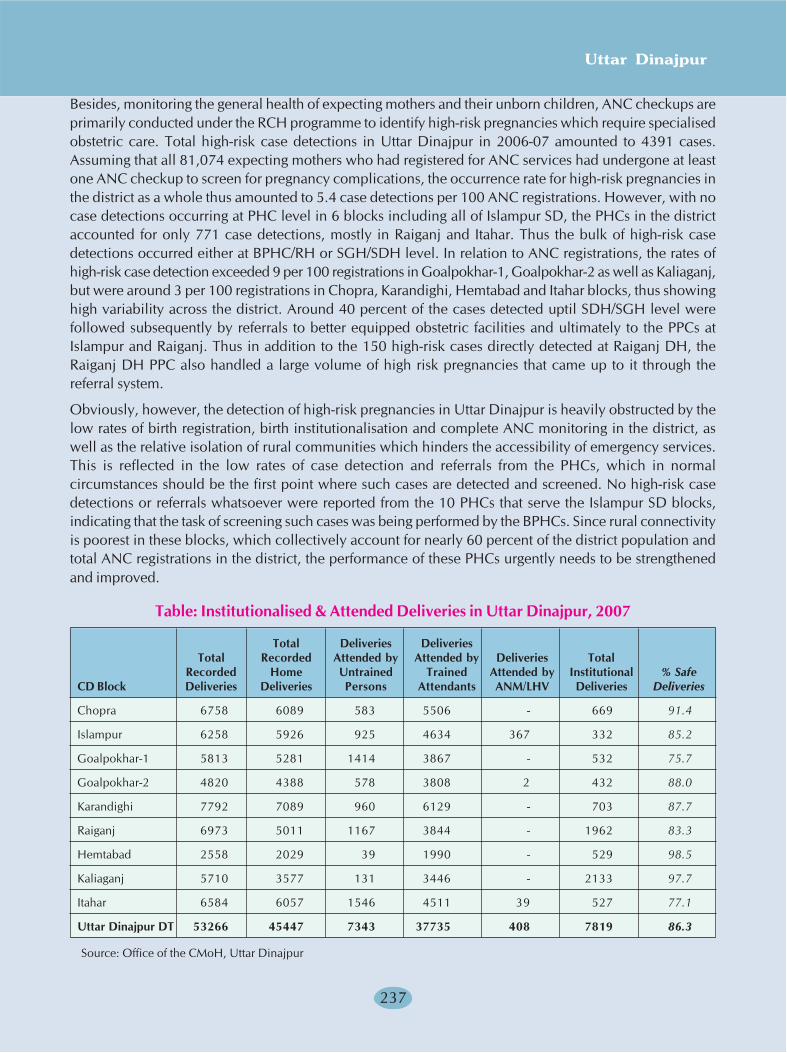
Uttar Dinajpur
237
Besides, monitoring the general health of expecting mothers and their unborn children, ANC checkups areprimarily conducted under the RCH programme to identify high-risk pregnancies which require specialisedobstetric care. Total high-risk case detections in Uttar Dinajpur in 2006-07 amounted to 4391 cases.Assuming that all 81,074 expecting mothers who had registered for ANC services had undergone at leastone ANC checkup to screen for pregnancy complications, the occurrence rate for high-risk pregnancies inthe district as a whole thus amounted to 5.4 case detections per 100 ANC registrations. However, with nocase detections occurring at PHC level in 6 blocks including all of Islampur SD, the PHCs in the districtaccounted for only 771 case detections, mostly in Raiganj and Itahar. Thus the bulk of high-risk casedetections occurred either at BPHC/RH or SGH/SDH level. In relation to ANC registrations, the rates ofhigh-risk case detection exceeded 9 per 100 registrations in Goalpokhar-1, Goalpokhar-2 as well as Kaliaganj,but were around 3 per 100 registrations in Chopra, Karandighi, Hemtabad and Itahar blocks, thus showinghigh variability across the district. Around 40 percent of the cases detected uptil SDH/SGH level werefollowed subsequently by referrals to better equipped obstetric facilities and ultimately to the PPCs atIslampur and Raiganj. Thus in addition to the 150 high-risk cases directly detected at Raiganj DH, theRaiganj DH PPC also handled a large volume of high risk pregnancies that came up to it through thereferral system.
Obviously, however, the detection of high-risk pregnancies in Uttar Dinajpur is heavily obstructed by thelow rates of birth registration, birth institutionalisation and complete ANC monitoring in the district, aswell as the relative isolation of rural communities which hinders the accessibility of emergency services.This is reflected in the low rates of case detection and referrals from the PHCs, which in normalcircumstances should be the first point where such cases are detected and screened. No high-risk casedetections or referrals whatsoever were reported from the 10 PHCs that serve the Islampur SD blocks,indicating that the task of screening such cases was being performed by the BPHCs. Since rural connectivityis poorest in these blocks, which collectively account for nearly 60 percent of the district population andtotal ANC registrations in the district, the performance of these PHCs urgently needs to be strengthenedand improved.
Table: Institutionalised & Attended Deliveries in Uttar Dinajpur, 2007
Total Deliveries DeliveriesTotal Recorded Attended by Attended by Deliveries Total
Recorded Home Untrained Trained Attended by Institutional % SafeCD Block Deliveries Deliveries Persons Attendants ANM/LHV Deliveries Deliveries
Chopra 6758 6089 583 5506 - 669 91.4
Islampur 6258 5926 925 4634 367 332 85.2
Goalpokhar-1 5813 5281 1414 3867 - 532 75.7
Goalpokhar-2 4820 4388 578 3808 2 432 88.0
Karandighi 7792 7089 960 6129 - 703 87.7
Raiganj 6973 5011 1167 3844 - 1962 83.3
Hemtabad 2558 2029 39 1990 - 529 98.5
Kaliaganj 5710 3577 131 3446 - 2133 97.7
Itahar 6584 6057 1546 4511 39 527 77.1
Uttar Dinajpur DT 53266 45447 7343 37735 408 7819 86.3
Source: Office of the CMoH, Uttar Dinajpur

Human Development Report 2010
238
0
1
2
3
4
5
6
7
8
9
Chop
ra
Isla
mpu
r
Goa
lpok
har-
1
Goa
lpok
har-
2
Kara
ndig
hi
Raig
anj
Hem
taba
d
Kalia
ganj
Itah
ar
Thou
sand
s Under Untrained supervision Attended by TBAs Institutional Deliveries
Recorded Deliveries in Uttar Dinajpur 2006-07
Safe Delivery Services, Maternal Mortality & Infant Mortality
In addition to existing infrastructural deficiencies within the healthcare system, other weaknesses in RCHservice delivery in Uttar Dinajpur stem from pervasive ignorance among rural segments of the populationabout RCH services provided through the public healthcare system as well as the adverse perceptions thatpersists among certain sections about poor investigative facilities, unsuitable timings, inadequate availabilityof drugs and indifferent attitudes among Government healthcare personnel. Emergency obstetric care isunavailable at primary health facilities, median distances from villages to properly equipped obstetrichospitals are very high in most rural regions of the district, and weak public transportation and the virtualabsence of ambulance services, make it extremely difficult for rural women to reach hospitals at criticaltimes for deliveries. All these factors have an important role in reducing the access of rural women to safedelivery services in the district.
While less than 15 percent of the deliveries recorded in Uttar Dinajpur in 2007 took place at publichealthcare facilities, nearly 38 thousand non-institutional deliveries were recorded under the supervisionof trained traditional birth attendants [TBAs], raising safe delivery coverage to over 86 percent of the officiallyrecorded deliveries in the district. From such official figures, the extent of safe delivery coverage in thedistrict would seem fairly adequate. However, since only Raiganj, Kaliaganj and Hemtabad accounted forhigh levels of institutionalisation exceeding 20 percent of recorded deliveries while the other Uttar Dinajpurblocks recorded institutionalisation levels well below 10 percent, it is seen that safe delivery services in thedistrict primarily rest on the presence of TBAs. Despite the fact that Medical Officers [MOs] and ANMs areposted to all PHCs in Uttar Dinajpur, their role in extending safe delivery services is close to negligible,except perhaps in Islampur, because the MOs are unavailable around the clock while the ANMs aregenerally untrained in essential obstetric care. In these circumstances, the role of the public healthcaresystem in promoting safe deliveries in the district is still far from satisfactory.
Gross under-reporting of non-institutional deliveries is a major problem which continues to persist stronglyin Uttar Dinajpur. The scale of this can be gauged from the evidence that only 53,266 deliveries wereofficially recorded in the district in 2007 against 81,074 ANC registrations in the same year. The DistrictHealth Plan for 2007-08 thus candidly admits that the true number of births occurring annually in thedistrict would exceed 84 thousand on the basis of population projections, indicating the seriousness of theproblem. Underreporting of births also vitiates the targeting of several other RCH programmes includingimmunisation, nutrition and maternity health services, by indicating misleading orders of coverage for thedistrict. Since after applying a correction based on fertility rates from Census figures, the estimated numberof deliveries in Uttar Dinajpur in 2006-07 rises to 81,526, while safe delivery coverage declines to around
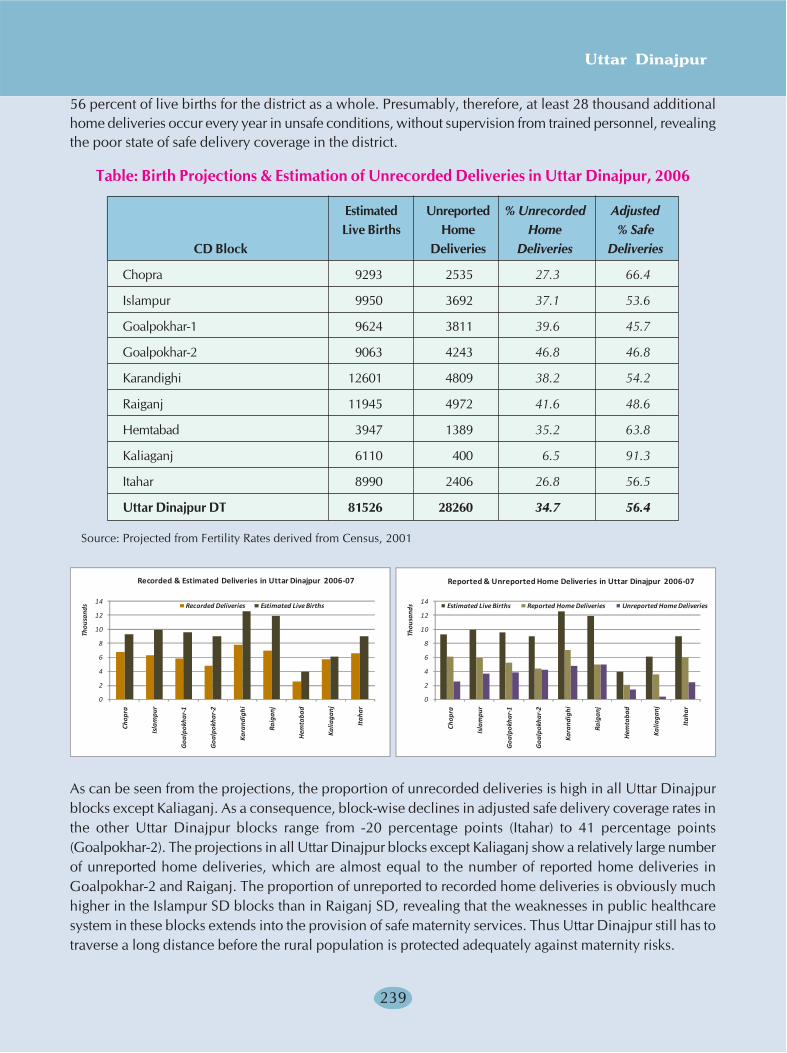
Uttar Dinajpur
239
56 percent of live births for the district as a whole. Presumably, therefore, at least 28 thousand additionalhome deliveries occur every year in unsafe conditions, without supervision from trained personnel, revealingthe poor state of safe delivery coverage in the district.
Table: Birth Projections & Estimation of Unrecorded Deliveries in Uttar Dinajpur, 2006
Estimated Unreported % Unrecorded AdjustedLive Births Home Home % Safe
CD Block Deliveries Deliveries Deliveries
Chopra 9293 2535 27.3 66.4
Islampur 9950 3692 37.1 53.6
Goalpokhar-1 9624 3811 39.6 45.7
Goalpokhar-2 9063 4243 46.8 46.8
Karandighi 12601 4809 38.2 54.2
Raiganj 11945 4972 41.6 48.6
Hemtabad 3947 1389 35.2 63.8
Kaliaganj 6110 400 6.5 91.3
Itahar 8990 2406 26.8 56.5
Uttar Dinajpur DT 81526 28260 34.7 56.4
Source: Projected from Fertility Rates derived from Census, 2001
As can be seen from the projections, the proportion of unrecorded deliveries is high in all Uttar Dinajpurblocks except Kaliaganj. As a consequence, block-wise declines in adjusted safe delivery coverage rates inthe other Uttar Dinajpur blocks range from -20 percentage points (Itahar) to 41 percentage points(Goalpokhar-2). The projections in all Uttar Dinajpur blocks except Kaliaganj show a relatively large numberof unreported home deliveries, which are almost equal to the number of reported home deliveries inGoalpokhar-2 and Raiganj. The proportion of unreported to recorded home deliveries is obviously muchhigher in the Islampur SD blocks than in Raiganj SD, revealing that the weaknesses in public healthcaresystem in these blocks extends into the provision of safe maternity services. Thus Uttar Dinajpur still has totraverse a long distance before the rural population is protected adequately against maternity risks.
0
2
4
6
8
10
12
14
Chop
ra
Isla
mpu
r
Goa
lpok
har-
1
Goa
lpok
har-
2
Kara
ndig
hi
Raig
anj
Hem
taba
d
Kalia
ganj
Itah
ar
Thou
sand
s Recorded Deliveries Estimated Live Births
Recorded & Estimated Deliveries in Uttar Dinajpur 2006-07
0
2
4
6
8
10
12
14
Chop
ra
Isla
mpu
r
Goa
lpok
har-
1
Goa
lpok
har-
2
Kara
ndig
hi
Raig
anj
Hem
taba
d
Kalia
ganj
Itah
ar
Thou
sand
s Estimated Live Births Reported Home Deliveries Unreported Home Deliveries
Reported & Unreported Home Deliveries in Uttar Dinajpur 2006-07
Human Development Report 2010
240
Besides, other inducing factors such as low literacy and social and economic backwardness, low accesswomen living in the rural areas of Uttar Dinajpur to RCH, safe delivery and general healthcare services tiesin with the prevalence of high infant mortality rates [IMRs] and maternal mortality rates [MMRs] in thedistrict. While accurate district and subdistrict level estimates of MMR are difficult to come by, IIPS sourcesbased on birth history data from the RCH survey estimate IMR in Uttar Dinajpur district at 68 per 1000 livebirths, which is much higher than the corresponding IMRs of 48 for West Bengal and 57 for India as awhole. Clearly, the national goal of reducing IMR to less than 30 per 1000 live births and MMR from itscurrent level of 301 per 100,000 live births in India and 194 in West Bengal to below 100 per 100,000 livebirths by the year 2010, requires heightened focus on improving RCH and safe delivery services in UttarDinajpur, which is one of the poorest performing districts in the country in this respect.
Official records collected from public maternity facilities in Uttar Dinajpur report the occurrence of 103obstetric deaths during the year 2006-07. When evaluated against the 53,266 live births recorded in thedistrict during the same year, the rough estimate of MMR in Uttar Dinajpur from official data sourceswould be around 193 per 100,000 lie births, and would probably be much higher if account was alsotaken of unreported live births and maternal deaths in the district. While 40 percent of the recorded maternaldeaths occurred during the term of pregnancy, 30 percent occurred during delivery and another 30 percentduring the postpartum period. The overwhelming majority of antepartum obstetric deaths took place at theRaiganj and Islampur PPCs, in contrast to which the death record at the BPHCs was low, showing that thetwo PPC facilities were being widely used for referral of cases where pregnancy related complications hadassumed life-threatening proportions. However, since the screening of expecting mothers through completeANC checkups in the district suffers from serious limitations, the gravity of the problem of antenatalcomplications leading to maternal deaths is probably greater than these figures would suggest. Nearly 60percent of the recorded maternal deaths in the district occur during and after delivery. Once again, theincidence of maternal deaths during unattended and unreported home deliveries is not adequately reflectedin these official figures. While with a better healthcare network and better screening rates, the Raiganj SDblocks account for a majority of prenatal and postpartum maternal deaths, the lower reported incidence inthe Islampur SD blocks probably masks much higher incidence of unreported maternal deaths in ruralareas within these blocks, where fertility is very high, communication is difficult and existing maternityfacilities are rudimentary at best. Posing a notable contrast to the rates of institutional deliveries and othermaternity services which are largely accessed at the PPCs, the remarkably high incidence of medicaltermination of pregnancy [MTP] distributed across most blocks of Uttar Dinajpur appears to indicate thatmaternal care services at most BPHCs are being availed as a last resort for contraception, especially in theIslampur SD blocks, although at great detriment to women's health situations in Uttar Dinajpur.
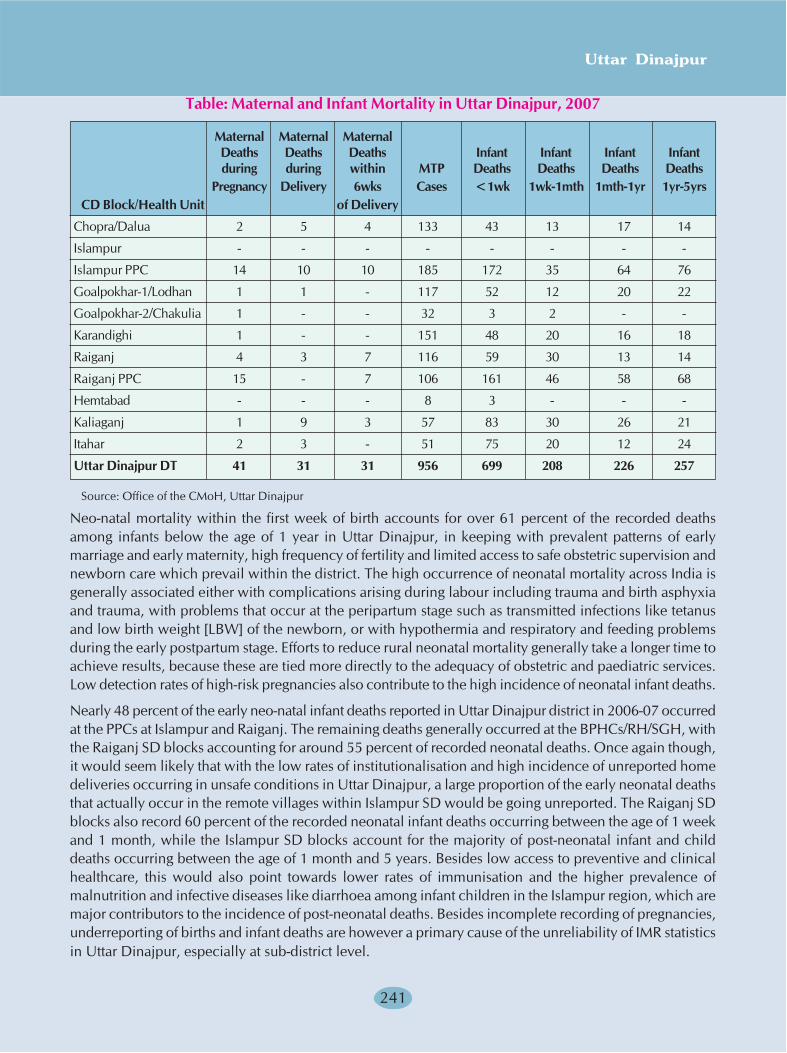
Uttar Dinajpur
241
Table: Maternal and Infant Mortality in Uttar Dinajpur, 2007
Maternal Maternal MaternalDeaths Deaths Deaths Infant Infant Infant Infantduring during within MTP Deaths Deaths Deaths Deaths
Pregnancy Delivery 6wks Cases <1wk 1wk-1mth 1mth-1yr 1yr-5yrsCD Block/Health Unit of Delivery
Chopra/Dalua 2 5 4 133 43 13 17 14
Islampur - - - - - - - -
Islampur PPC 14 10 10 185 172 35 64 76
Goalpokhar-1/Lodhan 1 1 - 117 52 12 20 22
Goalpokhar-2/Chakulia 1 - - 32 3 2 - -
Karandighi 1 - - 151 48 20 16 18
Raiganj 4 3 7 116 59 30 13 14
Raiganj PPC 15 - 7 106 161 46 58 68
Hemtabad - - - 8 3 - - -
Kaliaganj 1 9 3 57 83 30 26 21
Itahar 2 3 - 51 75 20 12 24
Uttar Dinajpur DT 41 31 31 956 699 208 226 257
Source: Office of the CMoH, Uttar Dinajpur
Neo-natal mortality within the first week of birth accounts for over 61 percent of the recorded deathsamong infants below the age of 1 year in Uttar Dinajpur, in keeping with prevalent patterns of earlymarriage and early maternity, high frequency of fertility and limited access to safe obstetric supervision andnewborn care which prevail within the district. The high occurrence of neonatal mortality across India isgenerally associated either with complications arising during labour including trauma and birth asphyxiaand trauma, with problems that occur at the peripartum stage such as transmitted infections like tetanusand low birth weight [LBW] of the newborn, or with hypothermia and respiratory and feeding problemsduring the early postpartum stage. Efforts to reduce rural neonatal mortality generally take a longer time toachieve results, because these are tied more directly to the adequacy of obstetric and paediatric services.Low detection rates of high-risk pregnancies also contribute to the high incidence of neonatal infant deaths.
Nearly 48 percent of the early neo-natal infant deaths reported in Uttar Dinajpur district in 2006-07 occurredat the PPCs at Islampur and Raiganj. The remaining deaths generally occurred at the BPHCs/RH/SGH, withthe Raiganj SD blocks accounting for around 55 percent of recorded neonatal deaths. Once again though,it would seem likely that with the low rates of institutionalisation and high incidence of unreported homedeliveries occurring in unsafe conditions in Uttar Dinajpur, a large proportion of the early neonatal deathsthat actually occur in the remote villages within Islampur SD would be going unreported. The Raiganj SDblocks also record 60 percent of the recorded neonatal infant deaths occurring between the age of 1 weekand 1 month, while the Islampur SD blocks account for the majority of post-neonatal infant and childdeaths occurring between the age of 1 month and 5 years. Besides low access to preventive and clinicalhealthcare, this would also point towards lower rates of immunisation and the higher prevalence ofmalnutrition and infective diseases like diarrhoea among infant children in the Islampur region, which aremajor contributors to the incidence of post-neonatal deaths. Besides incomplete recording of pregnancies,underreporting of births and infant deaths are however a primary cause of the unreliability of IMR statisticsin Uttar Dinajpur, especially at sub-district level.
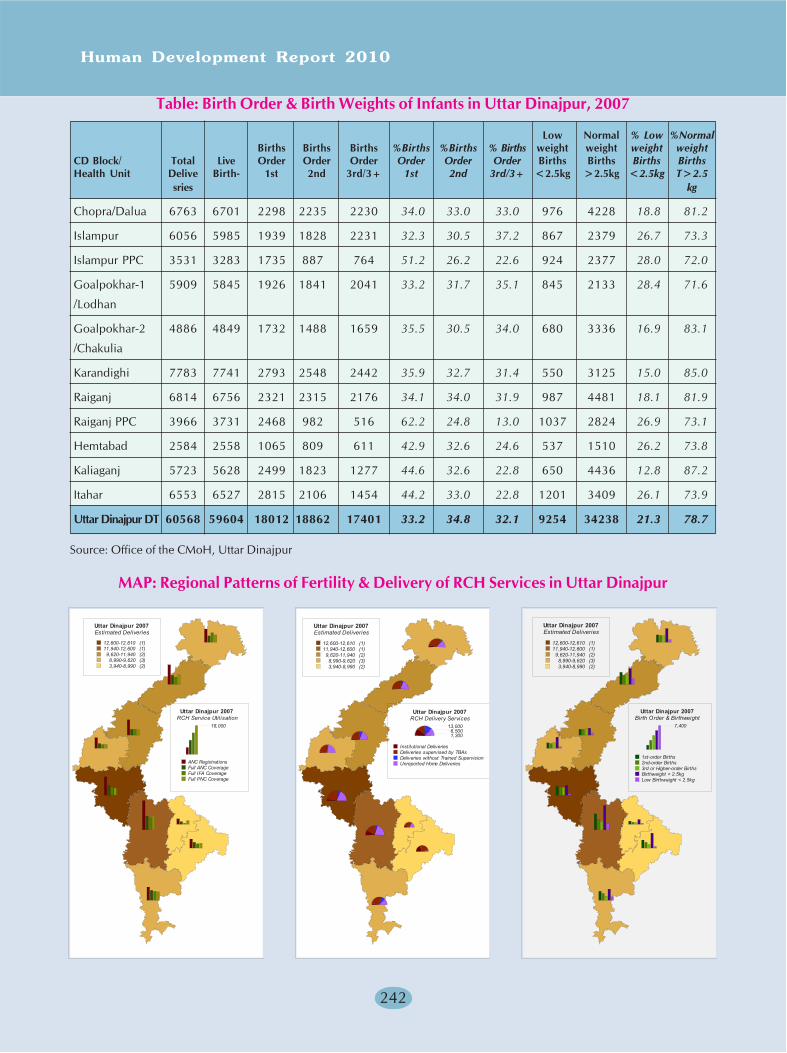
Human Development Report 2010
242
Table: Birth Order & Birth Weights of Infants in Uttar Dinajpur, 2007
Low Normal % Low %NormalBirths Births Births %Births %Births % Births weight weight weight weight
CD Block/ Total Live Order Order Order Order Order Order Births Births Births BirthsHealth Unit Delive Birth- 1st 2nd 3rd/3+ 1st 2nd 3rd/3+ <2.5kg >2.5kg <2.5kg T>2.5
sries kg
Chopra/Dalua 6763 6701 2298 2235 2230 34.0 33.0 33.0 976 4228 18.8 81.2
Islampur 6056 5985 1939 1828 2231 32.3 30.5 37.2 867 2379 26.7 73.3
Islampur PPC 3531 3283 1735 887 764 51.2 26.2 22.6 924 2377 28.0 72.0
Goalpokhar-1 5909 5845 1926 1841 2041 33.2 31.7 35.1 845 2133 28.4 71.6
/Lodhan
Goalpokhar-2 4886 4849 1732 1488 1659 35.5 30.5 34.0 680 3336 16.9 83.1
/Chakulia
Karandighi 7783 7741 2793 2548 2442 35.9 32.7 31.4 550 3125 15.0 85.0
Raiganj 6814 6756 2321 2315 2176 34.1 34.0 31.9 987 4481 18.1 81.9
Raiganj PPC 3966 3731 2468 982 516 62.2 24.8 13.0 1037 2824 26.9 73.1
Hemtabad 2584 2558 1065 809 611 42.9 32.6 24.6 537 1510 26.2 73.8
Kaliaganj 5723 5628 2499 1823 1277 44.6 32.6 22.8 650 4436 12.8 87.2
Itahar 6553 6527 2815 2106 1454 44.2 33.0 22.8 1201 3409 26.1 73.9
Uttar Dinajpur DT 60568 59604 18012 18862 17401 33.2 34.8 32.1 9254 34238 21.3 78.7
Source: Office of the CMoH, Uttar Dinajpur
MAP: Regional Patterns of Fertility & Delivery of RCH Services in Uttar Dinajpur
Uttar Dinajpur 2007Estimated Deliveries
12,600-12,610 (1)11,940-12,600 (1)9,620-11,940 (2)8,990-9,620 (3)3,940-8,990 (2)
Uttar Dinajpur 2007RCH Service Utilisation
18,000
ANC RegistrationsFull ANC CoverageFull IFA CoverageFull PNC Coverage
Uttar Dinajpur 2007Estimated Deliveries
12,600-12,610 (1)11,940-12,600 (1)9,620-11,940 (2)
8,990-9,620 (3)3,940-8,990 (2)
Uttar Dinajpur 2007RCH Delivery Services
13,0006,5001,300
Institutional DeliveriesDeliveries supervised by TBAsDeliveries without Trained SupervisionUnreported Home Deliveries
Uttar Dinajpur 2007Estimated Deliveries
12,600-12,610 (1)11,940-12,600 (1)
9,620-11,940 (2)8,990-9,620 (3)3,940-8,990 (2)
Uttar Dinajpur 2007Birth Order & Birthweight
7,400
1st-order Births2nd-order Births3rd or Higher-order BirthsBirthweight > 2.5kgLow Birthweight < 2.5kg

Uttar Dinajpur
243
While early marriage and early fertility continue to be a prominent rural characteristic in Uttar Dinajpurdistrict, the lack of access to modern contraception and RCH services are an additional reason for highfrequency of pregnancies as well as high-order births. Close to a third of the total live births recorded in thedistrict thus represented births of order 3 or even higher, reflecting large family-sizes. High-order birthswere predominant particularly in Islampur SD, where at least 30 percent of the births reported from theBPHCs and Karandighi RH and 37 percent of the births recorded at Islampur SDH represented 3rd orhigher-order births. Under Raiganj SD in contrast, only Raiganj recorded high-order births of similarly highfrequency. High-order births are generally also associated with the incidence of low birthweight [LBW]and with the subsequent frequency of neonatal and post-neonatal mortality among infants. Since the incidenceof LBW births also closely reflects the state of health of mothers, high LBW rates exceeding 26 percent inIslampur, Goalpokhar-1, Raiganj, Hemtabad and Itahar are indicative of the wide persistence of anaemiaand low nutrition levels among women, which make early marriage and early pregnancy a major healthrisk. Since the provision of ANC checkups and IFA diet supplements during pregnancy under the RCHprogramme is principally meant to offset such health-risks, this offers further evidence of the limited impactof RCH services in improving maternal & child health in many parts of rural Uttar Dinajpur. Tragically, italso becomes apparent that high infant and maternal mortality in the district is largely avoidable, and couldhave been lessened considerably if better maternal & child health standards had been maintained.
The major gender healthcare problems associated with the current maternal & child health situation inUttar Dinajpur become abundantly clear from the accompanying regional maps. First of all, ANC registrationis highly uneven across the district, leading to substantial under registration and subsequent underreportingof births in the populous blocks of Islampur SD. Secondly, while one-off services like tetanus toxoidinoculations are better delivered, the actual coverage provided by ANC and PNC services and IFAsupplementation which need to be sustained over a period of time is highly inadequate compared to thenumber of ANC registrations, reducing the positive impact of the RCH programme. RCH performanceimproves in relative terms in Hemtabad, Kaliaganj and Itahar, but poses a major problem in the rest of theUttar Dinajpur blocks. Excepting Kaliaganj block, the estimated incidence of unreported home deliveries ishigh throughout the district, leading in turn to under targeting of essential RCH services. The rate ofinstitutionalisation of deliveries is extremely low, particularly in the Islampur SD blocks and Itahar, so thatthe onus of providing safe delivery services is largely borne by TBAs. Even so, close to half the recordedand unreported deliveries in most blocks of Uttar Dinajpur take place without any form of qualifiedsupervision, leading to the heightening of obstetric and neonatal mortality. Neonatal and post-natal infantmortality risks are compounded by the relatively high incidence of LBW and high-order births throughseveral blocks of Uttar Dinajpur. Throughout the Islampur SD blocks, the incidence of births of third andhigher order is nearly as high as the incidence of 1st and 2nd order births, and in fact exceeds the latter inthe Muslim-dominated blocks of Islampur, Goalpokhar-1 and Goalpokhar-2, showing that the persistenceof high fertility and low child survival in these blocks is directly related to poorer RCH coverage.
ICDS Coverage in Uttar Dinajpur
As stated earlier, the ICDS programme implemented by the Women & Child Development Department ofMHRD is designed to offer holistic healthcare, nutritional and child development services to three keytarget sections within the rural population, namely preschool children, expecting and nursing mothers andadolescent girls. Since its inception, the targeting of ICDS has been primarily focused towards backwardareas with a high concentration of socially backward sections such as SCs and STs. While more than halfof the 1477 inhabited villages in Uttar Dinajpur are currently classified as backward, three-fourths of these
Human Development Report 2010
244
are located in the five Islampur SD blocks, and are concentrated particularly in Goalpokhar-1, Goalpokhar-2 and Karandighi blocks. While the Islampur SD blocks also account for over 80 percent of the functionalAWCs in Uttar Dinajpur, with over 2 lakh eligible preschool-age children and nearly 0.9 lakh eligiblepregnant and nursing mothers in 2006, current coverage under the ICDS programme only extended to 45percent of the eligible children and one-third of the eligible women in Islampur SD. In Chopra block, ICDSservices had been extended to less than 30 percent of the eligible mothers and children, while in Goalpokhar-2, they only covered around 14 percent of the eligible children and less than 8 percent of the eligiblewomen. Posing a sharp contrast, in the Raiganj SD blocks which collectively accounted for one-fourth ofthe backward villages in Uttar Dinajpur, ICDS coverage had been extended to 62 percent of the eligiblechildren and 69 percent of the eligible mothers, further compounding existing healthcare disparities betweenthe two Uttar Dinajpur subdivisions. Thus the best levels of ICDS coverage were found under Raiganj SD,extending to 72 percent of the eligible children in Kaliaganj block and 75 percent of the eligible mothers inRaiganj block, primarily because the size of the eligible population in the Raiganj SD blocks was muchsmaller than in Islampur SD.
Two other programmes currently being implemented under ICDS are the Kishori Shakti Yojana [KSY]targeted towards training and educating rural adolescent girls to improve their general health awarenessand offset early marriage and early motherhood, and the Positive Deviance [PD] nutrition programme,which seeks to improve the nutritional status of rural children by wider propagation of the best localnutritional practices that have been evolved by certain progressive households within the local community.However, as can be seen from the table, the coverage under KSY and PD programmes is still too lowcompared to the size of the target population in the district, to yield tangible dividends in the form ofsubstantive improvement in the maternal and child health situations. Blockwise coverage under theseprogrammes is still uneven, with the PD programme being primarily concentrated in the Raiganj and Itaharblocks, while KSY largely overlooks Hemtabad and Kaliaganj blocks.
Till the implementation of the 2006 order of the Supreme Court on the universalisation of ICDS across thecountry, expansion of ICDS in Uttar Dinajpur had been extremely slow despite the high extent of povertyand nutritional and MCH deprivation in the district, leaving large segments of the rural population unservedby ICDS services. Subsequently, with the addition of 750 new AWCs in just one year between 2006-07 incompliance with the Supreme Court directive, the total number of AWCs in Uttar Dinajpur has now risento 2334 centres. Rapid expansion of ICDS through the establishment of a large number of new AWCswithin a compressed span of time has obviously placed enormous pressure on the physical resourcesavailable to the ICDS system. Only 13 percent of the 1456 AWCs in existence in 2006-07 functioned fromtheir own built-up premises while the overwhelming majority functioned from open sheds. Hemtabad andKaliaganj were the only blocks where all AWCs functioned from built-up premises, with the shortfall inAWC buildings being made up through the use of rented premises. Since the AWCs in Islampur SD mainlyfunctioned from temporary structures, adequate provision of ICDS services was difficult. Only 23 percentof the AWCs in the district had access to proper drinking water facilities, the overwhelming majority ofthese being located in Islampur block. Sanitation coverage at the AWCs was close to negligible at just over2 percent, confined only to Kaliaganj and Karandighi blocks. Without adequate levels of funding for buildingICDS infrastructure, it is therefore unlikely that the ICDS programme in Uttar Dinajpur can achieve thesame results as it has in other advanced districts. Thus the universalisation of ICDS in Uttar Dinajpur willnot have the intended impact, without equivalent funding and resource commitment by MHRD.Paradoxically, within its given demographic and socioeconomic contexts, Uttar Dinajpur has the greatestneed of ICDS services which are probably served by the weakest ICDS infrastructure in West Bengal.
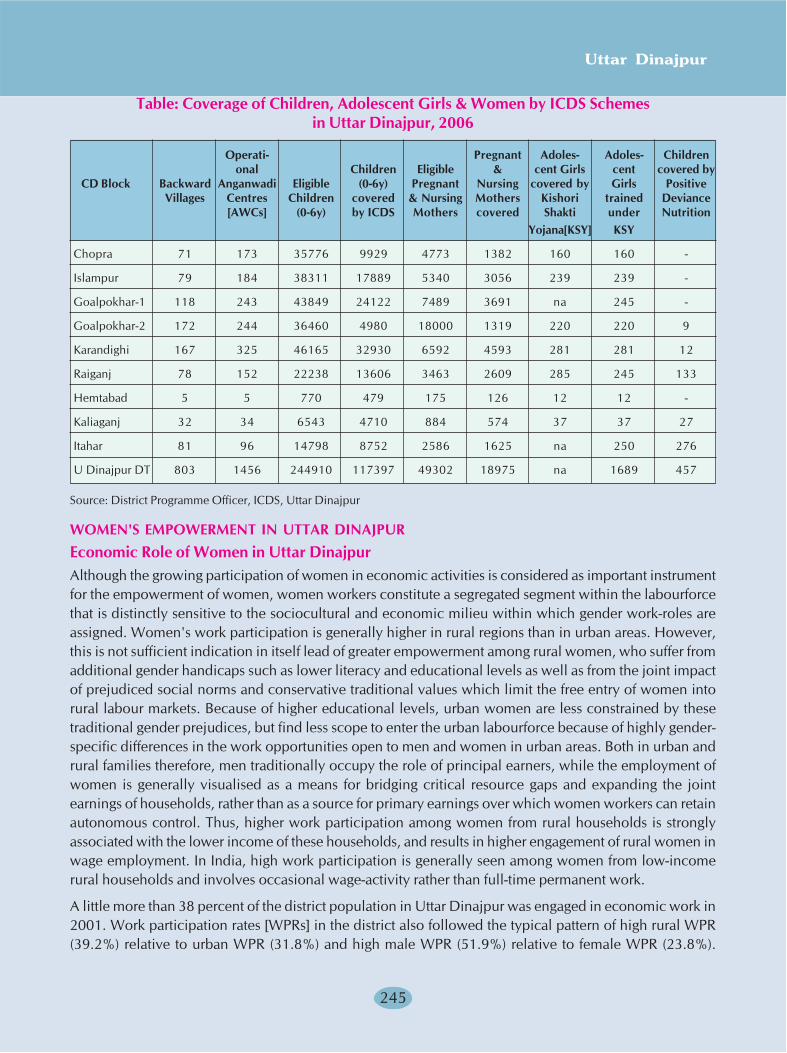
Uttar Dinajpur
245
Table: Coverage of Children, Adolescent Girls & Women by ICDS Schemesin Uttar Dinajpur, 2006
Operati- Pregnant Adoles- Adoles- Childrenonal Children Eligible & cent Girls cent covered by
CD Block Backward Anganwadi Eligible (0-6y) Pregnant Nursing covered by Girls PositiveVillages Centres Children covered & Nursing Mothers Kishori trained Deviance
[AWCs] (0-6y) by ICDS Mothers covered Shakti under NutritionYojana[KSY] KSY
Chopra 71 173 35776 9929 4773 1382 160 160 -
Islampur 79 184 38311 17889 5340 3056 239 239 -
Goalpokhar-1 118 243 43849 24122 7489 3691 na 245 -
Goalpokhar-2 172 244 36460 4980 18000 1319 220 220 9
Karandighi 167 325 46165 32930 6592 4593 281 281 12
Raiganj 78 152 22238 13606 3463 2609 285 245 133
Hemtabad 5 5 770 479 175 126 12 12 -
Kaliaganj 32 34 6543 4710 884 574 37 37 27
Itahar 81 96 14798 8752 2586 1625 na 250 276
U Dinajpur DT 803 1456 244910 117397 49302 18975 na 1689 457
Source: District Programme Officer, ICDS, Uttar Dinajpur
WOMEN'S EMPOWERMENT IN UTTAR DINAJPUREconomic Role of Women in Uttar DinajpurAlthough the growing participation of women in economic activities is considered as important instrumentfor the empowerment of women, women workers constitute a segregated segment within the labourforcethat is distinctly sensitive to the sociocultural and economic milieu within which gender work-roles areassigned. Women's work participation is generally higher in rural regions than in urban areas. However,this is not sufficient indication in itself lead of greater empowerment among rural women, who suffer fromadditional gender handicaps such as lower literacy and educational levels as well as from the joint impactof prejudiced social norms and conservative traditional values which limit the free entry of women intorural labour markets. Because of higher educational levels, urban women are less constrained by thesetraditional gender prejudices, but find less scope to enter the urban labourforce because of highly gender-specific differences in the work opportunities open to men and women in urban areas. Both in urban andrural families therefore, men traditionally occupy the role of principal earners, while the employment ofwomen is generally visualised as a means for bridging critical resource gaps and expanding the jointearnings of households, rather than as a source for primary earnings over which women workers can retainautonomous control. Thus, higher work participation among women from rural households is stronglyassociated with the lower income of these households, and results in higher engagement of rural women inwage employment. In India, high work participation is generally seen among women from low-incomerural households and involves occasional wage-activity rather than full-time permanent work.
A little more than 38 percent of the district population in Uttar Dinajpur was engaged in economic work in2001. Work participation rates [WPRs] in the district also followed the typical pattern of high rural WPR(39.2%) relative to urban WPR (31.8%) and high male WPR (51.9%) relative to female WPR (23.8%).

Human Development Report 2010
246
Access to economic work opportunities vary considerably between the different blocks of the district.However, work participation for both male and female workers was higher in the Raiganj SD blocks thanin the Islampur blocks, primarily on the strength of greater opportunities for women to engage in economicactivity. Female WPRs invariably exceeded 25 percent in throughout Raiganj SD, touching a high of nearly37 percent in Itahar block, but were well below 17 percent in the Islampur SD blocks with the exceptionof Goalpokhar-1 and Karandighi. Thus with just over a third of the district population, the rural and urbanareas in Raiganj SD collectively accounted for 40 percent of the district workforce and nearly 47 percent ofthe female workforce in Uttar Dinajpur.
Representing the most populous region in the district, Raiganj municipality and its rural periphery heldover a fifth of the working population in the district and just under 20 percent of the female workforce in2001. Itahar and Goalpokhar-1 blocks, each with around 10 percent of the district population, offeredbetter work opportunities to rural women, accounting for well over 15 percent of the female workforce ineach case. With less than 13 percent of the district population, Karandighi block too offered good opportunitiesfor economic engagement to women workers and consequently held more than 15 percent of the femaleworkforce in the district. Female work participation was distinctly low in the Muslim-dominated blocks ofChopra, Islampur and Goalpokhar-2 which held just over 28 percent of the district population and close to39 percent of the Muslim population of Uttar Dinajpur but only accounted for 18 percent of the aggregatefemale workforce. However, low female work participation in these blocks was not a cultural characteristicspecific to Muslim-dominated areas, but was dictated instead by other predisposing factors such as thedominant forms of economic activity in these particular blocks. Other Muslim-dominated blocks likeKarandighi and Goalpokhar-1, which hold between 14 to 16 percent of the Muslim population of UttarDinajpur, recorded much higher female WPRs. Female work participation was similarly high in Itahar,which holds around 11 percent of the Muslim population in Uttar Dinajpur. Since male WPRs too wererelatively high in these three blocks, the high rates of female work participation reflected an economicresponse from women workers in order to supplement the earnings of poor rural households.
Table: Gender Work Participation Rates in Uttar Dinajpur District, 2001
Total Total Total Male FemaleTotal Male Female Total Male Female WPR WPR WPR
CD Block/Town Population Population Population Workers Workers Workers [%] [%] [%]
Chopra 223022 115097 107925 70093 55228 14865 31.4 48.0 13.8
Islampur 241951 124263 117688 79208 60751 18457 32.7 48.9 15.7
Goalpokhar-1 245430 126465 118965 108170 68623 39547 44.1 54.3 33.2
Goalpokhar-2 226472 116758 109714 75368 57697 17671 33.3 49.4 16.1
Karandighi 304986 156430 148556 120332 77583 42749 39.5 49.6 28.8
Raiganj 347108 178919 168189 139013 94728 44285 40.0 52.9 26.3
Hemtabad 118822 61192 57630 48014 33581 14433 40.4 54.9 25.0
Kaliaganj 190019 97805 92214 86162 56368 29794 45.3 57.6 32.3
Itahar 249541 127295 122246 115623 71010 44613 46.3 55.8 36.5
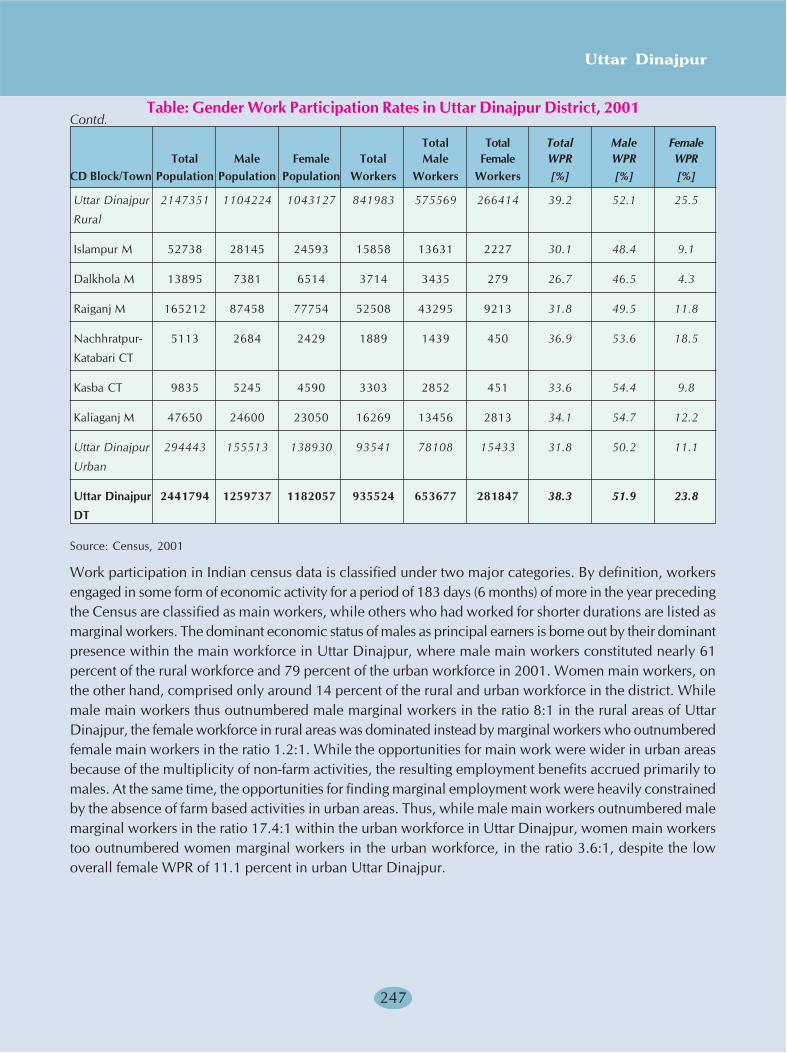
Uttar Dinajpur
247
Uttar Dinajpur 2147351 1104224 1043127 841983 575569 266414 39.2 52.1 25.5
Rural
Islampur M 52738 28145 24593 15858 13631 2227 30.1 48.4 9.1
Dalkhola M 13895 7381 6514 3714 3435 279 26.7 46.5 4.3
Raiganj M 165212 87458 77754 52508 43295 9213 31.8 49.5 11.8
Nachhratpur- 5113 2684 2429 1889 1439 450 36.9 53.6 18.5
Katabari CT
Kasba CT 9835 5245 4590 3303 2852 451 33.6 54.4 9.8
Kaliaganj M 47650 24600 23050 16269 13456 2813 34.1 54.7 12.2
Uttar Dinajpur 294443 155513 138930 93541 78108 15433 31.8 50.2 11.1
Urban
Uttar Dinajpur 2441794 1259737 1182057 935524 653677 281847 38.3 51.9 23.8
DT
Source: Census, 2001
Work participation in Indian census data is classified under two major categories. By definition, workersengaged in some form of economic activity for a period of 183 days (6 months) of more in the year precedingthe Census are classified as main workers, while others who had worked for shorter durations are listed asmarginal workers. The dominant economic status of males as principal earners is borne out by their dominantpresence within the main workforce in Uttar Dinajpur, where male main workers constituted nearly 61percent of the rural workforce and 79 percent of the urban workforce in 2001. Women main workers, onthe other hand, comprised only around 14 percent of the rural and urban workforce in the district. Whilemale main workers thus outnumbered male marginal workers in the ratio 8:1 in the rural areas of UttarDinajpur, the female workforce in rural areas was dominated instead by marginal workers who outnumberedfemale main workers in the ratio 1.2:1. While the opportunities for main work were wider in urban areasbecause of the multiplicity of non-farm activities, the resulting employment benefits accrued primarily tomales. At the same time, the opportunities for finding marginal employment work were heavily constrainedby the absence of farm based activities in urban areas. Thus, while male main workers outnumbered malemarginal workers in the ratio 17.4:1 within the urban workforce in Uttar Dinajpur, women main workerstoo outnumbered women marginal workers in the urban workforce, in the ratio 3.6:1, despite the lowoverall female WPR of 11.1 percent in urban Uttar Dinajpur.
Table: Gender Work Participation Rates in Uttar Dinajpur District, 2001
Total Total Total Male FemaleTotal Male Female Total Male Female WPR WPR WPR
CD Block/Town Population Population Population Workers Workers Workers [%] [%] [%]
Contd.
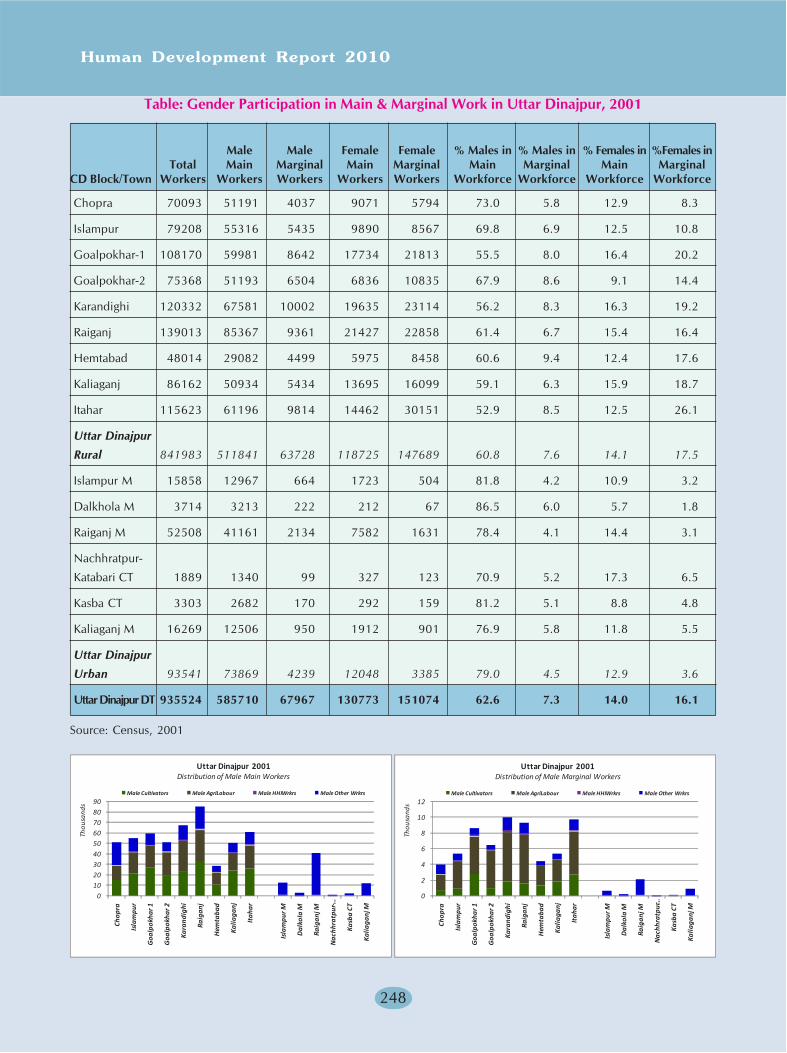
Human Development Report 2010
248
Table: Gender Participation in Main & Marginal Work in Uttar Dinajpur, 2001
Male Male Female Female % Males in % Males in % Females in %Females inTotal Main Marginal Main Marginal Main Marginal Main Marginal
CD Block/Town Workers Workers Workers Workers Workers Workforce Workforce Workforce Workforce
Chopra 70093 51191 4037 9071 5794 73.0 5.8 12.9 8.3
Islampur 79208 55316 5435 9890 8567 69.8 6.9 12.5 10.8
Goalpokhar-1 108170 59981 8642 17734 21813 55.5 8.0 16.4 20.2
Goalpokhar-2 75368 51193 6504 6836 10835 67.9 8.6 9.1 14.4
Karandighi 120332 67581 10002 19635 23114 56.2 8.3 16.3 19.2
Raiganj 139013 85367 9361 21427 22858 61.4 6.7 15.4 16.4
Hemtabad 48014 29082 4499 5975 8458 60.6 9.4 12.4 17.6
Kaliaganj 86162 50934 5434 13695 16099 59.1 6.3 15.9 18.7
Itahar 115623 61196 9814 14462 30151 52.9 8.5 12.5 26.1
Uttar Dinajpur
Rural 841983 511841 63728 118725 147689 60.8 7.6 14.1 17.5
Islampur M 15858 12967 664 1723 504 81.8 4.2 10.9 3.2
Dalkhola M 3714 3213 222 212 67 86.5 6.0 5.7 1.8
Raiganj M 52508 41161 2134 7582 1631 78.4 4.1 14.4 3.1
Nachhratpur-
Katabari CT 1889 1340 99 327 123 70.9 5.2 17.3 6.5
Kasba CT 3303 2682 170 292 159 81.2 5.1 8.8 4.8
Kaliaganj M 16269 12506 950 1912 901 76.9 5.8 11.8 5.5
Uttar Dinajpur
Urban 93541 73869 4239 12048 3385 79.0 4.5 12.9 3.6
Uttar Dinajpur DT 935524 585710 67967 130773 151074 62.6 7.3 14.0 16.1
Source: Census, 2001
0102030405060708090
Chop
ra
Isla
mpu
r
Goa
lpok
har 1
Goa
lpok
har 2
Kara
ndig
hi
Raig
anj
Hem
taba
d
Kalia
ganj
Itah
ar
Isla
mpu
r M
Dal
kola
M
Raig
anj M
Nac
hhra
tpur
-…
Kasb
a CT
Kalia
ganj
M
Thou
sand
s
Male Cultivators Male AgriLabour Male HHIWrkrs Male Other Wrkrs
Uttar Dinajpur 2001Distribution of Male Main Workers
0
2
4
6
8
10
12
Chop
ra
Isla
mpu
r
Goa
lpok
har 1
Goa
lpok
har 2
Kara
ndig
hi
Raig
anj
Hem
taba
d
Kalia
ganj
Itah
ar
Isla
mpu
r M
Dal
kola
M
Raig
anj M
Nac
hhra
tpur
…
Kasb
a CT
Kalia
ganj
M
Thou
sand
s
Male Cultivators Male AgriLabour Male HHIWrkrs Male Other Wrkrs
Uttar Dinajpur 2001Distribution of Male Marginal Workers
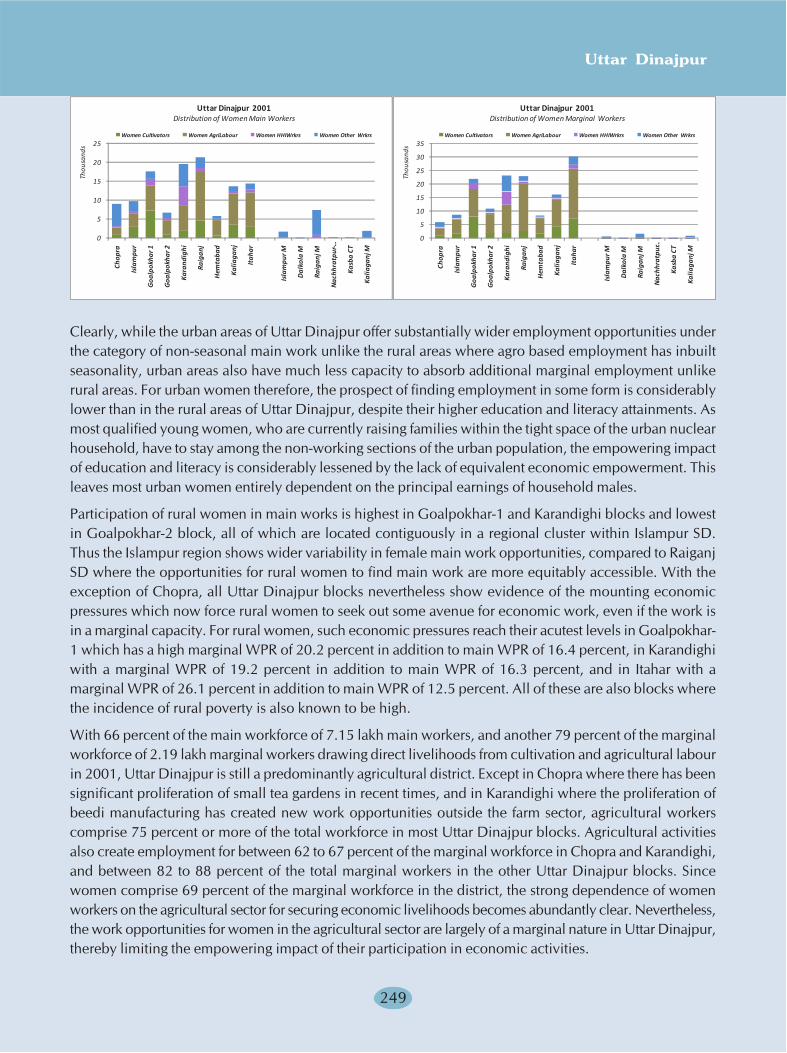
Uttar Dinajpur
249
0
5
10
15
20
25
Chop
ra
Isla
mpu
r
Goa
lpok
har 1
Goa
lpok
har 2
Kara
ndig
hi
Raig
anj
Hem
taba
d
Kalia
ganj
Itah
ar
Isla
mpu
r M
Dal
kola
M
Raig
anj M
Nac
hhra
tpur
- …
Kasb
a CT
Kalia
ganj
M
Thou
sand
s
Women Cultivators Women AgriLabour Women HHIWrkrs Women Other Wrkrs
Uttar Dinajpur 2001Distribution of Women Main Workers
0
5
10
15
20
25
30
35
Chop
ra
Isla
mpu
r
Goa
lpok
har 1
Goa
lpok
har 2
Kara
ndig
hi
Raig
anj
Hem
taba
d
Kalia
ganj
Itah
ar
Isla
mpu
r M
Dal
kola
M
Raig
anj M
Nac
hhra
tpur
…
Kasb
a CT
Kalia
ganj
M
Thou
sand
s
Women Cultivators Women AgriLabour Women HHIWrkrs Women Other Wrkrs
Uttar Dinajpur 2001Distribution of Women Marginal Workers
Clearly, while the urban areas of Uttar Dinajpur offer substantially wider employment opportunities underthe category of non-seasonal main work unlike the rural areas where agro based employment has inbuiltseasonality, urban areas also have much less capacity to absorb additional marginal employment unlikerural areas. For urban women therefore, the prospect of finding employment in some form is considerablylower than in the rural areas of Uttar Dinajpur, despite their higher education and literacy attainments. Asmost qualified young women, who are currently raising families within the tight space of the urban nuclearhousehold, have to stay among the non-working sections of the urban population, the empowering impactof education and literacy is considerably lessened by the lack of equivalent economic empowerment. Thisleaves most urban women entirely dependent on the principal earnings of household males.
Participation of rural women in main works is highest in Goalpokhar-1 and Karandighi blocks and lowestin Goalpokhar-2 block, all of which are located contiguously in a regional cluster within Islampur SD.Thus the Islampur region shows wider variability in female main work opportunities, compared to RaiganjSD where the opportunities for rural women to find main work are more equitably accessible. With theexception of Chopra, all Uttar Dinajpur blocks nevertheless show evidence of the mounting economicpressures which now force rural women to seek out some avenue for economic work, even if the work isin a marginal capacity. For rural women, such economic pressures reach their acutest levels in Goalpokhar-1 which has a high marginal WPR of 20.2 percent in addition to main WPR of 16.4 percent, in Karandighiwith a marginal WPR of 19.2 percent in addition to main WPR of 16.3 percent, and in Itahar with amarginal WPR of 26.1 percent in addition to main WPR of 12.5 percent. All of these are also blocks wherethe incidence of rural poverty is also known to be high.
With 66 percent of the main workforce of 7.15 lakh main workers, and another 79 percent of the marginalworkforce of 2.19 lakh marginal workers drawing direct livelihoods from cultivation and agricultural labourin 2001, Uttar Dinajpur is still a predominantly agricultural district. Except in Chopra where there has beensignificant proliferation of small tea gardens in recent times, and in Karandighi where the proliferation ofbeedi manufacturing has created new work opportunities outside the farm sector, agricultural workerscomprise 75 percent or more of the total workforce in most Uttar Dinajpur blocks. Agricultural activitiesalso create employment for between 62 to 67 percent of the marginal workforce in Chopra and Karandighi,and between 82 to 88 percent of the total marginal workers in the other Uttar Dinajpur blocks. Sincewomen comprise 69 percent of the marginal workforce in the district, the strong dependence of womenworkers on the agricultural sector for securing economic livelihoods becomes abundantly clear. Nevertheless,the work opportunities for women in the agricultural sector are largely of a marginal nature in Uttar Dinajpur,thereby limiting the empowering impact of their participation in economic activities.
Human Development Report 2010
250
Even though agricultural activities contribute significantly to the employment of both men and womenworkers in Uttar Dinajpur, as indicated in the associated barcharts, the employment profile of womenworkers in the district is less diversified compared to male workers, both in case of main as well asmarginal work participation. The aggregate number of main & marginal cultivators in Uttar Dinajpur touches2.77 lakh. Against 2.04 lakh males who are self-employed as main cultivators, the number of womenholding the status of main cultivators shrinks by roughly a tenth to less than 0.27 lakh, with women maincultivators being significantly present only in Goalpokhar-1, Raiganj, Kaliaganj and Islampur blocks, whichaccount collectively for 70 percent of their number. The number of women marginal cultivators in UttarDinajpur is higher at 0.31 lakh, in comparison to which the number of male marginal cultivators is almostnegligible at 0.15 lakh. Although till 2004, around 1.47 lakh rural households in Uttar Dinajpur hadacquired the legal status of pattadars as a result of the implementation of redistributive land reforms, theaverage size of each reassigned land holding, at around 0.2ha per patta, was too small for viable farmingoperations. Since 1992, provision has been made in West Bengal for recording joint titles to vested landsreassigned under redistributive land reforms in the names of both spouses with retrospective effect. However,the implementation of this order is still incomplete. Despite the fact that they constitute nearly a third of theagricultural workforce in Uttar Dinajpur, the presence of women as cultivators still remains relativelyinsignificant, while rural men continue to exercise gender dominance over women in the rural areas of thedistrict because of their pre-eminent positions as landowners and cultivators. Thus the primary work-rolesof rural women are confined largely to wage-work activities, as a consequence of which they constitutearound 40 percent of the 3.71 lakh agricultural labourers in Uttar Dinajpur. Even in this work-role, 0.87lakh women participate as marginal workers, against 0.58 lakh women engaged in agricultural wage-workin a main worker capacity.
The involvement of rural women in tertiary non-farm activities falling within the census category of 'otherworkers' only reaches appreciable proportions in Chopra and Karandighi, where there has been considerablelivelihood diversification through women-centred labour activities associated with small tea plantationsand beedi making. The involvement of rural men in non-agricultural activities has a wider spread acrossUttar Dinajpur and is significantly high in nearly all blocks with the exception of Hemtabad. The totalstrength of the male workforce engaged in other non-farm work thus amounts to 1.98 lakh, with 94 percentof the males being so engaged in a main worker capacity. In contrast, the total number of female otherworkers amounts to 0.55 lakh, among whom over 63 percent are engaged in a marginal worker capacity.
The contrasts in gender work-roles in Uttar Dinajpur are brought out strongly by the accompanying regionalmaps, which also show that the lower WPRs of women in most Islampur SD blocks as well as theirrelatively low participation in the main worker category add an economic dimension to the regional disparitiesalready faced by rural women in literacy, education and health status. In Goalpokhar-1, Itahar and Kaliaganjwhere female WPRs are relatively high, many more women function as marginal cultivators, which obviouslyadds considerable strength to their relative gender status.
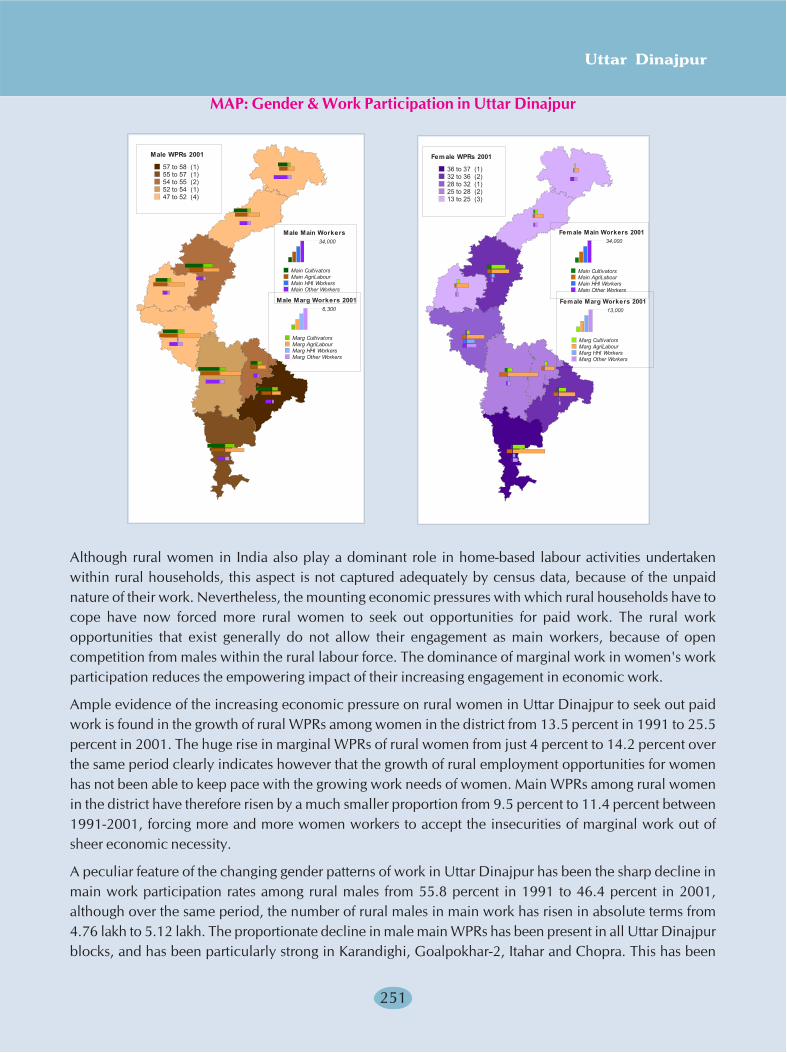
Uttar Dinajpur
251
MAP: Gender & Work Participation in Uttar Dinajpur
Although rural women in India also play a dominant role in home-based labour activities undertakenwithin rural households, this aspect is not captured adequately by census data, because of the unpaidnature of their work. Nevertheless, the mounting economic pressures with which rural households have tocope have now forced more rural women to seek out opportunities for paid work. The rural workopportunities that exist generally do not allow their engagement as main workers, because of opencompetition from males within the rural labour force. The dominance of marginal work in women's workparticipation reduces the empowering impact of their increasing engagement in economic work.
Ample evidence of the increasing economic pressure on rural women in Uttar Dinajpur to seek out paidwork is found in the growth of rural WPRs among women in the district from 13.5 percent in 1991 to 25.5percent in 2001. The huge rise in marginal WPRs of rural women from just 4 percent to 14.2 percent overthe same period clearly indicates however that the growth of rural employment opportunities for womenhas not been able to keep pace with the growing work needs of women. Main WPRs among rural womenin the district have therefore risen by a much smaller proportion from 9.5 percent to 11.4 percent between1991-2001, forcing more and more women workers to accept the insecurities of marginal work out ofsheer economic necessity.
A peculiar feature of the changing gender patterns of work in Uttar Dinajpur has been the sharp decline inmain work participation rates among rural males from 55.8 percent in 1991 to 46.4 percent in 2001,although over the same period, the number of rural males in main work has risen in absolute terms from4.76 lakh to 5.12 lakh. The proportionate decline in male main WPRs has been present in all Uttar Dinajpurblocks, and has been particularly strong in Karandighi, Goalpokhar-2, Itahar and Chopra. This has been
Male WPRs 2001
57 to 58 (1)55 to 57 (1)54 to 55 (2)52 to 54 (1)47 to 52 (4)
Male Main Workers34,000
Main CultivatorsMain AgriLabourMain HHI WorkersMain Other Workers
Male Marg Workers 20016,300
Marg CultivatorsMarg AgriLabourMarg HHI WorkersMarg Other Workers
Female WPRs 2001
36 to 37 (1)32 to 36 (2)28 to 32 (1)25 to 28 (2)13 to 25 (3)
Female Main Workers 200134,000
Main CultivatorsMain AgriLabourMain HHI WorkersMain Other Workers
Female Marg Workers 200113,000
Marg CultivatorsMarg AgriLabourMarg HHI WorkersMarg Other Workers
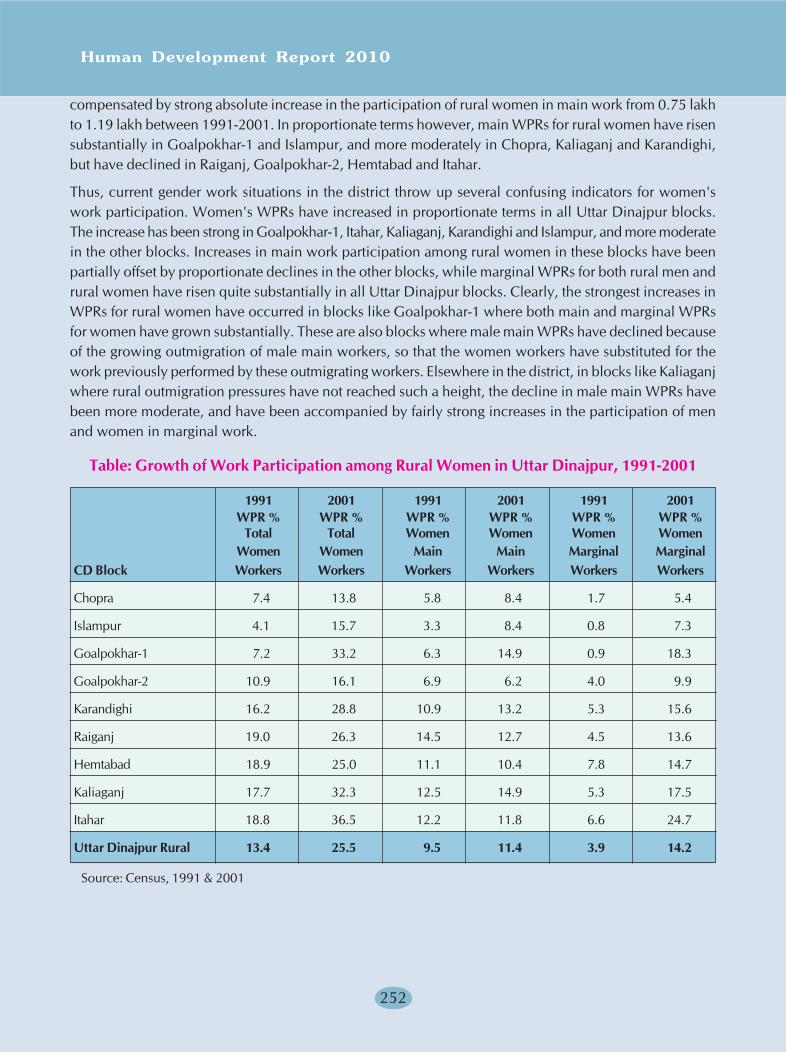
Human Development Report 2010
252
compensated by strong absolute increase in the participation of rural women in main work from 0.75 lakhto 1.19 lakh between 1991-2001. In proportionate terms however, main WPRs for rural women have risensubstantially in Goalpokhar-1 and Islampur, and more moderately in Chopra, Kaliaganj and Karandighi,but have declined in Raiganj, Goalpokhar-2, Hemtabad and Itahar.
Thus, current gender work situations in the district throw up several confusing indicators for women'swork participation. Women's WPRs have increased in proportionate terms in all Uttar Dinajpur blocks.The increase has been strong in Goalpokhar-1, Itahar, Kaliaganj, Karandighi and Islampur, and more moderatein the other blocks. Increases in main work participation among rural women in these blocks have beenpartially offset by proportionate declines in the other blocks, while marginal WPRs for both rural men andrural women have risen quite substantially in all Uttar Dinajpur blocks. Clearly, the strongest increases inWPRs for rural women have occurred in blocks like Goalpokhar-1 where both main and marginal WPRsfor women have grown substantially. These are also blocks where male main WPRs have declined becauseof the growing outmigration of male main workers, so that the women workers have substituted for thework previously performed by these outmigrating workers. Elsewhere in the district, in blocks like Kaliaganjwhere rural outmigration pressures have not reached such a height, the decline in male main WPRs havebeen more moderate, and have been accompanied by fairly strong increases in the participation of menand women in marginal work.
Table: Growth of Work Participation among Rural Women in Uttar Dinajpur, 1991-2001
1991 2001 1991 2001 1991 2001WPR % WPR % WPR % WPR % WPR % WPR %
Total Total Women Women Women WomenWomen Women Main Main Marginal Marginal
CD Block Workers Workers Workers Workers Workers Workers
Chopra 7.4 13.8 5.8 8.4 1.7 5.4
Islampur 4.1 15.7 3.3 8.4 0.8 7.3
Goalpokhar-1 7.2 33.2 6.3 14.9 0.9 18.3
Goalpokhar-2 10.9 16.1 6.9 6.2 4.0 9.9
Karandighi 16.2 28.8 10.9 13.2 5.3 15.6
Raiganj 19.0 26.3 14.5 12.7 4.5 13.6
Hemtabad 18.9 25.0 11.1 10.4 7.8 14.7
Kaliaganj 17.7 32.3 12.5 14.9 5.3 17.5
Itahar 18.8 36.5 12.2 11.8 6.6 24.7
Uttar Dinajpur Rural 13.4 25.5 9.5 11.4 3.9 14.2
Source: Census, 1991 & 2001
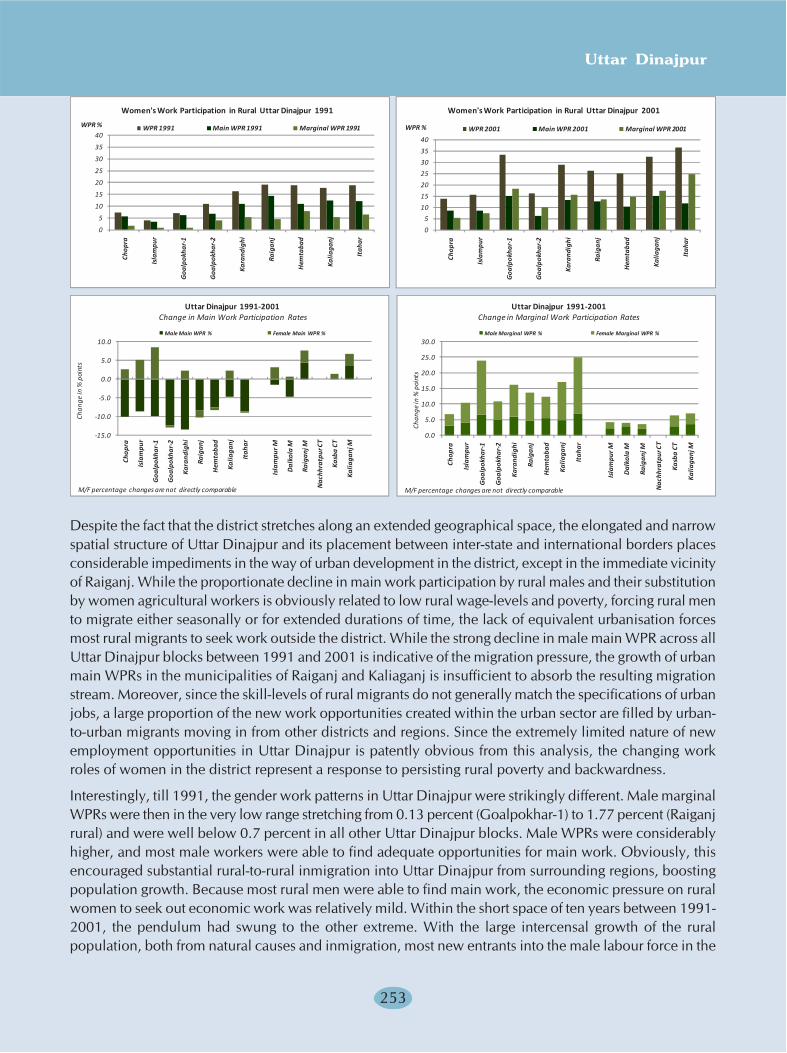
Uttar Dinajpur
253
0
5
10
15
20
25
30
35
40
Chop
ra
Isla
mpu
r
Goa
lpok
har-
1
Goa
lpok
har-
2
Kara
ndig
hi
Raig
anj
Hem
taba
d
Kalia
ganj
Itah
ar
WPR 1991 Main WPR 1991 Marginal WPR 1991WPR %
Women's Work Participation in Rural Uttar Dinajpur 1991
0
5
10
15
20
25
30
35
40
Chop
ra
Isla
mpu
r
Goa
lpok
har-
1
Goa
lpok
har-
2
Kara
ndig
hi
Raig
anj
Hem
taba
d
Kalia
ganj
Itah
ar
WPR 2001 Main WPR 2001 Marginal WPR 2001WPR %
Women's Work Participation in Rural Uttar Dinajpur 2001
-15.0
-10.0
-5.0
0.0
5.0
10.0
Chop
ra
Isla
mpu
r
Goa
lpok
har-
1
Goa
lpok
har-
2
Kara
ndig
hi
Raig
anj
Hem
taba
d
Kalia
ganj
Itah
ar
Isla
mpu
r M
Dal
kola
M
Raig
anj M
Nac
hhra
tpur
CT
Kasb
a CT
Kalia
ganj
M
Male Main WPR % Female Main WPR %
Uttar Dinajpur 1991-2001Change in Main Work Participation Rates
Chan
ge in
% p
oint
s
M/F percentage changes are not directly comparable
0.0
5.0
10.0
15.0
20.0
25.0
30.0
Chop
ra
Isla
mpu
r
Goa
lpok
har-
1
Goa
lpok
har-
2
Kara
ndig
hi
Raig
anj
Hem
taba
d
Kalia
ganj
Itah
ar
Isla
mpu
r M
Dal
kola
M
Raig
anj M
Nac
hhra
tpur
CT
Kasb
a CT
Kalia
ganj
M
Male Marginal WPR % Female Marginal WPR %
Uttar Dinajpur 1991-2001Change in Marginal Work Participation Rates
Chan
ge in
% p
oint
s
M/F percentage changes are not directly comparable
Despite the fact that the district stretches along an extended geographical space, the elongated and narrowspatial structure of Uttar Dinajpur and its placement between inter-state and international borders placesconsiderable impediments in the way of urban development in the district, except in the immediate vicinityof Raiganj. While the proportionate decline in main work participation by rural males and their substitutionby women agricultural workers is obviously related to low rural wage-levels and poverty, forcing rural mento migrate either seasonally or for extended durations of time, the lack of equivalent urbanisation forcesmost rural migrants to seek work outside the district. While the strong decline in male main WPR across allUttar Dinajpur blocks between 1991 and 2001 is indicative of the migration pressure, the growth of urbanmain WPRs in the municipalities of Raiganj and Kaliaganj is insufficient to absorb the resulting migrationstream. Moreover, since the skill-levels of rural migrants do not generally match the specifications of urbanjobs, a large proportion of the new work opportunities created within the urban sector are filled by urban-to-urban migrants moving in from other districts and regions. Since the extremely limited nature of newemployment opportunities in Uttar Dinajpur is patently obvious from this analysis, the changing workroles of women in the district represent a response to persisting rural poverty and backwardness.
Interestingly, till 1991, the gender work patterns in Uttar Dinajpur were strikingly different. Male marginalWPRs were then in the very low range stretching from 0.13 percent (Goalpokhar-1) to 1.77 percent (Raiganjrural) and were well below 0.7 percent in all other Uttar Dinajpur blocks. Male WPRs were considerablyhigher, and most male workers were able to find adequate opportunities for main work. Obviously, thisencouraged substantial rural-to-rural inmigration into Uttar Dinajpur from surrounding regions, boostingpopulation growth. Because most rural men were able to find main work, the economic pressure on ruralwomen to seek out economic work was relatively mild. Within the short space of ten years between 1991-2001, the pendulum had swung to the other extreme. With the large intercensal growth of the ruralpopulation, both from natural causes and inmigration, most new entrants into the male labour force in the
Human Development Report 2010
254
district today are only able to find marginal work during a certain part of the year and have to migrate awayfrom the district at other times in order to sustain their earnings. While the resulting labour gap has beenfilled by women workers, this occurs in response to the increasing economic insecurity of rural familieswhere the earnings of household males have become increasingly uncertain. Meanwhile, wage competitionamong the large contingent of males who make up the bulk of the rural labour force has depressed ruralwage-levels in the district to the point where the incentive to migrate to other regions and districts hasincreased commensurately. Thus the current gender work patterns in Uttar Dinajpur are also indicative ofthe growing economic stress that confronts rural households. While rising work participation by women inthe district has placed them in an important economic role, the empowering impact of their economicparticipation is largely negated by the disempowering impact of low human development and pervasivepoverty that makes Uttar Dinajpur one of the most backward districts in West Bengal.
Sectoral Change in Women's Employment
Women's economic roles in Uttar Dinajpur are considerably larger today than they were in the past. Agrowing number of rural women are now entering the workforce either in the role of main earners ormarginal earners, creating basic conditions for future economic empowerment of women in the district, ifthese gains in employment are accompanied by advances in women's education, health and social security.However, the impact of increasing work participation by women has so far been uneven across the district,because of local socioeconomic and cultural situations that differ considerably between its subregions. Ittherefore become important to identify characteristic regional and sectoral patterns of change in women'swork participation between 1991-2001, in order to assess whether current trends towards greater economicparticipation by women in Uttar Dinajpur are sustainable in the long run, or whether the saturation ofcurrent rural employment opportunities will halt the economic progress of women.
Throughout most parts of rural West Bengal, there has been a considerable decline in both the absoluteand relative number of males engaged in cultivation between 1991-2001. This has accompanied sharpgrowth in the number of rural males engaged in main & marginal worker roles as agricultural labourers.However, in Uttar Dinajpur, the decline in male cultivators by 0.35 lakh between 1991-2001 has beenaccompanied by substantial growth in the number of women cultivators from 0.12 lakh in 1991 to 0.26lakh in 2001, with particularly sharp increases taking place in Goalpokhar-1, Itahar and Kaliaganj, followedby Raiganj and Islampur blocks. Nevertheless, the increase in women cultivators has only been strongenough to offset the absolute decline in male cultivators in Goalpokhar-1 and Kaliaganj blocks, where thenew women cultivators have virtually stepped into the men's shoes. In these two blocks, there has alsobeen an increase in the absolute number of cultivators, against the trend in the other Uttar Dinajpur blocks.Although the increase in women cultivators is of a milder order in the rest of the Uttar Dinajpur blocks, thetrend towards increasing participation of women as main cultivators is maintained by all blocks acrossboth sub-divisions of the district.
Between 1991-2001, the number of women engaged in main work as agricultural labourers in Uttar Dinajpurhas also risen from 0.50 lakh to 0.57 lakh. Women workers accounted for around 39 percent of the totalincrease in main agricultural labourers by nearly 0.19 lakh. The importance of women's work in thesubsistence economy of the district has grown progressively as the role of male workers has declined. Thusin aggregate terms, the number of women main cultivators and agricultural labourers participating in farm-based work in Uttar Dinajpur increased substantially by 0.21 lakh, against an overall decline in male farmworkers by 0.23 lakh over the same period. Besides augmenting the agricultural labour force, women alsotook on the work-roles of men who had given up cultivation and had migrated to other occupations orother places for alternative employment. However, this failed to offset the overall decline in main cultivatorsin the district by 0.21 lakh over the same period.
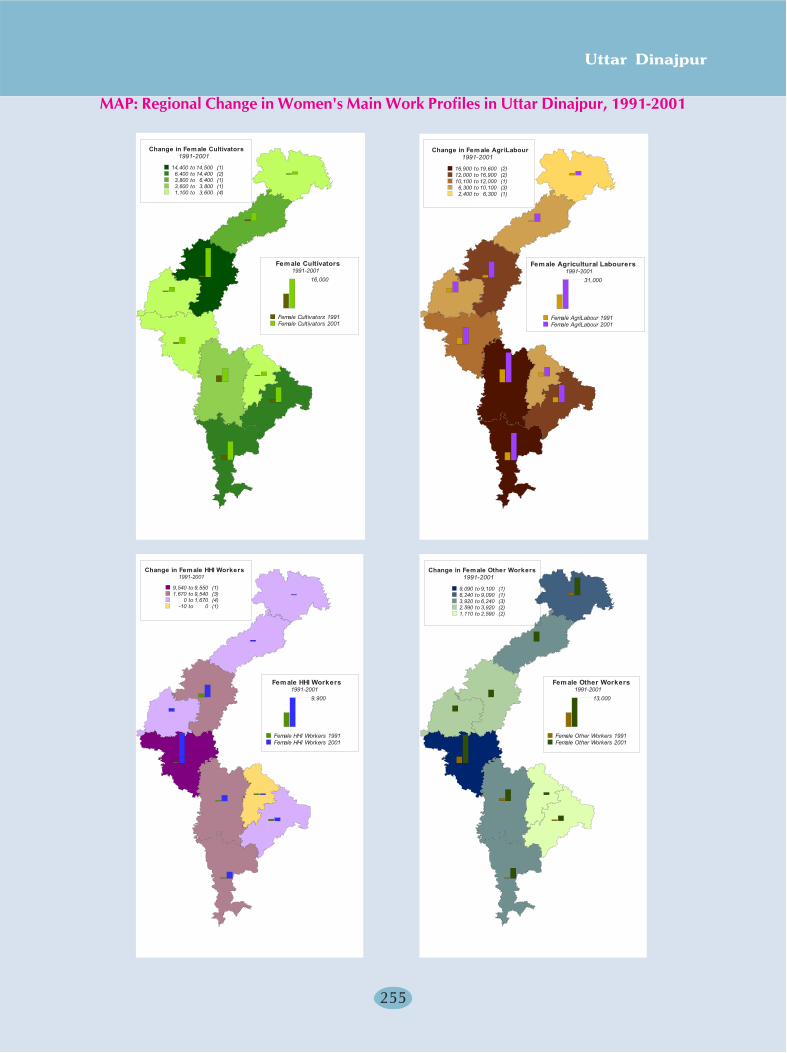
Uttar Dinajpur
255
MAP: Regional Change in Women's Main Work Profiles in Uttar Dinajpur, 1991-2001
Change in Female Cultivators1991-2001
14,400 to 14,500 (1)6,400 to 14,400 (2)3,800 to 6,400 (1)3,600 to 3,800 (1)1,100 to 3,600 (4)
Female Cultivators1991-2001
16,000
Female Cultivators 1991Female Cultivators 2001
Change in Female AgriLabour1991-2001
16,900 to 19,600 (2)12,000 to 16,900 (2)10,100 to 12,000 (1)
6,300 to 10,100 (3)2,400 to 6,300 (1)
Female Agricultural Labourers1991-2001
31,000
Female AgriLabour 1991Female AgriLabour 2001
Change in Female HHI Workers1991-2001
9,540 to 9,550 (1)1,670 to 9,540 (3)
0 to 1,670 (4)-10 to 0 (1)
Fem ale HHI Workers1991-2001
9,900
Female HHI Workers 1991Female HHI Workers 2001
Change in Female Other Workers1991-2001
9,090 to 9,100 (1)6,240 to 9,090 (1)3,920 to 6,240 (3)2,590 to 3,920 (2)1,110 to 2,590 (2)
Female Other Workers1991-2001
13,000
Female Other Workers 1991Female Other Workers 2001
Human Development Report 2010
256
In regional terms, the strongest increases in the number of female cultivators took place in Goalpokhar-1,followed by Islampur, Kaliaganj, Raiganj and Itahar, while in the other Uttar Dinajpur blocks, the presenceof women cultivators was weak and the increase in their number was modest. The sharpest increases inthe number of women main agricultural labourers also occurred in the intensely cultivated Raiganj-Itaharbelt. In the contiguous blocks of Kaliaganj, Goalpokhar-1 and Karandighi, the increase in women mainagricultural labourers was less intense and was relatively moderate in the other Uttar Dinajpur blocks.Given both regional tendencies, the role of rural women workers in the subsistence economy of the districthas expanded considerably in all blocks except Chopra, Goalpokhar-2 and Hemtabad. While womenworkers in Chopra were also able to find absorption in non-traditional activities such as small tea gardens,the slow growth of women's work involvement in the subsistence sector in Goalpokhar-2 and Hemtabadwas mainly because of the saturation of work opportunities in the agricultural sector, and the limited scopefor finding economic work outside this sector.
In the non-farm sector, women's work participation has increased most strongly in Karandighi block,where 0.22 lakh women workers (10,851 main workers and another 10,653 marginal workers) wereengaged in this category of work in 2001. The increase in women's work participation in Karandighi wassignificantly high both in the home-based production sector as well as in other non-farm occupations.Chopra accounted for the largest contingent of women main workers engaged under the 'other work'category, primarily because of proliferation of small tea gardens. Islampur, Goalpokhar-1 and Raiganj werethe other Uttar Dinajpur blocks where women's main work participation in non-farm activities increasedsubstantially. In Itahar however, because of the saturation of work opportunities in the agricultural sector,the participation of women marginal workers in non-farm activities increased steeply.
Summing up these cumulative sectoral trends in women's work participation in Uttar Dinajpur, it is evidentthat the huge rise in women's economic participation between 1991-2001 is in direct response to themounting economic pressures which now force rural women to seek out paid work opportunities tosupplement family incomes, in addition to their unpaid work in the household and on family farms. Inregions like Goalpokhar-1 where the agricultural potential had been inadequately developed in the past, ithas been relatively easy work women to find main and marginal work within the farm sector. Elsewhere,particularly in the Islampur SD blocks, increasing migration of rural male workers to other places and othersectors of work have also impelled the substitution of male farm workers by women workers, expandingthe work-role of women within the subsistence economy of Uttar Dinajpur. Increased women's participationin non-farm work has occurred in certain regions where the saturation of agricultural work opportunitieshas been accompanied by the proliferation of newer forms of non-farm activity. However, in core agriculturalareas throughout the district, where the intensity of cultivation and work participation is already very high,women workers only find engagement in various forms of marginal work, where work-related insecuritiesare considerably larger.
The prevalence of low rural wage levels throughout Uttar Dinajpur has limited the extent of economicempowerment resulting from increased work participation by rural women in the district. The earnings ofwomen marginal workers are uncertain, and are low where they come into direct competition with malewage-workers. Slow rates of urbanisation in Uttar Dinajpur do not offer enough scope for work relatedrural-urban migration. The natural consequence is for male workers to seek work at great distances, leavingthe womenfolk behind to take charge of households and families. Thus in many parts of rural Uttar Dinajpur,the acquisition of greater economic responsibilities by rural women reflects a response to rural povertyrather than a path to rural prosperity.
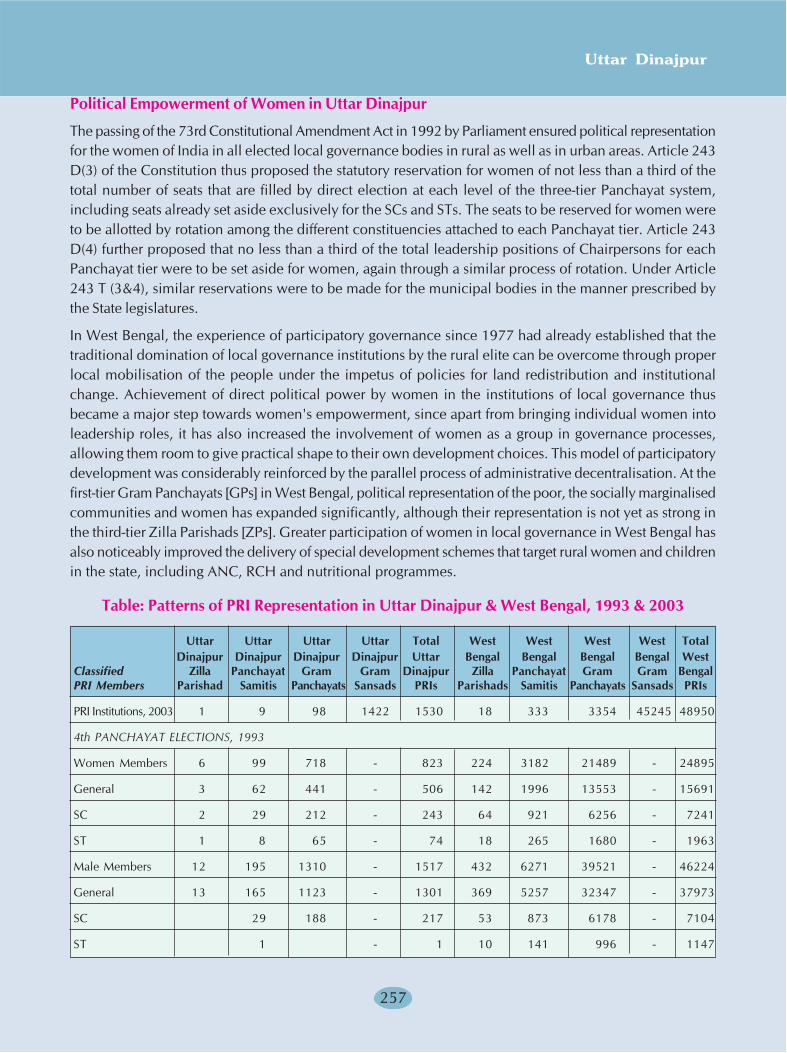
Uttar Dinajpur
257
Political Empowerment of Women in Uttar Dinajpur
The passing of the 73rd Constitutional Amendment Act in 1992 by Parliament ensured political representationfor the women of India in all elected local governance bodies in rural as well as in urban areas. Article 243D(3) of the Constitution thus proposed the statutory reservation for women of not less than a third of thetotal number of seats that are filled by direct election at each level of the three-tier Panchayat system,including seats already set aside exclusively for the SCs and STs. The seats to be reserved for women wereto be allotted by rotation among the different constituencies attached to each Panchayat tier. Article 243D(4) further proposed that no less than a third of the total leadership positions of Chairpersons for eachPanchayat tier were to be set aside for women, again through a similar process of rotation. Under Article243 T (3&4), similar reservations were to be made for the municipal bodies in the manner prescribed bythe State legislatures.
In West Bengal, the experience of participatory governance since 1977 had already established that thetraditional domination of local governance institutions by the rural elite can be overcome through properlocal mobilisation of the people under the impetus of policies for land redistribution and institutionalchange. Achievement of direct political power by women in the institutions of local governance thusbecame a major step towards women's empowerment, since apart from bringing individual women intoleadership roles, it has also increased the involvement of women as a group in governance processes,allowing them room to give practical shape to their own development choices. This model of participatorydevelopment was considerably reinforced by the parallel process of administrative decentralisation. At thefirst-tier Gram Panchayats [GPs] in West Bengal, political representation of the poor, the socially marginalisedcommunities and women has expanded significantly, although their representation is not yet as strong inthe third-tier Zilla Parishads [ZPs]. Greater participation of women in local governance in West Bengal hasalso noticeably improved the delivery of special development schemes that target rural women and childrenin the state, including ANC, RCH and nutritional programmes.
Table: Patterns of PRI Representation in Uttar Dinajpur & West Bengal, 1993 & 2003
Uttar Uttar Uttar Uttar Total West West West West TotalDinajpur Dinajpur Dinajpur Dinajpur Uttar Bengal Bengal Bengal Bengal West
Classified Zilla Panchayat Gram Gram Dinajpur Zilla Panchayat Gram Gram BengalPRI Members Parishad Samitis Panchayats Sansads PRIs Parishads Samitis Panchayats Sansads PRIs
PRI Institutions, 2003 1 9 98 1422 1530 18 333 3354 45245 48950
4th PANCHAYAT ELECTIONS, 1993
Women Members 6 99 718 - 823 224 3182 21489 - 24895
General 3 62 441 - 506 142 1996 13553 - 15691
SC 2 29 212 - 243 64 921 6256 - 7241
ST 1 8 65 - 74 18 265 1680 - 1963
Male Members 12 195 1310 - 1517 432 6271 39521 - 46224
General 13 165 1123 - 1301 369 5257 32347 - 37973
SC 29 188 - 217 53 873 6178 - 7104
ST 1 - 1 10 141 996 - 1147
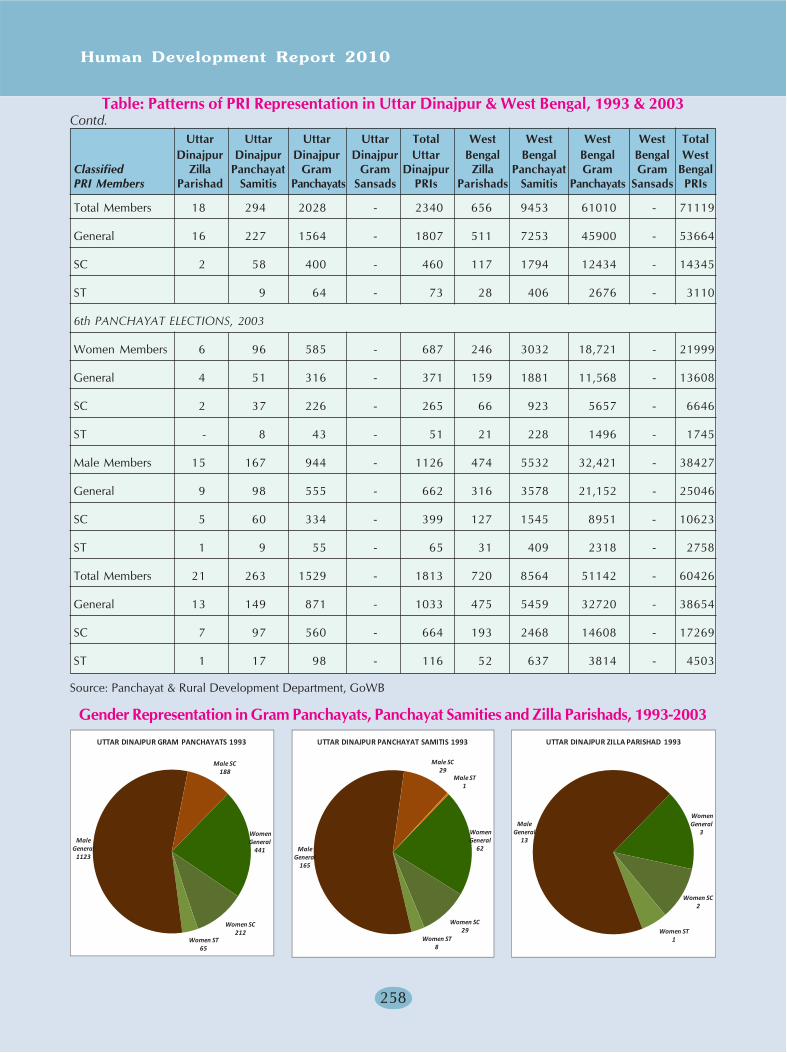
Human Development Report 2010
258
Total Members 18 294 2028 - 2340 656 9453 61010 - 71119
General 16 227 1564 - 1807 511 7253 45900 - 53664
SC 2 58 400 - 460 117 1794 12434 - 14345
ST 9 64 - 73 28 406 2676 - 3110
6th PANCHAYAT ELECTIONS, 2003
Women Members 6 96 585 - 687 246 3032 18,721 - 21999
General 4 51 316 - 371 159 1881 11,568 - 13608
SC 2 37 226 - 265 66 923 5657 - 6646
ST - 8 43 - 51 21 228 1496 - 1745
Male Members 15 167 944 - 1126 474 5532 32,421 - 38427
General 9 98 555 - 662 316 3578 21,152 - 25046
SC 5 60 334 - 399 127 1545 8951 - 10623
ST 1 9 55 - 65 31 409 2318 - 2758
Total Members 21 263 1529 - 1813 720 8564 51142 - 60426
General 13 149 871 - 1033 475 5459 32720 - 38654
SC 7 97 560 - 664 193 2468 14608 - 17269
ST 1 17 98 - 116 52 637 3814 - 4503
Source: Panchayat & Rural Development Department, GoWB
Table: Patterns of PRI Representation in Uttar Dinajpur & West Bengal, 1993 & 2003
Uttar Uttar Uttar Uttar Total West West West West TotalDinajpur Dinajpur Dinajpur Dinajpur Uttar Bengal Bengal Bengal Bengal West
Classified Zilla Panchayat Gram Gram Dinajpur Zilla Panchayat Gram Gram BengalPRI Members Parishad Samitis Panchayats Sansads PRIs Parishads Samitis Panchayats Sansads PRIs
Women General
441
Women SC212
Women ST65
Male General
1123
Male SC188
UTTAR DINAJPUR GRAM PANCHAYATS 1993
Women General
62
Women SC29
Women ST8
Male General
165
Male SC29
Male ST1
UTTAR DINAJPUR PANCHAYAT SAMITIS 1993
Women General
3
Women SC2
Women ST1
Male General
13
UTTAR DINAJPUR ZILLA PARISHAD 1993
Contd.
Gender Representation in Gram Panchayats, Panchayat Samities and Zilla Parishads, 1993-2003
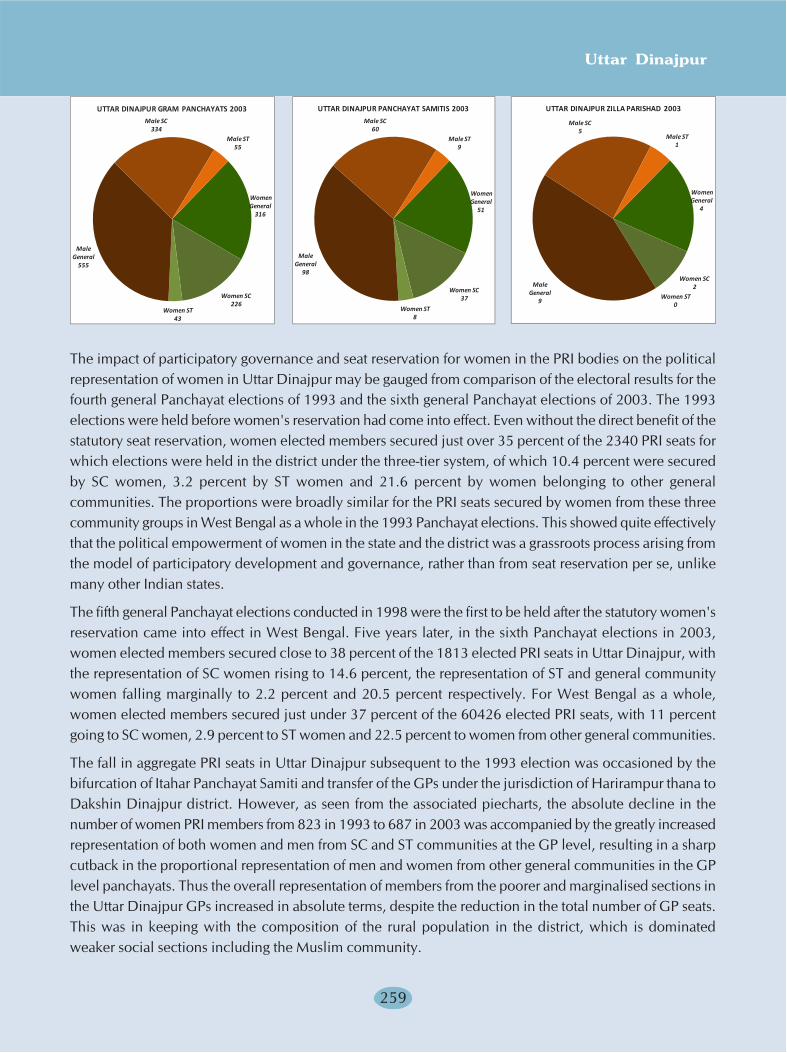
Uttar Dinajpur
259
Women General
316
Women SC226
Women ST43
Male General
555
Male SC334
Male ST55
UTTAR DINAJPUR GRAM PANCHAYATS 2003
Women General
51
Women SC37
Women ST8
Male General
98
Male SC60
Male ST9
UTTAR DINAJPUR PANCHAYAT SAMITIS 2003
Women General
4
Women SC2
Women ST0
Male General
9
Male SC5
Male ST1
UTTAR DINAJPUR ZILLA PARISHAD 2003
The impact of participatory governance and seat reservation for women in the PRI bodies on the politicalrepresentation of women in Uttar Dinajpur may be gauged from comparison of the electoral results for thefourth general Panchayat elections of 1993 and the sixth general Panchayat elections of 2003. The 1993elections were held before women's reservation had come into effect. Even without the direct benefit of thestatutory seat reservation, women elected members secured just over 35 percent of the 2340 PRI seats forwhich elections were held in the district under the three-tier system, of which 10.4 percent were securedby SC women, 3.2 percent by ST women and 21.6 percent by women belonging to other generalcommunities. The proportions were broadly similar for the PRI seats secured by women from these threecommunity groups in West Bengal as a whole in the 1993 Panchayat elections. This showed quite effectivelythat the political empowerment of women in the state and the district was a grassroots process arising fromthe model of participatory development and governance, rather than from seat reservation per se, unlikemany other Indian states.
The fifth general Panchayat elections conducted in 1998 were the first to be held after the statutory women'sreservation came into effect in West Bengal. Five years later, in the sixth Panchayat elections in 2003,women elected members secured close to 38 percent of the 1813 elected PRI seats in Uttar Dinajpur, withthe representation of SC women rising to 14.6 percent, the representation of ST and general communitywomen falling marginally to 2.2 percent and 20.5 percent respectively. For West Bengal as a whole,women elected members secured just under 37 percent of the 60426 elected PRI seats, with 11 percentgoing to SC women, 2.9 percent to ST women and 22.5 percent to women from other general communities.
The fall in aggregate PRI seats in Uttar Dinajpur subsequent to the 1993 election was occasioned by thebifurcation of Itahar Panchayat Samiti and transfer of the GPs under the jurisdiction of Harirampur thana toDakshin Dinajpur district. However, as seen from the associated piecharts, the absolute decline in thenumber of women PRI members from 823 in 1993 to 687 in 2003 was accompanied by the greatly increasedrepresentation of both women and men from SC and ST communities at the GP level, resulting in a sharpcutback in the proportional representation of men and women from other general communities in the GPlevel panchayats. Thus the overall representation of members from the poorer and marginalised sections inthe Uttar Dinajpur GPs increased in absolute terms, despite the reduction in the total number of GP seats.This was in keeping with the composition of the rural population in the district, which is dominatedweaker social sections including the Muslim community.
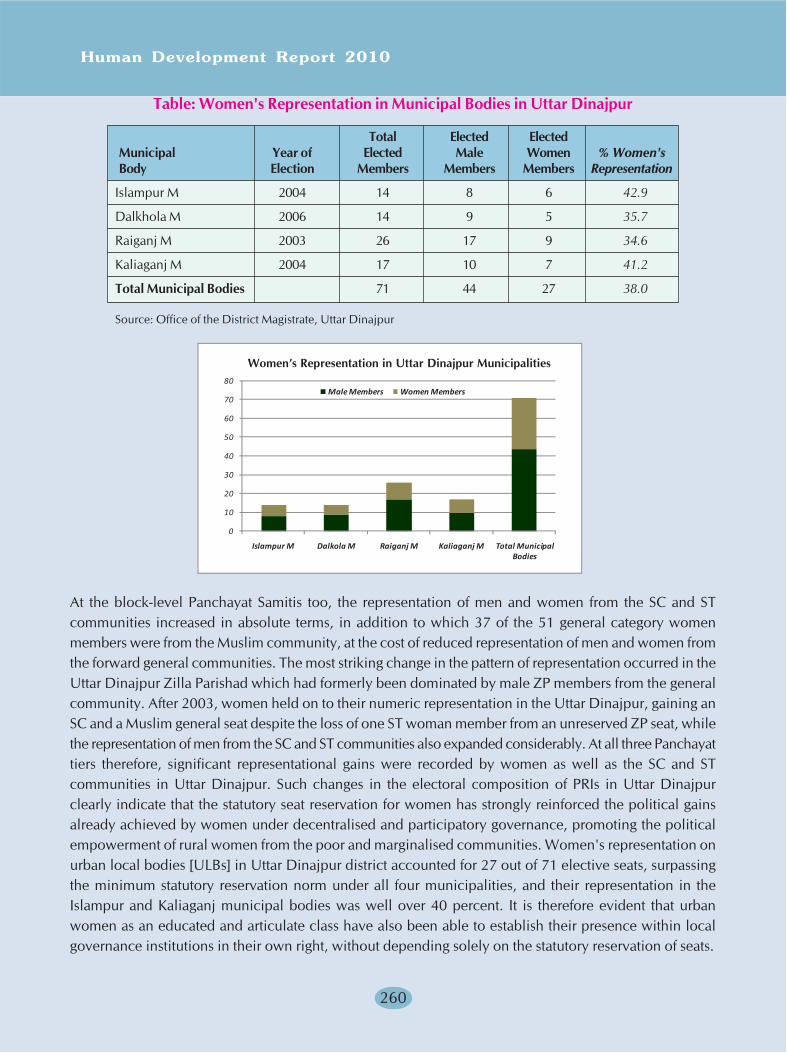
Human Development Report 2010
260
Table: Women's Representation in Municipal Bodies in Uttar Dinajpur
Total Elected ElectedMunicipal Year of Elected Male Women % Women'sBody Election Members Members Members Representation
Islampur M 2004 14 8 6 42.9
Dalkhola M 2006 14 9 5 35.7
Raiganj M 2003 26 17 9 34.6
Kaliaganj M 2004 17 10 7 41.2
Total Municipal Bodies 71 44 27 38.0
Source: Office of the District Magistrate, Uttar Dinajpur
At the block-level Panchayat Samitis too, the representation of men and women from the SC and STcommunities increased in absolute terms, in addition to which 37 of the 51 general category womenmembers were from the Muslim community, at the cost of reduced representation of men and women fromthe forward general communities. The most striking change in the pattern of representation occurred in theUttar Dinajpur Zilla Parishad which had formerly been dominated by male ZP members from the generalcommunity. After 2003, women held on to their numeric representation in the Uttar Dinajpur, gaining anSC and a Muslim general seat despite the loss of one ST woman member from an unreserved ZP seat, whilethe representation of men from the SC and ST communities also expanded considerably. At all three Panchayattiers therefore, significant representational gains were recorded by women as well as the SC and STcommunities in Uttar Dinajpur. Such changes in the electoral composition of PRIs in Uttar Dinajpurclearly indicate that the statutory seat reservation for women has strongly reinforced the political gainsalready achieved by women under decentralised and participatory governance, promoting the politicalempowerment of rural women from the poor and marginalised communities. Women's representation onurban local bodies [ULBs] in Uttar Dinajpur district accounted for 27 out of 71 elective seats, surpassingthe minimum statutory reservation norm under all four municipalities, and their representation in theIslampur and Kaliaganj municipal bodies was well over 40 percent. It is therefore evident that urbanwomen as an educated and articulate class have also been able to establish their presence within localgovernance institutions in their own right, without depending solely on the statutory reservation of seats.
0
10
20
30
40
50
60
70
80
Islampur M Dalkola M Raiganj M Kaliaganj M Total Municipal Bodies
Male Members Women Members
Women's Representation on Uttar Dinajpur MunicipalitiesWomen’s Representation in Uttar Dinajpur Municipalities
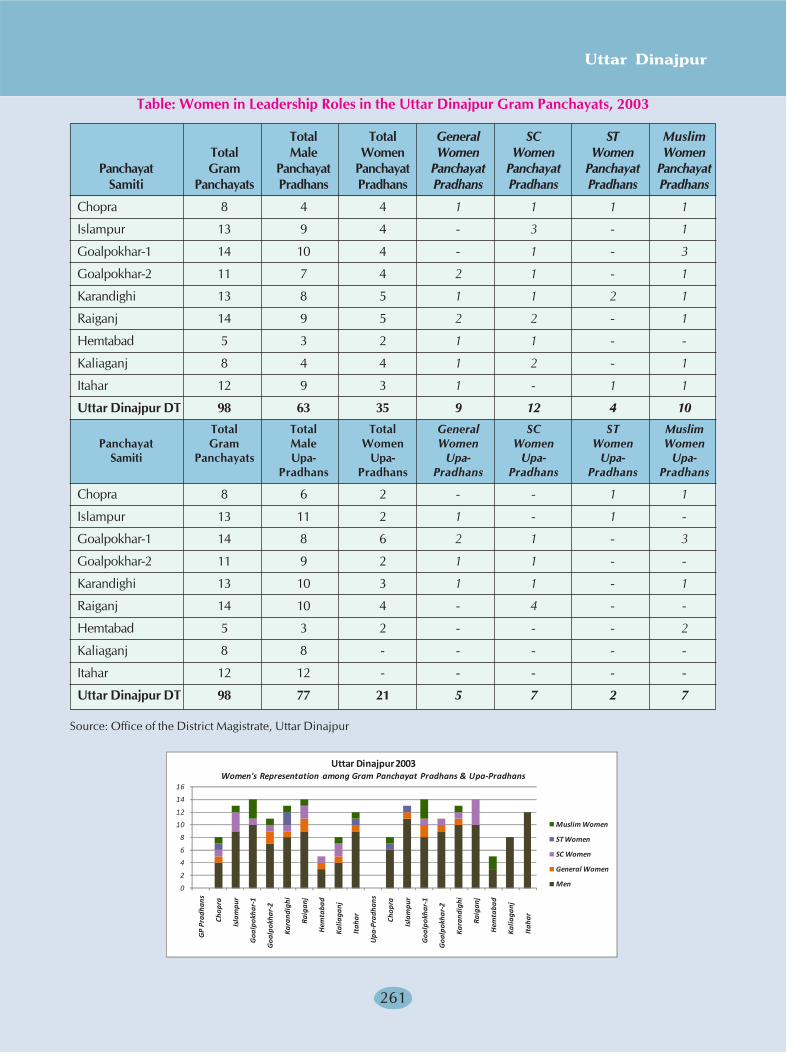
Uttar Dinajpur
261
Table: Women in Leadership Roles in the Uttar Dinajpur Gram Panchayats, 2003
Total Total General SC ST MuslimTotal Male Women Women Women Women Women
Panchayat Gram Panchayat Panchayat Panchayat Panchayat Panchayat PanchayatSamiti Panchayats Pradhans Pradhans Pradhans Pradhans Pradhans Pradhans
Chopra 8 4 4 1 1 1 1
Islampur 13 9 4 - 3 - 1
Goalpokhar-1 14 10 4 - 1 - 3
Goalpokhar-2 11 7 4 2 1 - 1
Karandighi 13 8 5 1 1 2 1
Raiganj 14 9 5 2 2 - 1
Hemtabad 5 3 2 1 1 - -
Kaliaganj 8 4 4 1 2 - 1
Itahar 12 9 3 1 - 1 1
Uttar Dinajpur DT 98 63 35 9 12 4 10
Total Total Total General SC ST MuslimPanchayat Gram Male Women Women Women Women Women
Samiti Panchayats Upa- Upa- Upa- Upa- Upa- Upa-Pradhans Pradhans Pradhans Pradhans Pradhans Pradhans
Chopra 8 6 2 - - 1 1
Islampur 13 11 2 1 - 1 -
Goalpokhar-1 14 8 6 2 1 - 3
Goalpokhar-2 11 9 2 1 1 - -
Karandighi 13 10 3 1 1 - 1
Raiganj 14 10 4 - 4 - -
Hemtabad 5 3 2 - - - 2
Kaliaganj 8 8 - - - - -
Itahar 12 12 - - - - -
Uttar Dinajpur DT 98 77 21 5 7 2 7
Source: Office of the District Magistrate, Uttar Dinajpur
0
2
4
6
8
10
12
14
16
GP
Prad
hans
Chop
ra
Isla
mpu
r
Goa
lpok
har-
1
Goa
lpok
har-
2
Kara
ndig
hi
Raig
anj
Hem
taba
d
Kalia
ganj
Itah
ar
Upa
-Pra
dhan
s
Chop
ra
Isla
mpu
r
Goa
lpok
har-
1
Goa
lpok
har-
2
Kara
ndig
hi
Raig
anj
Hem
taba
d
Kalia
ganj
Itah
ar
Muslim Women
ST Women
SC Women
General Women
Men
Uttar Dinajpur 2003Women's Representation among Gram Panchayat Pradhans & Upa-Pradhans
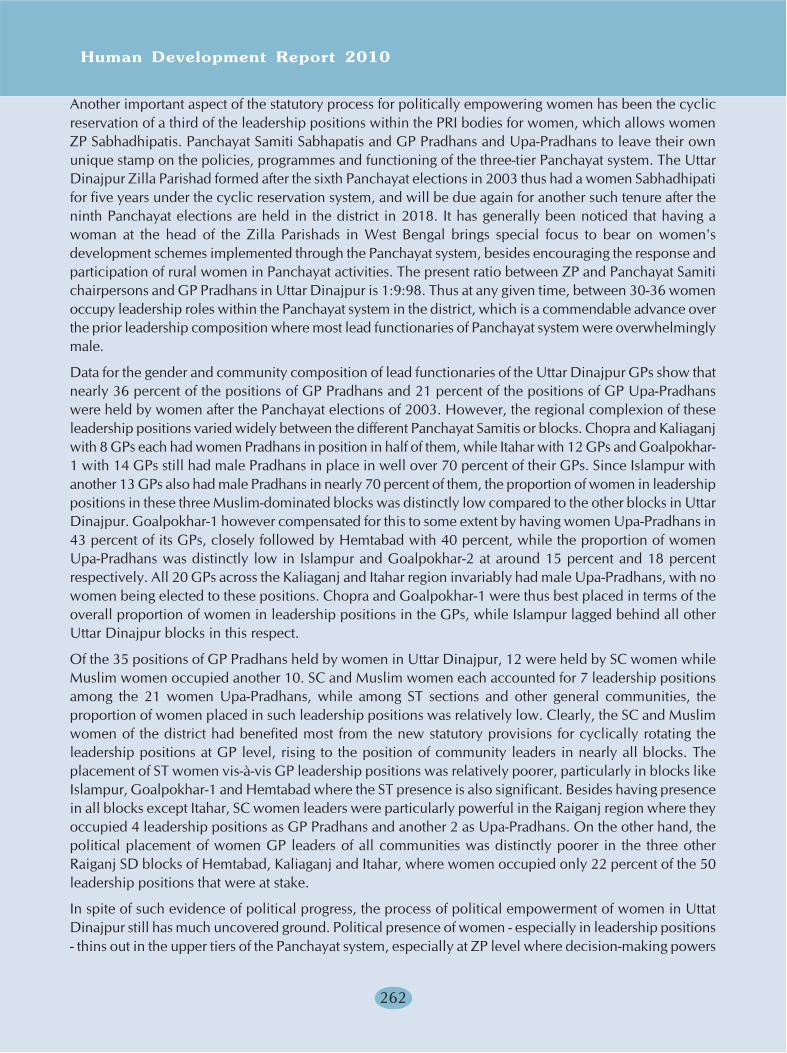
Human Development Report 2010
262
Another important aspect of the statutory process for politically empowering women has been the cyclicreservation of a third of the leadership positions within the PRI bodies for women, which allows womenZP Sabhadhipatis. Panchayat Samiti Sabhapatis and GP Pradhans and Upa-Pradhans to leave their ownunique stamp on the policies, programmes and functioning of the three-tier Panchayat system. The UttarDinajpur Zilla Parishad formed after the sixth Panchayat elections in 2003 thus had a women Sabhadhipatifor five years under the cyclic reservation system, and will be due again for another such tenure after theninth Panchayat elections are held in the district in 2018. It has generally been noticed that having awoman at the head of the Zilla Parishads in West Bengal brings special focus to bear on women'sdevelopment schemes implemented through the Panchayat system, besides encouraging the response andparticipation of rural women in Panchayat activities. The present ratio between ZP and Panchayat Samitichairpersons and GP Pradhans in Uttar Dinajpur is 1:9:98. Thus at any given time, between 30-36 womenoccupy leadership roles within the Panchayat system in the district, which is a commendable advance overthe prior leadership composition where most lead functionaries of Panchayat system were overwhelminglymale.
Data for the gender and community composition of lead functionaries of the Uttar Dinajpur GPs show thatnearly 36 percent of the positions of GP Pradhans and 21 percent of the positions of GP Upa-Pradhanswere held by women after the Panchayat elections of 2003. However, the regional complexion of theseleadership positions varied widely between the different Panchayat Samitis or blocks. Chopra and Kaliaganjwith 8 GPs each had women Pradhans in position in half of them, while Itahar with 12 GPs and Goalpokhar-1 with 14 GPs still had male Pradhans in place in well over 70 percent of their GPs. Since Islampur withanother 13 GPs also had male Pradhans in nearly 70 percent of them, the proportion of women in leadershippositions in these three Muslim-dominated blocks was distinctly low compared to the other blocks in UttarDinajpur. Goalpokhar-1 however compensated for this to some extent by having women Upa-Pradhans in43 percent of its GPs, closely followed by Hemtabad with 40 percent, while the proportion of womenUpa-Pradhans was distinctly low in Islampur and Goalpokhar-2 at around 15 percent and 18 percentrespectively. All 20 GPs across the Kaliaganj and Itahar region invariably had male Upa-Pradhans, with nowomen being elected to these positions. Chopra and Goalpokhar-1 were thus best placed in terms of theoverall proportion of women in leadership positions in the GPs, while Islampur lagged behind all otherUttar Dinajpur blocks in this respect.
Of the 35 positions of GP Pradhans held by women in Uttar Dinajpur, 12 were held by SC women whileMuslim women occupied another 10. SC and Muslim women each accounted for 7 leadership positionsamong the 21 women Upa-Pradhans, while among ST sections and other general communities, theproportion of women placed in such leadership positions was relatively low. Clearly, the SC and Muslimwomen of the district had benefited most from the new statutory provisions for cyclically rotating theleadership positions at GP level, rising to the position of community leaders in nearly all blocks. Theplacement of ST women vis-à-vis GP leadership positions was relatively poorer, particularly in blocks likeIslampur, Goalpokhar-1 and Hemtabad where the ST presence is also significant. Besides having presencein all blocks except Itahar, SC women leaders were particularly powerful in the Raiganj region where theyoccupied 4 leadership positions as GP Pradhans and another 2 as Upa-Pradhans. On the other hand, thepolitical placement of women GP leaders of all communities was distinctly poorer in the three otherRaiganj SD blocks of Hemtabad, Kaliaganj and Itahar, where women occupied only 22 percent of the 50leadership positions that were at stake.
In spite of such evidence of political progress, the process of political empowerment of women in UttatDinajpur still has much uncovered ground. Political presence of women - especially in leadership positions- thins out in the upper tiers of the Panchayat system, especially at ZP level where decision-making powers
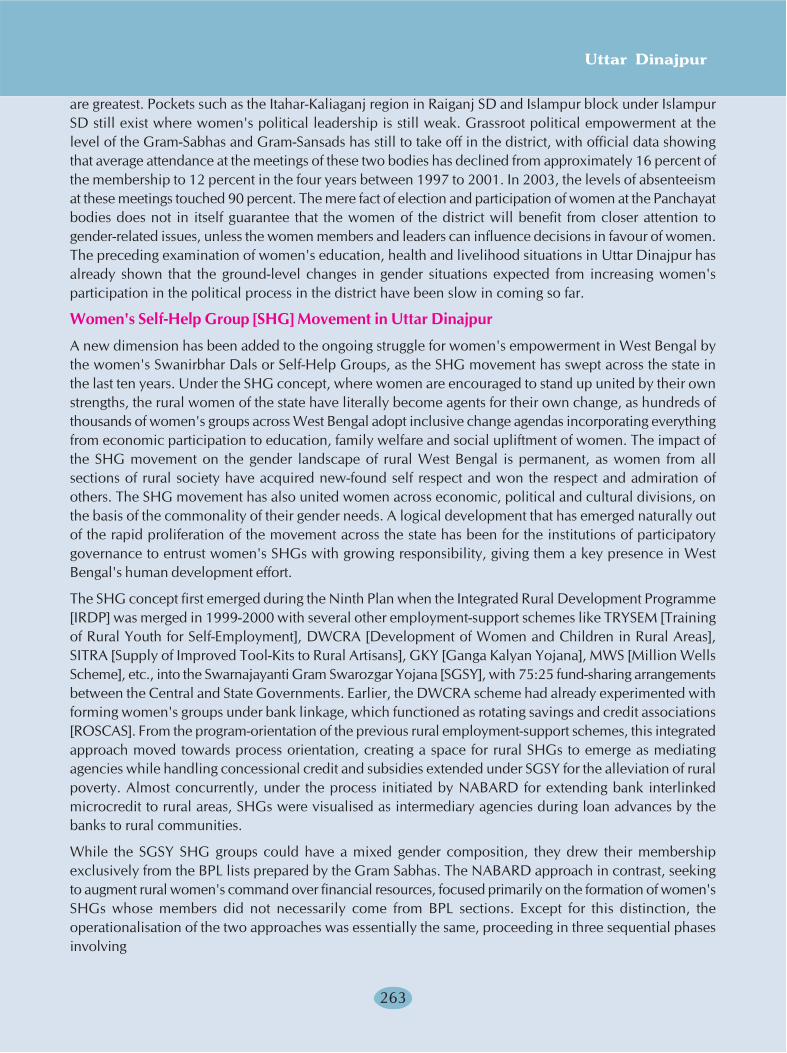
Uttar Dinajpur
263
are greatest. Pockets such as the Itahar-Kaliaganj region in Raiganj SD and Islampur block under IslampurSD still exist where women's political leadership is still weak. Grassroot political empowerment at thelevel of the Gram-Sabhas and Gram-Sansads has still to take off in the district, with official data showingthat average attendance at the meetings of these two bodies has declined from approximately 16 percent ofthe membership to 12 percent in the four years between 1997 to 2001. In 2003, the levels of absenteeismat these meetings touched 90 percent. The mere fact of election and participation of women at the Panchayatbodies does not in itself guarantee that the women of the district will benefit from closer attention togender-related issues, unless the women members and leaders can influence decisions in favour of women.The preceding examination of women's education, health and livelihood situations in Uttar Dinajpur hasalready shown that the ground-level changes in gender situations expected from increasing women'sparticipation in the political process in the district have been slow in coming so far.
Women's Self-Help Group [SHG] Movement in Uttar Dinajpur
A new dimension has been added to the ongoing struggle for women's empowerment in West Bengal bythe women's Swanirbhar Dals or Self-Help Groups, as the SHG movement has swept across the state inthe last ten years. Under the SHG concept, where women are encouraged to stand up united by their ownstrengths, the rural women of the state have literally become agents for their own change, as hundreds ofthousands of women's groups across West Bengal adopt inclusive change agendas incorporating everythingfrom economic participation to education, family welfare and social upliftment of women. The impact ofthe SHG movement on the gender landscape of rural West Bengal is permanent, as women from allsections of rural society have acquired new-found self respect and won the respect and admiration ofothers. The SHG movement has also united women across economic, political and cultural divisions, onthe basis of the commonality of their gender needs. A logical development that has emerged naturally outof the rapid proliferation of the movement across the state has been for the institutions of participatorygovernance to entrust women's SHGs with growing responsibility, giving them a key presence in WestBengal's human development effort.
The SHG concept first emerged during the Ninth Plan when the Integrated Rural Development Programme[IRDP] was merged in 1999-2000 with several other employment-support schemes like TRYSEM [Trainingof Rural Youth for Self-Employment], DWCRA [Development of Women and Children in Rural Areas],SITRA [Supply of Improved Tool-Kits to Rural Artisans], GKY [Ganga Kalyan Yojana], MWS [Million WellsScheme], etc., into the Swarnajayanti Gram Swarozgar Yojana [SGSY], with 75:25 fund-sharing arrangementsbetween the Central and State Governments. Earlier, the DWCRA scheme had already experimented withforming women's groups under bank linkage, which functioned as rotating savings and credit associations[ROSCAS]. From the program-orientation of the previous rural employment-support schemes, this integratedapproach moved towards process orientation, creating a space for rural SHGs to emerge as mediatingagencies while handling concessional credit and subsidies extended under SGSY for the alleviation of ruralpoverty. Almost concurrently, under the process initiated by NABARD for extending bank interlinkedmicrocredit to rural areas, SHGs were visualised as intermediary agencies during loan advances by thebanks to rural communities.
While the SGSY SHG groups could have a mixed gender composition, they drew their membershipexclusively from the BPL lists prepared by the Gram Sabhas. The NABARD approach in contrast, seekingto augment rural women's command over financial resources, focused primarily on the formation of women'sSHGs whose members did not necessarily come from BPL sections. Except for this distinction, theoperationalisation of the two approaches was essentially the same, proceeding in three sequential phasesinvolving
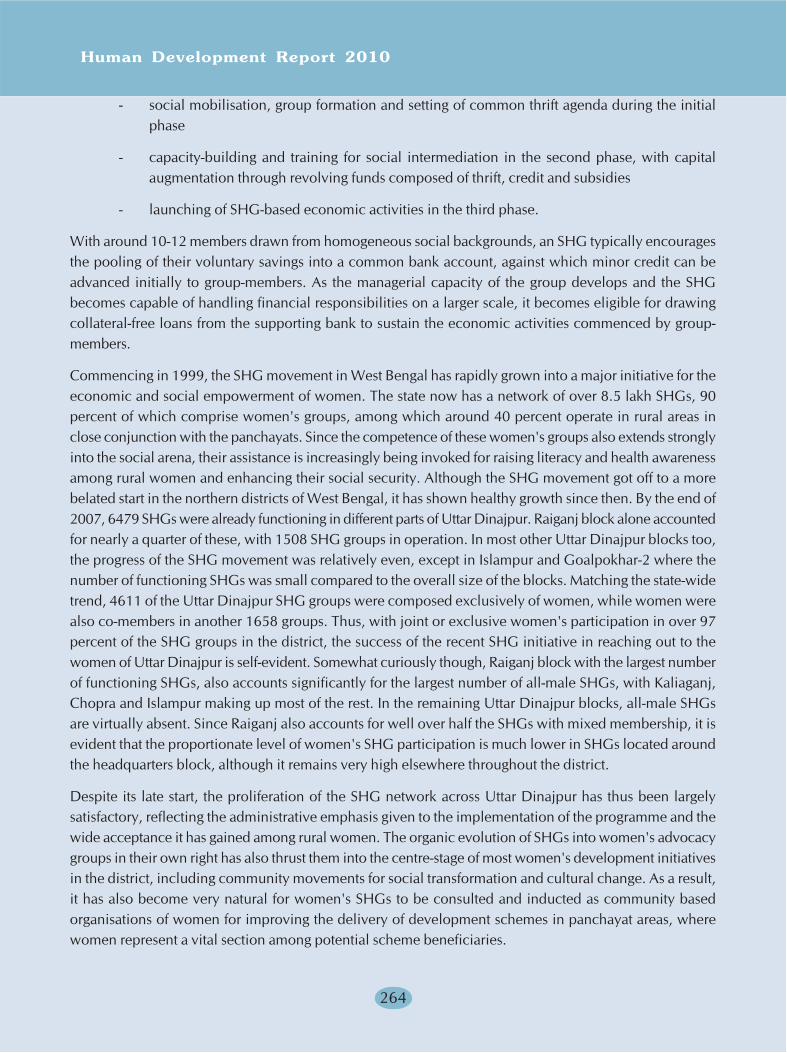
Human Development Report 2010
264
- social mobilisation, group formation and setting of common thrift agenda during the initialphase
- capacity-building and training for social intermediation in the second phase, with capitalaugmentation through revolving funds composed of thrift, credit and subsidies
- launching of SHG-based economic activities in the third phase.
With around 10-12 members drawn from homogeneous social backgrounds, an SHG typically encouragesthe pooling of their voluntary savings into a common bank account, against which minor credit can beadvanced initially to group-members. As the managerial capacity of the group develops and the SHGbecomes capable of handling financial responsibilities on a larger scale, it becomes eligible for drawingcollateral-free loans from the supporting bank to sustain the economic activities commenced by group-members.
Commencing in 1999, the SHG movement in West Bengal has rapidly grown into a major initiative for theeconomic and social empowerment of women. The state now has a network of over 8.5 lakh SHGs, 90percent of which comprise women's groups, among which around 40 percent operate in rural areas inclose conjunction with the panchayats. Since the competence of these women's groups also extends stronglyinto the social arena, their assistance is increasingly being invoked for raising literacy and health awarenessamong rural women and enhancing their social security. Although the SHG movement got off to a morebelated start in the northern districts of West Bengal, it has shown healthy growth since then. By the end of2007, 6479 SHGs were already functioning in different parts of Uttar Dinajpur. Raiganj block alone accountedfor nearly a quarter of these, with 1508 SHG groups in operation. In most other Uttar Dinajpur blocks too,the progress of the SHG movement was relatively even, except in Islampur and Goalpokhar-2 where thenumber of functioning SHGs was small compared to the overall size of the blocks. Matching the state-widetrend, 4611 of the Uttar Dinajpur SHG groups were composed exclusively of women, while women werealso co-members in another 1658 groups. Thus, with joint or exclusive women's participation in over 97percent of the SHG groups in the district, the success of the recent SHG initiative in reaching out to thewomen of Uttar Dinajpur is self-evident. Somewhat curiously though, Raiganj block with the largest numberof functioning SHGs, also accounts significantly for the largest number of all-male SHGs, with Kaliaganj,Chopra and Islampur making up most of the rest. In the remaining Uttar Dinajpur blocks, all-male SHGsare virtually absent. Since Raiganj also accounts for well over half the SHGs with mixed membership, it isevident that the proportionate level of women's SHG participation is much lower in SHGs located aroundthe headquarters block, although it remains very high elsewhere throughout the district.
Despite its late start, the proliferation of the SHG network across Uttar Dinajpur has thus been largelysatisfactory, reflecting the administrative emphasis given to the implementation of the programme and thewide acceptance it has gained among rural women. The organic evolution of SHGs into women's advocacygroups in their own right has also thrust them into the centre-stage of most women's development initiativesin the district, including community movements for social transformation and cultural change. As a result,it has also become very natural for women's SHGs to be consulted and inducted as community basedorganisations of women for improving the delivery of development schemes in panchayat areas, wherewomen represent a vital section among potential scheme beneficiaries.

Uttar Dinajpur
265
Table: Regional Spread of the SHG Network in Uttar Dinajpur District, 2007
Mixed % MixedTotal All- % All- Member- Member- All-Male % All-Male Ungra- %Ungra-
Woman Woman ship ship ded dedCD Block SHGs SHGs SHGs SHGs SHGs SHGs SHGs SHGs SHGs
Chopra 766 546 71.3 174 22.7 46 6.0 287 37.5
Islampur 579 489 84.5 66 11.4 24 4.1 340 58.7
Goalpokhar-1 679 531 78.2 142 20.9 6 0.9 369 54.3
Goalpokhar-2 320 264 82.5 45 14.1 11 3.4 175 54.7
Karandighi 801 643 80.3 158 19.7 0 0.0 378 47.2
Raiganj 1508 643 42.6 784 52.0 81 5.4 357 23.7
Hemtabad 305 266 87.2 39 12.8 0 0.0 85 27.9
Kaliaganj 819 657 80.2 120 14.7 42 5.1 277 33.8
Itahar 702 572 81.5 130 18.5 0 0.0 284 40.5
Uttar Dinajpur DT 6479 4611 71.2 1658 25.6 210 3.2 2552 39.4
Source: DRDA Cell, Office of the District Magistrate, Uttar Dinajpur
However, while all these add-on SHG functions result from the presence of these groups as grassrootsorganisations of rural women, the true purpose behind SHG formation has been the enlargement of women'seconomic roles on the self-help principle with support from new credit lines that specifically target thelaunching of enterprise activities by rural women. Thus the yardstick for measuring the successes andfailures of the SHG movement is the capacity attained by the SHG groups to initiate economic activities bytheir members based on bank-linked micro finance. In the three-phased process of SHG formation andcapacity development, the groups are graded at two points after their initial formation. SHGs that pass theGrade 1 assessment are trained specifically for financial and social intermediation in the second phase,while their capital sources are augmented through financial linkage with the supporting banks. Uponsuccessful completion of SHG capacity-building activities in the second phase, the groups go throughanother grading exercise. Those clearing the Grade 2 assessment are deemed eligible for full bank creditsupport amounting to a multiple of the capital they have already mobilised through their own collectivethrift and savings effort. The Grade 2 SHGs can subsequently launch full-scale economic activities with theparticipation of their members and the capital support pledged to them by the banking partners.
0200400600800
1000120014001600
Chop
ra
Isla
mpu
r
Goa
lpok
har-
1
Goa
lpok
har-
2
Kara
ndig
hi
Raig
anj
Hem
taba
d
Kalia
ganj
Itah
ar
All-Woman SHGs Mixed Member SHGs All-Male SHGs
SHG Group Formation in Uttar Dinajpur uptil 2007
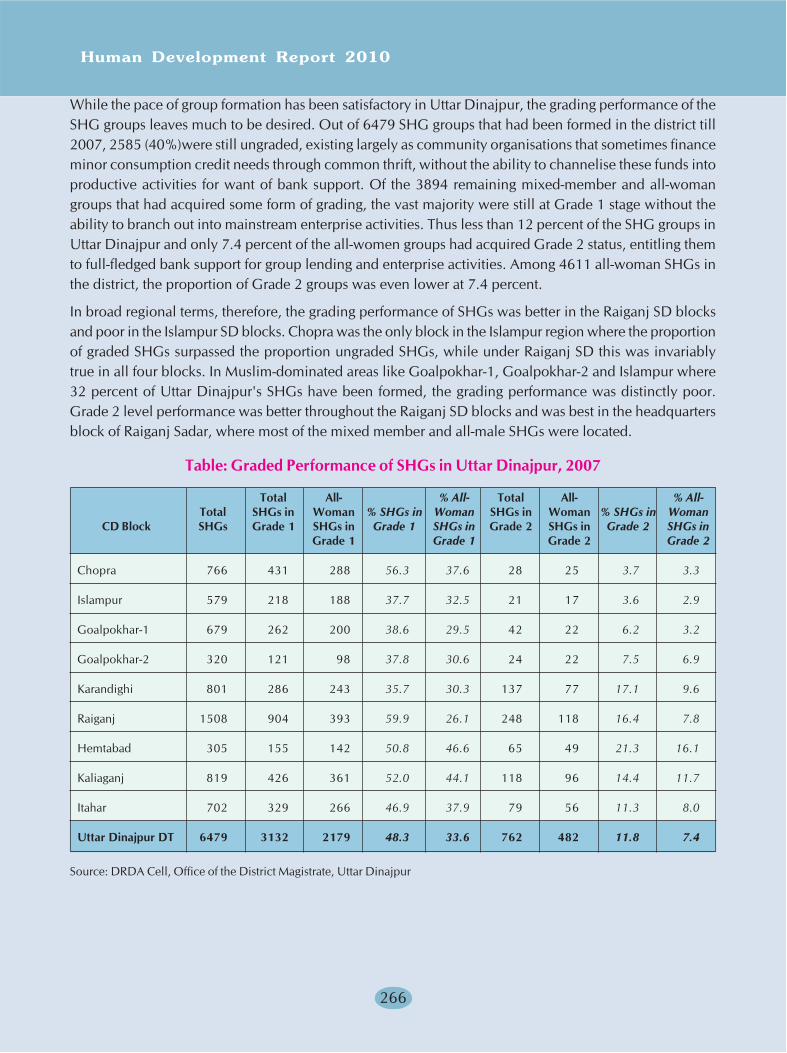
Human Development Report 2010
266
While the pace of group formation has been satisfactory in Uttar Dinajpur, the grading performance of theSHG groups leaves much to be desired. Out of 6479 SHG groups that had been formed in the district till2007, 2585 (40%)were still ungraded, existing largely as community organisations that sometimes financeminor consumption credit needs through common thrift, without the ability to channelise these funds intoproductive activities for want of bank support. Of the 3894 remaining mixed-member and all-womangroups that had acquired some form of grading, the vast majority were still at Grade 1 stage without theability to branch out into mainstream enterprise activities. Thus less than 12 percent of the SHG groups inUttar Dinajpur and only 7.4 percent of the all-women groups had acquired Grade 2 status, entitling themto full-fledged bank support for group lending and enterprise activities. Among 4611 all-woman SHGs inthe district, the proportion of Grade 2 groups was even lower at 7.4 percent.
In broad regional terms, therefore, the grading performance of SHGs was better in the Raiganj SD blocksand poor in the Islampur SD blocks. Chopra was the only block in the Islampur region where the proportionof graded SHGs surpassed the proportion ungraded SHGs, while under Raiganj SD this was invariablytrue in all four blocks. In Muslim-dominated areas like Goalpokhar-1, Goalpokhar-2 and Islampur where32 percent of Uttar Dinajpur's SHGs have been formed, the grading performance was distinctly poor.Grade 2 level performance was better throughout the Raiganj SD blocks and was best in the headquartersblock of Raiganj Sadar, where most of the mixed member and all-male SHGs were located.
Table: Graded Performance of SHGs in Uttar Dinajpur, 2007
Total All- % All- Total All- % All-Total SHGs in Woman % SHGs in Woman SHGs in Woman % SHGs in Woman
CD Block SHGs Grade 1 SHGs in Grade 1 SHGs in Grade 2 SHGs in Grade 2 SHGs inGrade 1 Grade 1 Grade 2 Grade 2
Chopra 766 431 288 56.3 37.6 28 25 3.7 3.3
Islampur 579 218 188 37.7 32.5 21 17 3.6 2.9
Goalpokhar-1 679 262 200 38.6 29.5 42 22 6.2 3.2
Goalpokhar-2 320 121 98 37.8 30.6 24 22 7.5 6.9
Karandighi 801 286 243 35.7 30.3 137 77 17.1 9.6
Raiganj 1508 904 393 59.9 26.1 248 118 16.4 7.8
Hemtabad 305 155 142 50.8 46.6 65 49 21.3 16.1
Kaliaganj 819 426 361 52.0 44.1 118 96 14.4 11.7
Itahar 702 329 266 46.9 37.9 79 56 11.3 8.0
Uttar Dinajpur DT 6479 3132 2179 48.3 33.6 762 482 11.8 7.4
Source: DRDA Cell, Office of the District Magistrate, Uttar Dinajpur
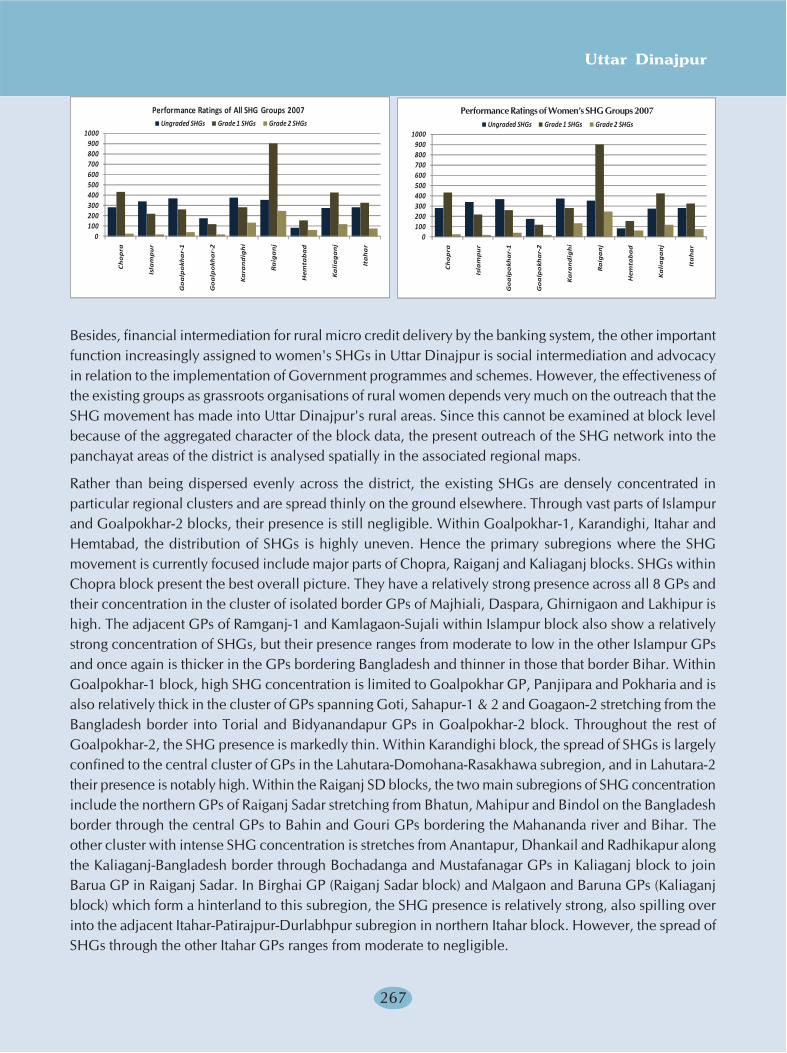
Uttar Dinajpur
267
Besides, financial intermediation for rural micro credit delivery by the banking system, the other importantfunction increasingly assigned to women's SHGs in Uttar Dinajpur is social intermediation and advocacyin relation to the implementation of Government programmes and schemes. However, the effectiveness ofthe existing groups as grassroots organisations of rural women depends very much on the outreach that theSHG movement has made into Uttar Dinajpur's rural areas. Since this cannot be examined at block levelbecause of the aggregated character of the block data, the present outreach of the SHG network into thepanchayat areas of the district is analysed spatially in the associated regional maps.
Rather than being dispersed evenly across the district, the existing SHGs are densely concentrated inparticular regional clusters and are spread thinly on the ground elsewhere. Through vast parts of Islampurand Goalpokhar-2 blocks, their presence is still negligible. Within Goalpokhar-1, Karandighi, Itahar andHemtabad, the distribution of SHGs is highly uneven. Hence the primary subregions where the SHGmovement is currently focused include major parts of Chopra, Raiganj and Kaliaganj blocks. SHGs withinChopra block present the best overall picture. They have a relatively strong presence across all 8 GPs andtheir concentration in the cluster of isolated border GPs of Majhiali, Daspara, Ghirnigaon and Lakhipur ishigh. The adjacent GPs of Ramganj-1 and Kamlagaon-Sujali within Islampur block also show a relativelystrong concentration of SHGs, but their presence ranges from moderate to low in the other Islampur GPsand once again is thicker in the GPs bordering Bangladesh and thinner in those that border Bihar. WithinGoalpokhar-1 block, high SHG concentration is limited to Goalpokhar GP, Panjipara and Pokharia and isalso relatively thick in the cluster of GPs spanning Goti, Sahapur-1 & 2 and Goagaon-2 stretching from theBangladesh border into Torial and Bidyanandapur GPs in Goalpokhar-2 block. Throughout the rest ofGoalpokhar-2, the SHG presence is markedly thin. Within Karandighi block, the spread of SHGs is largelyconfined to the central cluster of GPs in the Lahutara-Domohana-Rasakhawa subregion, and in Lahutara-2their presence is notably high. Within the Raiganj SD blocks, the two main subregions of SHG concentrationinclude the northern GPs of Raiganj Sadar stretching from Bhatun, Mahipur and Bindol on the Bangladeshborder through the central GPs to Bahin and Gouri GPs bordering the Mahananda river and Bihar. Theother cluster with intense SHG concentration is stretches from Anantapur, Dhankail and Radhikapur alongthe Kaliaganj-Bangladesh border through Bochadanga and Mustafanagar GPs in Kaliaganj block to joinBarua GP in Raiganj Sadar. In Birghai GP (Raiganj Sadar block) and Malgaon and Baruna GPs (Kaliaganjblock) which form a hinterland to this subregion, the SHG presence is relatively strong, also spilling overinto the adjacent Itahar-Patirajpur-Durlabhpur subregion in northern Itahar block. However, the spread ofSHGs through the other Itahar GPs ranges from moderate to negligible.
0100200300400500600700800900
1000
Ch
op
ra
Isla
mp
ur
Go
alp
okh
ar-
1
Go
alp
okh
ar-
2
Ka
ran
dig
hi
Ra
iga
nj
Hem
tab
ad
Ka
lia
ga
nj
Ita
ha
r
Ungraded SHGs Grade 1 SHGs Grade 2 SHGs
Performance Ratings of All SHG Groups 2007
0100200300400500600700800900
1000
Ch
op
ra
Isla
mp
ur
Go
alp
okh
ar-
1
Go
alp
okh
ar-
2
Ka
ran
dig
hi
Ra
iga
nj
Hem
tab
ad
Ka
lia
ga
nj
Ita
ha
r
Ungraded SHGs Grade 1 SHGs Grade 2 SHGs
Performance Ratings of All SHG Groups 2007Performance Ratings of Women’s SHG Groups 2007
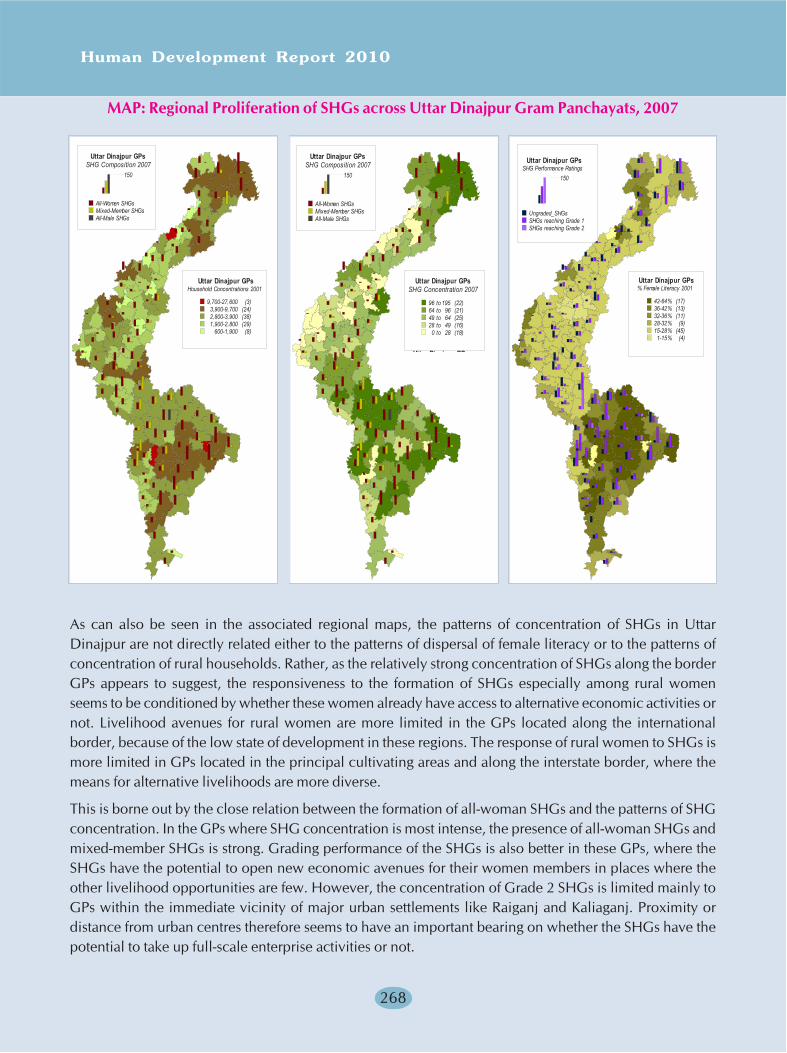
Human Development Report 2010
268
MAP: Regional Proliferation of SHGs across Uttar Dinajpur Gram Panchayats, 2007
As can also be seen in the associated regional maps, the patterns of concentration of SHGs in UttarDinajpur are not directly related either to the patterns of dispersal of female literacy or to the patterns ofconcentration of rural households. Rather, as the relatively strong concentration of SHGs along the borderGPs appears to suggest, the responsiveness to the formation of SHGs especially among rural womenseems to be conditioned by whether these women already have access to alternative economic activities ornot. Livelihood avenues for rural women are more limited in the GPs located along the internationalborder, because of the low state of development in these regions. The response of rural women to SHGs ismore limited in GPs located in the principal cultivating areas and along the interstate border, where themeans for alternative livelihoods are more diverse.
This is borne out by the close relation between the formation of all-woman SHGs and the patterns of SHGconcentration. In the GPs where SHG concentration is most intense, the presence of all-woman SHGs andmixed-member SHGs is strong. Grading performance of the SHGs is also better in these GPs, where theSHGs have the potential to open new economic avenues for their women members in places where theother livelihood opportunities are few. However, the concentration of Grade 2 SHGs is limited mainly toGPs within the immediate vicinity of major urban settlements like Raiganj and Kaliaganj. Proximity ordistance from urban centres therefore seems to have an important bearing on whether the SHGs have thepotential to take up full-scale enterprise activities or not.
Utt Di j GP
Uttar Dinajpur GPsHousehold Concentrations 2001
9,700-27,600 (3)3,900-9,700 (24)2,800-3,900 (38)1,900-2,800 (29)
600-1,900 (8)
Uttar Dinajpur GPsSHG Composition 2007
150
All-Women SHGsMixed-Member SHGsAll-Male SHGs
Uttar Dinajpur GPsSHG Composition 2007
150
All-Women SHGsMixed-Member SHGsAll-Male SHGs
Uttar Dinajp r GPs
Uttar Dinajpur GPsSHG Concentration 2007
96 to 195 (22)64 to 96 (21)49 to 64 (25)28 to 49 (16)0 to 28 (18)
Uttar Dinajpur GPs% Female Literacy 2001
42-64% (17)36-42% (13)32-36% (11)28-32% (9)15-28% (45)1-15% (4)
Uttar Dinajpur GPsSHG Performance Ratings
150
Ungraded_SHGsSHGs reaching Grade 1SHGs reaching Grade 2
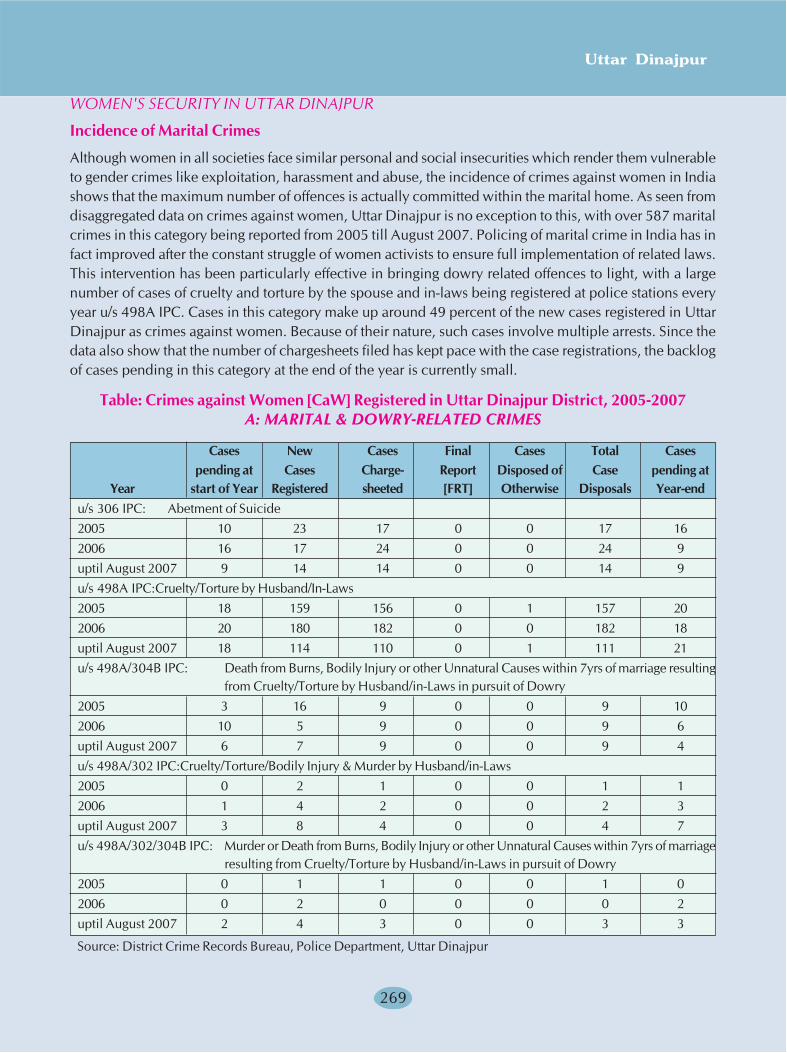
Uttar Dinajpur
269
WOMEN'S SECURITY IN UTTAR DINAJPUR
Incidence of Marital Crimes
Although women in all societies face similar personal and social insecurities which render them vulnerableto gender crimes like exploitation, harassment and abuse, the incidence of crimes against women in Indiashows that the maximum number of offences is actually committed within the marital home. As seen fromdisaggregated data on crimes against women, Uttar Dinajpur is no exception to this, with over 587 maritalcrimes in this category being reported from 2005 till August 2007. Policing of marital crime in India has infact improved after the constant struggle of women activists to ensure full implementation of related laws.This intervention has been particularly effective in bringing dowry related offences to light, with a largenumber of cases of cruelty and torture by the spouse and in-laws being registered at police stations everyyear u/s 498A IPC. Cases in this category make up around 49 percent of the new cases registered in UttarDinajpur as crimes against women. Because of their nature, such cases involve multiple arrests. Since thedata also show that the number of chargesheets filed has kept pace with the case registrations, the backlogof cases pending in this category at the end of the year is currently small.
Table: Crimes against Women [CaW] Registered in Uttar Dinajpur District, 2005-2007A: MARITAL & DOWRY-RELATED CRIMES
Cases New Cases Final Cases Total Casespending at Cases Charge- Report Disposed of Case pending at
Year start of Year Registered sheeted [FRT] Otherwise Disposals Year-endu/s 306 IPC: Abetment of Suicide2005 10 23 17 0 0 17 162006 16 17 24 0 0 24 9uptil August 2007 9 14 14 0 0 14 9u/s 498A IPC:Cruelty/Torture by Husband/In-Laws2005 18 159 156 0 1 157 202006 20 180 182 0 0 182 18uptil August 2007 18 114 110 0 1 111 21u/s 498A/304B IPC: Death from Burns, Bodily Injury or other Unnatural Causes within 7yrs of marriage resulting
from Cruelty/Torture by Husband/in-Laws in pursuit of Dowry2005 3 16 9 0 0 9 102006 10 5 9 0 0 9 6uptil August 2007 6 7 9 0 0 9 4u/s 498A/302 IPC:Cruelty/Torture/Bodily Injury & Murder by Husband/in-Laws2005 0 2 1 0 0 1 12006 1 4 2 0 0 2 3uptil August 2007 3 8 4 0 0 4 7u/s 498A/302/304B IPC: Murder or Death from Burns, Bodily Injury or other Unnatural Causes within 7yrs of marriage
resulting from Cruelty/Torture by Husband/in-Laws in pursuit of Dowry2005 0 1 1 0 0 1 02006 0 2 0 0 0 0 2uptil August 2007 2 4 3 0 0 3 3
Source: District Crime Records Bureau, Police Department, Uttar Dinajpur
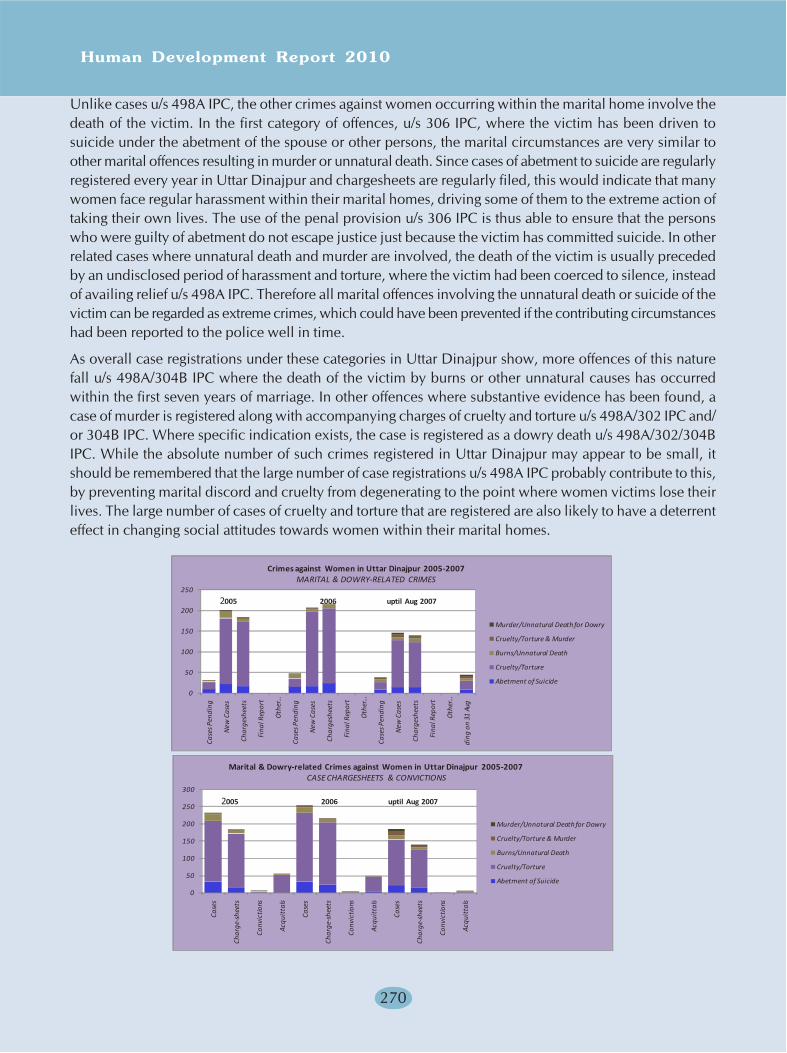
Human Development Report 2010
270
Unlike cases u/s 498A IPC, the other crimes against women occurring within the marital home involve thedeath of the victim. In the first category of offences, u/s 306 IPC, where the victim has been driven tosuicide under the abetment of the spouse or other persons, the marital circumstances are very similar toother marital offences resulting in murder or unnatural death. Since cases of abetment to suicide are regularlyregistered every year in Uttar Dinajpur and chargesheets are regularly filed, this would indicate that manywomen face regular harassment within their marital homes, driving some of them to the extreme action oftaking their own lives. The use of the penal provision u/s 306 IPC is thus able to ensure that the personswho were guilty of abetment do not escape justice just because the victim has committed suicide. In otherrelated cases where unnatural death and murder are involved, the death of the victim is usually precededby an undisclosed period of harassment and torture, where the victim had been coerced to silence, insteadof availing relief u/s 498A IPC. Therefore all marital offences involving the unnatural death or suicide of thevictim can be regarded as extreme crimes, which could have been prevented if the contributing circumstanceshad been reported to the police well in time.
As overall case registrations under these categories in Uttar Dinajpur show, more offences of this naturefall u/s 498A/304B IPC where the death of the victim by burns or other unnatural causes has occurredwithin the first seven years of marriage. In other offences where substantive evidence has been found, acase of murder is registered along with accompanying charges of cruelty and torture u/s 498A/302 IPC and/or 304B IPC. Where specific indication exists, the case is registered as a dowry death u/s 498A/302/304BIPC. While the absolute number of such crimes registered in Uttar Dinajpur may appear to be small, itshould be remembered that the large number of case registrations u/s 498A IPC probably contribute to this,by preventing marital discord and cruelty from degenerating to the point where women victims lose theirlives. The large number of cases of cruelty and torture that are registered are also likely to have a deterrenteffect in changing social attitudes towards women within their marital homes.
0
50
100
150
200
250
Case
s Pen
ding
New
Cas
es
Char
gesh
eets
Fina
l Rep
ort
Oth
er …
Case
s Pen
ding
New
Cas
es
Char
gesh
eets
Fina
l Rep
ort
Oth
er …
Case
s Pen
ding
New
Cas
es
Char
gesh
eets
Fina
l Rep
ort
Oth
er …
ding
on
31 A
ug
Murder/Unnatural Death for Dowry
Cruelty/Torture & Murder
Burns/Unnatural Death
Cruelty/Torture
Abetment of Suicide
2005 2006 uptil Aug 2007
Crimes against Women in Uttar Dinajpur 2005-2007MARITAL & DOWRY-RELATED CRIMES
0
50
100
150
200
250
300
Case
s
Char
ge-s
heet
s
Conv
ictio
ns
Acqu
itta
ls
Case
s
Char
ge-s
heet
s
Conv
ictio
ns
Acqu
itta
ls
Case
s
Char
ge-s
heet
s
Conv
ictio
ns
Acqu
itta
ls
Murder/Unnatural Death for Dowry
Cruelty/Torture & Murder
Burns/Unnatural Death
Cruelty/Torture
Abetment of Suicide
Marital & Dowry-related Crimes against Women in Uttar Dinajpur 2005-2007CASE CHARGESHEETS & CONVICTIONS
2005 2006 uptil Aug 2007
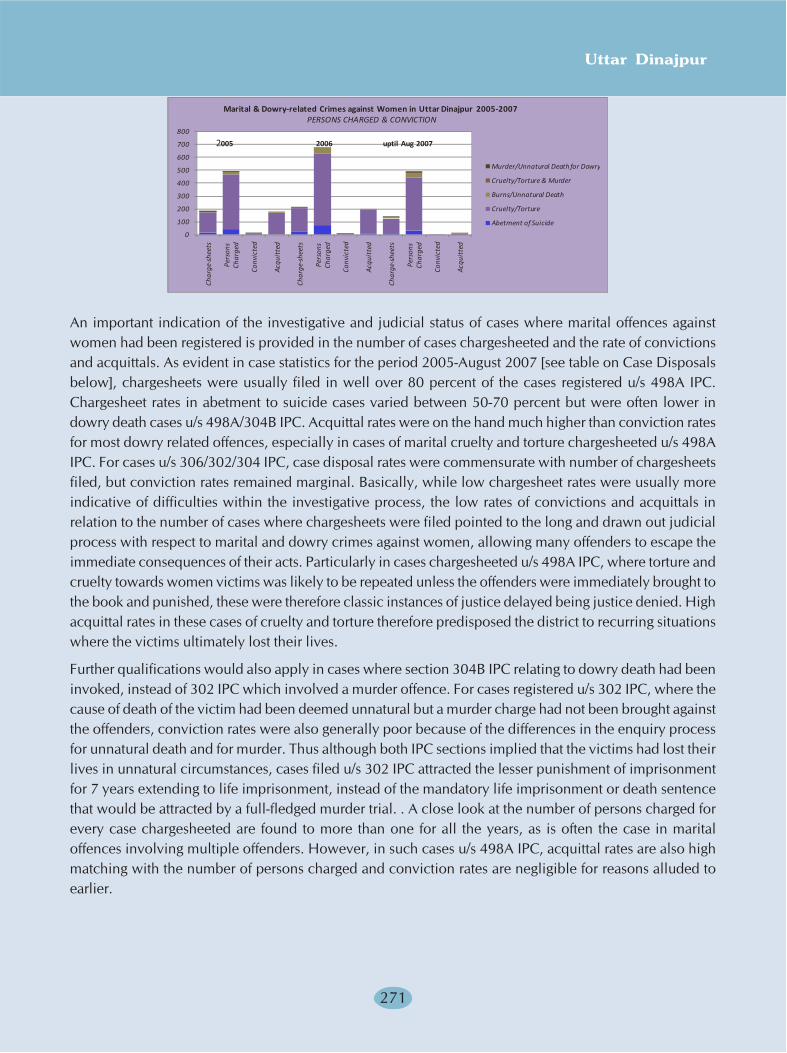
Uttar Dinajpur
271
0
100
200
300
400
500
600
700
800
Char
ge-s
heet
s
Pers
ons
Char
ged
Conv
icte
d
Acqu
itte
d
Char
ge-s
heet
s
Pers
ons
Char
ged
Conv
icte
d
Acqu
itte
d
Char
ge-s
heet
s
Pers
ons
Char
ged
Conv
icte
d
Acqu
itte
d
Murder/Unnatural Death for Dowry
Cruelty/Torture & Murder
Burns/Unnatural Death
Cruelty/Torture
Abetment of Suicide
Marital & Dowry-related Crimes against Women in Uttar Dinajpur 2005-2007PERSONS CHARGED & CONVICTION
2005 2006 uptil Aug 2007
An important indication of the investigative and judicial status of cases where marital offences againstwomen had been registered is provided in the number of cases chargesheeted and the rate of convictionsand acquittals. As evident in case statistics for the period 2005-August 2007 [see table on Case Disposalsbelow], chargesheets were usually filed in well over 80 percent of the cases registered u/s 498A IPC.Chargesheet rates in abetment to suicide cases varied between 50-70 percent but were often lower indowry death cases u/s 498A/304B IPC. Acquittal rates were on the hand much higher than conviction ratesfor most dowry related offences, especially in cases of marital cruelty and torture chargesheeted u/s 498AIPC. For cases u/s 306/302/304 IPC, case disposal rates were commensurate with number of chargesheetsfiled, but conviction rates remained marginal. Basically, while low chargesheet rates were usually moreindicative of difficulties within the investigative process, the low rates of convictions and acquittals inrelation to the number of cases where chargesheets were filed pointed to the long and drawn out judicialprocess with respect to marital and dowry crimes against women, allowing many offenders to escape theimmediate consequences of their acts. Particularly in cases chargesheeted u/s 498A IPC, where torture andcruelty towards women victims was likely to be repeated unless the offenders were immediately brought tothe book and punished, these were therefore classic instances of justice delayed being justice denied. Highacquittal rates in these cases of cruelty and torture therefore predisposed the district to recurring situationswhere the victims ultimately lost their lives.
Further qualifications would also apply in cases where section 304B IPC relating to dowry death had beeninvoked, instead of 302 IPC which involved a murder offence. For cases registered u/s 302 IPC, where thecause of death of the victim had been deemed unnatural but a murder charge had not been brought againstthe offenders, conviction rates were also generally poor because of the differences in the enquiry processfor unnatural death and for murder. Thus although both IPC sections implied that the victims had lost theirlives in unnatural circumstances, cases filed u/s 302 IPC attracted the lesser punishment of imprisonmentfor 7 years extending to life imprisonment, instead of the mandatory life imprisonment or death sentencethat would be attracted by a full-fledged murder trial. . A close look at the number of persons charged forevery case chargesheeted are found to more than one for all the years, as is often the case in maritaloffences involving multiple offenders. However, in such cases u/s 498A IPC, acquittal rates are also highmatching with the number of persons charged and conviction rates are negligible for reasons alluded toearlier.

Human Development Report 2010
272
BOX - TEXT
DOWRY DEATH IN UTTAR DINAJPUR
The institution of dowry has long been identified as a key instrument for the progressive oppression ofwomen in India. The pressure on families to the secure marital prospects of their daughters with ampledowry payments makes girls appear burdensome and unwanted. So long as the dowry represented a giftgiven voluntarily by parents to daughters who were starting a new home, it did not constitute a socialproblem. But as the practice in present-day society has evolved into a means of accumulation for thosefavoured with eligible sons, dowry demands are pushed to the limits of the financial capability of thegirls' parents and assume a menacing dimension.
Although urbanisation is still a rare feature in Uttar Dinajpur and the district has a largely rural complexion,dowry related crimes show a rising trend and occur with regularity in both towns and village areas. Nocommunity group is now immune to such offences, including ST sections among whom dowry was nottraditionally practised. Between 2003 and 2005, 359 dowry related cases were registered in UttarDinajpur district, representing around 16 percent of the total dowry cases registered in the six NorthBengal districts. In 85 cases, the offences had resulted in the death of the victim, with 49 women beingdriven into taking their own lives and 36 others being done away with by their husbands and in-laws.
Table: Dowry-related Police Cases Registered in Uttar Dinajpur & North Bengal, 2003-2005
2003 2004 2005 2003 2004 2005
Cases u/s 498A IPC: Cruelty/Torture by Husband/In-Laws % to North Bengal Cases u/s 498A IPC
Uttar Dinajpur 64 148 62 9.6 20.6 16.5
North Bengal Region 665 719 376
Cases u/s 498A/306 IPC: Cruelty/Torture & Abetment % to North Bengal Cases u/s 498A/306 IPCto Suicide
Uttar Dinajpur 21 21 7 15.0 11.3 13.2
North Bengal Region 140 186 53
Cases u/s 498A/302 IPC: Cruelty & Murder by % to North Bengal Cases u/s 498A/302 IPCHusband/in-Laws
Uttar Dinajpur 2 - - 15.4 - -
North Bengal Region 13 30 11
Cases u/s 304B IPC: Dowry Death % to North Bengal Cases u/s 304B IPC
Uttar Dinajpur 14 9 10 31.8 25.7 41.7
North Bengal Region 44 35 24
Cases u/s 498A/304 IPC: Cruelty & Dowry Death % to North Bengal Cases u/s 498A/304 IPC
Uttar Dinajpur - - 1 - - 100.0
North Bengal Region 6 5 1
Total Dowry-related Cases % to North Bengal Dowry-related Cases
Uttar Dinajpur 101 178 80 11.6 18.3 17.2
North Bengal Region 868 975 465
Source: State Crime Records Bureau, Police Department, West Bengal

Uttar Dinajpur
273
Analysing dowry crime figures for Uttar Dinajpur in terms of the scale of the offences committed, theregistration of cases u/s 498A IPC involving cruelty and torture by in-laws was generally much lower inproportion to the North Bengal total than the incidence of suspected dowry deaths u/s 304B IPC, whichexceeded 31 percent of the North Bengal cases in 2003 and 41 percent in 2005. Terminal crimes u/s306/302/304B IPC that lead to loss of life by the victim either by her own hand or through the action ofothers occur at the end of a chain of offences involving cruelty and injury, which if registered as cases atthat early stage would probably have preserved the lives of the victims. The high proportion of crimesregistered u/s 304B IPC in Uttar Dinajpur, when compared to North Bengal as a whole, would implythat women in the district are much more vulnerable to terminal marital crimes than elsewhere withinthe North Bengal region.
Table: Case Registrations & Arrests for Marital Offences in Uttar Dinajpur& North Bengal, 2003-2005
Cruelty/Torture Abetment Cruelty/Torture Dowry Death Cruelty/Torture/u/s 498A IPC to Suicide /Death u/s 304 IPC Murder
u/s 498A u/s 498A/ u/s 498A/
/306 IPC 304 IPC 302 IPC
District/Region/Year Cases Arrests Cases Arrests Cases Arrests Cases Arrests Cases Arrests
Uttar Dinajpur
2003 62 60 7 10 1 2 10 15 0 0
2004 148 213 21 30 0 0 9 13 0 0
2005 64 93 21 30 0 0 14 29 2 3
North Bengal Region
2003 470 609 53 111 1 2 24 43 11 23
2004 948 1442 186 333 5 9 35 60 30 58
2005 665 1101 140 279 6 11 44 107 13 22
AVERAGE GAP IN DAYS BETWEEN
District/Region/Year Cases Arrests Cases Arrests Cases Arrests Cases Arrests Cases Arrests
Uttar Dinajpur 4.0 3.0 22.3 15.6 1095.0 547.5 33.2 19.2 547.5 365.0
North Bengal 0.5 0.3 2.9 1.5 91.3 49.8 10.6 5.2 20.3 10.6
Source: State Crime Records Bureau, Police Department, West Bengal
Three-year averages from case registration and arrest records available at the State Crime Records Bureau[SCRB] for the period 2003-2005 suggest that one case u/s 498A involving marital cruelty and torture isregistered every 4 days in Uttar Dinajpur and that an arrest relating to the case is made once very 3 days.The difference of averages obviously arises because cruelty offences u/s 498A IPC are usually multi-person crimes involving more than one perpetrator. Since the North Bengal regional averages for casesand arrests serve to benchmark the averages for Uttar Dinajpur, it can be seen that the frequency of caseregistrations and arrests for cruelty and abetment to suicide u/s 498A/306 IPC and dowry deaths u/s 304IPC is also relatively high in Uttar Dinajpur. Conversely, the frequency of case registrations and arrestsin Uttar Dinajpur in cases u/s 498A/302 IPC and 498A/304 IPC is low and the average gap betweensuccessive case registrations and arrests is accordingly high in the district. However with 85 womenlosing their lives in the district over the 3-year period, from marital crimes involving suicide, extremetorture, unnatural deaths and murder, it appears on the average that one woman's life is lost every 13days from marital crimes in Uttar Dinajpur, and that an arrest in this connection is made every 8 days.
Human Development Report 2010
274
Crimes against a Woman's Person
Gender vulnerability of women is most apparent in cases of crimes committed on the women's person.Sexual harassment, molestation, rape, and rape accompanied by murder are all sexual crimes which directlyassault the dignity of women. In that sense, these are also power crimes that perpetuate male power andsubjugate women as a gender, under the threat of physical and sexual harm. While women face similarsocial insecurities in all countries and societies, the level of sexual violence inflicted on them is determinedby prevailing norms and legal conventions within their family and their social environment, so that thelevel of violence tolerated within one culture may be rejected by the next. Often, during a process ofhuman development when one set of cultural norms is being replaced by another, resistance by the sectionsof the community where social power is entrenched often takes the form of direct violence against women.Thus women invariably pay an unnecessarily high personal price in situations where the dominance andmuscle of entrenched castes and communities is being challenged through economic and socio-politicalstruggles. Rape can thus become a crime of domination and political violence, in addition to being a sexualcrime. Similarly, sexual harassment and molestation may turn into acts of pure predation by dominantmales and anti-socials, that are used for curbing the freedoms that women have earned through theirpersonal accomplishments such as intelligence and education. The incidence of offences against the women'sperson in Uttar Dinajpur district may also be examined in this light.
All sexual crimes subject their woman victims to direct bodily abuse and harm, but also have a criticallongterm impact on the mental health of the victims as well. In many cases, the potential offenders mayturn out to be next of kin or neighbours or acquaintances. In others, the woman victim may be caught off-guard and overpowered by the offender, taking advantage of the victim's defencelessness and biologicalweakness. Sexual harassment and molestation often go unreported in most societies for want of courageand family support on the part of the victim or out of the fear of social stigma. In Uttar Dinajpur, the factthat only one case involving sexual harassment was registered with the police between 2005-August 2007points to the gross under-reporting of such crimes. On the other hand, the number of molestation casesregistered was strikingly high and the rate at which chargesheets were filed in these cases was almostcommensurate, as a result of which the backlog of cases pending investigation at the end of each year wassmall. While identifiable factors such as social and cultural change, accompanied by the increasing movementof women from protected home environments into insecure workplaces and congregations may lie behindthe relatively high incidence of molestation cases, this can also be attributable to improved police reporting,increased awareness of legal rights and protections, and attitudinal change within society that increases theregistration of cases at the police stations, thereby improving the chances of redress. Either way, the incidenceof case registrations, chargesheets and police investigations indicate a dynamically changing milieu withinthe district, where gender issues are gradually being propelled into prominence.
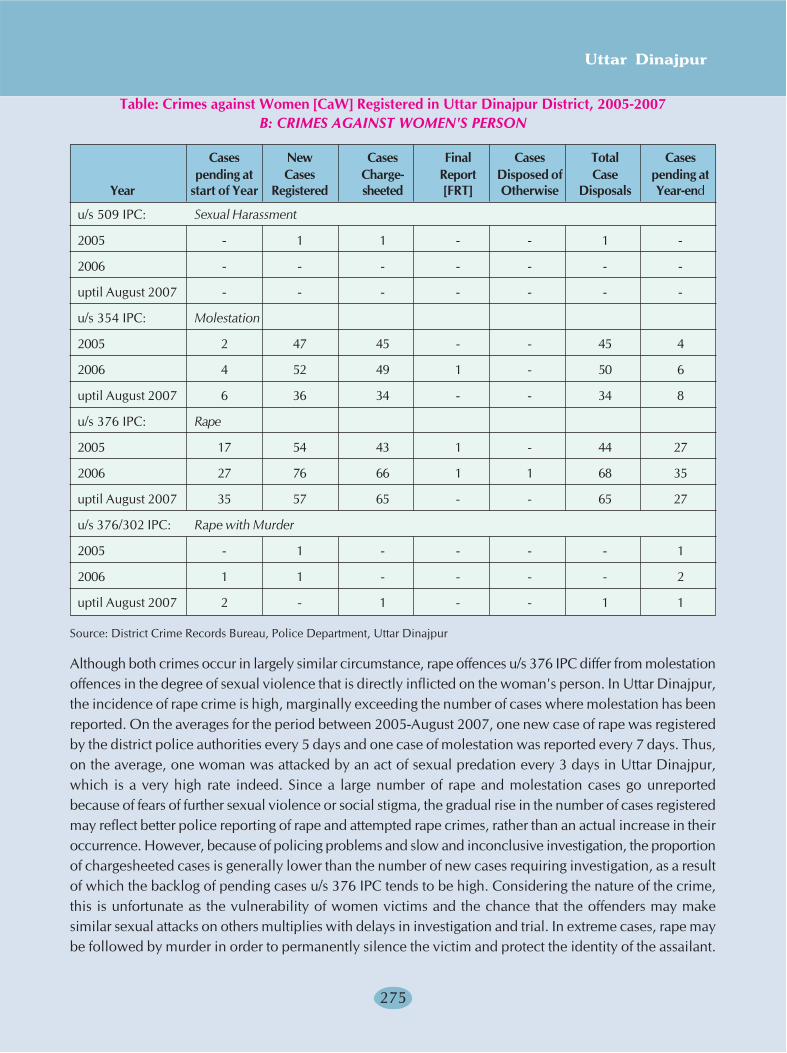
Uttar Dinajpur
275
Table: Crimes against Women [CaW] Registered in Uttar Dinajpur District, 2005-2007B: CRIMES AGAINST WOMEN'S PERSON
Cases New Cases Final Cases Total Casespending at Cases Charge- Report Disposed of Case pending at
Year start of Year Registered sheeted [FRT] Otherwise Disposals Year-end
u/s 509 IPC: Sexual Harassment
2005 - 1 1 - - 1 -
2006 - - - - - - -
uptil August 2007 - - - - - - -
u/s 354 IPC: Molestation
2005 2 47 45 - - 45 4
2006 4 52 49 1 - 50 6
uptil August 2007 6 36 34 - - 34 8
u/s 376 IPC: Rape
2005 17 54 43 1 - 44 27
2006 27 76 66 1 1 68 35
uptil August 2007 35 57 65 - - 65 27
u/s 376/302 IPC: Rape with Murder
2005 - 1 - - - - 1
2006 1 1 - - - - 2
uptil August 2007 2 - 1 - - 1 1
Source: District Crime Records Bureau, Police Department, Uttar Dinajpur
Although both crimes occur in largely similar circumstance, rape offences u/s 376 IPC differ from molestationoffences in the degree of sexual violence that is directly inflicted on the woman's person. In Uttar Dinajpur,the incidence of rape crime is high, marginally exceeding the number of cases where molestation has beenreported. On the averages for the period between 2005-August 2007, one new case of rape was registeredby the district police authorities every 5 days and one case of molestation was reported every 7 days. Thus,on the average, one woman was attacked by an act of sexual predation every 3 days in Uttar Dinajpur,which is a very high rate indeed. Since a large number of rape and molestation cases go unreportedbecause of fears of further sexual violence or social stigma, the gradual rise in the number of cases registeredmay reflect better police reporting of rape and attempted rape crimes, rather than an actual increase in theiroccurrence. However, because of policing problems and slow and inconclusive investigation, the proportionof chargesheeted cases is generally lower than the number of new cases requiring investigation, as a resultof which the backlog of pending cases u/s 376 IPC tends to be high. Considering the nature of the crime,this is unfortunate as the vulnerability of women victims and the chance that the offenders may makesimilar sexual attacks on others multiplies with delays in investigation and trial. In extreme cases, rape maybe followed by murder in order to permanently silence the victim and protect the identity of the assailant.
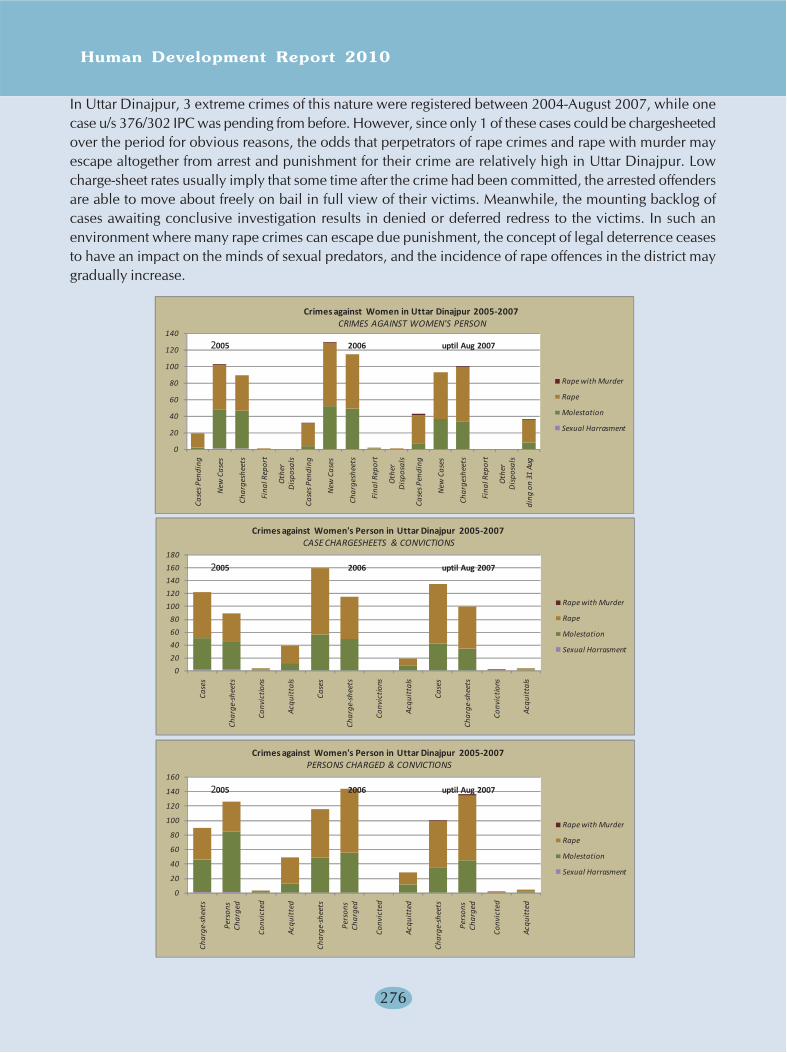
Human Development Report 2010
276
In Uttar Dinajpur, 3 extreme crimes of this nature were registered between 2004-August 2007, while onecase u/s 376/302 IPC was pending from before. However, since only 1 of these cases could be chargesheetedover the period for obvious reasons, the odds that perpetrators of rape crimes and rape with murder mayescape altogether from arrest and punishment for their crime are relatively high in Uttar Dinajpur. Lowcharge-sheet rates usually imply that some time after the crime had been committed, the arrested offendersare able to move about freely on bail in full view of their victims. Meanwhile, the mounting backlog ofcases awaiting conclusive investigation results in denied or deferred redress to the victims. In such anenvironment where many rape crimes can escape due punishment, the concept of legal deterrence ceasesto have an impact on the minds of sexual predators, and the incidence of rape offences in the district maygradually increase.
0
20
40
60
80
100
120
140
Case
s Pen
ding
New
Cas
es
Char
gesh
eets
Fina
l Rep
ort
Oth
er
Dis
posa
ls
Case
s Pen
ding
New
Cas
es
Char
gesh
eets
Fina
l Rep
ort
Oth
er
Dis
posa
ls
Case
s Pen
ding
New
Cas
es
Char
gesh
eets
Fina
l Rep
ort
Oth
er
Dis
posa
ls
ding
on
31 A
ug
Rape with Murder
Rape
Molestation
Sexual Harrasment
Crimes against Women in Uttar Dinajpur 2005-2007CRIMES AGAINST WOMEN'S PERSON
2005 2006 uptil Aug 2007
0
20
40
60
80
100
120
140
160
180
Case
s
Char
ge-s
heet
s
Conv
ictio
ns
Acqu
itta
ls
Case
s
Char
ge-s
heet
s
Conv
ictio
ns
Acqu
itta
ls
Case
s
Char
ge-s
heet
s
Conv
ictio
ns
Acqu
itta
ls
Rape with Murder
Rape
Molestation
Sexual Harrasment
Crimes against Women's Person in Uttar Dinajpur 2005-2007CASE CHARGESHEETS & CONVICTIONS
2005 2006 uptil Aug 2007
0
20
40
60
80
100
120
140
160
Char
ge-s
heet
s
Pers
ons
Char
ged
Conv
icte
d
Acqu
itte
d
Char
ge-s
heet
s
Pers
ons
Char
ged
Conv
icte
d
Acqu
itte
d
Char
ge-s
heet
s
Pers
ons
Char
ged
Conv
icte
d
Acqu
itte
d
Rape with Murder
Rape
Molestation
Sexual Harrasment
Crimes against Women's Person in Uttar Dinajpur 2005-2007PERSONS CHARGED & CONVICTIONS
2005 2006 uptil Aug 2007
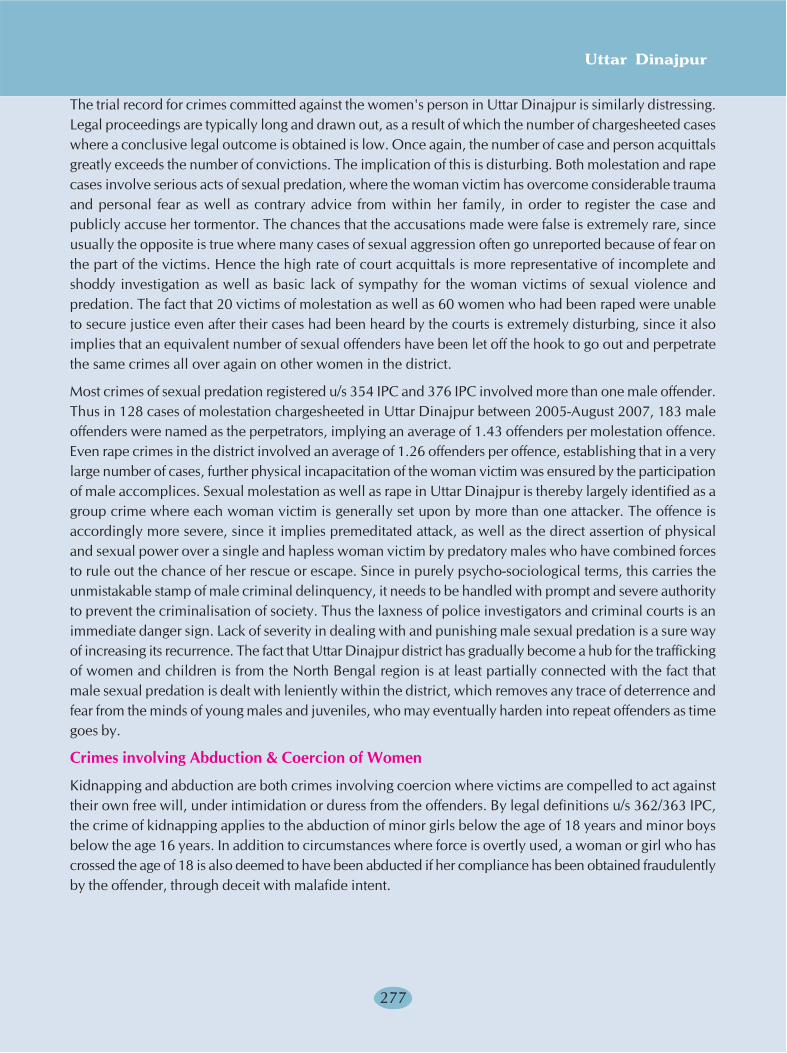
Uttar Dinajpur
277
The trial record for crimes committed against the women's person in Uttar Dinajpur is similarly distressing.Legal proceedings are typically long and drawn out, as a result of which the number of chargesheeted caseswhere a conclusive legal outcome is obtained is low. Once again, the number of case and person acquittalsgreatly exceeds the number of convictions. The implication of this is disturbing. Both molestation and rapecases involve serious acts of sexual predation, where the woman victim has overcome considerable traumaand personal fear as well as contrary advice from within her family, in order to register the case andpublicly accuse her tormentor. The chances that the accusations made were false is extremely rare, sinceusually the opposite is true where many cases of sexual aggression often go unreported because of fear onthe part of the victims. Hence the high rate of court acquittals is more representative of incomplete andshoddy investigation as well as basic lack of sympathy for the woman victims of sexual violence andpredation. The fact that 20 victims of molestation as well as 60 women who had been raped were unableto secure justice even after their cases had been heard by the courts is extremely disturbing, since it alsoimplies that an equivalent number of sexual offenders have been let off the hook to go out and perpetratethe same crimes all over again on other women in the district.
Most crimes of sexual predation registered u/s 354 IPC and 376 IPC involved more than one male offender.Thus in 128 cases of molestation chargesheeted in Uttar Dinajpur between 2005-August 2007, 183 maleoffenders were named as the perpetrators, implying an average of 1.43 offenders per molestation offence.Even rape crimes in the district involved an average of 1.26 offenders per offence, establishing that in a verylarge number of cases, further physical incapacitation of the woman victim was ensured by the participationof male accomplices. Sexual molestation as well as rape in Uttar Dinajpur is thereby largely identified as agroup crime where each woman victim is generally set upon by more than one attacker. The offence isaccordingly more severe, since it implies premeditated attack, as well as the direct assertion of physicaland sexual power over a single and hapless woman victim by predatory males who have combined forcesto rule out the chance of her rescue or escape. Since in purely psycho-sociological terms, this carries theunmistakable stamp of male criminal delinquency, it needs to be handled with prompt and severe authorityto prevent the criminalisation of society. Thus the laxness of police investigators and criminal courts is animmediate danger sign. Lack of severity in dealing with and punishing male sexual predation is a sure wayof increasing its recurrence. The fact that Uttar Dinajpur district has gradually become a hub for the traffickingof women and children is from the North Bengal region is at least partially connected with the fact thatmale sexual predation is dealt with leniently within the district, which removes any trace of deterrence andfear from the minds of young males and juveniles, who may eventually harden into repeat offenders as timegoes by.
Crimes involving Abduction & Coercion of Women
Kidnapping and abduction are both crimes involving coercion where victims are compelled to act againsttheir own free will, under intimidation or duress from the offenders. By legal definitions u/s 362/363 IPC,the crime of kidnapping applies to the abduction of minor girls below the age of 18 years and minor boysbelow the age 16 years. In addition to circumstances where force is overtly used, a woman or girl who hascrossed the age of 18 is also deemed to have been abducted if her compliance has been obtained fraudulentlyby the offender, through deceit with malafide intent.
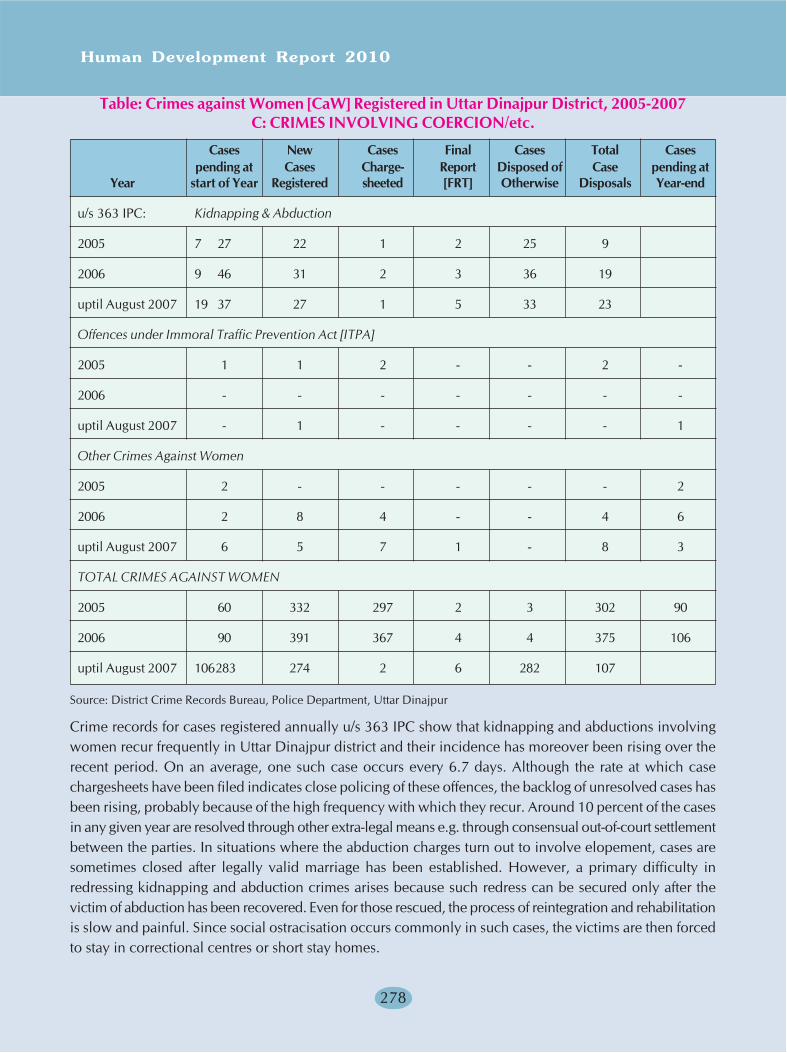
Human Development Report 2010
278
Table: Crimes against Women [CaW] Registered in Uttar Dinajpur District, 2005-2007C: CRIMES INVOLVING COERCION/etc.
Cases New Cases Final Cases Total Casespending at Cases Charge- Report Disposed of Case pending at
Year start of Year Registered sheeted [FRT] Otherwise Disposals Year-end
u/s 363 IPC: Kidnapping & Abduction
2005 7 27 22 1 2 25 9
2006 9 46 31 2 3 36 19
uptil August 2007 19 37 27 1 5 33 23
Offences under Immoral Traffic Prevention Act [ITPA]
2005 1 1 2 - - 2 -
2006 - - - - - - -
uptil August 2007 - 1 - - - - 1
Other Crimes Against Women
2005 2 - - - - - 2
2006 2 8 4 - - 4 6
uptil August 2007 6 5 7 1 - 8 3
TOTAL CRIMES AGAINST WOMEN
2005 60 332 297 2 3 302 90
2006 90 391 367 4 4 375 106
uptil August 2007 106283 274 2 6 282 107
Source: District Crime Records Bureau, Police Department, Uttar Dinajpur
Crime records for cases registered annually u/s 363 IPC show that kidnapping and abductions involvingwomen recur frequently in Uttar Dinajpur district and their incidence has moreover been rising over therecent period. On an average, one such case occurs every 6.7 days. Although the rate at which casechargesheets have been filed indicates close policing of these offences, the backlog of unresolved cases hasbeen rising, probably because of the high frequency with which they recur. Around 10 percent of the casesin any given year are resolved through other extra-legal means e.g. through consensual out-of-court settlementbetween the parties. In situations where the abduction charges turn out to involve elopement, cases aresometimes closed after legally valid marriage has been established. However, a primary difficulty inredressing kidnapping and abduction crimes arises because such redress can be secured only after thevictim of abduction has been recovered. Even for those rescued, the process of reintegration and rehabilitationis slow and painful. Since social ostracisation occurs commonly in such cases, the victims are then forcedto stay in correctional centres or short stay homes.
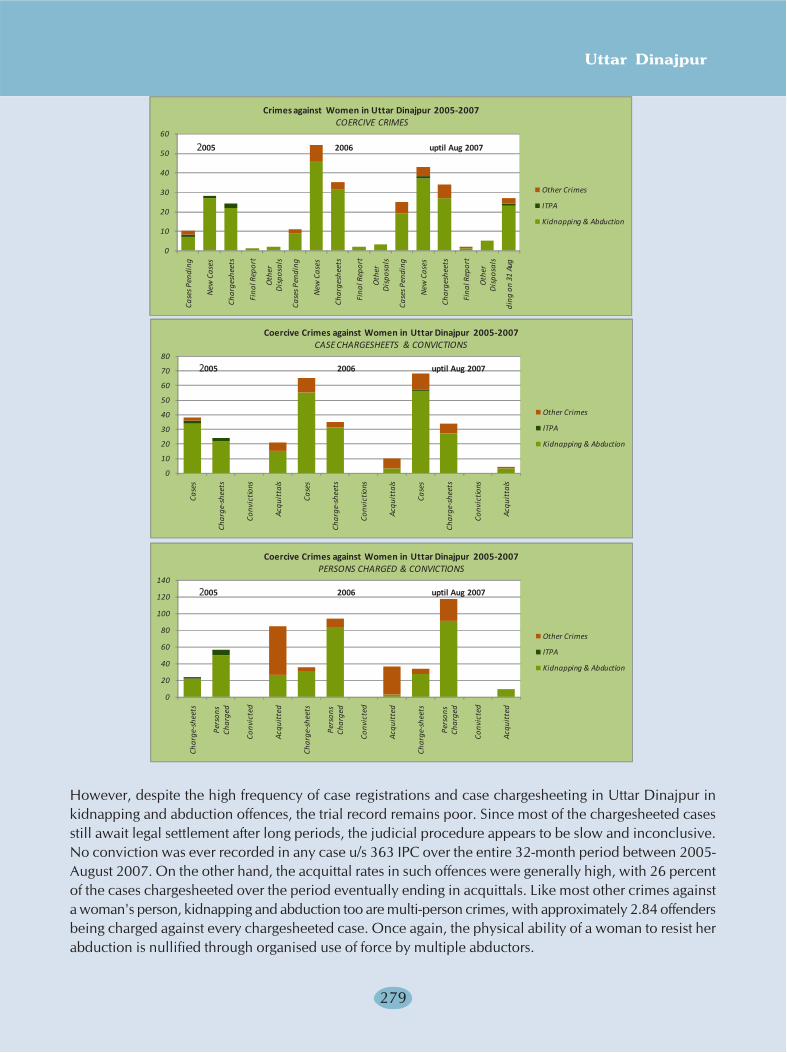
Uttar Dinajpur
279
0
10
20
30
40
50
60
Case
s Pen
ding
New
Cas
es
Char
gesh
eets
Fina
l Rep
ort
Oth
er
Dis
posa
ls
Case
s Pen
ding
New
Cas
es
Char
gesh
eets
Fina
l Rep
ort
Oth
er
Dis
posa
ls
Case
s Pen
ding
New
Cas
es
Char
gesh
eets
Fina
l Rep
ort
Oth
er
Dis
posa
ls
ding
on
31 A
ug
Other Crimes
ITPA
Kidnapping & Abduction
Crimes against Women in Uttar Dinajpur 2005-2007COERCIVE CRIMES
2005 2006 uptil Aug 2007
0
10
20
30
40
50
60
70
80
Case
s
Char
ge-s
heet
s
Conv
ictio
ns
Acqu
itta
ls
Case
s
Char
ge-s
heet
s
Conv
ictio
ns
Acqu
itta
ls
Case
s
Char
ge-s
heet
s
Conv
ictio
ns
Acqu
itta
ls
Other Crimes
ITPA
Kidnapping & Abduction
Coercive Crimes against Women in Uttar Dinajpur 2005-2007CASE CHARGESHEETS & CONVICTIONS
2005 2006 uptil Aug 2007
0
20
40
60
80
100
120
140
Char
ge-s
heet
s
Pers
ons
Char
ged
Conv
icte
d
Acqu
itte
d
Char
ge-s
heet
s
Pers
ons
Char
ged
Conv
icte
d
Acqu
itte
d
Char
ge-s
heet
s
Pers
ons
Char
ged
Conv
icte
d
Acqu
itte
d
Other Crimes
ITPA
Kidnapping & Abduction
Coercive Crimes against Women in Uttar Dinajpur 2005-2007PERSONS CHARGED & CONVICTIONS
2005 2006 uptil Aug 2007
However, despite the high frequency of case registrations and case chargesheeting in Uttar Dinajpur inkidnapping and abduction offences, the trial record remains poor. Since most of the chargesheeted casesstill await legal settlement after long periods, the judicial procedure appears to be slow and inconclusive.No conviction was ever recorded in any case u/s 363 IPC over the entire 32-month period between 2005-August 2007. On the other hand, the acquittal rates in such offences were generally high, with 26 percentof the cases chargesheeted over the period eventually ending in acquittals. Like most other crimes againsta woman's person, kidnapping and abduction too are multi-person crimes, with approximately 2.84 offendersbeing charged against every chargesheeted case. Once again, the physical ability of a woman to resist herabduction is nullified through organised use of force by multiple abductors.

Human Development Report 2010
280
Case Disposals and Legal Deterrence
Apart from preventive codes enforced through social concepts like izzat or family and social honour,which often fail to differentiate between the victim and the criminal after CaW offences have been committed,prevention of crimes against women rests on the twin principles of prompt detection and prompt investigationand legal deterrence. While the first of these is entirely within the police domain, the subsequent processdepends on the efficiency of the investigation as well as the efficiency of the criminal justice system asenforced through the District & Sessions Courts. Weaknesses at this stage create legal loopholes throughwhich the accused receive milder penalties compared to the gravity of their crimes or escape punishmentaltogether, subverting legal deterrence and increasing the frequency of repeat offences. Low rates of convictionand very high acquittal rates in the case records for CaW offences registered between 2005-August 2007identify this as a major problem impeding the administration of criminal justice in Uttar Dinajpur.
Table: Case Disposals relating to Crimes against Women [CaW] in Uttar Dinajpur District,January 2005-August 2007
Year 2005 2005 2005 2005 2006 2006 2006 2006 2007 2007 2007 2007Total Case Case Case Total Case Case Case Total Case Case CaseCases Charge- Convic- Acqui- Cases Charge Convic- Acqui- Cases Charge Convic- Acqui-
sheets tions ttals sheets tions ttals sheets tions ttals
MARITAL & DOWRY CRIMES
Abetment of Suicide 33 17 1 - 33 24 - 3 23 14 - 1
Cruelty/Torture 177 156 2 52 200 182 1 46 132 110 1 3
Burns/Unnatural Death 19 9 - 2 15 9 1 1 13 9 - 1
Cruelty/Torture & Murder 2 1 - 2 5 2 1 - 11 4 - -
Murder/Unnatural Death
for Dowry 1 1 2 - 2 - - - 6 3 - -
CRIMES AGAINST WOMEN'S PERSON
Sexual Harassment 1 1 - - - - - - - - - -
Molestation 49 45 1 11 56 49 - 8 42 34 - 1
Rape 71 43 2 27 103 66 - 11 92 65 2 2
Rape with Murder 1 - - - 2 - - - 2 1 - -
CRIMES INVOLVING COERCION/etc
Kidnapping & Abduction 34 22 - 15 55 31 - 3 56 27 - 3
ITPA 2 2 - - - - - - 1 - - -
Other Crimes 2 - - 6 10 4 - 7 11 7 - 1
Total Crimes
against Women 392 297 8 115 481 367 3 79 389 274 3 12
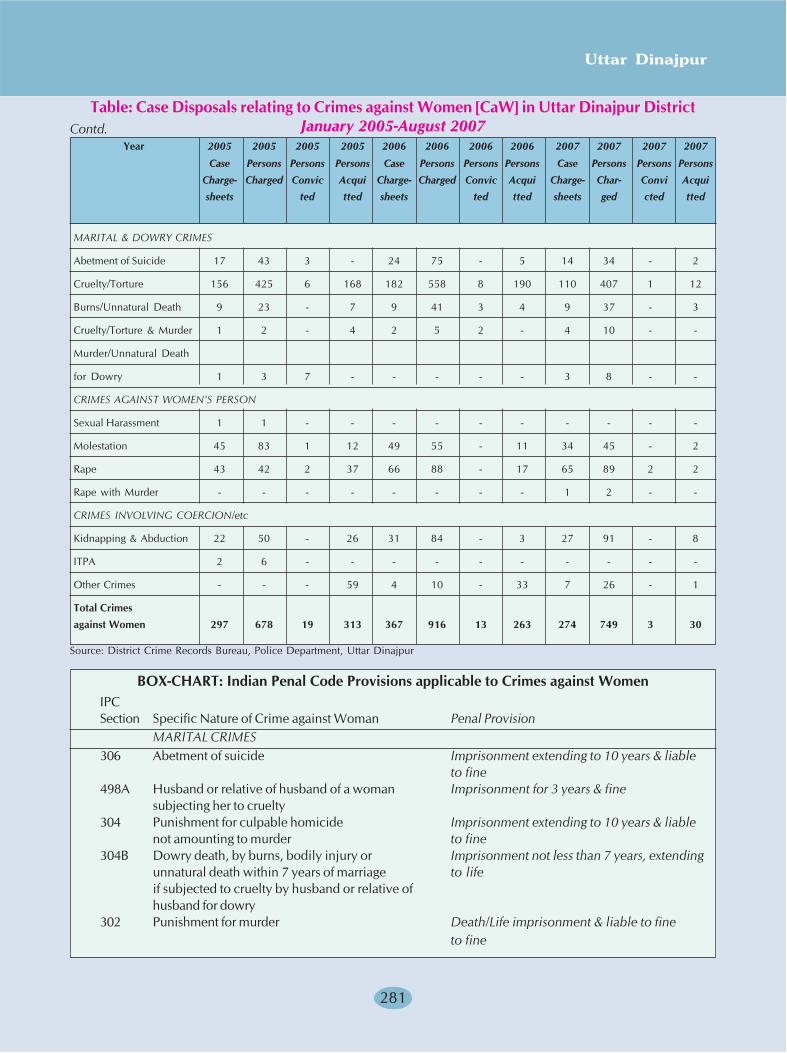
Uttar Dinajpur
281
Year 2005 2005 2005 2005 2006 2006 2006 2006 2007 2007 2007 2007
Case Persons Persons Persons Case Persons Persons Persons Case Persons Persons Persons
Charge- Charged Convic Acqui Charge- Charged Convic Acqui Charge- Char- Convi Acquisheets ted tted sheets ted tted sheets ged cted tted
MARITAL & DOWRY CRIMES
Abetment of Suicide 17 43 3 - 24 75 - 5 14 34 - 2
Cruelty/Torture 156 425 6 168 182 558 8 190 110 407 1 12
Burns/Unnatural Death 9 23 - 7 9 41 3 4 9 37 - 3
Cruelty/Torture & Murder 1 2 - 4 2 5 2 - 4 10 - -
Murder/Unnatural Death
for Dowry 1 3 7 - - - - - 3 8 - -
CRIMES AGAINST WOMEN'S PERSON
Sexual Harassment 1 1 - - - - - - - - - -
Molestation 45 83 1 12 49 55 - 11 34 45 - 2
Rape 43 42 2 37 66 88 - 17 65 89 2 2
Rape with Murder - - - - - - - - 1 2 - -
CRIMES INVOLVING COERCION/etc
Kidnapping & Abduction 22 50 - 26 31 84 - 3 27 91 - 8
ITPA 2 6 - - - - - - - - - -
Other Crimes - - - 59 4 10 - 33 7 26 - 1
Total Crimesagainst Women 297 678 19 313 367 916 13 263 274 749 3 30
Source: District Crime Records Bureau, Police Department, Uttar Dinajpur
BOX-CHART: Indian Penal Code Provisions applicable to Crimes against WomenIPCSection Specific Nature of Crime against Woman Penal Provision
MARITAL CRIMES306 Abetment of suicide Imprisonment extending to 10 years & liable
to fine498A Husband or relative of husband of a woman Imprisonment for 3 years & fine
subjecting her to cruelty304 Punishment for culpable homicide Imprisonment extending to 10 years & liable
not amounting to murder to fine304B Dowry death, by burns, bodily injury or Imprisonment not less than 7 years, extending
unnatural death within 7 years of marriage to lifeif subjected to cruelty by husband or relative ofhusband for dowry
302 Punishment for murder Death/Life imprisonment & liable to fineto fine
Table: Case Disposals relating to Crimes against Women [CaW] in Uttar Dinajpur DistrictJanuary 2005-August 2007Contd.
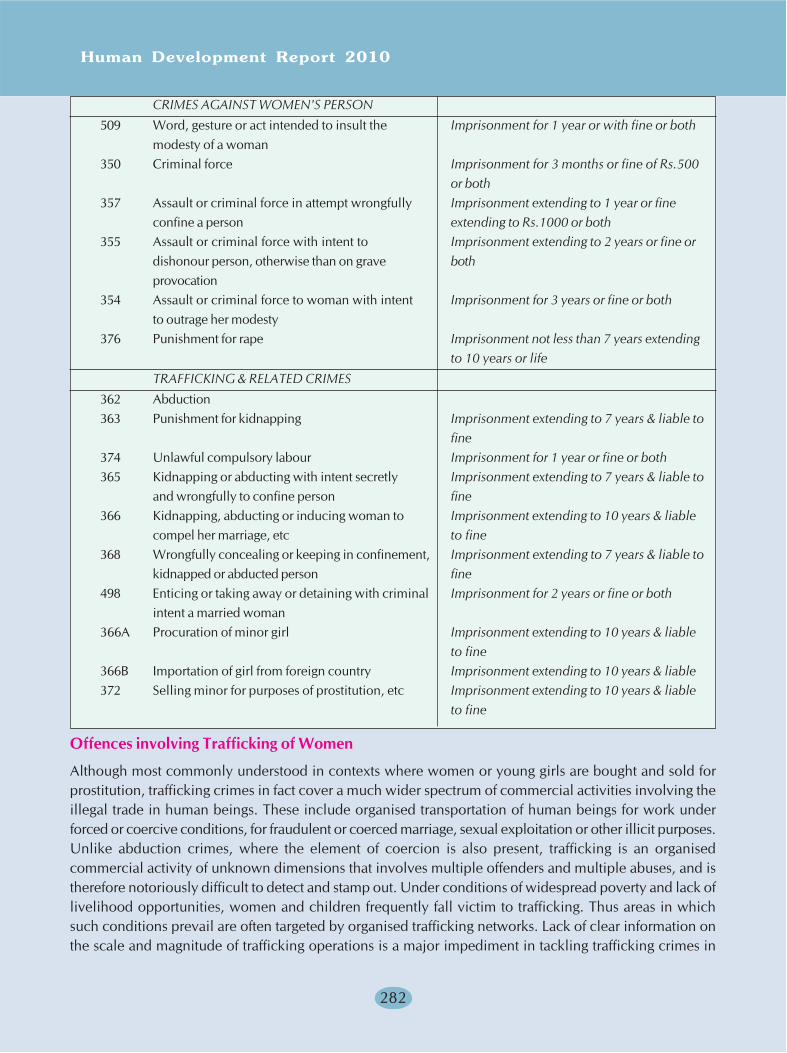
Human Development Report 2010
282
CRIMES AGAINST WOMEN'S PERSON509 Word, gesture or act intended to insult the Imprisonment for 1 year or with fine or both
modesty of a woman350 Criminal force Imprisonment for 3 months or fine of Rs.500
or both357 Assault or criminal force in attempt wrongfully Imprisonment extending to 1 year or fine
confine a person extending to Rs.1000 or both355 Assault or criminal force with intent to Imprisonment extending to 2 years or fine or
dishonour person, otherwise than on grave bothprovocation
354 Assault or criminal force to woman with intent Imprisonment for 3 years or fine or bothto outrage her modesty
376 Punishment for rape Imprisonment not less than 7 years extendingto 10 years or life
TRAFFICKING & RELATED CRIMES362 Abduction363 Punishment for kidnapping Imprisonment extending to 7 years & liable to
fine374 Unlawful compulsory labour Imprisonment for 1 year or fine or both365 Kidnapping or abducting with intent secretly Imprisonment extending to 7 years & liable to
and wrongfully to confine person fine366 Kidnapping, abducting or inducing woman to Imprisonment extending to 10 years & liable
compel her marriage, etc to fine368 Wrongfully concealing or keeping in confinement, Imprisonment extending to 7 years & liable to
kidnapped or abducted person fine498 Enticing or taking away or detaining with criminal Imprisonment for 2 years or fine or both
intent a married woman366A Procuration of minor girl Imprisonment extending to 10 years & liable
to fine366B Importation of girl from foreign country Imprisonment extending to 10 years & liable372 Selling minor for purposes of prostitution, etc Imprisonment extending to 10 years & liable
to fine
Offences involving Trafficking of Women
Although most commonly understood in contexts where women or young girls are bought and sold forprostitution, trafficking crimes in fact cover a much wider spectrum of commercial activities involving theillegal trade in human beings. These include organised transportation of human beings for work underforced or coercive conditions, for fraudulent or coerced marriage, sexual exploitation or other illicit purposes.Unlike abduction crimes, where the element of coercion is also present, trafficking is an organisedcommercial activity of unknown dimensions that involves multiple offenders and multiple abuses, and istherefore notoriously difficult to detect and stamp out. Under conditions of widespread poverty and lack oflivelihood opportunities, women and children frequently fall victim to trafficking. Thus areas in whichsuch conditions prevail are often targeted by organised trafficking networks. Lack of clear information onthe scale and magnitude of trafficking operations is a major impediment in tackling trafficking crimes in
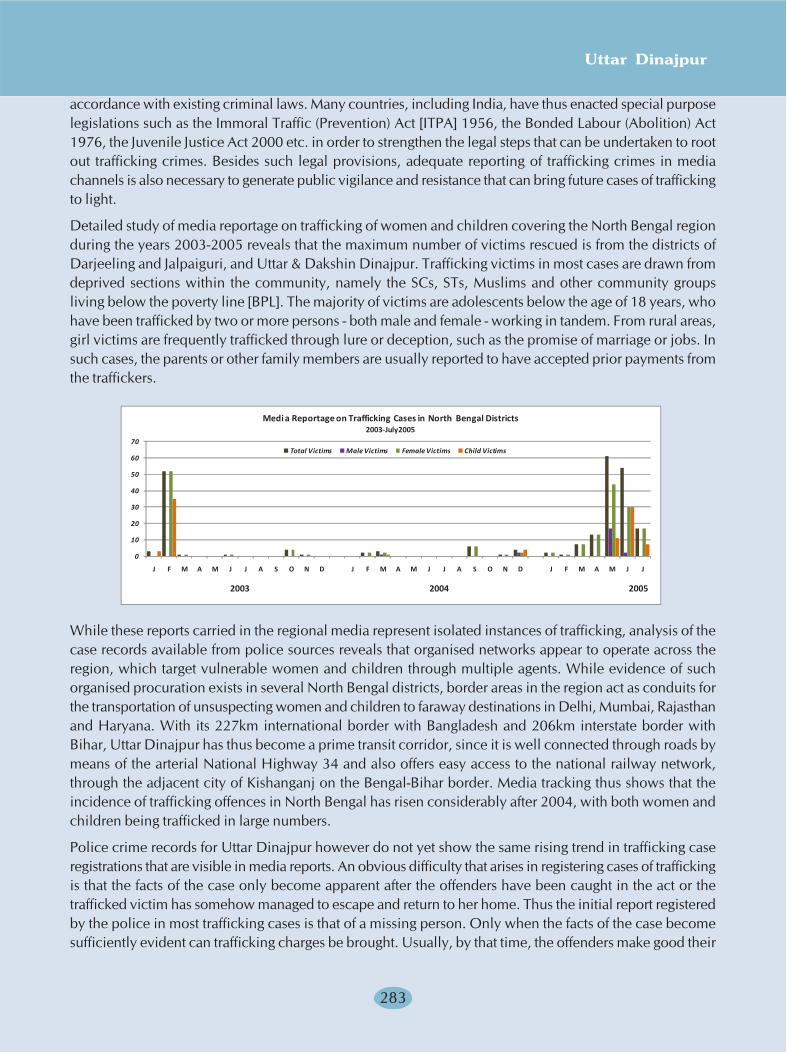
Uttar Dinajpur
283
accordance with existing criminal laws. Many countries, including India, have thus enacted special purposelegislations such as the Immoral Traffic (Prevention) Act [ITPA] 1956, the Bonded Labour (Abolition) Act1976, the Juvenile Justice Act 2000 etc. in order to strengthen the legal steps that can be undertaken to rootout trafficking crimes. Besides such legal provisions, adequate reporting of trafficking crimes in mediachannels is also necessary to generate public vigilance and resistance that can bring future cases of traffickingto light.
Detailed study of media reportage on trafficking of women and children covering the North Bengal regionduring the years 2003-2005 reveals that the maximum number of victims rescued is from the districts ofDarjeeling and Jalpaiguri, and Uttar & Dakshin Dinajpur. Trafficking victims in most cases are drawn fromdeprived sections within the community, namely the SCs, STs, Muslims and other community groupsliving below the poverty line [BPL]. The majority of victims are adolescents below the age of 18 years, whohave been trafficked by two or more persons - both male and female - working in tandem. From rural areas,girl victims are frequently trafficked through lure or deception, such as the promise of marriage or jobs. Insuch cases, the parents or other family members are usually reported to have accepted prior payments fromthe traffickers.
While these reports carried in the regional media represent isolated instances of trafficking, analysis of thecase records available from police sources reveals that organised networks appear to operate across theregion, which target vulnerable women and children through multiple agents. While evidence of suchorganised procuration exists in several North Bengal districts, border areas in the region act as conduits forthe transportation of unsuspecting women and children to faraway destinations in Delhi, Mumbai, Rajasthanand Haryana. With its 227km international border with Bangladesh and 206km interstate border withBihar, Uttar Dinajpur has thus become a prime transit corridor, since it is well connected through roads bymeans of the arterial National Highway 34 and also offers easy access to the national railway network,through the adjacent city of Kishanganj on the Bengal-Bihar border. Media tracking thus shows that theincidence of trafficking offences in North Bengal has risen considerably after 2004, with both women andchildren being trafficked in large numbers.
Police crime records for Uttar Dinajpur however do not yet show the same rising trend in trafficking caseregistrations that are visible in media reports. An obvious difficulty that arises in registering cases of traffickingis that the facts of the case only become apparent after the offenders have been caught in the act or thetrafficked victim has somehow managed to escape and return to her home. Thus the initial report registeredby the police in most trafficking cases is that of a missing person. Only when the facts of the case becomesufficiently evident can trafficking charges be brought. Usually, by that time, the offenders make good their
0
10
20
30
40
50
60
70
J F M A M J J A S O N D J F M A M J J A S O N D J F M A M J J
Total Victims Male Victims Female Victims Child Victims
Medi a Reportage on Trafficking Cases in North Bengal Districts2003-July2005
2003 2004 2005

Human Development Report 2010
284
escape and are a long way away. Since many missing women who have been trafficked to distant states arenever recovered, the district police records clearly represent the trends in police investigations rather thanspecific trends in the commitment of trafficking offences specifically. The recent rise in police caseregistrations and trafficking arrests in North Bengal may partially reflect increasing regional trends in theincidence of trafficking offences, as well as closer police surveillance and stiffer investigation of the reportedoffences. Similarly, the growth of regional reportage on the trafficking of women and children may alsoreflect better levels of media and public sensitisation about the menace of trafficking, as well as the increasingincidence of trafficking offences on the ground as well as better in the region. Since both trends show anincrease, the incidence of trafficking in Uttar Dinajpur has undoubtedly been growing in recent years. Asthe arrest record for kidnapping and abductions shows, trafficking is a highly organised operation, involvingracketeering and multi-person crimes. Often, while the small fry are apprehended, the big fish that mastermindthe racket get away. This stresses the need for better police coordination across the country in combatingtrafficking crimes.
In police procedures, trafficking crimes involve multiple charges and multiple laws. In cases where womenhave been trafficked into prostitution, penal action against traffickers is taken by invoking the provisions ofspecial laws under Immoral Traffic Prevention Act [ITPA]. Other related offences involving kidnapping,abduction, procuration or coerced marriage of young girls or forcible marriage come under related provisionsu/s 363/366/366A/366B IPC, which are often used to chargesheet the above cases. While imprisonment ofthe traffickers for 7-10 years is possible under both these laws, case disposals generally take a long coursesince redress can only be obtained after the rescue of the woman victim. Prior to their legal prosecution,the single or multiple offenders who committed the crime have to be identified by the victim, which is onlypossible after the woman victim has been rescued or recovered.
Table: Case Registrations & Arrests under ITPA in Uttar Dinajpur & North Bengal, 2003-2004
2003 2003 2004 2004 Avg Arrests Avg Ratio ofCases Total Cases Total per Case Female to
District Registered Arrests Registered Arrests [2003-2004] Male Arrests
Uttar Dinajpur - 1 2 16 8.50 0.60
North Bengal Region 5 40 15 150 9.50 1.18
Source: State Crime Records Bureau, Police Department, West Bengal
Table: Case Registrations against All Trafficking-related Offences in Uttar Dinajpur & North Bengal, 2003-2005
Total Total TotalCases u/s Cases u/s Cases u/s Traffick- Traffick- Traffick-
Cases Cases Cases 363/366/ 363/366/ 363/366/ ing ing ingDistrict/Region u/ ITPA u/ ITPA u/ ITPA 366A 366A 366A -related -related -related
&B IPC &B IPC &B IPC Cases Cases Cases2003 2004 2005 2003 2004 2005 2003 2004 2005
Uttar Dinajpur - 5 1 - 37 14 23 42 na
North Bengal Region 1 18 na 118 198 77 142 216 na
Source: State Crime Records Bureau, Police Department, West Bengal
Uttar Dinajpur
285
Police case and arrest records for 2003-2005 thus show that more trafficking cases are registered in UttarDinajpur under IPC provisions, while the number of ITPA cases in the district is generally much smallerthan the total registered in North Bengal. Arrest records for ITPA offences clearly establish that organisedracketeering is involved, since multiple persons are arrested. Nevertheless, the average number of arrestsper case and the ratio of female to male arrests are much lower in Uttar Dinajpur than in North Bengal,suggesting that more arrests in the district take place during the trafficking stage, rather than after thevictims have been delivered to the brothel keepers and madams. This finding is important in establishingthat the rate at which women are being trafficked through Uttar Dinajpur is high. The fact that many morecases are registered proportionately u/s 363/366/366A&B IPC in the district strengthens the inference thatUttar Dinajpur on the whole is a source or transit point for trafficking rackets, rather than being theirfavoured destination.
BOX - TEXT
GENDER VULNERABILITY & TRAFFICKING
Rural North Bengal has been frequently identified in media reports as well as national police records asa source area from which women and children are being trafficked to other states. The combination ofisolated borderland locations with economic and educational deprivation acts as a predisposing factor.A 2006 study by the Centre for Women's Studies, North Bengal University, surveyed certain rural areasin North Bengal to capture the characteristic field-situations where such incidents recur and to identifyvulnerable sections among the population who might fall easy victims to trafficking. The survey siteslocated in Uttar Dinajpur district were the villages of Baje Bindol under Bindol GP in Raiganj block,Radhikapur under Radhikapur GP in Kaliaganj block and Dharampur under Gulandar-1 GP in Itahar.Location of the survey sites along the long regional borders with Bihar and Bangladesh permitted theanalysis of crime and policing problems along the international and interstate frontiers, as a result ofwhich Uttar Dinajpur has become the principal conduit for cross-border trafficking of victims fromNorth Bengal and Bangladesh to other Indian states.
The sample of respondents studied in Uttar Dinajpur was heavily weighted with socially and economicallydeprived community groups such as the SCs, STs and rural Muslims. Although the respondents camefrom mixed economic and cultural backgrounds, commonality was observed between them in relationto low educational achievement, poverty, assetlessness and rootlessness. Entry into wage-work tookplace at a remarkably young age in the district, usually at the instance of parents or relatives, at ages aslow as 10-2 years among the Itahar respondents and 12.2 years among the Kaliaganj respondents. Mostfamilies depended on the earnings of a single main worker. Although several other family memberswere able to find occasional work, the seasonality of work opportunities also led to seasonality in theirwage contributions to the households. Daily wages for manual work in 2005 ranged between Rs.30-40per worker. Wage workers in Uttar Dinajpur were thus able to contribute between Rs.6600-8500 to thehousehold income annually, depending on their location and the regularity of work. No scarcity wagewas paid even at busy times (e.g. during agricultural transplanting and reaping ) when rural labourdemands are high, offering evidence that in the study region within Uttar Dinajpur, labour was in excesssupply. This resulted in a relatively flat wage-path at most study locations, for both slack-season wagesand wages during periods of higher labour demand. Potential wage incomes from the same quantum ofrural work in Uttar Dinajpur were consequently found to be less than half of those derived from similarDarjeeling and Jalpaiguri survey sites.

Human Development Report 2010
286
Persisting social evils such as dowry-related indebtedness among the rural poor also compelled youngchildren and women to leave their hearths and homes and emigrate outwards in search of casual orseasonal work, which was one of the principal reasons why they often became easy victims of trafficking.Many rural women, who had left the Uttar Dinajpur study villages to work elsewhere, scarcely madeany visits thereafter to their village homes. While the determining factor that limited their return wasscaled by the distance they had travelled, it also appeared likely that at least some of these rural womenand children may have been trafficked.
Regional Incidence of Crimes against Women
Of 523 cases registered as offences against women in Uttar Dinajpur between 2004-August 2005, 64 hadculminated with the death of women victims. Over 12 percent of the crimes against women in the districtthus involved dowry deaths u/s 498A/302, 498A/304B and 498A/306, 498A/302/304 IPC. Including urbanpolice station [PS] areas within the respective block identifiers, the incidence of dowry death was highest inChopra, followed by Raiganj and Karandighi. However in broad regional terms, marital insecurity amongwomen was highest in the five northern blocks of the district spanning Islampur subdivision [SD], whichcollectively accounted for 58 percent of the dowry deaths recorded in Uttar Dinajpur over the period.Although located within Islampur SD, Goalpokhar-1 & 2 reported the lowest incidence of dowry deathsoverall, while Kaliaganj and Hemtabad recorded the lowest incidence in Raiganj SD. Thus the bulk ofdowry deaths were concentrated in Chopra, Islampur and Karandighi under Islampur SD, and Raiganjblock under Raiganj SD.
Table: Victims of Dowry Death in Uttar Dinajpur,January 2004-August 2005
Dowry CaWDowry Deaths CaW CasesDeaths uptil August Cases uptil August
CD Blockwise Breakup 2004 2005 Communitywise Breakup 2004 2005
Chopra 9 7 Total CaW Cases 300 223
Islampur 3 4
Goalpokhar-1 1 3 Total Dowry Deaths 29 35
Goalpokhar-2 - 1 Total Hindu Victims 28 34
Karandighi 2 7 Hindu General Caste Victims 8 10
Raiganj 6 4 OBC Victims 1 2
Hemtabad 3 2 SC Victims 6 6
Kaliaganj 1 4 ST Victims 1 1
Itahar 4 3 Total Muslim Victims 13 16
Source: District Crime Records Bureau, Police Department, Uttar Dinajpur
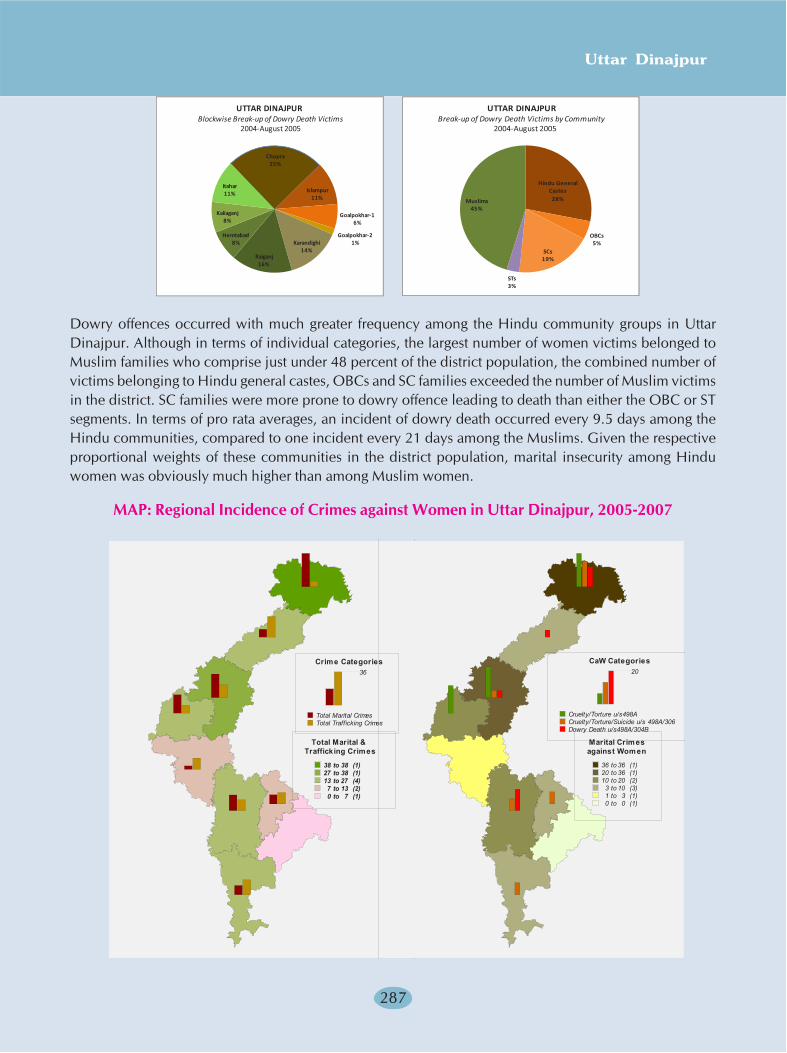
Uttar Dinajpur
287
Chopra25%
Islampur11%
Goalpokhar-16%
Goalpokhar-21%Karandighi
14%Raiganj
16%
Hemtabad8%
Kaliaganj8%
Itahar11%
UTTAR DINAJPUR Blockwise Break-up of Dowry Death Victims
2004-August 2005
Hindu General Castes28%
OBCs5%
SCs19%
STs3%
Muslims45%
UTTAR DINAJPURBreak-up of Dowry Death Victims by Community
2004-August 2005
Dowry offences occurred with much greater frequency among the Hindu community groups in UttarDinajpur. Although in terms of individual categories, the largest number of women victims belonged toMuslim families who comprise just under 48 percent of the district population, the combined number ofvictims belonging to Hindu general castes, OBCs and SC families exceeded the number of Muslim victimsin the district. SC families were more prone to dowry offence leading to death than either the OBC or STsegments. In terms of pro rata averages, an incident of dowry death occurred every 9.5 days among theHindu communities, compared to one incident every 21 days among the Muslims. Given the respectiveproportional weights of these communities in the district population, marital insecurity among Hinduwomen was obviously much higher than among Muslim women.
MAP: Regional Incidence of Crimes against Women in Uttar Dinajpur, 2005-2007
Marital Crimesagainst Women
36 to 36 (1)20 to 36 (1)10 to 20 (2)
3 to 10 (3)1 to 3 (1)0 to 0 (1)
CaW Categories20
Cruelty/Torture u/s498ACruelty/Torture/Suicide u/s 498A/306Dowry Death u/s498A/304B
Crime Categories36
Total Marital CrimesTotal Trafficking Crimes
Total Marital &Trafficking Crimes
38 to 38 (1)27 to 38 (1)13 to 27 (4)7 to 13 (2)0 to 7 (1)
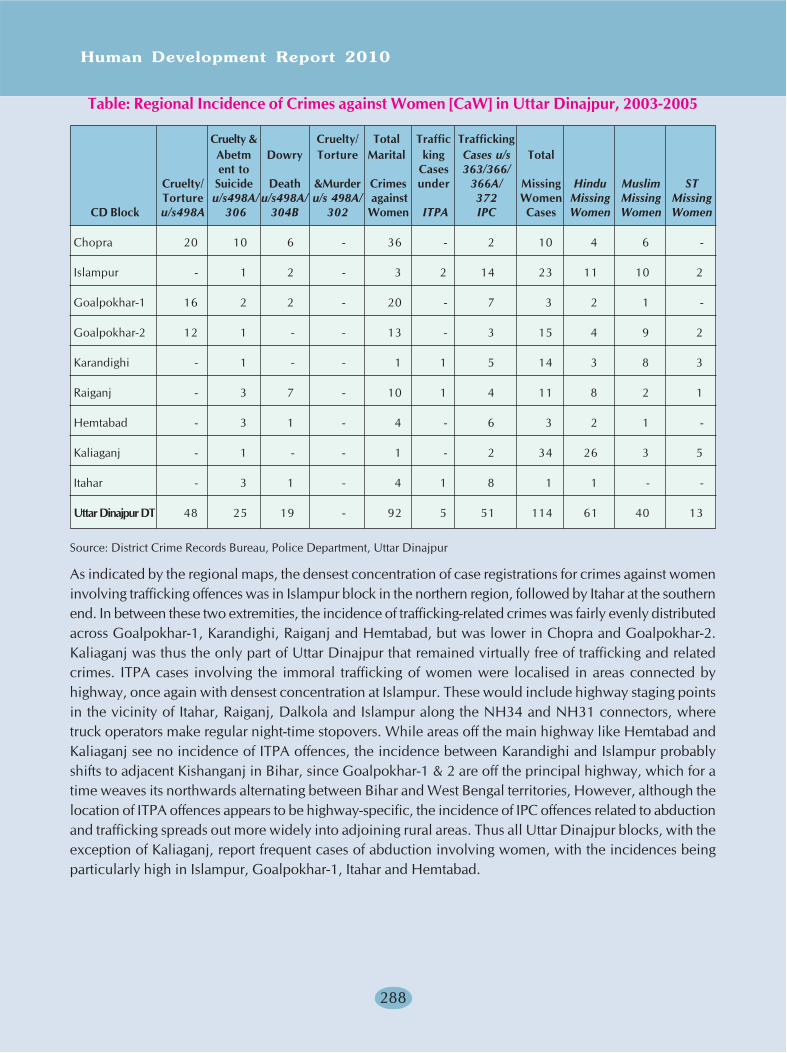
Human Development Report 2010
288
Table: Regional Incidence of Crimes against Women [CaW] in Uttar Dinajpur, 2003-2005
Cruelty & Cruelty/ Total Traffic TraffickingAbetm Dowry Torture Marital king Cases u/s Totalent to Cases 363/366/
Cruelty/ Suicide Death &Murder Crimes under 366A/ Missing Hindu Muslim STTorture u/s498A/ u/s498A/ u/s 498A/ against 372 Women Missing Missing Missing
CD Block u/s498A 306 304B 302 Women ITPA IPC Cases Women Women Women
Chopra 20 10 6 - 36 - 2 10 4 6 -
Islampur - 1 2 - 3 2 14 23 11 10 2
Goalpokhar-1 16 2 2 - 20 - 7 3 2 1 -
Goalpokhar-2 12 1 - - 13 - 3 15 4 9 2
Karandighi - 1 - - 1 1 5 14 3 8 3
Raiganj - 3 7 - 10 1 4 11 8 2 1
Hemtabad - 3 1 - 4 - 6 3 2 1 -
Kaliaganj - 1 - - 1 - 2 34 26 3 5
Itahar - 3 1 - 4 1 8 1 1 - -
Uttar Dinajpur DT 48 25 19 - 92 5 51 114 61 40 13
Source: District Crime Records Bureau, Police Department, Uttar Dinajpur
As indicated by the regional maps, the densest concentration of case registrations for crimes against womeninvolving trafficking offences was in Islampur block in the northern region, followed by Itahar at the southernend. In between these two extremities, the incidence of trafficking-related crimes was fairly evenly distributedacross Goalpokhar-1, Karandighi, Raiganj and Hemtabad, but was lower in Chopra and Goalpokhar-2.Kaliaganj was thus the only part of Uttar Dinajpur that remained virtually free of trafficking and relatedcrimes. ITPA cases involving the immoral trafficking of women were localised in areas connected byhighway, once again with densest concentration at Islampur. These would include highway staging pointsin the vicinity of Itahar, Raiganj, Dalkola and Islampur along the NH34 and NH31 connectors, wheretruck operators make regular night-time stopovers. While areas off the main highway like Hemtabad andKaliaganj see no incidence of ITPA offences, the incidence between Karandighi and Islampur probablyshifts to adjacent Kishanganj in Bihar, since Goalpokhar-1 & 2 are off the principal highway, which for atime weaves its northwards alternating between Bihar and West Bengal territories, However, although thelocation of ITPA offences appears to be highway-specific, the incidence of IPC offences related to abductionand trafficking spreads out more widely into adjoining rural areas. Thus all Uttar Dinajpur blocks, with theexception of Kaliaganj, report frequent cases of abduction involving women, with the incidences beingparticularly high in Islampur, Goalpokhar-1, Itahar and Hemtabad.
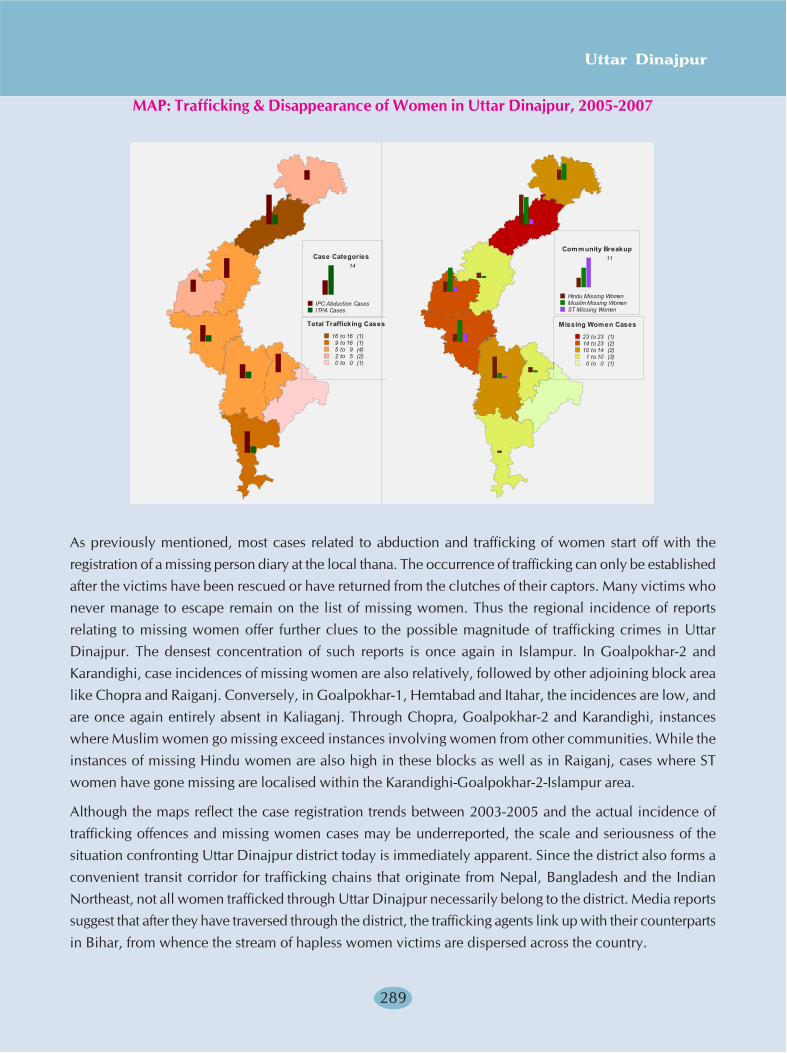
Uttar Dinajpur
289
MAP: Trafficking & Disappearance of Women in Uttar Dinajpur, 2005-2007
As previously mentioned, most cases related to abduction and trafficking of women start off with theregistration of a missing person diary at the local thana. The occurrence of trafficking can only be establishedafter the victims have been rescued or have returned from the clutches of their captors. Many victims whonever manage to escape remain on the list of missing women. Thus the regional incidence of reportsrelating to missing women offer further clues to the possible magnitude of trafficking crimes in UttarDinajpur. The densest concentration of such reports is once again in Islampur. In Goalpokhar-2 andKarandighi, case incidences of missing women are also relatively, followed by other adjoining block arealike Chopra and Raiganj. Conversely, in Goalpokhar-1, Hemtabad and Itahar, the incidences are low, andare once again entirely absent in Kaliaganj. Through Chopra, Goalpokhar-2 and Karandighi, instanceswhere Muslim women go missing exceed instances involving women from other communities. While theinstances of missing Hindu women are also high in these blocks as well as in Raiganj, cases where STwomen have gone missing are localised within the Karandighi-Goalpokhar-2-Islampur area.
Although the maps reflect the case registration trends between 2003-2005 and the actual incidence oftrafficking offences and missing women cases may be underreported, the scale and seriousness of thesituation confronting Uttar Dinajpur district today is immediately apparent. Since the district also forms aconvenient transit corridor for trafficking chains that originate from Nepal, Bangladesh and the IndianNortheast, not all women trafficked through Uttar Dinajpur necessarily belong to the district. Media reportssuggest that after they have traversed through the district, the trafficking agents link up with their counterpartsin Bihar, from whence the stream of hapless women victims are dispersed across the country.
Case Categories14
IPC Abduction CasesITPA Cases
Total Trafficking Cases
16 to 16 (1)9 to 16 (1)5 to 9 (4)2 to 5 (2)0 to 0 (1)
Missing Women Cases
23 to 23 (1)14 to 23 (2)10 to 14 (2)
1 to 10 (3)0 to 0 (1)
Community Breakup11
Hindu Missing WomenMuslim Missing WomenST Missing Women
Human Development Report 2010
290
BOX - TEXT
FOCUS GROUP DISCUSSION ON TRAFFICKING OF WOMEN & CHILDREN: RAIGANJ/AUGUST,2005
During a focus-group discussion with activists and women's stakeholder groups on trafficking issues inUttar Dinajpur, organised in August 2005 during the survey by the Centre for Women's Studies, NorthBengal University, several details emerged relating to the gender insecurities that currently confrontwomen in the district.
Representing Gunaprabha Swarnajayanti Mahila Dal - an SGSY-SHG group in Mohitpur Anchal inRaigani, Basanti Pal from Lakhunia village reported frequent trafficking of rural girls from her area to far-off places like Delhi etc. for work, through the intermediation of outside labour agents and local touts.Taking advantage of the difficulties faced by rural families in marrying off higher-aged daughters, thesepersons promise a rewarding alternative to the males of the families. Concurrence from the girls is neverobtained. Women victims of dowry disputes are sometimes placed under similar pressure, in one caseeven being forced into prostitution because of their inability to meet dowry demands.
Mithu Chakraborty and Maya Das, representing DURBA, spoke about the insidious nexus betweenSiliguri and the Panjipara-Islampur area in Uttar Dinajpur in the trafficking of rural girls from the districtinto urban brothels. Working closely with trafficking victims in these redlight areas, DURBA regularlymonitors the arrivals of new girls, seeking to ascertain their age and their willingness or unwillingness toenter commercial sex work [CSW]. Although collective efforts are made by local DURBA committees toliberate underage victims, many difficulties arise in returning the liberated victims to their villages. Aprimary reason for continuity within CSW is ostracism faced by the victims in rural society even afterthey have been rescued. Many girls who were initially unwilling victims return willingly after beingrejected by their families.
Tultuli Murmu, of an all-Adivasi SGSY-SHG group at Pandeypur in Karandighi, spoke of the adverseimpact of early marriage on Adivasi girls, leading to poor literacy, limited skills and poverty, and highfertility. Commercial home-brewing activity, which is common within the community, leads to the rapidbreakdown of social and family life. Meanwhile, dowry practices are also increasingly influencingeducated Adivasi youths, through a process of peer imitation. Child traffickers in the district frequentlytarget Muslim and Adivasi children, the most recent instance of which had occurred at the village ofAltapur. Accusations of witchery are frequently directed at old Adivasi women as a means for curbingtheir constructive participation in social and family affairs.
Bisnupada Aich, from an NGO group working on family and legal issues in the Sahapur area, mentionedthe frequent recurrence of girl-trafficking incidents in Bindol GP bordering Bangladesh. Dowry practicesare rapidly entering communities which had previously been immune to the practice. Even among theRajbanshi groups, where marriage by free choice had been previously widespread, a 16 year-old girlwho had been married through a love-match was subsequently pressured to arrange for a dowry payment.A common complaint from rural victims and their families is that dowry cases and rural complainantsdo not receive a fair hearing at the thanas. Consequently, many crimes against rural women in UttarDinajpur are never redressed. Poor legal awareness among rural complainants and their ignoranceabout police matters often result in General Diary entries being made instead of FIRs, even in the case ofcognisable offences. Habitual offenders who indulge in crimes against women thus often escape withimpunity, under such circumstances.
Uttar Dinajpur
291
Karnabala Das, member of an SGSY-SHG group from Khetrabari, under Karandighi-2 GP, spoke aboutthe urgent need for combating dowry as a social challenge. Muslim girls in Uttar Dinajpur are generallymarried off by the age of 8 to 10 years. Any girl who crosses that age without marriage is perceived as aliability even by her own family. Citing a recent case of abandonment of a 2-year old rural child in themunicipal area of Dalkola, she stated that extreme pressure and extreme gender insecurity sometimesforce women to take unimaginable decisions of this kind. Women SHGs have a huge potential role infighting such social practices that victimise rural women, and must therefore rise to the occasion. Addingher views, Beauty Sarkar - an SHG member from Chakulia, observed that dowry has traditionally playeda role in providing future social security to women. Any effort to stamp out the practice can only besuccessful if the same level of security is provided to women through other means. Economicempowerment of Women through SHGs would be an important step towards this.
Narayan Mazumdar, of St John's Ambulance, mentioned a survey being conducted by his organisationon the incidence of rural migration and trafficking in the Karandighi, Raiganj and Kaliaganj areas of UttarDinajpur. The two phenomena, he said, were closely interrelated. Concurring with his views, membersof the Karnajora SGSY-SHG group located just outside Raiganj pointed to the common agency of ruralmale migration to distant cities. Many such males, when they return periodically, act as contacts andagents for new migration and trafficking.
Concluding the discussion, Smt. Jyotsna Rani Singha, then Sabhadhipati, Uttar Dinajpur Zilla Parishad,stressed the need for continuous vigilance by women's groups to improve their own security. On theevidence of recent cases in Matikunda-3 GP, a new avenue for migration of rural women from thedistrict had been created by the increasing activity of marriage agents. Many of these incidents were justa cover for trafficking operations. The impact of increasing rural exposure to popular media in increasingthe incidence of crimes against women in Uttar Dinajpur needed to be closely monitored. The Panchayatsin the district could play an important role in this.

Human Development Report 2010

Uttar Dinajpur
293
Chapter 6MIGRATION AND RESETTLEMENT IN UTTAR DINAJPUR
Migration Inflows in Uttar Dinajpur
Till the partition of the country in 1947 under the Radcliffe award, most of present-day Uttar Dinajpur waspart of the larger district of Dinajpur in undivided Bengal, while the northern blocks covered by IslampurSD were transferred from Bihar to West Bengal in 1956. The mixed ethno linguistic and cultural characterof Uttar Dinajpur has been strongly influenced by these antecedents, and migration and resettlement withinUttar Dinajpur has accompanied these territorial changes. Pre-Partition Dinajpur had a substantial Muslim,Rajbanshi and tribal component within its population, besides Hindu upper-castes and the artisanal SCcastes. In the initial years following Partition, massive realignment of population took place within theerstwhile Dinajpur district, with Hindus and Muslims crossing to opposite sides of the newly drawnborder in large numbers. However, while emigration of Muslims into East Pakistan stopped within a fewyears, Hindu and tribal immigrants have continued to emigrate into India till the present day. This is themain population inflow that has contributed to the persistently high population growth in Uttar Dinajpurdistrict.
However, besides, migration sourced across international borders, Uttar Dinajpur has also received alarge stream of interstate migrants in the post-Independence period, particularly from the adjoining parts ofBihar. Migration of this kind has been primarily received in Islampur SD which, till 1956, had formed partof Kishanganj sub-division in erstwhile Purnea district in Bihar. Because of these territorial antecedents, theIslampur region still shares several linguistic, cultural and ethno religious characteristics as well as kinshipbonds with the adjoining Bihar areas. Seasonal migration of labour between adjoining regions occursregularly, besides which nuptial relations between communities settled on both sides of the Bihar-WestBengal border are another source for continuing interstate migration. The second largest group of migrantssettled within Uttar Dinajpur originates from Bihar.
Rapid population growth and rapid urbanisation have also contributed to migration and resettlement inUttar Dinajpur. Most major settlements in the northern part of the district, such as Islampur and Dalkolamunicipalities, lie along the highway that traverses the Bihar-West Bengal border, thus drawing in substantialpopulation inflows from either side. Relative population density in Uttar Dinajpur is still sparse comparedto adjacent West Bengal districts where population density is excessively high and agricultural land isscarce. Thus the possibility of securing larger holdings of farmland in Uttar Dinajpur under tenancy oroutright purchase has encouraged many marginal landholders from the Malda diara, who live under theconstant threat of erosion by the Ganga, to dispose of their land assets there and migrate northwards intoUttar Dinajpur where land is cheaper and more abundant. Migration from adjoining Malda is thus the thirdmajor population inflow that has been received by Uttar Dinajpur. Forming an addition to this, there hasalso been long-term population resettlement from Dakshin Dinajpur into Uttar Dinajpur, which, till 1992,were both parts of the undivided district of West Dinajpur. Surrounded on three sides by Bangladesh,Dakshin Dinajpur has been a major entry point for international migration, following which many migrantswho had initially settled in Dakshin Dinajpur have relocated to Uttar Dinajpur.
The proximity of Uttar Dinajpur to Bihar and Bangladesh, the relatively easy access to fertile irrigated land,the fast growth of agriculture, trade and commerce in the district, as well as the relatively developed stateof communications and transportation infrastructure have thus been contributing factors that have drawnin longterm inflows of migrants from various cultural communities and economic classes into Uttar Dinajpur.
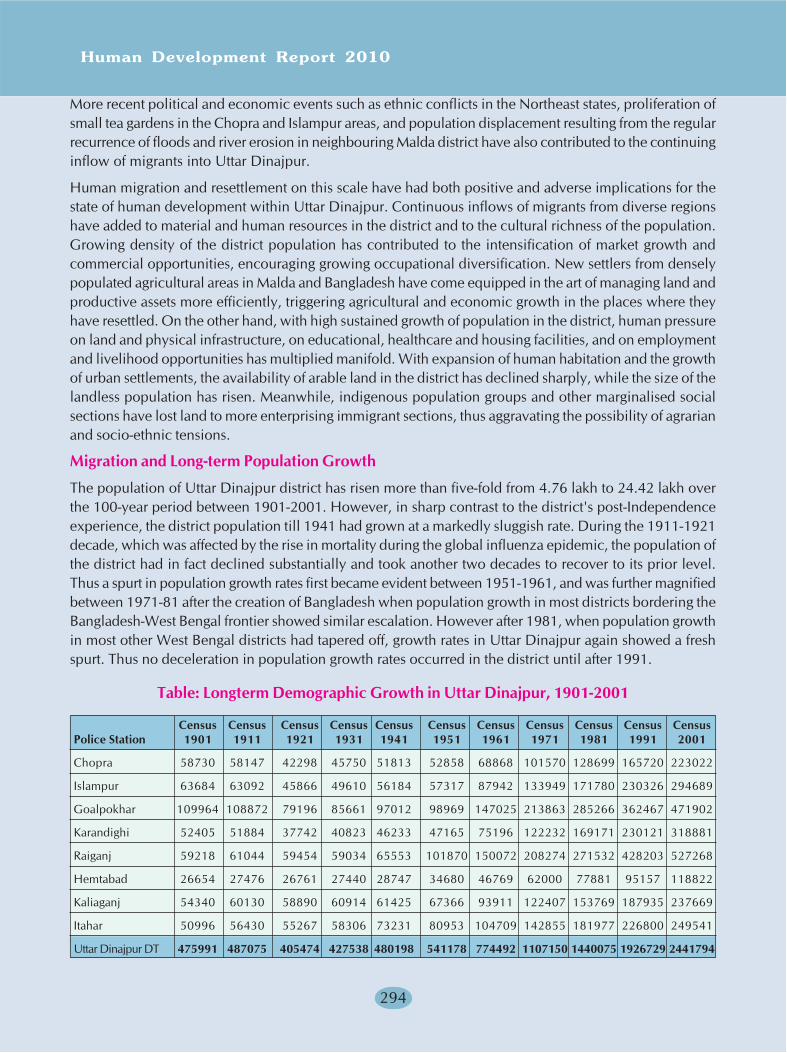
Human Development Report 2010
294
More recent political and economic events such as ethnic conflicts in the Northeast states, proliferation ofsmall tea gardens in the Chopra and Islampur areas, and population displacement resulting from the regularrecurrence of floods and river erosion in neighbouring Malda district have also contributed to the continuinginflow of migrants into Uttar Dinajpur.
Human migration and resettlement on this scale have had both positive and adverse implications for thestate of human development within Uttar Dinajpur. Continuous inflows of migrants from diverse regionshave added to material and human resources in the district and to the cultural richness of the population.Growing density of the district population has contributed to the intensification of market growth andcommercial opportunities, encouraging growing occupational diversification. New settlers from denselypopulated agricultural areas in Malda and Bangladesh have come equipped in the art of managing land andproductive assets more efficiently, triggering agricultural and economic growth in the places where theyhave resettled. On the other hand, with high sustained growth of population in the district, human pressureon land and physical infrastructure, on educational, healthcare and housing facilities, and on employmentand livelihood opportunities has multiplied manifold. With expansion of human habitation and the growthof urban settlements, the availability of arable land in the district has declined sharply, while the size of thelandless population has risen. Meanwhile, indigenous population groups and other marginalised socialsections have lost land to more enterprising immigrant sections, thus aggravating the possibility of agrarianand socio-ethnic tensions.
Migration and Long-term Population Growth
The population of Uttar Dinajpur district has risen more than five-fold from 4.76 lakh to 24.42 lakh overthe 100-year period between 1901-2001. However, in sharp contrast to the district's post-Independenceexperience, the district population till 1941 had grown at a markedly sluggish rate. During the 1911-1921decade, which was affected by the rise in mortality during the global influenza epidemic, the population ofthe district had in fact declined substantially and took another two decades to recover to its prior level.Thus a spurt in population growth rates first became evident between 1951-1961, and was further magnifiedbetween 1971-81 after the creation of Bangladesh when population growth in most districts bordering theBangladesh-West Bengal frontier showed similar escalation. However after 1981, when population growthin most other West Bengal districts had tapered off, growth rates in Uttar Dinajpur again showed a freshspurt. Thus no deceleration in population growth rates occurred in the district until after 1991.
Table: Longterm Demographic Growth in Uttar Dinajpur, 1901-2001
Census Census Census Census Census Census Census Census Census Census CensusPolice Station 1901 1911 1921 1931 1941 1951 1961 1971 1981 1991 2001
Chopra 58730 58147 42298 45750 51813 52858 68868 101570 128699 165720 223022
Islampur 63684 63092 45866 49610 56184 57317 87942 133949 171780 230326 294689
Goalpokhar 109964 108872 79196 85661 97012 98969 147025 213863 285266 362467 471902
Karandighi 52405 51884 37742 40823 46233 47165 75196 122232 169171 230121 318881
Raiganj 59218 61044 59454 59034 65553 101870 150072 208274 271532 428203 527268
Hemtabad 26654 27476 26761 27440 28747 34680 46769 62000 77881 95157 118822
Kaliaganj 54340 60130 58890 60914 61425 67366 93911 122407 153769 187935 237669
Itahar 50996 56430 55267 58306 73231 80953 104709 142855 181977 226800 249541
Uttar Dinajpur DT 475991 487075 405474 427538 480198 541178 774492 1107150 1440075 1926729 2441794
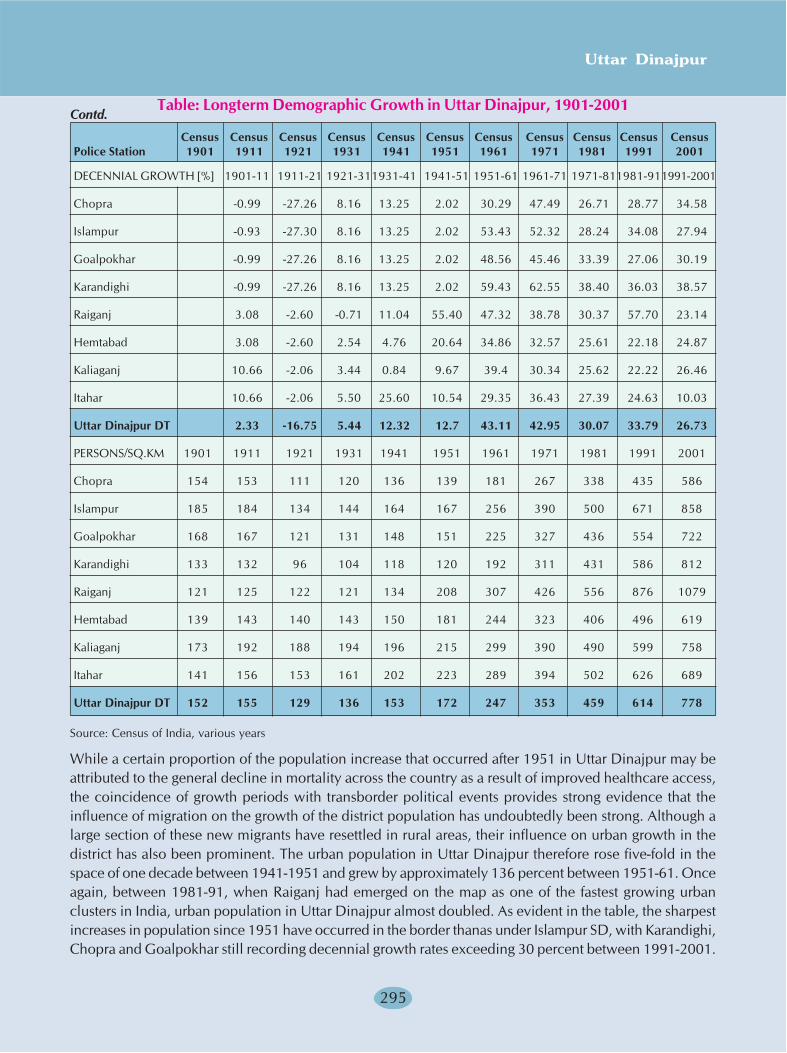
Uttar Dinajpur
295
DECENNIAL GROWTH [%] 1901-11 1911-21 1921-311931-41 1941-51 1951-61 1961-71 1971-811981-911991-2001
Chopra -0.99 -27.26 8.16 13.25 2.02 30.29 47.49 26.71 28.77 34.58
Islampur -0.93 -27.30 8.16 13.25 2.02 53.43 52.32 28.24 34.08 27.94
Goalpokhar -0.99 -27.26 8.16 13.25 2.02 48.56 45.46 33.39 27.06 30.19
Karandighi -0.99 -27.26 8.16 13.25 2.02 59.43 62.55 38.40 36.03 38.57
Raiganj 3.08 -2.60 -0.71 11.04 55.40 47.32 38.78 30.37 57.70 23.14
Hemtabad 3.08 -2.60 2.54 4.76 20.64 34.86 32.57 25.61 22.18 24.87
Kaliaganj 10.66 -2.06 3.44 0.84 9.67 39.4 30.34 25.62 22.22 26.46
Itahar 10.66 -2.06 5.50 25.60 10.54 29.35 36.43 27.39 24.63 10.03
Uttar Dinajpur DT 2.33 -16.75 5.44 12.32 12.7 43.11 42.95 30.07 33.79 26.73
PERSONS/SQ.KM 1901 1911 1921 1931 1941 1951 1961 1971 1981 1991 2001
Chopra 154 153 111 120 136 139 181 267 338 435 586
Islampur 185 184 134 144 164 167 256 390 500 671 858
Goalpokhar 168 167 121 131 148 151 225 327 436 554 722
Karandighi 133 132 96 104 118 120 192 311 431 586 812
Raiganj 121 125 122 121 134 208 307 426 556 876 1079
Hemtabad 139 143 140 143 150 181 244 323 406 496 619
Kaliaganj 173 192 188 194 196 215 299 390 490 599 758
Itahar 141 156 153 161 202 223 289 394 502 626 689
Uttar Dinajpur DT 152 155 129 136 153 172 247 353 459 614 778
Source: Census of India, various years
While a certain proportion of the population increase that occurred after 1951 in Uttar Dinajpur may beattributed to the general decline in mortality across the country as a result of improved healthcare access,the coincidence of growth periods with transborder political events provides strong evidence that theinfluence of migration on the growth of the district population has undoubtedly been strong. Although alarge section of these new migrants have resettled in rural areas, their influence on urban growth in thedistrict has also been prominent. The urban population in Uttar Dinajpur therefore rose five-fold in thespace of one decade between 1941-1951 and grew by approximately 136 percent between 1951-61. Onceagain, between 1981-91, when Raiganj had emerged on the map as one of the fastest growing urbanclusters in India, urban population in Uttar Dinajpur almost doubled. As evident in the table, the sharpestincreases in population since 1951 have occurred in the border thanas under Islampur SD, with Karandighi,Chopra and Goalpokhar still recording decennial growth rates exceeding 30 percent between 1991-2001.
Table: Longterm Demographic Growth in Uttar Dinajpur, 1901-2001
Census Census Census Census Census Census Census Census Census Census CensusPolice Station 1901 1911 1921 1931 1941 1951 1961 1971 1981 1991 2001
Contd.
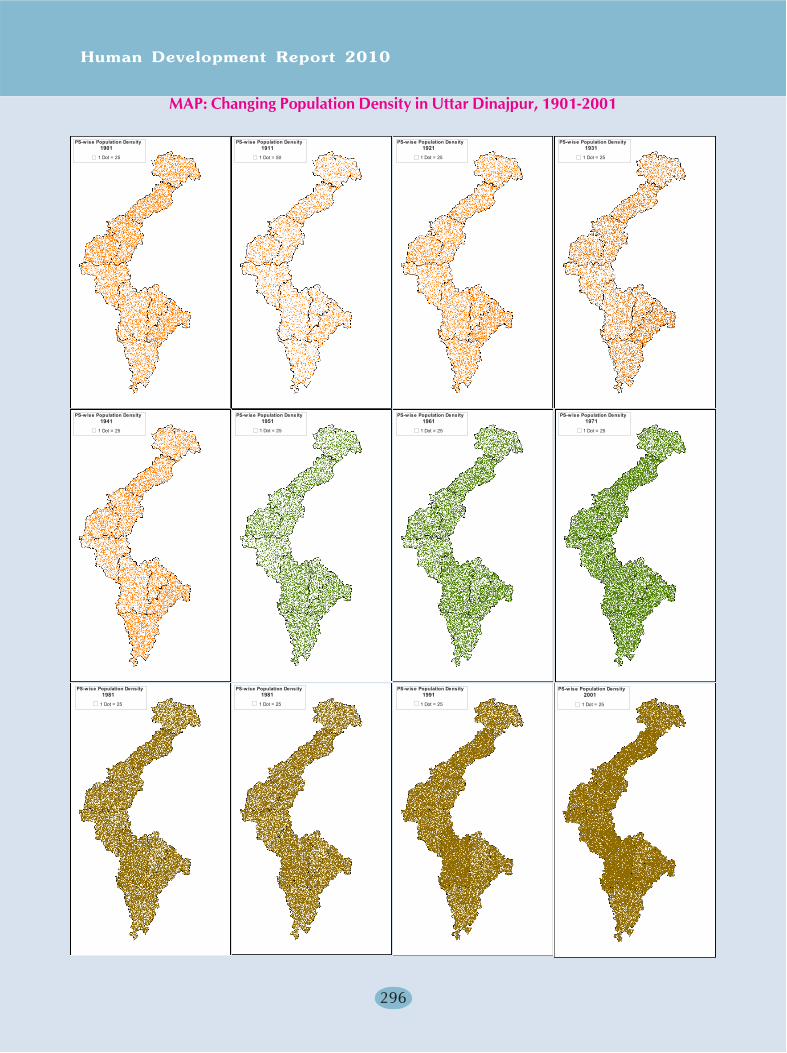
Human Development Report 2010
296
MAP: Changing Population Density in Uttar Dinajpur, 1901-2001
PS-wise Population Density1901
1 Dot = 25
PS-wise Population Density1911
1 Dot = 50
PS-wise Population Density1921
1 Dot = 25
PS-w ise Population Density1931
1 Dot = 25
PS-wise Population Density1941
1 Dot = 25
PS-w ise Population Density1951
1 Dot = 25
PS-wise Population Density1961
1 Dot = 25
PS-wise Population Density1971
1 Dot = 25
PS-w ise Population Density1981
1 Dot = 25
PS-w ise Population Density1981
1 Dot = 25
PS-wise Population Density1991
1 Dot = 25
PS-wise Population Density2001
1 Dot = 25
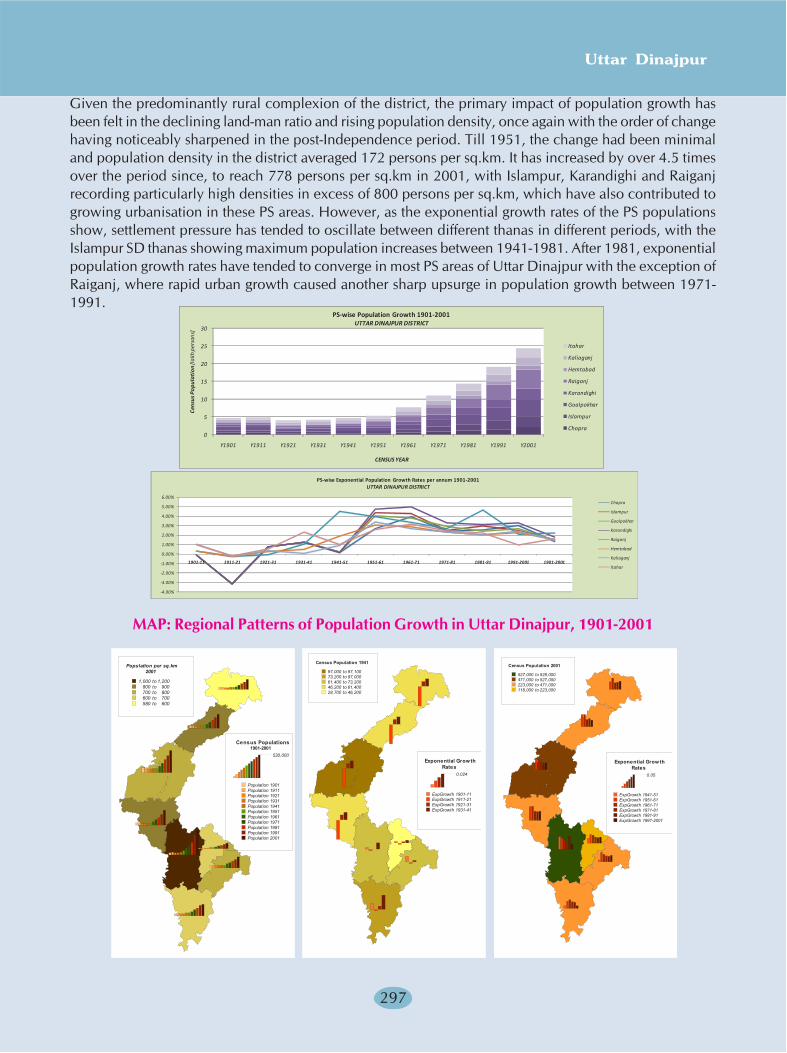
Uttar Dinajpur
297
Given the predominantly rural complexion of the district, the primary impact of population growth hasbeen felt in the declining land-man ratio and rising population density, once again with the order of changehaving noticeably sharpened in the post-Independence period. Till 1951, the change had been minimaland population density in the district averaged 172 persons per sq.km. It has increased by over 4.5 timesover the period since, to reach 778 persons per sq.km in 2001, with Islampur, Karandighi and Raiganjrecording particularly high densities in excess of 800 persons per sq.km, which have also contributed togrowing urbanisation in these PS areas. However, as the exponential growth rates of the PS populationsshow, settlement pressure has tended to oscillate between different thanas in different periods, with theIslampur SD thanas showing maximum population increases between 1941-1981. After 1981, exponentialpopulation growth rates have tended to converge in most PS areas of Uttar Dinajpur with the exception ofRaiganj, where rapid urban growth caused another sharp upsurge in population growth between 1971-1991.
MAP: Regional Patterns of Population Growth in Uttar Dinajpur, 1901-2001
0
5
10
15
20
25
30
Y1901 Y1911 Y1921 Y1931 Y1941 Y1951 Y1961 Y1971 Y1981 Y1991 Y2001
Cens
us P
opul
atio
n[la
kh p
erso
ns]
Itahar
Kaliaganj
Hemtabad
Raiganj
Karandighi
Goalpokhar
Islampur
Chopra
CENSUS YEAR
PS-wise Population Growth 1901-2001UTTAR DINAJPUR DISTRICT
-4.00%
-3.00%
-2.00%
-1.00%
0.00%
1.00%
2.00%
3.00%
4.00%
5.00%
6.00%
1901-11 1911-21 1921-31 1931-41 1941-51 1951-61 1961-71 1971-81 1981-91 1991-2001 1901-2001
Chopra
Islampur
Goalpokhar
Karandighi
Raiganj
Hemtabad
Kaliaganj
Itahar
PS-wise Exponential Population Growth Rates per annum 1901-2001UTTAR DINAJPUR DISTRICT
Census Populations1901-2001
530,000
Population 1901Population 1911Population 1921Population 1931Population 1941Population 1951Population 1961Population 1971Population 1981Population 1991Population 2001
Population per sq.km2001
1,000 to 1,200800 to 900700 to 800600 to 700580 to 600
Exponential Grow thRates
0.024
ExpGrowth 1901-11ExpGrowth 1911-21ExpGrowth 1921-31ExpGrowth 1931-41
Census Population 1941
97,000 to 97,10073,200 to 97,00061,400 to 73,20046,200 to 61,40028,700 to 46,200
Census Population 2001
527,000 to 528,000471,000 to 527,000223,000 to 471,000118,000 to 223,000
Exponential Grow thRates
0.05
ExpGrowth 1941-51ExpGrowth 1951-61ExpGrowth 1961-71ExpGrowth 1971-81ExpGrowth 1981-91ExpGrowth 1991-2001
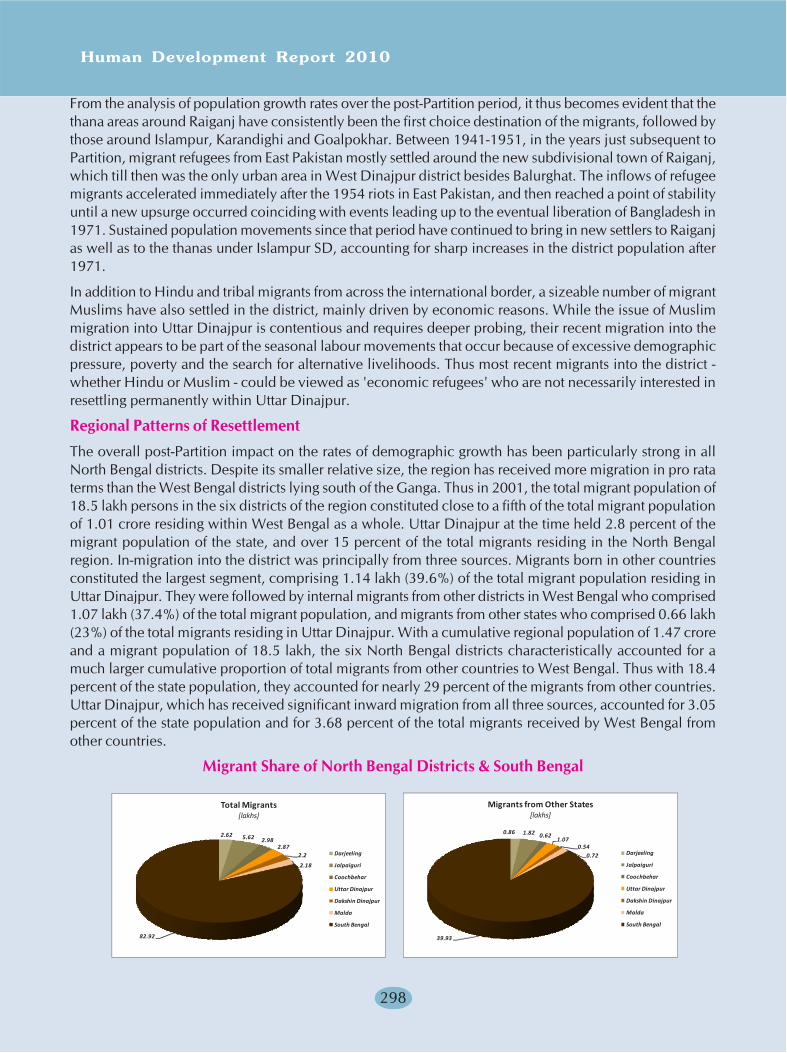
Human Development Report 2010
298
From the analysis of population growth rates over the post-Partition period, it thus becomes evident that thethana areas around Raiganj have consistently been the first choice destination of the migrants, followed bythose around Islampur, Karandighi and Goalpokhar. Between 1941-1951, in the years just subsequent toPartition, migrant refugees from East Pakistan mostly settled around the new subdivisional town of Raiganj,which till then was the only urban area in West Dinajpur district besides Balurghat. The inflows of refugeemigrants accelerated immediately after the 1954 riots in East Pakistan, and then reached a point of stabilityuntil a new upsurge occurred coinciding with events leading up to the eventual liberation of Bangladesh in1971. Sustained population movements since that period have continued to bring in new settlers to Raiganjas well as to the thanas under Islampur SD, accounting for sharp increases in the district population after1971.
In addition to Hindu and tribal migrants from across the international border, a sizeable number of migrantMuslims have also settled in the district, mainly driven by economic reasons. While the issue of Muslimmigration into Uttar Dinajpur is contentious and requires deeper probing, their recent migration into thedistrict appears to be part of the seasonal labour movements that occur because of excessive demographicpressure, poverty and the search for alternative livelihoods. Thus most recent migrants into the district -whether Hindu or Muslim - could be viewed as 'economic refugees' who are not necessarily interested inresettling permanently within Uttar Dinajpur.
Regional Patterns of Resettlement
The overall post-Partition impact on the rates of demographic growth has been particularly strong in allNorth Bengal districts. Despite its smaller relative size, the region has received more migration in pro rataterms than the West Bengal districts lying south of the Ganga. Thus in 2001, the total migrant population of18.5 lakh persons in the six districts of the region constituted close to a fifth of the total migrant populationof 1.01 crore residing within West Bengal as a whole. Uttar Dinajpur at the time held 2.8 percent of themigrant population of the state, and over 15 percent of the total migrants residing in the North Bengalregion. In-migration into the district was principally from three sources. Migrants born in other countriesconstituted the largest segment, comprising 1.14 lakh (39.6%) of the total migrant population residing inUttar Dinajpur. They were followed by internal migrants from other districts in West Bengal who comprised1.07 lakh (37.4%) of the total migrant population, and migrants from other states who comprised 0.66 lakh(23%) of the total migrants residing in Uttar Dinajpur. With a cumulative regional population of 1.47 croreand a migrant population of 18.5 lakh, the six North Bengal districts characteristically accounted for amuch larger cumulative proportion of total migrants from other countries to West Bengal. Thus with 18.4percent of the state population, they accounted for nearly 29 percent of the migrants from other countries.Uttar Dinajpur, which has received significant inward migration from all three sources, accounted for 3.05percent of the state population and for 3.68 percent of the total migrants received by West Bengal fromother countries.
Migrant Share of North Bengal Districts & South Bengal
2.62 5.62 2.982.87
2.2
2.18
82.92
Total Migrants[lakhs]
Darjeeling
Jalpaiguri
Coochbehar
Uttar Dinajpur
Dakshin Dinajpur
Malda
South Bengal
0.86 1.82 0.621.07
0.540.72
39.93
Migrants from Other States[lakhs]
Darjeeling
Jalpaiguri
Coochbehar
Uttar Dinajpur
Dakshin Dinajpur
Malda
South Bengal
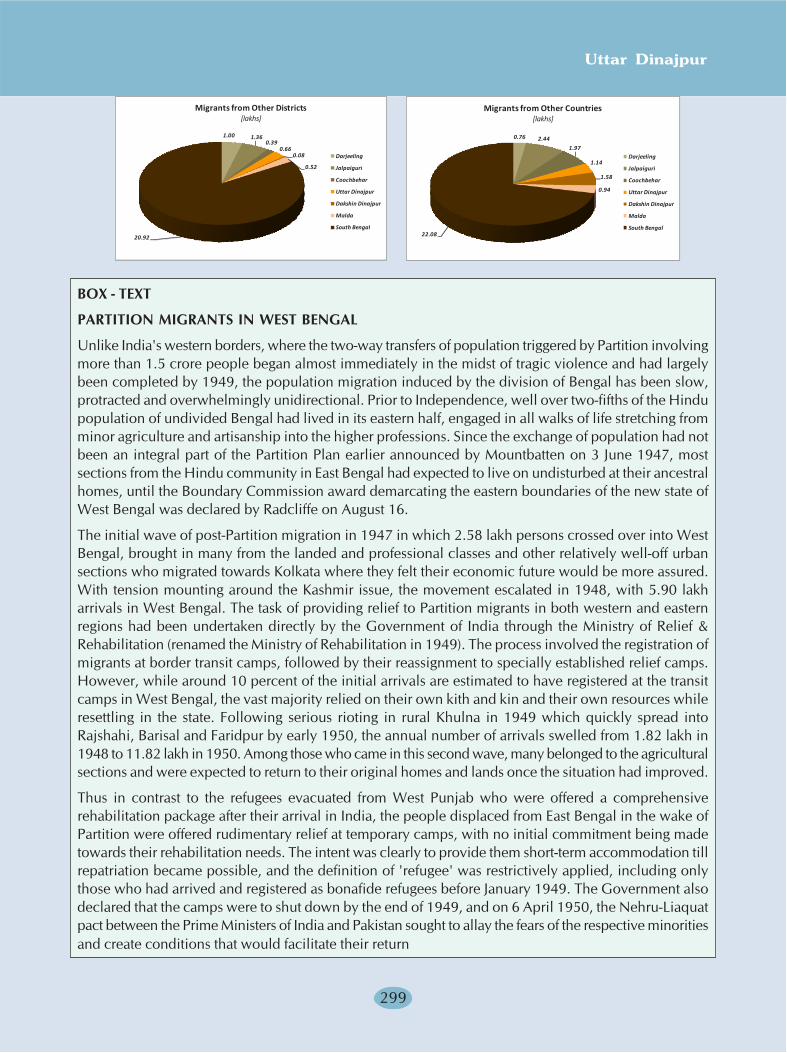
Uttar Dinajpur
299
1.00 1.360.39
0.660.08
0.52
20.92
Migrants from Other Districts[lakhs]
Darjeeling
Jalpaiguri
Coochbehar
Uttar Dinajpur
Dakshin Dinajpur
Malda
South Bengal
0.76 2.44
1.97
1.14
1.58
0.94
22.08
Migrants from Other Countries[lakhs]
Darjeeling
Jalpaiguri
Coochbehar
Uttar Dinajpur
Dakshin Dinajpur
Malda
South Bengal
BOX - TEXT
PARTITION MIGRANTS IN WEST BENGAL
Unlike India's western borders, where the two-way transfers of population triggered by Partition involvingmore than 1.5 crore people began almost immediately in the midst of tragic violence and had largelybeen completed by 1949, the population migration induced by the division of Bengal has been slow,protracted and overwhelmingly unidirectional. Prior to Independence, well over two-fifths of the Hindupopulation of undivided Bengal had lived in its eastern half, engaged in all walks of life stretching fromminor agriculture and artisanship into the higher professions. Since the exchange of population had notbeen an integral part of the Partition Plan earlier announced by Mountbatten on 3 June 1947, mostsections from the Hindu community in East Bengal had expected to live on undisturbed at their ancestralhomes, until the Boundary Commission award demarcating the eastern boundaries of the new state ofWest Bengal was declared by Radcliffe on August 16.
The initial wave of post-Partition migration in 1947 in which 2.58 lakh persons crossed over into WestBengal, brought in many from the landed and professional classes and other relatively well-off urbansections who migrated towards Kolkata where they felt their economic future would be more assured.With tension mounting around the Kashmir issue, the movement escalated in 1948, with 5.90 lakharrivals in West Bengal. The task of providing relief to Partition migrants in both western and easternregions had been undertaken directly by the Government of India through the Ministry of Relief &Rehabilitation (renamed the Ministry of Rehabilitation in 1949). The process involved the registration ofmigrants at border transit camps, followed by their reassignment to specially established relief camps.However, while around 10 percent of the initial arrivals are estimated to have registered at the transitcamps in West Bengal, the vast majority relied on their own kith and kin and their own resources whileresettling in the state. Following serious rioting in rural Khulna in 1949 which quickly spread intoRajshahi, Barisal and Faridpur by early 1950, the annual number of arrivals swelled from 1.82 lakh in1948 to 11.82 lakh in 1950. Among those who came in this second wave, many belonged to the agriculturalsections and were expected to return to their original homes and lands once the situation had improved.
Thus in contrast to the refugees evacuated from West Punjab who were offered a comprehensiverehabilitation package after their arrival in India, the people displaced from East Bengal in the wake ofPartition were offered rudimentary relief at temporary camps, with no initial commitment being madetowards their rehabilitation needs. The intent was clearly to provide them short-term accommodation tillrepatriation became possible, and the definition of 'refugee' was restrictively applied, including onlythose who had arrived and registered as bonafide refugees before January 1949. The Government alsodeclared that the camps were to shut down by the end of 1949, and on 6 April 1950, the Nehru-Liaquatpact between the Prime Ministers of India and Pakistan sought to allay the fears of the respective minoritiesand create conditions that would facilitate their return
Human Development Report 2010
300
Meanwhile, to disperse the new arrivals who had tended till then to crowd into Kolkata, new camps hadbeen set up at widely dispersed rural locations across the state, with one each being located in thedistricts of West Dinajpur and Coochbehar in North Bengal. The new wave of migration from agriculturalsections was therefore redirected increasingly to these dispersed rural camps. While the Nehru-Liaquatpact was able to create safe conditions for the return migration of the Muslims who had fled from WestBengal in the wake of widespread communal tension following the Khulna riots, there was little reciprocalmigration of Hindus back into East Pakistan because of continuing threat perceptions.
By the end of 1951, the flood of Partition migrants into West Bengal was estimated to have reached23.66 lakh. Around four-fifths of them had resettled in the South Bengal districts - particularly in Kolkata,Nadia and 24-Parganas, while West Dinajpur, Jalpaiguri and Coochbehar districts had accommodatedthe rest. West Dinajpur alone accounted for around 6.5 percent of the total Partition migrants receivedby West Bengal uptil 1951. The patterns of refugee resettlement in Uttar Dinajpur have thus closelyfollowed the changing economic complexion of the migrants. The more educated and financially securesections who arrived during the first migration wave had preferred to move into urban settlements likeRaiganj and Kaliaganj, while the later arrivals from the agricultural sections preferred to move to campsand settlements in rural areas, where there would be more opportunity to return to their traditionallivelihoods.
Instead of being shut down in 1949 as first intended, the relief camps in West Bengal soon swelled withcontinuous arrivals of new migrants fleeing from recurrent disturbances in East Pakistan. Most of thesenew arrivals had abandoned everything during their flight, and arrived destitute and without privatechannels of economic support. In 1952, when the passport system that had been introduced betweenIndia and West Pakistan in 1948 was extended to East Pakistan to restrict the admissions of persons whomight choose to stay on in West Bengal, another spate of migration ensued among those sections whowere afraid that the door might close on their entry. Fresh disturbances in East Pakistan connected withthe language agitation in 1955 and the adoption of an Islamic constitution in Pakistan in 1956 furthertraumatised the minorities, leading to cumulative arrivals of 4.30 lakh migrants over these two years.From 1956, the additional compulsion of having to procure valid migration certificates at the bordertransit point before being allowed entry into West Bengal slowed down legal arrivals of East Bengalmigrants to a trickle, and annual arrivals till 1961 ebbed to under 10 thousand each year. In the interim,the Government also announced that all relief work at the transit camps would end from 21 March 1958and no migrants would be eligible to be registered for Government relief after that date. Till 1961, WestBengal was estimated to have received 30.69 lakh migrants from East Pakistan, of whom 24 percent hadresettled in the North Bengal districts. Around 1.72 lakh migrants had resettled till that time in WestDinajpur. Through the 1960s, new arrivals were generally low, except in 1964-65 when snowballingdisturbances connected with the Hazratbal incident caused another 8.01 lakh migrants to flee EastPakistan, of whom around 5.00 lakh were absorbed in West Bengal.
The State Government had by then already declared that no new migrants would be provided reliefwithin the overburdened state, and therefore invoked assistance from the Government of India in dispersingthe new arrivals to other provinces. After an intervening lull, another wave of migration brought in 2.50lakh new arrivals in 1970, during the political tensions arising from the free Pakistan elections thatinexorably swept Sheikh Mujibur Rahman to power and Bangladesh to its bloody battle for independence.In the liberation struggle following the declaration of independence by Bangladesh on 25 March 1971,around 1 crore Bengali-speaking refugees from both Hindu and Muslim communities were estimated tohave taken shelter at relief camps on the West Bengal side of the border. They returned after Decemberthat year to a new country that had optimistically promised to distance itself from the legacy of Partition.
Uttar Dinajpur
301
Although all post-Partition migrants in West Bengal were generally referred to in colloquial terms as EastBengal refugees, official and legal orders issued at the time preferred to describe them as East PakistanDisplaced Persons [EPDPs]. This technical terminology which applied to all persons who had ordinarilybeen resident in the territories that were included in East Pakistan, and had migrated because of Partition,or because of the occurrence of subsequent civil disturbances or the fear of their occurrence (Ministry ofRehabilitation, 1957), was different from the definition of 'displaced persons' used in reference to theWest Pakistan refugees. Registered migrants arriving between October 1946 and 31 March 1958 weretermed old migrants, whose resettlement and rehabilitation was governed by the terms of the WestBengal Rehabilitation of Displaced Persons & Eviction of Persons in Unauthorised Occupation of LandAct, 1951 (West Bengal Act XVI of 1951). The designation thus applied to the 41.17 lakh DPs who hadarrived between those dates, among whom 31.32 lakh resettled in West Bengal. Later entrants who hadarrived between 1 January 1964 and 25 March 1971 were designated as new migrants, and were notprovided rehabilitation assistance unless they were willing to be resettled outside West Bengal. Thisnew definition covered approximately 11.14 lakh persons who arrived between 1964 and 25.3.1971.
Refugee families who had migrated to Uttar Dinajpur soon after Partition in 1947 had initially preferred toresettle in the urban areas of the district. Around major urban centres like Raiganj and Kaliaganj, therefugee settlers occupied vacant public lands or lands that had been left untended by emigrating Muslimsand thus established several refugee colonies. However, more well-off sections among the migrants generallypreferred to purchase land which was relatively cheap and abundantly available at the time, for constructionof their own houses. Among the later migrants who have arrived in Uttar Dinajpur from East Bengal overthe last two decades, the more visible tendency has been to resettle in rural areas. Migrant families whohave brought in some capital have generally chosen roadside settlements or rural markets, where they cancombine agriculture and small enterprise as sources for their livelihood. Poorer migrant sections whocame in without much education or material resources generally work as agricultural labourers,sharecroppers or marginal farmers. These resettlement preferences have also significantly influenced therural settlement structure of the district. Most roadside and market settlements are thus occupied chiefly byrefugee migrants, indigenous rural sections comprising the ST communities, the Rajbanshis and the Muslimsreside in their traditional villages which are usually located in the interior, at some distance from roads andmarkets.
Studies on refugee communities conducted by the Department of Sociology at North Bengal Universityhave documented the circumstances, times and modes of their migration and resettlement in various districtsof North Bengal including Uttar Dinajpur. Pertinent findings from some of these studies are summarisedbelow.
(i) Most refugee families who have migrated into the district during non-conflict periods havepreferred step migration. The migrating family has thus initially sent an adult male belongingto the family to a pre-selected area where it has prior social or kinship connections. Withsupport from these local networks, the initial migrant has established an earning avenue forhimself either in agriculture or some form of petty trade, purchased some homestead land andconstructed a house, while preparing the ground for migration of other family members. Finally,the family disposes of whatever immovable property it holds at its original place of settlement,before migrating as a group.
Human Development Report 2010
302
(ii) Refugee families have often had to try out several transitory settlements before finally locatinga place that is conducive for permanent resettlement, suggesting that they initially pass througha period of insecurity as well as uncertainty before finding stable occupations and sources oflivelihood.
(iii) Immigrants from East Pakistan/Bangladesh have arrived in Uttar Dinajpur almost equal numbersbefore and after 1971. Migrants who had entered after 25 March 1971, and are 'illegal' migrantsunder terms defined by the 1974 Land Boundary agreement (otherwise known as the Indira-Mujib accord), have not claimed refugee status and sought assistance from governmentsponsored rehabilitation packages. Instead, they have sought to rehabilitate themselves ontheir own. Many among them have, because of innate resilience and adaptation, subsequentlymoved to a respectable niche within the socioeconomic, cultural and political order of theirnew place of residence, after surmounting the initial years of struggle.
(iv) However, because of their illegal status, migrants who resettled in Uttar Dinajpur after 25March 1971 have also faced greater hardships in fitting themselves into their new places ofresettlement. Education and certificates acquired before they left Bangladesh hold little valuewhen seeking employment in India. Hence this effectively limits the formal employmentopportunities available to these migrants, forcing them to seek other livelihood alternatives inthe agricultural sector or in the petty trade.
(v) Most refugee families had arrived in Uttar Dinajpur with limited education and materialresources. Many among them however possessed superior skills in cultivation and traditionalcaste-based artisanal crafts and trades, which they have deployed effectively in securingeconomic rehabilitation. Because of their limited access to formal employment, they havealso depended disproportionately on informal occupations like rickshaw pulling, beedi bindingor petty trade and vending activities. Thus during their process of economic adaptation, therefugee migrants have also contributed to occupational diversification and agricultural andeconomic development in the district.
(vi) Exercising increasing leverage over the accommodative social and political environment intheir new home district, migrant communities have consistently outscored the older districtresidents in all spheres of economic, social and political achievement. The consequentialalienation of lands formerly held by these older residents and the growing control over socialand political power structures exercised by the initial migrants and by their children born inIndia have been integral to this process. Children from migrant families have also outdonetheir local peers in terms of educational achievement, and have therefore benefited considerablyfrom increased occupational mobility.
(vii) Old village, caste and kinship networks have played a significant role in aiding refugeeresettlement. Before migrating, the refugee families gather as much information as possibleabout their probable destinations through communication with these networks, and also securepsychological and social support by resettling close to them after migration. Fellow villagersand kinsfolk who had migrated successfully earlier are also able to protect new arrivals fromharassment by the authorities and from the threat of deportation. Network support also assiststhem to be naturalised as Indian citizens in due course of time.
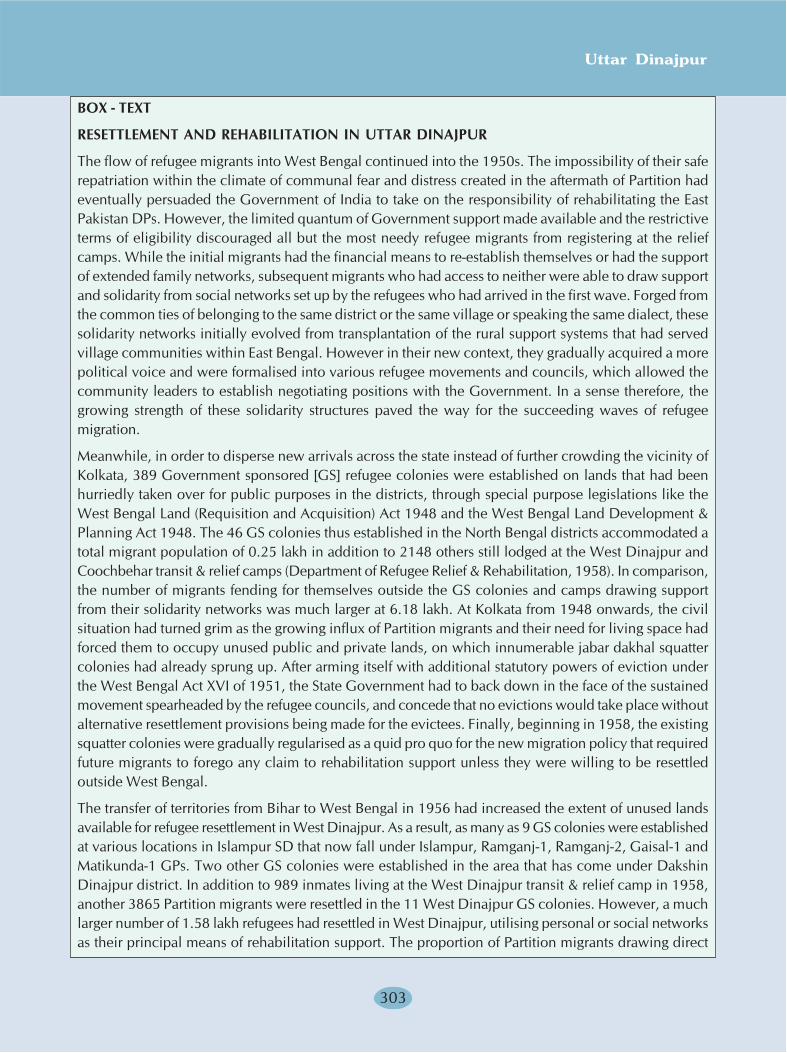
Uttar Dinajpur
303
BOX - TEXT
RESETTLEMENT AND REHABILITATION IN UTTAR DINAJPUR
The flow of refugee migrants into West Bengal continued into the 1950s. The impossibility of their saferepatriation within the climate of communal fear and distress created in the aftermath of Partition hadeventually persuaded the Government of India to take on the responsibility of rehabilitating the EastPakistan DPs. However, the limited quantum of Government support made available and the restrictiveterms of eligibility discouraged all but the most needy refugee migrants from registering at the reliefcamps. While the initial migrants had the financial means to re-establish themselves or had the supportof extended family networks, subsequent migrants who had access to neither were able to draw supportand solidarity from social networks set up by the refugees who had arrived in the first wave. Forged fromthe common ties of belonging to the same district or the same village or speaking the same dialect, thesesolidarity networks initially evolved from transplantation of the rural support systems that had servedvillage communities within East Bengal. However in their new context, they gradually acquired a morepolitical voice and were formalised into various refugee movements and councils, which allowed thecommunity leaders to establish negotiating positions with the Government. In a sense therefore, thegrowing strength of these solidarity structures paved the way for the succeeding waves of refugeemigration.
Meanwhile, in order to disperse new arrivals across the state instead of further crowding the vicinity ofKolkata, 389 Government sponsored [GS] refugee colonies were established on lands that had beenhurriedly taken over for public purposes in the districts, through special purpose legislations like theWest Bengal Land (Requisition and Acquisition) Act 1948 and the West Bengal Land Development &Planning Act 1948. The 46 GS colonies thus established in the North Bengal districts accommodated atotal migrant population of 0.25 lakh in addition to 2148 others still lodged at the West Dinajpur andCoochbehar transit & relief camps (Department of Refugee Relief & Rehabilitation, 1958). In comparison,the number of migrants fending for themselves outside the GS colonies and camps drawing supportfrom their solidarity networks was much larger at 6.18 lakh. At Kolkata from 1948 onwards, the civilsituation had turned grim as the growing influx of Partition migrants and their need for living space hadforced them to occupy unused public and private lands, on which innumerable jabar dakhal squattercolonies had already sprung up. After arming itself with additional statutory powers of eviction underthe West Bengal Act XVI of 1951, the State Government had to back down in the face of the sustainedmovement spearheaded by the refugee councils, and concede that no evictions would take place withoutalternative resettlement provisions being made for the evictees. Finally, beginning in 1958, the existingsquatter colonies were gradually regularised as a quid pro quo for the new migration policy that requiredfuture migrants to forego any claim to rehabilitation support unless they were willing to be resettledoutside West Bengal.
The transfer of territories from Bihar to West Bengal in 1956 had increased the extent of unused landsavailable for refugee resettlement in West Dinajpur. As a result, as many as 9 GS colonies were establishedat various locations in Islampur SD that now fall under Islampur, Ramganj-1, Ramganj-2, Gaisal-1 andMatikunda-1 GPs. Two other GS colonies were established in the area that has come under DakshinDinajpur district. In addition to 989 inmates living at the West Dinajpur transit & relief camp in 1958,another 3865 Partition migrants were resettled in the 11 West Dinajpur GS colonies. However, a muchlarger number of 1.58 lakh refugees had resettled in West Dinajpur, utilising personal or social networksas their principal means of rehabilitation support. The proportion of Partition migrants drawing direct
Human Development Report 2010
304
Government relief was thus very low at under 4 percent in West Dinajpur and under 5 percent in theother North Bengal districts, compared to 18 percent for South Bengal. In 2008, 2121 registered refugeefamilies were still residing in the Uttar Dinajpur GS colonies, indicating that settlement density at theseauthorised rural colonies had multiplied manifold after 1958.
Although no GS colonies were established in Raiganj SD where the majority of Partition migrants hadpreferred to squat on unused lands on the outskirts of Raiganj rather than moving into rural areas, mostearly settlers at these squatter colonies had migrated over relatively short distances from the parts ofDinajpur district that had gone to East Pakistan. Later migrants who came from more distant East Bengaldistricts either moved into these existing colonies or set up new ones of their own. In the 'old migration'period between 1947-58, 9 such squatter colonies came to be established on vested and unused privatelands in and around the township of Raiganj, at places like Shilpinagar, Shaktinagar, etc. Another 2squatter colonies were established during the same period in the vicinity of Kaliaganj. All these werecollectively classified under the 607 group and have mostly been regularised under subsequent CentralGovernment sponsored land-titling schemes which entitled their resident families to freehold possessionof individual plots after the colony lands were vested with the Government. Similarly, the 4 rural squattercolonies under the 607 group established in Ramganj-2 and Gobindpur GPs in Islampur block, and 12squatter colonies under the same group established in Majhiali, Kamalagaon-Sujali, Haptiagachh andSonapur GPs in Chopra blocks have also been regularised. In 2008, 4429 refugee families were residingin 27 squatter colonies under the 607 group in Uttar Dinajpur district as a whole, 94 percent of whomhad already received freehold possession of their plots. While the 607 group colonies located in theurban areas around Raiganj and Kaliaganj were relatively smaller and held between 66-176 migrantfamilies, each rural 607 group colony in Islampur SD held an average of 354 families, while the largestof these located at Subandigachh under Majhiali GP and Tin-mile Road under Sonapur GP had 434-464resident families. Islampur SD thus held over two-thirds of the Partition migrants who had resettled inUttar Dinajpur before 1958 and had rehabilitated themselves through their own efforts. The 607 groupcolonies in Islampur SD were thus much larger than the GS colonies. The role played by the socialnetworks of the Partition refugees in assisting the subsequent resettlement of their fellow sufferers inUttar Dinajpur is clearly evident from such figures.
In addition to the 607 group colonies which constitute the dominant section of squatter colonies establishedby Partition refugees in Uttar Dinajpur, one colony under the 175 group, housing 301 migrant families,exists at Indira Nagar in Raiganj. While this large colony has also subsequently been regularised withCentral Government support, 3 other squatter colonies of new migrants under the 998 group in RaiganjSD and one colony under the 998 group in Islampur SD have also subsequently been regularised at theinitiative of the State Government. However, from the overall rate of dropouts during the land-titlingprocess, it becomes evident that around 2 percent of the registered refugee families who had initiallyresettled in Islampur SD have subsequently migrated away. While another 66 families living at theShilpinagar-1 refugee colony are caught up in court litigations, around 1.5 percent of the migrant familiesat the other Uttar Dinajpur refugee colonies have been unable to produce valid refugee certificates at thetime of claiming title rights to their lands, as a result of which their cases are still pending.
Uttar Dinajpur district thus has a total of 42 squatter colonies housing registered Partition migrants whohad arrived in the district either between 1947 and 1958 (old migrants) or 1964 and 25 March 1971.While around 14 of these are urban colonies located within the municipal limits of Raiganj and Kaliaganj,the rural colonies scattered across Islampur and Chopra blocks contain over four-fifths of the registeredrefugee families in the old and new categories. No official records of registered Partition migrants exist
Uttar Dinajpur
305
for the intervening period between 1959-1963 when the registration of refugee families in West Bengalhad officially ceased. While a number of byanama and private refugee colonies were also established inWest Dinajpur in the pre-1971 period through loan-based or privately funded schemes under whichlegal title to the colony lands had been secured through outright purchase, the precise locations and thenumber of refugee families accommodated in these is difficult to ascertain because of the absence ofappropriate records. No official records obviously exist of later resettlements in Uttar Dinajpur in thepost-1971 period, when the legal right to claim refugee status had ceased. Sharp growth of population inUttar Dinajpur over the subsequent period would however suggest that the flow of migration remainedunabated until very recently. After 1971, undocumented migration into the district has been sustainedthrough the extensive social networks already established within the refugee community, aiding therehabilitation and resettlement of later migrants in Uttar Dinajpur.
Migration in the post-1971 Period
The erstwhile West Dinajpur region has evidently been especially prone to migratory movements of populationafter the 1947 partition of Bengal. Longterm migration and resettlement in the region can however beseparated into two distinct phases. Transborder migration into Uttar & Dakshin Dinajpur between 1947-1971 had been heavily influenced by the legal right of entry accorded to migrants from East Pakistan whosedisplacement could be directly attributed to the extended consequences of Partition. In the post-1971phase after the formation of Bangladesh, migration and resettlement from across the international bordercan no longer be ascribed to Partition and is therefore no longer a matter of right. Nevertheless, UttarDinajpur has continued to receive undocumented distress migration as well as economic migration fromacross the international border, in addition to domestic migration streams from adjoining West Bengaldistricts and the adjoining state of Bihar.
Although truncation of the original Dinajpur district into separate eastern and western territories that werealternately assigned to East Pakistan and India under the Radcliffe award produced compensating movementsof population in the immediate aftermath of Partition, such movements initially amounted to local migrationfrom one subdivision of the district to another. However, the 227km-long open international border createdby the act of Partition turned several border areas in Uttar Dinajpur as well as adjoining Dakshin Dinajpurinto corridors for major movements of DPs during the subsequent waves of migration from other districtsthat had been assigned to East Pakistan. In addition to these waves of international resettlement, UttarDinajpur has also received significant migration from adjoining districts in Bihar since 1956 when IslampurSD was transferred to West Bengal. Although linguistically and culturally distinct from each other, bothstreams of migration proceeded on similar lines, i.e., with the support of social and kinship networks thatexisted among people who had relocated earlier to West Dinajpur. In addition to the resettlement ofdisplaced families, there was also economic migration by single males, who with time either married intothese networks or brought in spouses from outside the district. Although not as strong as they were duringthe post-Partition disturbances, such patterns have continued into the present day.
Longterm migration trends in the districts of Uttar Dinajpur and Dakshin Dinajpur can be identified fromthe D-Series migration tables of successive Indian Censuses for the extended 30-year period 1971-2001.These tables classify migration trends under the two categories of longterm or lifetime migration defined inCensus data relating to place of birth and short-term or intercensal migration defined in Census data relatingto the place of last residence. The period 1971-2001 assumes special significance because it commenceswith the events subsequent to 25 March 1971 following the military crackdown in East Pakistan whichcaused an estimated 10 million refugees to flee into adjoining West Bengal districts including undivided
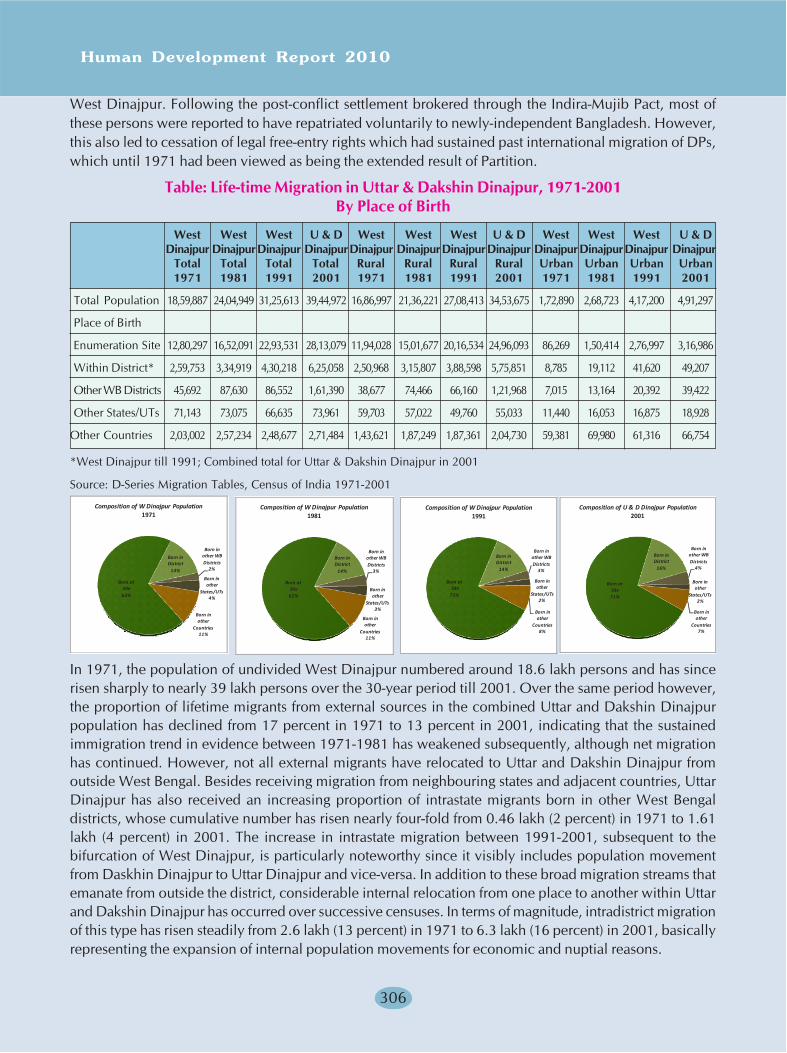
Human Development Report 2010
306
West Dinajpur. Following the post-conflict settlement brokered through the Indira-Mujib Pact, most ofthese persons were reported to have repatriated voluntarily to newly-independent Bangladesh. However,this also led to cessation of legal free-entry rights which had sustained past international migration of DPs,which until 1971 had been viewed as being the extended result of Partition.
Table: Life-time Migration in Uttar & Dakshin Dinajpur, 1971-2001By Place of Birth
West West West U & D West West West U & D West West West U & DDinajpur DinajpurDinajpur DinajpurDinajpur DinajpurDinajpurDinajpur DinajpurDinajpurDinajpur Dinajpur
Total Total Total Total Rural Rural Rural Rural Urban Urban Urban Urban1971 1981 1991 2001 1971 1981 1991 2001 1971 1981 1991 2001
Total Population 18,59,887 24,04,949 31,25,613 39,44,972 16,86,997 21,36,221 27,08,413 34,53,675 1,72,890 2,68,723 4,17,200 4,91,297
Place of Birth
Enumeration Site 12,80,297 16,52,091 22,93,531 28,13,079 11,94,028 15,01,677 20,16,534 24,96,093 86,269 1,50,414 2,76,997 3,16,986
Within District* 2,59,753 3,34,919 4,30,218 6,25,058 2,50,968 3,15,807 3,88,598 5,75,851 8,785 19,112 41,620 49,207
Other WB Districts 45,692 87,630 86,552 1,61,390 38,677 74,466 66,160 1,21,968 7,015 13,164 20,392 39,422
Other States/UTs 71,143 73,075 66,635 73,961 59,703 57,022 49,760 55,033 11,440 16,053 16,875 18,928
Other Countries 2,03,002 2,57,234 2,48,677 2,71,484 1,43,621 1,87,249 1,87,361 2,04,730 59,381 69,980 61,316 66,754
*West Dinajpur till 1991; Combined total for Uttar & Dakshin Dinajpur in 2001
Source: D-Series Migration Tables, Census of India 1971-2001
In 1971, the population of undivided West Dinajpur numbered around 18.6 lakh persons and has sincerisen sharply to nearly 39 lakh persons over the 30-year period till 2001. Over the same period however,the proportion of lifetime migrants from external sources in the combined Uttar and Dakshin Dinajpurpopulation has declined from 17 percent in 1971 to 13 percent in 2001, indicating that the sustainedimmigration trend in evidence between 1971-1981 has weakened subsequently, although net migrationhas continued. However, not all external migrants have relocated to Uttar and Dakshin Dinajpur fromoutside West Bengal. Besides receiving migration from neighbouring states and adjacent countries, UttarDinajpur has also received an increasing proportion of intrastate migrants born in other West Bengaldistricts, whose cumulative number has risen nearly four-fold from 0.46 lakh (2 percent) in 1971 to 1.61lakh (4 percent) in 2001. The increase in intrastate migration between 1991-2001, subsequent to thebifurcation of West Dinajpur, is particularly noteworthy since it visibly includes population movementfrom Daskhin Dinajpur to Uttar Dinajpur and vice-versa. In addition to these broad migration streams thatemanate from outside the district, considerable internal relocation from one place to another within Uttarand Dakshin Dinajpur has occurred over successive censuses. In terms of magnitude, intradistrict migrationof this type has risen steadily from 2.6 lakh (13 percent) in 1971 to 6.3 lakh (16 percent) in 2001, basicallyrepresenting the expansion of internal population movements for economic and nuptial reasons.
Born at Site62%
Born in District
14%
Born in other WB Districts
2%
Born in other
States/UTs4%
Born in other
Countries11%
Composition of W Dinajpur Population 1971
Born at Site62%
Born in District
14%
Born in other WB Districts
3%
Born in other
States/UTs3%
Born in other
Countries11%
Composition of W Dinajpur Population 1981
Born atSite
73%
Born in District
14%
Born in other WB Districts
3%
Born in other
States/UTs2%
Born in other
Countries8%
Composition of W Dinajpur Population 1991
Born atSite71%
Born in District
16%
Born in other WB Districts
4%
Born in other
States/UTs2%
Born in other
Countries7%
Composition of U & D Dinajpur Population 2001
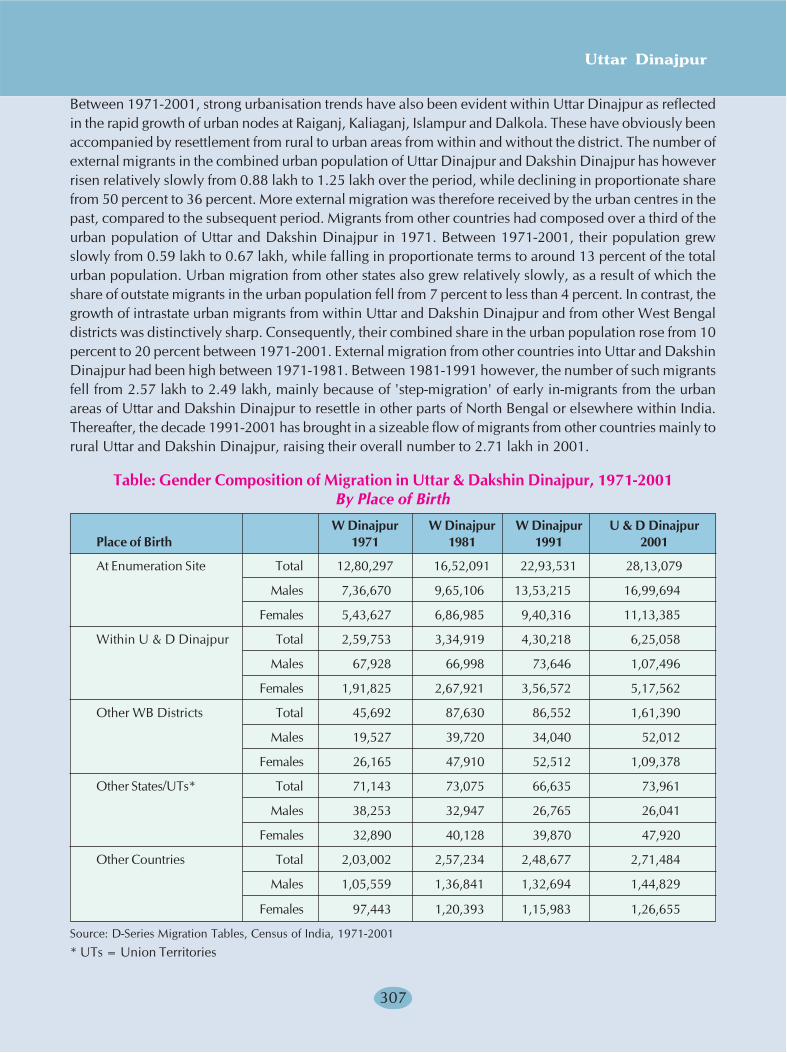
Uttar Dinajpur
307
Between 1971-2001, strong urbanisation trends have also been evident within Uttar Dinajpur as reflectedin the rapid growth of urban nodes at Raiganj, Kaliaganj, Islampur and Dalkola. These have obviously beenaccompanied by resettlement from rural to urban areas from within and without the district. The number ofexternal migrants in the combined urban population of Uttar Dinajpur and Dakshin Dinajpur has howeverrisen relatively slowly from 0.88 lakh to 1.25 lakh over the period, while declining in proportionate sharefrom 50 percent to 36 percent. More external migration was therefore received by the urban centres in thepast, compared to the subsequent period. Migrants from other countries had composed over a third of theurban population of Uttar and Dakshin Dinajpur in 1971. Between 1971-2001, their population grewslowly from 0.59 lakh to 0.67 lakh, while falling in proportionate terms to around 13 percent of the totalurban population. Urban migration from other states also grew relatively slowly, as a result of which theshare of outstate migrants in the urban population fell from 7 percent to less than 4 percent. In contrast, thegrowth of intrastate urban migrants from within Uttar and Dakshin Dinajpur and from other West Bengaldistricts was distinctively sharp. Consequently, their combined share in the urban population rose from 10percent to 20 percent between 1971-2001. External migration from other countries into Uttar and DakshinDinajpur had been high between 1971-1981. Between 1981-1991 however, the number of such migrantsfell from 2.57 lakh to 2.49 lakh, mainly because of 'step-migration' of early in-migrants from the urbanareas of Uttar and Dakshin Dinajpur to resettle in other parts of North Bengal or elsewhere within India.Thereafter, the decade 1991-2001 has brought in a sizeable flow of migrants from other countries mainly torural Uttar and Dakshin Dinajpur, raising their overall number to 2.71 lakh in 2001.
Table: Gender Composition of Migration in Uttar & Dakshin Dinajpur, 1971-2001By Place of Birth
W Dinajpur W Dinajpur W Dinajpur U & D DinajpurPlace of Birth 1971 1981 1991 2001
At Enumeration Site Total 12,80,297 16,52,091 22,93,531 28,13,079
Males 7,36,670 9,65,106 13,53,215 16,99,694
Females 5,43,627 6,86,985 9,40,316 11,13,385
Within U & D Dinajpur Total 2,59,753 3,34,919 4,30,218 6,25,058
Males 67,928 66,998 73,646 1,07,496
Females 1,91,825 2,67,921 3,56,572 5,17,562
Other WB Districts Total 45,692 87,630 86,552 1,61,390
Males 19,527 39,720 34,040 52,012
Females 26,165 47,910 52,512 1,09,378
Other States/UTs* Total 71,143 73,075 66,635 73,961
Males 38,253 32,947 26,765 26,041
Females 32,890 40,128 39,870 47,920
Other Countries Total 2,03,002 2,57,234 2,48,677 2,71,484
Males 1,05,559 1,36,841 1,32,694 1,44,829
Females 97,443 1,20,393 1,15,983 1,26,655
Source: D-Series Migration Tables, Census of India, 1971-2001
* UTs = Union Territories
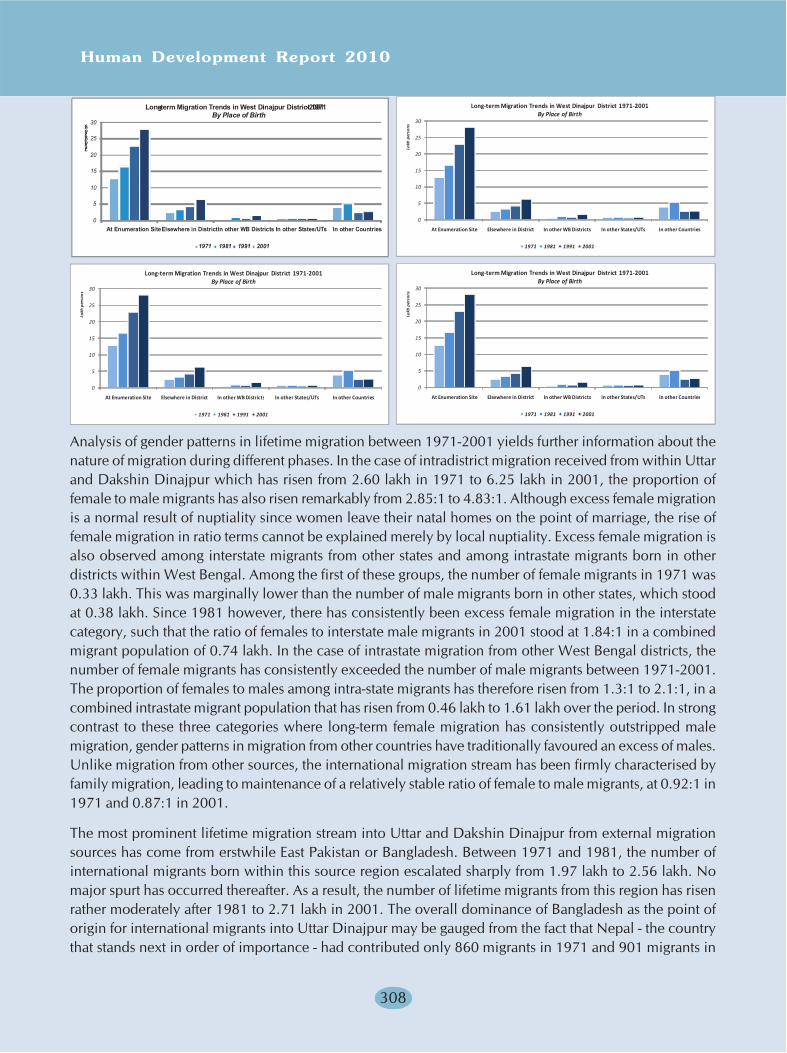
Human Development Report 2010
308
Analysis of gender patterns in lifetime migration between 1971-2001 yields further information about thenature of migration during different phases. In the case of intradistrict migration received from within Uttarand Dakshin Dinajpur which has risen from 2.60 lakh in 1971 to 6.25 lakh in 2001, the proportion offemale to male migrants has also risen remarkably from 2.85:1 to 4.83:1. Although excess female migrationis a normal result of nuptiality since women leave their natal homes on the point of marriage, the rise offemale migration in ratio terms cannot be explained merely by local nuptiality. Excess female migration isalso observed among interstate migrants from other states and among intrastate migrants born in otherdistricts within West Bengal. Among the first of these groups, the number of female migrants in 1971 was0.33 lakh. This was marginally lower than the number of male migrants born in other states, which stoodat 0.38 lakh. Since 1981 however, there has consistently been excess female migration in the interstatecategory, such that the ratio of females to interstate male migrants in 2001 stood at 1.84:1 in a combinedmigrant population of 0.74 lakh. In the case of intrastate migration from other West Bengal districts, thenumber of female migrants has consistently exceeded the number of male migrants between 1971-2001.The proportion of females to males among intra-state migrants has therefore risen from 1.3:1 to 2.1:1, in acombined intrastate migrant population that has risen from 0.46 lakh to 1.61 lakh over the period. In strongcontrast to these three categories where long-term female migration has consistently outstripped malemigration, gender patterns in migration from other countries have traditionally favoured an excess of males.Unlike migration from other sources, the international migration stream has been firmly characterised byfamily migration, leading to maintenance of a relatively stable ratio of female to male migrants, at 0.92:1 in1971 and 0.87:1 in 2001.
The most prominent lifetime migration stream into Uttar and Dakshin Dinajpur from external migrationsources has come from erstwhile East Pakistan or Bangladesh. Between 1971 and 1981, the number ofinternational migrants born within this source region escalated sharply from 1.97 lakh to 2.56 lakh. Nomajor spurt has occurred thereafter. As a result, the number of lifetime migrants from this region has risenrather moderately after 1981 to 2.71 lakh in 2001. The overall dominance of Bangladesh as the point oforigin for international migrants into Uttar Dinajpur may be gauged from the fact that Nepal - the countrythat stands next in order of importance - had contributed only 860 migrants in 1971 and 901 migrants in
0
5
10
15
20
25
30
At Enumeration SiteElsewhere in DistrictIn other WB Districts In other States/UTs In other Countries
Lakh persons
1971 1981 1991 2001
Long-term Migration Trends in West Dinajpur District 1971-2001By Place of Birth
0
5
10
15
20
25
30
At Enumeration Site Elsewhere in District In other WB Districts In other States/UTs In other Countries
Lakh
per
sons
1971 1981 1991 2001
Long-term Migration Trends in West Dinajpur District 1971-2001By Place of Birth
0
5
10
15
20
25
30
At Enumeration Site Elsewhere in District In other WB Districts In other States/UTs In other Countries
Lakh
per
son
s
1971 1981 1991 2001
Long-term Migration Trends in West Dinajpur District 1971-2001By Place of Birth
0
5
10
15
20
25
30
At Enumeration Site Elsewhere in District In other WB Districts In other States/UTs In other Countries
Lakh
per
son
s
1971 1981 1991 2001
Long-term Migration Trends in West Dinajpur District 1971-2001By Place of Birth
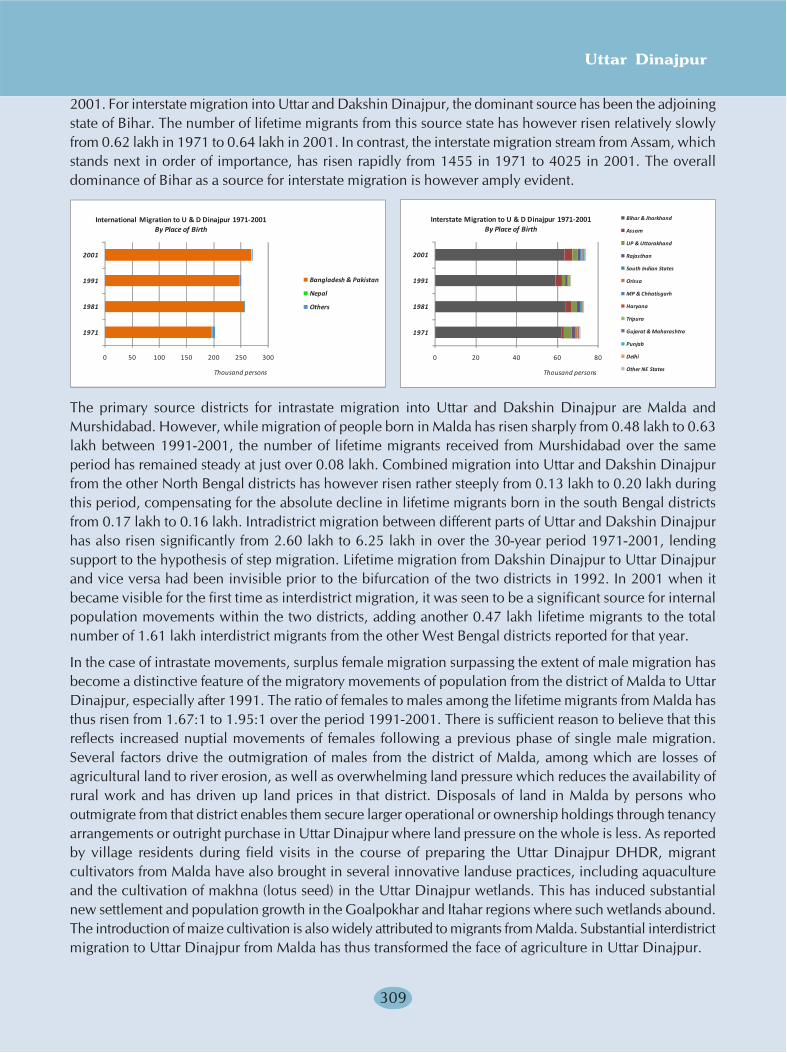
Uttar Dinajpur
309
2001. For interstate migration into Uttar and Dakshin Dinajpur, the dominant source has been the adjoiningstate of Bihar. The number of lifetime migrants from this source state has however risen relatively slowlyfrom 0.62 lakh in 1971 to 0.64 lakh in 2001. In contrast, the interstate migration stream from Assam, whichstands next in order of importance, has risen rapidly from 1455 in 1971 to 4025 in 2001. The overalldominance of Bihar as a source for interstate migration is however amply evident.
The primary source districts for intrastate migration into Uttar and Dakshin Dinajpur are Malda andMurshidabad. However, while migration of people born in Malda has risen sharply from 0.48 lakh to 0.63lakh between 1991-2001, the number of lifetime migrants received from Murshidabad over the sameperiod has remained steady at just over 0.08 lakh. Combined migration into Uttar and Dakshin Dinajpurfrom the other North Bengal districts has however risen rather steeply from 0.13 lakh to 0.20 lakh duringthis period, compensating for the absolute decline in lifetime migrants born in the south Bengal districtsfrom 0.17 lakh to 0.16 lakh. Intradistrict migration between different parts of Uttar and Dakshin Dinajpurhas also risen significantly from 2.60 lakh to 6.25 lakh in over the 30-year period 1971-2001, lendingsupport to the hypothesis of step migration. Lifetime migration from Dakshin Dinajpur to Uttar Dinajpurand vice versa had been invisible prior to the bifurcation of the two districts in 1992. In 2001 when itbecame visible for the first time as interdistrict migration, it was seen to be a significant source for internalpopulation movements within the two districts, adding another 0.47 lakh lifetime migrants to the totalnumber of 1.61 lakh interdistrict migrants from the other West Bengal districts reported for that year.
In the case of intrastate movements, surplus female migration surpassing the extent of male migration hasbecome a distinctive feature of the migratory movements of population from the district of Malda to UttarDinajpur, especially after 1991. The ratio of females to males among the lifetime migrants from Malda hasthus risen from 1.67:1 to 1.95:1 over the period 1991-2001. There is sufficient reason to believe that thisreflects increased nuptial movements of females following a previous phase of single male migration.Several factors drive the outmigration of males from the district of Malda, among which are losses ofagricultural land to river erosion, as well as overwhelming land pressure which reduces the availability ofrural work and has driven up land prices in that district. Disposals of land in Malda by persons whooutmigrate from that district enables them secure larger operational or ownership holdings through tenancyarrangements or outright purchase in Uttar Dinajpur where land pressure on the whole is less. As reportedby village residents during field visits in the course of preparing the Uttar Dinajpur DHDR, migrantcultivators from Malda have also brought in several innovative landuse practices, including aquacultureand the cultivation of makhna (lotus seed) in the Uttar Dinajpur wetlands. This has induced substantialnew settlement and population growth in the Goalpokhar and Itahar regions where such wetlands abound.The introduction of maize cultivation is also widely attributed to migrants from Malda. Substantial interdistrictmigration to Uttar Dinajpur from Malda has thus transformed the face of agriculture in Uttar Dinajpur.
0 50 100 150 200 250 300
1971
1981
1991
2001
Thousand persons
Bangladesh & Pakistan
Nepal
Others
International Migration to U & D Dinajpur 1971-2001By Place of Birth
0 20 40 60 80
1971
1981
1991
2001
Thousand persons
Bihar & Jharkhand
Assam
UP & Uttarakhand
Rajasthan
South Indian States
Orissa
MP & Chhatisgarh
Haryana
Tripura
Gujarat & Maharashtra
Punjab
Delhi
Other NE States
Interstate Migration to U & D Dinajpur 1971-2001By Place of Birth
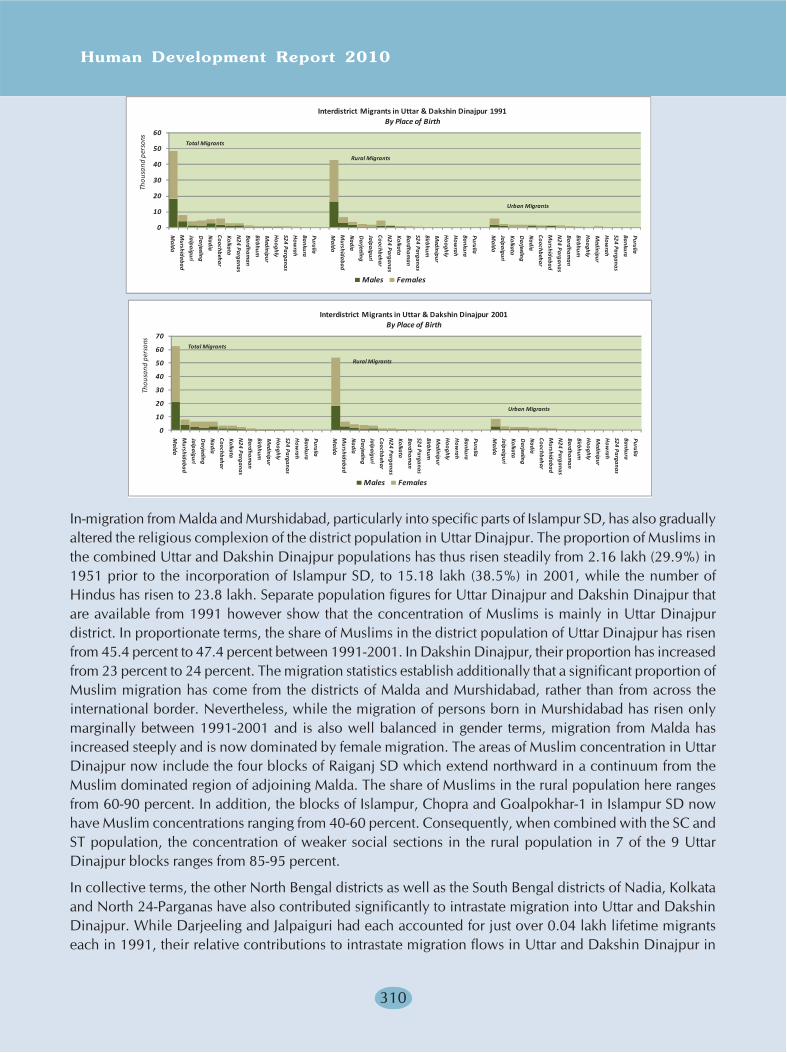
Human Development Report 2010
310
0
10
20
30
40
50
60
Malda
Murshidabad
Jalpaiguri
Darjeeling
Nadia
Coochbehar
Kolkata
N24 Parganas
Bardhaman
Birbhum
Medinipur
Hooghly
S24 Parganas
How
rah
Bankura
Purulia
Malda
Murshidabad
Nadia
Darjeeling
Jalpaiguri
Coochbehar
N24 Parganas
Kolkata
Bardhaman
S24 Parganas
Birbhum
Medinipur
Hooghly
How
rah
Bankura
Purulia
Malda
Jalpaiguri
Kolkata
Darjeeling
Nadia
Coochbehar
Murshidabad
N24 Parganas
Bardhaman
Birbhum
Hooghly
Medinipur
How
rah
S24 Parganas
Bankura
Purulia
Thou
sand
per
sons
Males Females
Interdistrict Migrants in Uttar & Dakshin Dinajpur 1991By Place of Birth
Total Migrants
Rural Migrants
Urban Migrants
0
10
20
30
40
50
60
70
Malda
Murshidabad
Jalpaiguri
Darjeeling
Nadia
Coochbehar
Kolkata
N24 Parganas
Bardhaman
Birbhum
Medinipur
Hooghly
S24 Parganas
How
rah
Bankura
Purulia
Malda
Murshidabad
Nadia
Darjeeling
Jalpaiguri
Coochbehar
N24 Parganas
Kolkata
Bardhaman
S24 Parganas
Birbhum
Medinipur
Hooghly
How
rah
Bankura
Purulia
Malda
Jalpaiguri
Kolkata
Darjeeling
Nadia
Coochbehar
Murshidabad
N24 Parganas
Bardhaman
Birbhum
Hooghly
Medinipur
How
rah
S24 Parganas
Bankura
PuruliaTh
ousa
nd p
erso
ns
Males Females
Interdistrict Migrants in Uttar & Dakshin Dinajpur 2001By Place of Birth
Total Migrants
Rural Migrants
Urban Migrants
In-migration from Malda and Murshidabad, particularly into specific parts of Islampur SD, has also graduallyaltered the religious complexion of the district population in Uttar Dinajpur. The proportion of Muslims inthe combined Uttar and Dakshin Dinajpur populations has thus risen steadily from 2.16 lakh (29.9%) in1951 prior to the incorporation of Islampur SD, to 15.18 lakh (38.5%) in 2001, while the number ofHindus has risen to 23.8 lakh. Separate population figures for Uttar Dinajpur and Dakshin Dinajpur thatare available from 1991 however show that the concentration of Muslims is mainly in Uttar Dinajpurdistrict. In proportionate terms, the share of Muslims in the district population of Uttar Dinajpur has risenfrom 45.4 percent to 47.4 percent between 1991-2001. In Dakshin Dinajpur, their proportion has increasedfrom 23 percent to 24 percent. The migration statistics establish additionally that a significant proportion ofMuslim migration has come from the districts of Malda and Murshidabad, rather than from across theinternational border. Nevertheless, while the migration of persons born in Murshidabad has risen onlymarginally between 1991-2001 and is also well balanced in gender terms, migration from Malda hasincreased steeply and is now dominated by female migration. The areas of Muslim concentration in UttarDinajpur now include the four blocks of Raiganj SD which extend northward in a continuum from theMuslim dominated region of adjoining Malda. The share of Muslims in the rural population here rangesfrom 60-90 percent. In addition, the blocks of Islampur, Chopra and Goalpokhar-1 in Islampur SD nowhave Muslim concentrations ranging from 40-60 percent. Consequently, when combined with the SC andST population, the concentration of weaker social sections in the rural population in 7 of the 9 UttarDinajpur blocks ranges from 85-95 percent.
In collective terms, the other North Bengal districts as well as the South Bengal districts of Nadia, Kolkataand North 24-Parganas have also contributed significantly to intrastate migration into Uttar and DakshinDinajpur. While Darjeeling and Jalpaiguri had each accounted for just over 0.04 lakh lifetime migrantseach in 1991, their relative contributions to intrastate migration flows in Uttar and Dakshin Dinajpur in
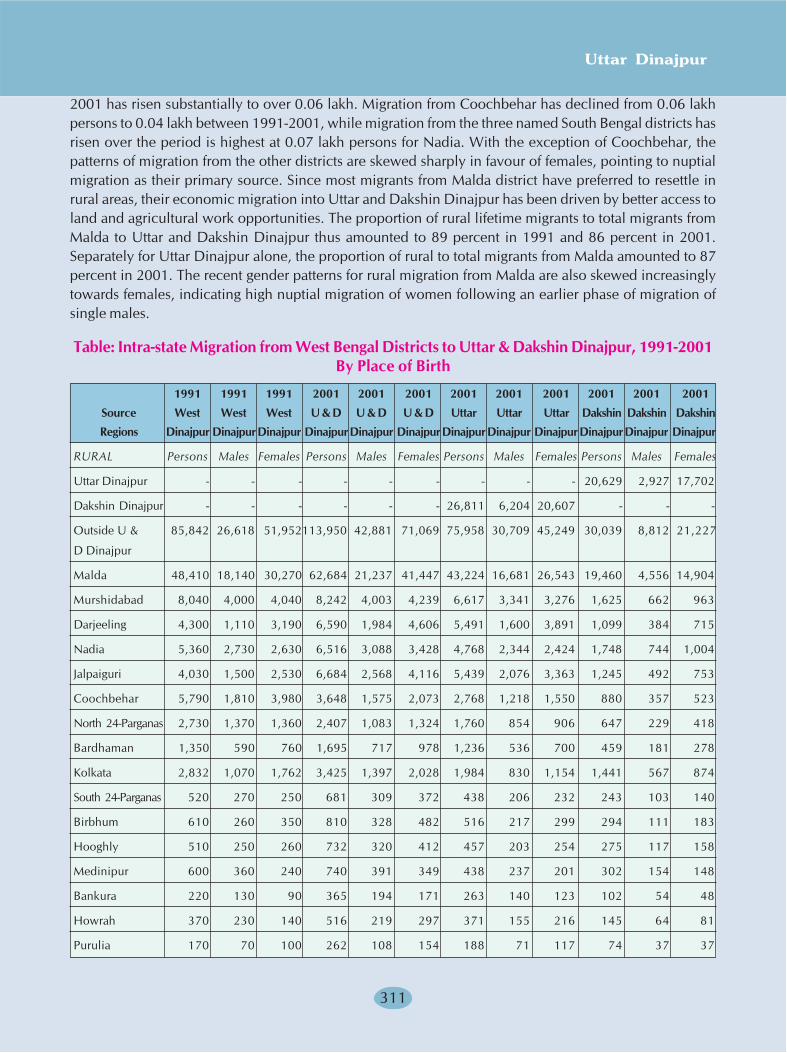
Uttar Dinajpur
311
2001 has risen substantially to over 0.06 lakh. Migration from Coochbehar has declined from 0.06 lakhpersons to 0.04 lakh between 1991-2001, while migration from the three named South Bengal districts hasrisen over the period is highest at 0.07 lakh persons for Nadia. With the exception of Coochbehar, thepatterns of migration from the other districts are skewed sharply in favour of females, pointing to nuptialmigration as their primary source. Since most migrants from Malda district have preferred to resettle inrural areas, their economic migration into Uttar and Dakshin Dinajpur has been driven by better access toland and agricultural work opportunities. The proportion of rural lifetime migrants to total migrants fromMalda to Uttar and Dakshin Dinajpur thus amounted to 89 percent in 1991 and 86 percent in 2001.Separately for Uttar Dinajpur alone, the proportion of rural to total migrants from Malda amounted to 87percent in 2001. The recent gender patterns for rural migration from Malda are also skewed increasinglytowards females, indicating high nuptial migration of women following an earlier phase of migration ofsingle males.
Table: Intra-state Migration from West Bengal Districts to Uttar & Dakshin Dinajpur, 1991-2001By Place of Birth
1991 1991 1991 2001 2001 2001 2001 2001 2001 2001 2001 2001
Source West West West U & D U & D U & D Uttar Uttar Uttar Dakshin Dakshin Dakshin
Regions Dinajpur DinajpurDinajpur DinajpurDinajpur DinajpurDinajpurDinajpur DinajpurDinajpurDinajpur Dinajpur
RURAL Persons Males Females Persons Males Females Persons Males Females Persons Males Females
Uttar Dinajpur - - - - - - - - - 20,629 2,927 17,702
Dakshin Dinajpur - - - - - - 26,811 6,204 20,607 - - -
Outside U & 85,842 26,618 51,952113,950 42,881 71,069 75,958 30,709 45,249 30,039 8,812 21,227
D Dinajpur
Malda 48,410 18,140 30,270 62,684 21,237 41,447 43,224 16,681 26,543 19,460 4,556 14,904
Murshidabad 8,040 4,000 4,040 8,242 4,003 4,239 6,617 3,341 3,276 1,625 662 963
Darjeeling 4,300 1,110 3,190 6,590 1,984 4,606 5,491 1,600 3,891 1,099 384 715
Nadia 5,360 2,730 2,630 6,516 3,088 3,428 4,768 2,344 2,424 1,748 744 1,004
Jalpaiguri 4,030 1,500 2,530 6,684 2,568 4,116 5,439 2,076 3,363 1,245 492 753
Coochbehar 5,790 1,810 3,980 3,648 1,575 2,073 2,768 1,218 1,550 880 357 523
North 24-Parganas 2,730 1,370 1,360 2,407 1,083 1,324 1,760 854 906 647 229 418
Bardhaman 1,350 590 760 1,695 717 978 1,236 536 700 459 181 278
Kolkata 2,832 1,070 1,762 3,425 1,397 2,028 1,984 830 1,154 1,441 567 874
South 24-Parganas 520 270 250 681 309 372 438 206 232 243 103 140
Birbhum 610 260 350 810 328 482 516 217 299 294 111 183
Hooghly 510 250 260 732 320 412 457 203 254 275 117 158
Medinipur 600 360 240 740 391 349 438 237 201 302 154 148
Bankura 220 130 90 365 194 171 263 140 123 102 54 48
Howrah 370 230 140 516 219 297 371 155 216 145 64 81
Purulia 170 70 100 262 108 154 188 71 117 74 37 37
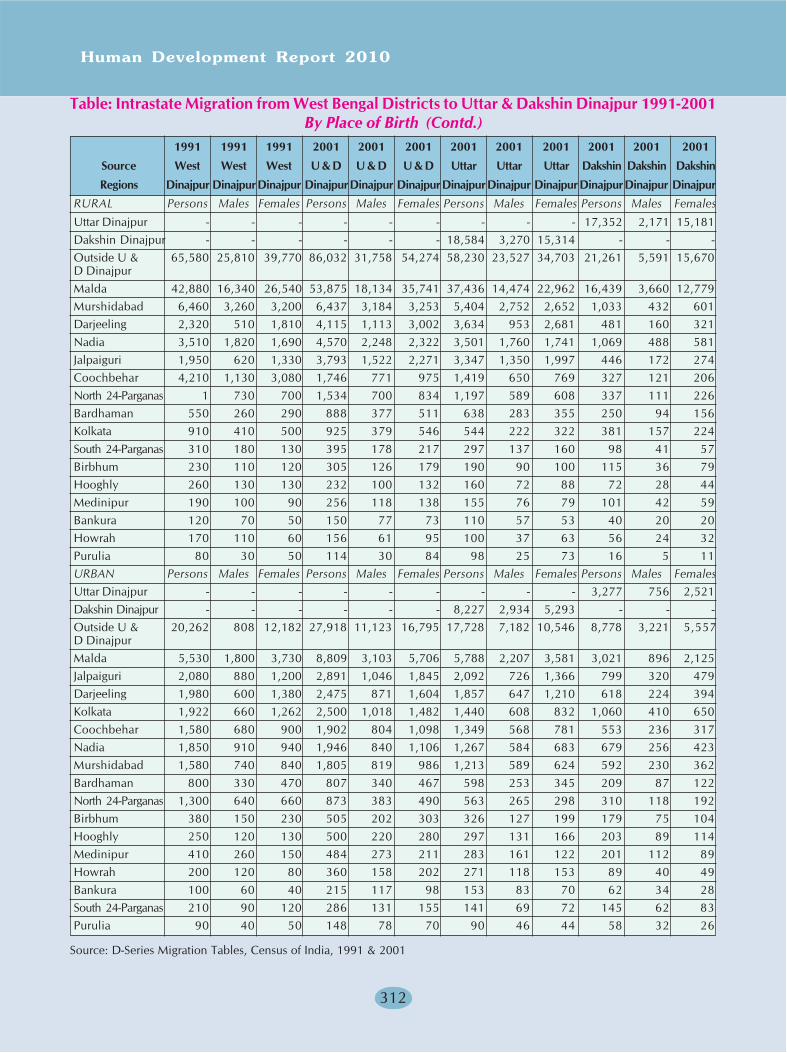
Human Development Report 2010
312
RURAL Persons Males Females Persons Males Females Persons Males Females Persons Males Females
Uttar Dinajpur - - - - - - - - - 17,352 2,171 15,181Dakshin Dinajpur - - - - - - 18,584 3,270 15,314 - - -Outside U & 65,580 25,810 39,770 86,032 31,758 54,274 58,230 23,527 34,703 21,261 5,591 15,670D DinajpurMalda 42,880 16,340 26,540 53,875 18,134 35,741 37,436 14,474 22,962 16,439 3,660 12,779Murshidabad 6,460 3,260 3,200 6,437 3,184 3,253 5,404 2,752 2,652 1,033 432 601Darjeeling 2,320 510 1,810 4,115 1,113 3,002 3,634 953 2,681 481 160 321Nadia 3,510 1,820 1,690 4,570 2,248 2,322 3,501 1,760 1,741 1,069 488 581Jalpaiguri 1,950 620 1,330 3,793 1,522 2,271 3,347 1,350 1,997 446 172 274Coochbehar 4,210 1,130 3,080 1,746 771 975 1,419 650 769 327 121 206North 24-Parganas 1 730 700 1,534 700 834 1,197 589 608 337 111 226Bardhaman 550 260 290 888 377 511 638 283 355 250 94 156Kolkata 910 410 500 925 379 546 544 222 322 381 157 224South 24-Parganas 310 180 130 395 178 217 297 137 160 98 41 57Birbhum 230 110 120 305 126 179 190 90 100 115 36 79Hooghly 260 130 130 232 100 132 160 72 88 72 28 44Medinipur 190 100 90 256 118 138 155 76 79 101 42 59Bankura 120 70 50 150 77 73 110 57 53 40 20 20Howrah 170 110 60 156 61 95 100 37 63 56 24 32Purulia 80 30 50 114 30 84 98 25 73 16 5 11URBAN Persons Males Females Persons Males Females Persons Males Females Persons Males FemalesUttar Dinajpur - - - - - - - - - 3,277 756 2,521Dakshin Dinajpur - - - - - - 8,227 2,934 5,293 - - -Outside U & 20,262 808 12,182 27,918 11,123 16,795 17,728 7,182 10,546 8,778 3,221 5,557D DinajpurMalda 5,530 1,800 3,730 8,809 3,103 5,706 5,788 2,207 3,581 3,021 896 2,125Jalpaiguri 2,080 880 1,200 2,891 1,046 1,845 2,092 726 1,366 799 320 479Darjeeling 1,980 600 1,380 2,475 871 1,604 1,857 647 1,210 618 224 394Kolkata 1,922 660 1,262 2,500 1,018 1,482 1,440 608 832 1,060 410 650Coochbehar 1,580 680 900 1,902 804 1,098 1,349 568 781 553 236 317Nadia 1,850 910 940 1,946 840 1,106 1,267 584 683 679 256 423Murshidabad 1,580 740 840 1,805 819 986 1,213 589 624 592 230 362Bardhaman 800 330 470 807 340 467 598 253 345 209 87 122North 24-Parganas 1,300 640 660 873 383 490 563 265 298 310 118 192Birbhum 380 150 230 505 202 303 326 127 199 179 75 104Hooghly 250 120 130 500 220 280 297 131 166 203 89 114Medinipur 410 260 150 484 273 211 283 161 122 201 112 89Howrah 200 120 80 360 158 202 271 118 153 89 40 49Bankura 100 60 40 215 117 98 153 83 70 62 34 28South 24-Parganas 210 90 120 286 131 155 141 69 72 145 62 83Purulia 90 40 50 148 78 70 90 46 44 58 32 26
Source: D-Series Migration Tables, Census of India, 1991 & 2001
Table: Intrastate Migration from West Bengal Districts to Uttar & Dakshin Dinajpur 1991-2001By Place of Birth (Contd.)
1991 1991 1991 2001 2001 2001 2001 2001 2001 2001 2001 2001
Source West West West U & D U & D U & D Uttar Uttar Uttar Dakshin Dakshin Dakshin
Regions Dinajpur DinajpurDinajpur DinajpurDinajpur DinajpurDinajpurDinajpur DinajpurDinajpurDinajpur Dinajpur
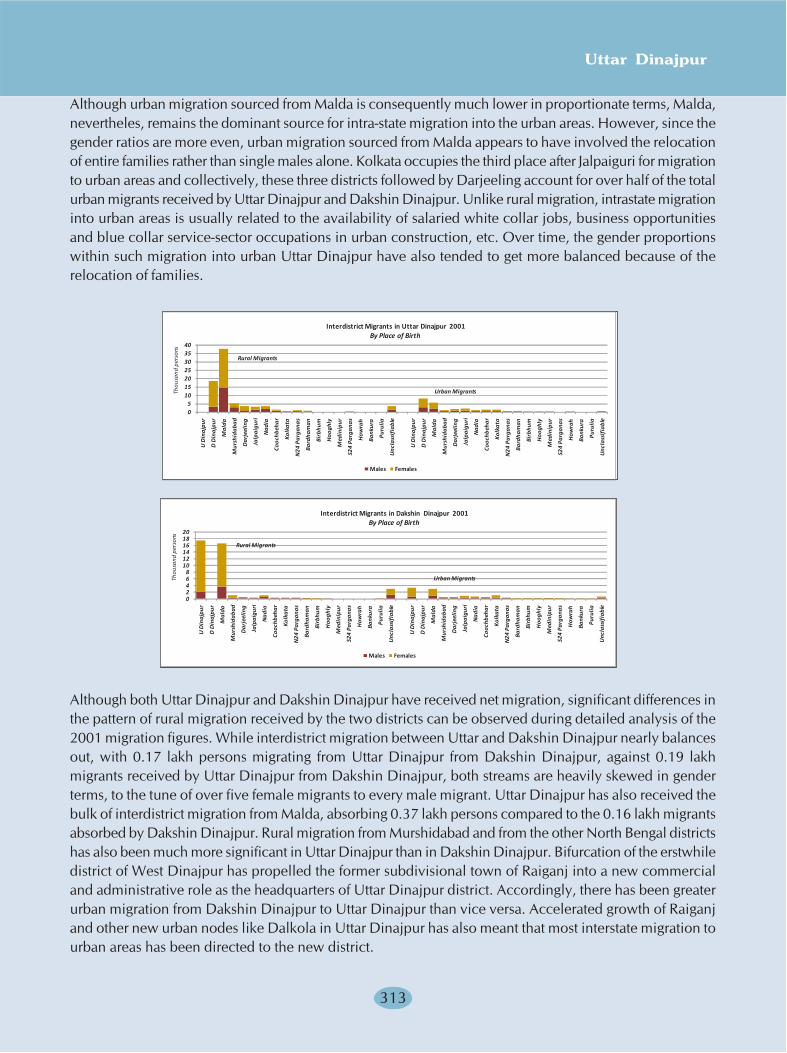
Uttar Dinajpur
313
Although urban migration sourced from Malda is consequently much lower in proportionate terms, Malda,nevertheles, remains the dominant source for intra-state migration into the urban areas. However, since thegender ratios are more even, urban migration sourced from Malda appears to have involved the relocationof entire families rather than single males alone. Kolkata occupies the third place after Jalpaiguri for migrationto urban areas and collectively, these three districts followed by Darjeeling account for over half of the totalurban migrants received by Uttar Dinajpur and Dakshin Dinajpur. Unlike rural migration, intrastate migrationinto urban areas is usually related to the availability of salaried white collar jobs, business opportunitiesand blue collar service-sector occupations in urban construction, etc. Over time, the gender proportionswithin such migration into urban Uttar Dinajpur have also tended to get more balanced because of therelocation of families.
Although both Uttar Dinajpur and Dakshin Dinajpur have received net migration, significant differences inthe pattern of rural migration received by the two districts can be observed during detailed analysis of the2001 migration figures. While interdistrict migration between Uttar and Dakshin Dinajpur nearly balancesout, with 0.17 lakh persons migrating from Uttar Dinajpur from Dakshin Dinajpur, against 0.19 lakhmigrants received by Uttar Dinajpur from Dakshin Dinajpur, both streams are heavily skewed in genderterms, to the tune of over five female migrants to every male migrant. Uttar Dinajpur has also received thebulk of interdistrict migration from Malda, absorbing 0.37 lakh persons compared to the 0.16 lakh migrantsabsorbed by Dakshin Dinajpur. Rural migration from Murshidabad and from the other North Bengal districtshas also been much more significant in Uttar Dinajpur than in Dakshin Dinajpur. Bifurcation of the erstwhiledistrict of West Dinajpur has propelled the former subdivisional town of Raiganj into a new commercialand administrative role as the headquarters of Uttar Dinajpur district. Accordingly, there has been greaterurban migration from Dakshin Dinajpur to Uttar Dinajpur than vice versa. Accelerated growth of Raiganjand other new urban nodes like Dalkola in Uttar Dinajpur has also meant that most interstate migration tourban areas has been directed to the new district.
05
10152025303540
U D
inaj
pur
D D
inaj
pur
Mal
da
Mur
shid
abad
Dar
jeel
ing
Jalp
aigu
ri
Nad
ia
Cooc
hbeh
ar
Kolk
ata
N24
Par
gana
s
Bard
ham
an
Birb
hum
Hoo
ghly
Med
inip
ur
S24
Parg
anas
How
rah
Bank
ura
Puru
lia
Unc
lass
ifia
ble
U D
inaj
pur
D D
inaj
pur
Mal
da
Mur
shid
abad
Dar
jeel
ing
Jalp
aigu
ri
Nad
ia
Cooc
hbeh
ar
Kolk
ata
N24
Par
gana
s
Bard
ham
an
Birb
hum
Hoo
ghly
Med
inip
ur
S24
Parg
anas
How
rah
Bank
ura
Puru
lia
Unc
lass
ifia
ble
Thou
sand
per
sons
Males Females
Interdistrict Migrants in Uttar Dinajpur 2001By Place of Birth
Rural Migrants
Urban Migrants
02468
101214161820
U D
inaj
pur
D D
inaj
pur
Mal
da
Mur
shid
abad
Dar
jeel
ing
Jalp
aigu
ri
Nad
ia
Cooc
hbeh
ar
Kolk
ata
N24
Par
gana
s
Bard
ham
an
Birb
hum
Hoo
ghly
Med
inip
ur
S24
Parg
anas
How
rah
Bank
ura
Puru
lia
Unc
lass
ifia
ble
U D
inaj
pur
D D
inaj
pur
Mal
da
Mur
shid
abad
Dar
jeel
ing
Jalp
aigu
ri
Nad
ia
Cooc
hbeh
ar
Kolk
ata
N24
Par
gana
s
Bard
ham
an
Birb
hum
Hoo
ghly
Med
inip
ur
S24
Parg
anas
How
rah
Bank
ura
Puru
lia
Unc
lass
ifia
ble
Thou
sand
per
sons
Males Females
Interdistrict Migrants in Dakshin Dinajpur 2001By Place of Birth
Rural Migrants
Urban Migrants
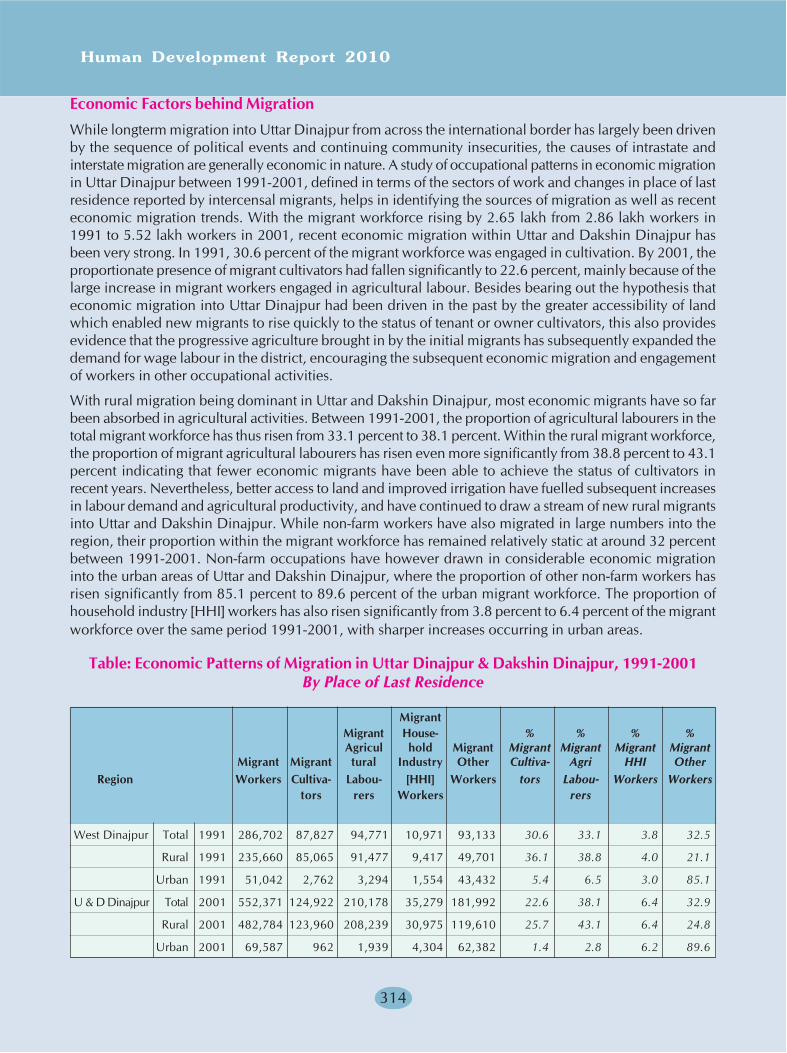
Human Development Report 2010
314
Economic Factors behind Migration
While longterm migration into Uttar Dinajpur from across the international border has largely been drivenby the sequence of political events and continuing community insecurities, the causes of intrastate andinterstate migration are generally economic in nature. A study of occupational patterns in economic migrationin Uttar Dinajpur between 1991-2001, defined in terms of the sectors of work and changes in place of lastresidence reported by intercensal migrants, helps in identifying the sources of migration as well as recenteconomic migration trends. With the migrant workforce rising by 2.65 lakh from 2.86 lakh workers in1991 to 5.52 lakh workers in 2001, recent economic migration within Uttar and Dakshin Dinajpur hasbeen very strong. In 1991, 30.6 percent of the migrant workforce was engaged in cultivation. By 2001, theproportionate presence of migrant cultivators had fallen significantly to 22.6 percent, mainly because of thelarge increase in migrant workers engaged in agricultural labour. Besides bearing out the hypothesis thateconomic migration into Uttar Dinajpur had been driven in the past by the greater accessibility of landwhich enabled new migrants to rise quickly to the status of tenant or owner cultivators, this also providesevidence that the progressive agriculture brought in by the initial migrants has subsequently expanded thedemand for wage labour in the district, encouraging the subsequent economic migration and engagementof workers in other occupational activities.
With rural migration being dominant in Uttar and Dakshin Dinajpur, most economic migrants have so farbeen absorbed in agricultural activities. Between 1991-2001, the proportion of agricultural labourers in thetotal migrant workforce has thus risen from 33.1 percent to 38.1 percent. Within the rural migrant workforce,the proportion of migrant agricultural labourers has risen even more significantly from 38.8 percent to 43.1percent indicating that fewer economic migrants have been able to achieve the status of cultivators inrecent years. Nevertheless, better access to land and improved irrigation have fuelled subsequent increasesin labour demand and agricultural productivity, and have continued to draw a stream of new rural migrantsinto Uttar and Dakshin Dinajpur. While non-farm workers have also migrated in large numbers into theregion, their proportion within the migrant workforce has remained relatively static at around 32 percentbetween 1991-2001. Non-farm occupations have however drawn in considerable economic migrationinto the urban areas of Uttar and Dakshin Dinajpur, where the proportion of other non-farm workers hasrisen significantly from 85.1 percent to 89.6 percent of the urban migrant workforce. The proportion ofhousehold industry [HHI] workers has also risen significantly from 3.8 percent to 6.4 percent of the migrantworkforce over the same period 1991-2001, with sharper increases occurring in urban areas.
Table: Economic Patterns of Migration in Uttar Dinajpur & Dakshin Dinajpur, 1991-2001By Place of Last Residence
MigrantMigrant House- % % % %Agricul hold Migrant Migrant Migrant Migrant Migrant
Migrant Migrant tural Industry Other Cultiva- Agri HHI OtherRegion Workers Cultiva- Labou- [HHI] Workers tors Labou- Workers Workers
tors rers Workers rers
West Dinajpur Total 1991 286,702 87,827 94,771 10,971 93,133 30.6 33.1 3.8 32.5
Rural 1991 235,660 85,065 91,477 9,417 49,701 36.1 38.8 4.0 21.1
Urban 1991 51,042 2,762 3,294 1,554 43,432 5.4 6.5 3.0 85.1
U & D Dinajpur Total 2001 552,371 124,922 210,178 35,279 181,992 22.6 38.1 6.4 32.9
Rural 2001 482,784 123,960 208,239 30,975 119,610 25.7 43.1 6.4 24.8
Urban 2001 69,587 962 1,939 4,304 62,382 1.4 2.8 6.2 89.6
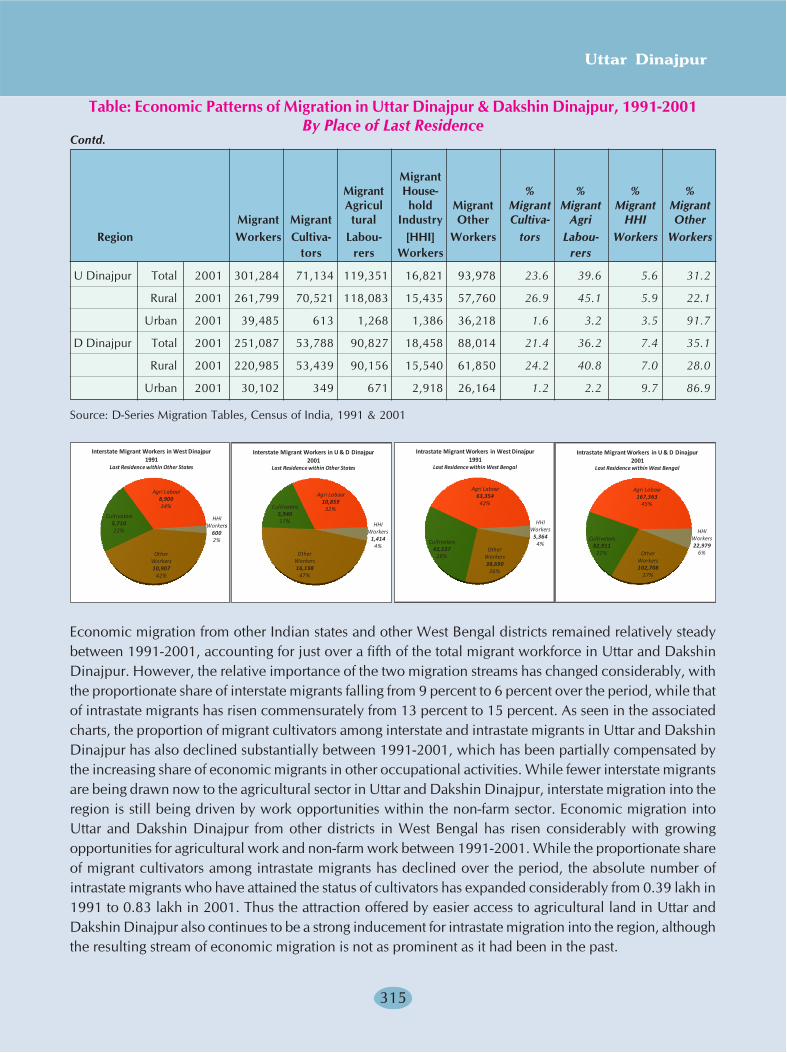
Uttar Dinajpur
315
U Dinajpur Total 2001 301,284 71,134 119,351 16,821 93,978 23.6 39.6 5.6 31.2
Rural 2001 261,799 70,521 118,083 15,435 57,760 26.9 45.1 5.9 22.1
Urban 2001 39,485 613 1,268 1,386 36,218 1.6 3.2 3.5 91.7
D Dinajpur Total 2001 251,087 53,788 90,827 18,458 88,014 21.4 36.2 7.4 35.1
Rural 2001 220,985 53,439 90,156 15,540 61,850 24.2 40.8 7.0 28.0
Urban 2001 30,102 349 671 2,918 26,164 1.2 2.2 9.7 86.9
Source: D-Series Migration Tables, Census of India, 1991 & 2001
Economic migration from other Indian states and other West Bengal districts remained relatively steadybetween 1991-2001, accounting for just over a fifth of the total migrant workforce in Uttar and DakshinDinajpur. However, the relative importance of the two migration streams has changed considerably, withthe proportionate share of interstate migrants falling from 9 percent to 6 percent over the period, while thatof intrastate migrants has risen commensurately from 13 percent to 15 percent. As seen in the associatedcharts, the proportion of migrant cultivators among interstate and intrastate migrants in Uttar and DakshinDinajpur has also declined substantially between 1991-2001, which has been partially compensated bythe increasing share of economic migrants in other occupational activities. While fewer interstate migrantsare being drawn now to the agricultural sector in Uttar and Dakshin Dinajpur, interstate migration into theregion is still being driven by work opportunities within the non-farm sector. Economic migration intoUttar and Dakshin Dinajpur from other districts in West Bengal has risen considerably with growingopportunities for agricultural work and non-farm work between 1991-2001. While the proportionate shareof migrant cultivators among intrastate migrants has declined over the period, the absolute number ofintrastate migrants who have attained the status of cultivators has expanded considerably from 0.39 lakh in1991 to 0.83 lakh in 2001. Thus the attraction offered by easier access to agricultural land in Uttar andDakshin Dinajpur also continues to be a strong inducement for intrastate migration into the region, althoughthe resulting stream of economic migration is not as prominent as it had been in the past.
Table: Economic Patterns of Migration in Uttar Dinajpur & Dakshin Dinajpur, 1991-2001By Place of Last Residence
MigrantMigrant House- % % % %Agricul hold Migrant Migrant Migrant Migrant Migrant
Migrant Migrant tural Industry Other Cultiva- Agri HHI OtherRegion Workers Cultiva- Labou- [HHI] Workers tors Labou- Workers Workers
tors rers Workers rers
Cultivators5,71022%
Agri Labour8,90034%
HHI Workers
6002%
Other Workers10,907
42%
Interstate Migrant Workers in West Dinajpur 1991
Last Residence within Other States
Cultivators5,94017%
Agri Labour10,859
32%
HHI Workers
1,4144%
Other Workers16,198
47%
Interstate Migrant Workers in U & D Dinajpur 2001
Last Residence within Other States
Cultivators42,537
28%
Agri Labour63,354
42%
HHI Workers
5,3644%
Other Workers38,690
26%
Intrastate Migrant Workers in West Dinajpur 1991
Last Residence within West Bengal
Cultivators82,911
22%
Agri Labour167,363
45%
HHI Workers22,979
6%Other Workers102,708
27%
Intrastate Migrant Workers in U & D Dinajpur 2001
Last Residence within West Bengal
Contd.

Human Development Report 2010
316
Longterm economic migration into the Dinajpur region has given migrant workers a strong economicpresence in both Uttar and Dakshin Dinajpur districts. In 2001, the migrant workforce of 3.01 lakh workersin Uttar Dinajpur comprised more than a quarter of the aggregate workforce of 11.56 lakh workers, whilein Dakshin Dinajpur, the migrant workforce of 2.51 lakh workers comprised over a third of the aggregateworkforce of 6.13 lakh workers. Over one-fourth of the cultivators in Uttar Dinajpur were economicmigrants against 28 percent in Dakshin Dinajpur. Economic migrants also constituted one-third of theagricultural labourers, 49 percent of the HHI workers and 37 percent of the other non-farm workers inUttar Dinajpur. Their presence was even stronger in Dakshin Dinajpur, where they comprised 41 percentof the agricultural labourers, 62 percent of the HHI workers and 51 percent of the non-farm workers. Asthe larger of the two districts however, Uttar Dinajpur accounted for a much larger number of migrantcultivators, agricultural workers and non-farm workers compared to Dakshin Dinajpur in absolute terms,while stronger presence of HHI workers was evident in Dakshin Dinajpur because of the dominance ofartisanal crafts like handloom weaving in that district. Because of its relatively favourable agroclimaticsituation and its ability to absorb a large number of economic migrants into both farm based and non-farmbased activities, Uttar Dinajpur has traditionally exerted a stronger economic pull compared to DakshinDinajpur, and has consequently drawn in more interdistrict and interstate migrants compared to the latter.While the Dakshin Dinajpur borders have formed a convenient gateway into the region for manyinternational migrants after 1947, a fairly large section among them has subsequently resettled in UttarDinajpur through step migration, in view of the better agricultural and commercial prospects that existwithin Uttar Dinajpur.
MAP: Village-level Change in Population, Cultivators & Agricultural Workersin Uttar Dinajpur, 1991-2001
M ARNAI
PA TI RAJ PUR
UTTAR DINAJPURPopulation Growth 1991-2001
above 2500 persons (12)1,500 to 2,500 persons (28)
500 to 1,500 persons (280)250 to 500 persons (359)
1 to 250 persons (769)Net population decrease (64)
M ARNAI
PATI RA J PUR
UTTAR DINAJPURChange in Cultivators 1991-2001
250 to 740 (11)0 to 250 (631)
-250 to 0 (850)-500 to -250 (15)
-1,800 to -500 (5)
M ARNAI
PAT I RAJ PUR
UTTAR DINAJPURChange in Agri Labour 1991-2001
100 to 620 (181)1 to 100 (649)
-100 to 1 (570)-300 to -100 (104)
-2,310 to -300 (8)
Uttar Dinajpur
317
Some idea of the overall impact of these economic pull factors on the agricultural sector in Uttar Dinajpurcan be gained from examination of recent intercensal growth in population in relation to the resultingvillage-level changes in the number of cultivators and agricultural labourers in different mouza areas withinUttar Dinajpur. As is evident from the associated regional maps, absolute growth of population has beenstronger over the period 1991-2001 in the villages of Islampur SD than in those under Raiganj SD. Strongclustered increases in mouza populations have occurred in the northernmost villages that stretch from theinterstate border with Bihar to the international border in Chopra and Islampur blocks. Population growthin the Goalpokhar region has been clustered more centrally around the villages that form the commonborder between Goalpokhar-1 and Golpokhar-2 blocks, while in Karandighi, population growth has againbeen widely dispersed through the villages located along the international border as well as those on theborder with Bihar. In Raiganj SD, in marked contrast, population growth has been clustered in the villagesalong the peripheries of Raiganj and Kaliaganj municipalities, and thins out along the international borderand along the interdistrict borders with Malda and Dakshin Dinajpur.
Strong increases have occurred in the number of cultivators in most villages located within Goalpokhar-1block as well as in contiguous villages in Goalpokhar-2 and Islampur blocks. However in northern Islampurand Chopra blocks where population growth has been strongest, there has been a strong shrinkage in thenumber of cultivators because of the switchover from farming to small tea plantations. Despite the relativelyeven increase in village populations across Karandighi block, growth of cultivators is less evident exceptalong the border with Raiganj block. Thus the villages where the cultivator population has grown areinterspersed fairly evenly with other villages where the absolute number of cultivators has declined. Amongthe Raiganj SD villages, clustered growth in cultivators has occurred in villages adjoining the Kaliaganj-Dakshin Dinajpur border and in the northern villages stretching from Raiganj towards Hemtabad, whilemost villages along the Bihar and Malda borders in Raiganj and Itahar blocks show a clustered shrinkage incultivator numbers. Most villages located along the international border in Raiganj SD have also experiencedabsolute declines in the number of cultivators. Moderate to high increases in the number of agriculturallabourers have however occurred in the vast majority of villages throughout Uttar Dinajpur district, withtheir growth being especially polarised in the irrigated tracts within Islampur and Goalpokhar-1 blocks,and also along the axis spreading from southern Karandighi across Raiganj and southern Hemtabad intoKaliaganj block. In Chopra and Goalpokhar-2 blocks and also in the villages along the urban periphery ofRaiganj in contrast, the absolute numbers of agricultural labourers show a moderate to strong decline.
Translating these occupational trends into the corresponding economic pull factors, it would seem thatpopulation growth in most parts of Islampur SD is driven by internal and inter-state migration of agriculturallabourers and also by inter,district migration and resettlement of cultivators. While the impact of theseeconomic pulls on recent international migration is more difficult to confirm, the locational evidencepoints towards the resettlement of such migrants as cultivators in Goalpokhar-1 block and as agriculturallabourers throughout Islampur block, both of which are contiguous to the international border. Economicmigration and population growth in Goalpokhar-2 and Karandighi, on the other hand, have been driven byoverall growth of work opportunities in the agricultural and non-agricultural sector. Though most blocks inRaiganj SD, population growth and migration have been driven by the expanding presence of irrigationand the growing labour demands of agriculture, as well as by growing opportunities for non-farm employmentalong the periphery of urban areas. Strong economic pulls are nevertheless in evidence across much ofUttar Dinajpur, making the district a prime destination for economic migrants.
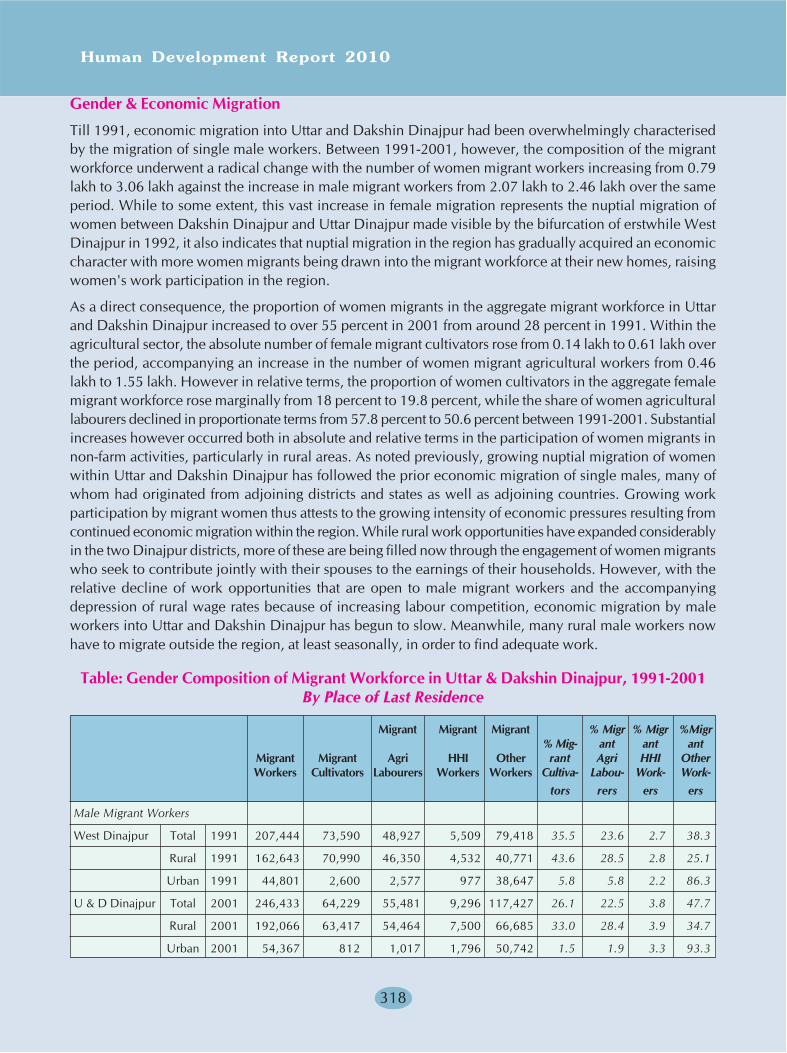
Human Development Report 2010
318
Gender & Economic Migration
Till 1991, economic migration into Uttar and Dakshin Dinajpur had been overwhelmingly characterisedby the migration of single male workers. Between 1991-2001, however, the composition of the migrantworkforce underwent a radical change with the number of women migrant workers increasing from 0.79lakh to 3.06 lakh against the increase in male migrant workers from 2.07 lakh to 2.46 lakh over the sameperiod. While to some extent, this vast increase in female migration represents the nuptial migration ofwomen between Dakshin Dinajpur and Uttar Dinajpur made visible by the bifurcation of erstwhile WestDinajpur in 1992, it also indicates that nuptial migration in the region has gradually acquired an economiccharacter with more women migrants being drawn into the migrant workforce at their new homes, raisingwomen's work participation in the region.
As a direct consequence, the proportion of women migrants in the aggregate migrant workforce in Uttarand Dakshin Dinajpur increased to over 55 percent in 2001 from around 28 percent in 1991. Within theagricultural sector, the absolute number of female migrant cultivators rose from 0.14 lakh to 0.61 lakh overthe period, accompanying an increase in the number of women migrant agricultural workers from 0.46lakh to 1.55 lakh. However in relative terms, the proportion of women cultivators in the aggregate femalemigrant workforce rose marginally from 18 percent to 19.8 percent, while the share of women agriculturallabourers declined in proportionate terms from 57.8 percent to 50.6 percent between 1991-2001. Substantialincreases however occurred both in absolute and relative terms in the participation of women migrants innon-farm activities, particularly in rural areas. As noted previously, growing nuptial migration of womenwithin Uttar and Dakshin Dinajpur has followed the prior economic migration of single males, many ofwhom had originated from adjoining districts and states as well as adjoining countries. Growing workparticipation by migrant women thus attests to the growing intensity of economic pressures resulting fromcontinued economic migration within the region. While rural work opportunities have expanded considerablyin the two Dinajpur districts, more of these are being filled now through the engagement of women migrantswho seek to contribute jointly with their spouses to the earnings of their households. However, with therelative decline of work opportunities that are open to male migrant workers and the accompanyingdepression of rural wage rates because of increasing labour competition, economic migration by maleworkers into Uttar and Dakshin Dinajpur has begun to slow. Meanwhile, many rural male workers nowhave to migrate outside the region, at least seasonally, in order to find adequate work.
Table: Gender Composition of Migrant Workforce in Uttar & Dakshin Dinajpur, 1991-2001By Place of Last Residence
Migrant Migrant Migrant % Migr % Migr %Migr% Mig- ant ant ant
Migrant Migrant Agri HHI Other rant Agri HHI OtherWorkers Cultivators Labourers Workers Workers Cultiva- Labou- Work- Work-
tors rers ers ers
Male Migrant Workers
West Dinajpur Total 1991 207,444 73,590 48,927 5,509 79,418 35.5 23.6 2.7 38.3
Rural 1991 162,643 70,990 46,350 4,532 40,771 43.6 28.5 2.8 25.1
Urban 1991 44,801 2,600 2,577 977 38,647 5.8 5.8 2.2 86.3
U & D Dinajpur Total 2001 246,433 64,229 55,481 9,296 117,427 26.1 22.5 3.8 47.7
Rural 2001 192,066 63,417 54,464 7,500 66,685 33.0 28.4 3.9 34.7
Urban 2001 54,367 812 1,017 1,796 50,742 1.5 1.9 3.3 93.3
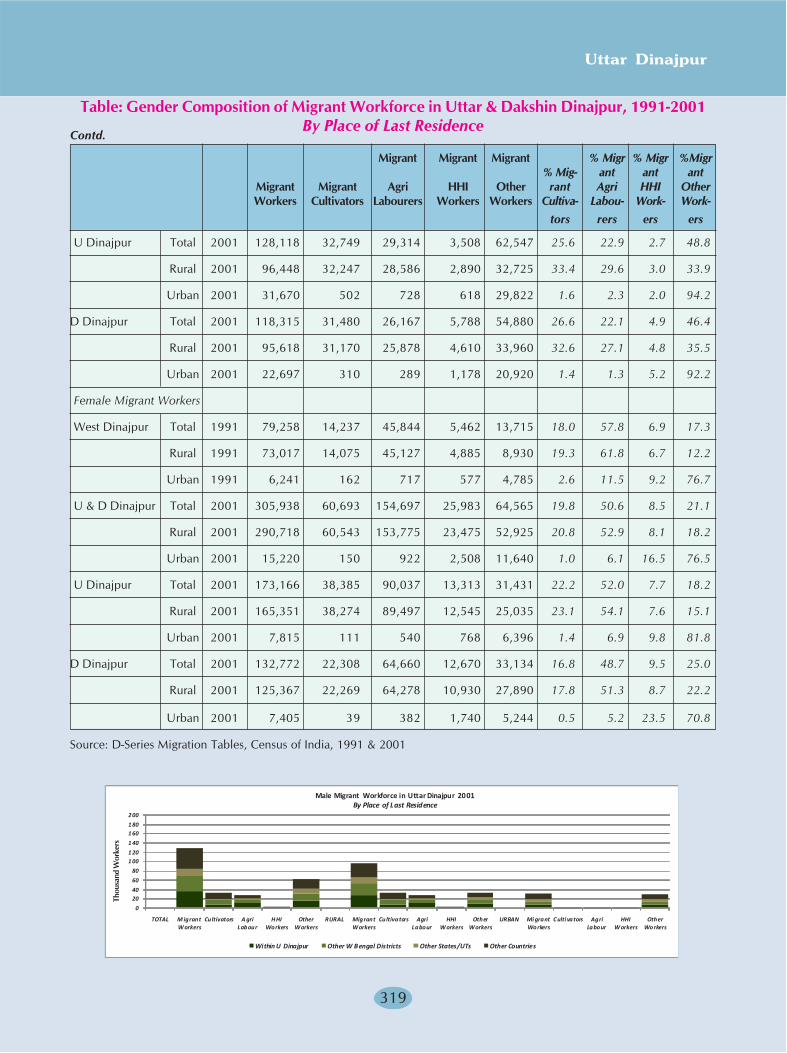
Uttar Dinajpur
319
U Dinajpur Total 2001 128,118 32,749 29,314 3,508 62,547 25.6 22.9 2.7 48.8
Rural 2001 96,448 32,247 28,586 2,890 32,725 33.4 29.6 3.0 33.9
Urban 2001 31,670 502 728 618 29,822 1.6 2.3 2.0 94.2
D Dinajpur Total 2001 118,315 31,480 26,167 5,788 54,880 26.6 22.1 4.9 46.4
Rural 2001 95,618 31,170 25,878 4,610 33,960 32.6 27.1 4.8 35.5
Urban 2001 22,697 310 289 1,178 20,920 1.4 1.3 5.2 92.2
Female Migrant Workers
West Dinajpur Total 1991 79,258 14,237 45,844 5,462 13,715 18.0 57.8 6.9 17.3
Rural 1991 73,017 14,075 45,127 4,885 8,930 19.3 61.8 6.7 12.2
Urban 1991 6,241 162 717 577 4,785 2.6 11.5 9.2 76.7
U & D Dinajpur Total 2001 305,938 60,693 154,697 25,983 64,565 19.8 50.6 8.5 21.1
Rural 2001 290,718 60,543 153,775 23,475 52,925 20.8 52.9 8.1 18.2
Urban 2001 15,220 150 922 2,508 11,640 1.0 6.1 16.5 76.5
U Dinajpur Total 2001 173,166 38,385 90,037 13,313 31,431 22.2 52.0 7.7 18.2
Rural 2001 165,351 38,274 89,497 12,545 25,035 23.1 54.1 7.6 15.1
Urban 2001 7,815 111 540 768 6,396 1.4 6.9 9.8 81.8
D Dinajpur Total 2001 132,772 22,308 64,660 12,670 33,134 16.8 48.7 9.5 25.0
Rural 2001 125,367 22,269 64,278 10,930 27,890 17.8 51.3 8.7 22.2
Urban 2001 7,405 39 382 1,740 5,244 0.5 5.2 23.5 70.8
Source: D-Series Migration Tables, Census of India, 1991 & 2001
Table: Gender Composition of Migrant Workforce in Uttar & Dakshin Dinajpur, 1991-2001By Place of Last Residence
Migrant Migrant Migrant % Migr % Migr %Migr% Mig- ant ant ant
Migrant Migrant Agri HHI Other rant Agri HHI OtherWorkers Cultivators Labourers Workers Workers Cultiva- Labou- Work- Work-
tors rers ers ers
0
2040
60
80
1 001 20
1 40
1 601 80
2 00
TOTAL M igrant Workers
Cultivators A gri Labour
H HI Workers
Other Workers
RURAL Migrant Workers
Cu ltivators Agri Labour
HHI Workers
Other Workers
URBAN Mi grant Workers
Culti vators Agri Labour
HHI Workers
Other Workers
Thousand Workers
Within U Dinajpur Other W Bengal Districts Other States/UTs Other Countries
Male Migrant Workforce in Uttar Dinajpur 2001By Place of Last Residence
Thou
sand
Wor
kers
Contd.

Human Development Report 2010
320
0
2040
60
80
1 001 20
1 40
1 601 80
2 00
TOTAL M igrant Workers
Cultivators A gri Labour
H HI Workers
Other Workers
RURAL Migrant Workers
Cultivators Agri Labour
HHI Workers
Other Workers
URBAN Mi grant Workers
C ulti vators Agri Labour
HHI Workers
Other Workers
Thousand Workers
Within U Dinajpur Other W B engal Districts Other States/UTs Other Countries
Female Migrant Workforce in Uttar Dinajpur 2001By Place of Last Residence
The consequences of economic migration from outside the district on the gender composition of the migrantworkforce in Uttar Dinajpur have been striking. This is evident in the associated charts which examine thesectoral composition of the male and female migrant workforce in Uttar Dinajpur in 2001 with referenceto different sources of economic migration. Comprising over 57 percent of the migrant workforce, femalemigrant workers outnumbered male migrant workers in the district in the ratio 1.4:1in 2001. However,although the vast majority of male migrant workers had migrated into the district from outside Uttar Dinajpur,over 70 percent of the female migrant workers originated internally from within the district. While economicmigrants from other countries comprised a third of the male migrant workforce in Uttar Dinajpur, theproportions of interstate migrants and intrastate migrants from other West Bengal districts in the malemigrant workforce amounted to 14 percent and 25 percent respectively. Thus only 0.36 lakh workers outof the aggregate male migrant workforce of 1.28 lakh originated from within Uttar Dinajpur. Among womenmigrant workers, in sharp contrast, the proportion of intrastate migrants amounted to 15 percent, while theproportion of interstate and international migrants stood at around 7 percent in each case. Thus 1.23 lakhwomen workers within the female migrant workforce of 1.73 lakh originated from within Uttar Dinajpur.
While the presence of external economic migrants was stronger among migrant male cultivators, HHIworkers and other non-farm workers, male internal migrants had an important presence among migrantagricultural workers. Economic migrants from other West Bengal districts and other countries comprised asignificant section among male cultivators, HHI workers and non-farm workers. However among interstatemigrants, the presence of male cultivators was low. The participation of women external migrants in non-agricultural activities surpassed their participation in the agricultural sector, while internal women migrantsparticipated much more significantly in agricultural activities. With nuptiality being an important intrinsicdeterminant of the patterns of women's economic migration in Uttar Dinajpur, much of this migration wasan internal response to external male economic migration. While the increased demand for agriculturallabour, following the expansion of irrigation, had been filled in the past by the economic migration ofsingle male workers from outside Uttar Dinajpur, a substantial section among them have subsequentlyresettled in the district, marrying local women. Consequently, while more women workers are now availablewithin Uttar Dinajpur to take on agricultural labour activities alongside their spouses, this sequentialprocess of external male migration, nuptiality and resettlement has also generated a deficit of women in thedistrict which is now being filled up by non-work related migration of women from outside the districtwho marry local as well as migrant males. The growing presence of women agricultural workers has alsoincreased the competition for work in rural areas, increasing the casual and seasonal outmigration of maleworkers from Uttar Dinajpur to other states and districts in search of work, which is a pattern that has alsobeen characteristic of states like Bihar. A growing number of agricultural labour households in Uttar Dinajpurwith outmigrating males remain female-headed for some part of the year. These outmigrating male workerssubsequently return for a part of the year to their homes and families during the peak agricultural seasonwhen labour demands in Uttar Dinajpur are the highest.
Thou
sand
Wor
kers
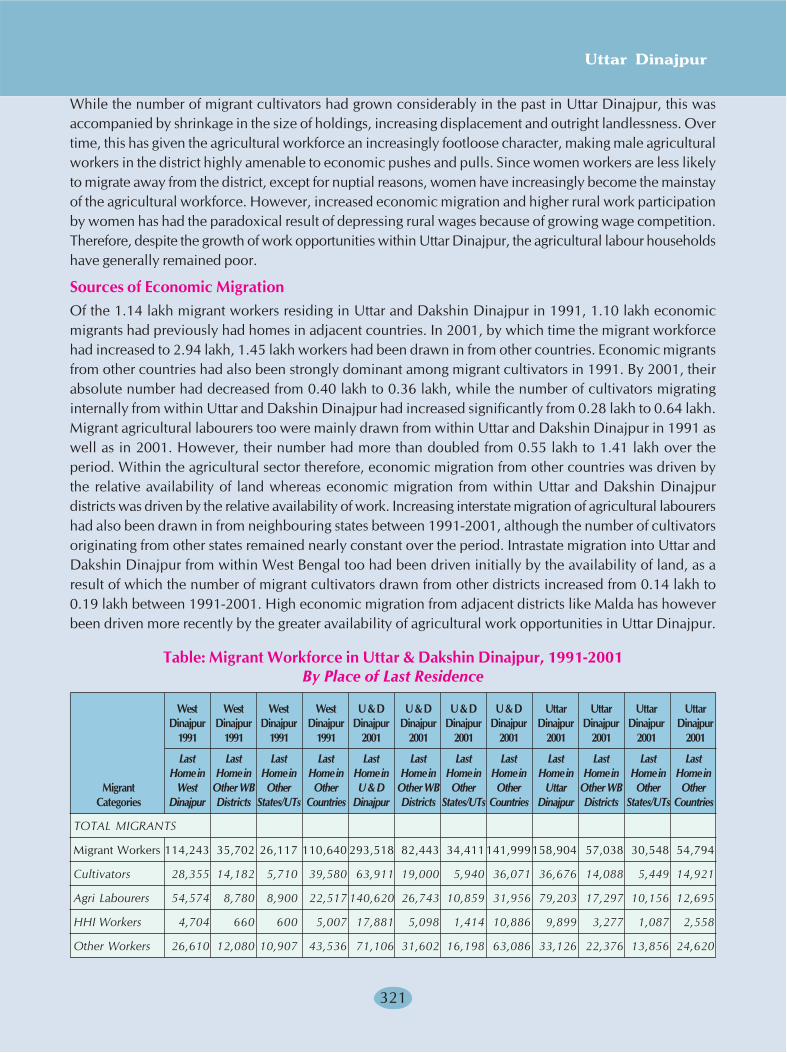
Uttar Dinajpur
321
While the number of migrant cultivators had grown considerably in the past in Uttar Dinajpur, this wasaccompanied by shrinkage in the size of holdings, increasing displacement and outright landlessness. Overtime, this has given the agricultural workforce an increasingly footloose character, making male agriculturalworkers in the district highly amenable to economic pushes and pulls. Since women workers are less likelyto migrate away from the district, except for nuptial reasons, women have increasingly become the mainstayof the agricultural workforce. However, increased economic migration and higher rural work participationby women has had the paradoxical result of depressing rural wages because of growing wage competition.Therefore, despite the growth of work opportunities within Uttar Dinajpur, the agricultural labour householdshave generally remained poor.
Sources of Economic MigrationOf the 1.14 lakh migrant workers residing in Uttar and Dakshin Dinajpur in 1991, 1.10 lakh economicmigrants had previously had homes in adjacent countries. In 2001, by which time the migrant workforcehad increased to 2.94 lakh, 1.45 lakh workers had been drawn in from other countries. Economic migrantsfrom other countries had also been strongly dominant among migrant cultivators in 1991. By 2001, theirabsolute number had decreased from 0.40 lakh to 0.36 lakh, while the number of cultivators migratinginternally from within Uttar and Dakshin Dinajpur had increased significantly from 0.28 lakh to 0.64 lakh.Migrant agricultural labourers too were mainly drawn from within Uttar and Dakshin Dinajpur in 1991 aswell as in 2001. However, their number had more than doubled from 0.55 lakh to 1.41 lakh over theperiod. Within the agricultural sector therefore, economic migration from other countries was driven bythe relative availability of land whereas economic migration from within Uttar and Dakshin Dinajpurdistricts was driven by the relative availability of work. Increasing interstate migration of agricultural labourershad also been drawn in from neighbouring states between 1991-2001, although the number of cultivatorsoriginating from other states remained nearly constant over the period. Intrastate migration into Uttar andDakshin Dinajpur from within West Bengal too had been driven initially by the availability of land, as aresult of which the number of migrant cultivators drawn from other districts increased from 0.14 lakh to0.19 lakh between 1991-2001. High economic migration from adjacent districts like Malda has howeverbeen driven more recently by the greater availability of agricultural work opportunities in Uttar Dinajpur.
Table: Migrant Workforce in Uttar & Dakshin Dinajpur, 1991-2001By Place of Last Residence
West West West West U & D U & D U & D U & D Uttar Uttar Uttar UttarDinajpur Dinajpur Dinajpur Dinajpur Dinajpur Dinajpur Dinajpur Dinajpur Dinajpur Dinajpur Dinajpur Dinajpur
1991 1991 1991 1991 2001 2001 2001 2001 2001 2001 2001 2001
Last Last Last Last Last Last Last Last Last Last Last LastHome in Home in Home in Home in Home in Home in Home in Home in Home in Home in Home in Home in
Migrant West Other WB Other Other U & D Other WB Other Other Uttar Other WB Other OtherCategories Dinajpur Districts States/UTs Countries Dinajpur Districts States/UTs Countries Dinajpur Districts States/UTs Countries
TOTAL MIGRANTS
Migrant Workers 114,243 35,702 26,117 110,640 293,518 82,443 34,411141,999158,904 57,038 30,548 54,794
Cultivators 28,355 14,182 5,710 39,580 63,911 19,000 5,940 36,071 36,676 14,088 5,449 14,921
Agri Labourers 54,574 8,780 8,900 22,517 140,620 26,743 10,859 31,956 79,203 17,297 10,156 12,695
HHI Workers 4,704 660 600 5,007 17,881 5,098 1,414 10,886 9,899 3,277 1,087 2,558
Other Workers 26,610 12,080 10,907 43,536 71,106 31,602 16,198 63,086 33,126 22,376 13,856 24,620
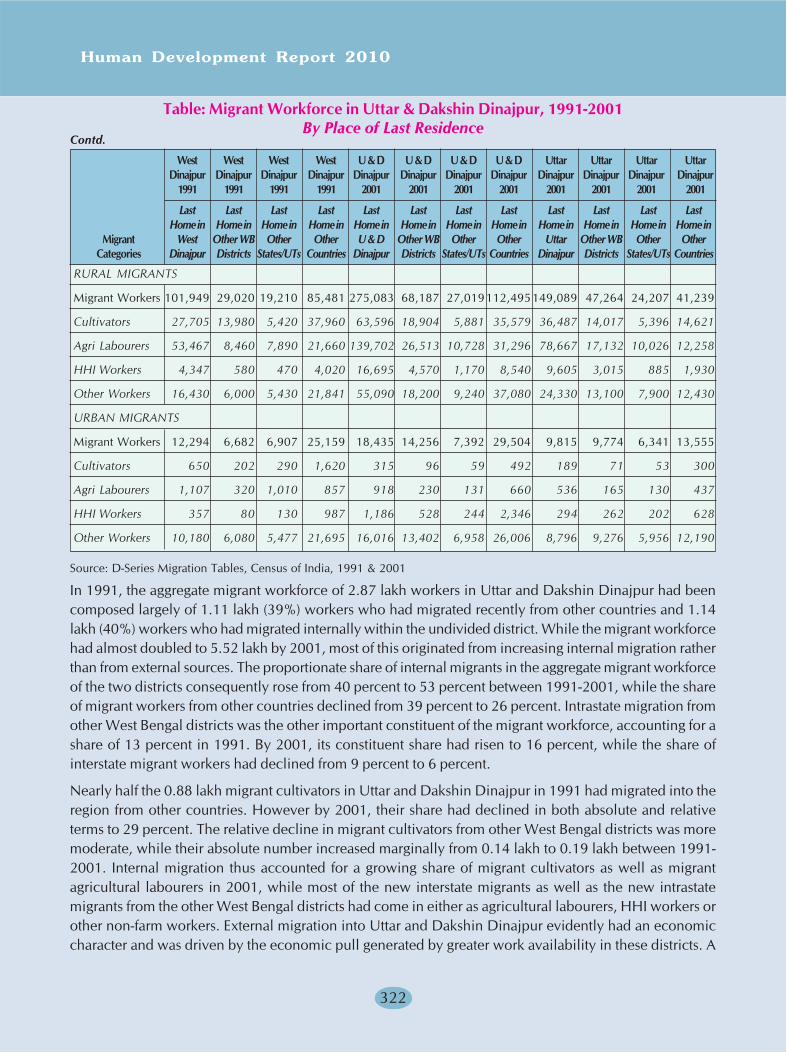
Human Development Report 2010
322
RURAL MIGRANTS
Migrant Workers 101,949 29,020 19,210 85,481 275,083 68,187 27,019112,495149,089 47,264 24,207 41,239
Cultivators 27,705 13,980 5,420 37,960 63,596 18,904 5,881 35,579 36,487 14,017 5,396 14,621
Agri Labourers 53,467 8,460 7,890 21,660 139,702 26,513 10,728 31,296 78,667 17,132 10,026 12,258
HHI Workers 4,347 580 470 4,020 16,695 4,570 1,170 8,540 9,605 3,015 885 1,930
Other Workers 16,430 6,000 5,430 21,841 55,090 18,200 9,240 37,080 24,330 13,100 7,900 12,430
URBAN MIGRANTS
Migrant Workers 12,294 6,682 6,907 25,159 18,435 14,256 7,392 29,504 9,815 9,774 6,341 13,555
Cultivators 650 202 290 1,620 315 96 59 492 189 71 53 300
Agri Labourers 1,107 320 1,010 857 918 230 131 660 536 165 130 437
HHI Workers 357 80 130 987 1,186 528 244 2,346 294 262 202 628
Other Workers 10,180 6,080 5,477 21,695 16,016 13,402 6,958 26,006 8,796 9,276 5,956 12,190
Source: D-Series Migration Tables, Census of India, 1991 & 2001
In 1991, the aggregate migrant workforce of 2.87 lakh workers in Uttar and Dakshin Dinajpur had beencomposed largely of 1.11 lakh (39%) workers who had migrated recently from other countries and 1.14lakh (40%) workers who had migrated internally within the undivided district. While the migrant workforcehad almost doubled to 5.52 lakh by 2001, most of this originated from increasing internal migration ratherthan from external sources. The proportionate share of internal migrants in the aggregate migrant workforceof the two districts consequently rose from 40 percent to 53 percent between 1991-2001, while the shareof migrant workers from other countries declined from 39 percent to 26 percent. Intrastate migration fromother West Bengal districts was the other important constituent of the migrant workforce, accounting for ashare of 13 percent in 1991. By 2001, its constituent share had risen to 16 percent, while the share ofinterstate migrant workers had declined from 9 percent to 6 percent.
Nearly half the 0.88 lakh migrant cultivators in Uttar and Dakshin Dinajpur in 1991 had migrated into theregion from other countries. However by 2001, their share had declined in both absolute and relativeterms to 29 percent. The relative decline in migrant cultivators from other West Bengal districts was moremoderate, while their absolute number increased marginally from 0.14 lakh to 0.19 lakh between 1991-2001. Internal migration thus accounted for a growing share of migrant cultivators as well as migrantagricultural labourers in 2001, while most of the new interstate migrants as well as the new intrastatemigrants from the other West Bengal districts had come in either as agricultural labourers, HHI workers orother non-farm workers. External migration into Uttar and Dakshin Dinajpur evidently had an economiccharacter and was driven by the economic pull generated by greater work availability in these districts. A
Table: Migrant Workforce in Uttar & Dakshin Dinajpur, 1991-2001By Place of Last Residence
West West West West U & D U & D U & D U & D Uttar Uttar Uttar UttarDinajpur Dinajpur Dinajpur Dinajpur Dinajpur Dinajpur Dinajpur Dinajpur Dinajpur Dinajpur Dinajpur Dinajpur
1991 1991 1991 1991 2001 2001 2001 2001 2001 2001 2001 2001
Last Last Last Last Last Last Last Last Last Last Last LastHome in Home in Home in Home in Home in Home in Home in Home in Home in Home in Home in Home in
Migrant West Other WB Other Other U & D Other WB Other Other Uttar Other WB Other OtherCategories Dinajpur Districts States/UTs Countries Dinajpur Districts States/UTs Countries Dinajpur Districts States/UTs Countries
Contd.
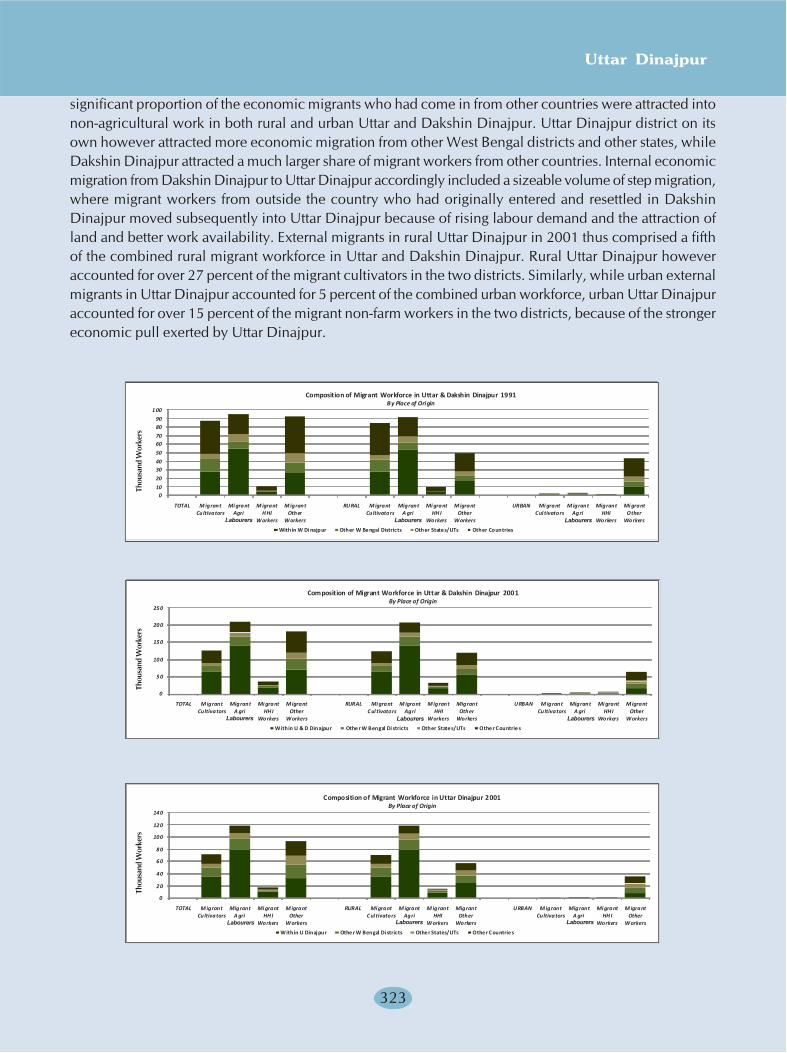
Uttar Dinajpur
323
significant proportion of the economic migrants who had come in from other countries were attracted intonon-agricultural work in both rural and urban Uttar and Dakshin Dinajpur. Uttar Dinajpur district on itsown however attracted more economic migration from other West Bengal districts and other states, whileDakshin Dinajpur attracted a much larger share of migrant workers from other countries. Internal economicmigration from Dakshin Dinajpur to Uttar Dinajpur accordingly included a sizeable volume of step migration,where migrant workers from outside the country who had originally entered and resettled in DakshinDinajpur moved subsequently into Uttar Dinajpur because of rising labour demand and the attraction ofland and better work availability. External migrants in rural Uttar Dinajpur in 2001 thus comprised a fifthof the combined rural migrant workforce in Uttar and Dakshin Dinajpur. Rural Uttar Dinajpur howeveraccounted for over 27 percent of the migrant cultivators in the two districts. Similarly, while urban externalmigrants in Uttar Dinajpur accounted for 5 percent of the combined urban workforce, urban Uttar Dinajpuraccounted for over 15 percent of the migrant non-farm workers in the two districts, because of the strongereconomic pull exerted by Uttar Dinajpur.
010
20
3040
50
6070
8090
1 00
TOTAL M igrant Cu ltivators
Mi grant Agri
Labour
M igrant H HI
Workers
M igrant Other
Workers
RURAL M igrant Cultivators
Migrant A gri
Labour
Mi grant HH I
Workers
M igrant Other
Workers
URBAN Mi grant Cul tivators
M igrant Agri
Labour
Migrant HHI
Workers
Mi grant Other
Workers
Thousand Workers
Within W Di najpur Other W Be ngal Districts Other State s/UTs Other Countries
Composition of Migrant Workforce in Uttar & Dakshin Dinajpur 1991By Place of Origin
0
5 0
10 0
15 0
20 0
25 0
TOTAL M igrant Cultivators
Migrant A gri
Labour
Mi grant HH I
Workers
M igrant Other
Workers
RURAL Mi grant C ul tivators
M igrant Agri
Labour
M igrant HHI
Workers
Migrant Other
Workers
URBAN M igrant Cu ltivators
Migrant A gri
Labour
Mi grant HH I
Workers
M igrant Other
Workers
Thousand Workers
Within U & D Dinajpur Othe r W Bengal Di stricts Other State s/UTs Othe r Countrie s
Composition of Migrant Workforce in Uttar & Dakshin Dinajpur 2001By Place of Origin
0
2 0
4 0
6 0
8 0
10 0
12 0
14 0
TOTAL M igrant Cultivators
Migrant A gri
Labour
Mi grant HH I
Workers
M igrant Other
Workers
RURAL Mi grant C ul tivators
M igrant Agri
Labour
M igrant HHI
Workers
Migrant Other
Workers
URBAN M igrant Cultivators
Migrant A gri
Labour
Mi grant HH I
Workers
M igrant Other
Workers
Thousand Workers
Within U Dinajpur Othe r W Bengal Di stricts Othe r States/UTs Othe r Countrie s
Composition of Migrant Workforce in Uttar Dinajpur 2001By Place of Origin
Thou
sand
Wor
kers
Thou
sand
Wor
kers
Thou
sand
Wor
kers
Labourers Labourers Labourers
LabourersLabourersLabourers
Labourers Labourers Labourers
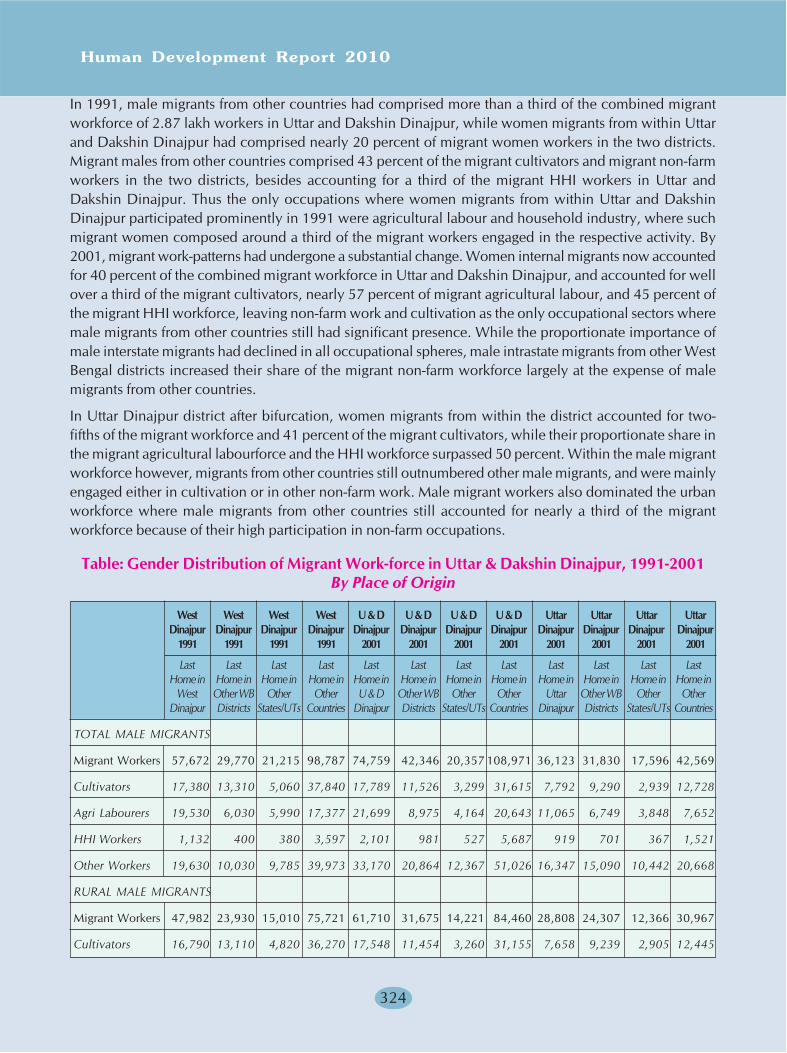
Human Development Report 2010
324
In 1991, male migrants from other countries had comprised more than a third of the combined migrantworkforce of 2.87 lakh workers in Uttar and Dakshin Dinajpur, while women migrants from within Uttarand Dakshin Dinajpur had comprised nearly 20 percent of migrant women workers in the two districts.Migrant males from other countries comprised 43 percent of the migrant cultivators and migrant non-farmworkers in the two districts, besides accounting for a third of the migrant HHI workers in Uttar andDakshin Dinajpur. Thus the only occupations where women migrants from within Uttar and DakshinDinajpur participated prominently in 1991 were agricultural labour and household industry, where suchmigrant women composed around a third of the migrant workers engaged in the respective activity. By2001, migrant work-patterns had undergone a substantial change. Women internal migrants now accountedfor 40 percent of the combined migrant workforce in Uttar and Dakshin Dinajpur, and accounted for wellover a third of the migrant cultivators, nearly 57 percent of migrant agricultural labour, and 45 percent ofthe migrant HHI workforce, leaving non-farm work and cultivation as the only occupational sectors wheremale migrants from other countries still had significant presence. While the proportionate importance ofmale interstate migrants had declined in all occupational spheres, male intrastate migrants from other WestBengal districts increased their share of the migrant non-farm workforce largely at the expense of malemigrants from other countries.
In Uttar Dinajpur district after bifurcation, women migrants from within the district accounted for two-fifths of the migrant workforce and 41 percent of the migrant cultivators, while their proportionate share inthe migrant agricultural labourforce and the HHI workforce surpassed 50 percent. Within the male migrantworkforce however, migrants from other countries still outnumbered other male migrants, and were mainlyengaged either in cultivation or in other non-farm work. Male migrant workers also dominated the urbanworkforce where male migrants from other countries still accounted for nearly a third of the migrantworkforce because of their high participation in non-farm occupations.
Table: Gender Distribution of Migrant Work-force in Uttar & Dakshin Dinajpur, 1991-2001By Place of Origin
West West West West U & D U & D U & D U & D Uttar Uttar Uttar UttarDinajpur Dinajpur Dinajpur Dinajpur Dinajpur Dinajpur Dinajpur Dinajpur Dinajpur Dinajpur Dinajpur Dinajpur
1991 1991 1991 1991 2001 2001 2001 2001 2001 2001 2001 2001
Last Last Last Last Last Last Last Last Last Last Last LastHome in Home in Home in Home in Home in Home in Home in Home in Home in Home in Home in Home in
West Other WB Other Other U & D Other WB Other Other Uttar Other WB Other OtherDinajpur Districts States/UTs Countries Dinajpur Districts States/UTs Countries Dinajpur Districts States/UTs Countries
TOTAL MALE MIGRANTS
Migrant Workers 57,672 29,770 21,215 98,787 74,759 42,346 20,357 108,971 36,123 31,830 17,596 42,569
Cultivators 17,380 13,310 5,060 37,840 17,789 11,526 3,299 31,615 7,792 9,290 2,939 12,728
Agri Labourers 19,530 6,030 5,990 17,377 21,699 8,975 4,164 20,643 11,065 6,749 3,848 7,652
HHI Workers 1,132 400 380 3,597 2,101 981 527 5,687 919 701 367 1,521
Other Workers 19,630 10,030 9,785 39,973 33,170 20,864 12,367 51,026 16,347 15,090 10,442 20,668
RURAL MALE MIGRANTS
Migrant Workers 47,982 23,930 15,010 75,721 61,710 31,675 14,221 84,460 28,808 24,307 12,366 30,967
Cultivators 16,790 13,110 4,820 36,270 17,548 11,454 3,260 31,155 7,658 9,239 2,905 12,445
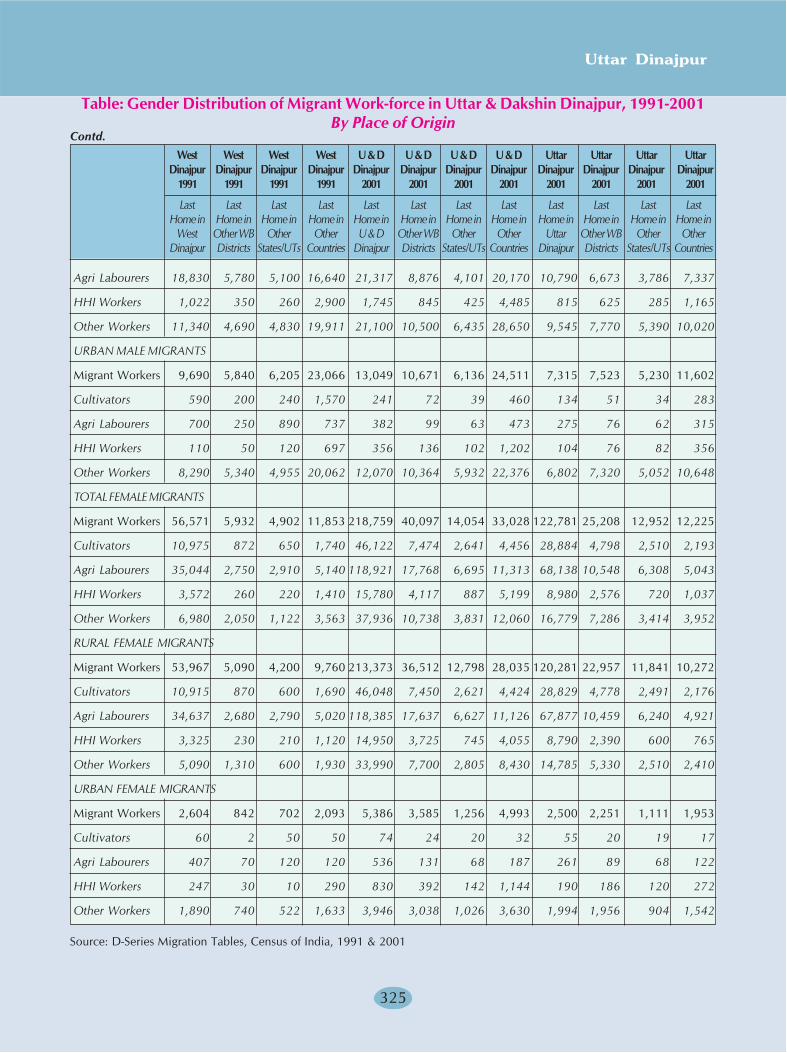
Uttar Dinajpur
325
Agri Labourers 18,830 5,780 5,100 16,640 21,317 8,876 4,101 20,170 10,790 6,673 3,786 7,337
HHI Workers 1,022 350 260 2,900 1,745 845 425 4,485 815 625 285 1,165
Other Workers 11,340 4,690 4,830 19,911 21,100 10,500 6,435 28,650 9,545 7,770 5,390 10,020
URBAN MALE MIGRANTS
Migrant Workers 9,690 5,840 6,205 23,066 13,049 10,671 6,136 24,511 7,315 7,523 5,230 11,602
Cultivators 590 200 240 1,570 241 72 39 460 134 51 34 283
Agri Labourers 700 250 890 737 382 99 63 473 275 76 62 315
HHI Workers 110 50 120 697 356 136 102 1,202 104 76 82 356
Other Workers 8,290 5,340 4,955 20,062 12,070 10,364 5,932 22,376 6,802 7,320 5,052 10,648
TOTAL FEMALE MIGRANTS
Migrant Workers 56,571 5,932 4,902 11,853 218,759 40,097 14,054 33,028 122,781 25,208 12,952 12,225
Cultivators 10,975 872 650 1,740 46,122 7,474 2,641 4,456 28,884 4,798 2,510 2,193
Agri Labourers 35,044 2,750 2,910 5,140 118,921 17,768 6,695 11,313 68,138 10,548 6,308 5,043
HHI Workers 3,572 260 220 1,410 15,780 4,117 887 5,199 8,980 2,576 720 1,037
Other Workers 6,980 2,050 1,122 3,563 37,936 10,738 3,831 12,060 16,779 7,286 3,414 3,952
RURAL FEMALE MIGRANTS
Migrant Workers 53,967 5,090 4,200 9,760 213,373 36,512 12,798 28,035 120,281 22,957 11,841 10,272
Cultivators 10,915 870 600 1,690 46,048 7,450 2,621 4,424 28,829 4,778 2,491 2,176
Agri Labourers 34,637 2,680 2,790 5,020 118,385 17,637 6,627 11,126 67,877 10,459 6,240 4,921
HHI Workers 3,325 230 210 1,120 14,950 3,725 745 4,055 8,790 2,390 600 765
Other Workers 5,090 1,310 600 1,930 33,990 7,700 2,805 8,430 14,785 5,330 2,510 2,410
URBAN FEMALE MIGRANTS
Migrant Workers 2,604 842 702 2,093 5,386 3,585 1,256 4,993 2,500 2,251 1,111 1,953
Cultivators 60 2 50 50 74 24 20 32 55 20 19 17
Agri Labourers 407 70 120 120 536 131 68 187 261 89 68 122
HHI Workers 247 30 10 290 830 392 142 1,144 190 186 120 272
Other Workers 1,890 740 522 1,633 3,946 3,038 1,026 3,630 1,994 1,956 904 1,542
Source: D-Series Migration Tables, Census of India, 1991 & 2001
Table: Gender Distribution of Migrant Work-force in Uttar & Dakshin Dinajpur, 1991-2001By Place of Origin
West West West West U & D U & D U & D U & D Uttar Uttar Uttar UttarDinajpur Dinajpur Dinajpur Dinajpur Dinajpur Dinajpur Dinajpur Dinajpur Dinajpur Dinajpur Dinajpur Dinajpur
1991 1991 1991 1991 2001 2001 2001 2001 2001 2001 2001 2001
Last Last Last Last Last Last Last Last Last Last Last LastHome in Home in Home in Home in Home in Home in Home in Home in Home in Home in Home in Home in
West Other WB Other Other U & D Other WB Other Other Uttar Other WB Other OtherDinajpur Districts States/UTs Countries Dinajpur Districts States/UTs Countries Dinajpur Districts States/UTs Countries
Contd.
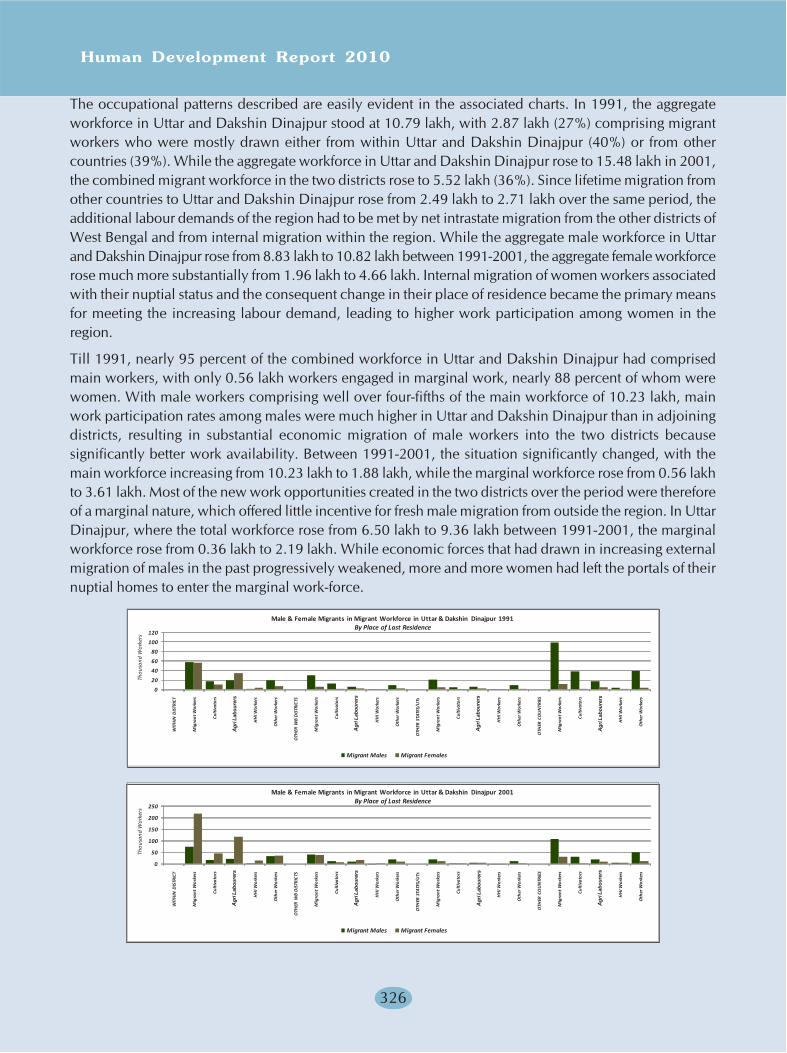
Human Development Report 2010
326
The occupational patterns described are easily evident in the associated charts. In 1991, the aggregateworkforce in Uttar and Dakshin Dinajpur stood at 10.79 lakh, with 2.87 lakh (27%) comprising migrantworkers who were mostly drawn either from within Uttar and Dakshin Dinajpur (40%) or from othercountries (39%). While the aggregate workforce in Uttar and Dakshin Dinajpur rose to 15.48 lakh in 2001,the combined migrant workforce in the two districts rose to 5.52 lakh (36%). Since lifetime migration fromother countries to Uttar and Dakshin Dinajpur rose from 2.49 lakh to 2.71 lakh over the same period, theadditional labour demands of the region had to be met by net intrastate migration from the other districts ofWest Bengal and from internal migration within the region. While the aggregate male workforce in Uttarand Dakshin Dinajpur rose from 8.83 lakh to 10.82 lakh between 1991-2001, the aggregate female workforcerose much more substantially from 1.96 lakh to 4.66 lakh. Internal migration of women workers associatedwith their nuptial status and the consequent change in their place of residence became the primary meansfor meeting the increasing labour demand, leading to higher work participation among women in theregion.
Till 1991, nearly 95 percent of the combined workforce in Uttar and Dakshin Dinajpur had comprisedmain workers, with only 0.56 lakh workers engaged in marginal work, nearly 88 percent of whom werewomen. With male workers comprising well over four-fifths of the main workforce of 10.23 lakh, mainwork participation rates among males were much higher in Uttar and Dakshin Dinajpur than in adjoiningdistricts, resulting in substantial economic migration of male workers into the two districts becausesignificantly better work availability. Between 1991-2001, the situation significantly changed, with themain workforce increasing from 10.23 lakh to 1.88 lakh, while the marginal workforce rose from 0.56 lakhto 3.61 lakh. Most of the new work opportunities created in the two districts over the period were thereforeof a marginal nature, which offered little incentive for fresh male migration from outside the region. In UttarDinajpur, where the total workforce rose from 6.50 lakh to 9.36 lakh between 1991-2001, the marginalworkforce rose from 0.36 lakh to 2.19 lakh. While economic forces that had drawn in increasing externalmigration of males in the past progressively weakened, more and more women had left the portals of theirnuptial homes to enter the marginal work-force.
0
20
40
60
80
100
120
WIT
HIN
DIS
TRIC
T
Mig
rant
Wor
kers
Culti
vato
rs
Agri
Labo
ur
HH
I Wor
kers
Oth
er W
orke
rs
OTH
ER W
B D
ISTR
ICTS
Mig
rant
Wor
kers
Culti
vato
rs
Agri
Labo
ur
HH
I Wor
kers
Oth
er W
orke
rs
OTH
ER S
TATE
S/U
Ts
Mig
rant
Wor
kers
Culti
vato
rs
Agri
Labo
ur
HH
I Wor
kers
Oth
er W
orke
rs
OTH
ER C
OU
NTR
IES
Mig
rant
Wor
kers
Culti
vato
rs
Agri
Labo
ur
HH
I Wor
kers
Oth
er W
orke
rs
Thou
sand
Wor
kers
Migrant Males Migrant Females
Male & Female Migrants in Migrant Workforce in Uttar & Dakshin Dinajpur 1991By Place of Last Residence
0
50
100
150
200
250
WIT
HIN
DIS
TRIC
T
Mig
rant
Wor
kers
Culti
vato
rs
Agri
Labo
ur
HH
I Wor
kers
Oth
er W
orke
rs
OTH
ER W
B D
ISTR
ICTS
Mig
rant
Wor
kers
Culti
vato
rs
Agri
Labo
ur
HH
I Wor
kers
Oth
er W
orke
rs
OTH
ER S
TATE
S/U
Ts
Mig
rant
Wor
kers
Culti
vato
rs
Agri
Labo
ur
HH
I Wor
kers
Oth
er W
orke
rs
OTH
ER C
OU
NTR
IES
Mig
rant
Wor
kers
Culti
vato
rs
Agri
Labo
ur
HH
I Wor
kers
Oth
er W
orke
rs
Thou
sand
Wor
kers
Migrant Males Migrant Females
Male & Female Migrants in Migrant Workforce in Uttar & Dakshin Dinajpur 2001By Place of Last Residence
Agr
i Lab
oure
rs
Agr
i Lab
oure
rs
Agr
i Lab
oure
rs
Agr
i Lab
oure
rsA
gri L
abou
rers
Agr
i Lab
oure
rs
Agr
i Lab
oure
rs
Agr
i Lab
oure
rs

Uttar Dinajpur
327
The changing structure of the aggregate workforce in Uttar and Dakshin Dinajpur districts is consistentwith the changing migration patterns seen in the charts. Male migration from outside the region has slackened,encouraging the work participation and internal migration of women workers. However, this changedwork situation is hardly satisfactory and is leading progressively to the seasonal or casual outward migrationof male workers from Uttar Dinajpur, as seen elsewhere in this report. Step migration of males to otherstates and cities outside Uttar Dinajpur is the inevitable result, as Uttar Dinajpur gradually switches frombeing a net recipient of migration to becoming a net exporter of population to the rest of the state and thecountry. The longterm solution obviously lies in expanding and diversifying livelihood opportunities inUttar Dinajpur.
Age Profiles of Migrants
Life-time migration into Uttar Dinajpur has evidently been driven by political push factors, economic pullfactors as well as locational advantages, all of which have combined to make the district a prime destinationfor successive waves of international, interstate and intrastate migration since 1947. However, since theresulting migrant streams have not entered the district simultaneously, each form of migration has takenprecedence over the others at given points of time. The age distributions of lifetime migrants in UttarDinajpur offer an important means for tracking this migration history while identifying the characteristicage profiles of each migrant group. Male migrants in the age-group 35-59 years formed the dominant agecluster among male migrants in 2001, comprising 43 percent of all male lifetime migrants in Uttar Dinajpur.With 57 percent of the migrants being over 35 years in age, the age profile for male migrants was heavilyskewed towards the senior age-groups. Among women migrants too, the age-group 35-59 years formed themodal age cluster, accounting for over 38 percent of all women migrants in Uttar Dinajpur. However withonly 10 percent of the women migrants being over 60 years in age, the age profile for women migrants wasless skewed. Given the prevalent rural practice of early marriage, women in the marriageable age cluster of15-34 years comprised 47 percent of the women migrants, clearly establishing that the migration of womenin Uttar Dinajpur is more recent and is closely related to nuptiality. Male migration, on the other hand, hadbeen stronger in the past and has weakened more recently, since the age cluster 15-34 years where singlemale migration usually occurs comprised less than 29 percent of all male migrants.
0
20
40
60
80
100
120
140
0-4 years 5-9 years 10-14 years
15-24 years
25-34 years
35-59 years
60+ years
Thousand persons
Elsewhere i n U Dinajpur Other WB Di stricts
Other States/UTs Other Countries
UTTA R DINA JPURAge Distributi on of Migrant Population 2001
0
5
10
15
20
25
30
35
0-4 years 5-9 years 10-14 years
15-24 years
25-34 years
35-59 years
60+ yea rs
Thousand persons
Elsewhere in U Di najpur Other WB Districts
Other States/UTs Other Countries
UTTAR DINAJPURAge Distributi on of Male Migrants 2001
0
5
10
15
20
25
30
35
0 -4 years 5 -9 years 10-14 years
15-24 years
25-34 years
35-59 years
60+ years
Thousand persons
Elsewhere in U Di najpur Other WB Districts
Other States/UTs Other Countries
UTTAR DINAJPURAge Distributi on of Male M igrants 2001
020406080
100120140
WIT
HIN
DIS
TRIC
T
Mig
rant
Wor
kers
Culti
vato
rs
Agri
Labo
ur
HH
I Wor
kers
Oth
er W
orke
rs
OTH
ER W
B D
ISTR
ICTS
Mig
rant
Wor
kers
Culti
vato
rs
Agri
Labo
ur
HH
I Wor
kers
Oth
er W
orke
rs
OTH
ER S
TATE
S/U
Ts
Mig
rant
Wor
kers
Culti
vato
rs
Agri
Labo
ur
HH
I Wor
kers
Oth
er W
orke
rs
OTH
ER C
OU
NTR
IES
Mig
rant
Wor
kers
Culti
vato
rs
Agri
Labo
ur
HH
I Wor
kers
Oth
er W
orke
rs
Thou
sand
Wor
kers
Migrant Males Migrant Females
Male & Female Migrants in Migrant Workforce in Uttar Dinajpur 2001By Place of Last Residence
Thou
sand
Per
sons
Thou
sand
Per
sons
Thou
sand
Per
sons
Agr
i Lab
oure
rs
Agr
i Lab
oure
rs
Agr
i Lab
oure
rs
Agr
i Lab
oure
rs
Human Development Report 2010
328
International migration has been the dominant source for male lifetime migration in Uttar Dinajpur, whilefemale nuptial migrants have generally been sourced through internal migration within the district. Sincemore than three-fourths of the male international migrants were aged over 35 years, male internationalmigration in Uttar Dinajpur was old rather than recent. Conversely, with two-thirds of the female internalmigrants being aged below 35 years, increased female internal migration in Uttar Dinajpur in recent yearshas occurred at least partially in response to the past migration of single males. Although smaller in absolutevolume, the flow of male interstate and interdistrict migration into Uttar Dinajpur has continued in recentyears, with 16 percent of the male interdistrict migrants and 14 percent of the interstate migrants falling inthe age-group 15-24 years. Internal migration of younger males has also risen in recent years, with males inthe age cluster 15-35 years comprising nearly 30 percent of all male migrants. Since internal, intrastate andinterstate migration of males occurs in direct response to economic pull factors such as high labour demand,it becomes obvious that the current wave of internal and intrastate male migration into Uttar Dinajpur hasgradually shut the door to increased economic migration of males from other states and countries.
The relatively balanced proportions of younger migrants in the age cluster 0-14 years within the stream ofinternal migrants obviously indicates that internal migration within Uttar Dinajpur is often likely to involvethe relocation of families, while in the case of intrastate and interstate migration, the relocation of familieshas been comparatively rare. International migration, which has declined in recent years, had also involvedthe relocation of families. Women migrants from other states and districts greatly outnumber male migrantsfrom these places in the age cluster 15-34 years, indicating that the net migration of women of marriageableage into Uttar Dinajpur from places outside the district occurs in response to the marriage demands oflocal as well as migrant males. This excess migration of women has been an important factor in reducingthe masculinity of the district population in Uttar Dinajpur and improving the female-male ratio [FMR]from 921 per 1000 males in 1991 to 938 per 1000 males in 2001.
Urban areas in Uttar Dinajpur had received a sizeable amount of family migration from other countries inthe past, and still receive a significant amount of migration from other states and other West Bengal districts.Internal migration into these urban areas from the rural areas of Uttar Dinajpur however is relativelyrecent, and its numerical magnitude is still low compared to intrastate migration from within West Bengal.Excess female migration is relatively strong among intrastate urban migrants from other West Bengal districts,and is also present among interstate urban migrants. Since the main factor driving excess female migrationinto Uttar Dinajpur is nuptial demand, this indicates that single males who had migrated into urban areasin Uttar Dinajpur from external locations in the past have generally preferred to bring in brides fromoutside the district. Given the mixed cultural complexion of the district, religion and community differenceshave played an important part in this, also strengthening the kinship chains that support external migration.
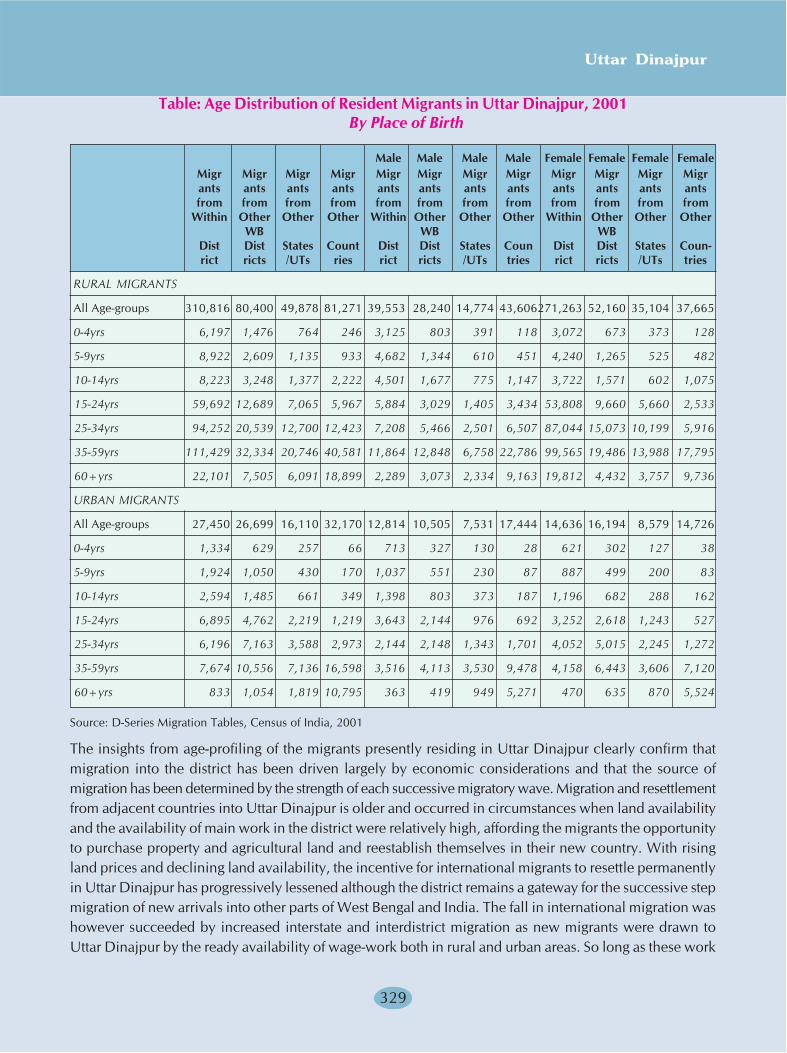
Uttar Dinajpur
329
Table: Age Distribution of Resident Migrants in Uttar Dinajpur, 2001By Place of Birth
Male Male Male Male Female Female Female FemaleMigr Migr Migr Migr Migr Migr Migr Migr Migr Migr Migr Migrants ants ants ants ants ants ants ants ants ants ants antsfrom from from from from from from from from from from from
Within Other Other Other Within Other Other Other Within Other Other OtherWB WB WB
Dist Dist States Count Dist Dist States Coun Dist Dist States Coun-rict ricts /UTs ries rict ricts /UTs tries rict ricts /UTs tries
RURAL MIGRANTS
All Age-groups 310,816 80,400 49,878 81,271 39,553 28,240 14,774 43,606271,263 52,160 35,104 37,665
0-4yrs 6,197 1,476 764 246 3,125 803 391 118 3,072 673 373 128
5-9yrs 8,922 2,609 1,135 933 4,682 1,344 610 451 4,240 1,265 525 482
10-14yrs 8,223 3,248 1,377 2,222 4,501 1,677 775 1,147 3,722 1,571 602 1,075
15-24yrs 59,692 12,689 7,065 5,967 5,884 3,029 1,405 3,434 53,808 9,660 5,660 2,533
25-34yrs 94,252 20,539 12,700 12,423 7,208 5,466 2,501 6,507 87,044 15,073 10,199 5,916
35-59yrs 111,429 32,334 20,746 40,581 11,864 12,848 6,758 22,786 99,565 19,486 13,988 17,795
60+yrs 22,101 7,505 6,091 18,899 2,289 3,073 2,334 9,163 19,812 4,432 3,757 9,736
URBAN MIGRANTS
All Age-groups 27,450 26,699 16,110 32,170 12,814 10,505 7,531 17,444 14,636 16,194 8,579 14,726
0-4yrs 1,334 629 257 66 713 327 130 28 621 302 127 38
5-9yrs 1,924 1,050 430 170 1,037 551 230 87 887 499 200 83
10-14yrs 2,594 1,485 661 349 1,398 803 373 187 1,196 682 288 162
15-24yrs 6,895 4,762 2,219 1,219 3,643 2,144 976 692 3,252 2,618 1,243 527
25-34yrs 6,196 7,163 3,588 2,973 2,144 2,148 1,343 1,701 4,052 5,015 2,245 1,272
35-59yrs 7,674 10,556 7,136 16,598 3,516 4,113 3,530 9,478 4,158 6,443 3,606 7,120
60+yrs 833 1,054 1,819 10,795 363 419 949 5,271 470 635 870 5,524
Source: D-Series Migration Tables, Census of India, 2001
The insights from age-profiling of the migrants presently residing in Uttar Dinajpur clearly confirm thatmigration into the district has been driven largely by economic considerations and that the source ofmigration has been determined by the strength of each successive migratory wave. Migration and resettlementfrom adjacent countries into Uttar Dinajpur is older and occurred in circumstances when land availabilityand the availability of main work in the district were relatively high, affording the migrants the opportunityto purchase property and agricultural land and reestablish themselves in their new country. With risingland prices and declining land availability, the incentive for international migrants to resettle permanentlyin Uttar Dinajpur has progressively lessened although the district remains a gateway for the successive stepmigration of new arrivals into other parts of West Bengal and India. The fall in international migration washowever succeeded by increased interstate and interdistrict migration as new migrants were drawn toUttar Dinajpur by the ready availability of wage-work both in rural and urban areas. So long as these work
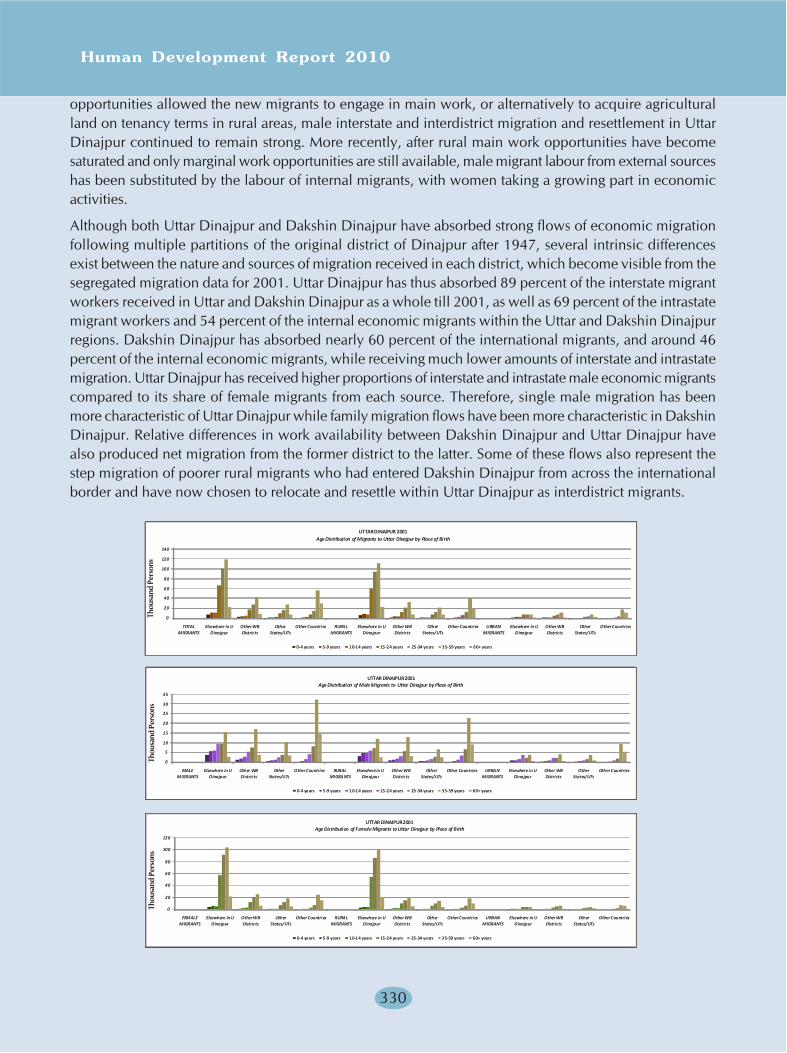
Human Development Report 2010
330
opportunities allowed the new migrants to engage in main work, or alternatively to acquire agriculturalland on tenancy terms in rural areas, male interstate and interdistrict migration and resettlement in UttarDinajpur continued to remain strong. More recently, after rural main work opportunities have becomesaturated and only marginal work opportunities are still available, male migrant labour from external sourceshas been substituted by the labour of internal migrants, with women taking a growing part in economicactivities.
Although both Uttar Dinajpur and Dakshin Dinajpur have absorbed strong flows of economic migrationfollowing multiple partitions of the original district of Dinajpur after 1947, several intrinsic differencesexist between the nature and sources of migration received in each district, which become visible from thesegregated migration data for 2001. Uttar Dinajpur has thus absorbed 89 percent of the interstate migrantworkers received in Uttar and Dakshin Dinajpur as a whole till 2001, as well as 69 percent of the intrastatemigrant workers and 54 percent of the internal economic migrants within the Uttar and Dakshin Dinajpurregions. Dakshin Dinajpur has absorbed nearly 60 percent of the international migrants, and around 46percent of the internal economic migrants, while receiving much lower amounts of interstate and intrastatemigration. Uttar Dinajpur has received higher proportions of interstate and intrastate male economic migrantscompared to its share of female migrants from each source. Therefore, single male migration has beenmore characteristic of Uttar Dinajpur while family migration flows have been more characteristic in DakshinDinajpur. Relative differences in work availability between Dakshin Dinajpur and Uttar Dinajpur havealso produced net migration from the former district to the latter. Some of these flows also represent thestep migration of poorer rural migrants who had entered Dakshin Dinajpur from across the internationalborder and have now chosen to relocate and resettle within Uttar Dinajpur as interdistrict migrants.
0
20
40
60
80
100
120
140
TOTAL MIGRANTS
Elsewhere in U Dinajpur
Other WB Districts
Other States/UTs
Other Countries RURAL MIGRANTS
Elsewhere in U Dinajpur
Other WB Districts
Other States/UTs
Other Countries URBAN MIGRANTS
Elsewhere in U Dinajpur
Other WB Districts
Other States/UTs
Other Countries
Thousand persons
0-4 years 5-9 years 10-14 years 15-24 years 25-34 years 35-59 years 60+ years
UTTAR DINAJPUR 2001Age Distribution of Migrants to Uttar Dinajpur by Place of Birth
0
5
10
15
20
25
30
35
MALE MIGRANTS
Elsewhere in U Dinajpur
Other WB Districts
Other States/UTs
Other Countries RURAL MIGRANTS
Elsewhere in U Dinajpur
Other WB Districts
Other States/UTs
Other Countries URBAN MIGRANTS
Elsewhere in U Dinajpur
Other WB Districts
Other States/UTs
Other Countries
Thousand persons
0-4 years 5-9 years 10-14 years 15-24 years 25-34 years 35-59 years 60+ years
UTTAR DINAJPUR2001Age Distribution of Male Migrants to Uttar Dinajpur by Place of Birth
0
20
40
60
80
100
120
FEMALE MIGRANTS
Elsewhere in U Dinajpur
Other WB Districts
Other States/UTs
Other Countries RURAL MIGRANTS
Elsewhere in U Dinajpur
Other WB Districts
Other States/UTs
Other Countries URBAN MIGRANTS
Elsewhere in U Dinajpur
Other WB Districts
Other States/UTs
Other Countries
Thousand persons
0-4 years 5-9 years 10-14 years 15-24 years 25-34 years 35-59 years 60+ years
UTTAR DINAJPUR2001Age Distribution of Female Migrants to Uttar Dinajpur by Place of Birth
Thou
sand
Per
sons
Thou
sand
Per
sons
Thou
sand
Per
sons
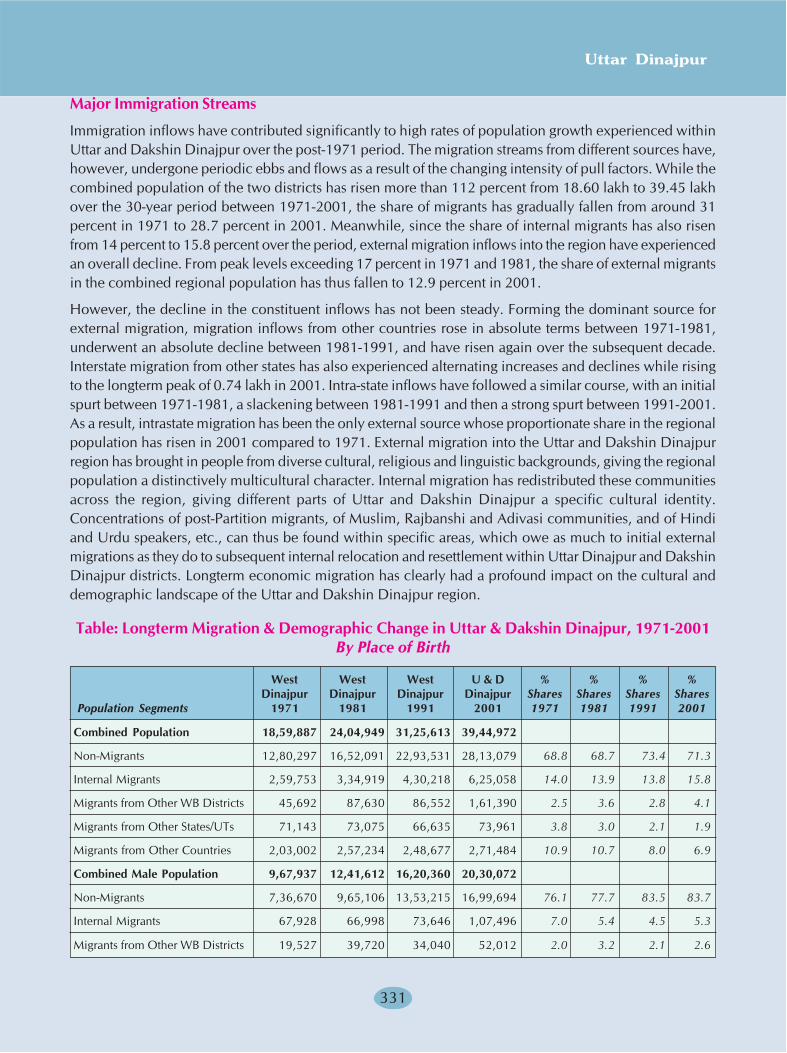
Uttar Dinajpur
331
Major Immigration Streams
Immigration inflows have contributed significantly to high rates of population growth experienced withinUttar and Dakshin Dinajpur over the post-1971 period. The migration streams from different sources have,however, undergone periodic ebbs and flows as a result of the changing intensity of pull factors. While thecombined population of the two districts has risen more than 112 percent from 18.60 lakh to 39.45 lakhover the 30-year period between 1971-2001, the share of migrants has gradually fallen from around 31percent in 1971 to 28.7 percent in 2001. Meanwhile, since the share of internal migrants has also risenfrom 14 percent to 15.8 percent over the period, external migration inflows into the region have experiencedan overall decline. From peak levels exceeding 17 percent in 1971 and 1981, the share of external migrantsin the combined regional population has thus fallen to 12.9 percent in 2001.
However, the decline in the constituent inflows has not been steady. Forming the dominant source forexternal migration, migration inflows from other countries rose in absolute terms between 1971-1981,underwent an absolute decline between 1981-1991, and have risen again over the subsequent decade.Interstate migration from other states has also experienced alternating increases and declines while risingto the longterm peak of 0.74 lakh in 2001. Intra-state inflows have followed a similar course, with an initialspurt between 1971-1981, a slackening between 1981-1991 and then a strong spurt between 1991-2001.As a result, intrastate migration has been the only external source whose proportionate share in the regionalpopulation has risen in 2001 compared to 1971. External migration into the Uttar and Dakshin Dinajpurregion has brought in people from diverse cultural, religious and linguistic backgrounds, giving the regionalpopulation a distinctively multicultural character. Internal migration has redistributed these communitiesacross the region, giving different parts of Uttar and Dakshin Dinajpur a specific cultural identity.Concentrations of post-Partition migrants, of Muslim, Rajbanshi and Adivasi communities, and of Hindiand Urdu speakers, etc., can thus be found within specific areas, which owe as much to initial externalmigrations as they do to subsequent internal relocation and resettlement within Uttar Dinajpur and DakshinDinajpur districts. Longterm economic migration has clearly had a profound impact on the cultural anddemographic landscape of the Uttar and Dakshin Dinajpur region.
Table: Longterm Migration & Demographic Change in Uttar & Dakshin Dinajpur, 1971-2001By Place of Birth
West West West U & D % % % %Dinajpur Dinajpur Dinajpur Dinajpur Shares Shares Shares Shares
Population Segments 1971 1981 1991 2001 1971 1981 1991 2001
Combined Population 18,59,887 24,04,949 31,25,613 39,44,972
Non-Migrants 12,80,297 16,52,091 22,93,531 28,13,079 68.8 68.7 73.4 71.3
Internal Migrants 2,59,753 3,34,919 4,30,218 6,25,058 14.0 13.9 13.8 15.8
Migrants from Other WB Districts 45,692 87,630 86,552 1,61,390 2.5 3.6 2.8 4.1
Migrants from Other States/UTs 71,143 73,075 66,635 73,961 3.8 3.0 2.1 1.9
Migrants from Other Countries 2,03,002 2,57,234 2,48,677 2,71,484 10.9 10.7 8.0 6.9
Combined Male Population 9,67,937 12,41,612 16,20,360 20,30,072
Non-Migrants 7,36,670 9,65,106 13,53,215 16,99,694 76.1 77.7 83.5 83.7
Internal Migrants 67,928 66,998 73,646 1,07,496 7.0 5.4 4.5 5.3
Migrants from Other WB Districts 19,527 39,720 34,040 52,012 2.0 3.2 2.1 2.6
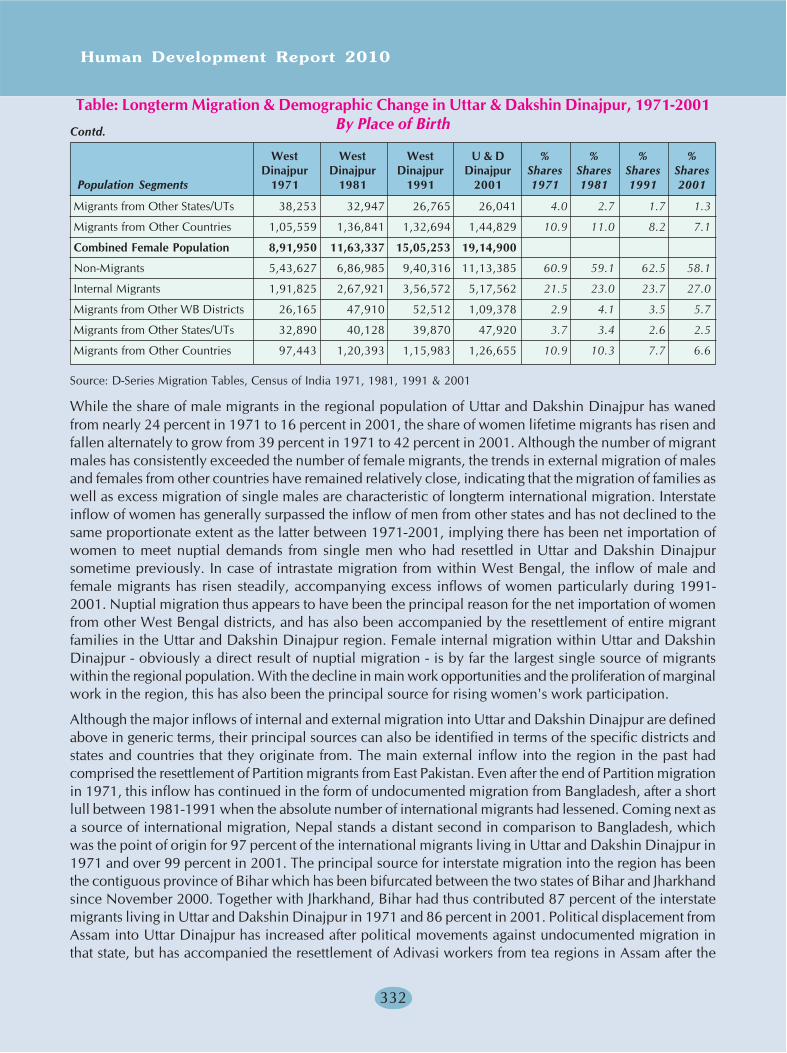
Human Development Report 2010
332
Migrants from Other States/UTs 38,253 32,947 26,765 26,041 4.0 2.7 1.7 1.3
Migrants from Other Countries 1,05,559 1,36,841 1,32,694 1,44,829 10.9 11.0 8.2 7.1
Combined Female Population 8,91,950 11,63,337 15,05,253 19,14,900
Non-Migrants 5,43,627 6,86,985 9,40,316 11,13,385 60.9 59.1 62.5 58.1
Internal Migrants 1,91,825 2,67,921 3,56,572 5,17,562 21.5 23.0 23.7 27.0
Migrants from Other WB Districts 26,165 47,910 52,512 1,09,378 2.9 4.1 3.5 5.7
Migrants from Other States/UTs 32,890 40,128 39,870 47,920 3.7 3.4 2.6 2.5
Migrants from Other Countries 97,443 1,20,393 1,15,983 1,26,655 10.9 10.3 7.7 6.6
Source: D-Series Migration Tables, Census of India 1971, 1981, 1991 & 2001
While the share of male migrants in the regional population of Uttar and Dakshin Dinajpur has wanedfrom nearly 24 percent in 1971 to 16 percent in 2001, the share of women lifetime migrants has risen andfallen alternately to grow from 39 percent in 1971 to 42 percent in 2001. Although the number of migrantmales has consistently exceeded the number of female migrants, the trends in external migration of malesand females from other countries have remained relatively close, indicating that the migration of families aswell as excess migration of single males are characteristic of longterm international migration. Interstateinflow of women has generally surpassed the inflow of men from other states and has not declined to thesame proportionate extent as the latter between 1971-2001, implying there has been net importation ofwomen to meet nuptial demands from single men who had resettled in Uttar and Dakshin Dinajpursometime previously. In case of intrastate migration from within West Bengal, the inflow of male andfemale migrants has risen steadily, accompanying excess inflows of women particularly during 1991-2001. Nuptial migration thus appears to have been the principal reason for the net importation of womenfrom other West Bengal districts, and has also been accompanied by the resettlement of entire migrantfamilies in the Uttar and Dakshin Dinajpur region. Female internal migration within Uttar and DakshinDinajpur - obviously a direct result of nuptial migration - is by far the largest single source of migrantswithin the regional population. With the decline in main work opportunities and the proliferation of marginalwork in the region, this has also been the principal source for rising women's work participation.
Although the major inflows of internal and external migration into Uttar and Dakshin Dinajpur are definedabove in generic terms, their principal sources can also be identified in terms of the specific districts andstates and countries that they originate from. The main external inflow into the region in the past hadcomprised the resettlement of Partition migrants from East Pakistan. Even after the end of Partition migrationin 1971, this inflow has continued in the form of undocumented migration from Bangladesh, after a shortlull between 1981-1991 when the absolute number of international migrants had lessened. Coming next asa source of international migration, Nepal stands a distant second in comparison to Bangladesh, whichwas the point of origin for 97 percent of the international migrants living in Uttar and Dakshin Dinajpur in1971 and over 99 percent in 2001. The principal source for interstate migration into the region has beenthe contiguous province of Bihar which has been bifurcated between the two states of Bihar and Jharkhandsince November 2000. Together with Jharkhand, Bihar had thus contributed 87 percent of the interstatemigrants living in Uttar and Dakshin Dinajpur in 1971 and 86 percent in 2001. Political displacement fromAssam into Uttar Dinajpur has increased after political movements against undocumented migration inthat state, but has accompanied the resettlement of Adivasi workers from tea regions in Assam after the
Table: Longterm Migration & Demographic Change in Uttar & Dakshin Dinajpur, 1971-2001By Place of Birth
West West West U & D % % % %Dinajpur Dinajpur Dinajpur Dinajpur Shares Shares Shares Shares
Population Segments 1971 1981 1991 2001 1971 1981 1991 2001
Contd.
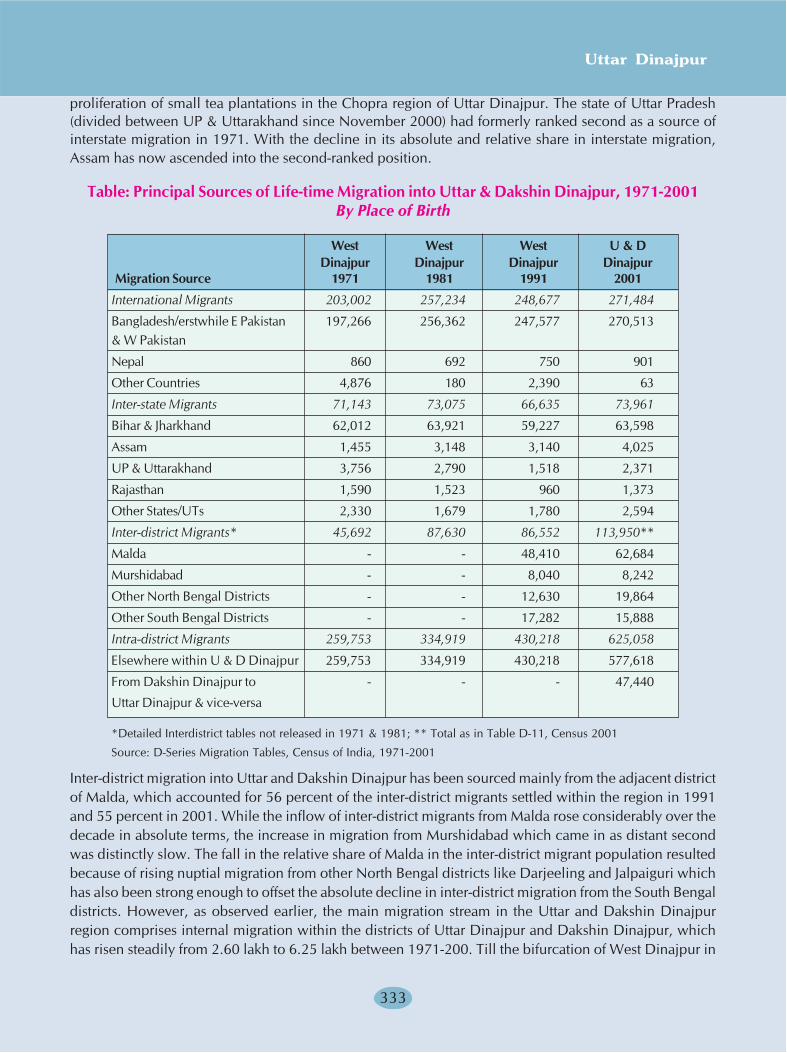
Uttar Dinajpur
333
proliferation of small tea plantations in the Chopra region of Uttar Dinajpur. The state of Uttar Pradesh(divided between UP & Uttarakhand since November 2000) had formerly ranked second as a source ofinterstate migration in 1971. With the decline in its absolute and relative share in interstate migration,Assam has now ascended into the second-ranked position.
Table: Principal Sources of Life-time Migration into Uttar & Dakshin Dinajpur, 1971-2001By Place of Birth
West West West U & DDinajpur Dinajpur Dinajpur Dinajpur
Migration Source 1971 1981 1991 2001
International Migrants 203,002 257,234 248,677 271,484
Bangladesh/erstwhile E Pakistan 197,266 256,362 247,577 270,513& W Pakistan
Nepal 860 692 750 901
Other Countries 4,876 180 2,390 63
Inter-state Migrants 71,143 73,075 66,635 73,961
Bihar & Jharkhand 62,012 63,921 59,227 63,598
Assam 1,455 3,148 3,140 4,025
UP & Uttarakhand 3,756 2,790 1,518 2,371
Rajasthan 1,590 1,523 960 1,373
Other States/UTs 2,330 1,679 1,780 2,594
Inter-district Migrants* 45,692 87,630 86,552 113,950**
Malda - - 48,410 62,684
Murshidabad - - 8,040 8,242
Other North Bengal Districts - - 12,630 19,864
Other South Bengal Districts - - 17,282 15,888
Intra-district Migrants 259,753 334,919 430,218 625,058
Elsewhere within U & D Dinajpur 259,753 334,919 430,218 577,618
From Dakshin Dinajpur to - - - 47,440
Uttar Dinajpur & vice-versa
*Detailed Interdistrict tables not released in 1971 & 1981; ** Total as in Table D-11, Census 2001
Source: D-Series Migration Tables, Census of India, 1971-2001
Inter-district migration into Uttar and Dakshin Dinajpur has been sourced mainly from the adjacent districtof Malda, which accounted for 56 percent of the inter-district migrants settled within the region in 1991and 55 percent in 2001. While the inflow of inter-district migrants from Malda rose considerably over thedecade in absolute terms, the increase in migration from Murshidabad which came in as distant secondwas distinctly slow. The fall in the relative share of Malda in the inter-district migrant population resultedbecause of rising nuptial migration from other North Bengal districts like Darjeeling and Jalpaiguri whichhas also been strong enough to offset the absolute decline in inter-district migration from the South Bengaldistricts. However, as observed earlier, the main migration stream in the Uttar and Dakshin Dinajpurregion comprises internal migration within the districts of Uttar Dinajpur and Dakshin Dinajpur, whichhas risen steadily from 2.60 lakh to 6.25 lakh between 1971-200. Till the bifurcation of West Dinajpur in
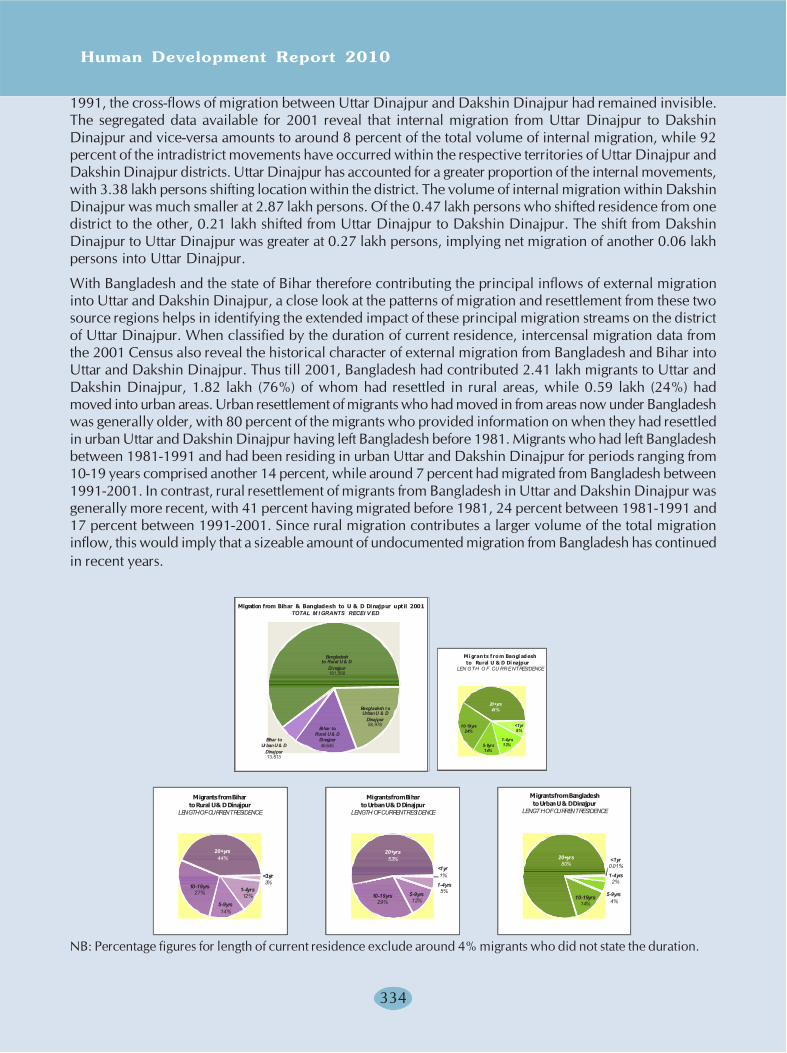
Human Development Report 2010
334
1991, the cross-flows of migration between Uttar Dinajpur and Dakshin Dinajpur had remained invisible.
The segregated data available for 2001 reveal that internal migration from Uttar Dinajpur to Dakshin
Dinajpur and vice-versa amounts to around 8 percent of the total volume of internal migration, while 92
percent of the intradistrict movements have occurred within the respective territories of Uttar Dinajpur and
Dakshin Dinajpur districts. Uttar Dinajpur has accounted for a greater proportion of the internal movements,
with 3.38 lakh persons shifting location within the district. The volume of internal migration within Dakshin
Dinajpur was much smaller at 2.87 lakh persons. Of the 0.47 lakh persons who shifted residence from one
district to the other, 0.21 lakh shifted from Uttar Dinajpur to Dakshin Dinajpur. The shift from Dakshin
Dinajpur to Uttar Dinajpur was greater at 0.27 lakh persons, implying net migration of another 0.06 lakh
persons into Uttar Dinajpur.
With Bangladesh and the state of Bihar therefore contributing the principal inflows of external migration
into Uttar and Dakshin Dinajpur, a close look at the patterns of migration and resettlement from these two
source regions helps in identifying the extended impact of these principal migration streams on the district
of Uttar Dinajpur. When classified by the duration of current residence, intercensal migration data from
the 2001 Census also reveal the historical character of external migration from Bangladesh and Bihar into
Uttar and Dakshin Dinajpur. Thus till 2001, Bangladesh had contributed 2.41 lakh migrants to Uttar and
Dakshin Dinajpur, 1.82 lakh (76%) of whom had resettled in rural areas, while 0.59 lakh (24%) had
moved into urban areas. Urban resettlement of migrants who had moved in from areas now under Bangladesh
was generally older, with 80 percent of the migrants who provided information on when they had resettled
in urban Uttar and Dakshin Dinajpur having left Bangladesh before 1981. Migrants who had left Bangladesh
between 1981-1991 and had been residing in urban Uttar and Dakshin Dinajpur for periods ranging from
10-19 years comprised another 14 percent, while around 7 percent had migrated from Bangladesh between
1991-2001. In contrast, rural resettlement of migrants from Bangladesh in Uttar and Dakshin Dinajpur was
generally more recent, with 41 percent having migrated before 1981, 24 percent between 1981-1991 and
17 percent between 1991-2001. Since rural migration contributes a larger volume of the total migration
inflow, this would imply that a sizeable amount of undocumented migration from Bangladesh has continued
in recent years.
NB: Percentage figures for length of current residence exclude around 4% migrants who did not state the duration.
��������
����� �� ���
�������� �
������
��������
����� �� ���
���������
������
�����������
������� �� ���
���������
�������
������������ �
����� �����
���������
����
������������ ���� � �������� ���� ����������� �� ����
������� ������ � � � �
����
��
����
����� ��
��
���� ��
��
�����
��
�������� �� ����� ����
�� ����� ����� ������
��� ���� �� �� ���������� ����
����
��
������
���
�����
���
������
���
�����
���
��������������������
������������������� ��
���������� ���� ��������
���
��
������
��
�����
���
������
��
�����
���
��������������������
�����!�������������� ��
���������� ���� ��������
���
���
������
��
�����
��
������
���
�����
��
�������������������"���
�����!�������������� ��
����������� ���� ��������
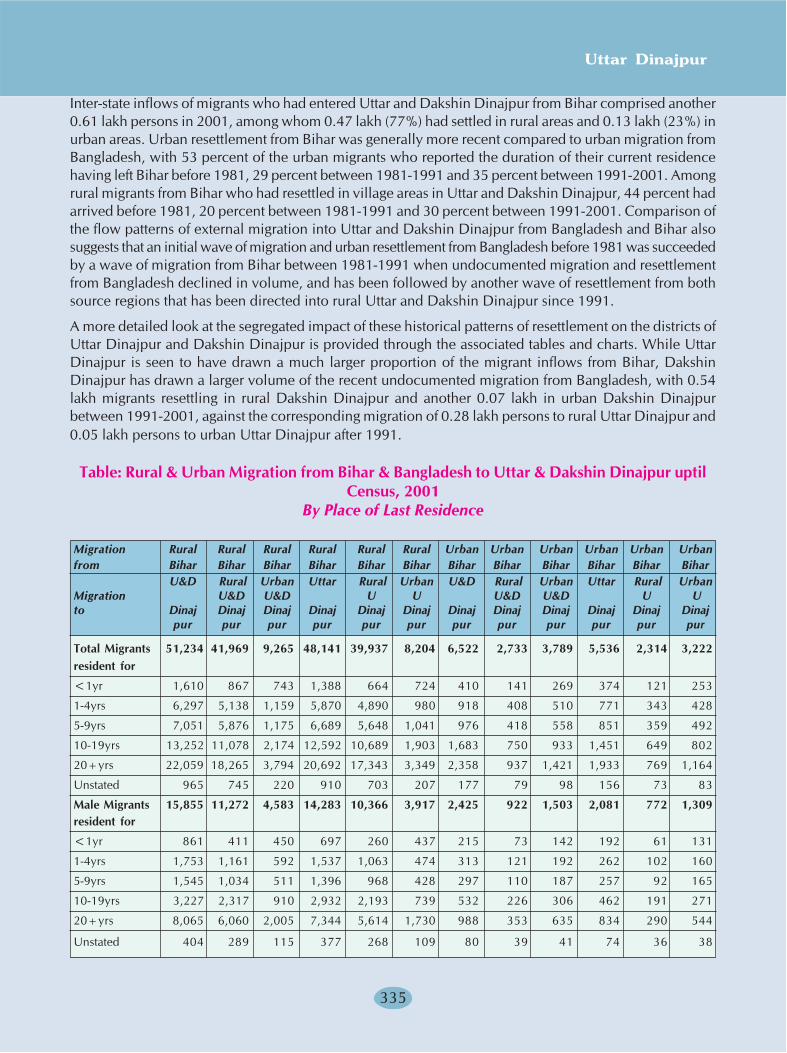
Uttar Dinajpur
335
Inter-state inflows of migrants who had entered Uttar and Dakshin Dinajpur from Bihar comprised another0.61 lakh persons in 2001, among whom 0.47 lakh (77%) had settled in rural areas and 0.13 lakh (23%) inurban areas. Urban resettlement from Bihar was generally more recent compared to urban migration fromBangladesh, with 53 percent of the urban migrants who reported the duration of their current residencehaving left Bihar before 1981, 29 percent between 1981-1991 and 35 percent between 1991-2001. Amongrural migrants from Bihar who had resettled in village areas in Uttar and Dakshin Dinajpur, 44 percent hadarrived before 1981, 20 percent between 1981-1991 and 30 percent between 1991-2001. Comparison ofthe flow patterns of external migration into Uttar and Dakshin Dinajpur from Bangladesh and Bihar alsosuggests that an initial wave of migration and urban resettlement from Bangladesh before 1981 was succeededby a wave of migration from Bihar between 1981-1991 when undocumented migration and resettlementfrom Bangladesh declined in volume, and has been followed by another wave of resettlement from bothsource regions that has been directed into rural Uttar and Dakshin Dinajpur since 1991.
A more detailed look at the segregated impact of these historical patterns of resettlement on the districts ofUttar Dinajpur and Dakshin Dinajpur is provided through the associated tables and charts. While UttarDinajpur is seen to have drawn a much larger proportion of the migrant inflows from Bihar, DakshinDinajpur has drawn a larger volume of the recent undocumented migration from Bangladesh, with 0.54lakh migrants resettling in rural Dakshin Dinajpur and another 0.07 lakh in urban Dakshin Dinajpurbetween 1991-2001, against the corresponding migration of 0.28 lakh persons to rural Uttar Dinajpur and0.05 lakh persons to urban Uttar Dinajpur after 1991.
Table: Rural & Urban Migration from Bihar & Bangladesh to Uttar & Dakshin Dinajpur uptilCensus, 2001
By Place of Last Residence
Migration Rural Rural Rural Rural Rural Rural Urban Urban Urban Urban Urban Urbanfrom Bihar Bihar Bihar Bihar Bihar Bihar Bihar Bihar Bihar Bihar Bihar Bihar
U&D Rural Urban Uttar Rural Urban U&D Rural Urban Uttar Rural UrbanMigration U&D U&D U U U&D U&D U Uto Dinaj Dinaj Dinaj Dinaj Dinaj Dinaj Dinaj Dinaj Dinaj Dinaj Dinaj Dinaj
pur pur pur pur pur pur pur pur pur pur pur pur
Total Migrants 51,234 41,969 9,265 48,141 39,937 8,204 6,522 2,733 3,789 5,536 2,314 3,222resident for
<1yr 1,610 867 743 1,388 664 724 410 141 269 374 121 253
1-4yrs 6,297 5,138 1,159 5,870 4,890 980 918 408 510 771 343 428
5-9yrs 7,051 5,876 1,175 6,689 5,648 1,041 976 418 558 851 359 492
10-19yrs 13,252 11,078 2,174 12,592 10,689 1,903 1,683 750 933 1,451 649 802
20+yrs 22,059 18,265 3,794 20,692 17,343 3,349 2,358 937 1,421 1,933 769 1,164
Unstated 965 745 220 910 703 207 177 79 98 156 73 83
Male Migrants 15,855 11,272 4,583 14,283 10,366 3,917 2,425 922 1,503 2,081 772 1,309resident for
<1yr 861 411 450 697 260 437 215 73 142 192 61 131
1-4yrs 1,753 1,161 592 1,537 1,063 474 313 121 192 262 102 160
5-9yrs 1,545 1,034 511 1,396 968 428 297 110 187 257 92 165
10-19yrs 3,227 2,317 910 2,932 2,193 739 532 226 306 462 191 271
20+yrs 8,065 6,060 2,005 7,344 5,614 1,730 988 353 635 834 290 544
Unstated 404 289 115 377 268 109 80 39 41 74 36 38
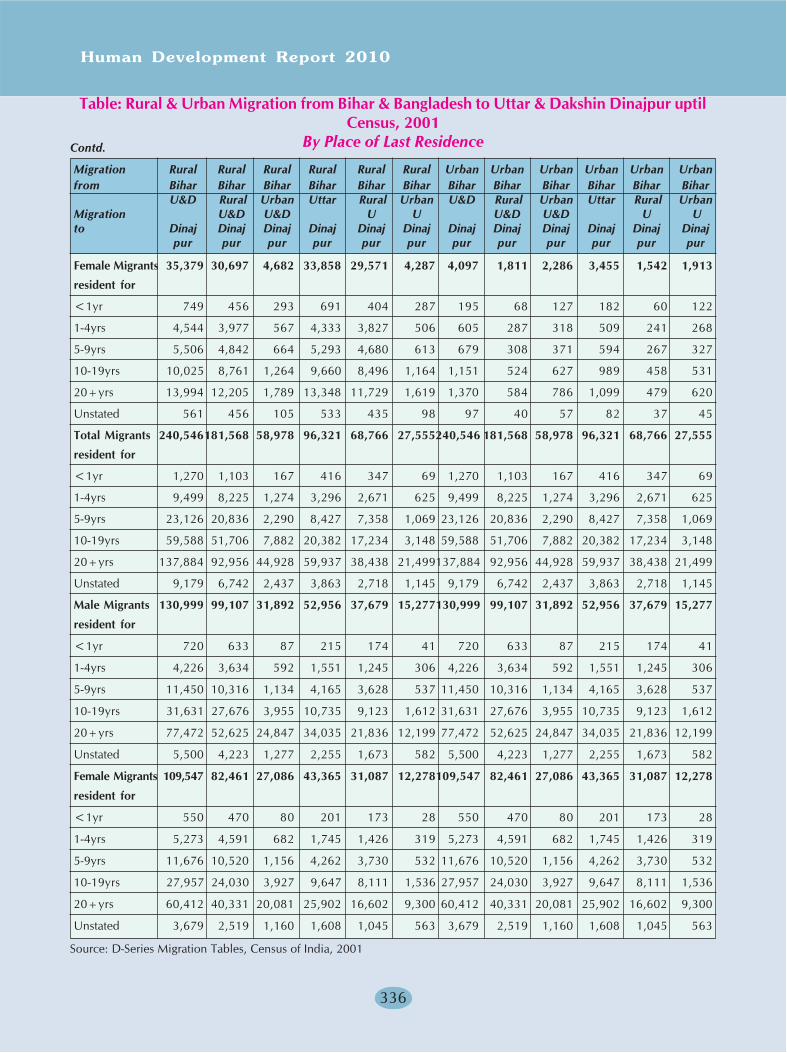
Human Development Report 2010
336
Female Migrants 35,379 30,697 4,682 33,858 29,571 4,287 4,097 1,811 2,286 3,455 1,542 1,913
resident for
<1yr 749 456 293 691 404 287 195 68 127 182 60 122
1-4yrs 4,544 3,977 567 4,333 3,827 506 605 287 318 509 241 268
5-9yrs 5,506 4,842 664 5,293 4,680 613 679 308 371 594 267 327
10-19yrs 10,025 8,761 1,264 9,660 8,496 1,164 1,151 524 627 989 458 531
20+yrs 13,994 12,205 1,789 13,348 11,729 1,619 1,370 584 786 1,099 479 620
Unstated 561 456 105 533 435 98 97 40 57 82 37 45
Total Migrants 240,546181,568 58,978 96,321 68,766 27,555240,546 181,568 58,978 96,321 68,766 27,555
resident for
<1yr 1,270 1,103 167 416 347 69 1,270 1,103 167 416 347 69
1-4yrs 9,499 8,225 1,274 3,296 2,671 625 9,499 8,225 1,274 3,296 2,671 625
5-9yrs 23,126 20,836 2,290 8,427 7,358 1,069 23,126 20,836 2,290 8,427 7,358 1,069
10-19yrs 59,588 51,706 7,882 20,382 17,234 3,148 59,588 51,706 7,882 20,382 17,234 3,148
20+yrs 137,884 92,956 44,928 59,937 38,438 21,499137,884 92,956 44,928 59,937 38,438 21,499
Unstated 9,179 6,742 2,437 3,863 2,718 1,145 9,179 6,742 2,437 3,863 2,718 1,145
Male Migrants 130,999 99,107 31,892 52,956 37,679 15,277130,999 99,107 31,892 52,956 37,679 15,277
resident for
<1yr 720 633 87 215 174 41 720 633 87 215 174 41
1-4yrs 4,226 3,634 592 1,551 1,245 306 4,226 3,634 592 1,551 1,245 306
5-9yrs 11,450 10,316 1,134 4,165 3,628 537 11,450 10,316 1,134 4,165 3,628 537
10-19yrs 31,631 27,676 3,955 10,735 9,123 1,612 31,631 27,676 3,955 10,735 9,123 1,612
20+yrs 77,472 52,625 24,847 34,035 21,836 12,199 77,472 52,625 24,847 34,035 21,836 12,199
Unstated 5,500 4,223 1,277 2,255 1,673 582 5,500 4,223 1,277 2,255 1,673 582
Female Migrants 109,547 82,461 27,086 43,365 31,087 12,278109,547 82,461 27,086 43,365 31,087 12,278
resident for
<1yr 550 470 80 201 173 28 550 470 80 201 173 28
1-4yrs 5,273 4,591 682 1,745 1,426 319 5,273 4,591 682 1,745 1,426 319
5-9yrs 11,676 10,520 1,156 4,262 3,730 532 11,676 10,520 1,156 4,262 3,730 532
10-19yrs 27,957 24,030 3,927 9,647 8,111 1,536 27,957 24,030 3,927 9,647 8,111 1,536
20+yrs 60,412 40,331 20,081 25,902 16,602 9,300 60,412 40,331 20,081 25,902 16,602 9,300
Unstated 3,679 2,519 1,160 1,608 1,045 563 3,679 2,519 1,160 1,608 1,045 563
Source: D-Series Migration Tables, Census of India, 2001
Table: Rural & Urban Migration from Bihar & Bangladesh to Uttar & Dakshin Dinajpur uptilCensus, 2001
By Place of Last Residence
Migration Rural Rural Rural Rural Rural Rural Urban Urban Urban Urban Urban Urbanfrom Bihar Bihar Bihar Bihar Bihar Bihar Bihar Bihar Bihar Bihar Bihar Bihar
U&D Rural Urban Uttar Rural Urban U&D Rural Urban Uttar Rural UrbanMigration U&D U&D U U U&D U&D U Uto Dinaj Dinaj Dinaj Dinaj Dinaj Dinaj Dinaj Dinaj Dinaj Dinaj Dinaj Dinaj
pur pur pur pur pur pur pur pur pur pur pur pur
Contd.
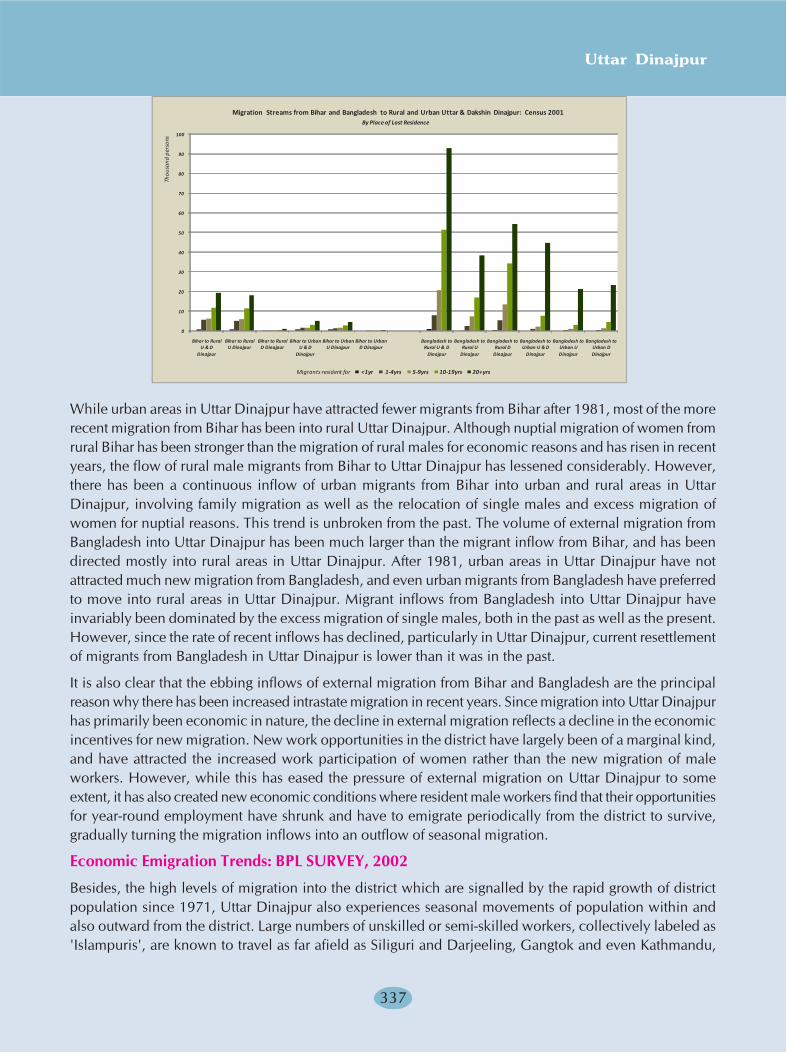
Uttar Dinajpur
337
While urban areas in Uttar Dinajpur have attracted fewer migrants from Bihar after 1981, most of the morerecent migration from Bihar has been into rural Uttar Dinajpur. Although nuptial migration of women fromrural Bihar has been stronger than the migration of rural males for economic reasons and has risen in recentyears, the flow of rural male migrants from Bihar to Uttar Dinajpur has lessened considerably. However,there has been a continuous inflow of urban migrants from Bihar into urban and rural areas in UttarDinajpur, involving family migration as well as the relocation of single males and excess migration ofwomen for nuptial reasons. This trend is unbroken from the past. The volume of external migration fromBangladesh into Uttar Dinajpur has been much larger than the migrant inflow from Bihar, and has beendirected mostly into rural areas in Uttar Dinajpur. After 1981, urban areas in Uttar Dinajpur have notattracted much new migration from Bangladesh, and even urban migrants from Bangladesh have preferredto move into rural areas in Uttar Dinajpur. Migrant inflows from Bangladesh into Uttar Dinajpur haveinvariably been dominated by the excess migration of single males, both in the past as well as the present.However, since the rate of recent inflows has declined, particularly in Uttar Dinajpur, current resettlementof migrants from Bangladesh in Uttar Dinajpur is lower than it was in the past.
It is also clear that the ebbing inflows of external migration from Bihar and Bangladesh are the principalreason why there has been increased intrastate migration in recent years. Since migration into Uttar Dinajpurhas primarily been economic in nature, the decline in external migration reflects a decline in the economicincentives for new migration. New work opportunities in the district have largely been of a marginal kind,and have attracted the increased work participation of women rather than the new migration of maleworkers. However, while this has eased the pressure of external migration on Uttar Dinajpur to someextent, it has also created new economic conditions where resident male workers find that their opportunitiesfor year-round employment have shrunk and have to emigrate periodically from the district to survive,gradually turning the migration inflows into an outflow of seasonal migration.
Economic Emigration Trends: BPL SURVEY, 2002
Besides, the high levels of migration into the district which are signalled by the rapid growth of districtpopulation since 1971, Uttar Dinajpur also experiences seasonal movements of population within andalso outward from the district. Large numbers of unskilled or semi-skilled workers, collectively labeled as'Islampuris', are known to travel as far afield as Siliguri and Darjeeling, Gangtok and even Kathmandu,
0
10
20
30
40
50
60
70
80
90
100
Bihar to Rural U & D
Dinajpur
Bihar to Rural U Dinajpur
Bihar to Rural D Dinajpur
Bihar to Urban U & D
Dinajpur
Bihar to Urban U Dinajpur
Bihar to Urban D Dinajpur
Bangladesh to Rural U & D
Dinajpur
Bangladesh to Rural U
Dinajpur
Bangladesh to Rural D
Dinajpur
Bangladesh to Urban U & D
Dinajpur
Bangladesh to Urban U Dinajpur
Bangladesh to Urban D Dinajpur
Thou
sand
per
sons
Migrants resident for <1yr 1-4yrs 5-9yrs 10-19yrs 20+yrs
Migration Streams from Bihar and Bangladesh to Rural and Urban Uttar & Dakshin Dinajpur: Census 2001By Place of Last Residence
Human Development Report 2010
338
where they perform a variety of wage-rated activities ranging from rickshaw and van pulling, menial andconstruction labour, road construction and excavation, to domestic service, small trade and other pettyenterprise. Workers from what employers label as 'Islampur' actually include rural labour from all overUttar Dinajpur as well as from the adjoining Kishanganj region which lies contiguous to Islampur SD. Thegrowth of this migrant workforce has now come to notice because of the sheer number of migrant workers- usually juveniles and young males - that are involved.
Several parts of Islampur and adjoining blocks from where significant numbers of workers migrate eitherseasonally or for longer durations of 1-2 years now show characteristics of the remittance economy whichare also characteristic of northern Bihar. Inflows of small but regular amounts of cash into the villagespermit several families to improve and modify dwelling structures from purely kuchcha to semi-puccaconstruction, as can be widely noticed during village visits through this region. However, a less-desiredconsequence is the large scale dropout of boys from rural schools once they cross the threshold age of 13-14 years and aspire to earn a living for themselves as well as for dependent families.
Livelihood processes of this kind which result ultimately in outward migration from rural areas, are oftendifficult to comprehend or document because of the difficulty in meeting or interviewing migrant workerswho rapidly scatter into a very large receiving region. However, while the migrant workers themselvessoon become almost untraceable, the local families that they leave behind temporarily become a goodsource of information. From interviews of this kind, conducted at several GPs in Chopra, Islampur,Goalpokhar-1 and Goalpokhar-2 blocks during the evaluation of the Post-Literacy Campaign (PLC) by aNorth Bengal University team in 2007, it became apparent that rural migration was often a livelihoodresponse during the agricultural slack season, when many landless rural labourers found insufficient work.Migration of this kind was strong enough to affect the gender ratios of learners who had participated in therural literacy campaign.
A further set of interviews at Bindol GP located along the international border of Raiganj block, conductedduring the regional study of trafficking of women and children by the Centre for Women's Studies, NorthBengal University, identified several regional features that contribute to such undocumented labourmovement. For instance, the initial outward movement by a small number of local workers takes placewith the encouragement and assistance of smalltime middle-level procurers and labour contractors. Manyof the former were themselves migrants from adjoining villages, who were thus well-known to the newaspirants. Among the features which made such migration attractive are the ready access to cash and otherforms of small luxury and entertainment that these contact persons always seem to have. Would-be migrantsare also reassured of network support from other residents of the district who had migrated earlier and arenow residing in the places where the new workers will be destined. Migration also occurred normally ingroups in which one or two members took the first initiative and then assembled a small group of theirfriends. This purely personal mode of contact and organisation made the process of migration virtuallyundetectable. Subsequently, many returning migrant workers in turn became the agency for more outwardmigration, until what had begun as a trickle gradually grew into a regularly flowing stream.
Among the characteristics which make 'Islampuri' workers highly employable in the adjoining hinterlandsto which they go, is there capacity for hard work accompanied by low material and wage demands. This infact reflects high levels of work competition and consequently low wage rates in many rural regions throughUttar Dinajpur. Daily-wage differentials between Islampur SD and contiguous areas in Siliguri are as muchas Rs. 20/- and increase even further in the Darjeeling and Sikkim hills, where children from impoverishedareas in the Islampur SD have become the first choice for employment in road construction groups, smalleateries and establishments and also many urban homes. Being undocumented, migration of this kind isalso unregulated, imposes a potential threat to the well-being and personal security of the workers involved,
Uttar Dinajpur
339
many of whom are underaged. The proneness of certain rural areas in Uttar Dinajpur to yield this constantstream of rural outmigration was tied up intimately with high population and the state of landlessness andpoverty, the overall rural employment situation, and the state of human development within the district.Despite the relatively strong agricultural base of the district - particularly in rice production, the roots ofoutward rural migration lay most decisively in the inability of regional agricultural systems in the district toprovide rural workers with year-round opportunities for work.
An opportunity to investigate the prevalence and extent of such internal migration pressures across thedifferent blocks of Uttar Dinajpur is provided by data from the 2002 BPL Survey, which in West Bengal isalso known as the Rural Household Survey [RHS 2002]. Uttar Dinajpur reveals highly paradoxicalcharacteristics in this respect. The spread of organised agriculture and the high returns obtainable from ricecultivation, to which Uttar Dinajpur is naturally suited, have been sufficient in the long term to draw in avast number of political and economic migrants from adjoining states and countries, where similar scopedid not exist. Despite the large number of migrants that the district has absorbed, Uttar Dinajpur has beenable to afford them with means for livelihood support mainly through its continuous progress in agriculture.However, although plenty of work can be found by agricultural labourers during the principal agriculturalseasons, such work is not necessarily continuous and does not extend through the rest of the year.Consequently, a class of rural labour has evolved in the district, which often has to expand its livelihoodchoices by migrating when necessary for seasonal or casual work.
Rural settlement patterns in the district are well reflected in the distribution of rural households across theblocks. The continuous region from Karandighi to Itahar is thus the most densely settled region of UttarDinajpur with each block accounting for a minimum of well over 65 thousand rural households. HoweverHemtabad and Kaliaganj, both also located in Raiganj SD, are more sparsely settled with under 40 thousandhouseholds each. Rural settlement through Islampur SD is less dense but also more even. Each block there,with the exception of Karandighi, has just over 50 thousand households on the average. These overallpatterns of rural settlement closely reflect the physiographic conditions and agricultural potentials of thedistrict. Settlement is thus most intense where agriculture is most developed and cropping intensity is thehighest.
Although agricultural progress has created immense opportunities for labour absorption in the district, theseasonality of agricultural activities also imparts a seasonality to the resulting rural livelihood patterns. Thisis also reflected in Census data, for example, in the figures for marginal workers which is high in UttarDinajpur both for males and females. Under the circumstances, it often becomes necessary during theagricultural slack season for these workers to seek out work wherever it is available when it is not availablein the vicinity of where they live. Detailed data from the BPL survey thus demarcate four sources of internalmigration in Uttar Dinajpur, three of which are work-related and one of which is not. Non-work relatedmigration is reported across all blocks in Raiganj SD, and also through most of Islampur SD with theexception of Goalpokhar-1 and Goalpokhar-2, indicating the complexity of migration into and from UttarDinajpur. However, all blocks without exception also report the significant presence of rural migration forwork-related causes. Thus on a household-scale, more than 9 out of every 10 rural households in UttarDinajpur report instances of migration by at least one household member, either for work or other causes.The incidence is even higher in Islampur, Karandighi and the Hemtabad-Kaliaganj belt. Raiganj block onthe other hand is something of an exception since, as the headquarters block, it also receives a largenumber of rural migrants. While fewer households here report outward migration, in those that do non-work related migration is listed as the principal cause. This would indicate on the whole that Raiganj blockis able to provide stabler livelihood opportunities to its rural residents, resulting in less outward migrationpressure.
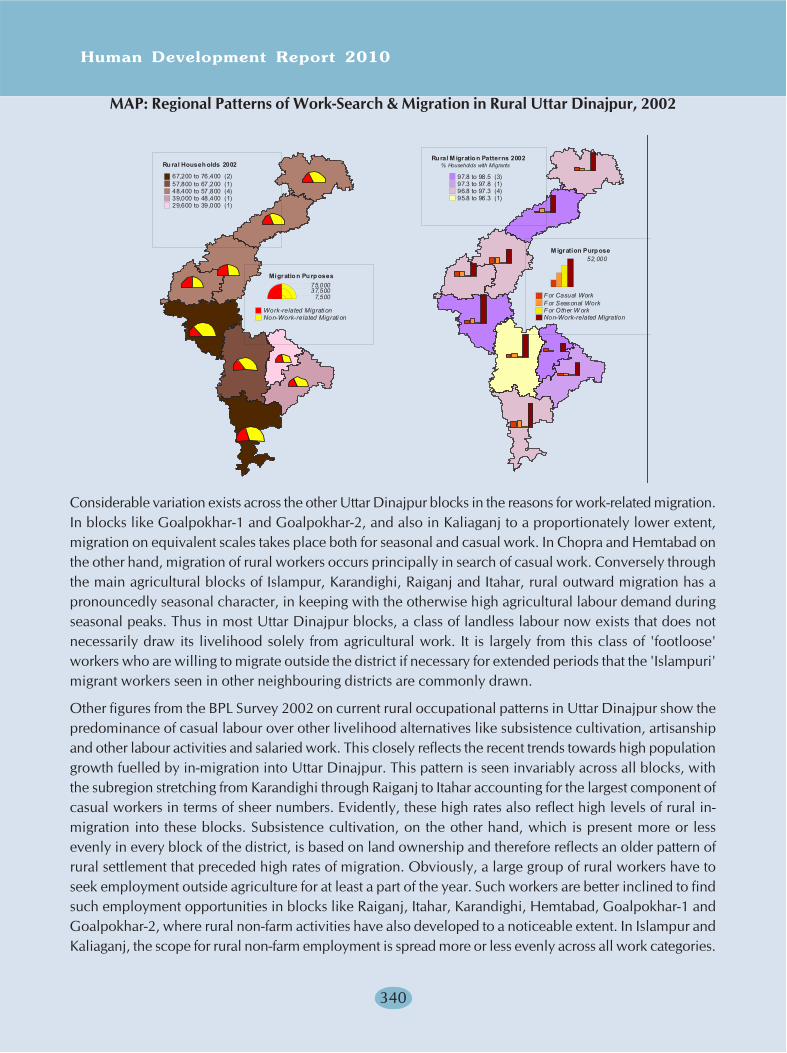
Human Development Report 2010
340
MAP: Regional Patterns of Work-Search & Migration in Rural Uttar Dinajpur, 2002
Considerable variation exists across the other Uttar Dinajpur blocks in the reasons for work-related migration.In blocks like Goalpokhar-1 and Goalpokhar-2, and also in Kaliaganj to a proportionately lower extent,migration on equivalent scales takes place both for seasonal and casual work. In Chopra and Hemtabad onthe other hand, migration of rural workers occurs principally in search of casual work. Conversely throughthe main agricultural blocks of Islampur, Karandighi, Raiganj and Itahar, rural outward migration has apronouncedly seasonal character, in keeping with the otherwise high agricultural labour demand duringseasonal peaks. Thus in most Uttar Dinajpur blocks, a class of landless labour now exists that does notnecessarily draw its livelihood solely from agricultural work. It is largely from this class of 'footloose'workers who are willing to migrate outside the district if necessary for extended periods that the 'Islampuri'migrant workers seen in other neighbouring districts are commonly drawn.
Other figures from the BPL Survey 2002 on current rural occupational patterns in Uttar Dinajpur show thepredominance of casual labour over other livelihood alternatives like subsistence cultivation, artisanshipand other labour activities and salaried work. This closely reflects the recent trends towards high populationgrowth fuelled by in-migration into Uttar Dinajpur. This pattern is seen invariably across all blocks, withthe subregion stretching from Karandighi through Raiganj to Itahar accounting for the largest component ofcasual workers in terms of sheer numbers. Evidently, these high rates also reflect high levels of rural in-migration into these blocks. Subsistence cultivation, on the other hand, which is present more or lessevenly in every block of the district, is based on land ownership and therefore reflects an older pattern ofrural settlement that preceded high rates of migration. Obviously, a large group of rural workers have toseek employment outside agriculture for at least a part of the year. Such workers are better inclined to findsuch employment opportunities in blocks like Raiganj, Itahar, Karandighi, Hemtabad, Goalpokhar-1 andGoalpokhar-2, where rural non-farm activities have also developed to a noticeable extent. In Islampur andKaliaganj, the scope for rural non-farm employment is spread more or less evenly across all work categories.
Rural M igration Patterns 2002% Households with Migrants
97.8 to 98.5 (3)97.3 to 97.8 (1)96.8 to 97.3 (4)95.8 to 96.3 (1)
M igration Purpose52,000
For Casual WorkFor Seasonal WorkFor Other W orkNon-Work-related Migration
Migratio n Pu rp oses75,00037,500
7,500
Work -related Migrati onNon-Work-related Migrati on
Ru ral Househ olds 2002
67,200 to 76,400 (2)57,800 to 67,200 (1)48,400 to 57,800 (4)39,000 to 48,400 (1)29,600 to 39,000 (1)
Uttar Dinajpur
341
Chopra is a noticeable exception, with non-farm occupations such as tea plantation work assuming aconsiderable role in the overall occupational distribution.
In a district with a large population and relatively low levels of economic development, not everyoneseeking rural work is likely to secure employment at the point or place of search. A large group of currentlyunemployed rural workers in Uttar Dinajpur consequently reported that they were in the midst of a jobsearch. The categories of work sought by these rural workers were very informative as to the potential forinternal work-related migration. Except for Chopra and Hemtabad blocks, where a larger proportion ofcurrently unemployed rural workers were seeking out casual employment, the dominant category in thedistrict comprised rural workers who were seasonally out of work and were thus seeking alternativelivelihoods for the duration of a season. Seasonal shortages and excesses of labour supply are thusoverwhelmingly present through most of Uttar Dinajpur, driving down rural wage rates considerably. Thepromise of sustained work at higher wage rates at locations in other states or districts is thus a pronouncedreason for internal migration of casual workers from Uttar Dinajpur to other states and districts. Evenamong seasonal agricultural workers, periods of seasonal agricultural slack create persisting livelihoodpressures. Except for agricultural labour families that possess small parcels of land, such seasonal pressuresare also mitigated ultimately by internal migration to more distant districts.
BOX - TEXT
LABOUR MIGRATION IN THE GOALPOKHAR REGION
As a populous but economically backward district, with livelihood choices within it being scarce, UttarDinajpur seasonally or temporarily exports a part of its labour force to relatively advanced states inIndia, like Maharashtra, Delhi, Karnataka, and Punjab. Thus in every village within the district, one cancome upon a section of village youths - mostly male - who at some point migrate out of the village. Theirmigration, in most cases, is temporary in nature. The migrant youth work in construction or smallmanufacturing and service units for a few years, earn some money, and then come back. Some of them,however, ultimately take their families with them to the place of their migration. This migration is povertyinduced, and the rural youths view it as a means of fighting their way out of poverty.
During survey work for the Uttar Dinajpur DHDR, a case study was done on the village of Dumuria,under Surjapur-1 Gram Panchayat in Goalpokhar-2 block, which is one of the most backward blocks inthe district. The village has 150 households and a brief survey was conducted on 100 of these. Dumuriais a village almost totally inhabited by Hindu refugees and a few Santhal families, who had migratedfrom Bangladesh, some before 1971 and most after 1971. Most Hindu migrant families belonged tovarious Scheduled Caste groups.
The village was educationally backward, as 30 of the 100 household heads interviewed were illiterate,while another 26 were only functionally literate. Among those who had some level of education, 14 hadstudied upto the primary level, 19 upto the upper primary level and only one had studied upto highschool. No resident had studied beyond this level.
Landlessness or marginal holdings characterised the village. Only five households, with 1-2ha of landeach, would qualify as small farmers. The household incomes were also indicative of the impoverishednature of the village. There was one family with a monthly income less than Rs. 1000, while about 20others had a monthly income between Rs.1000 and Rs.2000. Another 32 families had an income in therange Rs.2000 to Rs.3000 while 28 others had monthly incomes in the range Rs.3000 to Rs.4000. Thusonly 18 families in Dumuria had earnings exceeding Rs. 4000 a month.

Human Development Report 2010
342
As far as out-migration from the village was concerned, 59 migrant workers were identified, mostly malebelonging to the age group 20-35 years. Among them, two had migrated outside the village to places ofwork within Uttar Dinajpur, five to places outside the district, and 51 cases to places outside WestBengal. Of the latter, seven have migrated to work as domestic servants or as labour at constructionsites, three to work as skilled masons in the construction sector, four to work in tailoring units, four ascarpenters, one in other services, and a few as workers in small manufacturing units. A few of theoutmigrants were women, who had migrated after their marriage. Only eight of these migrants have leftthe village for good with all of their family. All the others have migrated less than two years ago and arecasual or temporary migrants.
The fact that Dumuria is a village largely composed of refugee families from Bangladesh seems to play aconsiderable role in the willingness of its residents to outmigrate further. Even after resettling in UttarDinajpur, many of these families have remained poor because of limited landholding and limitedopportunities for work. Earning differentials between the village and the places to which its workersseasonally migrate enables migrant workers who save a part of their increased earnings to make someoutlay towards a better future. Once the inertia towards outward migration is broken, a momentum isgenerated which leads to a stream of seasonal migration. New workers who choose to migrate learnabout other earning opportunities from returning migrants and can also count on support from the socialnetworks set up by other migrants who had left Dumuria previously.
Uttar Dinajpur
343
Chapter 7THE WAY AHEAD
DHDRs and Decentralised Planning
As one of the most backward districts in the state of West Bengal, Uttar Dinajpur undoubtedly experiencessevere impediments in the equalisation of the human capabilities represented by education, healthcare andlivelihood access. While the foregoing chapters of the Uttar Dinajpur DHDR have provided a detailedreport on these critical development constraints that exist today within the district, along with associatedchallenges in achieving gender equity and controlling high migration-induced rates of population growth,the logical purpose of preparing the DHDR can only be fully served if these prior findings are compressedsynoptically into a set of consistent human development rankings that can be used to measure the level ofcurrent attainments and deprivations within the district. Within the structure of human development reports,as popularised by the UNDP, this task is accomplished intuitively through the formulation of simple rankingindexes that can be easily analysed and interpreted by the ordinary people of the district, as well as by otherstakeholders who have a more direct role in deciding future planning priorities for the district. Thus,through human development indexing, the DHDRs can review the distribution of attainments and thefulfilment of people's entitlements across the district, while also identifying regions, population segmentsand livelihood sectors where these constraints are most severe.
By disaggregating the overall development attainments at district level and analysing these at subdistrictlevel for specific sectors and regions, the DHDRs essentially introduce a 'bottom up' approach towards themeasurement of human development and are thus able to draw focus to pockets of persisting backwardnessthat exist in the district. By shifting their attention from aggregate levels of achievement to the disaggregatedpatterns of regional attainment, the DHDRs also measure the extent of development inequality within thedistrict, and reveal directions for resource reallocation so that persisting human development gaps can befilled. Thus the DHDRs also assist in infusing a new sense of purposiveness into decentralised districtplanning by setting achievable timeframes, within which human development inequalities are to be removed.By offering a comprehensive report card to all stakeholders on the development processes and the overalldevelopment performance within the district, the DHDRs ultimately help in outlining a development visionfor the district, thus providing a springboard for the achievement of social justice and regional equity.
The way forward for the district of Uttar Dinajpur, as defined in this concluding chapter of the UttarDinajpur DHDR, commences with two essential steps. The first step involves the synoptic capture ofcurrent human development situations that exist within the district through the formulation and formalanalysis of human development indices for the different blocks that constitute the district. The second stepinvolves a review of the critical human development constraints and processes described in the precedingchapters in the light of these indices, and the envisioning of a basic human development strategy that canbe followed in future by the district planning authorities in Uttar Dinajpur. While these steps are merelythe beginning, they create a valuable opportunity to review and recast development priorities, ultimatelywith the purpose of liberating the human development process in Uttar Dinajpur from its present constraintsand opening the doorway for vibrant and inclusive growth that reaches out to all people residing in thedistrict.
Indexing Human Development in Uttar Dinajpur
The indexing of human development in Uttar Dinajpur at block and district levels at the conclusion of theDHDR exercise fulfils several useful purposes. Since baseline information on the relative development
Human Development Report 2010
344
achievements of the nine CD blocks is generally inadequate, block indexing helps to identify pockets ofpersisting backwardness in the district, and also draws immediate attention to the nature of humandevelopment deprivations within each block as well as to the nature of specific interventions that need tobe made, thus assisting the evolution of an overall development strategy for the District Plan. The indexingmethodologies also bring special focus to bear on underlying spatial and agroclimatic attributes thatcompound human development deprivations in certain subregions. By identifying the sources of persistinghuman poverty and vulnerability among certain social sections, the indexes help in the formulation ofappropriate poverty alleviation strategies designed to uplift vulnerable rural communities from the clutch ofhuman development deprivation and poverty.
Nevertheless, several conceptual and methodological issues have to be resolved before satisfactorycomputations of the indices can be made. Since the analysis in the DHDR has to be made at subdistrictlevel using block-level data, the database support for the indexing exercise is poor and entails modificationof the UNDP methodology for computing human development indices [HDIs]. Because the existing datasources are limited, insufficient information is available for the computation of human development dimensionindices for urban areas and for the district as a whole, through direct application of the UNDP method.Such difficulties appear most strongly in the computation of income-based indices since no official estimatesof per capita incomes are currently available at subdistrict level. Difficulties also arise during the computationof life expectancy based indices at subdistrict level, since estimates of infant mortality rates [IMRs] forsubdistrict units are not available from SRS and the IMRs available from the ICDS system are often incompleteand unreliable.
Thus the indexing of human development in the DHDR depends on adaptation of the original UNDPapproach to suit the databases currently available at block level. Such adaptations have also previouslybeen made during HDI computation in national and state HDRs, because of similar database constraints.The National HDR 2001 for India, thus, made significant departures from UNDP computation methodswhile calculating longevity indices based on weighted averages of life expectancy at age 1 year and IMR,instead of zero-age life expectancy as in the relevant UNDP index, and also while calculating indices foreducational attainment based on weighted averages of 7+ literacy rates and the intensity of school enrolmentsat different educational stages, instead of adult literacy rates and gross enrolment ratios [GERs] in theUNDP computation. Again, the indices for income attainment in NHDR 2001 departed significantly fromUNDP computations based on real per capita income, by weighting real per capita consumption expenditurewith adjustments for income inequality and inflation levels.
The HDI computations made in the West Bengal Human Development Report [WBHDR] 2004, again,made a methodological departure from the indexing methods used in NHDR 2001 by returning to zero-agelife expectancy to capture longevity and using a weighted average of 7+ literacy rates and NSS schoolenrolment ratios in the 6-14 age group instead of adult literacy rates and GERs. In the case of the WBHDRindices for income attainment, the departures made from the UNDP and NHDR formulations were evenmore radical, since these were based on an unweighted average of DDP per capita, NSS monthly percapita expenditure [mpce] and NSS estimates of the population above the poverty line.
The methodological problems that arise when computing sub-district level attainment indices for the DHDRsare even more severe, because of lack of direct estimates of per capita income and per capita expenditureat sub-district level, and the dearth of reliable estimates for IMR. The income attainment and health attainmentindices of the UNDP thus have to be substituted by suitable surrogate indices that can be readily computedfrom the existing block level database. However, it may be recalled that the UNDP life expectancy,educational attainment and income attainment indices in themselves are surrogate measures for basicunderlying human development dimensions of
Uttar Dinajpur
345
(i) leading a long and healthy life
(ii) continuous acquisition of knowledge, and
(iii) enhancing command over resources and material living standards
The lack of direct measures for income, health and knowledge attainments can thus be resolved by the useof alternative indirect measures of these human development dimensions, to yield consistent block-levelestimates of HDI based on adaptations of the UNDP methodology.
Modified HD Indexing Procedures in the Uttar Dinajpur DHDR
While the Bankura DHDR, 2007 did not make any HDI computations, choosing instead to represent inter-block variations in human development attributes pictorially as radar graphs, modified HDI computationswere made in the Malda DHDR, 2007, with the limited objective of making internally consistent humandevelopment comparisons between the constituent blocks in Malda district. The indexing methodologyused in the Uttar Dinajpur DHDR 2010 is identical to that earlier adopted in the Malda DHDR, andinvolves the initial computation of separate dimension indices that measure existing attainments in the 9Uttar Dinajpur blocks in the spheres of education, healthcare and access to livelihoods. Through a simpleaveraging method, these are then combined to yield the corresponding HDIs for each block, which measureoverall human development attainments in collective terms.
The computation for the education index is based on gross enrolment ratios [GERs] among the populationsegment aged between 5-14 years and 15+ adult literacy rates for each Uttar Dinajpur block, representingdirect application of the UNDP methodology. Nevertheless, in the absence of regular annual headcounts,the baseline estimates for the block population falling within these two age-segments in 2006 were generatedthrough forward projection of the corresponding 2001 population figures, using exponential growth trendsshown by these two population segments during the intercensal period between 1991-2001. The projectionhas an officially representative character, since similar projected population figures are routinely usedduring the targeting of Government education and healthcare programmes at district and block level.
Modifications to the UNDP health and income indices were made, for reasons earlier outlined, whilecalculating block level healthcare and economic indices at for Uttar Dinajpur. The modifications involvedsurrogate computation of
(a) a health services accessibility index in lieu of the UNDP life expectancy index, and
(b) a livelihood opportunities index in lieu of the UNDP income attainment index
The health services accessibility index used in the Uttar Dinajpur DHDR is the unweighted average ofseparate sub-indices for
(i) the proportion of the projected block population covered by rural sanitation schemes in 2006
(ii) the proportion of the projected block population fully or partially covered by safe drinkingwater schemes in 2006
(iii) the proportion of the target population in the age group 0-4 years covered by immunisationservices under the Universal Immunisation Programme [UIP] in each block in 2006, wherethe immunisation target for each block is determined independently on the basis of block-wise estimates of live births, rather than following the more approximate expected level ofachievement [ELA] methodology used while reporting immunisation achievements in HealthDepartment documents, and
Human Development Report 2010
346
(iv) the estimated proportion of safe deliveries in the block in the year 2006, where safe deliverieswere defined as the aggregated number of institutionalised deliveries and births assisted bytrained birth attendants [TBAs]
This combination of health and hygiene indicators ensures the sensitivity of the health services accessibilityindex to underlying factors that also determine rural morbidity and mortality, thus closely approximatingthe block level rankings that would have been obtained if, following the UNDP method, a zero-age lifeexpectancy index had been computed from IMR. The need for computing immunisation coverage indirectlyfrom block estimates of live births arises because the ELA-based indicators for immunisation achievementcommonly tend to be based on underestimates of the actual number of live births in the district. Hence themodified methodology was deemed more appropriate in estimating health service accessibility in the UttarDinajpur blocks.
The livelihood opportunities index used in the DHDR is based on work participation patterns among theUttar Dinajpur population, for which information is readily available at block level from the Census database.However, since these data are not updatable till the next Census, the computation of the index is done forthe census year 2001, unlike the other HD attainment indices where the computations refer to the year2006. The other practical limitation of this indexing method, in comparison to standard income basedindices, lies in its inability to draw in monetary data such as prevailing wage-rates which would help in thevaluation of work, rather than merely measuring the extent of its availability. Several conceptual obstaclesnevertheless stand in the way of including monetary data in the computation of the index. While standardiseddata on wage rates are not consistently available at block level, a block is also probably too large a unit forthe wage-levels within it to be captured by a single average wage rate. Also, because of widerangingdifferentials between the wages admissible for various categories and classes of work, a single averagewage would be incapable of capturing earning differentials within different segments of the block population.Hence, the livelihood opportunities index used in the computations for the Uttar Dinajpur DHDR dependsexclusively on work participation information drawn from Census sources.
Various dimensions of work participation are included in the computation of the index. While Censuswork participation rates [WPRs] or the ratio of total workers in the block to the 2001 block population givesome indication of the size of the block workforce and hence of the extent to which work opportunities areavailable to the block population, the ratio of main workers who are able to secure more than 180 days ofwork in a year to total workers in the block is a measure of the quality of available work opportunities.Collective earnings among main workers would in any case exceed the combined earnings of an equivalentnumber of marginal workers in the course of the year. Hence, blocks that are able to provide moreopportunities for main work to their working population would experience higher income attainmentscompared to other blocks in the district. A third work participation attribute included within the livelihoodopportunities index, utilising the four-fold occupational classification available for Census 2001 data, is theratio of 'other' workers to main workers, which measures the diversification of work opportunities withina block. The other worker category within this classification excludes the proportion of workers in theblock that derive their livelihoods from traditional agricultural and artisanal home-based activities. Thus,the ratio of other workers to main workers reflects the extent to which opportunities for non-traditional off-farm based livelihoods have proliferated within the block, indicating expansion of the economic base ofthe block. The Uttar Dinajpur blocks that are able to provide highly diversified work opportunities outsideagriculture would also be capable of expanding the incomes of the block population by drawing more andmore rural workers into new activities outside traditional agriculture. The livelihood index used in theDHDR is then computed as the simple average of these three basic work participation attributes.

Uttar Dinajpur
347
The modified human development index used in block-wise human development computations for theUttar Dinajpur DHDR is then expressed as an equiweighted average of the three dimension indices listedabove. Human development differentials between blocks can thus arise because of underlying variationsin block level education, healthcare and livelihood attainments, in any possible combination. The results ofthe modified HDI computations for Uttar Dinajpur are presented in the series of tables and charts below,which rank the 9 CD blocks against each other in terms of their indexed human development attainments.HD dimension indices and HDIs have only been calculated for the rural population in the district, sincedatabases containing the same set of development variables are not available at present for the four statutorytowns in the district. Since population growth in Uttar Dinajpur in recent times has been heavily influencedby migration, other conceptual difficulties also arise in making forward projections of the population inindividual urban areas, as required by some of the component indices. While rural-to-rural migrationgenerally follows a longterm trend, rural-to-urban migration can be quite spasmodic and unpredictable.Nevertheless, since urbanisation levels in the district are still very limited and the rural areas account fornearly 78 percent of the Uttar Dinajpur population, the block indices are highly representative of theoverall human development situation in the district and of the level of human development deprivationexperienced in each particular block. As such, these HD indices can provide adequate direction to futurehuman development planning exercises in Uttar Dinajpur by indicating the direction in which the planninginterventions can be refocused.
In line with the procedure earlier adopted in the Malda DHDR 2007, separate computations have alsobeen made for block level human poverty indices [HPIs]. Because of the frictions and fluxes generated bythe development process, not all residents in a block are able to leverage human development opportunitiesequally, experiencing relative deprivation as a result. The HPI is an inversely-weighted index that seeks tocapture the extent of poverty-inducing deprivations among vulnerable sections within each CD block.Especially vulnerable among rural segments within block population, for instance, are marginal cultivatorswho have lost land and become landless labourers as a consequence, households and communities whoexperience differential social barriers in their access to livelihoods and education, women-headed households,households headed by old and infirm members and other households with a large proportion of marginalworkers whose earnings are subject to periodic uncertainty, and so on. In each such instance, the ruralhouseholds under consideration suffer additional deprivation relative to their peers. Thus while the blockHDI coefficients represent the extent of human development achievements made by each block in UttarDinajpur, the HPI coefficients identify the corresponding patterns of relative deprivation that may exist ineach CD block. Human development interventions in the district need to be made after analysis of bothcoefficients.
Current Educational Attainments in Uttar Dinajpur
The education index calculation for the Uttar Dinajpur blocks was based on forward projection of theblock-level population count from the 2001 Census uptil the year 2006, using the annual exponentialgrowth rates for the population of each block populations, Block-wise primary and upper primary enrolmentfigures for 2006 were drawn from the DISE database. The size of the 5-14 age cohort, from which learnersare drawn at primary and upper primary stage, was estimated for each block from age-group data for theUttar Dinajpur population. The broad estimates thus generated were smoothed by forward projection ofthe 0-5 age cohorts from the 1991 and 2001 Censuses, since all infants in that age-group in 2001 would bein the school-going age in 2006, while infants in the 0-5 age-group in 1991 would all have left the primaryschool-going age cohort in 2006. No data adjustments were made for internal migration of students withinthe district, since children leaving their birth region to attend upper primary schools located elsewhere
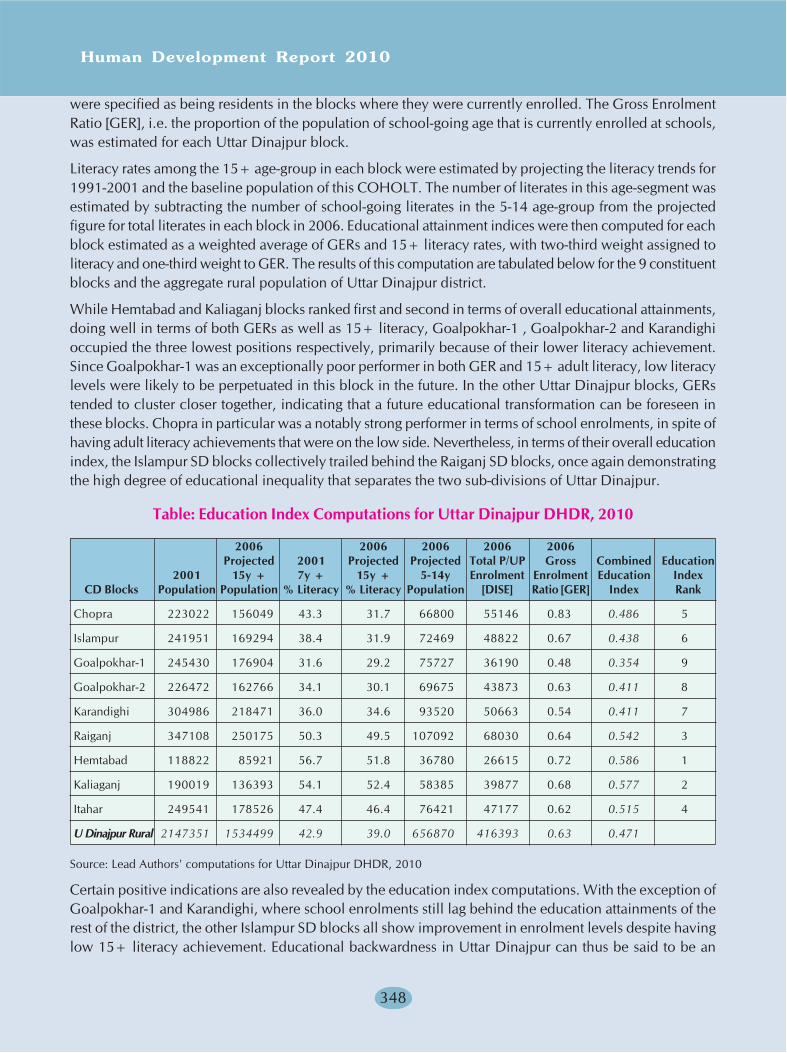
Human Development Report 2010
348
were specified as being residents in the blocks where they were currently enrolled. The Gross EnrolmentRatio [GER], i.e. the proportion of the population of school-going age that is currently enrolled at schools,was estimated for each Uttar Dinajpur block.
Literacy rates among the 15+ age-group in each block were estimated by projecting the literacy trends for1991-2001 and the baseline population of this COHOLT. The number of literates in this age-segment wasestimated by subtracting the number of school-going literates in the 5-14 age-group from the projectedfigure for total literates in each block in 2006. Educational attainment indices were then computed for eachblock estimated as a weighted average of GERs and 15+ literacy rates, with two-third weight assigned toliteracy and one-third weight to GER. The results of this computation are tabulated below for the 9 constituentblocks and the aggregate rural population of Uttar Dinajpur district.
While Hemtabad and Kaliaganj blocks ranked first and second in terms of overall educational attainments,doing well in terms of both GERs as well as 15+ literacy, Goalpokhar-1 , Goalpokhar-2 and Karandighioccupied the three lowest positions respectively, primarily because of their lower literacy achievement.Since Goalpokhar-1 was an exceptionally poor performer in both GER and 15+ adult literacy, low literacylevels were likely to be perpetuated in this block in the future. In the other Uttar Dinajpur blocks, GERstended to cluster closer together, indicating that a future educational transformation can be foreseen inthese blocks. Chopra in particular was a notably strong performer in terms of school enrolments, in spite ofhaving adult literacy achievements that were on the low side. Nevertheless, in terms of their overall educationindex, the Islampur SD blocks collectively trailed behind the Raiganj SD blocks, once again demonstratingthe high degree of educational inequality that separates the two sub-divisions of Uttar Dinajpur.
Table: Education Index Computations for Uttar Dinajpur DHDR, 2010
2006 2006 2006 2006 2006Projected 2001 Projected Projected Total P/UP Gross Combined Education
2001 15y + 7y + 15y + 5-14y Enrolment Enrolment Education IndexCD Blocks Population Population % Literacy % Literacy Population [DISE] Ratio [GER] Index Rank
Chopra 223022 156049 43.3 31.7 66800 55146 0.83 0.486 5
Islampur 241951 169294 38.4 31.9 72469 48822 0.67 0.438 6
Goalpokhar-1 245430 176904 31.6 29.2 75727 36190 0.48 0.354 9
Goalpokhar-2 226472 162766 34.1 30.1 69675 43873 0.63 0.411 8
Karandighi 304986 218471 36.0 34.6 93520 50663 0.54 0.411 7
Raiganj 347108 250175 50.3 49.5 107092 68030 0.64 0.542 3
Hemtabad 118822 85921 56.7 51.8 36780 26615 0.72 0.586 1
Kaliaganj 190019 136393 54.1 52.4 58385 39877 0.68 0.577 2
Itahar 249541 178526 47.4 46.4 76421 47177 0.62 0.515 4
U Dinajpur Rural 2147351 1534499 42.9 39.0 656870 416393 0.63 0.471
Source: Lead Authors' computations for Uttar Dinajpur DHDR, 2010
Certain positive indications are also revealed by the education index computations. With the exception ofGoalpokhar-1 and Karandighi, where school enrolments still lag behind the education attainments of therest of the district, the other Islampur SD blocks all show improvement in enrolment levels despite havinglow 15+ literacy achievement. Educational backwardness in Uttar Dinajpur can thus be said to be an
Uttar Dinajpur
349
inheritance from the past, in the form of persisting illiteracy among adult residents. Chopra has made aremarkable turnaround in breaking this crux, achieving very high GER in spite of low initial literacy. Thusthe low levels of education attainment in the Islampur SD blocks largely reflect educational backwardnesswithin their adult populations, which is likely to be reversed with time if school enrolments substantiallyimprove. The unenviable position of Uttar Dinajpur as the least literate district in West Bengal is primarilybecause of these low education attainments among the population of the Islampur SD blocks, amongwhich Goalpokhar-1 appears likely to perpetuate its position as the least literate block in Uttar Dinajpurbecause of its abysmally low attainments in both GER as well as adult literacy. Evidence that this positioncan be improved upon in the future emerges in the case of adjacent Goalpokhar-2 and Chopra. Althoughadult literacy here is almost at par with the low level seen in Goalpokhar-1, the GERs in these blocks standclearly ahead. The implication is that families with illiterate parents here are now being increasingly persuadedthat the key to a better future lies in improving the access of their children to formal education.
However, a more dire portent also present within the education index computations for all Uttar Dinajpurblocks relates to the longterm implications of the present rural GERs. Currently, less than two-thirds of thechildren in the 5-15 age-group who should be attending school are enrolled at primary and upper primaryschools in the district. Under the target of universalising education which seeks to raise GERs within thisage-group to 100 percent in a phased manner in the next few years, a sizeable number of out-of-schoolchildren still have to be inducted into the formal and nonformal school system in the district. Since enrolmentsand pupil-teacher ratios are already high in most Uttar Dinajpur blocks, this cannot be accomplishedwithout substantial expansion within the education system across the entire district. Without this policycommitment, the universalisation target cannot realistically be met in Uttar Dinajpur, and the district willsee the perpetuation of its legacy of high adult illiteracy for a long time to come.
The urgency of the educational situation in Uttar Dinajpur district becomes readily apparent. At present,there are a mixture of positive and adverse signals, indicating that education has become a key area forhuman development intervention in the district. The key interventions will have to be made particularly inthe Islampur SD blocks, where there are significant educational deficiencies, both in terms of the dearth ofeducational institutions and in the number of teachers. The key educational interventions will also need tobe planned holistically, so that children entering the primary education system are provided adequateavenues for further educational advancement through the establishment of an adequate number of upperprimary and secondary schools and colleges. Without substantial augmentation of the educationalinfrastructure across the district, both in terms of the dispersal of teaching staff and the dispersal of institutions,a large proportion of the rural population will continue to remain deprived of adequate educationalopportunities and knowledge inputs. In view of the urgency of this problem, a re-prioritisation will have totake place within the district which places the educational needs of the isolated Islampur SD blocks abovethe needs of other more advantageously situated blocks, till these educational imbalances are rectified.Given their border locations and their difficulties of communication, villages in the subdivision will needfocused attention if the current problems which result in Uttar Dinajpur being the least literate district inWest Bengal are to be rectified equitably.
Current Health Attainments in Uttar Dinajpur
While the educational attainment index discussed above applied the UNDP method of computation, thehealth attainment index calculation for the Uttar Dinajpur DHDR employs the proximate method developedfor the calculation of block level health indices in the Malda DHDR 2007, because of the unreliability ofdirect IMR estimates available in the district. Accordingly, the assessment of current healthcare situationsin the Uttar Dinajpur blocks is based on surrogate indicators that are sensitive to the quality and coverage
Human Development Report 2010
350
of the basic health services that are accessible to the block populations, namely the coverage of the populationby rural sanitation and safe drinking water schemes, the coverage extended by neonatal immunisationschemes, and the incidence of safe deliveries in each Uttar Dinajpur block. These represent a definitive setof general health & hygiene services and maternal & child health [MCH] interventions which also contributein the long run to the reduction of IMR and improvement of life expectancy in the district, as targeted duringcomputations of the UNDP health attainment index. The health sub-indicators used in measurement of thesurrogate health services accessibility index are listed below, with the attainment levels achieved by thenine Uttar Dinajpur blocks. The database on which these are developed includes data from the UttarDinajpur Zilla Parishad on current block-coverage under the Total Sanitation Programme [TSP] andSwajaldhara scheme, and data from the Uttar Dinajpur District Health Information System [DHIS] locatedat the office of the Chief Medical Officer of Health [CMoH] on block-wise coverage of children in the 0-4age-group under the Universal Immunisation Programme [UIP] and on the incidence of safe deliveries thatoccur under the supervision of hospitals and trained birth attendants [TBAs] in each block. However, thepopulation figures for the measurement of health and sanitation targets and for the overall number of birthsto be targeted by universal immunisation schemes and safe delivery are projected forward to the target-year2006. As explained earlier, the ELA methods used for estimating MCH and immunisation targets are discardedsince these provide inaccurate estimates of the number of live births, which are also inconsistent with theintercensal growth rates experienced by the Uttar Dinajpur population. Instead, a more direct estimate ofthe number of live births that have actually occurred is made from the exponential projection of intercensalgrowth rates for the block population. These are then used for the measurement of block-wise attainmentsunder the immunisation and MCH programmes, from which the composite health accessibility index isdeveloped by averaging these with safe drinking water and rural sanitation coverage.
As seen in the table for the four sub-indicators of health attainments, rural sanitation coverage under TSP islow in most Uttar Dinajpur blocks. Since TSP includes a subsidy element extended to BPL households, thefigures for TSP coverage largely reflect the degree of response among rural BPL households to this incentive.Since rural APL households are expected to bear the full costs of acquiring and installing sanitation facilitiespurchased from the sanitary marts, the response to TSP among them has been poor in most parts of ruralWest Bengal and India, accounting for the low rural sanitation coverage visible in the Uttar Dinajpurblocks. On the other hand, the Swajaldhara norm defines a rural habitation as being fully covered by thescheme if a protected water source is accessible to a maximum of 250 persons within an access radius of1.6 km from their households. On this count, many Uttar Dinajpur blocks now report full coverage underthe Swajaldhara norm, even though this does not in itself guarantee that all rural residents would accesssafe potable water from these installations if other unprotected water sources are available to them withina closer access radius. Since the Dinajpur region has an ancient tradition of utilising water from manmadetanks, over 29,000 of which are scattered across Uttar and Dakshin Dinajpur districts, effective access anduse of safe drinking water requires a change in the mindset and the behavioural patterns of the people.
Immunisation coverage is uniformly high in most parts of the district, and the block attainments forimmunisation are clustered relatively closely around the average immunisation attainment for the wholedistrict. Indicators for the incidence of safe deliveries are much lower on the whole, and also show widervariability between the Uttar Dinajpur. Since the ultimate target for all health & hygiene schemes is toachieve complete coverage, the present levels of coverage under rural sanitation and MCH schemes in theUttar Dinajpur blocks are well short of the ultimate scheme targets. Nearly half of the deliveries that takeplace in the district occur in unsafe conditions, and approximately one in every six infants still does notreceive adequate healthcare protection from Government immunisation schemes.
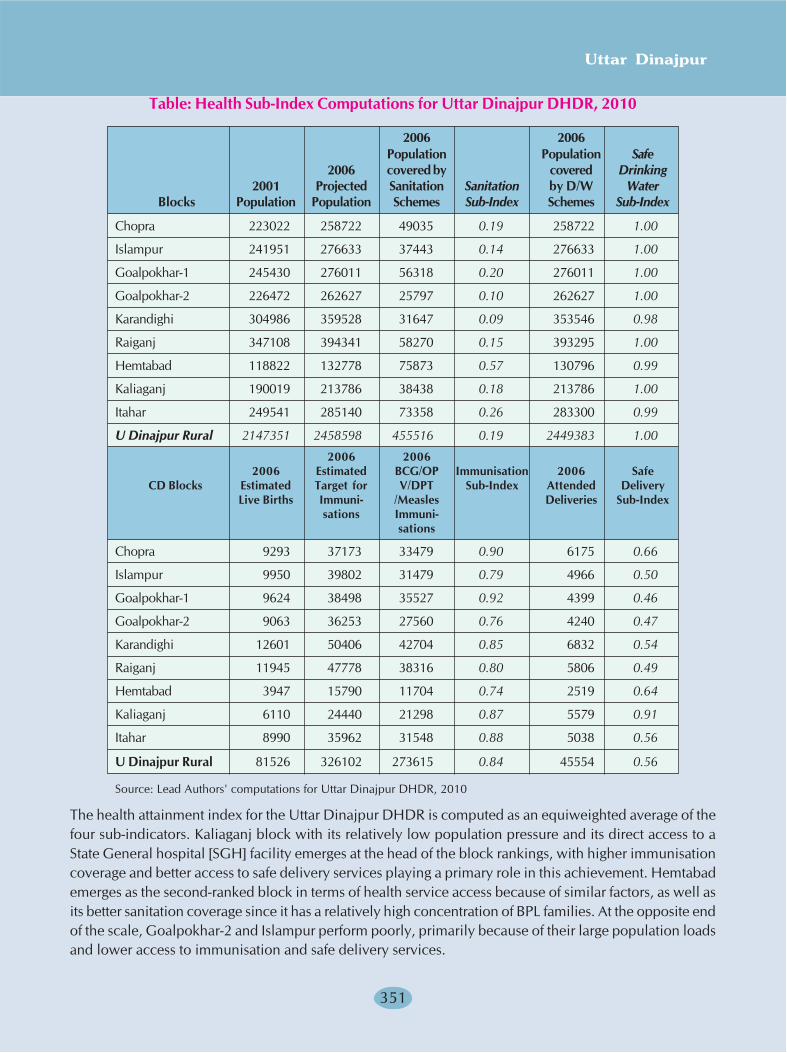
Uttar Dinajpur
351
Table: Health Sub-Index Computations for Uttar Dinajpur DHDR, 2010
2006 2006Population Population Safe
2006 covered by covered Drinking2001 Projected Sanitation Sanitation by D/W Water
Blocks Population Population Schemes Sub-Index Schemes Sub-Index
Chopra 223022 258722 49035 0.19 258722 1.00
Islampur 241951 276633 37443 0.14 276633 1.00
Goalpokhar-1 245430 276011 56318 0.20 276011 1.00
Goalpokhar-2 226472 262627 25797 0.10 262627 1.00
Karandighi 304986 359528 31647 0.09 353546 0.98
Raiganj 347108 394341 58270 0.15 393295 1.00
Hemtabad 118822 132778 75873 0.57 130796 0.99
Kaliaganj 190019 213786 38438 0.18 213786 1.00
Itahar 249541 285140 73358 0.26 283300 0.99
U Dinajpur Rural 2147351 2458598 455516 0.19 2449383 1.00
2006 20062006 Estimated BCG/OP Immunisation 2006 Safe
CD Blocks Estimated Target for V/DPT Sub-Index Attended DeliveryLive Births Immuni- /Measles Deliveries Sub-Index
sations Immuni-sations
Chopra 9293 37173 33479 0.90 6175 0.66
Islampur 9950 39802 31479 0.79 4966 0.50
Goalpokhar-1 9624 38498 35527 0.92 4399 0.46
Goalpokhar-2 9063 36253 27560 0.76 4240 0.47
Karandighi 12601 50406 42704 0.85 6832 0.54
Raiganj 11945 47778 38316 0.80 5806 0.49
Hemtabad 3947 15790 11704 0.74 2519 0.64
Kaliaganj 6110 24440 21298 0.87 5579 0.91
Itahar 8990 35962 31548 0.88 5038 0.56
U Dinajpur Rural 81526 326102 273615 0.84 45554 0.56
Source: Lead Authors' computations for Uttar Dinajpur DHDR, 2010
The health attainment index for the Uttar Dinajpur DHDR is computed as an equiweighted average of thefour sub-indicators. Kaliaganj block with its relatively low population pressure and its direct access to aState General hospital [SGH] facility emerges at the head of the block rankings, with higher immunisationcoverage and better access to safe delivery services playing a primary role in this achievement. Hemtabademerges as the second-ranked block in terms of health service access because of similar factors, as well asits better sanitation coverage since it has a relatively high concentration of BPL families. At the opposite endof the scale, Goalpokhar-2 and Islampur perform poorly, primarily because of their large population loadsand lower access to immunisation and safe delivery services.
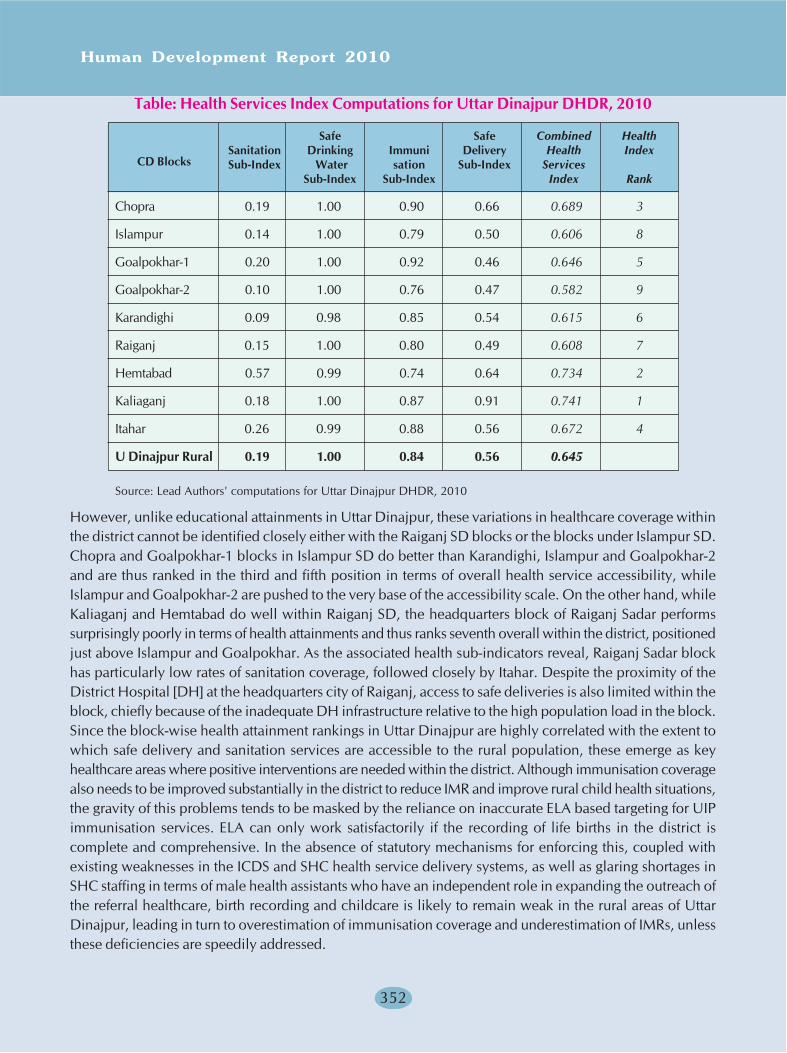
Human Development Report 2010
352
Table: Health Services Index Computations for Uttar Dinajpur DHDR, 2010
Safe Safe Combined Health
CD BlocksSanitation Drinking Immuni Delivery Health IndexSub-Index Water sation Sub-Index Services
Sub-Index Sub-Index Index Rank
Chopra 0.19 1.00 0.90 0.66 0.689 3
Islampur 0.14 1.00 0.79 0.50 0.606 8
Goalpokhar-1 0.20 1.00 0.92 0.46 0.646 5
Goalpokhar-2 0.10 1.00 0.76 0.47 0.582 9
Karandighi 0.09 0.98 0.85 0.54 0.615 6
Raiganj 0.15 1.00 0.80 0.49 0.608 7
Hemtabad 0.57 0.99 0.74 0.64 0.734 2
Kaliaganj 0.18 1.00 0.87 0.91 0.741 1
Itahar 0.26 0.99 0.88 0.56 0.672 4
U Dinajpur Rural 0.19 1.00 0.84 0.56 0.645
Source: Lead Authors' computations for Uttar Dinajpur DHDR, 2010
However, unlike educational attainments in Uttar Dinajpur, these variations in healthcare coverage withinthe district cannot be identified closely either with the Raiganj SD blocks or the blocks under Islampur SD.Chopra and Goalpokhar-1 blocks in Islampur SD do better than Karandighi, Islampur and Goalpokhar-2and are thus ranked in the third and fifth position in terms of overall health service accessibility, whileIslampur and Goalpokhar-2 are pushed to the very base of the accessibility scale. On the other hand, whileKaliaganj and Hemtabad do well within Raiganj SD, the headquarters block of Raiganj Sadar performssurprisingly poorly in terms of health attainments and thus ranks seventh overall within the district, positionedjust above Islampur and Goalpokhar. As the associated health sub-indicators reveal, Raiganj Sadar blockhas particularly low rates of sanitation coverage, followed closely by Itahar. Despite the proximity of theDistrict Hospital [DH] at the headquarters city of Raiganj, access to safe deliveries is also limited within theblock, chiefly because of the inadequate DH infrastructure relative to the high population load in the block.Since the block-wise health attainment rankings in Uttar Dinajpur are highly correlated with the extent towhich safe delivery and sanitation services are accessible to the rural population, these emerge as keyhealthcare areas where positive interventions are needed within the district. Although immunisation coveragealso needs to be improved substantially in the district to reduce IMR and improve rural child health situations,the gravity of this problems tends to be masked by the reliance on inaccurate ELA based targeting for UIPimmunisation services. ELA can only work satisfactorily if the recording of life births in the district iscomplete and comprehensive. In the absence of statutory mechanisms for enforcing this, coupled withexisting weaknesses in the ICDS and SHC health service delivery systems, as well as glaring shortages inSHC staffing in terms of male health assistants who have an independent role in expanding the outreach ofthe referral healthcare, birth recording and childcare is likely to remain weak in the rural areas of UttarDinajpur, leading in turn to overestimation of immunisation coverage and underestimation of IMRs, unlessthese deficiencies are speedily addressed.
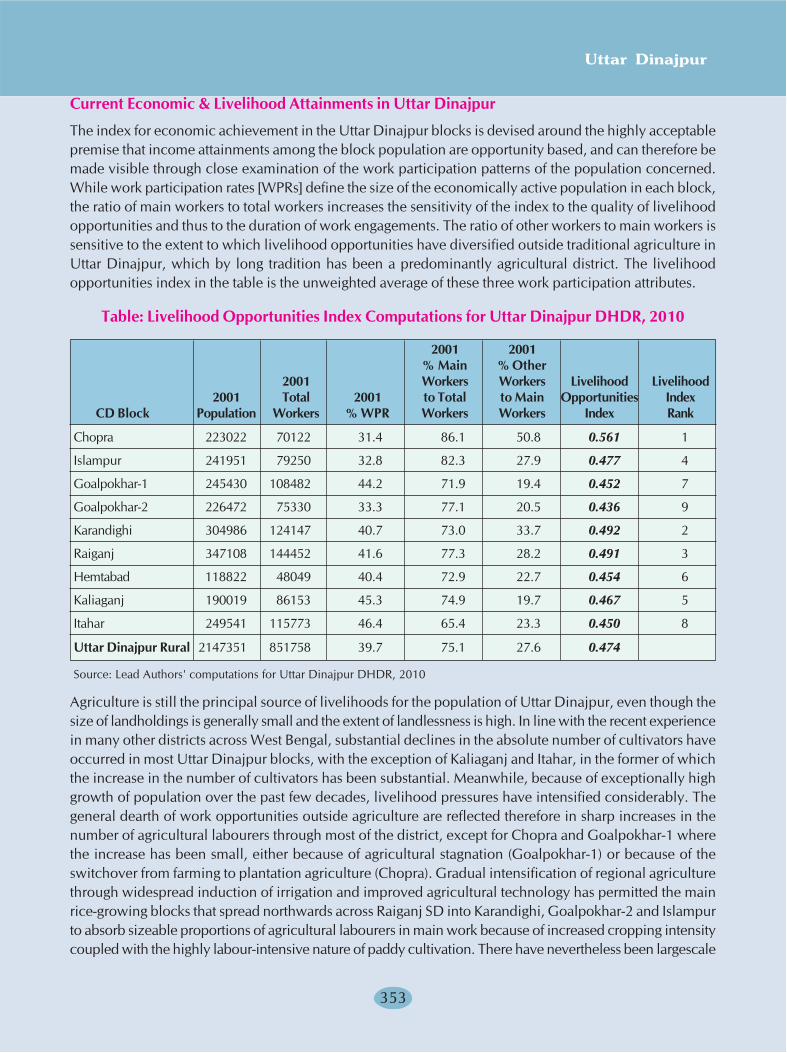
Uttar Dinajpur
353
Current Economic & Livelihood Attainments in Uttar Dinajpur
The index for economic achievement in the Uttar Dinajpur blocks is devised around the highly acceptablepremise that income attainments among the block population are opportunity based, and can therefore bemade visible through close examination of the work participation patterns of the population concerned.While work participation rates [WPRs] define the size of the economically active population in each block,the ratio of main workers to total workers increases the sensitivity of the index to the quality of livelihoodopportunities and thus to the duration of work engagements. The ratio of other workers to main workers issensitive to the extent to which livelihood opportunities have diversified outside traditional agriculture inUttar Dinajpur, which by long tradition has been a predominantly agricultural district. The livelihoodopportunities index in the table is the unweighted average of these three work participation attributes.
Table: Livelihood Opportunities Index Computations for Uttar Dinajpur DHDR, 2010
2001 2001% Main % Other
2001 Workers Workers Livelihood Livelihood2001 Total 2001 to Total to Main Opportunities Index
CD Block Population Workers % WPR Workers Workers Index Rank
Chopra 223022 70122 31.4 86.1 50.8 0.561 1
Islampur 241951 79250 32.8 82.3 27.9 0.477 4
Goalpokhar-1 245430 108482 44.2 71.9 19.4 0.452 7
Goalpokhar-2 226472 75330 33.3 77.1 20.5 0.436 9
Karandighi 304986 124147 40.7 73.0 33.7 0.492 2
Raiganj 347108 144452 41.6 77.3 28.2 0.491 3
Hemtabad 118822 48049 40.4 72.9 22.7 0.454 6
Kaliaganj 190019 86153 45.3 74.9 19.7 0.467 5
Itahar 249541 115773 46.4 65.4 23.3 0.450 8
Uttar Dinajpur Rural 2147351 851758 39.7 75.1 27.6 0.474
Source: Lead Authors' computations for Uttar Dinajpur DHDR, 2010
Agriculture is still the principal source of livelihoods for the population of Uttar Dinajpur, even though thesize of landholdings is generally small and the extent of landlessness is high. In line with the recent experiencein many other districts across West Bengal, substantial declines in the absolute number of cultivators haveoccurred in most Uttar Dinajpur blocks, with the exception of Kaliaganj and Itahar, in the former of whichthe increase in the number of cultivators has been substantial. Meanwhile, because of exceptionally highgrowth of population over the past few decades, livelihood pressures have intensified considerably. Thegeneral dearth of work opportunities outside agriculture are reflected therefore in sharp increases in thenumber of agricultural labourers through most of the district, except for Chopra and Goalpokhar-1 wherethe increase has been small, either because of agricultural stagnation (Goalpokhar-1) or because of theswitchover from farming to plantation agriculture (Chopra). Gradual intensification of regional agriculturethrough widespread induction of irrigation and improved agricultural technology has permitted the mainrice-growing blocks that spread northwards across Raiganj SD into Karandighi, Goalpokhar-2 and Islampurto absorb sizeable proportions of agricultural labourers in main work because of increased cropping intensitycoupled with the highly labour-intensive nature of paddy cultivation. There have nevertheless been largescale
Human Development Report 2010
354
increases in the number of marginal workers in the continuous belt stretching from Itahar through Raiganjto Karandighi, where agricultural saturation is already very high. While in Hemtabad and Kaliaganj, theincrease in marginal workers has been of a lesser order, because of lower population pressure overall, theother blocks in Islampur SD have all experienced growing outmigration of rural workers because of theinability of rural livelihood opportunities to grow apace with population numbers.
These combined trends are clearly visible in the variation in WPRs between the Uttar Dinajpur blocks.Chopra, Islampur and Goalpokhar-2 all have large block populations, but report substantially lower workparticipation than the rest of Uttar Dinajpur. Kaliaganj and Itahar, which grow immense quantities of rice,report much higher WPRs than the remainder of the district. Karandighi and Raiganj both have highpopulation concentration but report WPRs exceeding 40 percent. While the proportion of workers whohave been able to secure main work opportunities is generally high in all Uttar Dinajpur blocks, because ofthe dominance of agriculture, Chopra and Islampur offer considerably higher opportunities for main workparticipation, so that the numbers of marginal workers in these blocks is much lower compared to the restof Uttar Dinajpur. Experiencing the highest livelihood pressures, Itahar stands at the other extreme, withover a third of its workforce engaging in marginal work. Along with Chopra and Islampur, Karandighi andRaiganj offer more diversification in non-farm work opportunities. While in Chopra, the main reasonbehind this lies in the rapid spread of bought-leaf tea factories and associated small tea plantations, livelihooddiversification in Raiganj, Islampur and Karandighi is also affected by regional urbanisation trends aroundthe municipal towns located within them, and by the proliferation of beedi manufacturing activities inKarandighi. Kaliaganj, Goalpokhar-1 and Goalpokhar-2 stand at the opposite extreme, so far with littlevisible diversification away from agriculture. In Kaliaganj, this does not pose an immediate problem becauseof its lower relative population and because of its highly productive rice-based farming economy. On theother hand, in the two Goalpokhar blocks, the livelihood situations border on desperation, accounting forpoverty and high seasonal outmigration from these two blocks. In Itahar, the livelihood situation is similarlydesperate because of the sizeable density of the rural population, and high work participation and greaterdiversification to non-farm livelihood activities is unable to relieve these pressures.
Block rankings for the combined livelihood opportunities index closely follow these distributive patterns.Chopra stands first in terms of economic attainments, because of the combination of greater main workparticipation and higher rates of diversification to non-farm activities. The marked contrast between itslivelihood index value of 0.561, against index values for the other Uttar Dinajpur blocks as well as theindex for rural Uttar Dinajpur as a whole, show that it is well and truly ahead of the rest of the district interms of livelihood opportunities. The clustering of livelihood index values in the other blocks within therelatively narrow range of 0.436-0.492 shows that the principal economic constraints that operate withinthe district today are the high degree of landlessness, the small sizes of most farming operations, coupledwith the overwhelming pressure on agriculture for livelihoods Since the distributive pattern in livelihoodindices across the Uttar Dinajpur blocks is closely correlated with the degree of diversification in livelihoodactivities, clear indication is obtained that the economic future of the rural residents of Uttar Dinajpur willdepend strongly on the ability of the district to create viable livelihoods outside agriculture, through modernknowledge inputs that impart new skills to the district population and enhance its earning capabilities.
Overall Human Development in Uttar Dinajpur
The broad regional distributions of education, healthcare and livelihood attainments are summarised visuallyin the three dimension index maps. Regional disparities between the Raiganj SD and Islampur SD blocksare strongest in the case of educational attainments, with all blocks in Islampur SD being educationallydeprived in comparison to Raiganj SD. Healthcare disparities are distributed more unevenly between the

Uttar Dinajpur
355
two sub-divisions, with the populous blocks of Raiganj, Karandighi and Islampur faring poorly comparedto most other Uttar Dinajpur blocks. Goalpokhar-2, which ranks lowest in terms of health serviceaccessibility, forms a separate category by its own, suffering serious deficits in access to sanitation and safedeliveries besides lagging behind substantially in immunisation coverage. Except in Chopra, which standsapart from the other Uttar Dinajpur blocks in terms of the new access it offers to livelihood opportunitiesoutside the agricultural sector, block-level livelihood differentials within Uttar Dinajpur are not as wide asthose seen in the case of education and health attainments. The extent of livelihood pressure and workparticipation in the blocks is driven by population growth and migration. Nevertheless, although relativedifferences are small, the continuous cluster of blocks from Itahar to Karandighi offers relatively betterlivelihood access because of regional contiguity. While Kaliaganj and Islampur follow in sequence in thedevelopment periphery, the other Uttar Dinajpur blocks show up as definite gap areas in the provision ofequitable livelihood opportunities. Among them, Goalpokhar-2 shows significant levels of deprivation inall three human development dimensions. It is thus identified as the subregion of Uttar Dinajpur where thehuman development situation is most critical.
MAP: Spatial Comparison of Human Development Dimensions across Uttar Dinajpur
Education Index Health Services Index Livlihood Opportunity Index
The existence of such livelihood gaps within the economic landscape of Uttar Dinajpur also offers strongevidence of persisting lack of integration within the district economy. This originates partially from spatialfactors such as the peculiarly elongated shape of the district, the history of its administrative constitutionand the configurations of marketing and transportation networks which still tie the local economy of theIslampur region to neighbouring parts of Bihar. Livelihood development within the Goalpokhar cluster iscurrently affected by its proximity to the city of Kishanganj, to which this cluster has traditionally served asa feeder region. However, rapid economic development around the new municipality of Dalkola canprobably correct this regional imbalance within the foreseeable future, if proper communications policiesand assembly market planning are included in an integrated perspective for the development of Dalkola asa new urban complex within Uttar Dinajpur.
Uttar Dinajpur 2009Education Index
0.577 to 0.586 (2)0.515 to 0.577 (2)0.486 to 0.515 (1)0.411 to 0.486 (3)0.354 to 0.411 (1)
Uttar Dinajpur 2009Health Services Index
0.741 to 0.741 (1)0.734 to 0.741 (1)0.646 to 0.734 (3)0.606 to 0.646 (3)0.582 to 0.606 (1)
Uttar Dinajpur 2009Livelihood Opportunity Index
0.561 to 0.561 (1)0.491 to 0.561 (2)0.467 to 0.491 (2)0.450 to 0.467 (3)0.436 to 0.450 (1)
2010 2010 2010
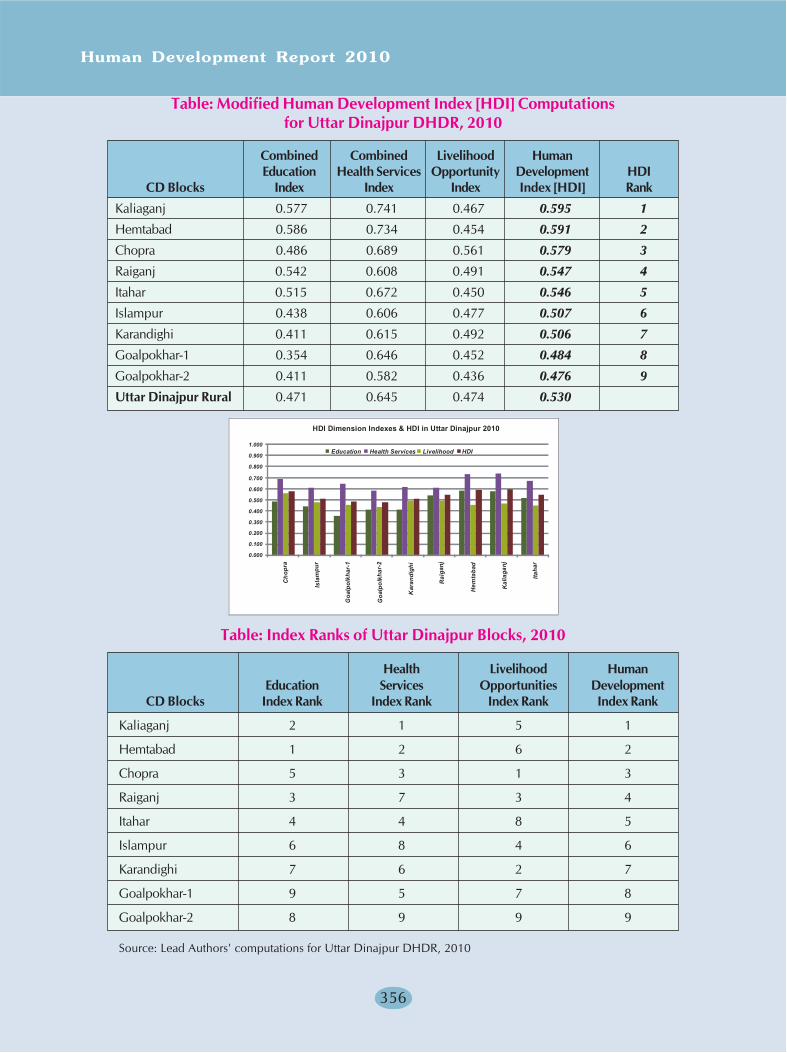
Human Development Report 2010
356
Table: Modified Human Development Index [HDI] Computationsfor Uttar Dinajpur DHDR, 2010
Combined Combined Livelihood HumanEducation Health Services Opportunity Development HDI
CD Blocks Index Index Index Index [HDI] RankKaliaganj 0.577 0.741 0.467 0.595 1
Hemtabad 0.586 0.734 0.454 0.591 2
Chopra 0.486 0.689 0.561 0.579 3
Raiganj 0.542 0.608 0.491 0.547 4
Itahar 0.515 0.672 0.450 0.546 5
Islampur 0.438 0.606 0.477 0.507 6
Karandighi 0.411 0.615 0.492 0.506 7
Goalpokhar-1 0.354 0.646 0.452 0.484 8
Goalpokhar-2 0.411 0.582 0.436 0.476 9
Uttar Dinajpur Rural 0.471 0.645 0.474 0.530
Table: Index Ranks of Uttar Dinajpur Blocks, 2010
Health Livelihood HumanEducation Services Opportunities Development
CD Blocks Index Rank Index Rank Index Rank Index Rank
Kaliaganj 2 1 5 1
Hemtabad 1 2 6 2
Chopra 5 3 1 3
Raiganj 3 7 3 4
Itahar 4 4 8 5
Islampur 6 8 4 6
Karandighi 7 6 2 7
Goalpokhar-1 9 5 7 8
Goalpokhar-2 8 9 9 9
Source: Lead Authors' computations for Uttar Dinajpur DHDR, 2010
0.000
0.100
0.200
0.300
0.400
0.500
0.600
0.700
0.800
0.900
1.000Education Health Services Livelihood HDI
HDI Dimension Indexes & HDI in Uttar Dinajpur 2010
Cho
pra
Isla
mpu
r
Goa
lpol
khar
-1
Goa
lpol
khar
-2
Kar
andi
ghi
Rai
ganj
Hem
taba
d
Kal
iaga
nj
Itaha
r
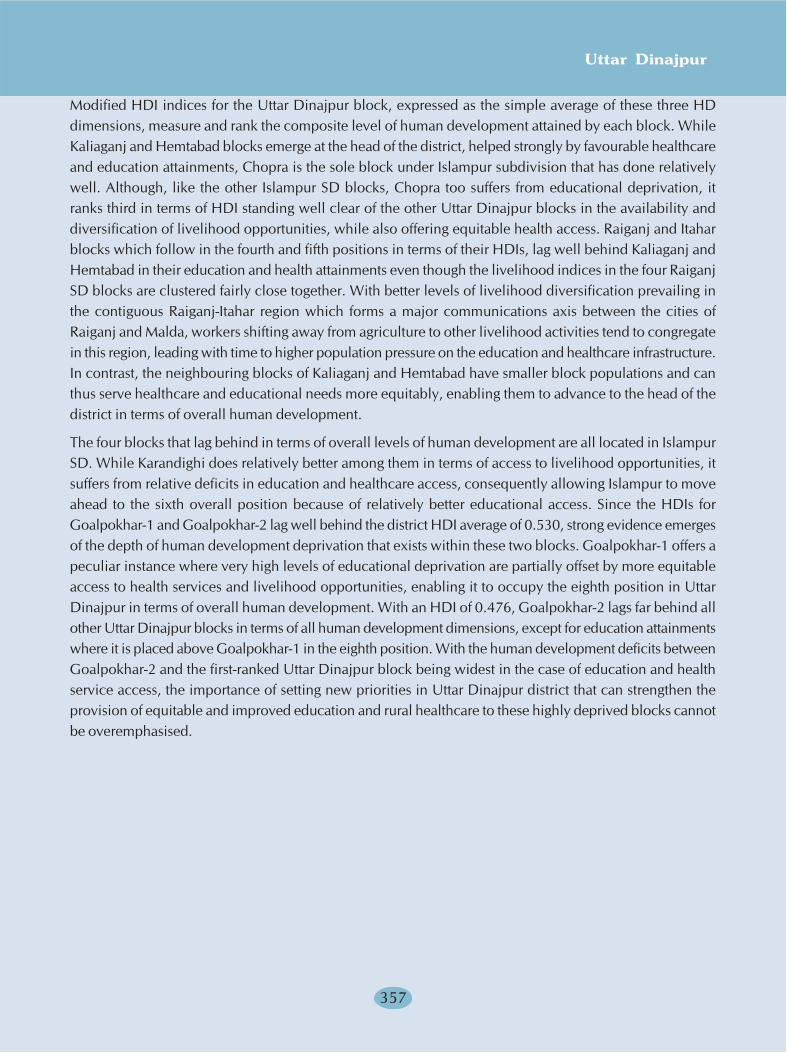
Uttar Dinajpur
357
Modified HDI indices for the Uttar Dinajpur block, expressed as the simple average of these three HDdimensions, measure and rank the composite level of human development attained by each block. WhileKaliaganj and Hemtabad blocks emerge at the head of the district, helped strongly by favourable healthcareand education attainments, Chopra is the sole block under Islampur subdivision that has done relativelywell. Although, like the other Islampur SD blocks, Chopra too suffers from educational deprivation, itranks third in terms of HDI standing well clear of the other Uttar Dinajpur blocks in the availability anddiversification of livelihood opportunities, while also offering equitable health access. Raiganj and Itaharblocks which follow in the fourth and fifth positions in terms of their HDIs, lag well behind Kaliaganj andHemtabad in their education and health attainments even though the livelihood indices in the four RaiganjSD blocks are clustered fairly close together. With better levels of livelihood diversification prevailing inthe contiguous Raiganj-Itahar region which forms a major communications axis between the cities ofRaiganj and Malda, workers shifting away from agriculture to other livelihood activities tend to congregatein this region, leading with time to higher population pressure on the education and healthcare infrastructure.In contrast, the neighbouring blocks of Kaliaganj and Hemtabad have smaller block populations and canthus serve healthcare and educational needs more equitably, enabling them to advance to the head of thedistrict in terms of overall human development.
The four blocks that lag behind in terms of overall levels of human development are all located in IslampurSD. While Karandighi does relatively better among them in terms of access to livelihood opportunities, itsuffers from relative deficits in education and healthcare access, consequently allowing Islampur to moveahead to the sixth overall position because of relatively better educational access. Since the HDIs forGoalpokhar-1 and Goalpokhar-2 lag well behind the district HDI average of 0.530, strong evidence emergesof the depth of human development deprivation that exists within these two blocks. Goalpokhar-1 offers apeculiar instance where very high levels of educational deprivation are partially offset by more equitableaccess to health services and livelihood opportunities, enabling it to occupy the eighth position in UttarDinajpur in terms of overall human development. With an HDI of 0.476, Goalpokhar-2 lags far behind allother Uttar Dinajpur blocks in terms of all human development dimensions, except for education attainmentswhere it is placed above Goalpokhar-1 in the eighth position. With the human development deficits betweenGoalpokhar-2 and the first-ranked Uttar Dinajpur block being widest in the case of education and healthservice access, the importance of setting new priorities in Uttar Dinajpur district that can strengthen theprovision of equitable and improved education and rural healthcare to these highly deprived blocks cannotbe overemphasised.
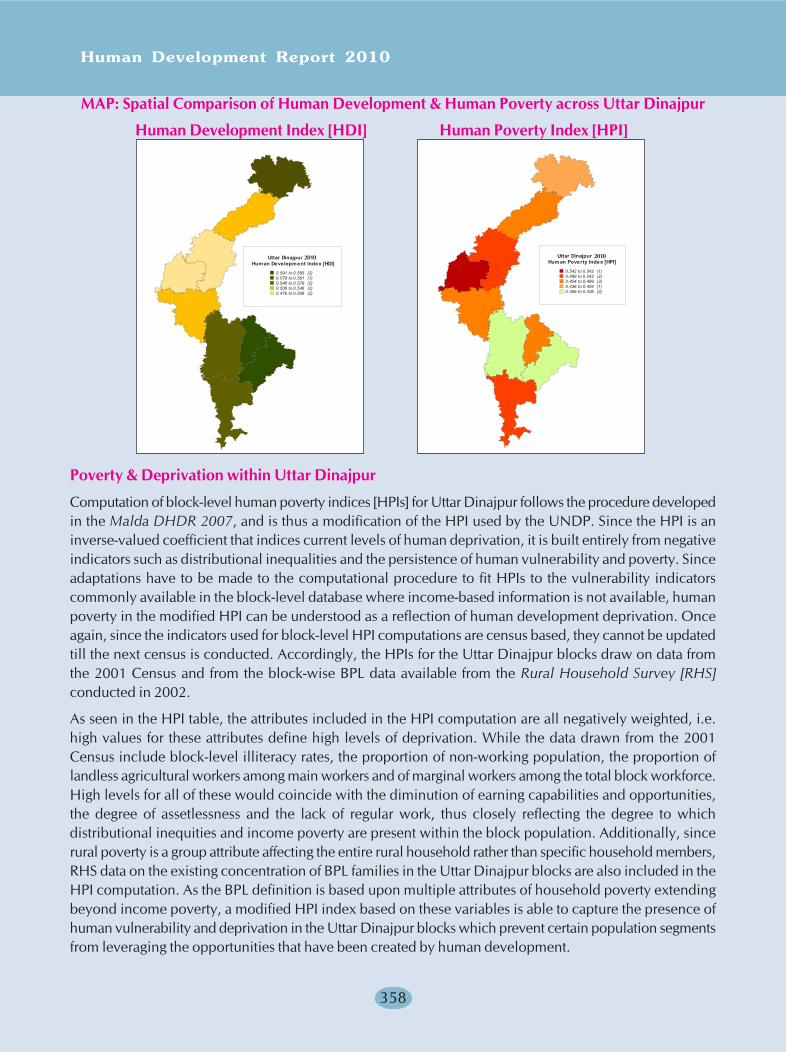
Human Development Report 2010
358
MAP: Spatial Comparison of Human Development & Human Poverty across Uttar Dinajpur
Human Development Index [HDI] Human Poverty Index [HPI]
Poverty & Deprivation within Uttar Dinajpur
Computation of block-level human poverty indices [HPIs] for Uttar Dinajpur follows the procedure developedin the Malda DHDR 2007, and is thus a modification of the HPI used by the UNDP. Since the HPI is aninverse-valued coefficient that indices current levels of human deprivation, it is built entirely from negativeindicators such as distributional inequalities and the persistence of human vulnerability and poverty. Sinceadaptations have to be made to the computational procedure to fit HPIs to the vulnerability indicatorscommonly available in the block-level database where income-based information is not available, humanpoverty in the modified HPI can be understood as a reflection of human development deprivation. Onceagain, since the indicators used for block-level HPI computations are census based, they cannot be updatedtill the next census is conducted. Accordingly, the HPIs for the Uttar Dinajpur blocks draw on data fromthe 2001 Census and from the block-wise BPL data available from the Rural Household Survey [RHS]conducted in 2002.
As seen in the HPI table, the attributes included in the HPI computation are all negatively weighted, i.e.high values for these attributes define high levels of deprivation. While the data drawn from the 2001Census include block-level illiteracy rates, the proportion of non-working population, the proportion oflandless agricultural workers among main workers and of marginal workers among the total block workforce.High levels for all of these would coincide with the diminution of earning capabilities and opportunities,the degree of assetlessness and the lack of regular work, thus closely reflecting the degree to whichdistributional inequities and income poverty are present within the block population. Additionally, sincerural poverty is a group attribute affecting the entire rural household rather than specific household members,RHS data on the existing concentration of BPL families in the Uttar Dinajpur blocks are also included in theHPI computation. As the BPL definition is based upon multiple attributes of household poverty extendingbeyond income poverty, a modified HPI index based on these variables is able to capture the presence ofhuman vulnerability and deprivation in the Uttar Dinajpur blocks which prevent certain population segmentsfrom leveraging the opportunities that have been created by human development.
Uttar Dinajpur 2009Human Development Index [HDI]
0.591 to 0.595 (2)0.579 to 0.591 (1)0.546 to 0.579 (2)0.506 to 0.546 (2)0.476 to 0.506 (2)
Uttar Dinajpur 2009Human Poverty Index [HPI]
0.542 to 0.542 (1)0.499 to 0.542 (2)0.454 to 0.499 (3)0.436 to 0.454 (1)0.406 to 0.436 (2)
20102010

Uttar Dinajpur
359
Table: Modified Human Poverty Index [HPI] Computations for Uttar Dinajpur DHDR, 2010
2001 2001 2002%Agricul % Marginal % Rural
tural Workers Families2001 Labourers to Total in BPL Human
2001 2001 % Non- to Main Workers category Poverty HPICD Block Population %Illiterates Workers Workers Index Rank
Goalpokhar-2 226472 65.1 66.7 51.0 22.9 65.3 0.542 1
Itahar 249541 51.9 53.6 47.5 34.6 64.9 0.505 2
Goalpokhar-1 245430 67.4 55.8 39.2 28.1 59.2 0.499 3
Hemtabad 118822 42.6 59.6 50.3 27.1 57.0 0.473 4
Karandighi 304986 61.6 61.1 42.5 27.0 37.2 0.459 5
Islampur 241951 60.8 67.2 40.6 17.7 40.7 0.454 6
Chopra 223022 55.7 68.6 29.1 13.9 50.6 0.436 7
Raiganj 347108 47.9 60.1 46.2 22.7 27.0 0.408 8
Kaliaganj 190019 45.2 54.7 42.9 25.1 35.4 0.406 9
Uttar Dinajpur Rural 2147351 57.1 50.1 38.6 25.1 46.7 0.435
Source: Lead Authors' computations for Uttar Dinajpur DHDR, 2010
The modified HPI index thus draws special focus to socially and economically deprived sections in UttarDinajpur who have not benefited equitably from the process of human development. Even within blocksthat show accelerated levels of human development, there are development victims who belong tomarginalised categories within the block population and continue to live in poverty. The modified HPIindicators measure their presence within the Uttar Dinajpur blocks, noting that social sections living belowthe threshold of poverty can suffer educational deprivation, have less access to healthcare and nutrition,and marginal or no access to improved means of livelihood, etc. Since the block-level HDIs and HPIs arethus formulated on different intuitive premises, any combination of the two is theoretically possible. Incertain blocks, high levels of human deprivation may coincide with acceptable levels of human developmentbecause of social exclusion among marginal segments. In others with greater distributional equity, humanpoverty may vanish with human development. In still others, human poverty may be the primary cause forlow levels of human development, because of the concentration of marginalised segments within the blockpopulation. The HPI table, which portrays these characteristics for rural Uttar Dinajpur, can be analysedcomparatively with reference to the earlier block-rankings in the HDI table.
With the highest levels of human development in rural Uttar Dinajpur, Kaliaganj block with an HDI of0.595 also records the lowest HPI of 0.406. It is evident that the high attainments in terms of humandevelopment attributes are inclusive in nature, and have, therefore, been able to lower the concentration ofpoverty in the block. In contrast, second-ranked and contiguous Hemtabad, with an HDI of 0.591 that isvery close to that of Kaliaganj, ranks fourth in terms of HPI, implying a higher concentration of poverty andpartial exclusion of the poor from the human development gains recorded by other economic sections.Third-ranked Chopra, located far to the north, has been able to ensure greater equity in human developmentand lower concentration of poverty, therefore, ranking seventh in terms of HPI. The headquarters block ofRaiganj, which ranked fourth in terms of HDI but offered the best livelihood opportunities in rural UttarDinajpur, accordingly, has a low concentration of poverty and achieves the second-lowest HPI of 0.408,
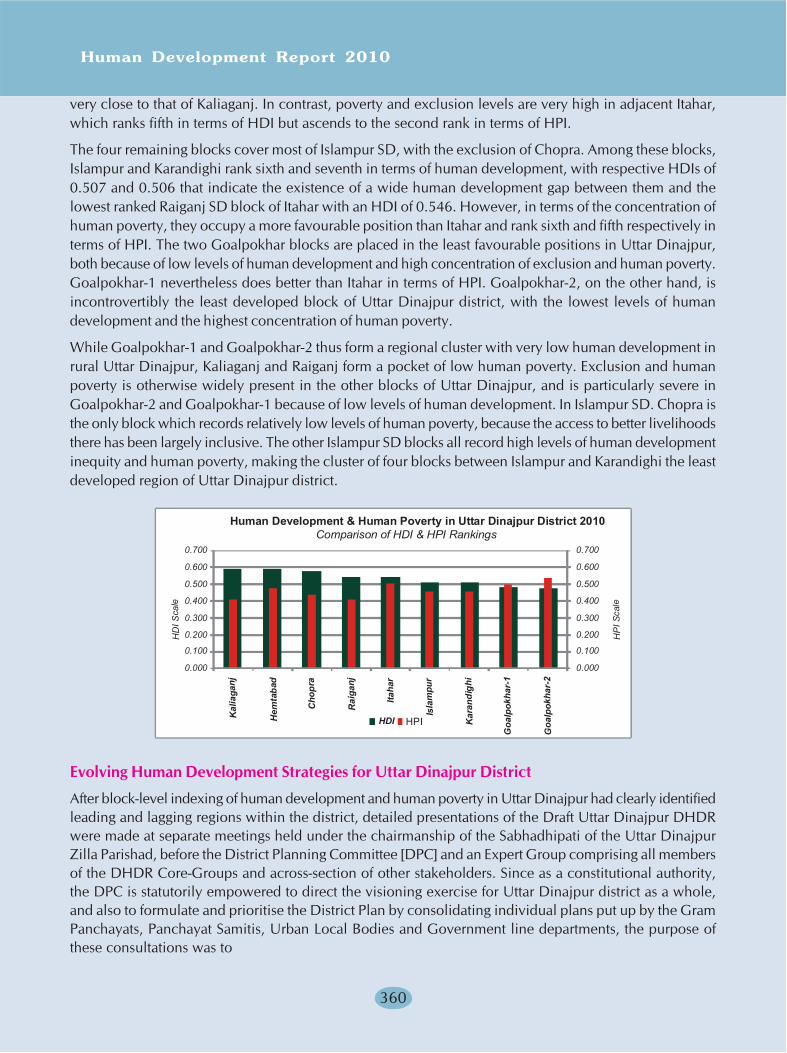
Human Development Report 2010
360
very close to that of Kaliaganj. In contrast, poverty and exclusion levels are very high in adjacent Itahar,which ranks fifth in terms of HDI but ascends to the second rank in terms of HPI.
The four remaining blocks cover most of Islampur SD, with the exclusion of Chopra. Among these blocks,Islampur and Karandighi rank sixth and seventh in terms of human development, with respective HDIs of0.507 and 0.506 that indicate the existence of a wide human development gap between them and thelowest ranked Raiganj SD block of Itahar with an HDI of 0.546. However, in terms of the concentration ofhuman poverty, they occupy a more favourable position than Itahar and rank sixth and fifth respectively interms of HPI. The two Goalpokhar blocks are placed in the least favourable positions in Uttar Dinajpur,both because of low levels of human development and high concentration of exclusion and human poverty.Goalpokhar-1 nevertheless does better than Itahar in terms of HPI. Goalpokhar-2, on the other hand, isincontrovertibly the least developed block of Uttar Dinajpur district, with the lowest levels of humandevelopment and the highest concentration of human poverty.
While Goalpokhar-1 and Goalpokhar-2 thus form a regional cluster with very low human development inrural Uttar Dinajpur, Kaliaganj and Raiganj form a pocket of low human poverty. Exclusion and humanpoverty is otherwise widely present in the other blocks of Uttar Dinajpur, and is particularly severe inGoalpokhar-2 and Goalpokhar-1 because of low levels of human development. In Islampur SD. Chopra isthe only block which records relatively low levels of human poverty, because the access to better livelihoodsthere has been largely inclusive. The other Islampur SD blocks all record high levels of human developmentinequity and human poverty, making the cluster of four blocks between Islampur and Karandighi the leastdeveloped region of Uttar Dinajpur district.
Evolving Human Development Strategies for Uttar Dinajpur District
After block-level indexing of human development and human poverty in Uttar Dinajpur had clearly identifiedleading and lagging regions within the district, detailed presentations of the Draft Uttar Dinajpur DHDRwere made at separate meetings held under the chairmanship of the Sabhadhipati of the Uttar DinajpurZilla Parishad, before the District Planning Committee [DPC] and an Expert Group comprising all membersof the DHDR Core-Groups and across-section of other stakeholders. Since as a constitutional authority,the DPC is statutorily empowered to direct the visioning exercise for Uttar Dinajpur district as a whole,and also to formulate and prioritise the District Plan by consolidating individual plans put up by the GramPanchayats, Panchayat Samitis, Urban Local Bodies and Government line departments, the purpose ofthese consultations was to
0.000
0.100
0.200
0.300
0.400
0.500
0.600
0.700
0.000
0.100
0.200
0.300
0.400
0.500
0.600
0.700
HDI HPI
Human Development & Human Poverty in Uttar Dinajpur District 2010Comparison of HDI & HPI Rankings
HD
I Sca
le
H
PI S
cale
Kal
iaga
nj
Hem
taba
d
Cho
pra
Rai
ganj
Itaha
r
Isla
mpu
r
Kar
andi
ghi
Goa
lpok
har-
1
Goa
lpok
har-
2
Uttar Dinajpur
361
(a) acquaint the DPC and the Expert Group with current human development situations in thedistrict as reflected in the DHDR, and
(b) seek firm direction from the DPC for the synthesis of a human development strategy for thedistrict of Uttar Dinajpur to alleviate these current problems.
The issues flagged during these meetings with the DPC and the DHDR Core Groups constitute the basicfoundation for human development strategy in Uttar Dinajpur. The core strategic elements first require thedistrict to confront the historic deprivations inherited from multiple alterations in its administrative boundariesafter 1947, which are responsible today for glaring regional disparities between its two sub-divisions.Next, the present educational inequalities within the district must be addressed in order to equaliseeducational opportunities across all blocks, thus enhancing the capabilities and functioning of the residentpopulation. The third element of the human development strategy requires rapid upgradation of physicaland social infrastructure, inclusive of healthcare, so that the people of Uttar Dinajpur are assured of thesame entitlements that are available in the other districts of West Bengal. The fourth strategic elementrequires the amelioration of existing human poverty through the creation of equitable livelihood opportunitiesfor the large concentration of socially backward groups that reside within Uttar Dinajpur. The fifth elementof the human development strategy calls for substantive improvements in gender security, through a processwhich progressively empowers women in Uttar Dinajpur, enabling them to participate in a fuller way andon equal terms in social and economic life. The issues that need to be resolved in each of these fivestrategic categories are outlined below, along with potential approaches that may be applied in the case ofUttar Dinajpur.
A: Rectifying Longterm Impacts of Administration Reorganisation
Unequal development has long been the bane of the Uttar Dinajpur region, both when it was part of theerstwhile West Dinajpur district, and later since 1992 when it was reconstituted as a separate district.Because of the need to rebuild the administrative infrastructure in Uttar Dinajpur after each readjustmentof district boundaries, many development activities in the district had been urban-centred, thus, leading tounbalanced development between the towns and villages. The Islampur region has thus suffered from aninitial development lag which was never quite bridged. With time, this gap has widened to the extent thatthe two subdivisions of Uttar Dinajpur district now present widely diverging human development profiles.This basic problem is compounded by the fact that the district has a diverse multicultural complexion, withthe Islampur region showing marked concentration of underprivileged communities and linguistic groups,including the SC, ST and Muslim communities as well as significant clusterings of Urdu and Hindi speakers.For equitable development of all cultural and linguistic groups residing within the district, it is imperativethat these development disparities between the two sub-divisions be removed.
Although the separation of Uttar Dinajpur from Dakshin Dinajpur was intended to focus developmentactivities towards the amelioration of regional disparities within the newly constituted district, the processof administrative bifurcation inevitably entailed the restructuring of departments and developmentprogrammes, creating another slowdown within the development processes experienced by the new district.With the total quantum of development funds being scarce, this restructuring is still not complete as ofdate. A particular instance where the impact of district bifurcation can be seen to have been particularlystrong arises in the case of the Raiganj District Hospital. Originally a 168-bedded subdivisional hospitalunder the jurisdiction of Balurghat District Hospital in erstwhile West Dinajpur, the facility was redesignatedas a District Hospital in 1992 after the creation of Uttar Dinajpur district. However, neither the overallbed-strength nor the complement of doctors and allied health personnel has expanded commensuratelyover the subsequent 17 years, making it difficult for Raiganj DH to cater to the entire health needs of the
Human Development Report 2010
362
district of Uttar Dinajpur satisfactorily. Many essential health services, e.g. blood bank facilities, etc. arestill inadequately provided, leading to overall deficiencies in healthcare provision in Uttar Dinajpur. AtBPHC and hospital level, many health facilities in Uttar Dinajpur still draw in additional patient-loads fromadjoining villages in Bihar, and from the extreme western portions of Dakshin Dinajpur where the boundariesof the erstwhile Itahar block were readjusted during the bifurcation of Uttar & Dakshin Dinajpur. Similarly,as a number of patients from the two Goalpokhar blocks attend hospital facilities in contiguously situatedKishanganj - now a district headquarters within Bihar - and Siliguri in Darjeeling district, development ofhealth infrastructure in the Goalpokhar region as well as through most of Islampur SD has consequentlybeen slow. However, in many such cases, patients have to commute considerable distances to avail ofhospital care, adding substantially to the time and costs of seeking and availing healthcare.
Following the bifurcation of Government departments between Uttar and Dakshin Dinajpur, otherdeficiencies persist in departmental infrastructure and personnel. In certain cases, such as the instance ofBureau of Applied Economics & Statistics [BAE&S], the concerned regional officer has to hold dual chargefor both districts. In the case of the Public Health Engineering [PHE] department, which executes drinkingwater schemes across the district, staffing deficiencies have prevailed since the bifurcation of the departmentin 1992. The District Industries Centre [DIC] lacks a sufficient number of designated industrial estates,where the industrialisation of the district can be aggressively pursued. Even after the reorganisation of thedistrict, the expansion of the network of SHCs and anganwadi centres in Uttar Dinajpur had been slowbecause of the deficiency of infrastructural funds. Meanwhile, with a large quantum of funds being expendedon civil works to upgrade the administrative infrastructure at the new district headquarters at Karnajora,there has been an overall shortage of capital funding for other development projects that need to be takenup urgently in other parts of Uttar Dinajpur.
The obvious planning interventions that can be made in this respect by the Uttar Dinajpur DPC are
(i) to articulate such persisting problems at the foundational stage of the District Plan,
(ii) to quantify the resulting service disparities that adversely affect development in each block,
(iii) to seek full funding support from the State Government for removing these longstandinglacunae which impact upon the overall human development profile of the district.
A time-bound course of action would also need to be defined to resolve the physical and administrativedeficiencies within a fixed timeframe, based on dovetailed perspective planning by the District Administrationand the line departments, and the execution of all outstanding development works on priority basis. At theend of the defined period, all infrastructural and administrative facilities within Uttar Dinajpur should havebeen brought to par with those available in every other district in West Bengal.
Removal of existing regional disparities between Islampur SD and Raiganj SD could proceed apace, byreprioritising the regional thrust of the District Plan. In particular, this would mean that the humandevelopment needs of the backward blocks under Islampur SD would need to be prioritised ahead of theneeds of the more developed blocks in Raiganj SD, till the intrinsic disparities between the two subdivisionshave largely disappeared. While a regional development strategy of this nature could involve some localcontentiousness, it needs to understood that the development lag between the two subdivisions initiallyappeared because of adherence to the opposite scale of priorities, which for a long time gave precedenceto the development needs of Raiganj SD over those of the Islampur region. Because of the high concentrationof backward social sections within the Islampur blocks, restoration of regional equity is the only way ofadvancing overall human development attainments across Uttar Dinajpur district as a whole.
Uttar Dinajpur
363
B: Redressal of Educational Inequalities
With primary school enrolments in Uttar Dinajpur showing a steadily rising trend over the past decade, thebasic problem affecting educational attainment in the district is the high dropout rate after the primarystage. Improvement in the retention rates of students within the educational system through the years tocome can thus be identified as a major human development target for Uttar Dinajpur district. Considerableimbalance exists currently between the capacity and outturn of the primary educational system and futureopportunities for pursuing education through its middle and secondary stages. This forces substantialinvoluntary dropout of students from the formal system beyond the Class IV-V stage. Accessibility of ruralschools is still a major problem in Uttar Dinajpur, with many students residing in the Islampur SD blockshaving to travel distances of 4-6km to attend upper primary and secondary school. Since this problemparticularly affects the enrolment of rural girls, at least two State-run hostels for Muslim and ST girls need tobe established within Islampur SD to improve the retention of girl students within the secondary educationsystem. Separate girls' high schools also need to be set up to improve the retention of girls at Majhiali andHaptiagachh, which are located at a considerable distance from the block headquarters at Chopra.
Several blocks in Islampur SD, where there has been a marked rise in primary enrolments, now also showunmistakable evidence of crowding and congestion, in the form of very high pupil-teacher ratios. Theinevitable consequence of this is a deterioration in the quality of instruction. Strengthening of the educationalinfrastructure in Uttar Dinajpur will thus require the establishment of a substantial number of new schools,accompanied by the extension of classrooms and new teacher recruitments. Since the district has sufferedfrom considerable educational weaknesses in the past, this new development effort will have to be made ina highly concerted manner over a short timeframe, necessitating the mobilisation of adequate State fundingfor uniform extension of educational opportunities across the rural areas of the district. Although the SSKsand MSKs functioning in Uttar Dinajpur district at present offer a low-cost alternative for universalisingbasic education, they cannot substitute in the long run for fully-fledged formal institutions. With high ratesof population growth and consequent widening of the population segment in the younger age-groups, thedemand for education is likely to increase even more through the years to come. Thus a comprehensiveupgradation of the school infrastructure is strongly justified.
The necessity of expanding the teaching strength at primary and upper primary schools also entails parallelexpansion in the intake capacity of teacher-training institutions. Since any new training institutions wouldhave to meet strict NCTE norms, substantial investments would have to be made on these new facilities, sothat the future staffing needs of the district school system could be fully met. To realise all these socialobjectives simultaneously, the District Planning Committee [DPC] at Uttar Dinajpur would need to formulatea medium-term perspective plan for upgrading the educational infrastructure in the district, and for ensuringthat the educational aspirations of students belonging to backward blocks are fulfilled.
Because of the overall dearth of college institutions in the district, opportunities for pursuing under graduateeducation after the Higher Secondary stage are also limited. With most colleges being clustered around thedistrict headquarters and adjoining Kaliaganj and Itahar blocks, pressure on the college system is highest inIslampur SD, where school enrolments and completion rates have increased substantially over the recentdecades. Establishment of a general college at Dalkola in 1995 has not adequately relieved the situation.Given the potential student intake as well as the difficulties of internal communication within the subdivision,another college urgently needs to be established between Goalpokhar and Chakulia.
A large number of high school and College students in Uttar Dinajpur are first-generation learners, whosefamilies have hitherto lacked an educational environment. Hence, career guidance centres need to beestablished at the school institutions to counsel them on their future choice of subjects and career options.Uttar Dinajpur still offers very limited avenues for vocational education. Since a growing proportion of the
Human Development Report 2010
364
district population will be school-literate in the near future, employment opportunities outside agriculturewould have to expand commensurately. Thus the number of technical training institutions and polytechnicswould also need to expand substantially, in order to equip non-collegiate students with the technical skillsthat would enable them to secure alternative employment. To achieve this, a new polytechnic or ITI couldbe established at Dalkola, in addition to the technical institute due to commence at Islampur from 2010.
The system of madrasah education in Uttar Dinajpur fills a vital gap within the district educational system,serving a vast region of Islampur SD with high minority concentration, where the system of State-aidedschools is at present inadequate. The proliferation of unrecognised madrasahs through this region reflectsthe growing demand for education among the minority community in an area so far characterised by lowliteracy. A total of 1888 unregistered beedi manufacturing units now function within the district, directlyemploying 3687 workers and engaging many others - mostly women - in the home-based activity of bindingbeedis. The high incidence of child labour had previously been a serious problem in the Muslim-dominatedareas of Uttar Dinajpur, because of high levels of landlessness and poverty among the Muslim population.Under the National Child Labour Project [NCLP], this has been partially ameliorated by establishing 45NCLP schools, primarily for the children of beedi and brickfield workers. However, for NCLP to have asalutary impact on the child labour profile across the district, at least 200 NCLP schools need to be establishedin Uttar Dinajpur to cater to the combined educational needs of the Muslim, SC & ST communities, amongwhom landlessness and poverty is generally high.
In the Karandighi region, the recent proliferation of beedi binding has enhanced family incomes among theMuslim community, followed by greater demand for education. Enrolment of girl children at the madrasahsis thus particularly high, touching 65 percent at the Rahatpur High Madrasah. Many children belonging tothe SC & ST communities also enrol at the madrasahs after completing their primary education elsewhere.Since there is an overall shortage of upper primary schools under the Government system, the madrasahsin the district which generally integrate primary with upper primary and secondary education provide analternative recourse. However, since Government assistance in support of madrasah education is onlyavailable to Junior High and High madrasahs, the proliferation of unrecognised madrasahs at the primarystage is largely unmonitored. Given the vital importance that the madrasah system holds for education inUttar Dinajpur, the Government policy in this regard needs to be reconsidered so that the State-recognisedmadrasahs can gradually emerge as an alternative system extending comprehensive education from theprimary to the secondary and higher secondary stage.
Although the Islampur SD areas in Uttar Dinajpur have a substantial Urdu and Hindi speaking population,low access to Urdu-medium Government schools is an important cause for the proliferation of madrasaheducation in the Muslim-dominated areas of the district. However, since few high schools and collegiateinstitutions in Uttar Dinajpur have provisions for teaching Urdu, the scope for higher education for Urdu-speakers is limited. While more Urdu and Hindi medium schools need to be established in Uttar Dinajpur,separate focus also needs to be laid on procuring adequate supplies of textbooks in these languages, and onthe recruitment of an adequate number of Urdu and Hindi speaking teachers through the School ServiceCommission [SSC] for posting at the Government schools located within Islampur SD. A second step inredressing this problem would be to establish an Urdu and a Hindi college in Islampur SD, with academicsupport drawn from the West Bengal Urdu and Hindi Academies. This would do a lot to ease the problemscurrently faced by Urdu and Hindi speakers in the district, who presently have to go to Bihar to pursuehigher education.
Uttar Dinajpur
365
C: Improvements in Physical and Health Infrastructure
With an unfavourable geographical location that straddles a long international border and the truncation ofits transport and communications network as a result of Partition and subsequent administrativereorganisation, Uttar Dinajpur still faces serious shortages in physical infrastructure that tell on itsdevelopment levels and social welfare performance. Both in the headquarters sub-division of Raiganj wheremany sub-divisional facilities have still to be upgraded fully to district-level, and in Islampur SD where thetransferred areas still depend on adjoining Kishanganj in Bihar for major communication linkages, theseinfrastructural limitations ultimately show up in the form of regional human development deficits.
Although a large number of rural roads in Uttar Dinajpur have recently been surfaced with black-tops,drawing upon PMGSY support, the road network in the district will have to be upgraded and expandedsubstantially for the rural economy to develop adequate market linkages. The dearth of communications isespecially felt within Islampur SD, where the principal highway link skirts the western fringe. Since four-laning of the highway and its ultimate conversion into a toll-road will seriously affect the development ofinternal communications, adequate investment should also be made to upgrade the parallel 'Bengal-to-Bengal' roadlink which has the potential to draw internal traffic from the underserved villages locatedalong the eastern border of the district.
While existing deficiencies in educational and healthcare infrastructure in Uttar Dinajpur also to someextent reflect the inheritance from the administrative reorganisations periodically experienced by the district,subsequent provision of these amenities has not been evenly spread between the two subdivisions, leadingto critical social infrastructure bottlenecks in the five Islampur blocks. The physical isolation of theseblocks from the principal urban centres in Uttar Dinajpur also impedes the posting of requisite personnel,as a result of which the rural PHCs at Kanki and Torial currently lack resident medical officers. Laboratoryfacilities at rural PHCs are similarly weak. Because of difficulties in recruiting adequate male staff willing toserve as health assistants at the rural SHCs, the programme of institutionalised healthcare visits to ruralhouseholds served by the SHCs suffers, considerably weakening health monitoring as well as the referralhealthcare systems. Meanwhile, many rural residents in the isolated villages and blocks are forced todepend on the services of dubious healthcare providers such as quack doctors.
Sustainable public healthcare requires sufficient staffing and adequate clinical infrastructure. With theincrease in district population and fast-growing patient loads, the primary healthcare system in Uttar Dinajpuris currently unable to provide satisfactory rural healthcare coverage. The available bed strength at manyBPHCs is highly insufficient to meet the anticipated needs of the block population. No beds are availableat the health centre at Kanki, which forces many indoor patients to seek private hospitalisation as far awayas Siliguri. With no BPHC being located in the block, the population of Karandighi is similarly underservedby the existing 30-bedded rural hospital, and thus has to depend to a considerable extent on the indoorhealthcare services extended by the District Hospital at Raiganj, ultimately lowering the efficiency of thereferral healthcare system. Inadequate emolument scales also affect the appointment and retention ofhealthcare technicians, partially weakening pathology services at the BPHCs. Meanwhile, mushroom growthhas occurred in private clinical and pathological establishments across the district, whose services ofteninvolve prophylactic and quality concerns.
Since public healthcare coverage in Uttar Dinajpur had hitherto been poor, the rural population will alsoneed to be conditioned towards wider acceptance of modern healthcare. A comprehensive information,education & communication [IEC] strategy thus needs to be formulated for the district as a whole, involvingcivil society partnerships for health outreach. Although the provision for appointing a grassroot accreditedsocial health activist [ASHA] for each village with 1000 population under NRHM makes another important
Human Development Report 2010
366
step toward this, the number of ASHA workers to be appointed and their training needs would be immense.Hence the programme for healthcare extension in Uttar Dinajpur will have to be carefully coordinated andplanned, so that it does not flounder at this critical stage. Given the NRHM coverage norms, the number ofSHCs in Uttar Dinajpur is presently inadequate and will have to expand substantially for referral healthcareand health acceptorship to improve. During the process of upgrading the SHC network, there would alsohave to be some rationalisation of the service loads through reassignments of villages to be covered by theexisting and new SHCs. At this stage, considerable attention would need to be devoted to locate thesehealthcare facilities optimally, taking into account the distances that would need to be covered by thehealthcare seekers as well as the existing communication links they would need to traverse.
Because of the dearth of SHCs and AWCs in the district, the delivery of immunisation and RCH services inUttar Dinajpur is still very weak. Institutional deliveries are still relatively rare, leading to the high persistenceof neo-natal and post-natal deaths among mothers and infants. Besides the District Hospital at Raiganjwhich has been upgraded in name but still functions within the infrastructure of a subdivisional hospital,the State General Hospital at Kaliaganj functions within the infrastructural framework of a rural Hospital.Considerable upgradation of the healthcare infrastructure in the district will have to be made, beforeimprovement occurs in the rural health situation. Establishment of an ESI hospital in Uttar Dinajpur is alsorequired to ameliorate health situations among the large number of brickfield workers in the district.
Although the Union Government has recently announced its intention of establishing a 960-beddedsuperspeciality hospital at Raiganj, on the lines of the All India Institute of Medical Sciences [AIIMS], theprevailing health situation in the district will only show distinct improvement if the entire referral healthcareinfrastructure is also revamped, with adequate provision of health institutions and health staff at all tiers.Since an opportunity for accomplishing this has now arisen under NRHM, Uttar Dinajpur needs to makefull use of this opportunity, in order to place healthcare attainments in the district on an even keel.
D: Amelioration of Livelihood Situations
Even though Uttar Dinajpur is a major rice-producing district, the current level of agricultural technology isgenerally poor, combined with a substantially underdeveloped irrigation potential which restricts theproductivity of small and marginal farmlands. Crop losses are a frequent feature during the season of rains,because of the location of large parts of the district along the active floodplains of the Mahananda andNagar. The problem has become critically acute in the region between Raiganj and Itahar where protectionworks along the Kulik and Nagar are urgently needed. The dominance of rice in the cropping profile ofUttar Dinajpur has led in recent years to the addition of substantial rice-processing capacity, with over 15registered mini ricemills, located mostly in Islampur SD. In addition, the unregistered rice-milling sectorforms a major cluster within the district, with 4911 small-scale units that collectively employ over 12,600workers. Large quantities of jute are also produced in the marshy and riverine tracts of Uttar Dinajpur, asa result of which several downstream industrial units that process the fibre into texturised jute yarn havealready been set up in the main jute-producing region. While these could form the future core for anintegrated complex involving the manufacture of high-value jute products, this potential seems to havebeen overlooked and no proposal for such an industrial complex is in the pipeline at present. A project ofthis order could be initiated and sustained if two high-volume jute mills were established to serve jute-growers at Islampur and Raiganj subdivisions and offer them adequate price-support.
As a major agricultural district, Uttar Dinajpur holds considerable potential for agro processing industries.More mini rice mills and rice bran oil extraction units can be set up across the district, with adequateinstitutional support. Under a closed production cycle, the large volume of rice husk produced by theserice mills would also provide a valuable source of energy to other industrial units. On the same principle,a modern petrochemical cracking unit has been established recently outside Kaliaganj, which processes
Uttar Dinajpur
367
petrochemicals brought down by tanker from the Haldia production complex into light aromatics likebenzene and toluene for distribution through North Bengal, Bihar and Nepal, using rice husk as its energysource. Other agro based units can also be established outside Islampur for processing tomatoes andpineapples which grow well in the Chopra-Islampur region, while a turmeric processing unit can belocated at Goalpokhar.
Through most of Uttar Dinajpur, the expansion in rice production has been based on the enhancement ofirrigation, primarily through the mechanism of energised shallow tubewells and river-lifts. However, withrural electrification rates in the district being poor, these energised irrigation systems depend heavily on theunsubsidised use of diesel fuel, greatly raising energy costs while also reducing the competitiveness of riceproducers in Uttar Dinajpur. Although the ultimate solution will be offered by the Tista Barrage Project[TBP], which has the potential of irrigating a command of 1.94 lakh ha of agricultural land in Uttar Dinajpurthrough inexpensive surface-based irrigation technologies when its first substage is complete, the tardyprogress made by TBP means that this event lies far in the distant future. Until then, multicrop agriculturein the district will not reach its full potential. A strong case, therefore, exists for accelerating theimplementation of TBP in Uttar Dinajpur, especially since the project has now been reclassified as aproject of national importance and is thus eligible to secure enhanced funding commitments from theUnion Government.
The Dinajpur region has traditionally been known for cultivating a large variety of indigenous aromatic ricestrains, of which the Tulaipanji variety is native to the Raiganj region. Another variety which is now nearlyextinct is the Joshoa rice strain still grown in isolated pockets of Karandighi. Most other local rice varietieshave now been eclipsed by modern rice hybrids, which have a shorter production cycle and guaranteehigher grain yields. Nevertheless, a serious initiative needs to be mounted for preserving the indigenousrice strains that are still cultivated in pockets by marginal and small farmers in Uttar Dinajpur, many ofwhich can be grown with minimal application of inputs in adverse weather conditions. Considerableresearch is being done in neighbouring Bangladesh in conserving the traditional varieties of Bengal rice. Asimilar effort can be initiated in Uttar Dinajpur to protect the agro biodiversity of indigenous rice varieties,which represent the accumulated bio-capital of the region's farmers.
Livestock-based livelihood activities, involving the rearing of cattle, goats and backyard poultry, have along tradition in Uttar Dinajpur. Several parts of the district produce a milk surplus, which can be enhancedfurther through breed improvement and fodder cultivation. Goatery projects have been encouraged acrossthe district, as a result of which the Islampur region now meets a considerable part of the meat demandfrom Siliguri. Establishment of a tannery unit near Islampur would allow the processing of hides sourcedfrom across the surrounding region, eventually forming a base for leathercrafts in the district.
Except for areas within Chopra block where small-grower tea plantations have been established in largenumbers, agricultural diversification in Uttar Dinajpur has so far been slow, because of the dominance ofrice cultivation. The Panjipara area under Islampur SD and the Birghai area under Raiganj SD producesubstantial amounts of horticultural crops. However, because of the lack of cold storages, alternativecropping patterns have yet to take firm root in the district, minimising the year-round opportunities forwage-work available to agricultural labourers and lowering effective wage-rates and earnings. During theseason of agricultural slack, a pronounced tendency has thus developed for male agricultural workers toseek casual employment opportunities by migrating to other states and districts. This nevertheless has thesocial downside of destabilising rural families and forcing an increasing number of women to carry thedual responsibility of looking after their families while seeking out locally available work. Return migrationby these male workers also compounds the transmission of communicable diseases, besides greatly increasingthe transmission risks of HIV/AIDS in the district.
Human Development Report 2010
368
With substantial migration of young male workers outside the district now taking place, a critical gap couldconceivably appear in the rural labour market within Uttar Dinajpur at certain times during the year.However the overall impact of labour outmigration has been lessened so far by informal inflows ofagricultural workers from adjacent areas in Bangladesh and Bihar during the peak agricultural season. Asevident in border regions like Hemtabad and Goalpokhar-1 blocks and the Bhatun region of Raiganj block,most of these workers usually enter the district on labour contract and leave after the peak season is over,and do not settle permanently in the receiving regions on a long-term basis. However, since they encouragethe long-term labour outflow from Uttar Dinajpur by depressing agricultural wage-levels and increasingthe wage-differentials with other regions, their movement ultimately has a major impact on rural labourprofiles within the district. This phenomenon has become particularly severe along the border villages ofIslampur SD, where unskilled boys as young as 13-14 years often quit school with the aim of joining themigrant labourforce that regularly finds work outside the district. As they leave Uttar Dinajpur in thecompany of the older family males who had migrated before them, the pattern is reinforced, leading to lowskill-acquisition and the general absence of thrift and enterprise among the rural population.
Although Uttar Dinajpur is located along a principal highway axis and is well connected with Siliguri,adjoining Bihar and Kolkata, the dearth of medium and large industry in the district currently restricts thescope for alternative non-farm employment. High levels of rural poverty across the region also inhibit thegrowth of local markets, even though substantial scope exists for extending small-scale industry in thedistrict because of the prevalence of low wage-costs. Paradoxically, the state-sector West Dinajpur SpinningMills Ltd. established in 1975 as a major public sector unit to feed the traditionally strong handloomindustry in the undivided district is now up for privatisation, because of its inability to competitively marketits yarn even after its recent modernisation. Given the proximity of the spinning mill to the highly skilledartisanal weavers of the adjacent Gangarampur region in Dakshin Dinajpur, Uttar Dinajpur could stillemerge as the future regional hub for an integrated textile complex located in North Bengal. However,revival of the traditional handloom weaving industry in the region would also depend to a considerableextent on new design inputs that can enhance the marketability of the local handloom products.
Several other artisanal trades are practised within the district, including the manufacture of fine potteryarticles, folk musical instruments and dhokra, sola, bamboo and woodcrafts. Many of these trades havetheir origin in the antiquity of the Dinajpur region and are traditionally practised among the STs as well asthe SC artisanal groups. Because of its proximity to forests, Chakulia was once a major centre for theturning of high-quality wooden wheels & axles for bullock-carts - a tradition that is now on the verge ofdying out. Kunore is still a major centre for the production of dhokra craft, while Kaliaganj has a traditionalbase of pottery manufacture. However, in the absence of technical and institutional support, the market forartisanal products has dwindled considerably, while the rural population has now gained access to newindustrial substitutes. The decline of artisanal trades threatens scores of craftsmen in Uttar Dinajpur withthe loss of their traditional skills and livelihoods, reducing them ultimately to the ranks of unskilled agriculturallabourers.
Although no organised effort has been made in the district so far to resuscitate traditional artisanal handicrafts,sufficient scope exists to expand their linkage with major urban markets, by showcasing their products andpromoting them through major national and regional crafts councils. An initial experiment at reviving andsustaining dhokra craft is currently underway at Anantapur GP in Kaliaganj block, with advanced trainingbeing imparted to the artisans by craft experts from Santiniketan. However, for this initiative to realise itsfull commercial potential, an integrated effort at crafts revival needs to be launched across the entire district,under the direction of established crafts consultants, to identify potential producing centres and upgraderaw material supply-chains, product designs, equipment and manufacturing skills, invoking technical inputs
Uttar Dinajpur
369
wherever necessary in order to increase production volumes. In pockets where artisan families live in largeclusters, such as the potter colonies in Kaliaganj, technical inputs like electric kilns can increase the efficiencyof the artisanal production process, while also permitting the diversification of products to include higherceramic grades like glazed pottery and stoneware. Comprehensive interventions of this kind have alreadyrevived many traditional handicrafts in other parts of India, and with major tourism centres like the Dooarsand Darjeeling situated close by, there is no reason why similar efforts would not succeed in Uttar Dinajpur.
E: Improvement in Gender Security
Increasing male migration from several rural regions within Uttar Dinajpur has generally had a beneficialimpact on female work participation, leading to the growing economic engagement of women in thedistrict. Nevertheless, since main work opportunities for women tend to be sparse, most women workersare primarily engaged in marginal work and are therefore unable to attain their full earning potential. Newwork opportunities for women in the district have also been created through the extension of the beedibinding activity and via the SHG movement. With high prevalence of rural poverty in Uttar Dinajpur,increased economic engagement of women merely eases the pressure on household incomes, rather thanleading to a material change in women's economic status. In terms of social privilege, both rural and urbanwomen in the district remain at a considerable distance from their male counterparts, evidence of whichexists in the frequent incidence of crimes against women.
Because of the long borders of the district and constant movement between them, women in Uttar Dinajpurundergo separate personal security risks, with a significant number going missing every year. Cases oftrafficking in women are often detected along the Uttar Dinajpur-Bihar border, involving women traffickedfrom other regions who are in transit through the district, as well as women locally trafficked from withinUttar Dinajpur. The routing of major National Highways through the district leads to the heavy movementof truckers, and a large number of roadside eateries that double up as redlight establishments after darkhave sprung up overnight at the truckers' halts. Because of promiscuity, the truckers are also identified as ahigh-risk group in the transmission of STIs and HIV/AIDS. No rescue home has been established as yet fortrafficked women in Uttar Dinajpur, making it difficult for rescuers to provide personal security to thetrafficking victims. Since the proximity of borders offers a convenient getaway to the traffickers, many morecases go undetected. As a result, trafficking in women and children through Uttar Dinajpur has nowreached the dimensions of a major criminal racket. Largescale movement of trucks through the districtmakes it easy for the racketeers to move their victims into other states. With the constant outflow and returnof male migrants from the district, social vigilance is low, making it especially difficult to trace and apprehendthe traffickers and their agents, who therefore operate with impunity in the border regions.
In view of such preconditioning factors, the trafficking of women and children for labour bondage andother immoral purposes poses a major crime risk in Uttar Dinajpur district. From an analysis of recenttrafficking records, the common modus operandi is for returning migrants to bring back certain 'friends',who then contract false marriages with poor rural girls in connivance with some of their relatives, who arepaid a handsome amount of money in return for such services. Hence, a system of preventive vigilanceneeds to be institutionalised in the border areas of Uttar Dinajpur, under which the local panchayat canmaintain a marriage register and a migration register, thus allowing public verification of the antecedents ofthe outside parties that seek to contract a marriage with a local girl, and enabling the police authorities tobe alerted in case suspicions arise. Activisation of women's Self-Help Groups in the villages offers anothereffective means of increasing social vigilance, since cases have already occurred where fraudulent marriageshave been halted in time, because of the alertness of the SHGs. Women's SHGs can also offer peer supportto the intended victims, in cases where the victim's family is a party to the crime.