Molecular and biological characterization of a new Brazilian begomovirus, euphorbia yellow mosaic...
8
haematologica/the hematology journal | 2005; 90(11) | 1541 | Donata Verdelli Michela Mattioli Sonia Fabris Lucia Nobili Daniela Intini Silvana Guerneri Katia Todoerti Alberto Zanella Giorgio Lambertenghi Deliliers Luigia Lombardi Antonino Neri Molecular and biological characterization of three novel interleukin-6-dependent human myeloma cell lines M ultiple myeloma is a malignant proliferation of bone marrow plasma cells characterized by marked genomic instability, highly hetero- geneous genetic lesions, and a varied clini- cal course. 1,2 The survival and proliferation of normal and malignant plasma cells strictly depend on a complex interaction with the bone marrow microenvironment mediated by adhesion molecules and the production of several cytokines, particular- ly interleukin-6 (IL-6). 3 Over the years, established human myeloma cell lines (HMCL) have significantly contributed to the investigation of the biological aspects of multiple myeloma, such as the produc- tion of and response to growth factors, the involvement in angiogenic processes, and the resistance to chemotherapeutic agents. 4 A number of chromosome translocations affecting the immunoglobulin loci in plas- ma cell dyscrasias have been identified by means of the molecular analysis of HMCL; particularly, the t(11;14)(q13;q32), t(4;14) (p16.3;q32), t(6;14)(p21.1;q32), t(14;16) (q32;q23), t(14;20)(q32;q11) and t(8;14) (q24;q32), which lead to the deregulation of their respective target genes CCND1, FGFR3 and MMSET, CCND3, MAF, MAFB, and MYC. 5 In this respect, it is conceivable that large HMCL panels reflecting the het- erogeneity of the disease may improve our understanding of the pathogenetic events and clinical progression of multiple myelo- ma, and may help to identify specific ther- apeutic targets. The slow growth rate of plasma cells, the need for specific growth factors critical for the development of multiple myeloma in vivo, and the overgrowth of Epstein-Barr virus (EBV)-infected B-lymphoblastoid cells possibly present in the original sam- ples are all limiting factors when establish- ing HMCL. Most HMCL have been From the U.O. Ematologia 2, Ospedale Maggiore IRCCS, Milan, Italy (DV, MM, SF, DI, KT, AZ, LL, AN); U.O. Ematologia 1 - Centro Trapianti Midollo, Dipartimento di Scienze Mediche, Università degli Studi di Milano, Milan, Italy (LN, GLD, AN); Laboratorio di Genetica Medica, Istituti Clinici di Perfezionamento, Milan, Italy (SG). Correspondence: Antonino Neri, MD, U.O. Ematologia 2, Dipartimento Scienze Mediche, Università di Milano,Ospedale Maggiore di Milano, IRCCS, via Francesco Sforza 35,20122 Milano, Italy. E-mail: [email protected] Background and Objectives. Established human myeloma cell lines (HMCL) have sig- nificantly contributed to the investigation of the biological aspects of multiple myelo- ma. Our study reports the molecular and biological characterization of three novel inter- leukin-6 (IL-6)-dependent HMCL (CMA-01, CMA-02, CMA-03) established from the malignant plasma cells of myeloma patients with extramedullary disease. Design and Methods. The immunophenotype, cell growth characteristics, IL-6 pathway, chromosomal alterations and gene expression profiles of the three HMCL were inves- tigated. Results. The plasma cell origin of the three Epstein-Barr virus-negative HMCL was con- firmed by immunophenotypic analysis. Cytogenetic and fluorescence in situ hybridiza- tion analyses revealed the presence of complex karyotypes with many numerical and structural chromosomal abnormalities. All three HMCL are positive for the t(8;14); CMA-01 and CMA-02 showed t(11;14) and t(14;16) translocations, respectively. The three HMCL grow slowly at a relatively low saturation density and depend on exoge- nous IL-6 for their survival and proliferation. The comparison of the gene expression profiles of the three HMCL versus those of the purified tumor plasma cells from which the cell lines were derived identified a set of differentially expressed genes mainly involved in the cell proliferation pathway. Interpretations and Conclusions. Extensively characterized large HMCL panels that reflect the heterogeneity of the disease may improve our understanding of the patho- genetic events and clinical progression of multiple myeloma. Key words: multiple myeloma; human myeloma cell lines; IL-6-dependent cell lines Haematologica 2005; 90:1541-1548 ©2005 Ferrata Storti Foundation Multiple Myeloma • Research Paper
-
Upload
independent -
Category
Documents
-
view
1 -
download
0
Transcript of Molecular and biological characterization of a new Brazilian begomovirus, euphorbia yellow mosaic...
haematologica/the hematology journal | 2005; 90(11) | 1541 |
Donata VerdelliMichela MattioliSonia FabrisLucia NobiliDaniela IntiniSilvana GuerneriKatia TodoertiAlberto ZanellaGiorgio Lambertenghi DeliliersLuigia LombardiAntonino Neri
Molecular and biological characterization of threenovel interleukin-6-dependent human myeloma celllines
Multiple myeloma is a malignantproliferation of bone marrowplasma cells characterized by
marked genomic instability, highly hetero-geneous genetic lesions, and a varied clini-cal course.1,2 The survival and proliferationof normal and malignant plasma cellsstrictly depend on a complex interactionwith the bone marrow microenvironmentmediated by adhesion molecules and theproduction of several cytokines, particular-ly interleukin-6 (IL-6).3 Over the years,established human myeloma cell lines(HMCL) have significantly contributed tothe investigation of the biological aspectsof multiple myeloma, such as the produc-tion of and response to growth factors, theinvolvement in angiogenic processes, andthe resistance to chemotherapeutic agents.4
A number of chromosome translocationsaffecting the immunoglobulin loci in plas-ma cell dyscrasias have been identified by
means of the molecular analysis of HMCL;particularly, the t(11;14)(q13;q32), t(4;14)(p16.3;q32), t(6;14)(p21.1;q32), t(14;16)(q32;q23), t(14;20)(q32;q11) and t(8;14)(q24;q32), which lead to the deregulation oftheir respective target genes CCND1,FGFR3 and MMSET, CCND3, MAF, MAFB,and MYC.5 In this respect, it is conceivablethat large HMCL panels reflecting the het-erogeneity of the disease may improve ourunderstanding of the pathogenetic eventsand clinical progression of multiple myelo-ma, and may help to identify specific ther-apeutic targets.
The slow growth rate of plasma cells,the need for specific growth factors criticalfor the development of multiple myelomain vivo, and the overgrowth of Epstein-Barrvirus (EBV)-infected B-lymphoblastoidcells possibly present in the original sam-ples are all limiting factors when establish-ing HMCL. Most HMCL have been
From the U.O. Ematologia 2,Ospedale Maggiore IRCCS, Milan,Italy (DV, MM, SF, DI, KT, AZ, LL,AN); U.O. Ematologia 1 - CentroTrapianti Midollo, Dipartimento diScienze Mediche, Università degliStudi di Milano, Milan, Italy (LN,GLD, AN); Laboratorio di GeneticaMedica, Istituti Clinici diPerfezionamento, Milan, Italy (SG).
Correspondence: Antonino Neri, MD, U.O. Ematologia2, Dipartimento Scienze Mediche,Università di Milano,OspedaleMaggiore di Milano, IRCCS,via Francesco Sforza 35,20122Milano, Italy.E-mail: [email protected]
Background and Objectives. Established human myeloma cell lines (HMCL) have sig-nificantly contributed to the investigation of the biological aspects of multiple myelo-ma. Our study reports the molecular and biological characterization of three novel inter-leukin-6 (IL-6)-dependent HMCL (CMA-01, CMA-02, CMA-03) established from themalignant plasma cells of myeloma patients with extramedullary disease.
Design and Methods. The immunophenotype, cell growth characteristics, IL-6 pathway,chromosomal alterations and gene expression profiles of the three HMCL were inves-tigated.
Results. The plasma cell origin of the three Epstein-Barr virus-negative HMCL was con-firmed by immunophenotypic analysis. Cytogenetic and fluorescence in situ hybridiza-tion analyses revealed the presence of complex karyotypes with many numerical andstructural chromosomal abnormalities. All three HMCL are positive for the t(8;14);CMA-01 and CMA-02 showed t(11;14) and t(14;16) translocations, respectively. Thethree HMCL grow slowly at a relatively low saturation density and depend on exoge-nous IL-6 for their survival and proliferation. The comparison of the gene expressionprofiles of the three HMCL versus those of the purified tumor plasma cells from whichthe cell lines were derived identified a set of differentially expressed genes mainlyinvolved in the cell proliferation pathway.
Interpretations and Conclusions. Extensively characterized large HMCL panels thatreflect the heterogeneity of the disease may improve our understanding of the patho-genetic events and clinical progression of multiple myeloma.
Key words: multiple myeloma; human myeloma cell lines; IL-6-dependent cell lines
Haematologica 2005; 90:1541-1548
©2005 Ferrata Storti Foundation
Multiple Myeloma • Research Paper
| 1542 | haematologica/the hematology journal | 2005; 90(11)
D. Verdelli et al.
derived from malignant plasma cells taken during theextramedullary phase of the disease, when such cellsare generally characterized by highly proliferativeactivity. The majority of HMCL are responsive to var-ious cytokines, but they often become independent ofspecific growth factors (particularly IL-6) because ofthe selection of subclones characterized by an intra-cellular autocrine IL-6 loop.4
We report here the establishment of three novelHMCL (CMA-01, CMA-02 and CMA-03) derivedfrom peripheral blood or peritoneal effusion plas-mablasts of myeloma patients with extramedullarydisease and a short survival. The cell lines are IL-6-dependent and therefore represent a suitable modelfor studies concerning various aspects of the biologyof multiple myeloma, particularly the pathwaysinvolved in cytokine responses.
Design and Methods
Patients’ characteristicsThe CMA-01, CMA-02 and CMA-03 HMCL were
established in vitro from plasmablasts isolated afterobtaining informed consent from patients admitted toour Hematology Service: CMA-01 and CMA-02 werederived from peripheral blood plasmablasts of patientswith plasma cell leukemia, and CMA-03 from a peri-toneal effusion of a patient with refractory myeloma.Table 1 shows the clinical parameters of the patientsfrom whom the plasma cells were isolated.
Establishment and culture of the CMA-01, CMA-02,CMA-03 cell lines
Mononuclear cells (60-90% plasmablasts) fromperipheral blood (CMA-01 and CMA-02) or peri-toneal effusion (CMA-03) were cultured in Iscove’s
modified Dulbecco’s medium supplemented with10% fetal calf serum and 20 U/mL recombinanthuman IL-6 (R&D System, Minneapolis, MN, USA) ata concentration of 5¥105/mL in 24-well plates, andincubated at 37°C in a 5% CO2 humidified atmos-phere.
The cells were fed twice weekly by partially replac-ing the medium and adding fresh IL-6. The cells start-ed growing after 3-6 weeks of culture and they arestill maintained under the same culture conditions.Mycoplasma contamination was excluded using theMycoAlert kit (Cambrex Bioscience, Rockland Inc,Rockland, ME, USA). EBV infection was investigatedby polymerase chain reaction (PCR) using EBVnuclear antigen-1 specific primers (forward 5’-AAG-GAGGGTGGTTTGGAAAG-3’; reverse 5’-AGA-CAATGGACTCCCTTAGC-3’). The control HMCL,KMS12, was cultured under the same conditionswithout IL-6.
Immunophenotype analysis Immunophenotypic characterization of the cell
lines was performed using the following panel ofmonoclonal antibodies: CD45, CD38, CD56, CD126,CD20, CD19 (Becton Dickinson, San Josè, CA, USA)and CD138 (IQ Products, Groningen, TheNetherlands). The monoclonal antibodies were used intriple staining, with CD138 being included in all of thecombinations in order to identify plasma cells.Irrelevant isotype-matched mouse immunoglobulinswere used as negative controls. Fluoroscein isothio-cyanate-conjugated rabbit anti-human sera specific forsurface or cytoplasmic immunoglobulins were pur-chased from DAKO (Glostrup, Denmark); fluorosceinisothiocyanate-conjugated rabbit immunoglobulinswere used as negative controls. Cell reactivity to thedifferent antibodies was analyzed on a FACSCaliburflow cytometer (Becton Dickinson) using the PAINT-A-GATE-PRO software program (Becton Dickinson). Anantigen was considered positive when at least 10% ofthe plasma cells displayed reactivity for this marker.
Expression analysis of interleukin-6 receptoraa (IL-6Raa))The reverse transcriptase-PCR analysis of IL-6Ra
was performed in accordance with a protocol previ-ously described.6 The protocol used for the quantita-tive real-time PCR (Q-RT-PCR) has also been pub-lished elsewhere.7 Human IL6R and endogenous con-trol GAPDH were respectively analysed using assay-on-demand and pre-developed assay reagents(PDAR), (Applied Biosystems, Foster, CA, USA). Thenumber of IL6R transcripts in each sample was calcu-lated from a standard curve relative to the U266 cellline, and the results were expressed as the ratiobetween IL6R RNA (ng) and GAPDH RNA (ng). Allthe determinations were made in triplicate. The con-
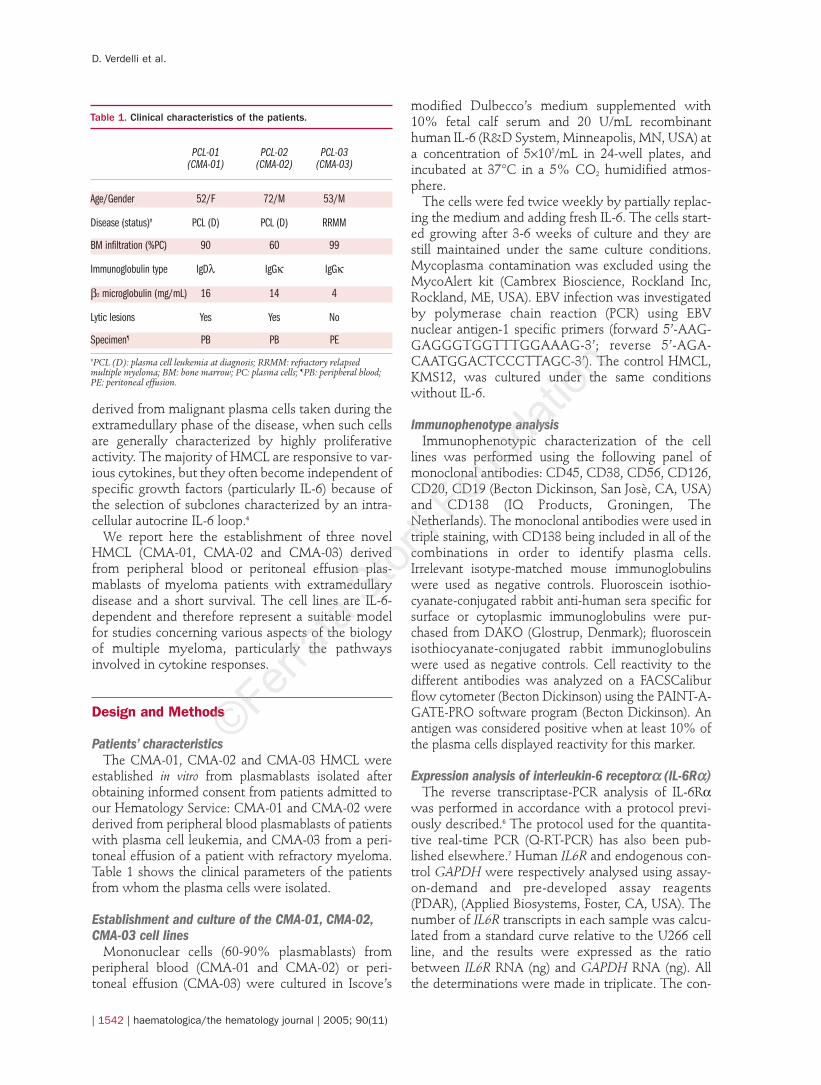
Table 1. Clinical characteristics of the patients.
PCL-01 PCL-02 PCL-03(CMA-01) (CMA-02) (CMA-03)
Age/Gender 52/F 72/M 53/M
Disease (status)# PCL (D) PCL (D) RRMM
BM infiltration (%PC) 90 60 99
Immunoglobulin type IgDl IgGk IgGk
b2 microglobulin (mg/mL) 16 14 4
Lytic lesions Yes Yes No
Specimen¶ PB PB PE
#PCL (D): plasma cell leukemia at diagnosis; RRMM: refractory relapsedmultiple myeloma; BM: bone marrow; PC: plasma cells; ¶PB: peripheral blood;PE: peritoneal effusion.
centration of IL-6Ra in the cell culture supernatantswas determined using a sandwich ELISA (R&DSystem, Minneapolis, MN, USA) according to themanufacturer’s instructions. The sensitivity of the testwas 6.5 pg/mL. The supernatants from the positive(OPM-2) and negative control (Jurkat and SKMM1)cell lines selected on the basis of Q-RT-PCR analysiswere also analyzed.
Cytogenetic and fluorescence in situ hybridization(FISH) analyses
The cells were treated with colcemid (0.1 mg/mL)for 90 minutes, harvested using hypotonic potassiumchloride, fixed with methanol/glacial acetic acid (3:1v/v), and stored at –20°C. The chromosome prepara-tions were made according to the conventionalmethod, analyzed by Q-banding, and karyotypedaccording to the ISCN recommendations (1995). TheFISH analyses were performed to investigate the pres-ence of the most frequent translocations found in mul-tiple myeloma, t(11;14)(q13;q32.3), t(4;14) (p16.3;q32.3), t(16;14)(q23;q32.3), t(6;14)(p21.1;q32.3), t(8;14)(q24;q32.3) and t(14;20)(q32;q11), as well as chromo-some 13q14 deletion. All of the probes used to detectthe chromosomal translocations have been previouslydescribed.8,9 The 13q14 deletions were detected usingtwo BAC clones selected from the UCSC Genome:320G21 located centromerically to the RB gene, and34F20 located within the minimal deleted region.10
Preparation of the probes, hybridization of the slidesand the FISH analyses were performed as previouslydescribed.8
Cell growth analysisThe cells were seeded in triplicate at a concentra-
tion of 2¥105/mL in 96-well plates, and counted daily;the medium was partially replaced every other day,and the population doubling time was determinedfrom the growth curve of exponentially proliferatingcells. In order to investigate the effect of IL-6 on cellgrowth, after two washes in medium without IL-6the cells were seeded in triplicate at a concentration of2¥104cells/well in 96-well plates, and different con-centrations of IL-6 were added. Cell proliferation wasevaluated at different times of culture by means of theCell Proliferation Reagent WST-1 kit (Roche,Indianapolis, IN, USA) following the manufacturer’sinstructions. Cloning efficiency was assayed using thesoft-agar assay: briefly, the cells were plated in tripli-cate into 35-mm agar plates containing Iscove’s mod-ified Dulbecco’s medium, 20% fetal calf serum, 20U/mL IL-6 and 0.5% purified agar and the colonieswere scored after two weeks of incubation at 37°C,5% CO2.
DNA content analysisCytofluorimetric analysis of DNA distribution of
the three exponentially growing myeloma cell lineswas performed by means of propidium iodide stain-ing. Briefly, 106 cells (previously fixed in 70% ethanol)were incubated in staining solution (propidium iodide20 mg/mL, RNAse 0.5 mg/mL, Nonidet P-40 0.05%) atroom temperature in the dark. The measurementswere made after 1 h using a FACSCalibur flow cyto-meter (Becton Dickinson). The DNA cell cycle analy-ses were performed using the MODFIT software(Verity Software House, Topshem, ME, USA). TheDNA index (DI) was calculated as the ratio of themodal channel of the G0-G1 peaks obtained for the cellline and a reference sample (peripheral bloodmononuclear cells from a normal donor).
Gene expression profiling analysisPlasma cells were purified from peripheral blood or
peritoneal effusion using CD138 immunomagneticmicrobeads as previously described.11 Total RNA wasextracted from the CMA-01, CMA-02 and CMA-03 celllines, and from purified (>90%) CD138+ tumorplasmacells, using the TRIzol® reagent (InVitrogen, Carlsbad,CA, USA), and biotin-labeled cRNA was generated aspreviously reported.11 In accordance with theAffymetrix protocol, 15 mg of fragmented cRNA werehybridized to U133A Probe Arrays (Affymetrix Inc.,Santa Clara, CA, USA). After scanning, the imageswere processed using AffymetrixTM MicroArray Suite(MAS) 5.0 and the gene expression values were deter-mined using the global scaling option, which allows anumber of experiments to be normalized to one targetintensity (i.e. 100) and thus compared. The data wereanalyzed using the previously described Genes@Worksoftware, a gene expression analysis tool based on thepattern discovery algorithm Structural PatternLocalization Analysis by Sequential Histograms(SPLASH).11,12 Briefly, Genes@Work discovers globalgene expression signatures that are common to an entireset of at least n experiments (the support set), where n isa user-selectable parameter called the minimum support.Differentially expressed genes are identified by compar-ing an expected gene expression probability density p(e)empirically computed from the experimental set with apredefined threshold (parameter d). The patterns of dif-ferentially expressed genes are then ranked according totheir statistical significance (z-score).
Results
The three cell lines were established from bulk cellpopulations; the time necessary for their establish-ment was two months for CMA-01 and CMA-03,and one month for CMA-02. The cell lines were char-acterized at early culture passages.
Characterization of three novel myeloma cell lines
haematologica/the hematology journal | 2005; 90(11) | 1543 |

| 1544 | haematologica/the hematology journal | 2005; 90(11)
D. Verdelli et al.
Morphological and immunophenotypic features Morphological analysis of the three cell lines showed
large cells with the characteristics of immature plas-mablasts with one or more nucleoli. Abnormal plas-mablasts with two or three nuclei and mitosis werealso observed, particularly in CMA-02 (data not shown).
The immunophenotype characterization of the threecell lines is shown in Table 2. The cell lines showedhigh reactivity for the plasma cell-specific markers(CD38 bright, CD138). CMA-02 and CMA-03 werepositive for CD45, an antigen whose expressiondeclines during normal plasma cell differentiation andwhose absence is considered to be a poor prognosticfactor in multiple myeloma.13 The CD19 and CD20 B-cell antigens were only expressed on CMA-01 cells: theexpression of CD20 (normally absent on plasma cells)may have prognostic value as it is related to advancedstages of the disease and a poor prognosis.14 All threecell lines expressed the same immunoglobulin typedetected in the patients’ plasma cells, not only in thecytoplasm but also on the surface membrane; thisexpression also appears to be related to more aggressivedisease.15 The adhesion molecule CD56, which is fre-quently expressed in multiple myeloma but not in nor-mal plasma cells and is generally lost duringextramedullary disease dissemination,16 was present intwo of the cell lines. CMA-01 expressed CD117 (c-KIT), a class III tyrosine kinase receptor not expressedby normal plasma cells, whose presence in about 30%of multiple myeloma patients makes it a tumor-associat-ed marker.17 Finally, significant levels of CD126, the IL-6receptor a (IL6-Ra), were detected only in CMA-01,whereas it was almost undetectable (<10% of cells) in
CMA-02 and CMA-03. However, appreciable levels ofspecific IL-6Ra transcripts were found by reverse tran-scriptase-PCR (Figure 1A) and Q-RT-PCR (Figure 1B). Inparticular, reverse transcriptase-PCR showed the pres-ence of two transcripts corresponding to the membrane(398 bp fragment) and the alternatively spliced solubleform of IL-6Ra (sIL-6Ra, 304 bp fragment).
To confirm this finding, and test the possibility thatthe IL-6 signaling could be mediated by the binding ofthe cytokine to sIL-6Ra, as found in other HMCL andplasma cells from myeloma patients,18 we used ELISAto determine the release of IL-6Ra in cell supernatantsafter 48 hours of incubation. As shown in Figure 1C,all of the cell lines produced appreciable levels of sIL-6Ra. As sIL-6Ra acts as an agonist capable of potenti-ating IL-6 activity, our results suggest that thecytokine signaling is at least partially mediated by this
Table 2. Immunophenotypic, cytogenetic and FISH analysis of theCMA-01, CMA-02 and CMA-03 cell lines.
Characteristic CMA-01 CMA-02 CMA-03
Cell surface markers (% positive cells)CD38 bright 70 80 99CD138 99 80 88CD138/45 Neg 55 99CD138/56 60 80 NegCD138/126 63 <10 <10CD138/20 66 Neg NegCD138/19 59 Neg NegCD138/117 70 Neg Neg
Surface membrane Ig IgDl IgGk IgGk
Cytoplasm Ig IgDl IgGk IgGk
Cytogenetic analysis hypotetraploidy hypotetraploidy hypotetraploidy
FISH analysis t(8;14) t(8;14) t(8;14)t(11;14) t(14;16) t(20;unknown)
Ig: immunoglobulin.
A
B
C
Figure 1. IL-6Raa expression in the CMA-01, CMA-02 and CMA-03cell lines. (A) reverse transcriptase PCR analysis: the 398 bp and304 bp fragments corresponding to membrane IL-6Raa and thealternatively spliced IL-6Raa mRNA are shown. (B) Q-RT-PCR analy-sis of IL-6Raa. (C) sIL-6Raa release by the CMA-01, CMA-02 andCMA-03 cell lines; comparison with OPM2 (positive control) andSKMM1 and Jurkat (negative controls) cells.
- 398- 304310 -
271 -234 -194 -118 -
281
875 - 603 -
F¥ CMA-
01
CMA-
02
CMA-
03
OPM
-2
SKM
M1
Jurk
at
CMA-01 CMA-02 CMA-03 OPM-2 SKMM1 Jurkat
CMA-01 CMA-02 CMA-03 OPM-2 SKMM1 Jurkat
IL-6
Raa /
GAPD
HsI
L-6
Raa(p
g/m
L)
0.8
0.6
0.4
0.2
0
2000
1500
1000
500
0

Characterization of three novel myeloma cell lines
haematologica/the hematology journal | 2005; 90(11) | 1545 |
mechanism in our cell lines.PCR analysis did not detect EBV DNA sequences in
any of the cell lines (data not shown), thus indicatingthe absence of EBV-immortalized lymphoblastoidcells in the cultures; this result is particularly relevantin CMA-01 cells, which express CD19.
Cytogenetic and FISH analysesConventional cytogenetic analysis of the CMA-01,
CMA-02 and CMA-03 cells detected hypotetraploidcomplex karyotypes and structural alterations (Table 2).The involvement of chromosome 1 in complexrearrangements was observed in all the cell lines,19 anda t(1;11) translocation was identified in the CMA-03. Inaddition, we detected the t(11;14) translocation andduplication of the long arm of chromosome 4 in CMA-01, two copies of chromosome 12q+ in CMA-02, andone copy of chromosome 9p- in CMA-03. The kary-otypes of CMA-02 and CMA-03 were comparablewith those of the primary tumor cells, confirming thefidelity of the cell lines with the original samples.Unfortunately, the karyotype of the original plasmacells from which CMA-01 was derived was not avail-able. In order to characterize the chromosome alter-ations in these cell lines better, we used FISH analysesto evaluate the presence of the main translocationsidentified so far in multiple myeloma, and the evidenceof the chromosome 13q14 deletion. As shown in Table2, all three cell lines were positive for the t(8;14) translo-cation involving the MYC locus which, in all cases, wasthe result of a complex chromosomal rearrangementwith different extra MYC and IGH signals (data notshown). The classical t(11;14) translocation involving theCCND1 locus was found in CMA-01, thus confirmingthe cytogenetic results. We also observed two extraCCND1 locus signals on an apparently normal chromo-some 11 and an unidentified marker. CMA-02 showeda t(14;16) translocation involving the MAF locus, andfour different co-localized signals were detected on twoputative der(14) and two unidentified chromosomes.
Furthermore, we detected various extra-signals ofprobes specific for the MAF or IGH locus (data notshown). The CMA-03 cell line showed a complex pat-tern of signals involving the MAFB locus on two puta-tive chromosomes 20, two der(20) and an unidentifiedmarker without the involvement of any immunoglobu-lin loci. Finally, none of the cell lines showed the 13q14deletion, while the detection of 3-4 copies of chromo-some 13 was in line with their hypotetraploid status.These findings confirmed the presence of many numer-ical and structural chromosomal abnormalities in theHMCL, which thus reflect the high genomic instabilitycharacteristic of multiple myeloma.
Growth characteristicsThe proliferation patterns of the three cell lines were
characterized by analyzing their growth curves, IL-6dependency and cloning efficiency. The cell lines growin suspension as single cells or small clusters. As shownin Figure 2A, the doubling times of CMA-01, CMA-02and CMA-03 were respectively 90, 110 and 80 hours(slower than that of the control KMS12 cells). As fre-quently found in recently established HMCL, the cellsreach a relative low saturation cell density (8¥105/mL),while KMS12 control cells grow to high saturation den-sity (2¥106 cells/mL). Cytofluorimetric analysis of DNAdistribution in exponentially proliferating cells con-firmed the proliferating pattern of the cell lines (Figure2B). All three cell lines grow in soft agar, albeit with alow level of cloning efficiency (0.5-1%) (data not shown).In order to confirm the IL-6 dependency of the threecell lines after their establishment in culture, we ana-lyzed the metabolic activity of viable cells in theabsence or presence of different IL-6 concentrations. Asshown in Figures 3A and 3B, the cytokine is essentialfor CMA-01, CMA-02 and CMA-03 proliferation:CMA-03 cannot grow without the supplementation ofIL-6, and the rate of growth of CMA-01 and CMA-02 isvery slow in its absence. This may be due to the pres-ence of cell sub-clones that do not depend on IL-6 pro-
Figure 2. Proliferation characteris-tics of the CMA-01, CMA-02 andCMA-03 cell lines; the KMS12 cellline was analyzed as a control. (A)Growth curve. (B) Flow cytometricDNA analysis of log phase growingcells. The DNA index (DI) representsthe ratio of the modal channel ofthe G0-G1 peak of the cell line and adiploid control sample.
0 2 4 6 8 10days
1000
010
0010
0
N. o
f via
ble
cells
(¥¥10
3 )A B
KMS12CMA-01CMA-02CMA-03
KMS12G0-G1: 52.39%G2-M: 3.65%S: 43.69%DI: 1.62%
CMA-01G0-G1: 77.83%G2-M: 11.19%S: 10.98%DI: 2.08%
CMA-02G0-G1: 59.53%G2-M: 13.34%S: 27.13%DI: 1.80%
CMA-03G0-G1: 52.05%G2-M: 1.57%S: 46.38%DI: 1.75%
0 200 400 600 800 1000
0 200 400 600 800 1000 0 200 400 600 800 1000
012
024
036
048
060
00
6012
018
024
030
0
060
120
180
240
300
012
024
036
048
060
0
0 200 400 600 800 1000FL2-H
FL2-H FL2-H
FL2-H
Coun
tsCo
unts
Coun
tsCo
unts
| 1546 | haematologica/the hematology journal | 2005; 90(11)
D. Verdelli et al.
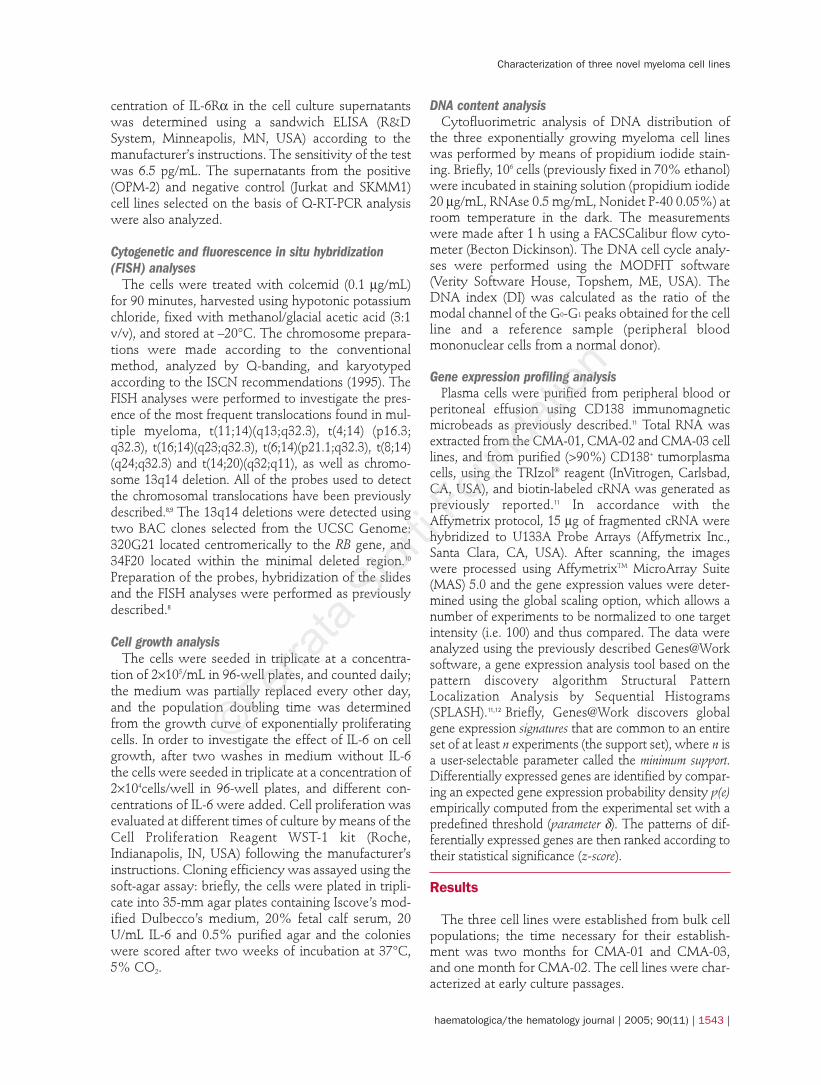
liferating activity but, as we failed to isolate them bygrowing the cells without IL-6 for 2-3 weeks, it is prob-able that they are poorly represented in our cell popu-lations or that IL-6 requirement is only partially over-come. In order to investigate whether IL-6 acts on theproliferation rate and/or as a survival factor, we ana-lyzed cell cycle status by evaluating DNA content inthe CMA-03 cell line in the presence or absence of thegrowth factor. As shown in Figure 3C, a proportion ofcells in the S phase was found in the presence of IL-6after 48 hours, thus suggesting that the cytokine pro-motes cell proliferation. The moderate increase of pre-G0-G1 rate in the absence of IL-6 is possibly related tothe presence of apoptotic cells, thus suggesting that inour cell lines IL-6 may also increase cell survival uponspecific stimuli.
Gene expression profilingTo identify the gene expression pattern(s) possibly
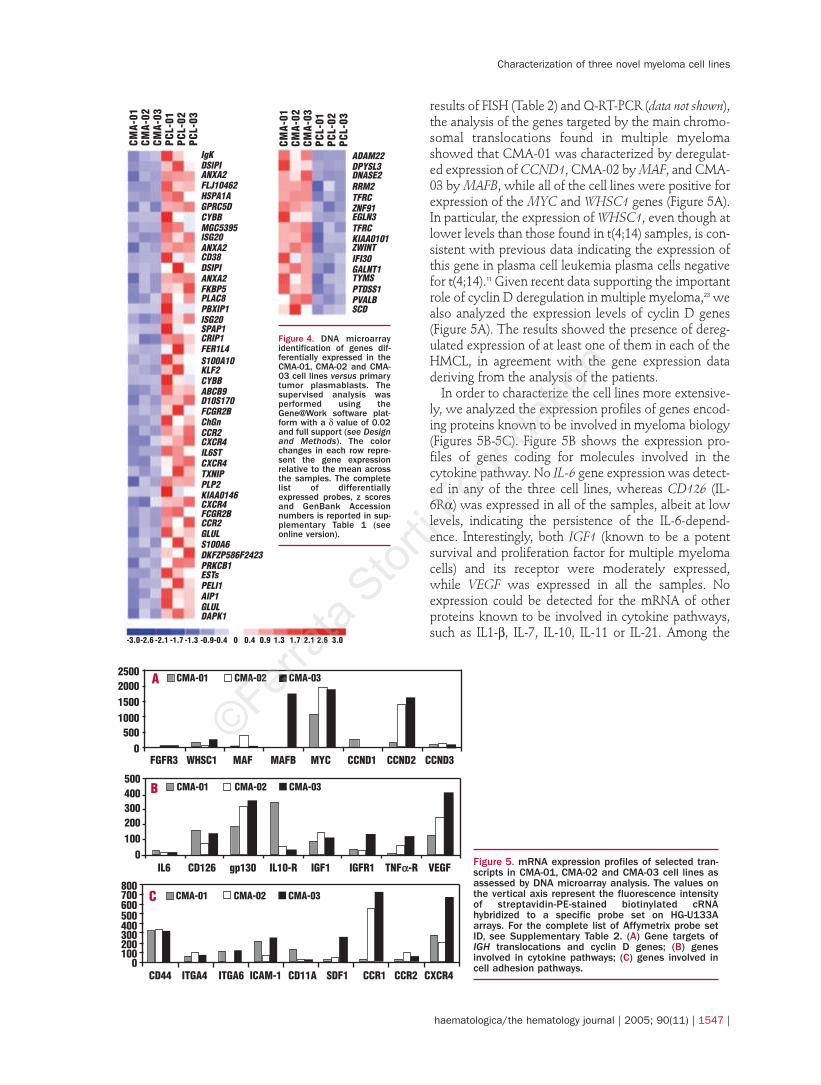
related to the in vitro growth of multiple myeloma plas-mablasts, we used supervised analysis to compare theglobal gene expression profiles of the cell lines withthose of purified tumor plasmablasts. The analysisselected a number of transcripts as differentiallyexpressed in the cell lines versus primary tumor plasmacells (16 up- and 46 down-regulated; Figure 4). Severalproliferation-associated genes were up-regulated in theCMA samples, including genes controlling DNAmetabolism such as DNAse 2, RRM2, ZWINT andTYMS. Interestingly, the most up-regulated gene in theCMA cell lines was ADAM22, a member of the disinte-
grin-metalloproteinase protein family that modulatescell-cell and cell-matrix interactions and protease activ-ity, whose expression is enhanced in cancer cells andmetastases;20 it is also worth noting the higher expres-sion of the CD71 transferrin receptor in the CMA celllines, a common characteristic of all HMCL.4 In con-trast, the majority of down-regulated genes in the CMAcell lines are associated with anti-proliferative or pro-apoptotic functions (e.g. ISG20, FCRH2 and KLF2).Notably, we also found specific down-regulation of thegp130 catalytic subunit of IL6-R (IL6ST), a transducerchain shared by many cytokines and growth factors.21
Genes codifying for molecules involved in cell adhesionpathway, such as chemokine receptors (CCR2, CXCR4)and protein kinase Cb (PRKCB1), whose signal trans-duction pathway triggers the effects of vascularendothelial growth factor on plasma cell migration,were also specifically down-regulated in the CMA sam-ples. Unexpectedly, we found down-regulation of thegenes encoding ANXA2 (involved in plasminogen-mediated cell invasiveness) and its ligand S100A10,both of which are over-expressed in cancer cells andparticularly in some cases of multiple myeloma andHMCL.22 Overall, these results show that cell line estab-lishment involves the clonal selection of rapidly prolif-erating cells that have probably acquired further inde-pendence from microenvironment homing factors thatare particularly relevant to myeloma biology.
The availability of global gene expression profilesmakes it possible to investigate the expression levels ofselected genes of particular interest. In line with the
Figure 3. Effect of exogenousIL-6 on the proliferation of theCMA-01, CMA-02 and CMA-03cell lines. (A) Increasingamounts of recombinanthuman IL-6 were added to themedium, and cell proliferationwas evaluated after 72 hoursby measuring the metabolicactivity of viable cells. (B)Proliferation of cells lines inthe presence (black lines) orabsence (dotted lines) of IL-6(20 U/mL). (C) Flow cytometriccell cycle analysis by DNA con-tent in the CMA-03 cell line inthe presence or absence of IL-6 (20U/mL).
A B
C
0 0,01 0,1 1 10 100IL-6 (U/mL)
Abso
rban
ce (A
450 -A
600 )
3
2
1
KMS12CMA-01CMA-02CMA-03
0 200 400 600 800 1000 0 200 400 600 800 1000FL1-H FL1-H
0 200 400 600 800 1000FL1-H
040
8012
016
020
0
040
8012
016
020
0
040
8012
016
020
0
Coun
ts
Coun
ts
Coun
ts
KMS12 CMA-01
CMA-02
days days
daysdays
CMA-03
0 1 2 3 4 5 0 1 2 3 4 5
0 1 2 3 4 50 1 2 3 4 5(A
450 -A
600 )
(A45
0 -A60
0 )(A
450 -A
600 )
(A45
0 -A60
0 )
3
2
1
0
3
2
1
0
3
2
1
0
3
2
1
0
CMA-03 0hpre G0-G1:14.94%G0-G1: 61.43%G2-M: 3.41%S: 20.20%
CMA-03 48h with IL-6pre G0-G1: 14.17%G0-G1: 48.05%G2-M: 3.25%S: 34.52%
CMA-03 48h w/o IL-6pre G0-G1: 33.31%G0-G1: 52.76%G2-M: 1.31%S: 12.16%
Characterization of three novel myeloma cell lines
haematologica/the hematology journal | 2005; 90(11) | 1547 |
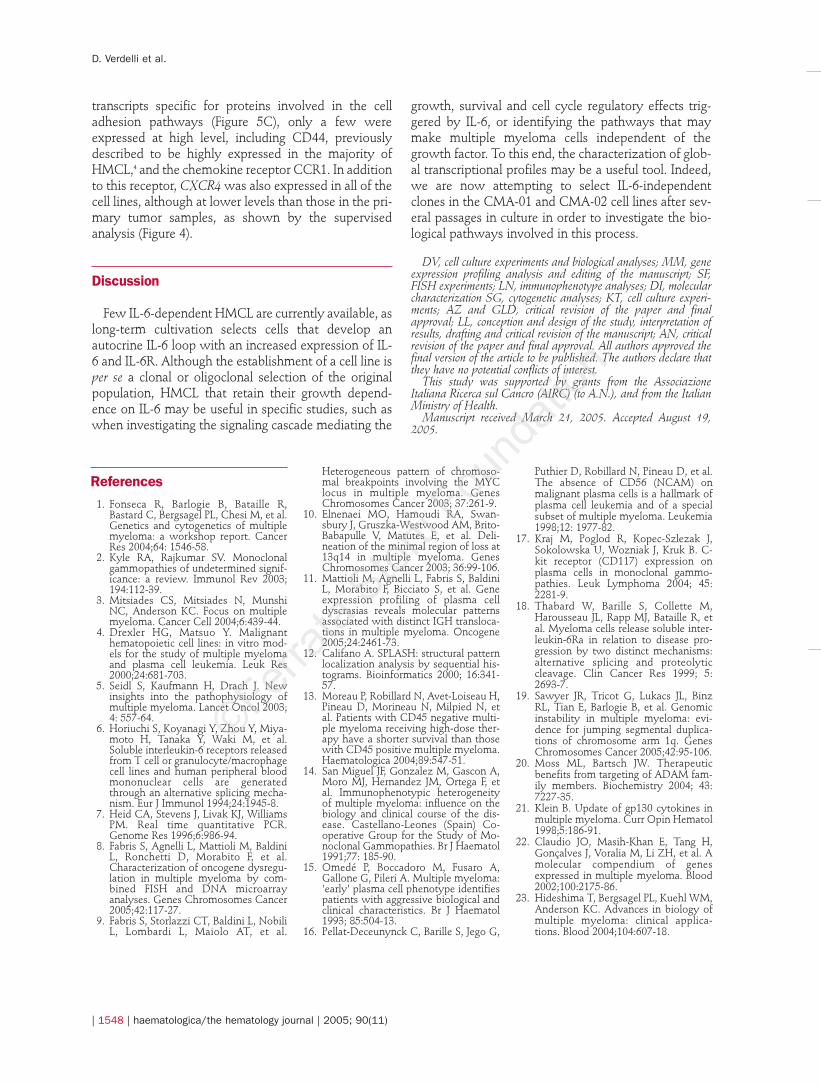
results of FISH (Table 2) and Q-RT-PCR (data not shown),the analysis of the genes targeted by the main chromo-somal translocations found in multiple myelomashowed that CMA-01 was characterized by deregulat-ed expression of CCND1, CMA-02 by MAF, and CMA-03 by MAFB, while all of the cell lines were positive forexpression of the MYC and WHSC1 genes (Figure 5A).In particular, the expression of WHSC1, even though atlower levels than those found in t(4;14) samples, is con-sistent with previous data indicating the expression ofthis gene in plasma cell leukemia plasma cells negativefor t(4;14).11 Given recent data supporting the importantrole of cyclin D deregulation in multiple myeloma,23 wealso analyzed the expression levels of cyclin D genes(Figure 5A). The results showed the presence of dereg-ulated expression of at least one of them in each of theHMCL, in agreement with the gene expression dataderiving from the analysis of the patients.
In order to characterize the cell lines more extensive-ly, we analyzed the expression profiles of genes encod-ing proteins known to be involved in myeloma biology(Figures 5B-5C). Figure 5B shows the expression pro-files of genes coding for molecules involved in thecytokine pathway. No IL-6 gene expression was detect-ed in any of the three cell lines, whereas CD126 (IL-6Ra) was expressed in all of the samples, albeit at lowlevels, indicating the persistence of the IL-6-depend-ence. Interestingly, both IGF1 (known to be a potentsurvival and proliferation factor for multiple myelomacells) and its receptor were moderately expressed,while VEGF was expressed in all the samples. Noexpression could be detected for the mRNA of otherproteins known to be involved in cytokine pathways,such as IL1-b, IL-7, IL-10, IL-11 or IL-21. Among the
Figure 4. DNA microarrayidentification of genes dif-ferentially expressed in theCMA-01, CMA-02 and CMA-03 cell lines versus primarytumor plasmablasts. Thesupervised analysis wasperformed using theGene@Work software plat-form with a d value of 0.02and full support (see Designand Methods). The colorchanges in each row repre-sent the gene expressionrelative to the mean acrossthe samples. The completelist of differentiallyexpressed probes, z scoresand GenBank Accessionnumbers is reported in sup-plementary Table 1 (seeonline version).
Figure 5. mRNA expression profiles of selected tran-scripts in CMA-01, CMA-02 and CMA-03 cell lines asassessed by DNA microarray analysis. The values onthe vertical axis represent the fluorescence intensityof streptavidin-PE-stained biotinylated cRNAhybridized to a specific probe set on HG-U133Aarrays. For the complete list of Affymetrix probe setID, see Supplementary Table 2. (A) Gene targets ofIGH translocations and cyclin D genes; (B) genesinvolved in cytokine pathways; (C) genes involved incell adhesion pathways.
A
C
B
ADAM22DPYSL3DNASE2RRM2TFRCZNF91EGLN3TFRCKIAA0101ZWINTIFI30GALNT1TYMSPTDSS1PVALBSCD
IgKDSIPIANXA2FLJ10462HSPA1AGPRC5DCYBBMGC5395ISG20ANXA2CD38DSIPIANXA2FKBP5PLAC8PBXIP1ISG20SPAP1CRIP1FER1L4S100A10KLF2CYBBABCB9D10S170FCGR2BChGnCCR2CXCR4IL6STCXCR4TXNIPPLP2KIAA0146CXCR4FCGR2BCCR2GLULS100A6DKFZP586F2423PRKCB1ESTsPELI1AIP1GLULDAPK1
2500200015001000500
0
500400300200100
0
800700600500400300200100
0
CMA-
01CM
A-02
CMA-
03PC
L-01
PCL-
02PC
L-03
CMA-
01CM
A-02
CMA-
03PC
L-01
PCL-
02PC
L-03
-3.0-2.6 -2.1 -1.7 -1.3 -0.9-0.4 0 0.4 0.9 1.3 1.7 2.1 2.6 3.0
FGFR3 WHSC1 MAF MAFB MYC CCND1 CCND2 CCND3
IL6 CD126 gp130 IL10-R IGF1 IGFR1 TNFaa-R VEGF
CD44 ITGA4 ITGA6 ICAM-1 CD11A SDF1 CCR1 CCR2 CXCR4
CMA-01 CMA-02 CMA-03
CMA-01 CMA-02 CMA-03
CMA-01 CMA-02 CMA-03
| 1548 | haematologica/the hematology journal | 2005; 90(11)
D. Verdelli et al.
transcripts specific for proteins involved in the celladhesion pathways (Figure 5C), only a few wereexpressed at high level, including CD44, previouslydescribed to be highly expressed in the majority ofHMCL,4 and the chemokine receptor CCR1. In additionto this receptor, CXCR4 was also expressed in all of thecell lines, although at lower levels than those in the pri-mary tumor samples, as shown by the supervisedanalysis (Figure 4).
Discussion
Few IL-6-dependent HMCL are currently available, aslong-term cultivation selects cells that develop anautocrine IL-6 loop with an increased expression of IL-6 and IL-6R. Although the establishment of a cell line isper se a clonal or oligoclonal selection of the originalpopulation, HMCL that retain their growth depend-ence on IL-6 may be useful in specific studies, such aswhen investigating the signaling cascade mediating the
growth, survival and cell cycle regulatory effects trig-gered by IL-6, or identifying the pathways that maymake multiple myeloma cells independent of thegrowth factor. To this end, the characterization of glob-al transcriptional profiles may be a useful tool. Indeed,we are now attempting to select IL-6-independentclones in the CMA-01 and CMA-02 cell lines after sev-eral passages in culture in order to investigate the bio-logical pathways involved in this process.
DV, cell culture experiments and biological analyses; MM, geneexpression profiling analysis and editing of the manuscript; SF,FISH experiments; LN, immunophenotype analyses; DI, molecularcharacterization SG, cytogenetic analyses; KT, cell culture experi-ments; AZ and GLD, critical revision of the paper and finalapproval; LL, conception and design of the study, interpretation ofresults, drafting and critical revision of the manuscript; AN, criticalrevision of the paper and final approval. All authors approved thefinal version of the article to be published. The authors declare thatthey have no potential conflicts of interest.
This study was supported by grants from the AssociazioneItaliana Ricerca sul Cancro (AIRC) (to A.N.), and from the ItalianMinistry of Health.
Manuscript received March 21, 2005. Accepted August 19,2005.
References1. Fonseca R, Barlogie B, Bataille R,
Bastard C, Bergsagel PL, Chesi M, et al.Genetics and cytogenetics of multiplemyeloma: a workshop report. CancerRes 2004;64: 1546-58.
2. Kyle RA, Rajkumar SV. Monoclonalgammopathies of undetermined signif-icance: a review. Immunol Rev 2003;194:112-39.
3. Mitsiades CS, Mitsiades N, MunshiNC, Anderson KC. Focus on multiplemyeloma. Cancer Cell 2004;6:439-44.
4. Drexler HG, Matsuo Y. Malignanthematopoietic cell lines: in vitro mod-els for the study of multiple myelomaand plasma cell leukemia. Leuk Res2000;24:681-703.
5. Seidl S, Kaufmann H, Drach J. Newinsights into the pathophysiology ofmultiple myeloma. Lancet Oncol 2003;4: 557-64.
6. Horiuchi S, Koyanagi Y, Zhou Y, Miya-moto H, Tanaka Y, Waki M, et al.Soluble interleukin-6 receptors releasedfrom T cell or granulocyte/macrophagecell lines and human peripheral bloodmononuclear cells are generatedthrough an alternative splicing mecha-nism. Eur J Immunol 1994;24:1945-8.
7. Heid CA, Stevens J, Livak KJ, WilliamsPM. Real time quantitative PCR.Genome Res 1996;6:986-94.
8. Fabris S, Agnelli L, Mattioli M, BaldiniL, Ronchetti D, Morabito F, et al.Characterization of oncogene dysregu-lation in multiple myeloma by com-bined FISH and DNA microarrayanalyses. Genes Chromosomes Cancer2005;42:117-27.
9. Fabris S, Storlazzi CT, Baldini L, NobiliL, Lombardi L, Maiolo AT, et al.
Heterogeneous pattern of chromoso-mal breakpoints involving the MYClocus in multiple myeloma. GenesChromosomes Cancer 2003; 37:261-9.
10. Elnenaei MO, Hamoudi RA, Swan-sbury J, Gruszka-Westwood AM, Brito-Babapulle V, Matutes E, et al. Deli-neation of the minimal region of loss at13q14 in multiple myeloma. GenesChromosomes Cancer 2003; 36:99-106.
11. Mattioli M, Agnelli L, Fabris S, BaldiniL, Morabito F, Bicciato S, et al. Geneexpression profiling of plasma celldyscrasias reveals molecular patternsassociated with distinct IGH transloca-tions in multiple myeloma. Oncogene2005;24:2461-73.
12. Califano A. SPLASH: structural patternlocalization analysis by sequential his-tograms. Bioinformatics 2000; 16:341-57.
13. Moreau P, Robillard N, Avet-Loiseau H,Pineau D, Morineau N, Milpied N, etal. Patients with CD45 negative multi-ple myeloma receiving high-dose ther-apy have a shorter survival than thosewith CD45 positive multiple myeloma.Haematologica 2004;89:547-51.
14. San Miguel JF, Gonzalez M, Gascon A,Moro MJ, Hernandez JM, Ortega F, etal. Immunophenotypic heterogeneityof multiple myeloma: influence on thebiology and clinical course of the dis-ease. Castellano-Leones (Spain) Co-operative Group for the Study of Mo-noclonal Gammopathies. Br J Haematol1991;77: 185-90.
15. Omedé P, Boccadoro M, Fusaro A,Gallone G, Pileri A. Multiple myeloma:'early' plasma cell phenotype identifiespatients with aggressive biological andclinical characteristics. Br J Haematol1993; 85:504-13.
16. Pellat-Deceunynck C, Barille S, Jego G,
Puthier D, Robillard N, Pineau D, et al.The absence of CD56 (NCAM) onmalignant plasma cells is a hallmark ofplasma cell leukemia and of a specialsubset of multiple myeloma. Leukemia1998;12: 1977-82.
17. Kraj M, Poglod R, Kopec-Szlezak J,Sokolowska U, Wozniak J, Kruk B. C-kit receptor (CD117) expression onplasma cells in monoclonal gammo-pathies. Leuk Lymphoma 2004; 45:2281-9.
18. Thabard W, Barille S, Collette M,Harousseau JL, Rapp MJ, Bataille R, etal. Myeloma cells release soluble inter-leukin-6Ra in relation to disease pro-gression by two distinct mechanisms:alternative splicing and proteolyticcleavage. Clin Cancer Res 1999; 5:2693-7.
19. Sawyer JR, Tricot G, Lukacs JL, BinzRL, Tian E, Barlogie B, et al. Genomicinstability in multiple myeloma: evi-dence for jumping segmental duplica-tions of chromosome arm 1q. GenesChromosomes Cancer 2005;42:95-106.
20. Moss ML, Bartsch JW. Therapeuticbenefits from targeting of ADAM fam-ily members. Biochemistry 2004; 43:7227-35.
21. Klein B. Update of gp130 cytokines inmultiple myeloma. Curr Opin Hematol1998;5:186-91.
22. Claudio JO, Masih-Khan E, Tang H,Gonçalves J, Voralia M, Li ZH, et al. Amolecular compendium of genesexpressed in multiple myeloma. Blood2002;100:2175-86.
23. Hideshima T, Bergsagel PL, Kuehl WM,Anderson KC. Advances in biology ofmultiple myeloma: clinical applica-tions. Blood 2004;104:607-18.