Modifications in Coverage Patterns and Land Use around the Huizache-Caimanero Lagoon System,...
8
Estuarine, Coastal and Shelf Science (1999) 49, 37–44 Article No. ecss.1999.0489, available online at http://www.idealibrary.com on Modifications in Coverage Patterns and Land Use around the Huizache-Caimanero Lagoon System, Sinaloa, Mexico: A Multi-temporal Analysis using LANDSAT Images A. Ruiz-Luna a and C. A. Berlanga-Robles b Lab. de Manejo Ambiental CIAD-Mazatla ´n, P.O. Box 711, Mazatla ´n, Sin, Mexico Received 13 July 1998 and accepted in revised form 19 March 1999 Human activities, such as agriculture and shrimp farming, have influenced the Huizache-Caimanero lagoon system, modifying the landscape and diminishing its natural productivity. Four Landsat MSS (multi-spectral scanner) and TM (thematic mapper) sub-images, taken between 1973 and 1997, were analysed to evaluate trends of changes in the lagoon, saltmarsh, mangrove, agriculture, secondary succession and dry forest classes. The scenes were enhanced by principal components analysis. A thematic map for each sub-image was produced using supervised classification with the extraction and classification of homogeneous objects algorithm (ECHO). Aerial photography and field verification of testing points were used to validate the classification and to assess its accuracy using the Kappa coefficient. The area covered by class and year was estimated and the temporal trends were defined by linear regression. The natural covers (lagoon, mangrove and dry forest) showed a significant reduction in 1997 when compared with 1973, whereas the agricultural areas, secondary succession and saltmarshes showed an increase in cover. The frequency distribution analysis of the normalized difference vegetation index (NDVI) confirmed the observed trends. The Huizache-Caimanero region is a highly disturbed landscape, mainly caused by agricultural practices, that must be rehabilitated to maintain its natural productivity. ? 1999 Academic Press Keywords: Landscape ecology; ECHO; NDVI; supervised classification; Kappa coefficient; LANDSAT; Huizache-Caimanero; Mexico Pacific coast Introduction Methods employed for the conservation and manage- ment of wetlands are usually concentrated on protect- ing isolated, scattered habitats, which although useful in preventing immediate destruction, do not insure permanent protection. The existence of environments such as wetlands depends on conditions created and maintained by large-scale factors which include, among others, cover patterns and land use in a particular type of landscape (Pearson, 1994). Land cover in areas surrounding aquatic systems greatly transforms the hydrological cycle, because it influences storage patterns and water discharge (Richardson & McCarthy, 1994). The effect land- cover has on the interconnection and mobility of ecological processes within these areas is of great importance in maintaining biodiversity (Pearson et al., 1996; Keitt et al., 1997). Independent of the intrinsic transcendence of the wetlands, the patterns of cover and land use reflect the nature of interactions of societies with their physical environments (Campbell, 1996). Landscape dynamics may be interpreted by employing an evaluation of the changes in land use and cover (Poudevigne & Alard, 1997). Thematic maps developed by classifying satellite images and mathematical operations related to the spectral bands that make up a satellite image can be used to generate indicators that are sensitive to the presence and con- dition of vegetation, humidity, soil brightness and other features of interest (Iban ˜ez et al., 1998). Data from remote sensors capable of spectral and spatial resolution are extremely useful for analysing changes in land use and cover, because characteristics of the area may be analysed with sufficient precision to be exploited efficiently in the management of natural resources (Dimyati et al., 1996; Grignetti et al., 1997). In large and heterogeneous environments, such as those found in coastal areas, remote sensors provide much data from which current information about land cover may be extracted efficiently and economically (Baily & Nowell, 1996; Green et al., 1996). Within human ecology, data from remote sensors allow the quantitative comparisons of the impact of processes such as intensive soil use and population 0272–7714/99/070037+08 $30.00/0 ? 1999 Academic Press
-
Upload
independent -
Category
Documents
-
view
1 -
download
0
Transcript of Modifications in Coverage Patterns and Land Use around the Huizache-Caimanero Lagoon System,...

Estuarine, Coastal and Shelf Science (1999) 49, 37–44Article No. ecss.1999.0489, available online at http://www.idealibrary.com on
Modifications in Coverage Patterns and Land Usearound the Huizache-Caimanero Lagoon System,Sinaloa, Mexico: A Multi-temporal Analysis usingLANDSAT Images
A. Ruiz-Lunaa and C. A. Berlanga-Roblesb
Lab. de Manejo Ambiental CIAD-Mazatlan, P.O. Box 711, Mazatlan, Sin, Mexico
Received 13 July 1998 and accepted in revised form 19 March 1999
Human activities, such as agriculture and shrimp farming, have influenced the Huizache-Caimanero lagoon system,modifying the landscape and diminishing its natural productivity. Four Landsat MSS (multi-spectral scanner) and TM(thematic mapper) sub-images, taken between 1973 and 1997, were analysed to evaluate trends of changes in the lagoon,saltmarsh, mangrove, agriculture, secondary succession and dry forest classes. The scenes were enhanced by principalcomponents analysis. A thematic map for each sub-image was produced using supervised classification with the extractionand classification of homogeneous objects algorithm (ECHO). Aerial photography and field verification of testing pointswere used to validate the classification and to assess its accuracy using the Kappa coefficient. The area covered by classand year was estimated and the temporal trends were defined by linear regression. The natural covers (lagoon, mangroveand dry forest) showed a significant reduction in 1997 when compared with 1973, whereas the agricultural areas,secondary succession and saltmarshes showed an increase in cover. The frequency distribution analysis of the normalizeddifference vegetation index (NDVI) confirmed the observed trends. The Huizache-Caimanero region is a highly disturbedlandscape, mainly caused by agricultural practices, that must be rehabilitated to maintain its natural productivity.
? 1999 Academic Press
Keywords: Landscape ecology; ECHO; NDVI; supervised classification; Kappa coefficient; LANDSAT;Huizache-Caimanero; Mexico Pacific coast
Introduction
Methods employed for the conservation and manage-ment of wetlands are usually concentrated on protect-ing isolated, scattered habitats, which although usefulin preventing immediate destruction, do not insurepermanent protection. The existence of environmentssuch as wetlands depends on conditions created andmaintained by large-scale factors which include,among others, cover patterns and land use in aparticular type of landscape (Pearson, 1994).
Land cover in areas surrounding aquatic systemsgreatly transforms the hydrological cycle, becauseit influences storage patterns and water discharge(Richardson & McCarthy, 1994). The effect land-cover has on the interconnection and mobility ofecological processes within these areas is of greatimportance in maintaining biodiversity (Pearsonet al., 1996; Keitt et al., 1997). Independent of theintrinsic transcendence of the wetlands, the patternsof cover and land use reflect the nature of interactionsof societies with their physical environments(Campbell, 1996).
0272–7714/99/070037+08 $30.00/0
Landscape dynamics may be interpreted byemploying an evaluation of the changes in land useand cover (Poudevigne & Alard, 1997). Thematicmaps developed by classifying satellite images andmathematical operations related to the spectral bandsthat make up a satellite image can be used to generateindicators that are sensitive to the presence and con-dition of vegetation, humidity, soil brightness andother features of interest (Ibanez et al., 1998).
Data from remote sensors capable of spectral andspatial resolution are extremely useful for analysingchanges in land use and cover, because characteristicsof the area may be analysed with sufficient precision tobe exploited efficiently in the management of naturalresources (Dimyati et al., 1996; Grignetti et al., 1997).In large and heterogeneous environments, such asthose found in coastal areas, remote sensors providemuch data from which current information about landcover may be extracted efficiently and economically(Baily & Nowell, 1996; Green et al., 1996).
Within human ecology, data from remote sensorsallow the quantitative comparisons of the impact ofprocesses such as intensive soil use and population
? 1999 Academic Press

38 A. Ruiz-Luna and C. A. Berlanga-Robles
growth. These comparisons effectively link the spatialand temporal variation that results from changes insoil use in an environmental, socio-economic andcultural context, allowing an analysis to be made on ascale which relates local adaptation strategies toecological and economic variability on a regional level(Brondizio et al., 1994).
The Huizache-Caimanero lagoon system, with itshigh level of natural productivity, ranging from 13 to16 mg C l"1 day"1 (Edwards, 1978), is one of themost important in north-western Mexico and togetherwith its immediate surroundings, forms a landscapewhich has been radically modified to increase fishingyields, enhance shrimp farming and agricultural pro-ductivity (de la Lanza & Garcıa-Calderon, 1991).Although the system has suffered disturbances that areclearly evident, there are no evaluations that wouldenable quantification and an analysis of the tendenciesto be made. Regional plans can accelerate the processof transformation of the landscape, such as the con-struction of a dam, new shrimp farms, and the con-verting of seasonal agriculture to an irrigation system.The present study offers a multi-temporal analysis ofthe patterns of land cover using digital processingof LANDSAT satellite images.
Study area
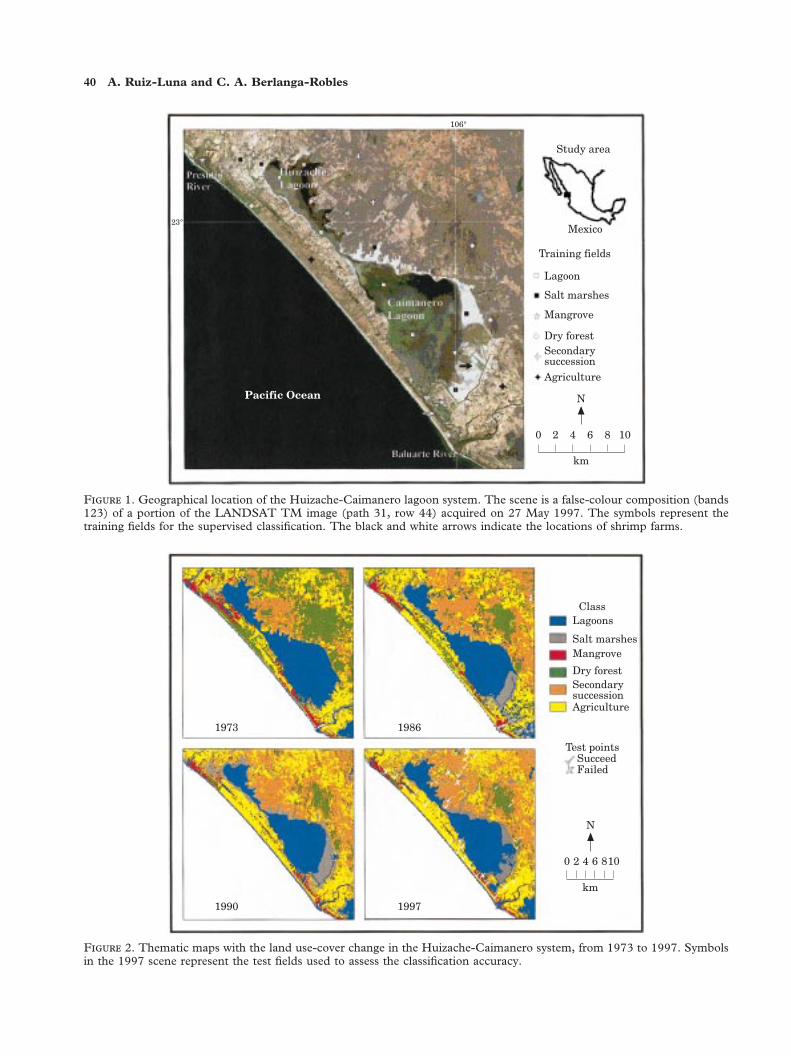
The Huizache-Caimanero lagoon system is in south-ern Sinaloa, Mexico, between 22)50*–23)05*N and105)55*–106)15*W (Figure 1). The landscape com-prises the Lagunas El Huizache and El Caimanerowith average areas of 41 and 134 km2 in the rainyseason (June–January) and 15 and 40 km2 during thedry season when the barrier to the sea is completelyclosed and limits the interchange with the sea. LagunaHuizache is connected in the north-east to the RioPresidio by means of a 10 km canal bordered bymangroves. Laguna Caimanero is connected in the
south-east to Rio Baluarte via an estuary. The lagoonsare connected to each other by a 250 m canal. Thelagoons only receive freshwater drainage during therainy season. Some rural communities are foundadjacent to the lagoon system, where the main activi-ties are seasonal agriculture, cattle farming and ashrimp fishery. Vegetation is predominantly dryforest. There are secondary associations of xerophyticand caduceus underbrush. The climate in the zone ishot sub-humid, with a mean annual temperatureoscillating from 22 to 26 )C. The average annualprecipitation is 928 to 1457 mm (Siu & del Valle,1986; de la Lanza & Garcıa-Calderon, 1991; INEGI,1995).
Materials and methods
To analyse the main modifications that have occurredaround the Huizache-Caimanero system, four differ-ent scenes of the area were compared, after theirclassification using supervised classifications tech-niques. In addition, the analysis of the frequencydistribution of the normalized difference vegetationindex (NDVI) was done. The NDVI is a quantitativemeasure that attempts to assess biomass or vegetativevigour (Campbell, 1996).
The four LANDSAT satellite scenes (path 31, row44) of the lagoon system and its immediate surround-ings, lie between 366 741 and 401 247 UTM and2 523 560 and 2 558 116 UTM. The images wereacquired in 1973 and 1986 with the multispectralscanner (MSS) and in 1990 and 1997 with thethematic mapper (TM). The main characteristics ofthe four scenes are described in Table 1. In all cases,the images correspond to the dry period (January toJune), having been taken during March to May. In theevaluation, six classes were defined. They included thewater surface of the lagoon system (lagoon class) andfive kinds of land cover; saltmarshes and bare soils
T 1. Main characteristics of the LANDSAT images used to evaluate trends of pattern coveragein the Huizache-Caimanero lagoon system
Acquisition dateLANDSAT
sensorAvailable
bandsOriginal
pixel size (m)Corrected
pixel size (m)Sub-image size(columns, rows)
3 Mar 1973 MSS 1 2 3 4 80#80 60#60 576, 57610 Mar 1986 MSS 1 2 3 4 80#80 60#60 576, 5766 Apr 1990 TM 2 3 4 5 30#30 33#33 1052, 105227 May 1997 TM 1 2 3 4 5 7 30#30 25#25 1382, 1382
Bands in the MSS sensor have the following wavelengths (1) 0·5–0·6ìm (green); (2) 0·6–0·7 ìm (red); (3)0·7–0·8 ìm (near infrared); and (4) 0·8–1·1 ìm (near infrared). Wavelengths of the TM sensor bands: (1)0·45–0·52 ìm (blue); (2) 0·52–0·60 ìm (green); (3) 0·60–0·69 ìm (red), (4) 0·76–0·90 ìm (near infrared); (5)1·55–1·75 ìm (mid infrared); and (7) 2·08–2·35 ìm (mid infrared).
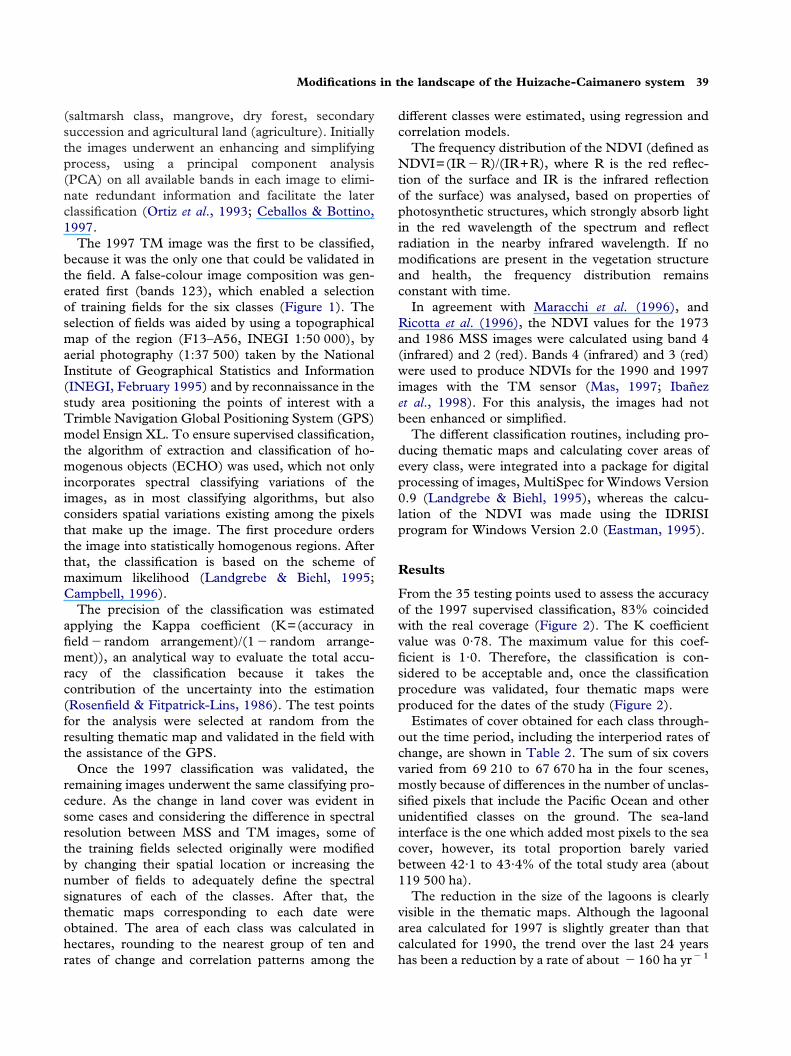
Modifications in the landscape of the Huizache-Caimanero system 39
(saltmarsh class, mangrove, dry forest, secondarysuccession and agricultural land (agriculture). Initiallythe images underwent an enhancing and simplifyingprocess, using a principal component analysis(PCA) on all available bands in each image to elimi-nate redundant information and facilitate the laterclassification (Ortiz et al., 1993; Ceballos & Bottino,1997.
The 1997 TM image was the first to be classified,because it was the only one that could be validated inthe field. A false-colour image composition was gen-erated first (bands 123), which enabled a selectionof training fields for the six classes (Figure 1). Theselection of fields was aided by using a topographicalmap of the region (F13–A56, INEGI 1:50 000), byaerial photography (1:37 500) taken by the NationalInstitute of Geographical Statistics and Information(INEGI, February 1995) and by reconnaissance in thestudy area positioning the points of interest with aTrimble Navigation Global Positioning System (GPS)model Ensign XL. To ensure supervised classification,the algorithm of extraction and classification of ho-mogenous objects (ECHO) was used, which not onlyincorporates spectral classifying variations of theimages, as in most classifying algorithms, but alsoconsiders spatial variations existing among the pixelsthat make up the image. The first procedure ordersthe image into statistically homogenous regions. Afterthat, the classification is based on the scheme ofmaximum likelihood (Landgrebe & Biehl, 1995;Campbell, 1996).
The precision of the classification was estimatedapplying the Kappa coefficient (K=(accuracy infield"random arrangement)/(1"random arrange-ment)), an analytical way to evaluate the total accu-racy of the classification because it takes thecontribution of the uncertainty into the estimation(Rosenfield & Fitpatrick-Lins, 1986). The test pointsfor the analysis were selected at random from theresulting thematic map and validated in the field withthe assistance of the GPS.
Once the 1997 classification was validated, theremaining images underwent the same classifying pro-cedure. As the change in land cover was evident insome cases and considering the difference in spectralresolution between MSS and TM images, some ofthe training fields selected originally were modifiedby changing their spatial location or increasing thenumber of fields to adequately define the spectralsignatures of each of the classes. After that, thethematic maps corresponding to each date wereobtained. The area of each class was calculated inhectares, rounding to the nearest group of ten andrates of change and correlation patterns among the
different classes were estimated, using regression andcorrelation models.
The frequency distribution of the NDVI (defined asNDVI=(IR"R)/(IR+R), where R is the red reflec-tion of the surface and IR is the infrared reflectionof the surface) was analysed, based on properties ofphotosynthetic structures, which strongly absorb lightin the red wavelength of the spectrum and reflectradiation in the nearby infrared wavelength. If nomodifications are present in the vegetation structureand health, the frequency distribution remainsconstant with time.
In agreement with Maracchi et al. (1996), andRicotta et al. (1996), the NDVI values for the 1973and 1986 MSS images were calculated using band 4(infrared) and 2 (red). Bands 4 (infrared) and 3 (red)were used to produce NDVIs for the 1990 and 1997images with the TM sensor (Mas, 1997; Ibanezet al., 1998). For this analysis, the images had notbeen enhanced or simplified.
The different classification routines, including pro-ducing thematic maps and calculating cover areas ofevery class, were integrated into a package for digitalprocessing of images, MultiSpec for Windows Version0.9 (Landgrebe & Biehl, 1995), whereas the calcu-lation of the NDVI was made using the IDRISIprogram for Windows Version 2.0 (Eastman, 1995).
Results
From the 35 testing points used to assess the accuracyof the 1997 supervised classification, 83% coincidedwith the real coverage (Figure 2). The K coefficientvalue was 0·78. The maximum value for this coef-ficient is 1·0. Therefore, the classification is con-sidered to be acceptable and, once the classificationprocedure was validated, four thematic maps wereproduced for the dates of the study (Figure 2).
Estimates of cover obtained for each class through-out the time period, including the interperiod rates ofchange, are shown in Table 2. The sum of six coversvaried from 69 210 to 67 670 ha in the four scenes,mostly because of differences in the number of unclas-sified pixels that include the Pacific Ocean and otherunidentified classes on the ground. The sea-landinterface is the one which added most pixels to the seacover, however, its total proportion barely variedbetween 42·1 to 43·4% of the total study area (about119 500 ha).
The reduction in the size of the lagoons is clearlyvisible in the thematic maps. Although the lagoonalarea calculated for 1997 is slightly greater than thatcalculated for 1990, the trend over the last 24 yearshas been a reduction by a rate of about "160 ha yr"1
40 A. Ruiz-Luna and C. A. Berlanga-Robles
Study area
Mexico
Training fields
Lagoon
Salt marshes
Mangrove
Dry forestSecondarysuccessionAgriculture
Pacific Ocean
23°
2 4 6 8 10
km
N
106°
0
F 1. Geographical location of the Huizache-Caimanero lagoon system. The scene is a false-colour composition (bands123) of a portion of the LANDSAT TM image (path 31, row 44) acquired on 27 May 1997. The symbols represent thetraining fields for the supervised classification. The black and white arrows indicate the locations of shrimp farms.
Lagoons
Salt marshesMangrove
Dry forestSecondarysuccessionAgriculture
SucceedFailed
Test points
2 4 6 810
km
N
0
Class
1973 1986
1990 1997
F 2. Thematic maps with the land use-cover change in the Huizache-Caimanero system, from 1973 to 1997. Symbolsin the 1997 scene represent the test fields used to assess the classification accuracy.

Modifications in the landscape of the Huizache-Caimanero system 41
represent natural vegetation. The correlation coef-ficients for both the mangrove swamp and the dryforest with agriculture were "0·92(P>0·95). Theformer could be taken as an indicator of the displace-ment of the natural vegetation by agriculture, whichgrew at an average rate of 152 ha yr"1 (R2=0·83).
Secondary succession in the study zone is made upof associations of xerophytic underbrush, caduceusfoliage and on the bank east of the canal which joinsthe lagoons, mangrove (Avicennia germinans). Thecoverage showed an average rate of growth of325 ha yr"1 (R2=0·79) during the 24 years of thestudy, but the fastest growth was from 1973 to 1986(Table 2).
The agricultural border increased most from 1973to 1986, maintaining relative stability since then. Inrecent years, it has been the secondary succession thathas displaced the dry forest, showing a negative cor-relation between both variables ("0·95). Because ofthis interaction between agriculture and secondarysuccession, the estimates for both variables may varyin a correlated manner during the interim years.Assuming agriculture and secondary successionbelong to a single cover class, a rate of growth of450 ha yr"1 (R2=0·77) was shown and therewas a negative correlation ("0·95) with the naturalvegetation.
Discussion
For the classification, the mangrove and thedensest parts of the dry forest show similar spectralsignatures, but it was possible to classify the imageswith a minimum of overlap, because of the algorithmproperties of the ECHO classification, which alsotakes spatial criteria into account (neighbouringpixels).
For the lagoon system, there are important vari-ations in size between the dry and rainy seasons, withthe wetlands diminishing by up to 60% (Siu & del
(R2=0·73). The marsh area tripled from 1973 to1990; the rate of increase calculated was close to225 ha yr"1 (R2=0·73).
Since 1986, the thematic maps of the south ofLaguna Caimanero have revealed a large area ofmarshland, approximately 1714 ha, bordered by a15 km canal built in 1984 (Siu & del Valle, 1986). Inthe thematic map from 1997 and in the false colourcomposition shown in Figure 1, shrimp farms may beobserved in the south of Laguna Caimanero. Theanalyses of the supervised classification and of theNDVI portray a reduction in the coverage of naturalvegetation (mangrove and dry forest) of about14 000 ha between 1973 and 1997. At present, themangrove swamp is found in small portions next tothe rivers and the dry forest regions are in the hills.
The period of greatest disturbance was from 1973to 1986, with a deforestation rate around"72 ha yr"1 for the mangrove system and"714 ha yr"1 for the dry forest, both figures beinggreater than those of the average rate of deforestationcalculated for the study period, which is "47 ha yr"1
for the mangrove swamp and "579 ha yr"1 for thedry forest, with a determination coefficient (R2) of0·85 (mangrove) and 0·93 (dry forest).
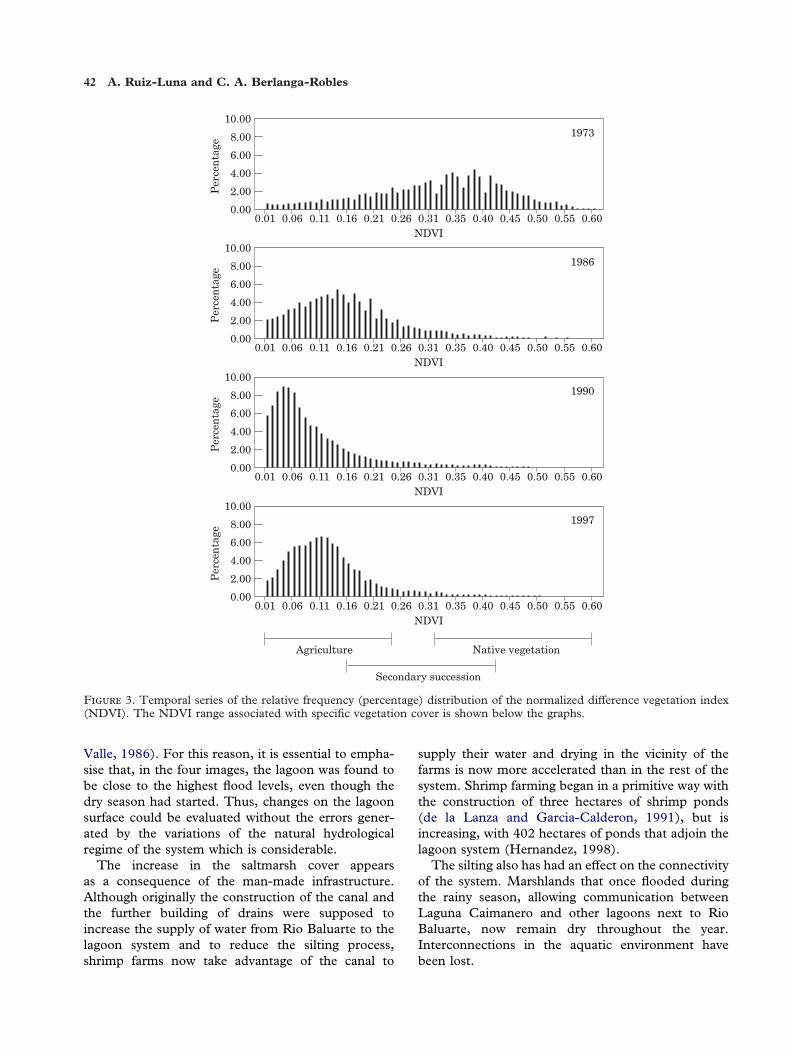
The frequency distribution percentages of theNDVI show how the modal classes shift toward thelowest values of the NDVI from 1973 to 1997 (Figure3). Superimposing the thematic maps with the NDVI(OVERLAY module of IDRISI), the pixels that wereclassified were determined as agriculture within arange of 0·01 to 0·024 of the NDVI, those classified assecondary succession within a range of 0·16 to 0·42and mangrove and dry forest (native vegetation) in arange of 0·32 to 1·00. Hence, the movement towardsthe left of the histogram indicates loss of forest masswith time.
Whereas in 1973, 55% of the pixels fell within thenatural vegetation interval, in 1986 only 6·1% did andfor 1990 and 1997 no more than 4% of the pixels
T 2. Estimated coverage (ha) of water surface (lagoon) and five classes of vegetation and landuse covers in the landscape of the Huizache-Caimanero lagoon system, Mexico. The inter-periodand total rates of change (%) between 1973 and 1997 are in italics. The figures are rounded to thenearest group of ten (coverage) or integral (rates of change)
Class 1973 1986 1990 1997 1973–86 1986–90 1990–97 Total
Lagoon 16 140 13 740 11 710 12 880 "15 "15 10 "20Salt marsh 3500 5080 9200 8200 45 81 "11 134Mangrove 2310 1380 1220 1250 "40 "12 2 "46Dry forest 16 570 7290 4050 3480 "56 "44 "14 "79Secondary succession 12 470 20 010 19 600 20 320 60 "2 4 63Agriculture 18 220 21 030 21 920 21 540 15 4 "2 18
42 A. Ruiz-Luna and C. A. Berlanga-Robles
0.60
10.00
0.000.01
NDVI
Per
cen
tage
8.00
6.00
4.00
2.00
0.06 0.11 0.16 0.21 0.26 0.31 0.35 0.40 0.45 0.50 0.55
1973
0.60
10.00
0.000.01
NDVI
Per
cen
tage
8.00
6.00
4.00
2.00
0.06 0.11 0.16 0.21 0.26 0.31 0.35 0.45 0.50 0.55
1986
0.60
10.00
0.000.01
NDVI
Per
cen
tage
8.00
6.00
4.00
2.00
0.06 0.11 0.16 0.21 0.26 0.31 0.35 0.40 0.45 0.50 0.55
1990
0.60
10.00
0.000.01
NDVI
Per
cen
tage
8.00
6.00
4.00
2.00
0.06 0.11 0.16 0.21 0.26 0.31 0.35 0.40 0.45 0.50 0.55
1997
Agriculture Native vegetation
Secondary succession
0.40
F 3. Temporal series of the relative frequency (percentage) distribution of the normalized difference vegetation index(NDVI). The NDVI range associated with specific vegetation cover is shown below the graphs.
Valle, 1986). For this reason, it is essential to empha-sise that, in the four images, the lagoon was found tobe close to the highest flood levels, even though thedry season had started. Thus, changes on the lagoonsurface could be evaluated without the errors gener-ated by the variations of the natural hydrologicalregime of the system which is considerable.
The increase in the saltmarsh cover appearsas a consequence of the man-made infrastructure.Although originally the construction of the canal andthe further building of drains were supposed toincrease the supply of water from Rio Baluarte to thelagoon system and to reduce the silting process,shrimp farms now take advantage of the canal to
supply their water and drying in the vicinity of thefarms is now more accelerated than in the rest of thesystem. Shrimp farming began in a primitive way withthe construction of three hectares of shrimp ponds(de la Lanza and Garcia-Calderon, 1991), but isincreasing, with 402 hectares of ponds that adjoin thelagoon system (Hernandez, 1998).
The silting also has had an effect on the connectivityof the system. Marshlands that once flooded duringthe rainy season, allowing communication betweenLaguna Caimanero and other lagoons next to RioBaluarte, now remain dry throughout the year.Interconnections in the aquatic environment havebeen lost.

Modifications in the landscape of the Huizache-Caimanero system 43
References
Anonymous. 1990 Rosario: Monografia Municipal 1990. Gobiernodel Estado de Sinaloa, Mexico, 137 pp.
Baily, B. & Nowell, D. 1996 Techniques for monitoring coastalchange: a review and case study. Oceanography and CoastalManagement 32, 85–95.
Brondizio, E. S., Moran, E. F., Mausel, P. & Wu, Y. 1994 Land usechange in the Amazon estuary: patterns of caboclo settlement andlandscape management. Human Ecology 22, 249–278.
Campbell, J. B. 1996 Introduction to Remote Sensing. Taylor &Francis, London, 622 pp.
Ceballos, J. C. & Bottino, M. J. 1997 The discrimination of scenesby principal components analysis of multi-spectral imagery.International Journal of Remote Sensing 18, 2437–2449.
Childers, D. L. & Gosselink, J. G. 1990 Assessment of cumulativeimpacts to water quality in a forested wetland landscape. Journalof Environmental Quality 19, 454–463.
de la Lanza, E. G. & Garcia-Calderon, J. L. 1991 Sistema lagunarHuizache y Caimanero, Sin. Un estudio socio ambiental,pesquero y acuicola. Hidrobiologica 1, 1–35.
Dimyati, M., Mizuno, K., Kobayashi, S. & Kitamura, T. 1996An analysis of land use/cover change using the combination ofMSS Landsat and land use map—a case study in Yogyakarta,Indonesia. International Journal of Remote Sensing 17, 931–944.
Eastman, J. R. 1995 IDRISI for WINDOWS. User’s guide, IDRISIProduction, Clark University, U.S.A.
Edwards, R. C. C. 1978 The fishery and fisheries biology of penaidshrimp on the Pacific coast of Mexico. Oceanography and MarineBiology Annual Review 16, 145–180.
Green, E. P., Mumby, P. J., Edwards, A. J. & Clark, C. D. 1996 Areview of remote sensing for the assessment and management oftropical coastal resources. Coastal Management 24, 1–40.
Grignetti, A., Salvatori, R., Casacchia, R. & Manes, F. 1997Mediterranean vegetation analysis by multi-temporal satellitesensor data. International Journal of Remote Sensing 18, 1307–1318.
Hernandez, C. R. 1998 Analisis de la camaronicultura y su impactosobre el ambiente en el sur del Estado de Sinaloa. Professional thesis.Universidad Autonoma de Baja California Sur Mexico. 93 pp.
Ibanez, G, Salinas, S. G., Lund, M. I. & Maldonado, F. 1998Analisis de areas salinizadas del Valle del Tulum, mediante el usode imagenes Landsat TM. Boletin SELPER-Mexico 44, 15–36.
INEGI. Estudio hidrologico del Estado de Sinaloa. Instituto Nacionalde Estadistica Geografia e Informatica (INEGI), Mexico, 88 pp.
Keitt, T. H., Urban, D. L. & Milne, B. T. 1997 Detecting criticalscales in fragmented landscapes. Conservation Ecology [on line]1,4, and can be found at URL:http://www.consecol.org/vol1/iss1/art4.
Landgrebe, D. & Biehl, L. 1995 An Introduction to MultiSpec.Purdue Res. Found. Indiana. U.S.A. 85 p.
Mas, J. F. 1997 Monitoring land-cover changes in the TerminosLagoon region, Mexico: a comparison of change detection tech-niques. Proceedings of the IV Conference on Remote Sensing forMarine and Coastal Environments, Orlando, Florida 1, 159–167.
Maracchi, G., Conese, C., Maselli, F. & Bravetti, L. 1996 Assess-ment and examination of coastal vegetation deterioration bymeans of Landsat TM data. Journal of Coastal Research 12,103–111.
Ortiz, G. S. M., Segura, M. J., Escoto, S. P. & Gil, A. 1993Comparacion de resultados obtenidos mediante procesamientodigital de imagenes de satelite en areas costeras mexicanas.Oceanologia 1, 1–30.
Pearson, S. M. 1994 Landscape-level processes and wetland con-servation in the Southern Appalacian Mountains. Water, Air andSoil pollution 77, 321–332.
For native vegetation and agriculture, a negativecorrelation was detected. Soil composition andtopography predominating in the municipality of ElRosario, where the lagoon system is located, funda-mentally limit agriculture to seasonal activities, witha minimum amount of crops irrigated by pumps(Anonymous, 1990). As a result, the agricultural fieldsare temporally abandoned and early succession pro-cesses take place, establishing secondary succession.This situation is reflected in the frequency distri-butions of the NDVI and can explain the shiftingtowards higher values of this index from 1990 to 1997.During 1990, 92% of the pixels showed NDVI valuesrelated to agriculture, but in 1997 there were 7% morepixels associated with secondary succession than in1990.
The seasonal farming of chilli, corn, sorghum andother crops is done mainly to the east of the lagoons,affecting the areas of dry forest, while the permanentfarming of coconut palms and pasture for cattle fodderis along the sand bar which separates the lagoonsfrom the ocean. These agricultural practices and thegrowth of rural communities have affected areas thatoriginally were covered by mangroves and dry forest.
Agriculture and the farming of pasture for cattlefodder have a direct and immediate influence on thenatural vegetation, but also have a later effect on thelagoons (Richardson & McCarthy, 1994). Furtherpossible alterations to the biogeochemical cycles aregenerated by the incorporation of nutrients resultingfrom fertilization (Childers & Gosselink, 1990).
The results obtained show a continuous degra-dation of the natural environment (lagoons, mangroveswamps and dry forest) in the Huizache-Caimanerosystem, which has been subjected to strong pressuregenerated by anthropogenic development in the area.At the present time, the lagoon system and its imme-diate environs form an extremely perturbed landscapewith some of their natural covers highly fragmented.The rates of deforestation of the natural vegetation,especially dry forest and of drying of the lagoons arealarming. A reversal is vital to achieve long-termsustainability in fishery, shrimp aquaculture and agri-culture, the main economic activities that can sustaina community-based development in this zone.
Acknowledgements
The authors are grateful to Guadalupe de la Lanza,Eduardo Brondizio and anonymous referees for help-ful comments on the manuscript. We would like toacknowledge the financial support of CONACYT(Ref. 2304-PT) and also the North AmericanLandscape Characterization program (NALC-NASA)
and the Institute of Geography (UNAM) whoprovided us with some of the Landsat images.
44 A. Ruiz-Luna and C. A. Berlanga-Robles
Pearson, S. M., Turner, M. G., Gardner, R. H. & O’Neill, R. V.1996 An organism-based perspective of habitat fragmentation. InBiodiversity in Managed Landscapes: Theory and Practice (Szaro,R. C. & Johnston, D. W., eds). Oxford University Press, Oxford,808 pp.
Poudevigne, I. & Alard, D. 1997 Landscape and agriculturalpatterns in rural areas: a case study in the Brionne Basin,Normandy, France. Journal of Environmental Management 50,335–349.
Ricotta, C., Avena, G. C. & Ferri, F. 1996 Analysis of humanimpact on a forested landscape of central Italy with a simplifiedNDVI texture descriptor. International Journal of Remote Sensing17, 2869–2874.
Richardson, C. J. & McCarthy, E. J. 1994 Effect of land develop-ment and forest management on hydrologic response in south-eastern coastal wetlands: a review. Wetlands 14, 56–71.
Rosenfield, G. H. & Fitpatrick-Lins, K. 1986 A coefficient ofagreement as a measure of thematic classification accuracy.Photogrammetric Engineering and Remote Sensing 52, 223–227.
Siu, E. & del Valle, I. 1986 Comparacion de condiciones hidrogra-ficas durante 1977 y 1985, del sistema Huizache-Caimanero,Sinaloa. Ciencias del Mar UAS 2, 27–31.