Modern Business Statistics with Microsoft Office Excel 4th ...
28
CHAPTER 3—DESCRIPTIVE STATISTICS: NUMERICAL MEASURES MULTIPLE CHOICE 1. The interquartile range is the difference between the a. first and second quartiles b. first and third quartiles c. second and third quartiles d. second and fourth quartiles ANS: B PTS: 1 2. The coefficient of determination is equal to the a. absolute value of the correlation coefficient b. squared value of the correlation coefficient c. square-root of the correlation coefficient d. inverse value of the correlation coefficient ANS: B PTS: 1 3. Generally, which one of the following is the least appropriate measure of central tendency for a data set that contains outliers? a. mean b. median c. 2 nd quartile d. 50 th percentile ANS: A PTS: 1 4. An important measure of location for categorical data is the a. mean b. median c. mode d. margin ANS: C PTS: 1 5. The measure of variability easiest to compute, but seldom used as the only measure, is the a. range b. interquartile range c. standard deviation d. variance ANS: A PTS: 1 6. In computing descriptive statistics for grouped data, the ____ are used to approximate the data values in each class. a. class lower limits b. class upper limits c. class midpoints d. class ranges ANS: C PTS: 1 Modern Business Statistics with Microsoft Office Excel 4th Edition Anderson Test Bank Full Download: https://alibabadownload.com/product/modern-business-statistics-with-microsoft-office-excel-4th-edition-anderson- This sample only, Download all chapters at: AlibabaDownload.com
-
Upload
khangminh22 -
Category
Documents
-
view
1 -
download
0
Transcript of Modern Business Statistics with Microsoft Office Excel 4th ...

CHAPTER 3—DESCRIPTIVE STATISTICS: NUMERICAL MEASURES
MULTIPLE CHOICE
1. The interquartile range is the difference between the
a. first and second quartiles
b. first and third quartiles
c. second and third quartiles
d. second and fourth quartiles
ANS: B PTS: 1
2. The coefficient of determination is equal to the
a. absolute value of the correlation coefficient
b. squared value of the correlation coefficient
c. square-root of the correlation coefficient
d. inverse value of the correlation coefficient
ANS: B PTS: 1
3. Generally, which one of the following is the least appropriate measure of central tendency for a data
set that contains outliers?
a. mean
b. median
c. 2nd quartile
d. 50th percentile
ANS: A PTS: 1
4. An important measure of location for categorical data is the
a. mean
b. median
c. mode
d. margin
ANS: C PTS: 1
5. The measure of variability easiest to compute, but seldom used as the only measure, is the
a. range
b. interquartile range
c. standard deviation
d. variance
ANS: A PTS: 1
6. In computing descriptive statistics for grouped data, the ____ are used to approximate the data values
in each class.
a. class lower limits
b. class upper limits
c. class midpoints
d. class ranges
ANS: C PTS: 1
Modern Business Statistics with Microsoft Office Excel 4th Edition Anderson Test BankFull Download: https://alibabadownload.com/product/modern-business-statistics-with-microsoft-office-excel-4th-edition-anderson-test-bank/
This sample only, Download all chapters at: AlibabaDownload.com

7. Which of the following is not a measure of variability of a single variable?
a. range
b. covariance
c. standard deviation
d. coefficient of variation
ANS: B PTS: 1
8. The empirical rule states that, for data having a bell-shaped distribution, the percentage of data values
being within one standard deviation of the mean is approximately
a. 33
b. 50
c. 68
d. 95
ANS: C PTS: 1
9. A box plot is a graphical representation of data that is based on
a. the empirical rule
b. z-scores
c. a histogram
d. a five-number summary
ANS: D PTS: 1
10. The coefficient of variation indicates how large the standard deviation is relative to the
a. mean
b. median
c. range
d. variance
ANS: A PTS: 1
11. Which of the following descriptive statistics is not measured in the same units as the data?
a. 35th percentile
b. standard deviation
c. variance
d. interquartile range
ANS: C PTS: 1
12. A numerical measure computed from a sample, such as sample mean, is known as a
a. population parameter
b. sample parameter
c. sample statistic
d. population mean
ANS: C PTS: 1
13. A numerical measure, such as a mean, computed from a population is known as a
a. population parameter
b. sample parameter
c. sample statistic
d. sample mean
ANS: A PTS: 1

14. Since the population size is always larger than the sample size, then the sample statistic
a. can never be larger than the population parameter
b. can never be equal to the population parameter
c. can never be zero
d. None of the other answers are correct.
ANS: D PTS: 1
15. is an example of a
a. population parameter
b. sample statistic
c. population variance
d. mode
ANS: A PTS: 1
16. The mean of a sample is
a. always equal to the mean of the population
b. always smaller than the mean of the population
c. computed by summing the data values and dividing the sum by (n 1)
d. computed by summing all the data values and dividing the sum by the number of items
ANS: D PTS: 1
17. The mean of the sample
a. is always larger than the mean of the population from which the sample was taken
b. is always smaller than the mean of the population from which the sample was taken
c. can never be zero
d. None of the other answers are correct.
ANS: D PTS: 1
18. Since the population is always larger than the sample, the value of the sample mean
a. is always smaller than the true value of the population mean
b. is always larger than the true value of the population mean
c. is always equal to the true value of the population mean
d. could be larger, equal to, or smaller than the true value of the population mean
ANS: D PTS: 1
19. After the data has been arranged from smallest value to largest value, the value in the middle is called
the
a. range
b. median
c. mean
d. None of the other answers are correct.
ANS: B PTS: 1
20. If a data set has an even number of observations, the median
a. can not be determined
b. is the average value of the two middle items
c. must be equal to the mean
d. is the average value of the two middle items when all items are arranged in ascending
order

ANS: D PTS: 1
21. Since the median is the middle value of a data set, it must always be
a. smaller than the mode
b. larger than the mode
c. smaller than the mean
d. None of the other answers are correct.
ANS: D PTS: 1
22. The most frequently occurring value of a data set is called the
a. range
b. mode
c. mean
d. None of the other answers are correct.
ANS: B PTS: 1
23. Since the mode is the most frequently occurring data value, it
a. can never be larger than the mean
b. is always larger than the median
c. is always larger than the mean
d. None of the other answers are correct.
ANS: D PTS: 1
24. Excel's __________ function can be used to compute the mean.
a. MAX
b. AVERAGE
c. MEDIAN
d. MODE
ANS: B PTS: 1
25. Excel's __________ function can be used to compute the median.
a. MAX
b. AVERAGE
c. MEDIAN
d. MODE
ANS: C PTS: 1
26. Excel's __________ function can be used to compute the mode.
a. MAX
b. AVERAGE
c. MEDIAN
d. MODE.SNGL
ANS: D PTS: 1
27. Excel provides functions for computing the
a. mean
b. median
c. mode
d. Excel provides functions for all of these.

ANS: D PTS: 1
28. In computing the pth percentile, if the index i is an integer the pth percentile is the
a. data value in position i
b. data value in position i + 1
c. average of data values in position i and i + 1
ANS: C PTS: 1
29. The 50th percentile is the
a. mode
b. median
c. mean
d. third quartile
ANS: B PTS: 1
30. The 75th percentile is also the
a. first quartile
b. second quartile
c. third quartile
d. fourth quartile
ANS: C PTS: 1
31. The first quartile
a. contains at least one third of the data elements
b. is the same as the 25th percentile
c. is the same as the 50th percentile
d. is the same as the 75th percentile
ANS: B PTS: 1
32. Which of the following is not a measure of location?
a. mean
b. median
c. variance
d. mode
ANS: C PTS: 1
33. The median of a sample will always equal the
a. mode
b. mean
c. 50th percentile
d. all of these answers are correct
ANS: C PTS: 1
34. The measure of location that is the most likely to be influenced by extreme values in the data set is the
a. range
b. median
c. mode
d. mean
ANS: D PTS: 1

Exhibit 3-1
A researcher has collected the following sample data.
5 12 6 8 5
6 7 5 12 4
35. Refer to Exhibit 3-1. The median is
a. 5
b. 6
c. 7
d. 8
ANS: B PTS: 1
36. Refer to Exhibit 3-1. The mode is
a. 5
b. 6
c. 7
d. 8
ANS: A PTS: 1
37. Refer to Exhibit 3-1. The mean is
a. 5
b. 6
c. 7
d. 8
ANS: C PTS: 1
38. Refer to Exhibit 3-1. The 75th percentile is
a. 5
b. 6
c. 7
d. 8
ANS: D PTS: 1
Exhibit 3-2
A researcher has collected the following sample data. The mean of the sample is 5.
3 5 12 3 2
39. Refer to Exhibit 3-2. The variance is
a. 80
b. 4.062
c. 13.2
d. 16.5
ANS: D PTS: 1
40. Refer to Exhibit 3-2. The standard deviation is
a. 8.944
b. 4.062
c. 13.2
d. 16.5
ANS: B PTS: 1
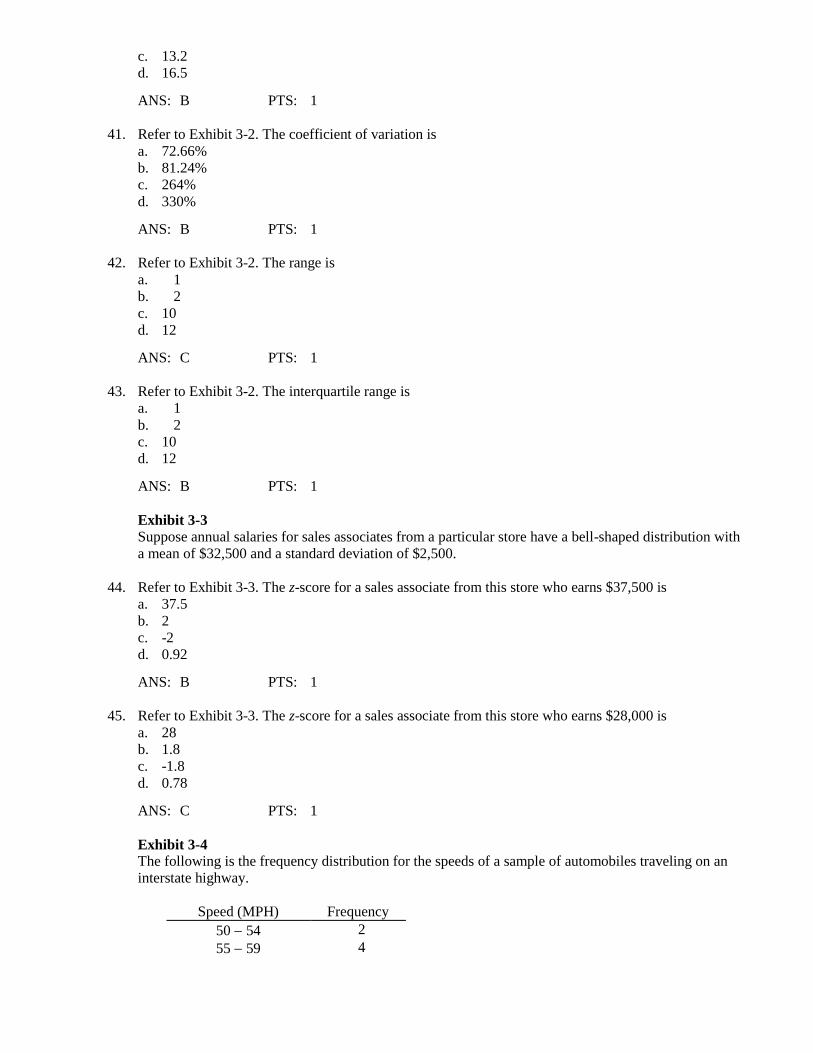
41. Refer to Exhibit 3-2. The coefficient of variation is
a. 72.66%
b. 81.24%
c. 264%
d. 330%
ANS: B PTS: 1
42. Refer to Exhibit 3-2. The range is
a. 1
b. 2
c. 10
d. 12
ANS: C PTS: 1
43. Refer to Exhibit 3-2. The interquartile range is
a. 1
b. 2
c. 10
d. 12
ANS: B PTS: 1
Exhibit 3-3
Suppose annual salaries for sales associates from a particular store have a bell-shaped distribution with
a mean of $32,500 and a standard deviation of $2,500.
44. Refer to Exhibit 3-3. The z-score for a sales associate from this store who earns $37,500 is
a. 37.5
b. 2
c. -2
d. 0.92
ANS: B PTS: 1
45. Refer to Exhibit 3-3. The z-score for a sales associate from this store who earns $28,000 is
a. 28
b. 1.8
c. -1.8
d. 0.78
ANS: C PTS: 1
Exhibit 3-4
The following is the frequency distribution for the speeds of a sample of automobiles traveling on an
interstate highway.
Speed (MPH) Frequency
50 54 2
55 59 4

60 64 5
65 69 10
70 74 9
75 79 5
35
46. Refer to Exhibit 3-4. The mean is
a. 35
b. 670
c. 10
d. 67
ANS: D PTS: 1
47. Refer to Exhibit 3-4. The variance is
a. 6.969
b. 7.071
c. 48.570
d. 50.000
ANS: D PTS: 1
48. Refer to Exhibit 3-4. The standard deviation is
a. 6.969
b. 7.071
c. 48.570
d. 50.000
ANS: B PTS: 1
49. The difference between the largest and the smallest data values is the
a. variance
b. interquartile range
c. range
d. coefficient of variation
ANS: C PTS: 1
50. The interquartile range is
a. the 50th percentile
b. another name for the variance
c. the difference between the largest and smallest values
d. the difference between the third quartile and the first quartile
ANS: D PTS: 1
51. The interquartile range is used as a measure of variability to overcome what difficulty of the range?
a. the sum of the range variances is zero
b. the range is difficult to compute
c. the range is influenced too much by extreme values
d. the range is negative
ANS: C PTS: 1
52. The sample variance

a. is always smaller than the true value of the population variance
b. is always larger than the true value of the population variance
c. could be smaller, equal to, or larger than the true value of the population variance
d. can never be zero
ANS: C PTS: 1
53. The variance of the sample
a. can never be negative
b. can be negative
c. cannot be zero
d. cannot be less than one
ANS: A PTS: 1
54. The population variance can never be
a. zero
b. larger than the standard deviation
c. negative
d. all of these are correct
ANS: C PTS: 1
55. The sum of deviations of the individual data elements from their mean is
a. always greater than zero
b. always less than zero
c. sometimes greater than and sometimes less than zero, depending on the data elements
d. always equal to zero
ANS: D PTS: 1
56. The value of the sum of the squared deviations from the mean, i.e., must always be
a. less than the mean
b. negative
c. either positive or negative depending on whether the mean is negative or positive
d. at least zero
ANS: D PTS: 1
57. If the variance of a data set is correctly computed with the formula using n 1 in the denominator,
which of the following is true?
a. the data set is a sample
b. the data set is a population
c. the data set could be either a sample or a population
d. the data set is from a census
ANS: A PTS: 1
58. During a cold winter, the temperature stayed below zero for ten days (ranging from -20 to -5). The
variance of the temperatures of the ten day period
a. is negative since all the numbers are negative
b. must be at least zero
c. can not be computed since all the numbers are negative
d. can be either negative or positive
ANS: B PTS: 1

59. The variance of a sample of 81 observations equals 64. The standard deviation of the sample equals
a. 0
b. 4096
c. 8
d. 6,561
ANS: C PTS: 1
60. The standard deviation of a sample of 100 observations equals 64. The variance of the sample equals
a. 8
b. 10
c. 6,400
d. 4,096
ANS: D PTS: 1
61. The numerical value of the standard deviation can never be
a. larger than the variance
b. zero
c. negative
d. all of these statements are correct
ANS: C PTS: 1
62. Excel's __________ function can be used to compute the sample variance.
a. MAX
b. MODE
c. VAR.S
d. STDEV
ANS: C PTS: 1
63. Excel's __________ function can be used to compute the population variance.
a. MAX
b. MODE
c. VAR
d. None of the other answers are correct.
ANS: D PTS: 1
64. Excel's __________ function can be used to compute the sample standard deviation.
a. MAX
b. MODE
c. VAR
d. STDEV.S
ANS: D PTS: 1
65. Excel's __________ function can be used to compute the population standard deviation.
a. MAX
b. MODE
c. STDEV
d. None of the other answers are correct.
ANS: D PTS: 1

66. The coefficient of variation is
a. the same as the variance
b. the square root of the variance
c. the square of the standard deviation
d. None of the other answers are correct.
ANS: D PTS: 1
67. The weights (in pounds) of a sample of 36 individuals were recorded and the following statistics were
calculated
mean 160 range 60
mode 165 variance 324
median 170
The coefficient of variation equals
a. 0.1125%
b. 11.25%
c. 203.12%
d. 0.20312%
ANS: B PTS: 1
68. Which of the following is a measure of dispersion?
a. percentiles
b. quartiles
c. interquartile range
d. all of these are measures of dispersion
ANS: C PTS: 1
69. Which of the following is not a measure of dispersion?
a. the range
b. the 50th percentile
c. the standard deviation
d. the interquartile range
ANS: B PTS: 1
70. The measure of dispersion that is influenced most by extreme values is
a. the variance
b. the standard deviation
c. the range
d. the interquartile range
ANS: C PTS: 1
71. The descriptive measure of dispersion that is based on the concept of a deviation about the mean is
a. the range
b. the interquartile range
c. both the range and the interquartile range
d. the standard deviation
ANS: D PTS: 1
72. If two groups of numbers have the same mean, then their
a. standard deviations must also be equal
b. medians must also be equal
c. modes must also be equal
d. None of the other answers are correct.
ANS: D PTS: 1
73. The descriptive measure that is not measured in the same units as the original data is the
a. median
b. standard deviation
c. mode
d. variance
ANS: D PTS: 1
74. Which of the following symbols represents the size of the population?
a. 2 b. c. d. N
ANS: D PTS: 1
75. Which of the following symbols represents the size of the sample?
a. 2 b. c. N
d. n
ANS: D PTS: 1
76. Which of the following symbols represents the mean of the population?
a. 2 b. c. d.
ANS: C PTS: 1
77. Which of the following symbols represents the mean of the sample?
a. 2
b. c. d.
ANS: D PTS: 1
78. Which of the following symbols represents the variance of the population?
a. 2
b. c. d.
ANS: A PTS: 1
79. The symbol 2 is used to represent the
a. variance of the population
b. standard deviation of the sample
c. standard deviation of the population
d. None of the other answers are correct.
ANS: A PTS: 1
80. Which of the following symbols represents the standard deviation of the population?
a. 2
b. c. d.
ANS: B PTS: 1
81. The symbol is used to represent the
a. variance of the population
b. standard deviation of the sample
c. standard deviation of the population
d. None of the other answers are correct.
ANS: C PTS: 1
82. The __________ denotes the number of standard deviations xi is from the mean .
a. range
b. median
c. z-score
d. third quartile
ANS: C PTS: 1
83. A(n) __________ is an unusually small or unusually large data value.
a. sample statistic
b. median
c. z-score
d. outlier
ANS: D PTS: 1
84. __________ can be used to make statements about the proportion of data values that must be within a
specified number of standard deviations of the mean.
a. Chebyshev's theorem
b. The empirical rule
c. A five-number summary
d. A box plot
ANS: A PTS: 1
85. __________ can be used to determine the percentage of data values that must be within one, two, and
three standard deviations of the mean for data having a bell-shaped distribution.
a. Chebyshev's theorem
b. empirical rule
c. five-number summary

d. box plot
ANS: B PTS: 1
86. In a five-number summary, which of the following is not used for data summarization?
a. the smallest value
b. the largest value
c. the median
d. the mean
ANS: D PTS: 1
87. A graphical summary of data that is based on a five-number summary is a
a. histogram
b. stem-and-leaf display
c. scatter diagram
d. box plot
ANS: D PTS: 1
88. A numerical measure of linear association between two variables is the
a. variance
b. covariance
c. standard deviation
d. coefficient of variation
ANS: B PTS: 1
89. Positive values of covariance indicate
a. a positive variance of the x values
b. a positive variance of the y values
c. the standard deviation is positive
d. a positive relation between the x and the y variables
ANS: D PTS: 1
90. Excel's __________ function can be used to compute the sample covariance.
a. MAX
b. COVARIANCE.S
c. VAR
d. CORREL
ANS: B PTS: 1
91. A numerical measure of linear association between two variables is the
a. variance
b. z-score
c. correlation coefficient
d. None of the other answers are correct.
ANS: C PTS: 1
92. The correlation coefficient ranges between
a. 0 and 1
b. 1 and 1
c. minus infinity and plus infinity
d. 1 and 100
ANS: B PTS: 1
93. The correlation coefficient
a. is the same as the covariance
b. can be larger than 1
c. cannot be larger than 1
d. cannot be negative
ANS: C PTS: 1
94. Excel's __________ function can be used to compute the sample correlation coefficient.
a. MAX
b. COVAR
c. VAR
d. CORREL
ANS: D PTS: 1
95. A mean computed in such a way that each data value is given a weight reflecting its importance is
referred to as
a. an important mean
b. a trimmed mean
c. a weighted mean
d. a heavy mean
ANS: C PTS: 1
96. In computing descriptive statistics from grouped data,
a. data values are treated as if they occur at the midpoint of a class
b. the grouped data result is more accurate than the ungrouped result
c. the grouped data computations are used only when a population is being analyzed
d. All of these answers are correct.
ANS: A PTS: 1
97. When should measures of location and dispersion be computed from grouped data rather than from
individual data values?
a. as much as possible since computations are easier
b. only when individual data values are unavailable
c. whenever computer packages for descriptive statistics are unavailable
d. only when the data are from a population
ANS: B PTS: 1
98. An important numerical measure of the shape of a distribution is the
a. correlation coefficient
b. variance
c. skewness
d. relative location
ANS: C PTS: 1
99. If the data distribution is symmetric, the skewness is
a. 0

b. .5
c. 1
d. None of the other answers is correct.
ANS: A PTS: 1
100. For data skewed to the left, the skewness is
a. between 0 and .5
b. less than 1
c. positive
d. negative
ANS: D PTS: 1
101. When the data are positively skewed, the mean will usually be
a. less than the median
b. greater than the median
c. less than the mode
d. greater than the mode
ANS: B PTS: 1
PROBLEM
1. The hourly wages of a sample of eight individuals is given below.
Individual Hourly Wage ($)
A 27
B 25
C 20
D 10
E 12
F 14
G 17
H 19
For the above sample, determine the following measures:
a. The mean.
b. The standard deviation.
c. The 25th percentile.
ANS:
a. 18
b. 6
c. 13
PTS: 1
2. In 1998, the average age of students at UTC was 22 with a standard deviation of 3.96. In 1999, the
average age was 24 with a standard deviation of 4.08. In which year do the ages show a more
dispersed distribution? Show your complete work and support your answer.
ANS:
C.V. for 1998 18% Therefore 1997 shows a more dispersed distribution.
C.V. for 1999 17%
PTS: 1
3. For the following data
5 7 9 11 15 19
Compute the following measures:
a. The mean
b. The variance
c. The standard deviation
d. The coefficient of variation
e. The 25th percentile
f. The median
g. The 75th percentile
ANS:
a. 11
b. 27.2
c. 5.22
d. 47.41
e. 7
f. 10
g. 15
PTS: 1
4. For the following data
20 18 17 23 22 19 21 17 23
Compute the following measures:
a. The mean
b. The variance
c. The standard deviation
d. The coefficient of variation
e. The 25th percentile
f. The median
g. The 75th percentile
ANS:
a. 20
b. 5.75
c. 2.4
d. 11.99
e. 18
f. 20
g. 22
PTS: 1

5. A private research organization studying families in various countries reported the following data for
the amount of time 4-year old children spent alone with their fathers each day.
Country Time with Dad (minutes)
Belgium 30
Canada 44
China 54
Finland 50
Germany 36
Nigeria 42
Sweden 46
United States 42
For the above sample, determine the following measures:
a. The mean
b. The standard deviation
c. The mode
d. The 75th percentile
ANS:
a. 43
b. 7.56
c. 42
d. 48
PTS: 1
6. The following data show the yearly salaries of football coaches at some state-supported universities.
University Salary ($1,000)
A 53
B 44
C 68
D 47
E 62
F 59
G 53
H 94
For the above sample, determine the following measures.
a. The mean yearly salary
b. The standard deviation
c. The mode
d. The median
e. The 70th percentile
ANS:
a. 60
b. 15.8
c. 53
d. 56
e. 62

PTS: 1
7. The amount of time that a sample of students spends watching television per day is given below.
Student Time (minutes)
1 40
2 28
3 71
4 48
5 49
6 35
7 40
8 57
a. Compute the mean.
b. Compute the median.
c. Compute the standard deviation.
d. Compute the 75th percentile.
ANS:
a. 46
b. 44
c. 13.5
d. 53
PTS: 1
8. The number of hours worked per week for a sample of ten students is shown below.
Student Hours
1 20
2 0
3 18
4 16
5 22
6 40
7 8
8 6
9 30
10 40
a. Determine the median and explain its meaning.
b. Compute the 70th percentile and explain its meaning.
c. What is the mode of the above data? What does it signify?
ANS:
a. 19; approximately 50% of the students work at least 19 hours
b. 26; at least 70% of the students work less than or equal to 26 hours per week
c. 40; the most frequent data element
PTS: 1

9. A researcher has obtained the number of hours worked per week during the summer for a sample of
fifteen students.
40 25 35 30 20 40 30 20 40 10 30 20 10 5 20
Using this data set, compute the
a. median
b. mean
c. mode
d. 40th percentile
e. range
f. sample variance
g. standard deviation
ANS:
a. 25
b. 25
c. 20
d. 20
e. 35
f. 128.571
g. 11.339
PTS: 1
10. A sample of twelve families was taken. Each family was asked how many times per week they dine in
restaurants. Their responses are given below.
2 1 0 2 0 2 1 2 0 2 1 2
Using this data set, compute the
a. mode
b. median
c. mean
d. range
e. interquartile range
f. variance
g. standard deviation
h. coefficient of variation
ANS:
a. 2
b. 1.5
c. 1.25
d. 2
e. 1.5
f. 0.75
g. 0.866
h. 69.28%
PTS: 1
11. A sample of 9 mothers was taken. The mothers were asked the age of their oldest child. You are given
their responses below.
3 12 4 7 14 6 2 9 11
a. Compute the mean.
b. Compute the variance.
c. Compute the standard deviation.
d. Compute the coefficient of variation.
e. Determine the 25th percentile.
f. Determine the median
g. Determine the 75th percentile.
h. Determine the range.
ANS:
a. 7.56
b. 17.78
c. 4.22
d. 55.8
e. 4.0
f. 7.0
g. 11
h. 12
PTS: 1
12. A sample of 11 individuals shows the following monthly incomes.
Individual Income ($)
1 1,500
2 2,000
3 2,500
4 4,000
5 4,000
6 2,500
7 2,000
8 4,000
9 3,500
10 3,000
11 43,000
a. What would be a representative measure of central location for the above data? Explain.
b. Determine the mode.
c. Determine the median.
d. Determine the 60th percentile.
e. Drop the income of individual number 11 and compute the standard deviation for the first 10
individuals.
ANS:
a. Median, because the income of individual 11 is unusually high.
b. 4000
c. 3000
d. 3500

e. 936.90
PTS: 1
13. Suppose annual salaries for sales associates from a particular store have a mean of $32,500 and a
standard deviation of $2,500.
a. Calculate and interpret the z-score for a sales associate who makes $36,000.
b. Use Chebyshev's theorem to calculate the percentage of sales associates with salaries between
$26,250 and $38,750.
c. Suppose that the distribution of annual salaries for sales associates at this store is bell-shaped.
Use the empirical rule to calculate the percentage of sales associates with salaries between
$27,500 and $37,500.
d. Use the empirical rule to determine the percentage of sales associates with salaries less than
$27,500.
e. Still suppose that the distribution of annual salaries for sales associates at this store is
bell-shaped. A sales associate makes $42,000. Should this salary be considered an outlier?
Explain.
ANS:
a. 1.4. This sales associate's annual salary is 1.4 standard deviations higher than the mean annual
salary for sales associates from this store.
b. 84%
c. 95%
d. 2.5%
e. Yes because this salary is more than 3 standard deviations from the mean. It has a z-score of
3.8.
PTS: 1
14. Provide a five-number summary for the follow data.
115 191 153 194 236
184 216 185 183 202
ANS:
Smallest 115,
Q1 183,
Median 188,
Q3 202,
Largest 236
PTS: 1
15. The following observations are given for two variables.
y x
5 2
8 12
18 3
20 6
22 11
30 19
10 18

7 9
a. Compute and interpret the sample covariance for the above data.
b. Compute and interpret the sample correlation coefficient.
ANS:
a. 19.286 (rounded). Since the covariance is positive, it indicates a positive relationship between x
and y.
b. 0.345. There is a positive relationship between x and y. The relationship is not very strong.
PTS: 1
16. The following data represent the daily demand (y in thousands of units) and the unit price (x in dollars)
for a product.
Daily Demand (y) Unit Price (x)
47 1
39 3
35 5
44 3
34 6
20 8
15 16
30 6
a. Compute and interpret the sample covariance for the above data.
b. Compute and interpret the sample correlation coefficient.
ANS:
a. -160.14 (rounded). Since the covariance is negative, it indicates a negative relationship
between x and y.
b. -0.922. There is a strong negative relationship between daily demand and unit price.
PTS: 1
17. Compute the weighted mean for the following data.
xi Weight (wi)
9 10
8 12
5 4
3 5
2 3
ANS:
6.676
PTS: 1
18. Compute the weighted mean for the following data.
xi Weight (wi)
19 12
17 30
14 28
13 10
18 10
ANS:
16
PTS: 1
19. Paul, a freshman at a local college just completed 15 credit hours. His grade report is presented below.
Course Credit Hours Grades
Calculus 5 C
Biology 4 A
English 3 D
Music 2 B
P.E. 1 A
The local university uses a 4 point grading system, i.e., A 4, B 3, C 2, D 1, F 0. Compute
Paul's semester grade point average.
ANS:
2.6
PTS: 1
20. Consider the data in the following frequency distribution. Assume the data represent a population.
Class Frequency
2 6 2
7 11 3
12 16 4
17 21 1
For the above data, compute the following.
a. The mean
b. The variance
c. The standard deviation
ANS:
a. 11
b. 21
c. 4.58
PTS: 1
21. The following frequency distribution shows the ACT scores of a sample of students:
Score Frequency
14 18 2
19 23 5
24 28 12

29 33 1
For the above data, compute the following.
a. The mean
b. The standard deviation
ANS:
a. 24
b. 3.77
PTS: 1
22. The following is a frequency distribution of grades for a statistics examination.
Examination Grade Frequency
40 49 3
50 59 5
60 69 11
70 79 22
80 89 15
90 99 6
Treating these data as a sample, compute the following:
a. The mean
b. The standard deviation
c. The variance
d. The coefficient of variation
ANS:
a. 74.016
b. 12.601
c. 158.778
d. 17.02%
PTS: 1
23. The starting salaries of a sample of college students are given below.
Starting Salary ($1000s) Frequency
10 14 2
15 19 3
20 24 5
25 29 7
30 34 2
35 39 1
a. Compute the mean.
b. Compute the variance.
c. Compute the standard deviation.
d. Compute the coefficient of variation.
ANS:

a. 23.7
b. 42.83
c. 6.54
d. 27.59
PTS: 1
24. The following frequency distribution shows the time (in minutes) that a sample of students uses the
computer terminals per day.
Time (minutes) Frequency
20 39 2
40 59 4
60 79 6
80 99 4
100 119 2
a. Compute the mean.
b. Compute the variance.
c. Compute the standard deviation.
d. Compute the coefficient of variation.
ANS:
a. 69.5
b. 564.54
c. 23.76
d. 34.19%
PTS: 1
25. A sample of charge accounts at a local drug store revealed the following frequency distribution of
unpaid balances.
Unpaid Balance ($) Frequency
10 29 5
30 49 10
50 69 6
70 89 9
90 109 20
a. Determine the mean unpaid balance.
b. Determine the standard deviation.
c. Compute the coefficient of variation.
ANS:
a. 71.1
b. 28.88
c. 40.62%
PTS: 1
26. The following is a frequency distribution for the ages of a sample of employees at a local company.
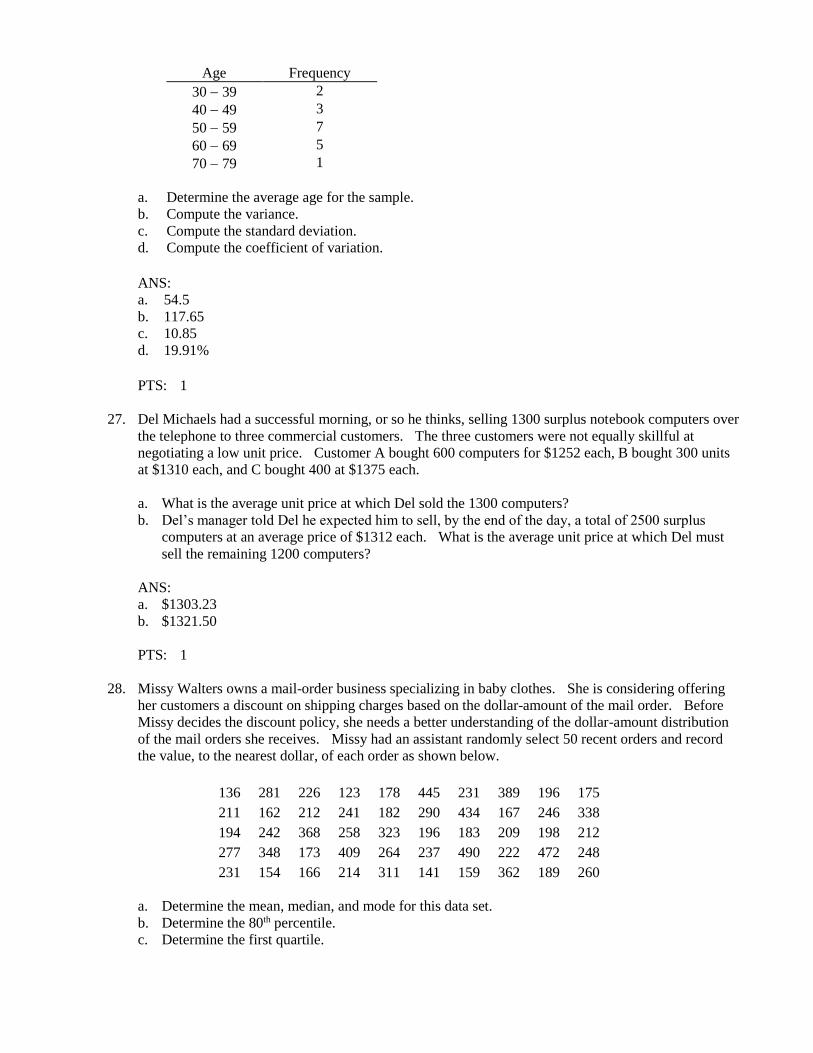
Age Frequency
30 39 2
40 49 3
50 59 7
60 69 5
70 79 1
a. Determine the average age for the sample.
b. Compute the variance.
c. Compute the standard deviation.
d. Compute the coefficient of variation.
ANS:
a. 54.5
b. 117.65
c. 10.85
d. 19.91%
PTS: 1
27. Del Michaels had a successful morning, or so he thinks, selling 1300 surplus notebook computers over
the telephone to three commercial customers. The three customers were not equally skillful at
negotiating a low unit price. Customer A bought 600 computers for $1252 each, B bought 300 units
at $1310 each, and C bought 400 at $1375 each.
a. What is the average unit price at which Del sold the 1300 computers?
b. Del’s manager told Del he expected him to sell, by the end of the day, a total of 2500 surplus
computers at an average price of $1312 each. What is the average unit price at which Del must
sell the remaining 1200 computers?
ANS:
a. $1303.23
b. $1321.50
PTS: 1
28. Missy Walters owns a mail-order business specializing in baby clothes. She is considering offering
her customers a discount on shipping charges based on the dollar-amount of the mail order. Before
Missy decides the discount policy, she needs a better understanding of the dollar-amount distribution
of the mail orders she receives. Missy had an assistant randomly select 50 recent orders and record
the value, to the nearest dollar, of each order as shown below.
136 281 226 123 178 445 231 389 196 175
211 162 212 241 182 290 434 167 246 338
194 242 368 258 323 196 183 209 198 212
277 348 173 409 264 237 490 222 472 248
231 154 166 214 311 141 159 362 189 260
a. Determine the mean, median, and mode for this data set.
b. Determine the 80th percentile. c. Determine the first quartile.
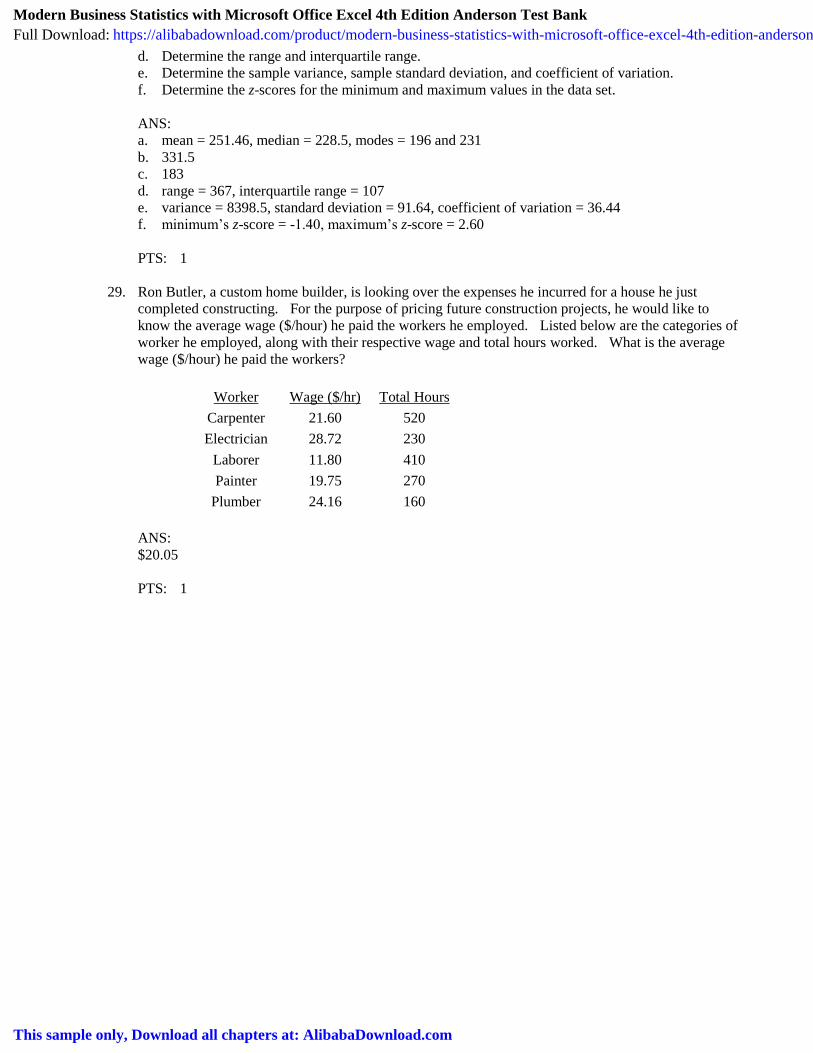
d. Determine the range and interquartile range.
e. Determine the sample variance, sample standard deviation, and coefficient of variation.
f. Determine the z-scores for the minimum and maximum values in the data set.
ANS:
a. mean = 251.46, median = 228.5, modes = 196 and 231
b. 331.5 c. 183
d. range = 367, interquartile range = 107
e. variance = 8398.5, standard deviation = 91.64, coefficient of variation = 36.44
f. minimum’s z-score = -1.40, maximum’s z-score = 2.60
PTS: 1
29. Ron Butler, a custom home builder, is looking over the expenses he incurred for a house he just
completed constructing. For the purpose of pricing future construction projects, he would like to
know the average wage ($/hour) he paid the workers he employed. Listed below are the categories of
worker he employed, along with their respective wage and total hours worked. What is the average
wage ($/hour) he paid the workers?
Worker Wage ($/hr) Total Hours
Carpenter 21.60 520
Electrician 28.72 230
Laborer 11.80 410
Painter 19.75 270
Plumber 24.16 160
ANS:
$20.05
PTS: 1
Modern Business Statistics with Microsoft Office Excel 4th Edition Anderson Test BankFull Download: https://alibabadownload.com/product/modern-business-statistics-with-microsoft-office-excel-4th-edition-anderson-test-bank/
This sample only, Download all chapters at: AlibabaDownload.com