Rehabilitation of Patients with Moderate Knee Osteoarthritis ...
Upload
khangminh22Category
view
1download
0
Moderate alcohol consumption, adiponectin, inflammation and type 2
diabetes risk
Prospective cohort studies and randomized crossover trials
Michel M. Joosten
Thesis committee Thesis supervisor Prof. dr. R.F. Witkamp Professor of Nutrition and Pharmacology, Wageningen University Thesis co-supervisor Dr. H.F.J. Hendriks Senior scientist, TNO Quality of Life, Zeist Other members Dr. E.B. Rimm, Harvard School of Public Health, Boston, MA, U.S.A. Prof. dr. ir. E.J.M. Feskens, Wageningen University Prof. dr. ir. R.P. Mensink, Maastricht University, Maastricht Prof. dr. ir. L.M. Havekes, Leiden University Medical Center, Leiden This research was conducted under the auspices of the Graduate School VLAG (Food Technology, Agrobiotechnology, Nutrition and Health Sciences).

Moderate alcohol consumption, adiponectin, inflammation and type 2 diabetes risk
Prospective cohort studies and randomized crossover trials
Michel M. Joosten
Thesis submitted in fulfillment of the requirements for the degree of doctor
at Wageningen University by the authority of the Rector Magnificus
Prof. dr. M.J. Kropff, in the presence of the
Thesis Committee appointed by the Academic Board to be defended in public
on Wednesday 12 January 2011 at 1:30 p.m. in the Aula.

Michel M. Joosten Moderate alcohol consumption, adiponectin, inflammation and type 2 diabetes risk - Prospective cohort studies and randomized crossover trials, 192 pages. Thesis Wageningen University, Wageningen, NL (2010) With references, with summaries in Dutch and English ISBN 978-90-8585-825-6

Aan mijn ouders
If you admire someone, you should go ahead and tell them, people hardly ever get the flowers while they can still smell them

Abstract Background: Moderate alcohol consumption has been associated with a lower risk of type 2 diabetes in various populations. However, the underlying mechanisms are not entirely clear. The aims of this thesis were 1) to substantiate the evidence of the association between alcohol consumption and type 2 diabetes in observational research and 2) to examine physiological mechanisms in randomized trials with specific attention to adiponectin, inflammation and insulin sensitivity which may mediate the association between alcohol consumption and type 2 diabetes. Methods: Two prospective cohort studies, one among 38,031 U.S. men (age: 45-75 y) of the Health Professionals Follow up Study (HPFS) and one among 35,625 Dutch men and women (age: 20-70 y) of the European Prospective Investigation into Cancer and Nutrition (EPIC)-NL cohort. Four randomized, crossover trials of eight to twelve weeks with consumption of 25-30 g alcohol/day in the form of vodka with orange juice, beer, or white wine (twice) compared to orange juice, alcohol free beer, white grape juice or water among 24 young men, 24 premenopausal and 36 and 22 postmenopausal women, respectively. Results: A 7.5 g/day increase in alcohol consumption over four years was associated with lower diabetes risk among initial non-drinkers (hazard ratio [HR]: 0.78; 95% confidence interval (CI): 0.60, 1.00) and drinkers initially consuming <15 g/d (HR: 0.89; 95% CI: 0.83, 0.96) but not among men initially drinking ≥15 g/d (HR: 0.99; 95% CI: 0.95, 1.02) (Pinteraction < 0.01) in U.S. men. Among Dutch subjects with ≥3 out of 4 low-risk lifestyle behaviors, moderate alcohol consumption was associated with a lower risk of type 2 diabetes compared with abstention (HR: 0.56; 95% CI: 0.32, 1.00).
In the randomized crossover trials, alcohol consumption consistently increased circulating adiponectin levels by about 10% compared to abstention (P < 0.05) regardless of beverage type, gender or age. These increases were evident after a minimum of three weeks of alcohol consumption. Moderate alcohol consumption also increased expression of the gene encoding adiponectin in adipose tissue and lowered serum fasting insulin and triglyceride levels (all P < 0.05). An integrated approach of large-scale profiling of proteins and genes revealed that moderate alcohol consumption for four weeks altered gene expression profiles of white blood cells and circulating markers related to inflammation in men (all P < 0.05). However, we did not observe an attenuated inflammatory response after a low-dose in vivo endotoxin bolus, despite increased high-density lipoprotein cholesterol and apolipoprotein levels after four weeks of alcohol consumption compared to abstention. Six minutes of oral white wine exposure without swallowing substantially (-20%; P < 0.05) and temporarily (~20 min) decreased circulating free fatty acid concentrations compared with oral water exposure.
Conclusions: Moderate alcohol consumption was associated with a lower risk of type 2 diabetes compared with abstention. The association persisted among subjects already at low risk based on combined favorable lifestyle behaviors. Also, increases in alcohol consumption among initially rare and light drinking men were associated with higher adiponectin levels and lower risk of type 2 diabetes. Increased adiponectin levels, anti-inflammatory effects and decreased insulin and triglyceride levels, may partially explain the inverse association between moderate alcohol consumption and type 2 diabetes.
Table of contents 1. General introduction 11 Prospective cohort studies 2. Changes in alcohol consumption and subsequent risk of type 2 diabetes in men
(Diabetes; accepted) 31
3. Combined effect of alcohol consumption and lifestyle behaviors on risk of type 2
diabetes (American Journal of Clinical Nutrition 2010; 91:1777-83)
49
Randomized crossover trials 4. Moderate alcohol consumption increases insulin sensitivity and ADIPOQ
expression in postmenopausal women: a randomized, crossover trial (Diabetologia. 2008; 51:1375-81)
69
5. Moderate alcohol consumption alters leukocyte gene expression profiles and
proteins related to immune response and lipid metabolism in men (Submitted in revised form)
85
6. Alterations in total and high-molecular weight adiponectin after three weeks of
moderate alcohol consumption in premenopausal women (Submitted in revised form)
103
7. Alcohol-induced increase in lipoproteins does not alter inflammatory response after
low-dose in vivo endotoxin challenge in men (Submitted)(Submitted in revised form)
115
8. Short-term oral exposure to white wine transiently lowers serum free fatty acids
(Appetite. 2010; 55:124-9) 131
9. General discussion 147 Summary 171 Lay summary in Dutch (Samenvatting voor niet-ingewijden) 175 Acknowledgement (Dankwoord) 181 About the author 187


Chapter 1
General introduction
| Chapter 1
12
Alcohol consumption: what’s (in) a drink? The term ‘alcohol’ in alcohol consumption commonly refers to ethanol or ethyl alcohol, a 2-carbon alcohol, which is the dominant bioactive compound in all alcoholic beverages. It is safe to say that alcohol is both a tonic and a poison. The difference lies mostly in the dose. Moderate alcohol consumption is associated with lower total mortality (1), cardiovascular diseases (2;3) and type 2 diabetes (4) but also with increased breast cancer risk among women (5) compared with abstention. Excessive alcohol consumption is associated with an increased risk of injuries and accidents (6;7), liver diseases (8;9), several forms of cancer (5), alcohol dependence and alcoholism. The quantity of alcohol consumed thus determines how it affects overall health and well-being. In 2006, the Dutch Health Council stated that “People who consume alcohol are well advised to limit their intake; adult men should drink no more than two standard Dutch units per day, and adult women no more than one unit. Binge drinking should be avoided. Alcohol consumption is inadvisable for the under-eighteens, and for pregnant women, women who are seeking to become pregnant and women who are breastfeeding” (10). According to the 2005 United States Department of Agriculture (USDA) Dietary Guidelines (11), moderate drinking is considered to be no more than one drink per day for women and no more than two drinks/day for men. Guidelines for sensible drinking set by the U.K. government in 1995 are 3 to 4 units or less for men and 2 to 3 units or less for women (12).
In the Netherlands a standard unit of beer (250 mL), wine (100 mL) and spirits (35 mL) all contain around 10 g of pure alcohol. In the United States typical serving sizes consist of one 12-ounce bottle of beer, one 5-ounce glass of wine, or 1.5 ounces of 80-proof distilled liquor equaling around 14 to 15 g of alcohol per serving (13) whereas a standard unit of alcohol in the United Kingdom equals 8 g of alcohol. Thus, at the upper limits, moderate drinking would be between 10 to 20 g of alcohol/day for women and 20 to 30 g/day for men, depending which guideline one uses.
Given differences in first-pass metabolism, volume of distribution, and overall body size between men and women (14), women experience toxic effects at approximately half the daily dose of alcohol of men. This notion is reflected in sex-specific limits that these above mentioned guidelines endorse. Diabetes mellitus: etiology Diabetes mellitus, often simply referred to as diabetes, is a disorder characterized by hyperglycemia (chronic elevated blood glucose levels) from defects in insulin secretion, insulin sensitivity, or both. These high blood glucose levels produce the classical symptoms of polyuria (frequent urination), and polydipsia (increased thirst). Diabetes is associated with increased morbidity and mortality. Complications include retinopathy, neuropathy and
General introduction |
13
renal failure. Several forms of diabetes can be distinguished. Type 1 diabetes mellitus, also known as insulin-dependent diabetes, is caused by defects in pancreatic function leading to an inability to produce sufficient amount of insulin. This type of diabetes is often diagnosed at early age and accounts for less then 5% of the diabetes cases.
Type 2 diabetes mellitus, formerly non-insulin-dependent diabetes mellitus or adult-onset diabetes, is the most common form of diabetes and accounts for approximately 90 to 95% of the cases of diabetes. As of 2000 at least 171 million people worldwide suffer from diabetes, or 2.8% of the population (15). Type 2 diabetes is a metabolic disorder that is characterized by high blood glucose in the context of insulin resistance and abnormal insulin secretion. It is caused by a combination of an impairment of the β-cells to release sufficient insulin (β-cell dysfunction) and an impaired metabolic response of peripheral tissues to circulating insulin (insulin resistance).
The underlying mechanisms leading to insulin resistance and β-cell dysfunction are still subject of research. Recently, obesity has been associated with a chronic low-grade inflammatory state of adipose tissue (16;17) in which circulating concentrations of inflammatory mediators such as tumor necrosis factor alpha (TNF-α) interleukin-6 (IL-6) and C-reactive protein (CRP) are increased (18). Low-grade inflammatory changes have been shown to precede type 2 diabetes by many years (19;20).
Besides elevated glucose concentrations, circulating free fatty acid (FFA) concentrations are also increased in obese persons, which lead to a reduction of glucose uptake in adipose tissue and skeletal muscles and in a stimulation of glucose output from the liver. In response to elevated glucose and FFA concentrations various tissues and cell types have been shown to release inflammatory mediators.
Finally, adipose tissue is known to secrete various signaling peptides – the adipokines – influencing insulin sensitivity, inflammation and food intake (21). The most abundant adipokine is adiponectin. Adiponectin is thought be involved in glucose and lipid metabolism (22). Higher adiponectin levels have been consistently associated with a lower risk of type 2 diabetes (23) and cardiovascular disease (24). Moreover, adiponectin is positively associated with insulin sensitivity (25) and inversely with inflammatory markers (26). Modifiable lifestyle factors Although genetic elements are involved in the development of pre-diabetes and type 2 diabetes, the rapid changes in incidence rates during the last decades suggest a particularly important role for lifestyle related factors. Compelling evidence from epidemiologic studies and lifestyle interventions indicate that the current worldwide diabetes epidemic is largely due to changes in diet and lifestyle (27). The majority (~90%) of incidence type 2 diabetes cases may be prevented by a healthy lifestyle of which excess adiposity is by far the most important risk factor for diabetes (28-30). Other components of a low-risk lifestyle being physically active (31;32), refraining from smoking (33) and eating a diverse and healthy
| Chapter 1
14
diet rich in fruits, vegetables, whole grains, nuts and legumes and low in red and processed meats, sugar-sweetened beverages and sodium (34-37). Besides these four modifiable lifestyle factors, moderate alcohol consumption could be regarded as a fifth low-risk factor to reduce the risk of type 2 diabetes. State of the art evidence on alcohol consumption and type 2 diabetes risk Substantial epidemiological evidence of at least 20 prospective studies (28;30;38-68) from different geographical regions and large and diverse cohorts described in several meta-analyses (4;69-73) links moderate alcohol consumption with a lower risk of type 2 diabetes. The population size and diversity and length of follow-up all vary greatly from study to study which adds to the robustness and generalizability of the findings. Most studies describe a J-shaped or U-shaped curve, whereby light to moderate drinkers have less risk than abstainers and heavy drinkers. The strength of the association described in these meta-analyses varies between the 10 and 40%. Maximum risk reduction is observed when consuming alcohol at about 25 g/day. No risk reduction was reported at consumption levels greater than 50 g/day for both men and women (4;69-73).
The ethanol itself, rather than specific components of various alcoholic beverages, appear to be the major factor in conferring health benefits. However, the alcohol-containing beverage which is most frequently consumed in specific populations, will be associated with the greatest benefit in that population; e.g. wine is the most common source of alcohol in Dutch postmenopausal women and wine is therefore of most benefit (57) whereas if spirits or beer are consumed the most these beverages appear to have the strongest associations (45;61). Factors modifying the relation between alcohol consumption and type 2 diabetes Besides several lifestyle factors that are associated with diabetes risk itself, other factors have the potency to modify the relation between alcohol consumption and diabetes risk. Two examples of such factors include drinking pattern and genetic predisposition. Drinking pattern Drinking pattern is an important factor in the relation, because the way alcohol is consumed has differential effects given the same volume: drinking moderate amounts per occasion and at regular frequency (4-7 days/week) decreases risk of type 2 diabetes (45;55) whereas binge drinking or episodic drinking (5 or more alcoholic beverages at a single occasion) increases the risk (46;59).
General introduction |
15
Genetic predisposition Polymorphisms in genes that oxidize alcohol may also affect the relation between alcohol consumption and type 2 diabetes risk. The major enzymes involved are alcohol dehydrogenase (ADH) and aldehyde dehydrogenase (ALDH). Ethanol is oxidized to acetaldehyde in a reversible reaction catalyzed by the class I ADH isoenzymes (e.g. ADH1a, ADH1b, ADH1c) located in the cytosol of hepatocytes. Subsequently, acetaldehyde is then oxidized to acetate and water in a nonreversible reaction catalyzed by the mitochondrial class II ALDH2. Functional relevant polymorphisms are found in the genes encoding ADH1b and ADH1c, the latter affecting ethanol degradation rates and alcohol intake in Caucasian populations (74). Thus, such a polymorphism could modify the association of alcohol consumption with disease risk but with an effect anticipated only among drinkers. Indeed, it appears that the alcohol dehydrogenase 1c gene (ADH1C) modifies the relation between alcohol consumption and diabetes among drinkers (75) although some inconsistency exists (76). Underlying mechanisms based on observational studies and randomized trials Improved insulin sensitivity There is substantial observational evidence that links alcohol consumption to improved insulin sensitivity either in a linearly inverse association (77-85) or a U-shaped relationship (47;76;86;87). This association even presents in subjects with confirmed type 2 diabetes (88). Furthermore, alcohol consumption is also inversely associated with glycemic control among type 2 diabetes patients (89) and complications of type 1 (90) and type 2 diabetes such as cardiovascular diseases and mortality (91).
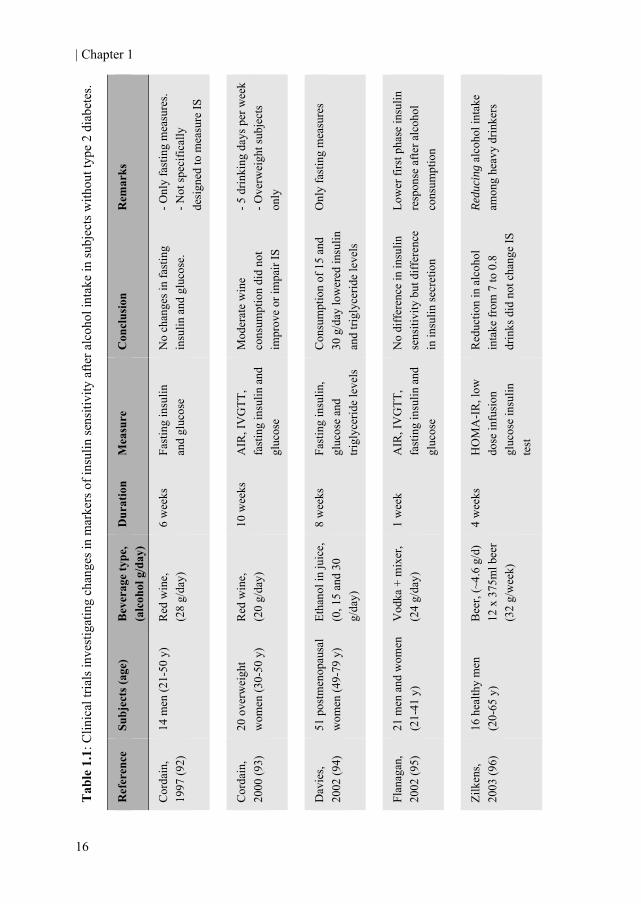
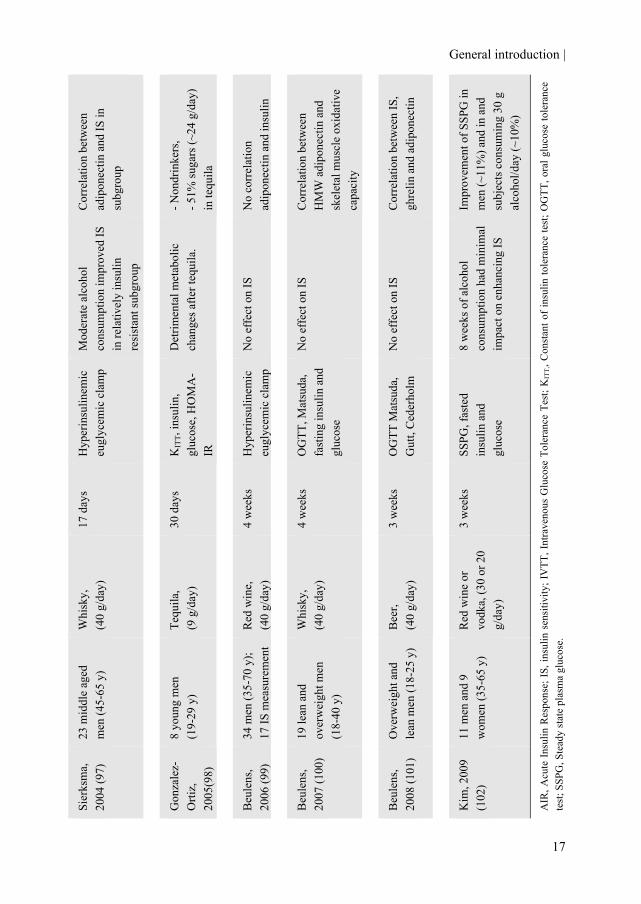
Despite a large amount of observational studies showing a positive association between moderate alcohol consumption and insulin sensitivity, there is limited evidence from clinical trials that supports this finding. So far, eleven studies have examined the effects of moderate alcohol consumption on fasting glucose and insulin levels or (in)direct markers of insulin sensitivity in subjects without diabetes (92-102) (Table 1.1). Only one study reported lower steady-state plasma glucose (SSPG; a measure of insulin resistance) (102) in a subgroup of people after eight weeks of red wine or vodka consumption, equaling 30 g of alcohol/day. Another study reported lower fasting insulin and triglyceride levels, another independent risk factor for type 2 diabetes (94), after eight weeks of alcohol consumption in the form of 15 and 30 g pure alcohol and juice per day. The majority of studies, however, did not show changes in fasting levels of glucose and insulin or insulin sensitivity. It appears that the alcohol’s effects on insulin sensitivity are only observed after prolonged periods of consumption (8 weeks) and are more pronounced in older, more insulin-resistant populations (94;102) or in subjects with type 2 diabetes (103-106).
| Chapter 1
16
Tab
le 1
.1: C
linic
al tr
ials
inve
stig
atin
g ch
ange
s in
mar
kers
of i
nsul
in se
nsiti
vity
afte
r alc
ohol
inta
ke in
subj
ects
with
out t
ype
2 di
abet
es.
Rem
arks
- Onl
y fa
stin
g m
easu
res.
- Not
spec
ifica
lly
desi
gned
to m
easu
re IS
- 5 d
rinki
ng d
ays p
er w
eek
- Ove
rwei
ght s
ubje
cts
only
Onl
y fa
stin
g m
easu
res
Low
er fi
rst p
hase
insu
lin
resp
onse
afte
r alc
ohol
co
nsum
ptio
n
Redu
cing
alc
ohol
inta
ke
amon
g he
avy
drin
kers
Con
clus
ion
No
chan
ges i
n fa
stin
g in
sulin
and
glu
cose
.
Mod
erat
e w
ine
cons
umpt
ion
did
not
impr
ove
or im
pair
IS
Con
sum
ptio
n of
15
and
30 g
/day
low
ered
insu
lin
and
trigl
ycer
ide
leve
ls
No
diff
eren
ce in
insu
lin
sens
itivi
ty b
ut d
iffer
ence
in
insu
lin se
cret
ion
Red
uctio
n in
alc
ohol
in
take
from
7 to
0.8
dr
inks
did
not
cha
nge
IS
Mea
sure
Fast
ing
insu
lin
and
gluc
ose
AIR
, IV
GTT
, fa
stin
g in
sulin
and
gl
ucos
e
Fast
ing
insu
lin,
gluc
ose
and
trigl
ycer
ide
leve
ls
AIR
, IV
GTT
, fa
stin
g in
sulin
and
gl
ucos
e
HO
MA
-IR
, low
do
se in
fusi
on
gluc
ose
insu
lin
test
Dur
atio
n
6 w
eeks
10 w
eeks
8 w
eeks
1 w
eek
4 w
eeks
Bev
erag
e ty
pe,
(alc
ohol
g/d
ay)
Red
win
e,
(28
g/da
y)
Red
win
e,
(20
g/da
y)
Etha
nol i
n ju
ice,
(0
, 15
and
30
g/da
y)
Vod
ka +
mix
er,
(24
g/da
y)
Bee
r, (~
4.6
g/d)
12
x 3
75m
l bee
r (3
2 g/
wee
k)
Subj
ects
(age
)
14 m
en (2
1-50
y)
20 o
verw
eigh
t w
omen
(30-
50 y
)
51 p
ostm
enop
ausa
l w
omen
(49-
79 y
)
21 m
en a
nd w
omen
(2
1-41
y)
16 h
ealth
y m
en
(20-
65 y
)
Ref
eren
ce
Cor
dain
, 19
97 (9
2)
Cor
dain
, 20
00 (9
3)
Dav
ies,
2002
(94)
Flan
agan
, 20
02 (9
5)
Zilk
ens,
2003
(96)
General introduction |
17
Cor
rela
tion
betw
een
adip
onec
tin a
nd IS
in
subg
roup
- Non
drin
kers
, - 5
1% su
gars
(~24
g/d
ay)
in te
quila
No
corr
elat
ion
adip
onec
tin a
nd in
sulin
Cor
rela
tion
betw
een
HM
W a
dipo
nect
in a
nd
skel
etal
mus
cle
oxid
ativ
e ca
paci
ty
Cor
rela
tion
betw
een
IS,
ghre
lin a
nd a
dipo
nect
in
Impr
ovem
ent o
f SSP
G in
m
en (~
11%
) and
in a
nd
subj
ects
con
sum
ing
30 g
al
coho
l/day
(~10
%)
AIR
, Acu
te In
sulin
Res
pons
e; IS
, ins
ulin
sen
sitiv
ity; I
VTT
, Int
rave
nous
Glu
cose
Tol
eran
ce T
est;
KIT
T,, C
onst
ant o
f ins
ulin
tole
ranc
e te
st; O
GTT
, ora
l glu
cose
tole
ranc
e te
st; S
SPG
, Ste
ady
stat
e pl
asm
a gl
ucos
e.
Mod
erat
e al
coho
l co
nsum
ptio
n im
prov
ed IS
in
rela
tivel
y in
sulin
re
sist
ant s
ubgr
oup
Det
rimen
tal m
etab
olic
ch
ange
s afte
r teq
uila
.
No
effe
ct o
n IS
No
effe
ct o
n IS
No
effe
ct o
n IS
8 w
eeks
of a
lcoh
ol
cons
umpt
ion
had
min
imal
im
pact
on
enha
ncin
g IS
Hyp
erin
sulin
emic
eu
glyc
emic
cla
mp
KIT
T, in
sulin
, gl
ucos
e, H
OM
A-
IR
Hyp
erin
sulin
emic
eu
glyc
emic
cla
mp
OG
TT, M
atsu
da,
fast
ing
insu
lin a
nd
gluc
ose
OG
TT M
atsu
da,
Gut
t, C
eder
holm
SSPG
, fas
ted
insu
lin a
nd
gluc
ose
17 d
ays
30 d
ays
4 w
eeks
4 w
eeks
3 w
eeks
3 w
eeks
Whi
sky,
(4
0 g/
day)
Tequ
ila,
(9 g
/day
)
Red
win
e,
(40
g/da
y)
Whi
sky,
(4
0 g/
day)
Bee
r,
(40
g/da
y)
Red
win
e or
vo
dka,
(30
or 2
0 g/
day)
23 m
iddl
e ag
ed
men
(45-
65 y
)
8 yo
ung
men
(1
9-29
y)
34 m
en (3
5-70
y);
17 IS
mea
sure
men
t
19 le
an a
nd
over
wei
ght m
en
(18-
40 y
)
Ove
rwei
ght a
nd
lean
men
(18-
25 y
)
11 m
en a
nd 9
w
omen
(35-
65 y
)
Sier
ksm
a,
2004
(97)
Gon
zale
z-O
rtiz,
20
05(9
8)
Beu
lens
, 20
06 (9
9)
Beu
lens
, 20
07 (1
00)
Beu
lens
, 20
08 (1
01)
Kim
, 200
9 (1
02)
| Chapter 1
18
Increased circulating adiponectin levels Second, alcohol consumption has been associated with higher circulating adiponectin concentrations (82;107-109) even in diabetic subjects (88). Adiponectin was demonstrated to be an independent risk factor of insulin sensitivity and type 2 diabetes based on 10 prospective cohort studies (23). It is also inversely associated with markers of inflammation (26). More importantly, increased adiponectin concentrations may explain up two one third of the association between alcohol consumption and type 2 diabetes (110).
Also in several randomized trials, predominantly performed in males, moderate alcohol consumption increased plasma total adiponectin concentrations (97;99-101;111) and even the high-molecular weight (HMW) adiponectin isomer (100). Especially the latter of adiponectin has been proposed as the most active metabolic form (112-114). Anti-inflammatory effects Third, moderate alcohol consumption has various effects on the immune system (115) and is associated with lower levels of inflammatory markers (116-118). In concord with insulin sensitivity and adiponectin levels, the association between alcohol consumption and inflammatory markers even persists among men with type 2 diabetes (88;119).
Data from randomized trials on inflammatory markers after prolonged moderate alcohol consumption are scare but do suggest lower levels of CRP (120;121) and certain cytokines (122) although not consistently (123). Furthermore, moderate alcohol consumption also has several acute effects on white blood cells. Also several lines of evidence suggest that acute moderate alcohol consumption inhibits the pluripotent transcription factor nuclear receptor regulatory factor kappa B (NF-κB) in white blood cells (124;125). Activation of this transcription factor is a pivotal step in the induction of inflammatory cytokines, chemokines and growth factors. Beneficial postprandial effects Recent evidence showed that alcoholic beverages as such are capable of reducing peak blood glucose concentrations and the overall postprandial glucose response when consumed with or before a carbohydrate-containing meal (126;127). Besides lowered glycemic responses, acute alcohol consumption also decreased serum FFA levels (128) also in subjects with type 2 diabetes (129). Rationale and outline of this thesis There is ample evidence from observational research linking moderate alcohol consumption to a reduced risk of type 2 diabetes. However, several aspects have not yet been studied. Also, the physiological mechanisms that account for this observation are not completely understood. We thus aimed to:
General introduction |
19
1) further substantiate the existing literature of prospective cohort studies on alcohol consumption and risk of type 2 diabetes by investigating the temporality of the relation between alcohol intake and type 2 diabetes risk and by examining this association among subjects already at low risk of diabetes due to individual and joint contribution of healthy lifestyle behaviors 2) examine physiological mechanisms in short-term intervention studies of alcohol consumption that potentially mediate the association between alcohol consumption and type 2 diabetes. Of particular interest is the effect of alcohol consumption on adiponectin concentrations, low-grade inflammatory processes and to a lesser extent insulin sensitivity. Prospective cohort studies A new approach to explore the causality of the alcohol–diabetes relation is to examine the temporality of the association; in other words: does the introduction or removal of alcoholic beverages lead to a change in risk? In chapter 2 we examine the effect of changes in alcohol consumption on subsequent changes in risk of type 2 diabetes during twenty years of follow-up. Furthermore, we look at associations between a four-year change in alcohol consumption and its effect on circulating levels of adiponectin and hemoglobin A1c (HbA1c). As previously described in this chapter approximately 90% of the incident type 2 diabetes cases could have been prevented by adhering to several low-risk lifestyle behaviors. It is uncertain whether alcohol consumption could still decrease the risk of diabetes even if people already pursue several of these healthy lifestyle behaviors and may consequently be considered as an independent risk factor. Therefore, we evaluate in chapter 3 the association between alcohol consumption and type 2 diabetes in the context of single and multiple favorable lifestyle behaviors. Randomized crossover trials Despite the consistent decreased risk of type 2 diabetes associated with moderate alcohol consumption in observational studies the majority of the short-term alcohol-feeding trials do not find changes in insulin sensitivity, an important predictor of type 2 diabetes, even after prolonged moderate alcohol consumption. In chapter 4 we try to confirm a previously observed finding of improved insulin sensitivity in postmenopausal women. Additionally, we investigate the effects of white wine on the expression of the gene encoding adiponectin (ADIPOQ) and on corresponding circulating protein levels of adiponectin, an important biochemical predictor of type 2 diabetes. Moderate alcohol consumption has several acute effects on gene expression of white blood cells but longer term effects on gene expression are largely unknown. In chapter 5 we thus
| Chapter 1
20
explore the effects of four weeks of moderate vodka consumption on changes in associated gene expression of leukocytes (white blood cells) and several circulating proteins. Although prolonged moderate alcohol consumption increases circulating adiponectin levels acute alcohol consumption in moderation does not increase postprandial adiponectin levels. This suggests that longer periods of consumption are needed to increase adiponectin levels. Therefore, we describe in chapter 6 weekly changes in two forms of plasma adiponectin levels during 3 weeks of moderate beer consumption in normal-weight premenopausal women. Since a low-grade inflammation is thought to play an important role in the development of type 2 diabetes, we tried to mimic an acute low-grade inflammatory status by challenging young men with a low-dose endotoxin bolus to see whether the inflammatory response is attenuated after moderate vodka consumption. These results are described in chapter 7. Besides prolonged and postprandial effects of moderate alcohol consumption, pre-prandial effects of alcohol consumption (e.g. mere tasting of alcohol before ingestion) might also affect glucose and lipid metabolism. These pre-prandial effects belong to a so called cephalic phase and are important in triggering gastric and intestinal responses. Therefore, in chapter 8 we investigate the effects of pre-prandial oral white wine exposure on several markers of glucose and lipid metabolism to investigate whether alcohol induces cephalic phase responses.

General introduction |
21
References 1. Di Castelnuovo A, Costanzo S, Bagnardi V, Donati MB, Iacoviello L, de GG. Alcohol
dosing and total mortality in men and women: an updated meta-analysis of 34 prospective studies. Arch Intern Med 2006;166:2437-45.
2. Corrao G, Rubbiati L, Bagnardi V, Zambon A, Poikolainen K. Alcohol and coronary heart disease: a meta-analysis. Addiction 2000;95:1505-23.
3. Di Castelnuovo A, Rotondo S, Iacoviello L, Donati MB, de GG. Meta-analysis of wine and beer consumption in relation to vascular risk. Circulation 2002;105:2836-44.
4. Howard AA, Arnsten JH, Gourevitch MN. Effect of alcohol consumption on diabetes mellitus: a systematic review. Ann Intern Med 2004;140:211-9.
5. World Cancer Research Fund (WCRF)/ American Institute for Cancer Research (AICR). Food, nutrition and physical activity and the prevention of cancer: A global perspective. Washington D.C: 2007.
6. Rehm J, Mathers C, Popova S, Thavorncharoensap M, Teerawattananon Y, Patra J. Global burden of disease and injury and economic cost attributable to alcohol use and alcohol-use disorders. The Lancet 2009;373:2223-33.
7. Taylor B, Irving HM, Kanteres F et al. The more you drink, the harder you fall: a systematic review and meta-analysis of how acute alcohol consumption and injury or collision risk increase together. Drug Alcohol Depend 2010;110:108-16.
8. Hart CL, Morrison DS, Batty GD, Mitchell RJ, Davey SG. Effect of body mass index and alcohol consumption on liver disease: analysis of data from two prospective cohort studies. BMJ 2010;340:c1240.
9. Rehm J, Taylor B, Mohapatra S et al. Alcohol as a risk factor for liver cirrhosis: a systematic review and meta-analysis. Drug Alcohol Rev 2010;29:437-45.
10. Gezondheidsraad. Richtlijnen goede voeding 2006. Den Haag: 2006.
11. U.S. Department of Health and Human Services and U.S. Department of Agriculture. Dietary Guidelines for Americans, 2005. Washington D.C.: Government Printing Office, 2005.
12. Department of Health. Sensible drinking. The report of an inter-departmental working group. London: HMSO, 1995.
13. U.S. Department of Agriculture. National Nutrient Database for Standard References. 19-8-2010.
14. Baraona E, Abittan CS, Dohmen K et al. Gender differences in pharmacokinetics of alcohol. Alcohol Clin Exp Res 2001;25:502-7.
15. Wild S, Roglic G, Green A, Sicree R, King H. Global Prevalence of Diabetes. Diabetes Care 2004;27:1047-53.
| Chapter 1
22
16. Wellen KE, Hotamisligil GS. Inflammation, stress, and diabetes. J Clin Invest 2005;115:1111-9.
17. Guilherme A, Virbasius JV, Puri V, Czech MP. Adipocyte dysfunctions linking obesity to insulin resistance and type 2 diabetes. Nat Rev Mol Cell Biol 2008;9:367-77.
18. Kahn SE, Hull RL, Utzschneider KM. Mechanisms linking obesity to insulin resistance and type 2 diabetes. Nature 2006;444:840-6.
19. Spranger J, Kroke A, Mohlig M et al. Inflammatory Cytokines and the Risk to Develop Type 2 Diabetes: Results of the Prospective Population-Based European Prospective Investigation into Cancer and Nutrition (EPIC)-Potsdam Study. Diabetes 2003;52:812-7.
20. Thorand B, Baumert J, Kolb H et al. Sex differences in the prediction of type 2 diabetes by inflammatory markers: results from the MONICA/KORA Augsburg case-cohort study, 1984-2002. Diabetes Care 2007;30:854-60.
21. Meier U, Gressner AM. Endocrine regulation of energy metabolism: review of pathobiochemical and clinical chemical aspects of leptin, ghrelin, adiponectin, and resistin. Clin Chem 2004;50:1511-25.
22. Berg AH, Combs TP, Scherer PE. ACRP30/adiponectin: an adipokine regulating glucose and lipid metabolism. Trends Endocrinol Metab 2002;13:84-9.
23. Li S, Shin HJ, Ding EL, van Dam RM. Adiponectin Levels and Risk of Type 2 Diabetes: A Systematic Review and Meta-analysis. JAMA 2009;302:179-88.
24. Pischon T, Girman CJ, Hotamisligil GS, Rifai N, Hu FB, Rimm EB. Plasma Adiponectin Levels and Risk of Myocardial Infarction in Men. JAMA 2004;291:1730-7.
25. Snijder MB, Heine RJ, Seidell JC et al. Associations of Adiponectin Levels With Incident Impaired Glucose Metabolism and Type 2 Diabetes in Older Men and Women: The Hoorn Study. Diabetes Care 2006;29:2498-503.
26. Hung J, McQuillan BM, Thompson PL, Beilby JP. Circulating adiponectin levels associate with inflammatory markers, insulin resistance and metabolic syndrome independent of obesity. Int J Obes (Lond) 2008;32:772-9.
27. Schulze MB, Hu FB. Primary prevention of diabetes: what can be done and how much can be prevented? Annu Rev Public Health 2005;26:445-67.
28. Hu FB, Manson JE, Stampfer MJ et al. Diet, lifestyle, and the risk of type 2 diabetes mellitus in women. N Engl J Med 2001;345:790-7.
29. Ford ES, Bergmann MM, Kroger J, Schienkiewitz A, Weikert C, Boeing H. Healthy living is the best revenge: findings from the European Prospective Investigation Into Cancer and Nutrition-Potsdam study. Arch Intern Med 2009;169:1355-62.
30. Mozaffarian D, Kamineni A, Carnethon M, Djousse L, Mukamal KJ, Siscovick D. Lifestyle risk factors and new-onset diabetes mellitus in older adults: the cardiovascular health study. Arch Intern Med 2009;169:798-807.
General introduction |
23
31. Wannamethee SG, Shaper AG, Alberti KG. Physical activity, metabolic factors, and the incidence of coronary heart disease and type 2 diabetes. Arch Intern Med 2000;160:2108-16.
32. Hu FB, Sigal RJ, Rich-Edwards JW et al. Walking compared with vigorous physical activity and risk of type 2 diabetes in women: a prospective study. JAMA 1999;282:1433-9.
33. Rimm EB, Manson JE, Stampfer MJ et al. Cigarette smoking and the risk of diabetes in women. Am J Public Health 1993;83:211-4.
34. van Dam RM, Rimm EB, Willett WC, Stampfer MJ, Hu FB. Dietary Patterns and Risk for Type 2 Diabetes Mellitus in U.S. Men. Ann Intern Med 2002;136:201-9.
35. Fung TT, McCullough M, van Dam RM, Hu FB. A Prospective Study of Overall Diet Quality and Risk of Type 2 Diabetes in Women. Diabetes Care 2007;30:1753-7.
36. Martinez-Gonzalez MA, de lF-A, Nunez-Cordoba JM et al. Adherence to Mediterranean diet and risk of developing diabetes: prospective cohort study. BMJ 2008;336:1348-51.
37. McNaughton SA, Mishra GD, Brunner EJ. Dietary patterns, insulin resistance, and incidence of type 2 diabetes in the Whitehall II Study. Diabetes Care 2008;31:1343-8.
38. Stampfer MJ, Colditz GA, Willett WC et al. A prospective study of moderate alcohol drinking and risk of diabetes in women. Am J Epidemiol 1988;128:549-58.
39. Feskens EJ, Kromhout D. Cardiovascular risk factors and the 25-year incidence of diabetes mellitus in middle-aged men. The Zutphen Study. Am J Epidemiol 1989;130:1101-8.
40. Gurwitz JH, Field TS, Glynn RJ et al. Risk factors for non-insulin-dependent diabetes mellitus requiring treatment in the elderly. J Am Geriatr Soc 1994;42:1235-40.
41. Sugimori H, Miyakawa M, Yoshida K et al. Health risk assessment for diabetes mellitus based on longitudinal analysis of MHTS database. J Med Syst 1998;22:27-32.
42. Tsumura K, Hayashi T, Suematsu C, Endo G, Fujii S, Okada K. Daily alcohol consumption and the risk of type 2 diabetes in Japanese men: the Osaka Health Survey. Diabetes Care 1999;22:1432-7.
43. Ajani UA, Hennekens CH, Spelsberg A, Manson JE. Alcohol consumption and risk of type 2 diabetes mellitus among US male physicians. Arch Intern Med 2000;160:1025-30.
44. Wei M, Gibbons LW, Mitchell TL, Kampert JB, Blair SN. Alcohol intake and incidence of type 2 diabetes in men. Diabetes Care 2000;23:18-22.
45. Conigrave KM, Hu BF, Camargo CA, Jr., Stampfer MJ, Willett WC, Rimm EB. A prospective study of drinking patterns in relation to risk of type 2 diabetes among men. Diabetes 2001;50:2390-5.
46. Kao WHL, Puddey IB, Boland LL, Watson RL, Brancati FL. Alcohol Consumption and the Risk of Type 2 Diabetes Mellitus: Atherosclerosis Risk in Communities Study. Am J Epidemiol 2001;154:748-57.
| Chapter 1
24
47. de Vegt F, Dekker JM, Groeneveld WJ et al. Moderate alcohol consumption is associated with lower risk for incident diabetes and mortality: the Hoorn Study. Diabetes Research and Clinical Practice 2002;57:53-60.
48. Meisinger C, Thorand B, Schneider A, Stieber J, Doring A, Lowel H. Sex Differences in Risk Factors for Incident Type 2 Diabetes Mellitus: The MONICA Augsburg Cohort Study. Arch Intern Med 2002;162:82-9.
49. Wannamethee SG, Shaper AG, Perry IJ, Alberti KG. Alcohol consumption and the incidence of type II diabetes. J Epidemiol Community Health 2002;56:542-8.
50. Watanabe M, Barzi F, Neal B et al. Alcohol consumption and the risk of diabetes by body mass index levels in a cohort of 5,636 Japanese. Diabetes Res Clin Pract 2002;57:191-7.
51. Carlsson S, Hammar N, Grill V, Kaprio J. Alcohol Consumption and the Incidence of Type 2 Diabetes: A 20-year follow-up of the Finnish Twin Cohort Study. Diabetes Care 2003;26:2785-90.
52. Lee DH, Ha MH, Kim JH et al. Gamma-glutamyltransferase and diabetes--a 4 year follow-up study. Diabetologia 2003;46:359-64.
53. Lu W, Jablonski KA, Resnick HE et al. Alcohol intake and glycemia in American Indians: the strong heart study. Metabolism 2003;52:129-35.
54. Nakanishi N, Suzuki K, Tatara K. Alcohol consumption and risk for development of impaired fasting glucose or type 2 diabetes in middle-aged Japanese men. Diabetes Care 2003;26:48-54.
55. Wannamethee SG, Camargo CA, Jr., Manson JE, Willett WC, Rimm EB. Alcohol drinking patterns and risk of type 2 diabetes mellitus among younger women. Arch Intern Med 2003;163:1329-36.
56. Lee DH, Folsom AR, Jacobs DR, Jr. Dietary iron intake and Type 2 diabetes incidence in postmenopausal women: the Iowa Women's Health Study. Diabetologia 2004;47:185-94.
57. Beulens JW, Stolk RP, Van der Schouw YT, Grobbee DE, Hendriks HF, Bots ML. Alcohol consumption and risk of type 2 diabetes among older women. Diabetes Care 2005;28:2933-8.
58. Waki K, Noda M, Sasaki S et al. Alcohol consumption and other risk factors for self-reported diabetes among middle-aged Japanese: a population-based prospective study in the JPHC study cohort I. Diabet Med 2005;22:323-31.
59. Hodge AM, English DR, O'Dea K, Giles GG. Alcohol intake, consumption pattern and beverage type, and the risk of Type 2 diabetes. Diabetic Medicine 2006;23:690-7.
60. Strodl E, Kenardy J. Psychosocial and non-psychosocial risk factors for the new diagnosis of diabetes in elderly women. Diabetes Res Clin Pract 2006;74:57-65.
61. Djousse L, Biggs ML, Mukamal KJ, Siscovick DS. Alcohol Consumption and Type 2 Diabetes Among Older Adults: The Cardiovascular Health Study. Obesity Res 2007;15:1758-65.
General introduction |
25
62. Sato KK, Hayashi T, Nakamura Y et al. Liver enzymes compared with alcohol consumption in predicting the risk of type 2 diabetes: the Kansai Healthcare Study. Diabetes Care 2008;31:1230-6.
63. Crandall JP, Polsky S, Howard AA et al. Alcohol consumption and diabetes risk in the Diabetes Prevention Program. Am J Clin Nutr 2009;90:595-601.
64. Imamura F, Lichtenstein AH, Dallal GE, Meigs JB, Jacques PF. Confounding by dietary patterns of the inverse association between alcohol consumption and type 2 diabetes risk. Am J Epidemiol 2009;170:37-45.
65. Roh WG, Shin HC, Choi JH, Lee YJ, Kim K. Alcohol consumption and higher incidence of impaired fasting glucose or type 2 diabetes in obese Korean men. Alcohol 2009;43:643-8.
66. Hozawa A, Okamura T, Tanaka T et al. Relation of Gamma-glutamyltransferase and alcohol drinking with incident diabetes: the HIPOP-OHP study. J Atheroscler Thromb 2010;17:195-202.
67. Joosten MM, Grobbee DE, van der A DL, Verschuren WM, Hendriks HF, Beulens JW. Combined effect of alcohol consumption and lifestyle behaviors on risk of type 2 diabetes. Am J Clin Nutr 2010;91:1777-83.
68. Boggs DA, Rosenberg L, Ruiz-Narvaez EA, Palmer JR. Coffee, tea, and alcohol intake in relation to risk of type 2 diabetes in African American women. Am J Clin Nutr 2010;92:960-6.
69. Carlsson S, Hammar N, Grill V. Alcohol consumption and type 2 diabetes Meta-analysis of epidemiological studies indicates a U-shaped relationship. Diabetologia 2005;48:1051-4.
70. Koppes LL, Dekker JM, Hendriks HF, Bouter LM, Heine RJ. Moderate alcohol consumption lowers the risk of type 2 diabetes: a meta-analysis of prospective observational studies. Diabetes Care 2005;28:719-25.
71. Seike N, Noda M, Kadowaki T. Alcohol consumption and risk of type 2 diabetes mellitus in Japanese: a systematic review. Asia Pac J Clin Nutr 2008;17:545-51.
72. Baliunas DO, Taylor BJ, Irving H et al. Alcohol as a risk factor for type 2 diabetes: A systematic review and meta-analysis. Diabetes Care 2009;32:2123-32.
73. Pietraszek A, Gregersen S, Hermansen K. Alcohol and type 2 diabetes. A review. Nutrition, Metabolism and Cardiovascular Diseases 2010;20:366-75.
74. Eriksson CJ, Fukunaga T, Sarkola T et al. Functional relevance of human adh polymorphism. Alcohol Clin Exp Res 2001;25:157S-63S.
75. Beulens JW, Rimm EB, Hendriks HF et al. Alcohol consumption and type 2 diabetes: influence of genetic variation in alcohol dehydrogenase. Diabetes 2007;56:2388-94.
76. Husemoen LL, Jorgensen T, Borch-Johnsen K, Hansen T, Pedersen O, Linneberg A. The association of alcohol and alcohol metabolizing gene variants with diabetes and coronary heart disease risk factors in a white population. PLoS One 2010;5.
| Chapter 1
26
77. Mayer EJ, Newman B, Quesenberry CP, Jr., Friedman GD, Selby JV. Alcohol consumption and insulin concentrations. Role of insulin in associations of alcohol intake with high-density lipoprotein cholesterol and triglycerides. Circulation 1993;88:2190-7.
78. Facchini F, Chen YD, Reaven GM. Light-to-moderate alcohol intake is associated with enhanced insulin sensitivity. Diabetes Care 1994;17:115-9.
79. Kiechl S, Willeit J, Poewe W et al. Insulin sensitivity and regular alcohol consumption: large, prospective, cross sectional population study (Bruneck study). BMJ 1996;313:1040-4.
80. Flanagan DE, Moore VM, Godsland IF, Cockington RA, Robinson JS, Phillips DI. Alcohol consumption and insulin resistance in young adults. Eur J Clin Invest 2000;30:297-301.
81. Goude D, Fagerberg B, Hulthe J. Alcohol consumption, the metabolic syndrome and insulin resistance in 58-year-old clinically healthy men (AIR study). Clin Sci (Lond) 2002;102:345-52.
82. Thamer C, Haap M, Fritsche A, Haering H, Stumvoll M. Relationship Between Moderate Alcohol Consumption and Adiponectin and Insulin Sensitivity in a Large Heterogeneous Population. Diabetes Care 2004;27:1240.
83. Fueki Y, Miida T, Wardaningsih E et al. Regular alcohol consumption improves insulin resistance in healthy Japanese men independent of obesity. Clinica Chimica Acta 2007;382:71-6.
84. Kawamoto R, Kohara K, Tabara Y et al. Alcohol consumption is associated with decreased insulin resistance independent of body mass index in Japanese community-dwelling men. Tohoku J Exp Med 2009;218:331-7.
85. Paulson QX, Hong J, Holcomb VB, Nunez NP. Effects of body weight and alcohol consumption on insulin sensitivity. Nutr J 2010;9:14.
86. Razay G, Heaton KW, Bolton CH, Hughes AO. Alcohol consumption and its relation to cardiovascular risk factors in British women. BMJ 1992;304:80-3.
87. Lazarus R, Sparrow D, Weiss ST. Alcohol Intake and Insulin Levels: The Normative Aging Study. Am J Epidemiol 1997;145:909-16.
88. Englund Ogge L, Brohall G, Behre CJ, Schmidt C, Fagerberg B. Alcohol Consumption in Relation to Metabolic Regulation, Inflammation, and Adiponectin in 64-Year-Old Caucasian Women: A population-based study with a focus on impaired glucose regulation. Diabetes Care 2006;29:908-13.
89. Ahmed AT, Karter AJ, Warton EM, Doan JU, Weisner CM. The relationship between alcohol consumption and glycemic control among patients with diabetes: the Kaiser Permanente Northern California Diabetes Registry. J Gen Intern Med 2008;23:275-82.
90. Beulens JW, Kruidhof JS, Grobbee DE, Chaturvedi N, Fuller JH, Soedamah-Muthu SS. Alcohol consumption and risk of microvascular complications in type 1 diabetes patients: the EURODIAB Prospective Complications Study. Diabetologia 2008;51:1631-8.

General introduction |
27
91. Koppes LL, Dekker JM, Hendriks HF, Bouter LM, Heine RJ. Meta-analysis of the relationship between alcohol consumption and coronary heart disease and mortality in type 2 diabetic patients. Diabetologia 2006;49:648-52.
92. Cordain L, Bryan ED, Melby CL, Smith MJ. Influence of moderate daily wine consumption on body weight regulation and metabolism in healthy free-living males. J Am Coll Nutr 1997;16:134-9.
93. Cordain L, Melby CL, Hamamoto AE et al. Influence of moderate chronic wine consumption on insulin sensitivity and other correlates of syndrome X in moderately obese women. Metabolism 2000;49:1473-8.
94. Davies MJ, Baer DJ, Judd JT, Brown ED, Campbell WS, Taylor PR. Effects of moderate alcohol intake on fasting insulin and glucose concentrations and insulin sensitivity in postmenopausal women: a randomized controlled trial. JAMA 2002;287:2559-62.
95. Flanagan DEH, Pratt E, Murphy J et al. Alcohol consumption alters insulin secretion and cardiac autonomic activity. European Journal of Clinical Investigation 2002;32:187-92.
96. Zilkens RR, Burke V, Watts G, Beilin LJ, Puddey IB. The Effect of Alcohol Intake on Insulin Sensitivity in Men: A randomized controlled trial. Diabetes Care 2003;26:608-12.
97. Sierksma A, Patel H, Ouchi N et al. Effect of moderate alcohol consumption on adiponectin, tumor necrosis factor-α, and insulin sensitivity. Diabetes Care 2004;27:184-9.
98. Gonzalez-Ortiz M, Pascoe-Gonzalez S, Kam-Ramos AM, Martinez-Abundis E. Effect of tequila on homocysteine, insulin secretion, insulin sensitivity, and metabolic profile in healthy men. Journal of Diabetes and its Complications 2005;19:155-9.
99. Beulens JW, van Beers RM, Stolk RP, Schaafsma G, Hendriks HF. The effect of moderate alcohol consumption on fat distribution and adipocytokines. Obesity (Silver Spring) 2006;14:60-6.
100. Beulens JW, van Loon LJ, Kok FJ et al. The effect of moderate alcohol consumption on adiponectin oligomers and muscle oxidative capacity: a human intervention study. Diabetologia 2007;50:1388-92.
101. Beulens JW, de Zoete EC, Kok FJ, Schaafsma G, Hendriks HF. Effect of moderate alcohol consumption on adipokines and insulin sensitivity in lean and overweight men: a diet intervention study. Eur J Clin Nutr 2008;62:1098-105.
102. Kim SH, Abbasi F, Lamendola C, Reaven GM. Effect of moderate alcoholic beverage consumption on insulin sensitivity in insulin-resistant, nondiabetic individuals. Metabolism 2009;58:387-92.
103. Napoli R, Cozzolino D, Guardasole V et al. Red wine consumption improves insulin resistance but not endothelial function in type 2 diabetic patients. Metabolism 2005;54:306-13.
104. Marfella R, Cacciapuoti F, Siniscalchi M et al. Effect of moderate red wine intake on cardiac prognosis after recent acute myocardial infarction of subjects with Type 2 diabetes mellitus. Diabet Med 2006;23:974-81.
| Chapter 1
28
105. Shai I, Wainstein J, Harman-Boehm I et al. Glycemic effects of moderate alcohol intake among patients with type 2 diabetes: a multicenter, randomized, clinical intervention trial. Diabetes Care 2007;30:3011-6.
106. Bantle AE, Thomas W, Bantle JP. Metabolic effects of alcohol in the form of wine in persons with type 2 diabetes mellitus. Metabolism 2008;57:241-5.
107. Pischon T, Girman CJ, Rifai N, Hotamisligil GS, Rimm EB. Association between dietary factors and plasma adiponectin concentrations in men. Am J Clin Nutr 2005;81:780-6.
108. Kotani K, Sakane N, Saiga K, Sano Y, Kurozawa Y. Lifestyle-related determinants and serum adiponectin concentrations in a general population of Japanese females. Arch Med Res 2007;38:887-90.
109. Cassidy A, Skidmore P, Rimm EB et al. Plasma Adiponectin Concentrations Are Associated with Body Composition and Plant-Based Dietary Factors in Female Twins. J Nutr 2009;139:353-8.
110. Beulens JW, Rimm EB, Hu FB, Hendriks HF, Mukamal KJ. Alcohol consumption, mediating biomarkers, and risk of type 2 diabetes among middle-aged women. Diabetes Care 2008;31:2050-5.
111. Imhof A, Plamper I, Maier S, Trischler G, Koenig W. Effect of drinking on adiponectin in healthy men and women: a randomized intervention study of water, ethanol, red wine, and beer with or without alcohol. Diabetes Care 2009;32:1101-3.
112. Hara K, Horikoshi M, Yamauchi T et al. Measurement of the high-molecular weight form of adiponectin in plasma is useful for the prediction of insulin resistance and metabolic syndrome. Diabetes Care 2006;29:1357-62.
113. Bobbert T, Rochlitz H, Wegewitz U et al. Changes of adiponectin oligomer composition by moderate weight reduction. Diabetes 2005;54:2712-9.
114. Seino Y, Hirose H, Saito I, Itoh H. High-molecular-weight adiponectin is a predictor of progression to metabolic syndrome: a population-based 6-year follow-up study in Japanese men. Metabolism 2009;58:355-60.
115. Romeo J, Warnberg J, Nova E, Diaz LE, Gomez-Martinez S, Marcos A. Moderate alcohol consumption and the immune system: a review. Br J Nutr 2007;98 Suppl 1:S111-S115.
116. Imhof A, Froehlich M, Brenner H, Boeing H, Pepys MB, Koenig W. Effect of alcohol consumption on systemic markers of inflammation. Lancet 2001;357:763-7.
117. Albert MA, Glynn RJ, Ridker PM. Alcohol consumption and plasma concentration of C-reactive protein. Circulation 2003;107:443-7.
118. Pai JK, Hankinson SE, Thadhani R, Rifai N, Pischon T, Rimm EB. Moderate alcohol consumption and lower levels of inflammatory markers in US men and women. Atherosclerosis 2006;186:113-20.
General introduction |
29
119. Shai I, Rimm EB, Schulze MB, Rifai N, Stampfer MJ, Hu FB. Moderate alcohol intake and markers of inflammation and endothelial dysfunction among diabetic men. Diabetologia 2004;47:1760-7.
120. Sierksma A, van der Gaag MS, Kluft C, Hendriks HF. Effect of moderate alcohol consumption on fibrinogen levels in healthy volunteers is discordant with effects on C-reactive protein. Ann N Y Acad Sci 2001;936:630-3.:630-3.
121. Vazquez-Agell M, Sacanella E, Tobias E et al. Inflammatory markers of atherosclerosis are decreased after moderate consumption of cava (sparkling wine) in men with low cardiovascular risk. J Nutr 2007;137:2279-84.
122. Romeo J, Warnberg J, Nova E, Diaz LE, Gonzalez-Gross M, Marcos A. Changes in the immune system after moderate beer consumption. Ann Nutr Metab 2007;51:359-66.
123. Beulens JW, van den BR, Kok FJ, Helander A, Vermunt SH, Hendriks HF. Moderate alcohol consumption and lipoprotein-associated phospholipase A2 activity. Nutr Metab Cardiovasc Dis 2008;18:539-44.
124. Mandrekar P, Dolganiuc A, Bellerose G et al. Acute alcohol inhibits the induction of nuclear regulatory factor κB activation through CD14/toll-like receptor 4, interleukin-1, and tumor necrosis factor receptors: a common mechanism independent of inhibitory κB alpha degradation? Alcohol Clin Exp Res 2002;26:1609-14.
125. Mandrekar P, Catalano D, White B, Szabo G. Moderate alcohol intake in humans attenuates monocyte inflammatory responses: inhibition of nuclear regulatory factor κB and induction of interleukin 10. Alcohol Clin Exp Res 2006;30:135-9.
126. Greenfield JR, Samaras K, Hayward CS, Chisholm DJ, Campbell LV. Beneficial postprandial effect of a small amount of alcohol on diabetes and cardiovascular risk factors: modification by insulin resistance. J Clin Endocrinol Metab 2005;90:661-72.
127. Brand-Miller JC, Fatima K, Middlemiss C et al. Effect of alcoholic beverages on postprandial glycemia and insulinemia in lean, young, healthy adults. Am J Clin Nutr 2007;85:1545-51.
128. Avogaro A, Sambataro M, Marangoni A et al. Moderate alcohol consumption, glucose metabolism and lipolysis: the effect on adiponectin and tumor necrosis factor alpha. J Endocrinol Invest 2003;26:1213-8.
129. Avogaro A, Watanabe RM, Dall'Arche A, Vigili De Kreutzenberg S, Tiengo A, Pacini G. Acute Alcohol Consumption Improves Insulin Action Without Affecting Insulin Secretion in Type 2 Diabetic Subjects. Diabetes Care 2004;27:1369-74.


Chapter 2
Changes in alcohol consumption and subsequent risk of type 2 diabetes in men
Michel M. Joosten Stephanie E. Chiuve Kenneth J. Mukamal
Frank B. Hu Henk F.J. Hendriks
Eric B. Rimm
Accepted for publication in Diabetes
| Chapter 2
32
Background: Alcohol consumption has been associated with lower risk of diabetes, but whether changes in alcohol consumption over time influence future diabetes risk is unclear. Objective: The objective of this study was to investigate the association of four-year changes in alcohol consumption with subsequent risk of type 2 diabetes. Design: We prospectively examined 38,031 middle-aged men from the Health Professionals Follow-up Study free of diagnosed diabetes or cancer in 1990. Alcohol consumption was reported on food frequency questionnaires and updated every four years. Results: A total of 1,905 cases of type 2 diabetes occurred during 428,497 person-years of follow-up. A 7.5 g/day (~half a glass) increase in alcohol consumption over four years was associated with lower diabetes risk among initial nondrinkers (multivariable hazard ratio [HR]: 0.78; 95% confidence interval [CI]: 0.60, 1.00) and drinkers initially consuming <15 g/day (HR: 0.89; 95% CI: 0.83, 0.96) but not among men initially drinking ≥15 g/day (HR: 0.99; 95% CI: 0.95, 1.02; Pinteraction < 0.01). A similar pattern was observed for levels of total adiponectin and hemoglobin A1c, with a better metabolic profile among abstainers and light drinkers who modestly increased their alcohol intake, compared with men who either drank less or among men who were already moderate drinkers and increased their intake. Likewise, compared to stable light drinkers (0-4.9 g/day), light drinkers who increased their intake to moderate levels (5.0-29.9 g/day) had a significantly lower risk of type 2 diabetes (HR: 0.75; 95% CI: 0.62, 0.90). Conclusions: Increases in alcohol consumption over time were associated with lower risk of type 2 diabetes among initially rare and light drinkers. This lower risk was evident within a four-year period following increased alcohol intake.

Change in alcohol and type 2 diabetes |
33
Introduction Alcohol consumption has been consistently associated with a reduced risk of type 2 diabetes compared with abstention or excessive consumption (1;2). Most prospective studies measure alcohol consumption at only one point in time which assumes intake is fairly stable over time. However, alcohol consumption is dynamic, especially over longer periods of follow-up (3). Importantly, changes in alcohol consumption over time have been associated with subsequent changes in risk of cardiovascular diseases (4-6) and mortality (7) although some inconsistency exists (8;9). Variability in intake over time thus highlights the constraints of single measures of alcohol consumption.
To our knowledge, no observational studies have examined the association between changes in alcohol consumption over time and future risk of type 2 diabetes, despite the importance of such studies both in assessing the robustness of the alcohol-diabetes association and in addressing a topic of direct clinical importance – what happens when individuals adopt or cease drinking? Short-term randomized trials of alcohol have shown changes in insulin sensitivity and adiponectin concentrations within six to eight weeks, suggesting changes in subsequent risk of diabetes could plausibly occur with a short latency (10-12). Therefore, we attempted to examine whether initiation of light to moderate alcohol consumption is associated with a lower subsequent risk of type 2 diabetes, and likewise whether reduction in alcohol consumption is associated with higher type 2 diabetes risk.
To accomplish these aims, we examined men enrolled in the Health Professionals Follow-up Study (HPFS), an ongoing prospective cohort of men who have repeatedly reported their alcohol consumption over time and in whom validated diagnoses of diabetes have been ascertained for two decades. Methods Study population The HPFS is a prospective investigation of 51,529 U.S. male health professionals aged 40 - 75 y at baseline in 1986 who returned a mailed questionnaire about diet and medical history. Participants subsequently provided diet, lifestyle, and medical information on biennial questionnaires. We excluded men with missing data on body mass index (BMI) and physical activity at baseline. We also excluded men who had implausible nutritional information (≥70 missing food items or estimated daily energy intake <800 or >4200 kcal). Furthermore, we excluded men who deceased or had diagnosed diabetes or cancer (except non melanoma skin caner) before follow-up for these analyses started (i.e., in 1990). After these exclusions 38,031 participants remained for the analyses.
To assess the association between changes in alcohol intake and biochemical markers of glycemia, we examined a subset of men in this cohort who participated in a nested case-control study of coronary heart disease. In 1994, 18,825 participants provided blood samples. Men who provided samples were somewhat younger but were otherwise similar to those who did not provide samples. We matched 266 men with incident coronary

| Chapter 2
34
heart disease until 2000 and an additional 188 cases from 2000 to 2004 with controls matched for age, date of blood draw, and smoking status on a 1:2 basis, as described previously (13;14). All participants gave written informed consent, and the Harvard school of public health human subjects committee review board approved the study protocol. Assessment of alcohol consumption In 1986, men reported their alcohol consumption on a semi quantitative food frequency questionnaire (FFQ) (15;16) that included ,separate items for beer, white wine, red wine, and liquor. Participants were asked how often, on average over the past year, they consumed each beverage. We calculated total alcohol intake by multiplying the average consumption of each beverage by the published alcohol content of the specified portion size based on periodically updated U.S. Department of Agriculture food composition tables and then summing across beverages (17). The FFQ was administered again every 4 years, with an item for light beer added in 1994. We assessed the validity of self-reported alcohol consumption by comparing estimated alcohol intake from the FFQ with the intake derived from two 7-day dietary records among 127 participants who returned questionnaires in 1986 and 1987 and resided in or near Boston, Massachusetts. The Spearman rank correlation coefficient between alcohol intake estimated from the FFQ and corresponding intake from diet records was 0.86 (18). Assessment of lifestyle factors Lifestyle factors were assessed biennially using questionnaires including BMI, smoking, physical activity, and medical conditions. Participants reported physical activity as the average time engaged in specific activities during the previous year. Reported weights have been shown to correlate well with measured weights, (16) and the assessment of physical activity was previously validated (19). We obtained energy intake, coffee consumption and energy-adjusted intakes of dietary fiber, glycemic load, trans fat, and the ratio between polyunsaturated and saturated fat from a semi quantitative FFQ (20). Glycemic load was calculated by multiplying the amount of carbohydrates by the average glycemic index as previously described (21). Ascertainment of type 2 diabetes Incident cases of type 2 diabetes were identified by self report and confirmed by a validated supplementary questionnaire detailing symptoms, diagnostic laboratory test results and diabetes treatment. The diagnosis was confirmed if participants reported at least one of the following: treatment with insulin or oral hypoglycemic medication, at least one classic symptom (excessive thirst, polyuria, weight loss, or hunger) plus elevated plasma glucose level, or at least two elevated plasma glucose concentrations on two different occasions in the absence of symptoms. Elevated plasma glucose concentration was defined as at least ≥140 mg/dL (≥7.8 mmol/L), plasma glucose ≥200 mg/dL [≥11.1 mmol/L] nonfasting, or plasma glucose ≥200 mg/dL [≥11.1 mmol/L] after ≥2 hours during an oral glucose

Change in alcohol and type 2 diabetes |
35
tolerance test before 1998; for cases diagnosed in 1998 and later, the fasting plasma glucose threshold was lowered to ≥126 mg/dL (≥7.0 mmol/L) (22). The validity of self reported diabetes has been confirmed with medical record review in a sample (23). Measurement of biochemical variables Blood samples were collected in liquid EDTA tubes, placed on ice packs, stored in Styrofoam containers, returned to our laboratory via overnight courier, and centrifuged and aliquoted for storage in liquid nitrogen freezers (−130°C or colder). Plasma total adiponectin concentrations were measured by competitive radio-imunoassay (Linco Research Inc, St Charles, MO, U.S.A.) for cases and controls ascertained through 2000 (N = 798). Hemoglobin A1c (HbA1c) concentrations were measured by turbidimetric immunoinhibition for cases and controls through 2004 (N = 1,365). Statistical analysis Each individual contributed person-time from the return of the 1990 questionnaire to the date of diagnosis of type 2 diabetes, date of diagnosis of cancer or death, or January 31, 2006, which ever came first. We used Cox proportional hazards models to calculate hazard ratios (HR) and 95% confidence intervals (CI). We used change in alcohol consumption updated every 4 years as a time-varying covariable, using an Anderson-Gill data structure (24). Thus, we used the change in alcohol consumption between the 1986 and 1990 questionnaires to determine the risk for type 2 diabetes during the period from 1990 to 1994, the change in alcohol consumption based on the 1990 and 1994 questionnaires for the period from 1994 to 1998, and so on. In these analyses, men contributed person-time only during each four-year period in which they provided data on alcohol consumption. We skipped contributions of person-time for individuals with missing information on alcohol consumption during follow-up for that specific period. In multivariate models, we adjusted for age (five categories), BMI (eight categories: <23.0, 23.0-23.9, 24.0- 24.9, 2.5-26.9, 2.7-28.9, 29.0-30.9, 31.0-34.9, or ≥35.0 kg/m2), physical activity (quintiles), smoking status (never, former, current 1-14 cigarettes/day, current 15-24 cigarettes/day or current ≥25 cigarettes/day), family history of type 2 diabetes (yes or no), incident and prevalent cardiovascular disease (stroke, myocardial infarction, coronary artery bypass surgery or angina), hypertension, and hypercholesterolemia, dietary glycemic load, fiber intake, trans fat intake, ratio of polyunsaturated to saturated fat (all four in quintiles and energy-adjusted), coffee intake (quintiles) and total energy intake (continuous). All variables were treated as time-varying covariates in our models. Linear trends across (change in) alcohol consumption categories were tested by treating the median value of each category as a continuous variable.

| Chapter 2
36
Tab
le 2
.1: C
hara
cter
istic
s acc
ordi
ng to
4-y
ear c
hang
e in
alc
ohol
con
sum
ptio
n in
199
0 st
ratif
ied
by in
itial
inta
ke in
198
6 (N
= 3
3,07
3)1 .
Cha
nge
in a
lcoh
ol c
onsu
mpt
ion
4 ye
ars l
ater
(g/d
ay)
Mod
erat
e to
la
rge
incr
ease
(≥
7.5)
17
0 (0
.5%
) 59
.4
25.7
3.
0 0.
0 21
.5
38.0
5.
0 11
.2
12.9
25
.3
29.2
1,19
0 (3
.6%
) 57
.6
25.7
1.
7 8.
0
Smal
l to
mod
erat
e in
crea
se
(2.5
–7.4
9)
30
9 (0
.9%
) 56
.7
25.5
1.
6 0.
0 4.
1 36
.1
3.7
14.3
13
.9
26.3
35
.9
2,
391
(7.2
%)
56.7
25
.4
1.6
6.7
No
chan
ge /
rela
tivel
y st
able
(±
2.49
)
6,
868
(20.
8%)
57.8
25
.6
1.2
0.0
0.2
35.8
3.
4 15
.9
11.4
25
.6
28.4
9,32
1 (2
8.2%
) 57
.1
25.5
1.
3 4.
9
Smal
l to
mod
erat
e de
crea
se
(2.5
–7.4
9)
…
…
…
…
…
…
…
…
…
…
…
…
3,51
7 (1
0.6%
) 57
.3
25.5
1.
0 8.
3
Mod
erat
e to
la
rge
decr
ease
(≥
7.5)
…
…
…
…
…
…
…
…
…
…
…
…
791
(2.4
%)
58.9
25
.5
-0.2
12
.1
Initi
al a
lcoh
ol c
onsu
mpt
ion
(g/d
ay)
No
drin
ks/d
(0 )
N
o. (%
of t
otal
) of p
artic
ipan
ts
A
ge (y
)
BM
I (kg
/m2 )
W
eigh
t gai
n fr
om ’8
6 to
’90
(lbs)
Alc
ohol
con
sum
ptio
n in
198
6 (g
/day
)
Alc
ohol
con
sum
ptio
n in
199
0 (g
/day
)
Phys
ical
act
ivity
(MET
s/w
eek)
Cur
rent
smok
er (%
)
Fam
ily h
isto
ry o
f dia
bete
s (%
)2
Car
diov
ascu
lar d
isea
se (%
)3
Hyp
erte
nsio
n (%
)
Hyp
erch
oles
tero
lem
ia (%
) <1
dri
nk/d
ay (0
.1-1
4.9)
No.
(% o
f tot
al) o
f par
ticip
ants
Age
(y)
B
MI (
kg/m
2 )
Wei
ght g
ain
from
’86
to ’9
0 (lb
s)
A
lcoh
ol c
onsu
mpt
ion
in 1
986
(g/d
ay)

Change in alcohol and type 2 diabetes |
37
24.5
38
.4
5.4
14.5
10
.1
27.0
33
.2
97
9 (3
.0%
) 58
.4
25.6
1.
9 28
.5
49.2
39
.7
9.4
13.5
8.
8 33
.8
33.1
Abb
revi
atio
ns: B
MI:
body
mas
s ind
ex (c
alcu
late
d as
the
wei
ght i
n ki
logr
ams d
ivid
ed b
y he
ight
in m
eter
s squ
ared
; MET
: met
abol
ic e
quiv
alen
t; el
lipse
s, no
t app
licab
le.
1 Dat
a ar
e gi
ven
as m
ean
for c
ontin
uous
var
iabl
es, e
xcep
t alc
ohol
con
sum
ptio
n (m
edia
n) a
nd p
erce
ntag
e fo
r cat
egor
ical
var
iabl
es a
nd a
re a
ge-a
djus
ted,
exc
ept f
or a
ge.
2 His
tory
of d
iabe
tes w
ith o
nset
at a
ge ≥
30 y
ears
in im
med
iate
fam
ily.
3 Car
diov
ascu
lar d
isea
se c
ompr
ises
stro
ke, m
yoca
rdia
l inf
arct
ion,
cor
onar
y ar
tery
byp
ass s
urge
ry a
nd a
ngin
a pe
ctor
is.
11.2
40
.3
4.4
15.3
10
.9
24.2
31
.2
66
5 (2
.0%
) 57
.7
25.2
1.
5 27
.7
32.2
39
.8
5.4
12.2
9.
5 24
.2
28.2
4.7
36.1
4.
0 16
.1
11.3
23
.6
30.7
2,11
8 (6
.4%
) 58
.8
25.4
1.
6 30
.2
30.1
38
.1
8.6
13.7
10
.3
27.8
31
.4
3.9
38.6
3.
5 15
.6
11.6
24
.0
30.9
1,49
8 (4
.5%
) 57
.7
25.4
1.
5 26
.0
21.2
40
.2
5.5
15.4
10
.9
26.5
32
.2
2.3
37.8
5.
6 14
.9
10.9
27
.0
32.3
3,25
6 (9
.8%
) 58
.7
25.7
1.
1 37
.9
16.4
39
.5
7.5
13.4
11
.4
31.0
32
.4
A
lcoh
ol c
onsu
mpt
ion
in 1
990
(g/d
ay)
Ph
ysic
al a
ctiv
ity (M
ETs/
wee
k)
C
urre
nt sm
oker
(%)
Fa
mily
his
tory
of d
iabe
tes (
%)2
C
ardi
ovas
cula
r dis
ease
(%)3
H
yper
tens
ion
(%)
H
yper
chol
este
role
mia
(%)
≥1 d
rink
/day
(0.1
-14.
9)
N
o. (%
of t
otal
) of p
artic
ipan
ts
A
ge (y
)
BM
I (kg
/m2 )
W
eigh
t gai
n fr
om ’8
6 to
’90
(lbs)
Alc
ohol
con
sum
ptio
n in
198
6 (g
/day
)
Alc
ohol
con
sum
ptio
n in
199
0 (g
/day
)
Phys
ical
act
ivity
(MET
s/w
eek)
Cur
rent
smok
er (%
)
Fam
ily h
isto
ry o
f dia
bete
s (%
)2
Car
diov
ascu
lar d
isea
se (%
)3
Hyp
erte
nsio
n (%
)
Hyp
erch
oles
tero
lem
ia (%
)

| Chapter 2
38
Tab
le 2
.2: H
azar
d ra
tios o
f typ
e 2
diab
etes
acc
ordi
ng to
upd
ated
4-y
ear c
hang
es in
alc
ohol
inta
ke st
ratif
ied
by in
itial
inta
ke (N
= 3
8,03
1)1 .
Cha
nge
in a
lcoh
ol c
onsu
mpt
ion
4 ye
ars l
ater
(g/d
ay)
Per
7.5
g/da
y in
crea
se
0.
78 (0
.60,
1.0
0)
0.
89 (0
.83,
0.9
6)
0.
99 (0
.95,
1.0
2)
0.00
4
1 Mul
tivar
iabl
e-ad
just
ed h
azar
d ra
tios (
95%
con
fiden
ce in
terv
als)
wer
e ca
lcul
ated
usi
ng C
ox p
ropo
rtion
al h
azar
ds m
odel
and
adj
uste
d fo
r age
(5 c
ateg
orie
s), b
ody
mas
s in
dex
(8 c
ateg
orie
s), p
hysi
cal a
ctiv
ity (q
uint
iles)
, sm
okin
g st
atus
(nev
er, f
orm
er, c
urre
nt 1
-14
ciga
rette
s/da
y, c
urre
nt 1
5-24
cig
aret
tes/
day
or c
urre
nt ≥
25 c
igar
ette
s/da
y),
fam
ily h
isto
ry o
f typ
e 2
diab
etes
, inc
iden
t and
pre
vale
nt c
ardi
ovas
cula
r dis
ease
(stro
ke, m
yoca
rdia
l inf
arct
ion,
cor
onar
y ar
tery
byp
ass s
urge
ry o
r ang
ina)
, hyp
erte
nsio
n, a
nd
hype
rcho
lest
erol
emia
, die
tary
gly
cem
ic lo
ad (q
uint
iles)
, fib
er in
take
(qui
ntile
s), t
rans
fat i
ntak
e (q
uint
iles)
, rat
io o
f pol
yuns
atur
ated
fat a
nd sa
tura
ted
fat (
quin
tiles
) (al
l en
ergy
adj
uste
d), c
offe
e in
take
(qui
ntile
s) a
nd to
tal e
nerg
y in
take
(con
tinuo
us).
2 Pin
tera
ctio
n was
der
ived
by
addi
ng a
n in
tera
ctio
n te
rm b
etw
een
the
7.5
g/da
y in
crem
ent i
n al
coho
l con
sum
ptio
n (c
ontin
uous
) and
initi
al a
lcoh
ol c
onsu
mpt
ion
(cat
egor
ical
) in
the
mul
tivar
iate
mod
el. E
llips
es, n
ot a
pplic
able
.
Mod
erat
e to
la
rge
incr
ease
(≥
7.5)
0.
63 (0
.35,
1.1
3)
3,22
9 13
0.
84 (0
.68,
1.0
3)
26,6
00
112
0.90
(0.6
6, 1
.24)
18
,093
65
Smal
l to
m
oder
ate
in
crea
se
(2.5
–7.4
9)
0.
84 (0
.55,
1.3
0)
5,17
0 22
0.
76 (0
.63,
0.9
1)
42,1
62
145
1.04
(0.7
2, 1
.51)
11
,250
40
No
chan
ge /
rela
tivel
y st
able
(±
2.49
)
1.
00 (r
efer
ent)
89,0
08
448
1.00
(ref
eren
t) 11
3,71
4 53
4 1.
00 (r
efer
ent)
26,7
86
94
Smal
l to
mod
erat
e de
crea
se
(2.5
–7.4
9)
…
…
…
1.06
(0.8
9, 1
.26)
33
,804
16
5 1.
14 (0
.83,
1.5
6)
17,4
64
67
Mod
erat
e to
la
rge
decr
ease
(≥
7.5)
…
…
…
1.22
(0.9
0, 1
.66)
7,
446
45
1.18
(0.9
1, 1
.53)
33
,771
15
5
Initi
al a
lcoh
ol c
onsu
mpt
ion
(g
/day
)
Non
(0)
M
ultiv
aria
ble-
adju
sted
1
Per
son-
year
s
No.
of c
ases
<
1 dr
ink/
day
(0.1
-14.
9)
M
ultiv
aria
ble-
adju
sted
1
Per
son-
year
s
No.
of c
ases
≥
1 dr
ink/
day
(≥15
.0)
M
ultiv
aria
ble-
adju
sted
1
Per
son-
year
s
No.
of c
ases
Pin
tera
ctio
n2
Change in alcohol and type 2 diabetes |
39
Concentrations of total adiponectin and HbA1c per 7.5 g/day increment in alcohol intake over four years (i.e., 1990-1994) were calculated with a mixed analysis of variance model that included the same terms as the Cox regression model and a term for case-control status with clustering on case-control triads. The models were stratified by alcohol intake in 1990. For these analyses, we excluded men with missing data on alcohol intake and with a history of type 2 diabetes in 1994, leaving 697 and 1,188 men for the adiponectin and HbA1c analyses, respectively. Results In 1990, the first update on alcohol consumption, most subjects (55%) reported only modest change in alcohol consumption compared to four years earlier (Table 2.1). The median change in alcohol consumption was 0 g/day. No consistent trends where seen in potential confounders among men who decreased or increased their alcohol consumption. Overall alcohol consumption and risk of type 2 diabetes During 428,497 person-years of follow-up among 38,031 men, we documented 1,905 cases of newly diagnosed type 2 diabetes. We first examined alcohol consumption in grams per day and risk of diabetes. Compared with abstention, HRs of type 2 diabetes after multivariable adjustment were 1.04 (95% CI: 0.92, 1.18) for alcohol consumption of 0.1 to 4.9 g/day, 0.81 (95% CI: 0.69, 0.94) for 5 to 9.9 g/day, 0.70 (95% CI: 0.59, 0.84) for 10 to 14.9 g/day, 0.71 (95% CI: 0.60, 0.84) for 15 to 29.9 g/day, 0.54 (95% CI: 0.44, 0.67) for 30 to 49.9 g/day and 0.50 (95% CI: 0.36, 0.69) for alcohol consumption of 50 or more grams per day (Ptrend < 0.0001). Four-year changes in amount of alcohol intake and risk of type 2 diabetes The effect of a 7.5 g/day (~half a glass) change in alcohol intake on subsequent change in diabetes risk differed between initial alcohol consumption levels (Pinteraction < 0.01) (Table 2.2). Such an increment had the largest association with risk on men who were initially nondrinkers at the beginning of any four-year period of change (HR: 0.78; 95% CI: 0.60, 1.00). This was followed by men who initially consumed <1 glass/day (HR: 0.89; 95% CI: 0.83, 0.96). Four-year change in alcohol intake was not associated with subsequent diabetes risk among men who consumed ≥1 glass/day at the beginning of the four-year period (HR: 0.99; 95% CI: 0.95, 1.02). In a secondary analysis, we repeated the analysis excluding men with any missing alcohol data during follow-up. This slightly strengthened the association of changes in alcohol intake with risk among initial nondrinkers (HR: 0.71; 95% CI: 0.52, 0.98) but had little effect on initial <1 glass/day drinkers (HR: 0.89; 95% CI: 0.82, 0.96) and ≥1 glass/day drinkers (HR: 0.99; 95% CI: 0.95, 1.04). To minimize potential bias related to total abstention from alcohol consumption due to poor health, we also excluded all current nondrinkers at the beginning of each follow-up period, with little effect on the HRs (data not shown). Finally, we examined whether changes in BMI and physical activity

| Chapter 2
40
over time could partially explain the observed relation. We assessed this effect by including levels of BMI and physical activity assessed at both the beginning and end of each four-year period used to calculate change in alcohol consumption, while retaining all other variables in the model. This did not materially influence our results (results not shown). Table 2.3: Hazard ratios of type 2 diabetes according to updated 4-year changes in initial and current drinking category (N = 38,031).
Alcohol drinking category four years later (g/day)
Initial alcohol drinking category (g/day)
Light (0-4.9)
Moderate (5.0-29.9)
Heavier (≥30.0)
Ptrend1
Light (0-4.9) Hazard ratio2 1.00 (referent) 0.75 (0.62, 0.90) 0.35 (0.11, 1.10) < 0.001 Person-years 169,623 31,723 1,127 No. of cases 875 125 3
Moderate (5.0-29.9) Hazard ratio2 1.09 (0.92, 1.30) 0.74 (0.65, 0.83) 0.59 (0.45, 0.77) < 0.001 Person-years 27,841 134,942 16,050 No. of cases 159 496 60
Heavier (≥30.0) Hazard ratio2 0.78 (0.44, 1.38) 0.67 (0.52, 0.88) 0.50 (0.40, 0.63) 0.08 Person-years 2,089 15,036 30,067 No. of cases 12 65 110
1 Ptrend was derived from tests of linear trend across increasing categories of alcohol use by treating the median value of each category as a continuous variable. 2 Multivariable-adjusted hazard ratios (95% confidence intervals) were calculated using Cox proportional hazards model and adjusted for the covariates listed in table 2. The association between changes in alcohol consumption and diabetes risk among the three strata of initial drinkers did not substantially differ by subgroups of BMI. The multivariable-adjusted relative risks for diabetes associated with a 7.5 g/day increase in alcohol among initial nondrinkers, <1 and ≥1 drink/day consumers were 0.66 (95% CI: 0.42-1.04), 0.85 (95% CI: 0.76, 0.94) and 0.98 (95% CI: 0.93, 1.04) for men with a BMI <28.3 kg/m2 (median BMI of incident diabetes cases) and 0.86 (95% CI: 0.65, 1.14), 0.92 (95% CI: 0.84, 1.02) and 0.99 (95% CI: 0.93, 1.04) for men with a BMI of ≥28.3 kg/m2, respectively (Pinteraction = 0.48).
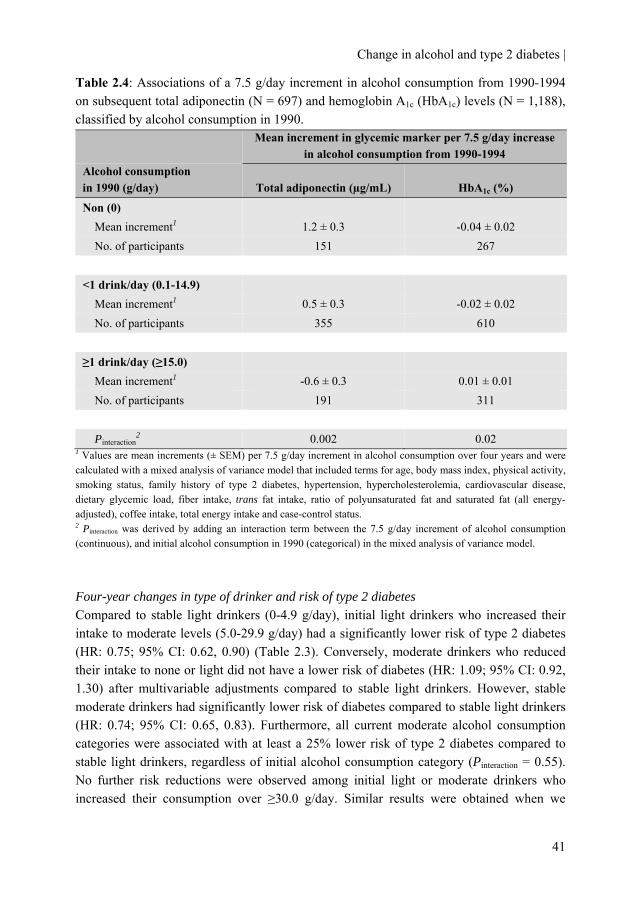
Change in alcohol and type 2 diabetes |
41
Table 2.4: Associations of a 7.5 g/day increment in alcohol consumption from 1990-1994 on subsequent total adiponectin (N = 697) and hemoglobin A1c (HbA1c) levels (N = 1,188), classified by alcohol consumption in 1990.
Mean increment in glycemic marker per 7.5 g/day increase
in alcohol consumption from 1990-1994 Alcohol consumption in 1990 (g/day) Total adiponectin (µg/mL) HbA1c (%)
Non (0) Mean increment1 1.2 ± 0.3 -0.04 ± 0.02 No. of participants 151 267
<1 drink/day (0.1-14.9) Mean increment1 0.5 ± 0.3 -0.02 ± 0.02 No. of participants 355 610
≥1 drink/day (≥15.0) Mean increment1 -0.6 ± 0.3 0.01 ± 0.01 No. of participants 191 311 Pinteraction
2 0.002 0.02 1 Values are mean increments (± SEM) per 7.5 g/day increment in alcohol consumption over four years and were calculated with a mixed analysis of variance model that included terms for age, body mass index, physical activity, smoking status, family history of type 2 diabetes, hypertension, hypercholesterolemia, cardiovascular disease, dietary glycemic load, fiber intake, trans fat intake, ratio of polyunsaturated fat and saturated fat (all energy-adjusted), coffee intake, total energy intake and case-control status. 2 Pinteraction was derived by adding an interaction term between the 7.5 g/day increment of alcohol consumption (continuous), and initial alcohol consumption in 1990 (categorical) in the mixed analysis of variance model. Four-year changes in type of drinker and risk of type 2 diabetes Compared to stable light drinkers (0-4.9 g/day), initial light drinkers who increased their intake to moderate levels (5.0-29.9 g/day) had a significantly lower risk of type 2 diabetes (HR: 0.75; 95% CI: 0.62, 0.90) (Table 2.3). Conversely, moderate drinkers who reduced their intake to none or light did not have a lower risk of diabetes (HR: 1.09; 95% CI: 0.92, 1.30) after multivariable adjustments compared to stable light drinkers. However, stable moderate drinkers had significantly lower risk of diabetes compared to stable light drinkers (HR: 0.74; 95% CI: 0.65, 0.83). Furthermore, all current moderate alcohol consumption categories were associated with at least a 25% lower risk of type 2 diabetes compared to stable light drinkers, regardless of initial alcohol consumption category (Pinteraction = 0.55). No further risk reductions were observed among initial light or moderate drinkers who increased their consumption over ≥30.0 g/day. Similar results were obtained when we
| Chapter 2
42
reanalyzed the data excluding people who abstained from alcohol or who had missing alcohol data during follow-up (data not shown). Four-year change in amount of alcohol intake and effect on markers of glycemia To test the robustness of our findings, we next examined the four-year change in alcohol consumption from 1990-1994 on markers of glycemia collected in 1994, stratified by initial alcohol consumption in 1990 (Table 2.4). A similar interaction between change in alcohol and baseline alcohol intake as in the main analysis was observed for levels of total adiponectin and HbA1c among non-diabetic men. For example, a 7.5 g/day increment in alcohol intake, between 1990-1994, was associated with a 1.2 ± 0.3 µg/mL (mean ± SEM) higher adiponectin level in 1994 among men who were nondrinkers at baseline, a 0.5 ± 0.3 µg/mL higher adiponectin level among <1 glass/day drinkers, and a 0.6 ± 0.3 µg/mL lower level among ≥1 glass/day drinkers at baseline (Pinteraction = 0.002). For HbA1c, the inverse association between change in alcohol intake in 1990-1994 and HbA1c concentration was also strongest among nondrinkers compared to <1 glass/day drinkers and ≥1 glass/day drinkers in 1990 (Pinteraction = 0.02). Discussion In this large prospective cohort study, we found that four-year changes in alcohol consumption assessed repeatedly over time were followed by subsequent changes in risk of type 2 diabetes. The lower risk associated with an increase in alcohol consumption was dependent on initial drinking levels, with no benefit associated with increased intake among men already drinking moderately. This pattern of lower risk associated with increased alcohol consumption solely among abstainers and light drinkers was further supported by associations of change in alcohol intake with total adiponectin and HbA1c.
Our results extend previous epidemiological studies that have reported an inverse association between moderate alcohol consumption and the longer term risk of type 2 diabetes (1;2). Recent studies have shown that alcohol consumption is associated with lower risk of type 2 diabetes even among low-risk individuals (lean, active non-smokers) (25;26) and when adjusted for multiple lifestyle factors based on BMI, physical activity level, smoking habits and diet quality (27-29). Comparisons of different beverage types generally suggest that ethanol rather than the type of alcoholic beverage is responsible for this association (23;30). Furthermore, variation in the ADH1C gene, a gene that encodes the alcohol dehydrogenase 1C enzyme that oxidizes ethanol, appears to modify the association between alcohol consumption and type 2 diabetes risk, providing further epidemiological support for the causal nature of the relationship between alcohol consumption and diabetes risk (31).
The plausibility of these observational results is supported by short-term randomized controlled trials on changes in alcohol consumption (25-30 g/day) (10;11) In these studies, moderate drinking significantly improved insulin sensitivity after six to eight
Change in alcohol and type 2 diabetes |
43
weeks. Also, clinical trials in a variety of populations have shown that alcohol consumption increases adiponectin, (11;12;32;33) a hormone secreted by adipose tissue that appears to improve insulin sensitivity. Indeed, adiponectin appears to explain approximately 25 to 30% of the inverse association between alcohol consumption and type 2 diabetes in women (34). Lastly, longer-term randomized trials of three to twelve months among diabetic individuals have shown that assignment to alcohol consumption lowers fasting glucose (35) and HbA1c (36).
These findings from randomized trials suggest that the effects of alcohol intake on glycemia have a short latency, as they appear within weeks of assignment to alcohol. Our results are consistent with this finding, the more beneficial metabolic parameters and the lower subsequent risk of diabetes associated with an increase in alcohol consumption was evident in the next follow-up period. Our results further imply that the effect may be transient, as a decrease in consumption was accompanied by a modest increase in risk. Finally, our results highlight that any benefit of alcohol on glycemia and risk of diabetes is restricted to moderate drinking, and increases among those already drinking moderately confer no lower risk.
Several limitations warrant consideration. We relied on self-reported alcohol consumption. However, validation studies in these health professionals comparing self-administered questionnaire with intake assessed by detailed diet records showed correlations above 0.8 and mean and standard deviation values almost identical by the two methods (18). Second, we do not know why men changed their intake. However, we restricted our analysis to men without history of diabetes and cancer and adjusted for cardiovascular disease, hypertension and hypercholesterolemia. Third, we do not know when during each four-year interval the change in alcohol consumption occurred, a limitation that reflects the fact that the administered FFQ specifically queries alcohol consumption in the previous year. Therefore, we cannot definitely evaluate whether the change in intake on type 2 diabetes risk is immediate. We do know however, that the change in alcohol preceded the diagnosis of diabetes. Fourth, we performed our analysis in male health professionals and results may therefore not be readily generalizable to other populations. However, within this homogenous group of highly educated men potential confounding due to social economic status is substantially reduced. Fifth, we could not evaluate changes in beverage types, given the more limited use of any particular beverage compared with total alcohol use. We have previously found that all beverage types were inversely associated with type 2 diabetes in this cohort (24). Finally, as with any observational study, unaccounted factors associated with changes in alcohol consumption and risk of type 2 diabetes may introduce an unknown degree of residual confounding, despite the substantial number of potentially confounding factors we included.
In conclusion, in this cohort of male health professionals increases in alcohol consumption over time were associated with correspondingly lower four-year risk of type 2 diabetes, although this association was limited to rare and light drinkers at baseline. This suggests that the effect of alcohol consumption on diabetes risk has a relatively short

| Chapter 2
44
latency time but may also be transient and reversible. Our results also highlight that individuals already consuming alcohol in moderation did not receive further benefit from increased consumption. Although our results might be seen as suggesting that some individuals should consider adopting regular and moderate intake of alcohol, our findings – even if proven to be causal - are limited to a single outcome of diabetes. Decisions and recommendations about changes in alcohol consumption should, as with alcohol consumption in general, consider the full range of risks and benefits to an individual, including the consistent harms to the individual and society of drinking that exceeds recommended limits. Author contributions MMJ, SEC, KJM, HFJH and EBR contributed to the design of the study. FBH and EBR acquired the data. MMJ, SEC, KJM and EBR analysed and interpreted the data. MMJ and KJM drafted the first manuscript. HFJH, FBH and EBR obtained funding. KJM, FBH, HFJH and EBR supervised the study. All authors critically reviewed the manuscript for important intellectual content and approved the final version. MMJ and HFJH receive partial funding (unrestricted) from the Dutch Foundation for Alcohol Research (SAR). Acknowledgement We are indebted to the 51,529 participants in the HPFS for their dedicated collaboration and the entire staff of the HPFS for their assistance in conducting the study. The Health Professionals Follow-up Study is supported by grants AA11181, CA55075, DK58845 and HL35464 from the National Institutes of Health. The research described in this article was partly funded by the Dutch Foundation for Alcohol Research (SAR).
Change in alcohol and type 2 diabetes |
45
References 1. Koppes LL, Dekker JM, Hendriks HF, Bouter LM, Heine RJ. Moderate alcohol consumption
lowers the risk of type 2 diabetes: a meta-analysis of prospective observational studies. Diabetes Care 2005;28:719-25.
2. Baliunas DO, Taylor BJ, Irving H et al. Alcohol as a risk factor for type 2 diabetes: A systematic review and meta-analysis. Diabetes Care 2009;32:2123-32.
3. Kerr WC, Fillmore KM, Bostrom A. Stability of alcohol consumption over time: evidence from three longitudinal surveys from the United States. J Stud Alcohol 2002;63:325-33.
4. Mukamal KJ, Conigrave KM, Mittleman MA et al. Roles of drinking pattern and type of alcohol consumed in coronary heart disease in men. N Engl J Med 2003;348:109-18.
5. Sesso HD, Stampfer MJ, Rosner B, Hennekens CH, Manson JE, Gaziano JM. Seven-year changes in alcohol consumption and subsequent risk of cardiovascular disease in men. Arch Intern Med 2000;160:2605-12.
6. King DE, Mainous AG, III, Geesey ME. Adopting moderate alcohol consumption in middle age: subsequent cardiovascular events. Am J Med 2008;121:201-6.
7. Gronbaek M, Johansen D, Becker U et al. Changes in alcohol intake and mortality: a longitudinal population-based study. Epidemiology 2004;15:222-8.
8. Emberson JR, Shaper AG, Wannamethee SG, Morris RW, Whincup PH. Alcohol intake in middle age and risk of cardiovascular disease and mortality: accounting for intake variation over time. Am J Epidemiol 2005;161:856-63.
9. Wannamethee SG, Shaper AG. Taking up regular drinking in middle age: effect on major coronary heart disease events and mortality. Heart 2002;87:32-6.
10. Davies MJ, Baer DJ, Judd JT, Brown ED, Campbell WS, Taylor PR. Effects of moderate alcohol intake on fasting insulin and glucose concentrations and insulin sensitivity in postmenopausal women: a randomized controlled trial. JAMA 2002;287:2559-62.
11. Joosten MM, Beulens JW, Kersten S, Hendriks HF. Moderate alcohol consumption increases insulin sensitivity and ADIPOQ expression in postmenopausal women: a randomised, crossover trial. Diabetologia 2008;51:1375-81.
12. Imhof A, Plamper I, Maier S, Trischler G, Koenig W. Effect of drinking on adiponectin in healthy men and women: a randomized intervention study of water, ethanol, red wine, and beer with or without alcohol. Diabetes Care 2009;32:1101-3.
13. Pischon T, Girman CJ, Hotamisligil GS, Rifai N, Hu FB, Rimm EB. Plasma Adiponectin Levels and Risk of Myocardial Infarction in Men. JAMA 2004;291:1730-7.
14. Giovannucci E, Liu Y, Hollis BW, Rimm EB. 25-hydroxyvitamin D and risk of myocardial infarction in men: a prospective study. Arch Intern Med 2008;168:1174-80.

| Chapter 2
46
15. Rimm EB, Giovannucci EL, Stampfer MJ, Colditz GA, Litin LB, Willett WC. Reproducibility and validity of an expanded self-administered semiquantitative food frequency questionnaire among male health professionals. Am J Epidemiol 1992;135:1114-26.
16. Willett W, Stampfer MJ, Bain C et al. Cigarette smoking, relative weight, and menopause. Am J Epidemiol 1983;117:651-8.
17. U.S. Department of Agriculture ARS. USDA Nutrient Database for Standard Reference. Washington, DC, U.S.: Government Printing Office, 1999.
18. Giovannucci E, Colditz G, Stampfer MJ et al. The assessment of alcohol consumption by a simple self-administered questionnaire. Am J Epidemiol 1991;133:810-7.
19. Hu FB, Sigal RJ, Rich-Edwards JW et al. Walking compared with vigorous physical activity and risk of type 2 diabetes in women: a prospective study. JAMA 1999;282:1433-9.
20. Feskanich D, Rimm EB, Giovannucci EL et al. Reproducibility and validity of food intake measurements from a semiquantitative food frequency questionnaire. J Am Diet Assoc 1993;93:790-6.
21. Schulze MB, Liu S, Rimm EB, Manson JE, Willett WC, Hu FB. Glycemic index, glycemic load, and dietary fiber intake and incidence of type 2 diabetes in younger and middle-aged women. Am J Clin Nutr 2004;80:348-56.
22. Report of the Expert Committee on the Diagnosis and Classification of Diabetes Mellitus. Diabetes Care 1997;20:1183-97.
23. Conigrave KM, Hu BF, Camargo CA, Jr., Stampfer MJ, Willett WC, Rimm EB. A prospective study of drinking patterns in relation to risk of type 2 diabetes among men. Diabetes 2001;50:2390-5.
24. Therneau, TM. Extending the Cox Model. In : Lin DY, Fleming TR, eds. (Proceedings of the first Seattle Symposium on Biostatistics: Survival Analysis), 51-84. 1997. New York, NY, Springer-Verlag.
25. Ajani UA, Hennekens CH, Spelsberg A, Manson JE. Alcohol consumption and risk of type 2 diabetes mellitus among US male physicians. Arch Intern Med 2000;160:1025-30.
26. Wannamethee SG, Camargo CA, Jr., Manson JE, Willett WC, Rimm EB. Alcohol drinking patterns and risk of type 2 diabetes mellitus among younger women. Arch Intern Med 2003;163:1329-36.
27. Hu FB, Manson JE, Stampfer MJ et al. Diet, lifestyle, and the risk of type 2 diabetes mellitus in women. N Engl J Med 2001;345:790-7.
28. Mozaffarian D, Kamineni A, Carnethon M, Djousse L, Mukamal KJ, Siscovick D. Lifestyle risk factors and new-onset diabetes mellitus in older adults: the cardiovascular health study. Arch Intern Med 2009;169:798-807.
29. Joosten MM, Grobbee DE, van der A DL, Verschuren WM, Hendriks HF, Beulens JW. Combined effect of alcohol consumption and lifestyle behaviors on risk of type 2 diabetes. Am J Clin Nutr 2010;91:1777-83.
Change in alcohol and type 2 diabetes |
47
30. Beulens JW, Stolk RP, Van der Schouw YT, Grobbee DE, Hendriks HF, Bots ML. Alcohol consumption and risk of type 2 diabetes among older women. Diabetes Care 2005;28:2933-8.
31. Beulens JW, Rimm EB, Hendriks HF et al. Alcohol consumption and type 2 diabetes: influence of genetic variation in alcohol dehydrogenase. Diabetes 2007;56:2388-94.
32. Sierksma A, Patel H, Ouchi N et al. Effect of moderate alcohol consumption on adiponectin, tumor necrosis factor-α, and insulin sensitivity. Diabetes Care 2004;27:184-9.
33. Beulens JW, van Loon LJ, Kok FJ et al. The effect of moderate alcohol consumption on adiponectin oligomers and muscle oxidative capacity: a human intervention study. Diabetologia 2007;50:1388-92.
34. Beulens JW, Rimm EB, Hu FB, Hendriks HF, Mukamal KJ. Alcohol consumption, mediating biomarkers, and risk of type 2 diabetes among middle-aged women. Diabetes Care 2008;31:2050-5.
35. Shai I, Wainstein J, Harman-Boehm I et al. Glycemic effects of moderate alcohol intake among patients with type 2 diabetes: a multicenter, randomized, clinical intervention trial. Diabetes Care 2007;30:3011-6.
36. Marfella R, Cacciapuoti F, Siniscalchi M et al. Effect of moderate red wine intake on cardiac prognosis after recent acute myocardial infarction of subjects with Type 2 diabetes mellitus. Diabet Med 2006;23:974-81.

Chapter 3
Combined effect of alcohol consumption and lifestyle behaviors on risk of type 2 diabetes
Michel M. Joosten Diederick E. Grobbee Daphne L. van der A
W.M. Monique Verschuren Henk F.J. Hendriks Joline W.J. Beulens
American Journal of Clinical Nutrition 2010 Jun;91(6):1777-83

| Chapter 3
50
Background: It has been suggested that the inverse association between alcohol and type 2 diabetes could be explained by moderate drinkers’ healthier lifestyles. Objective: We studied whether moderate alcohol consumption is associated with a lower risk of type 2 diabetes among adults with combined low-risk lifestyle behaviors. Design: We prospectively examined 35,625 adults of the Dutch European Prospective Investigation into Cancer and Nutrition (EPIC)-NL cohort aged 20 - 70 years and free of diabetes, cardiovascular disease and cancer at baseline (1993-1997). Besides moderate alcohol consumption (women: 5.0-14.9 g/day; men: 5.0-29.9 g/day), we defined low-risk levels of four lifestyle behaviors: optimal weight (BMI <25 kg/m2), physically active (≥30 minutes of physical activity/day), current non-smoker and a healthy diet (upper two quintiles of the DASH diet). Results: During a median of 10.3 years, we identified 796 incident cases of type 2 diabetes. Compared with teetotalers, hazard ratios of moderate alcohol consumers for risk of type 2 diabetes in low-risk lifestyle strata after multivariable adjustments were 0.35 (95% CI: 0.17, 0.72) when of a normal weight, 0.65 (0.46, 0.91) when physically active, 0.54 (0.41, 0.71) when nonsmoking and 0.57 (0.39, 0.84) when consuming a healthy diet. When ≥3 low-risk lifestyle behaviors were combined, the hazard ratio for incidence of type 2 diabetes among moderate alcohol consumers after multivariable adjustments was 0.56 (0.32, 1.00). Conclusion: In subjects already at lower risk of type 2 diabetes on the basis of multiple low-risk lifestyle behaviors, moderate alcohol consumption was associated with an approximately 40% lower risk compared with abstention.
Alcohol, lifestyles and type 2 diabetes |
51
Introduction Several studies have demonstrated that type 2 diabetes can largely be prevented through a healthy lifestyle (1;2). Components of such a lifestyle include maintaining a normal body weight (1), being physically active (3), refraining from smoking (4) and eating a healthy diet (5). Moderate alcohol consumption has consistently been associated with a decreased risk of type 2 diabetes in prospective cohort studies compared with abstention or excessive consumption (6;7). Much of this association is thought to be attributable to an improved insulin sensitivity due to moderate alcohol consumption (8;9). Therefore, moderate alcohol consumption could be considered a fifth favorable behavioral lifestyle factor to lower the risk of type 2 diabetes.
Despite this evidence, some have suggested that the observed inverse association between alcohol and disease such as type 2 diabetes can be explained by the fact that moderate drinkers have a healthier lifestyle in general (10). Previous studies on the relation between alcohol consumption, lifestyle and type 2 diabetes have only considered individual lifestyle behaviors, (11-13) but low-risk lifestyle habits are often inter-correlated and may be most effective when present in combination.
Little is known about the association between type 2 diabetes risk and alcohol consumption in the context of healthy lifestyle behaviors, especially when multiple low-risk lifestyle habits are combined. We therefore examined the association of alcohol intake with risk of type 2 diabetes in strata of separate lifestyle behaviors based on body mass index (BMI), physical activity level, smoking and adherence to the Dietary Approach to Stop Hypertension (DASH) diet and in strata of combined low-risk lifestyle behaviors in a prospective population-based study of men and women (of which almost half were postmenopausal at baseline). Methods Study population The EPIC-NL cohort is the Dutch contribution to the European Prospective Investigation into Cancer and Nutrition (EPIC) and consists of the Prospect and MORGEN cohort. Both cohorts were jointly set up within the context of EPIC between 1993 and 1997, recruiting predominantly Caucasian 40,011 subjects. This cohort is described in more detail elsewhere (14). In short, Prospect is a prospective cohort study of 17,357 women aged 49 - 70 who participated in the breast cancer screening between 1993 and 1997. The Monitoring Project on Risk Factors for Chronic Diseases (MORGEN)-cohort consists of 22,654 men and women aged 20 - 59 years who were recruited from three Dutch towns (Amsterdam, Doetinchem and Maastricht). From 1993 to 1997, each year a new random sample of ~5,000 subjects was examined. Of the total cohort of 40,011 persons, 615 subjects reported diabetes and 915 and 1,560 participants reported cardiovascular disease or cancer respectively at baseline and were therefore excluded. Furthermore, we excluded 192 subjects with missing data on alcohol consumption and diet, 138 persons with missing data
| Chapter 3
52
of other lifestyle behaviors, 36 individuals with unrealistic energy intakes (<600 kcal/day or >5000 kcal/day) and 930 individuals without consent for linkage to disease registries,
leaving 35,625 subjects for the present study. The Prospect-EPIC study was approved by the Institutional Review Board of the University Medical Center Utrecht and the MORGEN project was approved by the Medical Ethical Committee of TNO, the Netherlands. All participants signed informed consent prior to study inclusion. General assessments At baseline, participants filled in a general questionnaire on demographic characteristics and risk behaviors for presence of chronic diseases. The general questionnaires from both cohorts were largely similar. Coding of this information was standardized and merged into one uniform database. Body weight, height, waist and hip circumferences were measured. Physical activity was assessed using a questionnaire, validated in an elderly population (15). The Cambridge Physical Activity Index (CPAI) was used to allocate individuals to four ordered categories: inactive, moderately inactive, moderately active and active, as previously described (16). Because we could not calculate a total physical activity score for 14% of all participants, we imputed missing scores by single imputation using linear regression modeling (SPSS MVA procedure) with other lifestyle factors (e.g. smoking, BMI) and the outcome (type 2 diabetes). Smoking was defined as never, past or current. Daily nutritional intake was obtained from a food frequency questionnaire (FFQ) containing questions on the usual frequency of consumption of 79 main food items during the year preceding enrolment. This questionnaire allows the estimation of the average daily consumption of 178 foods. The FFQ was validated against 12 monthly 24-hour recalls in a representative group before the start of the study (17;18).
We constructed the DASH diet score as previously described (19). The score is based on 8 components: high intake of fruits, vegetables (except potatoes and legumes), nuts and legumes, low-fat dairy products, and whole grains and low intake of sodium, sweetened beverages, and red and processed meats. The original DASH diet limits saturated fat intake, which would be in part reflected by a de-emphasis on red and processed meats in our score. For each of the components, we classified subjects into sex-specific quintiles according to their intake ranking. Component score for fruits, vegetables, nuts and legumes, low-fat dairy products, and whole grains is the sex-specific’s quintile ranking. For example, quintile 1 is assigned 1 point and quintile 5, 5 points. For sodium, red and processed meats, and sweetened beverages, low intake was desired. Therefore, the lowest quintile was given a score of 5 points and the highest quintile, 1 point. We then summed up the component scores to obtain an overall DASH score ranging from 8 (lowest adherence) to 40 (highest adherence).
Education was categorized into three groups; low, average and high. Low education attainment included those with primary education up to those completing intermediate vocational education, average educational attainment included those with higher secondary education and high educational attainment included those with higher

Alcohol, lifestyles and type 2 diabetes |
53
vocational education and university. Women were assumed to be post-menopausal when they reported not having menstrual periods for at least a year. Serum HDL-cholesterol was measured in a 6.5% random sample of the baseline cohort using an automated enzymatic procedure on a Vitros 250 (Johnson & Johnson, Rochester, NY, U.S.A.). Assessment of alcohol intake Alcohol consumption was assessed by the general questionnaire and FFQ. The validity of this alcohol consumption assessment is good as confirmed by a Spearman correlation of 0.87 for women and 0.74 for men between the FFQ and twelve 24-hour recalls (17). Through the general questionnaire subjects were asked whether they had ever consumed alcohol. If so, they were asked the number of units of alcohol-free beer, beer, white wine, red wine, port/sherry/vermouth and spirits consumed. Subjects indicated their consumption frequency on a daily/weekly/monthly/yearly scale or as never consumed. Alcohol consumption at baseline was determined by multiplying the alcohol percentage of each beverage by the standard ethanol weight content (5% for beer, 18.5% for fortified wine, 12.5% for red wine, 12% for white wine and 40% for liquor; means from the average sorts of beverages). Ascertainment of type 2 diabetes The ascertainment of type 2 diabetes has been described in more detail elsewhere (20). The incidence of type 2 diabetes was first assessed by self-report in follow-up questionnaires and a urine dipstick test in the Prospect cohort only. Also data on diagnosis of type 2 diabetes were obtained from the Dutch Centre for Health Care Information, which holds a standardized computerized register of hospital discharge diagnoses [all diagnosis were coded according to the International Classification of Diseases, Ninth revision (ICD-9, ICD codes 250)] (21). The records from this database were linked to the EPIC-NL cohort with a validated probabilistic method (22). All potential cases of type 2 diabetes have been verified against medical records of the general practitioners and pharmacists. For 89% of all potential diabetes cases verification information was available. Of these potential diabetes cases 72% were verified as having type 2 diabetes and were used as such in the analysis. The remaining 28% was verified as not having type 2 diabetes or having another type of diabetes like gestational diabetes and were therefore included in our analysis as non-cases. Definition of low-risk lifestyle behaviors and alcohol categories We used the World Health Organization cut-off for healthy weight (BMI <25 kg/m2). Results were essentially the same when we defined low risk for BMI as 18.5 to <25 kg/m2 (data not shown). We used waist circumference as a surrogate measure for healthy weight. Low risk level was defined as a waist circumference of less than 88 cm in women or 92 cm in men (Adult Treatment Panel III criteria) (23). We dichotomized the population based on the four categories of CPAI into physically active (≥30 minutes of combined recreational, household, and occupational physical activity/day; CPAI categories: moderately active,
| Chapter 3
54
active) and physically inactive (<30 minutes of combined daily recreational, household, and occupational physical activity/day; CPAI categories: inactive, moderately inactive). In terms of cigarette smoking participants were categorized in current non-smokers (never/former) or current smokers. For the DASH diet score categories were: low adherence (lower 3 quintiles; composite score range of 8 to 25), or high adherence (upper 2 quintiles; composite score range of 26 to 40). Alcohol categories were divided in four alcohol groups in line with the 2005 U.S. DA Dietary Guidelines (24) as follows: teetotalers (lifelong abstainers), light (0-4.9 g/day for both women and men; includes former drinkers), moderate (between 5.0 to 14.9 g/day for women; 5.0 to 29.9 g/day for men) and heavier consumers (≥15.0 g/day for women; ≥30.0 g/day for men). Statistical analysis Follow up time was calculated from date of enrolment into the study to the date of diabetes diagnosis or date of death, all other participants were censored at the end of follow up (January 2006). We used Cox proportional hazards model to calculate relative risk for each alcohol consumption category using teetotalers as a reference and 95% confidence intervals (95% CI), adjusted for age (continuous), BMI, (continuous), physical activity (inactive; moderately inactive; moderately active; active), smoking (never, former and current), adherence to the DASH diet (quintiles), parental history of type 2 diabetes (present or not), education (high, middle, low), postmenopausal status (premenopausal, postmenopausal, perimenopausal and surgical postmenopausal), cohort (Prospect-EPIC-NL or MORGEN-EPIC-NL) and daily energy intake (continuous) and stratified by gender. To determine effects of alcohol consumption and individual lifestyle behaviors, the association of alcohol consumption with type 2 diabetes was first estimated stratified by each lifestyle factor separately. Secondly, to determine the effects of alcohol consumption and combined low-risk lifestyle factors on type 2 diabetes incidence, participants could score one point for each low-risk lifestyle: BMI <25 kg/m2, physically active, current non-smoker, and upper two quintiles of the DASH diet. They could have a score ranging from 0 (no low-risk behaviors) to 4 (all low-risk behaviors). Statistical interaction of alcohol consumption with gender and with lifestyle behaviors was assessed based on likelihood ratio tests in models with and with out the cross-product terms in the multivariable model. Statistical analyses were performed using the SAS statistical software package (SAS version 9, SAS Institute, Cary, NC, U.S.A.). Results In both men and women, teetotalers smoked less and were less highly educated compared to alcohol consumers (Table 3.1). Less than 2.0% of the women reported drinking >45 g/day (>3 drinks/day) and 2.2% of the men reported drinking >75 g/day (>5 drinks/day). To validate the self-reported alcohol intake, we determined the relation between alcohol intake and HDL-cholesterol in a 6.5% sub-cohort. This analysis showed a linear association (P <
Alcohol, lifestyles and type 2 diabetes |
55
0.001) between alcohol intake and HDL-cholesterol concentrations in both men (N = 604) and women (N = 1,719) (β ± SD: 0.062 ± 0.005 mmol/l per 5 g alcohol/day in women and 0.043 ± 0.007 mmol/l per 10 g alcohol/day in men) adjusted for all confounders from the multivariable model.
During a median follow-up of 10.3 person-years (360,661 person-years) we verified 618 female and 178 male incident cases of type 2 diabetes. Compared with female teetotalers hazard ratios (HRs) for type 2 diabetes were 0.75 (95% confidence interval (CI): 0.61, 0.91) for light, 0.48 (95% CI: 0.36, 0.63) for moderate and 0.54 (95% CI: 0.40, 0.73) for heavier drinkers after multivariable adjustment. Among males, HRs were 0.98 (95% CI: 0.53, 1.80) for light, 0.79 (95% CI: 0.43, 1.44) for moderate and 0.71 (95% CI: 0.37, 1.38) for heavier drinkers compared with male teetotalers after multivariable adjustment. Because we did not find a gender-based difference (Pinteraction = 0.50) between alcohol consumption and type 2 diabetes, we combined men and women in further analyses. In the entire population, HRs for type 2 diabetes were 0.78 (95% CI: 0.64, 0.95) for light, 0.55 (95% CI: 0.43, 0.69) for moderate and 0.57 (95% CI: 0.44, 0.74) for heavier alcohol consumers compared with teetotalers after multivariable adjustment.
Prevalence of low-risk lifestyle behaviors was, 47.1% for having an optimal weight, 68.7% for having an optimal waist circumference, 62.3% for being physically active, 69.3 for not smoking and 38.5% for having a high diet quality. After multivariable adjustments, HRs for risk of type 2 diabetes in high-risk strata of lifestyle behaviors were 6.11 (95% CI: 4.74, 7.83) for BMI, 5.96 (95% CI: 5.02, 7.08) for waist circumference, 1.06 (95% CI: 0.92, 1.22) for physical activity, 1.19 (95% CI: 1.01, 1.40) for smoking and 1.18 (95% CI: 1.01, 1.37) for the DASH diet compared to the low-risk levels of each lifestyle behavior. When analyzing physical activity over the four categories in the multivariable adjusted model more pronounced associations were observed: Each increase in physical activity category was significantly associated with a 7% lower risk of type 2 diabetes after multivariable adjustments (Ptrend < 0.05). Results were essentially the same when we excluded imputed values for physical activity.
Compared with teetotalers, HRs of moderate alcohol consumers for risk of type 2 diabetes in low-risk lifestyle strata after multivariable adjustments were 0.35 (95% CI: 0.17, 0.72) when having an optimal weight or 0.45 (95% CI: 0.28, 0.72) when having an optimal waist circumference, 0.65 (95% CI: 0.46, 0.91) when being physical active, 0.54 (95% CI: 0.41, 0.71) when being a non-smoker and 0.57 (95% CI: 0.39, 0.84) when consuming a healthy diet (Table 3.2). Results were essentially the same when we excluded imputed values for physical activity: 0.67 (95% CI: 0.46, 0.98). Comparable results were found for moderate alcohol consumers in subgroups reporting less healthy lifestyle behaviors.
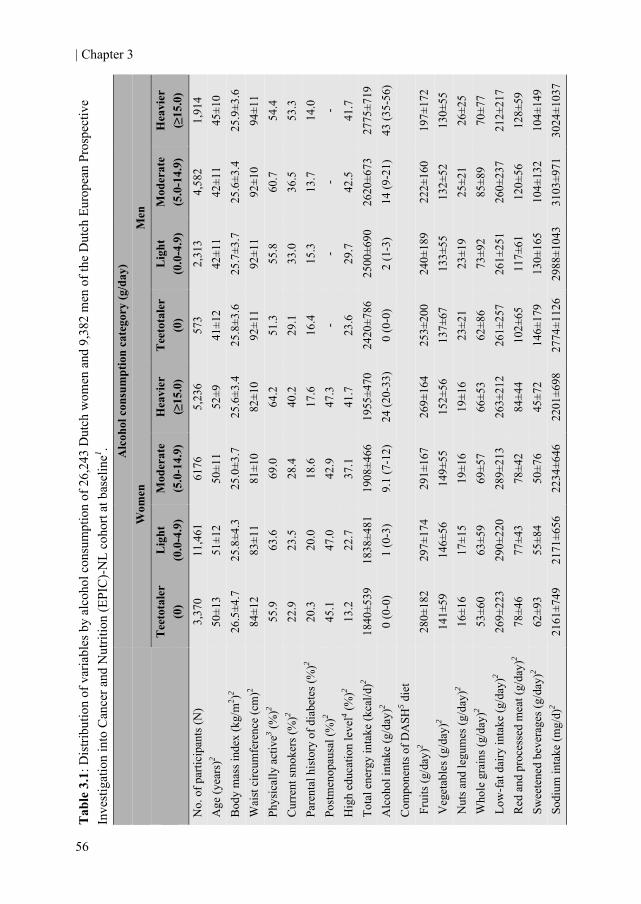
| Chapter 3
56
Tab
le 3
.1: D
istri
butio
n of
var
iabl
es b
y al
coho
l con
sum
ptio
n of
26,
243
Dut
ch w
omen
and
9,3
82 m
en o
f the
Dut
ch E
urop
ean
Pros
pect
ive
Inve
stig
atio
n in
to C
ance
r and
Nut
ritio
n (E
PIC
)-N
L co
hort
at b
asel
ine1 . A
lcoh
ol c
onsu
mpt
ion
cate
gory
(g/d
ay)
Men
Hea
vier
(≥
15.0
)
1,91
4 45
±10
25.9
±3.6
94
±11
54.4
53
.3
14.0
-
41.7
27
75±7
19
43 (3
5-56
)
197±
172
130±
55
26±2
5 70
±77
212±
217
128±
59
104±
149
3024
±103
7
Mod
erat
e (5
.0-1
4.9)
4,58
2 42
±11
25.6
±3.4
92
±10
60.7
36
.5
13.7
-
42.5
26
20±6
73
14 (9
-21)
222±
160
132±
52
25±2
1 85
±89
260±
237
120±
56
104±
132
3103
±971
Lig
ht
(0.0
-4.9
)
2,31
3 42
±11
25.7
±3.7
92
±11
55.8
33
.0
15.3
-
29.7
25
00±6
90
2 (1
-3)
24
0±18
9 13
3±55
23
±19
73±9
2 26
1±25
1 11
7±61
13
0±16
5 29
88±1
043
Tee
tota
ler
(0)
573
41±1
2 25
.8±3
.6
92±1
1 51
.3
29.1
16
.4
- 23
.6
2420
±786
0
(0-0
)
253±
200
137±
67
23±2
1 62
±86
261±
257
102±
65
146±
179
2774
±112
6
Wom
en
Hea
vier
(≥
15.0
)
5,23
6 52
±9
25.6
±3.4
82
±10
64.2
40
.2
17.6
47
.3
41.7
19
55±4
70
24 (2
0-33
)
269±
164
152±
56
19±1
6 66
±53
263±
212
84±4
4 45
±72
2201
±698
Mod
erat
e (5
.0-1
4.9)
6176
50
±11
25.0
±3.7
81
±10
69.0
28
.4
18.6
42
.9
37.1
19
08±4
66
9.1
(7-1
2)
29
1±16
7 14
9±55
19
±16
69±5
7 28
9±21
3 78
±42
50±7
6 22
34±6
46
Lig
ht
(0.0
-4.9
)
11,4
61
51±1
2 25
.8±4
.3
83±1
1 63
.6
23.5
20
.0
47.0
22
.7
1838
±481
1
(0-3
)
297±
174
146±
56
17±1
5 63
±59
290±
220
77±4
3 55
±84
2171
±656
Tee
tota
ler
(0)
3,37
0 50
±13
26.5
±4.7
84
±12
55.9
22
.9
20.3
45
.1
13.2
18
40±5
39
0 (0
-0)
28
0±18
2 14
1±59
16
±16
53±6
0 26
9±22
3 78
±46
62±9
3 21
61±7
49
No.
of p
artic
ipan
ts (N
) A
ge (y
ears
)2 B
ody
mas
s ind
ex (k
g/m
2 )2 W
aist
circ
umfe
renc
e (c
m)2
Phys
ical
ly a
ctiv
e3 (%)2
Cur
rent
smok
ers (
%)2
Pare
ntal
his
tory
of d
iabe
tes (
%)2
Post
men
opau
sal (
%)2
Hig
h ed
ucat
ion
leve
l4 (%)2
Tota
l ene
rgy
inta
ke (k
cal/d
)2 A
lcoh
ol in
take
(g/d
ay)2
Com
pone
nts o
f DA
SH5 d
iet
Fru
its (g
/day
)2 V
eget
able
s (g/
day)
2 N
uts a
nd le
gum
es (g
/day
)2 W
hole
gra
ins (
g/da
y)2
Low
-fat
dai
ry in
take
(g/d
ay)2
Red
and
pro
cess
ed m
eat (
g/da
y)2
Sw
eete
ned
beve
rage
s (g/
day)
2 S
odiu
m in
take
(mg/
d)2
Alcohol, lifestyles and type 2 diabetes |
57
1 Dat
a ar
e m
ean
± SD
or m
edia
n (2
5th to
75th
per
cent
iles)
for c
ontin
uous
var
iabl
es o
r per
cent
for d
icho
tom
ous a
nd c
ateg
oric
al v
aria
bles
. 2 P
val
ues <
0.0
5 be
twee
n al
coho
l cat
egor
ies w
ithin
gen
der b
ased
on
AN
OV
A (c
ontin
uous
var
iabl
es) o
r chi
squa
re (c
ateg
oric
al v
aria
bles
). 3 P
hysi
cal
activ
ity w
as b
ased
on
an i
ndex
of
com
bine
d re
crea
tiona
l, ho
useh
old,
and
occ
upat
iona
l ph
ysic
al a
ctiv
ity (
Phys
ical
ly a
ctiv
e: ≥
30 m
inut
es o
f co
mbi
ned
recr
eatio
nal,
hous
ehol
d, a
nd o
ccup
atio
nal p
hysi
cal a
ctiv
ity/d
ay).
4 Hig
h ed
ucat
iona
l lev
el: h
ighe
r voc
atio
nal e
duca
tion
and
univ
ersi
ty.
5 Die
tary
App
roac
h to
Sto
p H
yper
tens
ion
(DA
SH) d
iet i
s a
diet
focu
sing
on
8 co
mpo
nent
s: h
igh
inta
ke o
f fru
its, v
eget
able
s, nu
ts a
nd le
gum
es, l
ow fa
t dai
ry p
rodu
cts,
and
who
le g
rain
s and
low
inta
ke o
f sod
ium
, sw
eete
ned
beve
rage
s, an
d re
d an
d pr
oces
sed
mea
ts.
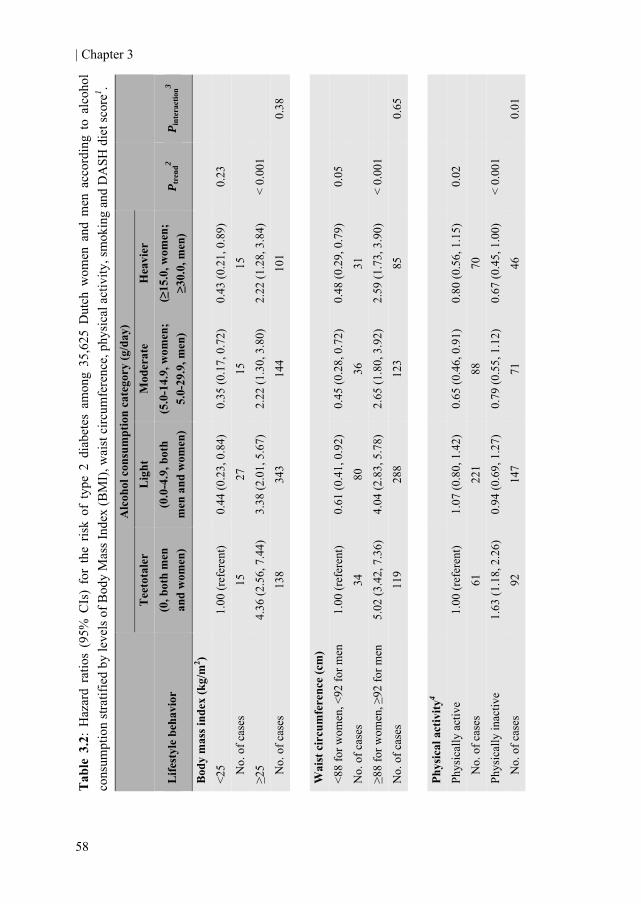
| Chapter 3
58
Tab
le 3
.2:
Haz
ard
ratio
s (9
5% C
Is)
for
the
risk
of t
ype
2 di
abet
es a
mon
g 35
,625
Dut
ch w
omen
and
men
acc
ordi
ng t
o al
coho
lco
nsum
ptio
n st
ratif
ied
by le
vels
of B
ody
Mas
s Ind
ex (B
MI)
, wai
st c
ircum
fere
nce,
phy
sica
l act
ivity
, sm
okin
g an
d D
ASH
die
t sco
re1 .
P int
erac
tion3
0.
38
0.
65
0.
01
P tre
nd2
0.
23
< 0.
001
0.
05
<
0.00
1
0.02
<
0.00
1
Alc
ohol
con
sum
ptio
n ca
tego
ry (g
/day
) H
eavi
er
(≥15
.0, w
omen
; ≥3
0.0,
men
)
0.43
(0.2
1, 0
.89)
15
2.22
(1.2
8, 3
.84)
10
1 0.
48 (0
.29,
0.7
9)
31
2.59
(1.7
3, 3
.90)
85
0.80
(0.5
6, 1
.15)
70
0.67
(0.4
5, 1
.00)
46
Mod
erat
e (5
.0-1
4.9,
wom
en;
5.0-
29.9
, men
)
0.35
(0.1
7, 0
.72)
15
2.22
(1.3
0, 3
.80)
14
4 0.
45 (0
.28,
0.7
2)
36
2.65
(1.8
0, 3
.92)
12
3
0.65
(0.4
6, 0
.91)
88
0.79
(0.5
5, 1
.12)
71
Lig
ht
(0.0
-4.9
, bot
h m
en a
nd w
omen
)
0.44
(0.2
3, 0
.84)
27
3.38
(2.0
1, 5
.67)
34
3 0.
61 (0
.41,
0.9
2)
80
4.04
(2.8
3, 5
.78)
28
8
1.07
(0.8
0, 1
.42)
221
0.94
(0.6
9, 1
.27)
14
7
Tee
tota
ler
(0, b
oth
men
an
d w
omen
)
1.00
(ref
eren
t) 15
4.36
(2.5
6, 7
.44)
13
8 1.
00 (r
efer
ent)
34
5.02
(3.4
2, 7
.36)
11
9
1.00
(ref
eren
t)
61
1.63
(1.1
8, 2
.26)
92
Life
styl
e be
havi
or
Bod
y m
ass i
ndex
(kg/
m2 )
<25
N
o. o
f cas
es
≥25
N
o. o
f cas
es
Wai
st c
ircu
mfe
renc
e (c
m)
<88
for w
omen
, <92
for m
en
No.
of c
ases
≥8
8 fo
r wom
en, ≥
92 fo
r men
N
o. o
f cas
es
Phys
ical
act
ivity
4
Phys
ical
ly a
ctiv
e
N
o. o
f cas
es
Phys
ical
ly in
activ
e
No.
of c
ases

Alcohol, lifestyles and type 2 diabetes |
59
0.03
0.38
1 H
azar
d ra
tios
wer
e de
rived
usi
ng C
ox p
ropo
rtion
al h
azar
d m
odel
s an
d w
ere
adju
sted
for
age
(con
tinuo
us),
pare
ntal
his
tory
of d
iabe
tes
(pre
sent
or n
ot),
men
opau
sal
stat
us (p
rem
enop
ausa
l, su
rgic
al p
ostm
enop
ausa
l, pe
rimen
opau
sal a
nd p
ostm
enop
ausa
l), e
duca
tion
(hig
h, m
iddl
e, a
nd lo
w),
coho
rt (P
rosp
ect o
r M
onito
ring
Proj
ect o
n R
isk
Fact
ors
for
Chr
onic
Dis
ease
s), a
nd e
nerg
y in
take
/day
(co
ntin
uous
) an
d w
ere
stra
tifie
d by
sex
. Fur
ther
mor
e, m
odel
s w
ere
adju
sted
for
eac
h of
the
othe
r th
ree
lifes
tyle
beh
avio
rs n
ot st
ratif
ied
on: B
MI (
cont
inuo
us),
phys
ical
act
ivity
(ina
ctiv
e, m
oder
atel
y in
activ
e, m
oder
atel
y ac
tive
and
activ
e), s
mok
ing
(nev
er, f
orm
er, c
urre
nt),
and
adhe
renc
e to
the
DA
SH d
iet (
quin
tiles
). 2 D
eriv
ed u
sing
line
ar tr
end
test
acr
oss o
rdin
al c
ateg
orie
s of a
lcoh
ol c
onsu
mpt
ion
(teet
otal
er, l
ight
, mod
erat
e, h
eavi
er).
3 Der
ived
usi
ng li
kelih
ood
ratio
test
s fr
om m
odel
s w
ith a
nd w
ith o
ut th
e cr
oss-
prod
uct t
erm
of a
lcoh
ol c
ateg
ory
(teet
otal
er, l
ight
, mod
erat
e, h
eavi
er) a
nd e
ach
lifes
tyle
beha
vior
(low
-ris
k, h
igh-
risk)
in th
e m
ultiv
aria
ble
mod
el.
4 Phy
sica
l ac
tivity
was
bas
ed o
n an
ind
ex o
f co
mbi
ned
recr
eatio
nal,
hous
ehol
d, a
nd o
ccup
atio
nal
phys
ical
act
ivity
(Ph
ysic
ally
act
ive:
≥30
min
utes
of
com
bine
d re
crea
tiona
l, ho
useh
old,
and
occ
upat
iona
l ph
ysic
al a
ctiv
ity/d
ay;
phys
ical
ly i
nact
ive:
<30
min
utes
of
com
bine
d re
crea
tiona
l, ho
useh
old,
and
occ
upat
iona
l ph
ysic
alac
tivity
/day
). 5 D
ieta
ry A
ppro
ach
to S
top
Hyp
erte
nsio
n (D
ASH
) die
t is
a di
et fo
cusi
ng o
n 8
com
pone
nts:
hig
h in
take
of f
ruits
, veg
etab
les,
nuts
and
legu
mes
, low
fat d
airy
pro
duct
s, an
d w
hole
gra
ins
and
low
inta
ke o
f sod
ium
, sw
eete
ned
beve
rage
s, an
d re
d an
d pr
oces
sed
mea
ts (h
igh
adhe
renc
e: u
pper
2 q
uint
iles
(com
posi
te s
core
rang
e of
26
to 4
0);
low
adh
eren
ce: l
ower
3 q
uint
iles (
com
posi
te sc
ore
rang
e of
8 to
25)
).
0.
001
< 0.
001
0.
001
< 0.
001
0.
73 (0
.54,
0.9
8)
80
0.51
(0.3
5, 0
.74)
36
0.45
(0.2
8, 0
.73)
29
0.74
(0.5
1, 1
.07)
87
0.
54 (0
.41,
0.7
1)
104
0.75
(0.5
3, 1
.04)
55
0.57
(0.3
9, 0
.84)
59
0.63
(0.4
4, 0
.90)
10
0
0.
78 (0
.62,
0.9
6)
278
1.03
(0.7
8, 1
.36)
90
0.81
(0.5
9, 1
.13)
142
0.89
(0.6
5, 1
.22)
22
6
1.
00 (r
efer
ent)
121
1.21
(0.8
2, 1
.80)
32
1.00
(ref
eren
t)
49
1.18
(0.8
4, 1
.67)
10
4
Smok
ing
Cur
rent
ly n
on-s
mok
ing
N
o. o
f cas
es
Smok
ing
N
o. o
f cas
es
DA
SH5 d
iet
Hig
h ad
here
nce
N
o. o
f cas
es
Low
adh
eren
ce
N
o. o
f cas
es

| Chapter 3
60
Tab
le 3
.3: H
azar
d ra
tios
(95%
CIs
) of t
ype
2 di
abet
es a
ccor
ding
to d
rinki
ng h
abits
com
bine
d w
ith 3
or 4
, 2, a
nd n
one
or 1
low
-risk
lif
esty
le b
ehav
iors
1 .
P int
erac
tion4
0.17
1 H
azar
d ra
tios
wer
e de
rived
by
usin
g C
ox p
ropo
rtion
al h
azar
ds m
odel
s an
d w
ere
adju
sted
for
age
(co
ntin
uous
), pa
rent
al h
isto
ry o
f di
abet
es (
pres
ent
or n
ot),
men
opau
sal s
tatu
s (p
rem
enop
ausa
l, po
stm
enop
ausa
l, pe
rimen
opau
sal a
nd s
urgi
cal p
ostm
enop
ausa
l), e
duca
tion
(hig
h, m
iddl
e, a
nd lo
w),
coho
rt (P
rosp
ect o
r Mon
itorin
g Pr
ojec
t on
Ris
k Fa
ctor
s for
Chr
onic
Dis
ease
s), a
nd e
nerg
y in
take
/day
(con
tinuo
us) a
nd st
ratif
ied
by se
x.
2 The
fou
r lo
w-r
isk
beha
vior
s ar
e: b
ody
mas
s in
dex
<25
kg/m
2 , ph
ysic
ally
act
ive
(≥30
min
utes
of
com
bine
d re
crea
tiona
l, ho
useh
old,
and
occ
upat
iona
l ph
ysic
al
activ
ity/d
ay),
curr
ently
not
sm
okin
g (fo
rmer
and
nev
er s
mok
ers)
and
hig
h ad
here
nce
(upp
er tw
o qu
intil
es: c
ompo
site
sco
re ra
nge
of 2
6 to
40)
to th
e D
ASH
die
t (a
diet
fo
cusi
ng o
n 8
com
pone
nts:
hig
h in
take
of
frui
ts,
vege
tabl
es,
nuts
and
leg
umes
, lo
w f
at d
airy
pro
duct
s, an
d w
hole
gra
ins
and
low
int
ake
of s
odiu
m,
swee
tene
dbe
vera
ges,
and
red
and
proc
esse
d m
eats
). 3 D
eriv
ed u
sing
line
ar tr
end
test
acr
oss o
rdin
al c
ateg
orie
s of a
lcoh
ol c
onsu
mpt
ion
(teet
otal
er, l
ight
, mod
erat
e, h
eavi
er).
4 Der
ived
usi
ng a
like
lihoo
d ra
tio te
st f
rom
mod
els
with
and
with
out
the
cros
s-pr
oduc
t ter
m o
f al
coho
l cat
egor
y (te
etot
aler
, lig
ht, m
oder
ate,
hea
vier
) an
d co
mbi
ned
low
-ris
k lif
esty
le c
ateg
ory
(3 o
r 4, 2
, and
non
e or
1 lo
w-r
isk
lifes
tyle
beh
avio
rs) i
n th
e m
ultiv
aria
ble
mod
el.
P tre
nd3
0.02
0.00
2 <
0.00
1
Alc
ohol
con
sum
ptio
n ca
tego
ry (g
/day
) H
eavi
er
(≥15
.0, w
omen
; ≥3
0.0,
men
) 0.
63 (0
.34,
1.1
8)
20
1.43
(0.8
5, 2
.42)
48
1.50
(0.8
9, 2
.53)
48
Mod
erat
e (5
.0-1
4.9,
wom
en;
5.0-
29.9
, men
) 0.
56 (0
.32,
1.0
0)
30
1.21
(0.7
3, 2
.01)
61
1.98
(1.2
0, 3
.28)
68
Lig
ht
(0.0
-4.9
, bot
h m
en a
nd w
omen
) 1.
13 (0
.70,
1.8
3)
92
1.70
(1.0
6, 2
.72)
131
2.75
(1.7
2, 4
.39)
14
5
Tee
tota
ler
(0, b
oth
men
an
d w
omen
) 1.
00 (r
efer
ent)
21
2.68
(1.6
2, 4
.45)
61
3.90
(2.3
7, 6
.42)
71
Num
ber
of lo
w-r
isk
lifes
tyle
be
havi
ors c
ombi
ned2
3 or
4
N
o. o
f cas
es
2 N
o. o
f cas
es
1 or
non
e
No.
of c
ases

Alcohol, lifestyles and type 2 diabetes |
61
There were significant interactions between alcohol consumption categories and physical activity and between alcohol consumption categories and smoking, but these were mainly due to the lower risks of heavier drinkers who smoke or are physically inactive. Interactions between alcohol consumption categories and other dichotomous lifestyle behaviors were not significant (Table 3.2).
In order to have adequate power to investigate the impact of combined low-risk lifestyle factors across categories of alcohol consumption, we grouped participants with three or all four (38.2%), two (35.5%), and one or none (26.3%) low-risk lifestyle behaviors together. When ≥3 low-risk lifestyle behaviors were combined, HR for incidence of type 2 diabetes among moderate alcohol consumers after multivariable adjustments was 0.56 (95% CI: 0.32, 1.00) (Table 3.3). Results were essentially the same but more precise when we used the low-risk level for waist circumference instead of the low-risk level of BMI with the combined lifestyles analysis: 0.60 (95% CI: 0.37, 0.97). Similar associations were found among moderate alcohol consumers reporting less low-risk lifestyle habits. We observed no effect modification of the association of gender with combined low-risk lifestyle behaviors (Pinteraction = 0.23) or alcohol and combined low-risk lifestyle behaviors (Pinteraction = 0.17) after multivariable adjustment.
When analyzing data for each cohort separately almost identical HRs, tough less precise, were observed among moderate alcohol consumers with ≥3 low-risk lifestyle behaviors combined. The HR for the Prospect cohort was 0.54 (95% CI: 0.27, 1.08) whereas the HR for the MORGEN cohort was 0.59 (95% CI: 0.22, 1.57) after multivariable adjustment. Again, when low-risk level of BMI was replaced with the low-risk level of waist circumference in the combined score, virtually the same HRs were observed among moderate alcohol consumers with ≥3 low-risk lifestyle behaviors combined when results from the multivariate model were split up according to cohort: Prospect cohort: 0.55 (95% CI: 0.30, 1.00); MORGEN cohort: 0.61 (95% CI: 0.28, 1.32). Discussion This prospective study shows that moderate alcohol consumption is associated with a reduced risk of developing type 2 diabetes, regardless of other favorable behavioral lifestyles. Among participants already at lower risk of developing type 2 diabetes based on the combined effect of body weight, physical activity level, smoking habits, and diet quality, moderate alcohol consumption was associated with a lower risk for the incidence of type 2 diabetes.
Our results confirm that moderate alcohol consumption reduces the risk of type 2 diabetes in the presence of individual low-risk lifestyle behaviors, such as BMI, physical activity and smoking, which is in line with 3 previous observational studies (11-13). In addition, they show that moderate alcohol consumption remains to be associated with a lower risk of type 2 diabetes among those with multiple low-risk lifestyle behaviors combined. These findings indicate that the relation between alcohol consumption and type

| Chapter 3
62
2 diabetes is not likely to be explained by a healthier lifestyle of moderate drinkers in general.
Our findings of joint moderate alcohol consumption and healthy lifestyle behaviors are comparable with findings of Mukamal et al for risk of coronary heart disease (25). In their study, men with 4 healthy lifestyle behaviors, who drank alcohol in moderation (5.0 to 29.9 g/day) remained to have a significant lower risk for myocardial infarction as compared with abstainers. Therefore, the associations of alcohol consumption with both type 2 diabetes and coronary heart disease do not seem to be confounded by healthier lifestyles of moderate drinkers.
In our cohort, heavier drinkers had lower risks of developing type 2 diabetes compared with teetotalers. Even heavier drinkers with a less favorable lifestyle behavior (based on smoking status, physical activity, and diet), had lower risks of developing type 2 diabetes compared with teetotalers with the favorable lifestyle behavior (Table 2). These findings warrant clarification. A reduction in the risk of developing type 2 diabetes is observed for an alcohol intake up to 50 g/day (6;7). However, the upper limit for moderate drinking in the current study was based on the 2005 U.S. DA Dietary Guidelines (24), directed at prevention of all chronic diseases rather than on maximum risk reduction of type 2 diabetes. These relatively low cutoffs, particularly for women, could explain the low-risks observed among the heavier drinkers.
Clearly, the observations for heavier drinkers must be considered in the light of potential harmful effects of excessive alcohol intake and greater risk of certain cancers such as breast and rectum (26). Heavy or excessive drinking should always be discouraged, whereas moderate alcohol consumption could be regarded as a complement, rather than an alternative, to other low-risk lifestyle habits. Guidelines and personal advice on alcohol consumption should consider the full range of benefits and risks to the individual.
The association between alcohol consumption and type 2 diabetes tended to be stronger in women than in men, which is consistent with previous meta-analyses (6;7). However, studies in these meta-analyses that reported results for both men and women did not find this trend. Men in this cohort were substantially younger than women and only about one-fourth of the entire cohort consisted of men. Subsequently, there were fewer incident cases of type 2 diabetes in men than in women, which may explain the weaker association between alcohol intake and incidence type 2 diabetes in men.
There are several biologically plausible mechanisms to explain an inverse association between moderate alcohol consumption and type 2 diabetes. In 2 short-term randomized controlled crossover trials of women without diabetes, alcohol consumption of 30 and 25 g/day decreased insulin resistance and triglycerides concentrations (8;9). Besides these effects, moderate alcohol consumption increases both gene expression and circulating protein levels of adiponectin (9). Adiponectin is positively associated with insulin sensitivity and inversely associated with inflammation and type 2 diabetes (27). Recently it has been suggested that adiponectin may explain about 25 to 30% of the inverse association between alcohol consumption and type 2 diabetes in women (28).
Alcohol, lifestyles and type 2 diabetes |
63
Some limitations of our study warrant consideration. First, a FFQ was used for nutritional assessment including alcohol intake. Self-reported alcohol intake is generally being underreported (29). However, there was a high correlation between alcohol consumption from the FFQ and the twelve 24-hour recalls and between alcohol consumption and serum HDL-cholesterol levels. This suggests sufficient validity for ranking participants on alcohol consumption. Also, we could not take drinking pattern (regular versus episodic/binge drinking) into account. However, among moderately drinking middle-aged and older women, binge drinking does not occur frequently (30). It is therefore unlikely that this influenced the results in this cohort of predominantly middle-aged and older women. Furthermore, we did not take into account beverage type in the association between alcohol and type 2 diabetes. However, a previous study in one of the cohorts presented here showed that beverage type did not influence this association (20).
Second, we used only baseline measurements to characterize individuals and did not take into account possible changes in alcohol consumption or other lifestyle behaviors over follow-up. People who are already ill or have poor health might be more likely to change their diet and could therefore drink less or even quit drinking as a result of this. However, we repeated the analyses excluding people with type 2 diabetes within the first two years of follow-up and the association persisted (data not shown). We excluded those with prevalent cardiovascular diseases and cancer at baseline. In addition, we used lifetime abstainers as a reference category without occasional or former drinkers to rule out “the sick quitter” hypothesis (31). Therefore, our results are unlikely to be confounded by such reverse causality.
Third, although we adjusted for several known potential confounders, we cannot completely rule out the possibility of residual confounding. Finally, presence of type 2 diabetes goes often undetected, and may be preclinical up to nine to twelve years (32). Undetected diabetes cases in our cohort may have been misclassified as nondiabetic individuals, which resulted in the attenuation of associations.
In summary, this study supports the presence of an inverse association between moderate alcohol consumption and incidence of type 2 diabetes in a mixed population and extends this association to subjects already at low-risk based on their multiple low-risk lifestyle behaviors. Moderate alcohol consumption (approximately 0.5 to 1 drink/day for women and 0.5 to 2 drinks/day for men) appears to reduce the risk of type 2 diabetes, independently of other lifestyle behaviors.
| Chapter 3
64
Authors’ contributions The authors’ responsibilities were as follows - MMJ, HFJH, and JWJB: concept and design of the study; DEG, DLA, WMMV, and JWJB: acquisition of the data; MMJ, and JWJB: conducting the statistical analyses and writing of the first draft of the manuscript. DEG, DLA, WMMV, and HFJH: critical review, advice and consultation throughout. MMJ and HFJH receive partial funding (unrestricted) from the SAR, a Dutch organization for alcohol research. DEG, DLA, WMMV, and JWJB report no conflict of interest. Acknowledgement We thank GBA, Statistics Netherlands and the institute PHARMO for providing data on vital status, cause of death, and occurrence of chronic diseases. The research described in this article was partly funded by the Dutch Foundation for Alcohol Research (SAR).

Alcohol, lifestyles and type 2 diabetes |
65
References 1. Hu FB, Manson JE, Stampfer MJ et al. Diet, lifestyle, and the risk of type 2 diabetes mellitus
in women. N Engl J Med 2001;345:790-7.
2. Mozaffarian D, Kamineni A, Carnethon M, Djousse L, Mukamal KJ, Siscovick D. Lifestyle risk factors and new-onset diabetes mellitus in older adults: the cardiovascular health study. Arch Intern Med 2009;169:798-807.
3. Wannamethee SG, Shaper AG, Alberti KG. Physical activity, metabolic factors, and the incidence of coronary heart disease and type 2 diabetes. Arch Intern Med 2000;160:2108-16.
4. Rimm EB, Manson JE, Stampfer MJ et al. Cigarette smoking and the risk of diabetes in women. Am J Public Health 1993;83:211-4.
5. Liese AD, Nichols M, Sun X, D'Agostino RB, Jr., Haffner SM. Adherence to the DASH Diet is inversely associated with incidence of type 2 diabetes: the insulin resistance atherosclerosis study. Diabetes Care 2009;32:1434-6.
6. Baliunas DO, Taylor BJ, Irving H et al. Alcohol as a risk factor for type 2 diabetes: A systematic review and meta-analysis. Diabetes Care 2009;32:2123-32.
7. Koppes LL, Dekker JM, Hendriks HF, Bouter LM, Heine RJ. Moderate alcohol consumption lowers the risk of type 2 diabetes: a meta-analysis of prospective observational studies. Diabetes Care 2005;28:719-25.
8. Davies MJ, Baer DJ, Judd JT, Brown ED, Campbell WS, Taylor PR. Effects of moderate alcohol intake on fasting insulin and glucose concentrations and insulin sensitivity in postmenopausal women: a randomized controlled trial. JAMA 2002;287:2559-62.
9. Joosten MM, Beulens JW, Kersten S, Hendriks HF. Moderate alcohol consumption increases insulin sensitivity and ADIPOQ expression in postmenopausal women: a randomised, crossover trial. Diabetologia 2008;51:1375-81.
10. Fillmore KM, Stockwell T, Chikritzhs T, Bostrom A, Kerr W. Moderate alcohol use and reduced mortality risk: systematic error in prospective studies and new hypotheses. Ann Epidemiol 2007;17:S16-S23.
11. Ajani UA, Hennekens CH, Spelsberg A, Manson JE. Alcohol consumption and risk of type 2 diabetes mellitus among US male physicians. Arch Intern Med 2000;160:1025-30.
12. Wannamethee SG, Shaper AG, Perry IJ, Alberti KG. Alcohol consumption and the incidence of type II diabetes. J Epidemiol Community Health 2002;56:542-8.
13. Wannamethee SG, Camargo CA, Jr., Manson JE, Willett WC, Rimm EB. Alcohol drinking patterns and risk of type 2 diabetes mellitus among younger women. Arch Intern Med 2003;163:1329-36.
14. Beulens JW, Monninkhof EM, Verschuren MW et al. Cohort Profile: The EPIC-NL study. Int J Epidemiol 2009.
| Chapter 3
66
15. Voorrips LE, Ravelli AC, Dongelmans PC, Deurenberg P, van Staveren WA. A physical activity questionnaire for the elderly. Med Sci Sports Exerc 1991;23:974-9.
16. Wareham NJ, Jakes RW, Rennie KL et al. Validity and repeatability of a simple index derived from the short physical activity questionnaire used in the European Prospective Investigation into Cancer and Nutrition (EPIC) study. Public Health Nutr 2003;6:407-13.
17. Ocke MC, Bueno-de-Mesquita HB, Goddijn HE et al. The Dutch EPIC food frequency questionnaire. I. Description of the questionnaire, and relative validity and reproducibility for food groups. Int J Epidemiol 1997;26 Suppl 1:S37-S48.
18. Ocke MC, Bueno-de-Mesquita HB, Pols MA, Smit HA, van Staveren WA, Kromhout D. The Dutch EPIC food frequency questionnaire. II. Relative validity and reproducibility for nutrients. Int J Epidemiol 1997;26 Suppl 1:S49-S58.
19. Fung TT, Chiuve SE, McCullough ML, Rexrode KM, Logroscino G, Hu FB. Adherence to a DASH-style diet and risk of coronary heart disease and stroke in women. Arch Intern Med 2008;168:713-20.
20. Beulens JW, Stolk RP, Van der Schouw YT, Grobbee DE, Hendriks HF, Bots ML. Alcohol consumption and risk of type 2 diabetes among older women. Diabetes Care 2005;28:2933-8.
21. World Health Organization. International Classification of Diseases, 9th revision (ICD-9). Geneva, Switseland: WHO, 1977.
22. Herings RM, Bakker A, Stricker BH, Nap G. Pharmaco-morbidity linkage: a feasibility study comparing morbidity in two pharmacy based exposure cohorts. J Epidemiol Community Health 1992;46:136-40.
23. Grundy SM, Cleeman JI, Daniels SR et al. Diagnosis and management of the metabolic syndrome: an American Heart Association/National Heart, Lung, and Blood Institute Scientific Statement. Circulation 2005;112:2735-52.
24. U.S. Department of Health and Human Services and U.S. Department of Agriculture. Dietary Guidelines for Americans, 2005. Washington D.C.: Government Printing Office, 2005.
25. Mukamal KJ, Chiuve SE, Rimm EB. Alcohol Consumption and Risk for Coronary Heart Disease in Men With Healthy Lifestyles. Arch Intern Med 2006;166:2145-50.
26. Allen NE, Beral V, Casabonne D et al. Moderate Alcohol Intake and Cancer Incidence in Women. J Natl Cancer Inst 2009;101:296-305.
27. Duncan BB, Schmidt MI, Pankow JS et al. Adiponectin and the Development of Type 2 Diabetes: The Atherosclerosis Risk in Communities Study. Diabetes 2004;53:2473-8.
28. Beulens JWJ, Rimm EB, Hu FB, Hendriks HFJ, Mukamal KJ. Alcohol Consumption, Mediating Biomarkers, and Risk of Type 2 Diabetes Among Middle-Aged Women. Diabetes Care 2008;31:2050-5.
29. Feunekes GIJ, van 't Veer P, van Staveren WA, Kok FJ. Alcohol Intake Assessment: The Sober Facts. Am J Epidemiol 1999;150:105-12.

Alcohol, lifestyles and type 2 diabetes |
67
30. Naimi TS, Brewer RD, Mokdad A, Denny C, Serdula MK, Marks JS. Binge Drinking Among US Adults. JAMA 2003;289:70-5.
31. Shaper AG, Wannamethee G, Walker M. Alcohol and mortality in British men: explaining the U-shaped curve. Lancet 1988;2:1267-73.
32. Harris MI, Klein R, Welborn TA, Knuiman MW. Onset of NIDDM occurs at least 4-7 yr before clinical diagnosis. Diabetes Care 1992;15:815-9.

Chapter 4
Moderate alcohol consumption increases insulin sensitivity and ADIPOQ gene expression in
postmenopausal women: a randomized, crossover trial
Michel M. Joosten Joline W.J. Beulens
Sander Kersten Henk F.J. Hendriks
Diabetologia 2008 Aug;51(8):1375-81
| Chapter 4
70
Background: Moderate alcohol consumption has consistently been associated with a decreased risk of type 2 diabetes compared with abstaining and excessive drinking but whether it improves insulin sensitivity remains uncertain. Objective: To determine whether six weeks of daily, moderate alcohol consumption increases expression of the gene encoding adiponectin (ADIPOQ) and plasma levels of the protein, and improves insulin sensitivity in postmenopausal women. Methods: In a randomized, open-label, crossover trial conducted in the Netherlands, 36 apparently healthy postmenopausal women who were regular alcohol consumers, received 250 mL white wine (~25 g alcohol/day) or 250 mL of white grape juice (control) daily during dinner for six weeks. Randomization to treatment allocation occurred according to BMI. Insulin sensitivity and ADIPOQ mRNA and plasma adiponectin levels were measured at the end of both periods. Insulin sensitivity was estimated using the homeostasis model assessment of insulin resistance (HOMA-IR). Levels of ADIPOQ mRNA in subcutaneous adipose tissue were determined by RT-PCR. Results: All participants completed the study. Six weeks of white wine consumption reduced fasting insulin (mean ± SEM 40.0 ± 3.4 vs. 46.5 ± 3.4 pmol/L; P < 0.01) and HOMA-IR (1.42 ± 0.13 vs. 1.64 ± 0.13; P = 0.02) compared with 6 weeks of grape juice consumption. ADIPOQ mRNA levels (1.09 ± 0.15 vs. 0.98 ± 0.15; P = 0.04) and plasma levels of total (13.1 ± 0.8 vs. 12.0 ± 0.8 μg/mL; P < 0.001) and high-molecular weight (HMW) adiponectin (9.9 ± 1.2 vs. 8.8 ± 1.2 μg/mL; P = 0.02) significantly increased after alcohol consumption compared with juice consumption. Changes in ADIPOQ mRNA levels correlated with changes in plasma levels of total adiponectin (ρ = 0.46; P < 0.01). Both fasting triglyceride (8.2%; P = 0.04) and LDL-cholesterol levels (7.8%; P < 0.0001) decreased whereas HDL-cholesterol increased (7.0%; P < 0.0001) after prolonged moderate alcohol intake. No notable adverse events were reported. Conclusions: Moderate alcohol consumption for six weeks improves insulin sensitivity, adiponectin levels and lipid profile in postmenopausal women. Furthermore, these data suggest a transcriptional mechanism leading to the alcohol-induced increase in adiponectin plasma levels. Trial registration: Clinicaltrials.gov ID no.: NCT00285909.
Alcohol, adiponectin and insulin sensitivity |
71
Introduction Moderate alcohol consumption has consistently been associated with a decreased risk of type 2 diabetes compared with abstaining and excessive drinking (1;2). The reason for the lower risk of type 2 diabetes is not entirely clear but a plausible explanation seems to be improved insulin sensitivity (3). However, so far only one randomized controlled trial among postmenopausal women has confirmed this notion (4). Other studies, mainly performed among young male populations, failed to detect such effects (5-12).
Adiponectin, an adipose tissue-derived hormone, is thought to play an important role in the regulation of insulin sensitivity and glucose and lipid metabolism (13). Its plasma levels are positively associated with insulin sensitivity (14) and are inversely associated with impaired glucose metabolism and type 2 diabetes (15-17). Furthermore, observational studies revealed an association between moderate alcohol consumption, adiponectin concentrations and insulin sensitivity (18;19). Randomized controlled trials also showed a significant increase of both circulating levels of total and high-molecular weight (HMW) adiponectin (8;11;12) after a period of moderate alcohol consumption compared with abstention.
However, the mechanism by which moderate alcohol consumption increases adiponectin levels is unknown. Synthesis of adiponectin is controlled by peroxisome proliferator-activated receptor γ (PPARγ) activation, which functions as a transcriptional regulator (20). Low doses of alcohol have been shown to alter the expression of genes encoding tissue plasminogen activator (PLAT) and plasminogen activator inhibitor type-1 (PAI-1 also known as SERPINE1) (21). Like adiponectin, these markers are affected by moderate alcohol consumption and activated by PPARγ (22).
Consequently, we investigated whether moderate alcohol consumption affects gene expression of the gene encoding adiponectin (ADIPOQ) and levels of the protein, and whether it improves insulin sensitivity in postmenopausal women. Methods Study protocol The study used a randomized, open-label, placebo-controlled, crossover design, consisting of two 6-week periods, each preceded by a 1 week of washout. Participants consumed 250 mL of white wine (25 g alcohol; Chardonnay; Jean d’Alibert, Rieux, France) or alcohol-free white grape juice (Albert Heijn, Zaandam, the Netherlands) daily for 6 weeks during dinner. The study was conducted at TNO (a Dutch acronym for applied scientific research) Quality of Life, in Zeist, the Netherlands. The primary objective of the study was to investigate the effect of moderate alcohol consumption on PPARγ activity and risk markers of metabolic disease and took place from March through June 2006. Participants were instructed to maintain their habitual body weight, food pattern and physical activity pattern and were told to refrain from any alcoholic products during the entire study (including washout periods) except for alcoholic beverages supplied by TNO. Of the 77 women who
| Chapter 4
72
were screened, 40 were eligible to participate. A total of 36 women were randomly selected and initiated the study. Allocation to treatment order was randomized according to BMI. Both white wine and white grape juice contained 300kJ/100mL (~70 kcal/100mL). Blood and adipose tissue sampling was done on the last day of each treatment period after an overnight fast. Compliance was monitored by weekly measurement of urinary ethyl glucuronide (EtG), a direct phase II metabolite of ethanol formed by action of UDP- glucuronosyl transferase. EtG has been reported to be a superior marker with 100% sensitivity as a biomarker of recent drinking (23). It persists in the urine up to ~75 - 85 h after last intake. Additional measures of compliance were increase of HDL-cholesterol, daily questionnaires, and return of empty bottles. Participants Postmenopausal women were recruited from a pool of volunteers of TNO Quality of Life and by advertisements in local newspapers. Eligible participants consumed between 5 and 21 units of alcohol per week, were apparently healthy and had an absence of menses for at least two years, a BMI between 18.5 and 35 kg/m2 and no family history of alcoholism. Participants gave written informed consent and received a compensation for their participation. An independent medical ethical committee (The Medical Ethical Committee University Medical Centre Utrecht) approved the research protocol. Outcomes measures Primary endpoints were markers of insulin sensitivity such as homeostasis model assessment of insulin resistance (HOMA-IR), glucose, insulin, HbA1c and free fatty acids (FFA) and several adiponectin-related measures such as ADIPOQ mRNA levels and plasma levels of total and HMW adiponectin. Secondary variables included lipid profile (triglycerides, HDL-and LDL-cholesterol) HbA1c and FFA and correlations between specific outcome measures. Analyses and assessment Ethyl glucuronide was determined in morning urine samples. Urinary samples were diluted about twenty times using an internal standard solution. The resulting solution was analyzed using a triple quadrupole Ultra Performance LC/MS in MRM mode (Waters, Saint-Quentin En Yvelines Cedex, France) with a detection limit of 50 ng/mL. Cut-off limit to assess compliance during juice intervention for urinary EtG values was set at >0.25 mg/mL (positive sample), to obtain a high sensitivity but avoid positive results due to unintentional ethanol exposure. Cut-off limit during wine intervention was set at EtG values <0.5 mg/mL (2.2 μmol/L) (negative sample) as proposed by Bottcher et al. (24). Blood samples were obtained from the anticubital vein of the forearm and collected in tubes containing clot activator for serum and in ice-chilled tubes containing or Potassium Ethylene Diamine Tetra Acid (K3EDTA) for plasma (Vacutainer Systems, Becton Dickinson, Plymouth, U.K.). Blood was centrifuged for 15 minutes at 2.000 g at 4°C, within 15 - 30 minutes after
Alcohol, adiponectin and insulin sensitivity |
73
collection and stored at -80°C. All biochemical determinations in blood were performed at TNO Quality of Life using Olympus analytical equipment and reagents except for adiponectin. Plasma total adiponectin concentrations were determined by radioimmunoassay (RIA) method (Linco Research, Inc., St. Charles, MO, U.S.A.) with a mean intra-assay coefficient of variation of 5.0% and plasma high molecular weight (HMW) adiponectin levels by a novel Enzyme-linked immunosorbent assay (ELISA) (Linco Research) with a mean intra-assay coefficient of variation of 14.1%. LDL-cholesterol was calculated by the Friedewald formula. Subcutaneous adipose tissue was sampled from the buttock by means of a Strauss cannula, outer diameter 1.5 mm and stored at -70°C until further analysis. Total RNA was extracted from adipose tissues with TRIzol reagent (Invitrogen, Breda, The Netherlands); 1 mg total RNA was then reverse-transcribed with iScript (Bio-Rad,Veenendaal, The Netherlands). cDNA was PCR-amplified with Platinum Taq DNA polymerase (Invitrogen) on a Bio-Rad iCycler or MyIQ PCR machine. Expression were standardized to levels of acidic ribosomal protein ARBP (25). Primer sequences used were ADIPOQ forward: TATCCCCAACATGCCCATTCG, ADIPOQ reverse: TGGTAGGCAAAGTAGTACAGCC, PPARG forward: TCCATGCTGTTATGGGT-GAA, PPARG reverse: TCAAAGGAGTGGGAGTGGTC, ARBP forward: CGGGAAGGCTGTGGTGCTG and ARBP reverse: GTGAACACAAAGCCCACA-TTCC. Statistical analyses Statistical analyses were performed using the SAS statistical software package (SAS version 8, SAS Institute, Cary, NC, U.S.A.). All variables were compared between treatments with a mixed analysis of variance model that included terms for treatment, period and the interaction between period and treatment (indicating possible carryover effects). Body weight was included in the model as a random factor to adjust for changes of body weight. Correlation coefficients were computed according to Spearman rank order to assess associations between intervention-induced changes in outcome measures. Based on a study by Arvidsson et al. (26) a sample size of 36 should be sufficient to detect a 20% difference in ADIPOQ mRNA levels with a power of 80% and accepting a two-sided a of 0.05. Data are presented as means and SEM unless otherwise specified. Statistical significance was defined as P < 0.05. Results General results All 36 postmenopausal women completed the study. Participants were slightly overweight (BMI 25.4 ± 3.3 kg/m2). Mean glucose, insulin, triglycerides and cholesterol concentrations before the intervention indicated that participants were euglycemic and normolipidemic (Table 4.1).

| Chapter 4
74
Table 4.1: Characteristics of 36 postmenopausal women before intervention after an overnight fast.
Variable Baseline Age (years) 56.5 ± 4.2 Weight (kg) 71.4 ± 10.0 BMI (kg/m2) 25.4 ± 3.3 Glucose (mmol/L) 5.5 ±0.4 Insulin (pmol/L) 37.4 ± 12.6 Triglycerides (mmol/L) 1.21 ± 0.54 HDL-cholesterol (mmol/L) 1.67 ± 0.27 LDL-cholesterol (mmol/L) 3.88 ± 0.60 Total cholesterol (mmol/L) 6.11 ± 0.72 Alkaline phosphatase (U/L) 76.1 ± 19.3 Alanine aminotransferase (U/L) 15.3 ± 8.2 Aspartate aminotransferase (U/L) 20.8 ± 7.4 γ-Glutamyltranspeptidase (U/L) 21.3 ± 11.4 Follicle-stimulating hormone (IU/L) 108.5 ± 41.3
Data are means ± SD
Compliance with treatments was assessed by weekly urinary EtG revealing two positive samples during the juice-drinking period and six negative samples during the wine-drinking period out of the 468 samples analyzed (overall compliance of 98.3%). Another indicator for compliance was the 7.0% increase in HDL-cholesterol after wine compared with juice consumption (Table 4.2).
No significant (P > 0.05) carryover effects, as assessed by an interaction between treatment and period effect, were observed for any outcome measures. Treatment means of variables and P values estimated from models with period effects were very similar to those obtained from models without period effect, and we report the results of the latter. Mean body weight was 0.7 kg higher (P < 0.001) at the end of the alcohol drinking period (Table 4.2). Results were adjusted for this difference in body weight, but did not essentially change them. Therefore, unadjusted results are presented here. Insulin sensitivity Fasting serum insulin concentrations decreased (12.3%; P < 0.01) and HbA1c percentages (P < 0.09) tended to decrease after six weeks of moderate alcohol consumption compared with abstention. Insulin sensitivity, as expressed by the HOMA-IR index, also improved by 11.9 % (P = 0.02) after white wine consumption. However, there were no differences between serum glucose and free fatty acid concentrations after the two treatment periods (Table 4.2).
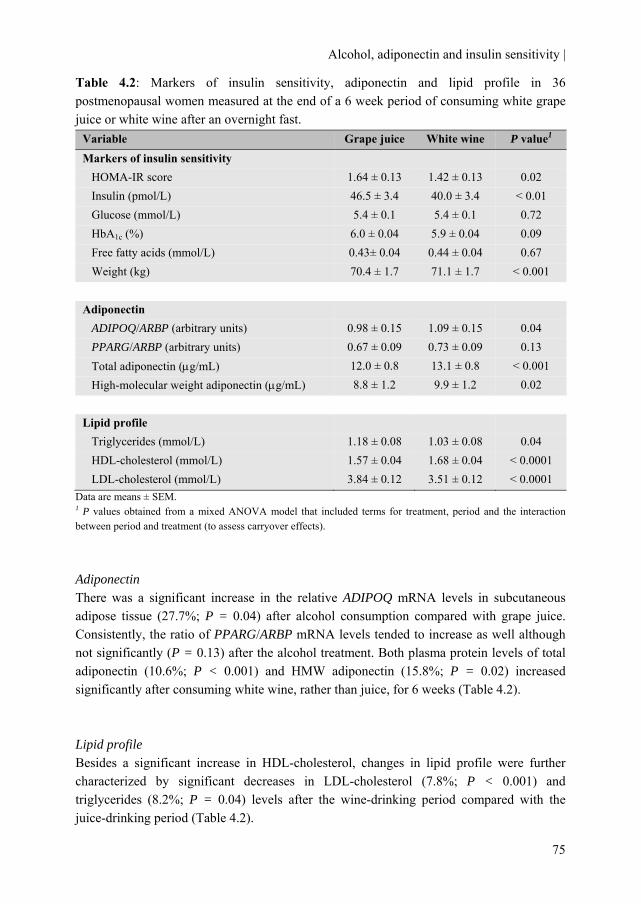
Alcohol, adiponectin and insulin sensitivity |
75
Table 4.2: Markers of insulin sensitivity, adiponectin and lipid profile in 36 postmenopausal women measured at the end of a 6 week period of consuming white grape juice or white wine after an overnight fast.
Data are means ± SEM. 1 P values obtained from a mixed ANOVA model that included terms for treatment, period and the interaction between period and treatment (to assess carryover effects). Adiponectin There was a significant increase in the relative ADIPOQ mRNA levels in subcutaneous adipose tissue (27.7%; P = 0.04) after alcohol consumption compared with grape juice. Consistently, the ratio of PPARG/ARBP mRNA levels tended to increase as well although not significantly (P = 0.13) after the alcohol treatment. Both plasma protein levels of total adiponectin (10.6%; P < 0.001) and HMW adiponectin (15.8%; P = 0.02) increased significantly after consuming white wine, rather than juice, for 6 weeks (Table 4.2). Lipid profile Besides a significant increase in HDL-cholesterol, changes in lipid profile were further characterized by significant decreases in LDL-cholesterol (7.8%; P < 0.001) and triglycerides (8.2%; P = 0.04) levels after the wine-drinking period compared with the juice-drinking period (Table 4.2).
Variable Grape juice White wine P value1 Markers of insulin sensitivity HOMA-IR score 1.64 ± 0.13 1.42 ± 0.13 0.02 Insulin (pmol/L) 46.5 ± 3.4 40.0 ± 3.4 < 0.01 Glucose (mmol/L) 5.4 ± 0.1 5.4 ± 0.1 0.72 HbA1c (%) 6.0 ± 0.04 5.9 ± 0.04 0.09 Free fatty acids (mmol/L) 0.43± 0.04 0.44 ± 0.04 0.67 Weight (kg) 70.4 ± 1.7 71.1 ± 1.7 < 0.001 Adiponectin ADIPOQ/ARBP (arbitrary units) 0.98 ± 0.15 1.09 ± 0.15 0.04 PPARG/ARBP (arbitrary units) 0.67 ± 0.09 0.73 ± 0.09 0.13 Total adiponectin (μg/mL) 12.0 ± 0.8 13.1 ± 0.8 < 0.001 High-molecular weight adiponectin (μg/mL) 8.8 ± 1.2 9.9 ± 1.2 0.02 Lipid profile Triglycerides (mmol/L) 1.18 ± 0.08 1.03 ± 0.08 0.04 HDL-cholesterol (mmol/L) 1.57 ± 0.04 1.68 ± 0.04 < 0.0001 LDL-cholesterol (mmol/L) 3.84 ± 0.12 3.51 ± 0.12 < 0.0001

| Chapter 4
76
Correlations Changes in ADIPOQ mRNA levels due to alcohol consumption correlated positively with changes in PPARG mRNA levels (ρ = 0.76; P < 0.001) and with changes in the plasma protein level of total adiponectin (ρ = 0.46; P < 0.01), but not with changes in plasma levels of HMW adiponectin (ρ = -0.25; P = 0.15). No significant correlations were found between changes in HOMA-IR and changes in total (ρ = 0.27; P = 0.11) or HMW (ρ = -0.18; P = 0.29) adiponectin plasma levels. Furthermore, changes in HDL-cholesterol correlated significantly with changes in total adiponectin (ρ = 0.47; P < 0.01) but not with HMW adiponectin levels (ρ = 0.13; P = 0.44). Discussion The primary findings of this study are that daily moderate alcohol intake improves insulin sensitivity and lipid profile in postmenopausal women. Furthermore, ADIPOQ mRNA levels in subcutaneous adipose tissue along with plasma levels of total and HMW adiponectin increased after moderate alcohol consumption. Moreover, changes in ADIPOQ mRNA levels correlated with changes in plasma total adiponectin indicating that prolonged moderate alcohol intake increases circulating adiponectin via increased gene expression. However, improvements in insulin sensitivity were not associated and with increased plasma adiponectin levels (HMW and total) after moderate alcohol consumption in these women.
A strength of this study is its randomized crossover design. In addition, we assessed compliance to study treatment several times in different ways throughout the study and observed no significant deviations. Several limitations warrant consideration. A slightly lower body weight was observed after the juice intervention compared with the alcohol intervention. However, lower body weight is associated with improved insulin sensitivity and thus could have only affected the results towards no alcohol-induced improvement in insulin sensitivity. In the present study, only subcutaneous adipose tissue samples were used to determine ADIPOQ mRNA levels. Studies have demonstrated that ADIPOQ mRNA levels were higher (27;28) or not different (29) in subcutaneous compared with visceral adipose tissue in lean and obese subjects. Furthermore, studies in human adipose tissue showed increased (30) as well as indifferent (31) ADIPOQ mRNA and in vitro protein secretion levels of adiponectin from subcutaneous compared with omental adipocytes. Subcutaneous adipose tissue thus, appears to be at least of equal importance as omental adipose tissue for circulating plasma adiponectin levels.
The observed changes in insulin sensitivity after prolonged moderate alcohol intake are in accordance with a study by Davies et al. (4) in which moderate alcohol consumption in postmenopausal women for 8 weeks decreased fasting insulin and triglycerides levels, both independent risk factors for type 2 diabetes, and improved insulin sensitivity. However, other clinical trials did not find a change in fasting insulin levels (5) and triglyceride levels (32;33) nor in insulin sensitivity after moderate alcohol consumption
Alcohol, adiponectin and insulin sensitivity |
77
(6-12), whereas levels of total adiponectin (8;10;12) and HMW adiponectin (11) did increase. Differences in the designs used in these clinical trials are numerous. However, studies that did observe an effect on markers of insulin sensitivity after moderate alcohol consumption were all performed in middle-aged (4), relatively insulin resistant (8) or diabetic subjects (34;35). This suggests that the effect of moderate alcohol intake on insulin sensitivity is more pronounced in subjects with (slightly) impaired glucose tolerance rather then young and glucose tolerant subjects. Moreover, most interventions that did not observe a link between alcohol and insulin sensitivity lasted only 30 (7;9) or even fewer (8;10-12) days of consecutive alcohol consumption, while this study and of Davies et al. (4) and Shai et al. (34) comprised of 6, 8 and 12 weeks respectively. This indicates that a longer duration of alcohol consumption may be needed to exert an effect on insulin sensitivity. Finally, the relation between moderate alcohol intake and insulin sensitivity might be influenced by gender since the association between alcohol consumption and type 2 diabetes appears to be stronger in women then men as observed in some observational studies (2). This gender difference may partly be explained by changes associated with menopause which may mediate the relation between alcohol and triglyceride levels, the latter being an independent risk factor for type 2 diabetes (36). Compared with postmenopausal non-drinkers, postmenopausal drinkers have lower triglyceride levels whereas male drinkers have higher triglyceride levels compared with male abstainers (37).
Intervention-associated changes in ADIPOQ mRNA levels in subcutaneous adipose tissue correlated with changes in plasma protein levels of total adiponectin. In line with are cross sectional studies (38;39) showing associations between subcutaneous ADIPOQ mRNA levels with plasma levels of adiponectin. This finding suggests that the alcohol-induced increase in plasma adiponectin levels is mediated by de novo synthesis rather than decreased renal function (40) or post-transcriptional regulation (41). Changes in plasma HMW adiponectin did not correlate with changes in ADIPOQ mRNA levels. However, multimer oligomer formation of HMW adiponectin is influenced by several post-translational modifications (42) which can account for the absence of such a correlation.
Adiponectin synthesis is under control of the transcription factor PPARγ (20). PPARγ ligands induce expression of the adiponectin gene via direct binding of the PPARγ / retinoid X receptor heterodimer to the PPAR-responsive element in the human ADIPOQ promoter. We indeed observed a trend for increased PPARG mRNA levels after the alcohol intervention. However, our sample size of 36 participants was anticipated to detect a 20% change in mRNA levels. As the intervention gave rise to only a 9% change in PPARG mRNA, our study was underpowered to detect a significant difference in. Besides this trend for increased PPARG mRNA levels we also found a strong correlation between intervention-associated changes in PPARG and ADIPOQ mRNA levels. Furthermore, previous research has shown that PAI-1 expression, and PAI-1 protein levels increases after alcohol consumption (21). PAI-1 expression is also regulated by PPARγ (22). It thus seems plausible that moderate alcohol use might alter adiponectin gene expression and consequently adiponectin protein levels, also in a PPARγ-mediated manner.

| Chapter 4
78
Consistent with previous findings in young and middle-aged men (8;10), we now report that also in postmenopausal women total adiponectin plasma levels increase after moderate alcohol consumption. Moreover, we found that also the high-molecular weight form of plasma adiponectin increased after six weeks of alcohol consumption. The increase in HMW adiponectin after moderate alcohol consumption is in line with a previous study in which a trend was observed (11). In the current study, however, we used a more sensitive and precise methodology to quantify HMW adiponectin, ELISA instead of quantitative Western blotting.
The observed changes in insulin sensitivity as measured by HOMA-IR did not correlate with the alcohol-induced changes in total or with HMW adiponectin, of which the latter is proposed to be a better predictor of insulin sensitivity (43). These findings are consistent with other lifestyle interventions like weight loss (44) and exercise interventions (45) and with previous observations of our group (11;12) which showed increased adiponectin plasma levels without changes in insulin sensitivity. In this study we do find an alcohol-effect on insulin sensitivity irrespective of changes in adiponectin levels. The present results may suggest a possible independent effect of alcohol on insulin sensitivity in addition to an adiponectin-mediated effect on insulin sensitivity.
Looking cross sectional at our data, we did observe correlations between HOMA-IR and adiponectin levels after both alcohol and placebo treatment (data not shown). This is in line with published literature in which consistently associations between adiponectin and insulin sensitivity have been shown (14-17). Possibly, increased adiponectin levels partly explain the improved insulin sensitivity seen among moderate alcohol consumers (18;19). Studies have revealed that circulating adiponectin levels are inversely associated with markers of inflammation (39;46;47) whereas a low-grade inflammation is thought to contribute to insulin resistance (48). Therefore, adiponectin may lead to improved insulin sensitivity through effects on inflammatory markers.
In conclusion, the results of the present study demonstrate that six weeks of moderate alcohol consumption improves insulin sensitivity, and lipid profile in postmenopausal women. Furthermore, moderate alcohol consumption increases subcutaneous adipose ADIPOQ mRNA levels and plasma levels of adiponectin. This suggests that the alcohol-induced increase in adiponectin is attributable at least in part to transcriptional alterations in adipose tissue. The observed improvement in insulin sensitivity, lipid profile and adiponectin levels when consuming 2.5 standard drinks per day may reduce the risk of type 2 diabetes and cardiovascular disease in postmenopausal women. Despite these potentially beneficial findings, scientific literature indicates that alcohol drinking may also have detrimental health effects (49). Both potential benefits and risks should be taken into consideration when counseling on consumption.
Alcohol, adiponectin and insulin sensitivity |
79
Duality of interest The authors declare that there is no duality of interest associated with this manuscript. Acknowledgements We thank all those involved in the conduct of the study for their efforts. This research described in this article was partly funded by the Dutch Foundation for Alcohol Research (SAR).

| Chapter 4
80
References 1. Beulens JW, Stolk RP, Van der Schouw YT, Grobbee DE, Hendriks HF, Bots ML. Alcohol
consumption and risk of type 2 diabetes among older women. Diabetes Care 2005;28:2933-8.
2. Koppes LL, Dekker JM, Hendriks HF, Bouter LM, Heine RJ. Moderate alcohol consumption lowers the risk of type 2 diabetes: a meta-analysis of prospective observational studies. Diabetes Care 2005;28:719-25.
3. Hendriks HF. Moderate alcohol consumption and insulin sensitivity: observations and possible mechanisms. Ann Epidemiol 2007;17:S40-S42.
4. Davies MJ, Baer DJ, Judd JT, Brown ED, Campbell WS, Taylor PR. Effects of moderate alcohol intake on fasting insulin and glucose concentrations and insulin sensitivity in postmenopausal women: a randomized controlled trial. JAMA 2002;287:2559-62.
5. Cordain L, Bryan ED, Melby CL, Smith MJ. Influence of moderate daily wine consumption on body weight regulation and metabolism in healthy free-living males. J Am Coll Nutr 1997;16:134-9.
6. Cordain L, Melby CL, Hamamoto AE et al. Influence of moderate chronic wine consumption on insulin sensitivity and other correlates of syndrome X in moderately obese women. Metabolism 2000;49:1473-8.
7. Zilkens RR, Burke V, Watts G, Beilin LJ, Puddey IB. The Effect of Alcohol Intake on Insulin Sensitivity in Men: A randomized controlled trial. Diabetes Care 2003;26:608-12.
8. Sierksma A, Patel H, Ouchi N et al. Effect of moderate alcohol consumption on adiponectin, tumor necrosis factor-α, and insulin sensitivity. Diabetes Care 2004;27:184-9.
9. Gonzalez-Ortiz M, Pascoe-Gonzalez S, Kam-Ramos AM, Martinez-Abundis E. Effect of tequila on homocysteine, insulin secretion, insulin sensitivity, and metabolic profile in healthy men. Journal of Diabetes and its Complications 2005;19:155-9.
10. Beulens JW, van Beers RM, Stolk RP, Schaafsma G, Hendriks HF. The effect of moderate alcohol consumption on fat distribution and adipocytokines. Obesity (Silver Spring) 2006;14:60-6.
11. Beulens JW, van Loon LJ, Kok FJ et al. The effect of moderate alcohol consumption on adiponectin oligomers and muscle oxidative capacity: a human intervention study. Diabetologia 2007;50:1388-92.
12. Beulens JW, de Zoete EC, Kok FJ, Schaafsma G, Hendriks HF. Effect of moderate alcohol consumption on adipokines and insulin sensitivity in lean and overweight men: a diet intervention study. Eur J Clin Nutr 2008;62:1098-105.
13. Chandran M, Phillips SA, Ciaraldi T, Henry RR. Adiponectin: more than just another fat cell hormone? Diabetes Care 2003;26:2442-50.
14. Tschritter O, Fritsche A, Thamer C et al. Plasma Adiponectin Concentrations Predict Insulin Sensitivity of Both Glucose and Lipid Metabolism. Diabetes 2003;52:239-43.

Alcohol, adiponectin and insulin sensitivity |
81
15. Snijder MB, Heine RJ, Seidell JC et al. Associations of Adiponectin Levels With Incident Impaired Glucose Metabolism and Type 2 Diabetes in Older Men and Women: The Hoorn Study. Diabetes Care 2006;29:2498-503.
16. Snehalatha C, Mukesh B, Simon M, Viswanathan V, Haffner SM, Ramachandran A. Plasma Adiponectin Is an Independent Predictor of Type 2 Diabetes in Asian Indians. Diabetes Care 2003;26:3226-9.
17. Duncan BB, Schmidt MI, Pankow JS et al. Adiponectin and the Development of Type 2 Diabetes: The Atherosclerosis Risk in Communities Study. Diabetes 2004;53:2473-8.
18. Thamer C, Haap M, Fritsche A, Haering H, Stumvoll M. Relationship Between Moderate Alcohol Consumption and Adiponectin and Insulin Sensitivity in a Large Heterogeneous Population. Diabetes Care 2004;27:1240.
19. Englund Ogge L, Brohall G, Behre CJ, Schmidt C, Fagerberg B. Alcohol Consumption in Relation to Metabolic Regulation, Inflammation, and Adiponectin in 64-Year-Old Caucasian Women: A population-based study with a focus on impaired glucose regulation. Diabetes Care 2006;29:908-13.
20. Iwaki M, Matsuda M, Maeda N et al. Induction of Adiponectin, a Fat-Derived Antidiabetic and Antiatherogenic Factor, by Nuclear Receptors. Diabetes 2003;52:1655-63.
21. Booyse FM, Aikens ML, Grenett HE. Endothelial cell fibrinolysis: transcriptional regulation of fibrinolytic protein gene expression (t-PA, u-PA, and PAI-1) by low alcohol. Alcohol Clin Exp Res 1999;23:1119-24.
22. Marx N, Bourcier T, Sukhova GK, Libby P, Plutzky J. PPARgamma activation in human endothelial cells increases plasminogen activator inhibitor type-1 expression: PPARgamma as a potential mediator in vascular disease. Arterioscler Thromb Vasc Biol 1999;19:546-51.
23. Hoiseth G, Bernard JP, Stephanson N et al. Comparison between the urinary alcohol markers EtG, EtS, and GTOL/5-HIAA in a controlled drinking experiment. Alcohol Alcohol 2008;43:187-91.
24. Bottcher M, Beck O, Helander A. Evaluation of a new immunoassay for urinary ethyl glucuronide testing. Alcohol Alcohol 2008;43:46-8.
25. Joosen AM, Bakker AH, Zorenc AH, Kersten S, Schrauwen P, Westerterp KR. PPARgamma activity in subcutaneous abdominal fat tissue and fat mass gain during short-term overfeeding. Int J Obes (Lond) 2006;30:302-7.
26. Arvidsson E, Viguerie N, Andersson I, Verdich C, Langin D, Arner P. Effects of Different Hypocaloric Diets on Protein Secretion From Adipose Tissue of Obese Women. Diabetes 2004;53:1966-71.
27. Hernandez-Morante JJ, Milagro F, Gabaldon JA, Martinez JA, Zamora S, Garaulet M. Effect of DHEA-sulfate on adiponectin gene expression in adipose tissue from different fat depots in morbidly obese humans. Eur J Endocrinol 2006;155:593-600.
| Chapter 4
82
28. Lihn AS, Bruun JM, He G, Pedersen SB, Jensen PF, Richelsen B. Lower expression of adiponectin mRNA in visceral adipose tissue in lean and obese subjects. Molecular and Cellular Endocrinology 2004;219:9-15.
29. Yang WS, Chen MH, Lee WJ et al. Adiponectin mRNA levels in the abdominal adipose depots of nondiabetic women. Int J Obes Relat Metab Disord 2003;27:896-900.
30. Fisher FM, McTernan PG, Valsamakis G et al. Differences in adiponectin protein expression: effect of fat depots and type 2 diabetic status. Horm Metab Res 2002;34:650-4.
31. Motoshima H, Wu X, Sinha MK et al. Differential Regulation of Adiponectin Secretion from Cultured Human Omental and Subcutaneous Adipocytes: Effects of Insulin and Rosiglitazone. J Clin Endocrinol Metab 2002;87:5662-7.
32. Rumpler WV, Clevidence BA, Muesing RA, Rhodes DG. Changes in Women's Plasma Lipid and Lipoprotein Concentrations Due to Moderate Consumption of Alcohol Are Affected by Dietary Fat Level. J Nutr 1999;129:1713-7.
33. Sierksma A, Vermunt SH, Lankhuizen IM et al. Effect of moderate alcohol consumption on parameters of reverse cholesterol transport in postmenopausal women. Alcohol Clin Exp Res 2004;28:662-6.
34. Shai I, Wainstein J, Harman-Boehm I et al. Glycemic effects of moderate alcohol intake among patients with type 2 diabetes: a multicenter, randomized, clinical intervention trial. Diabetes Care 2007;30:3011-6.
35. Bantle AE, Thomas W, Bantle JP. Metabolic effects of alcohol in the form of wine in persons with type 2 diabetes mellitus. Metabolism 2008;57:241-5.
36. DeFronzo RA, Ferrannini E. Insulin resistance. A multifaceted syndrome responsible for NIDDM, obesity, hypertension, dyslipidemia, and atherosclerotic cardiovascular disease. Diabetes Care 1991;14:173-94.
37. Ebrahim S, Lawlor DA, Shlomo YB et al. Alcohol dehydrogenase type 1C (ADH1C) variants, alcohol consumption traits, HDL-cholesterol and risk of coronary heart disease in women and men: British Women's Heart and Health Study and Caerphilly cohorts. Atherosclerosis 2008;196:871-8.
38. Kern PA, Di Gregorio GB, Lu T, Rassouli N, Ranganathan G. Adiponectin Expression From Human Adipose Tissue: Relation to Obesity, Insulin Resistance, and Tumor Necrosis Factor-{alpha} Expression. Diabetes 2003;52:1779-85.
39. Engeli S, Feldpausch M, Gorzelniak K et al. Association Between Adiponectin and Mediators of Inflammation in Obese Women. Diabetes 2003;52:942-7.
40. Guebre-Egziabher F, Drai J, Fouque D. Adiponectin and chronic kidney disease. J Ren Nutr 2007;17:9-12.
41. Rasouli N, Yao-Borengasser A, Miles LM, Elbein SC, Kern PA. Increased plasma adiponectin in response to pioglitazone does not result from increased gene expression. Am J Physiol Endocrinol Metab 2006;290:E42-E46.
Alcohol, adiponectin and insulin sensitivity |
83
42. Wang Y, Lam KS, Yau MH, Xu A. Post-translational modifications of adiponectin: mechanisms and functional implications. Biochem J 2008;409:623-33.
43. Hara K, Horikoshi M, Yamauchi T et al. Measurement of the High-Molecular Weight Form of Adiponectin in Plasma Is Useful for the Prediction of Insulin Resistance and Metabolic Syndrome. Diabetes Care 2006;29:1357-62.
44. Bobbert T, Rochlitz H, Wegewitz U et al. Changes of adiponectin oligomer composition by moderate weight reduction. Diabetes 2005;54:2712-9.
45. Bluher M, Brennan AM, Kelesidis T et al. Total and High-Molecular Weight Adiponectin in Relation to Metabolic Variables at Baseline and in Response to an Exercise Treatment Program: Comparative evaluation of three assays. Diabetes Care 2007;30:280-5.
46. Ouchi N, Walsh K. Adiponectin as an anti-inflammatory factor. Clinica Chimica Acta 2007;380:24-30.
47. Hung J, McQuillan BM, Thompson PL, Beilby JP. Circulating adiponectin levels associate with inflammatory markers, insulin resistance and metabolic syndrome independent of obesity. Int J Obes (Lond) 2008;32:772-9.
48. Wellen KE, Hotamisligil GS. Inflammation, stress, and diabetes. J Clin Invest 2005;115:1111-9.
49. World Cancer Research Fund (WCRF)/ American Institute for Cancer Research (AICR). Food, nutrition and physical activity and the prevention of cancer: A global perspective. Washington D.C: 2007.


Chapter 5
Moderate alcohol consumption alters leukocyte gene expression profiles and proteins related to immune response and lipid metabolism in men
Michel M. Joosten Marjan J. van Erk
Linette Pellis Renger F. Witkamp Henk F.J. Hendriks
Submitted in revised form
| Chapter 5
86
Background: Moderate alcohol consumption has various acute and longer-term effects on low-grade inflammation which may accumulatively affect chronic disease risk. So far, no comprehensive, large-scale profiling has been performed to integrate the effects of longer-term moderate alcohol consumption. Objective: To describe the effects of moderate alcohol consumption on several circulating markers and whole-genome transcriptomics using large-scale profiling of proteins and gene expression activity in blood and in blood cells, respectively. Methods: In a randomized, open-label, crossover trial, 24 young (age: 21-33 y) normal-weight (BMI: 19-27 kg/m2) men consumed 100 mL vodka (30 g alcohol) with 200 mL orange juice or orange juice only (control) daily during dinner for four weeks. After each 4-week period, blood was sampled for measuring serum lipoproteins, plasma cytokines and whole blood gene expression. To determine gene expression profiles whole blood was collected in PAXgene tubes and extracted RNA was analyzed on Illumina BeadChips. Results: Four weeks of vodka increased HDL-cholesterol, associated lipoprotein levels and total adiponectin whereas interleukin (IL)-1 receptor antagonist and IL-18 plasma levels decreased (all P < 0.05) compared with control. Four weeks of vodka resulted in down-regulation of 345 genes and up-regulation of 455 genes in blood cells. Pathway analysis revealed effects of vodka consumption on the immune response with a down-regulated expression of the nuclear transcription factor kappa B (NF-κB) in blood cells. Furthermore, a network of expression changes related to lipid metabolism was observed with a central role for peroxisome proliferator-activated receptor alpha (PPARα). Conclusion: An integrated approach of large-scale profiling of proteins and genes showed that longer-term moderate alcohol consumption altered immune response and lipid metabolism. Trial registration: Clinicaltrials.gov ID no.: 00918918
Alcohol, immune response and lipid metabolism |
87
Introduction It is recognized that chronic, low-grade inflammation is an important hall mark in the development of both atherosclerosis and type 2 diabetes (1;2). Low-grade inflammatory changes have been shown to precede type 2 diabetes by many years (3;4). Moderate alcohol consumption has been consistently associated with a reduced risk of both cardiovascular diseases (5) and type 2 diabetes (6) compared with abstention possibly due to a lowered inflammatory status.
Alcohol consumption is known to modulate several immune functions and inflammatory processes (7). In observational studies moderate alcohol consumption is associated with lower levels of inflammatory markers (8) and lowered levels of C-reactive protein (CRP) (9-11). Data from randomized trials on inflammatory markers after prolonged moderate alcohol consumption are scarce but do suggest lower levels of certain cytokines (12) and CRP (13;14) although not consistently (15). Acute moderate alcohol consumption has been shown to suppress the production of pluripotent nuclear transcription factor kappa B (NF-κB) (16-18) in white blood cells. Activation of NF-κB, induced by a wide range of signals including lipopoly-saccharides and viruses, is a pivotal step in the induction of several inflammatory cytokines, chemokines and growth factors.
Besides their important role in inflammatory responses and the immune system, white blood cells are also the most readily available tissue for gene expression profiling. More importantly, their gene expression profiles have previously been shown to reflect dietary-induced changes in several short-term and longer-term intervention trials (19;20).
Recently, we have shown that the interpretation of a dietary intervention-induced changes can be strongly facilitated by the use of an integrative approach of comprehensive techniques such protein and gene profiling (21). Hence, we examined the effects of prolonged moderate alcohol consumption by means of an integrated approach of gene and protein profiling of blood. Methods Study Design The study used a randomized, open-label, crossover design, consisting of two 4-week periods. Subjects consumed two miniatures (50 mL each) of vodka (Smirnoff, U.K.) (30 g alcohol) with 200 mL orange juice (Appelsientje, the Netherlands) or only orange juice daily for four weeks during dinner. The study was conducted at TNO (a Dutch acronym for applied scientific research) Quality of Life, in Zeist, the Netherlands. The study was approved by an independent centralized ethics committee (METOPP; Tilburg, the Netherlands) and is registered at Clinicaltrials.gov, number NCT 00918918. Allocation to treatment order was randomized according to BMI and age. Blood sampling was done on the morning after four weeks of each treatment period, after an overnight fast. Compliance was monitored by weekly measurement of urinary ethyl glucuronide (EtG), a direct phase II metabolite of ethanol formed by action of UDP-glucuronosyl transferase. EtG has been
| Chapter 5
88
reported to be a superior marker with 100% sensitivity as a biomarker of recent drinking. It persists in the urine up to ~75 - 85 h after last intake (22). Cut-off limit to assess compliance during juice intervention for urinary EtG values was set at >0.25 mg/mL (positive sample), to obtain a high sensitivity but avoid positive results due to unintentional ethanol exposure. Cut-off limit during vodka intervention was set at EtG values <0.5 mg/mL (2.2 μmol/L) (negative sample). Additional measures of compliance were the increase of HDL-cholesterol and the return of empty bottles of vodka. Subjects We recruited 24 apparently healthy, non smoking male subjects between 21 and 40 years. Subjects were eligible if they consumed between 5 and 28 units of alcohol per week, were free of any medication at the beginning of the study, and had a BMI between 18 and 27 kg/m2 and had no family history of alcoholism. Subjects gave written informed consent and received a compensation for their participation. They were instructed to maintain their habitual body weight, food pattern and physical activity pattern and were told to refrain from any alcoholic products during the entire study except the vodka supplied by TNO. Blood and urine handling and analysis Blood samples were obtained from the anticubital vein of the forearm and collected in tubes containing clot activator for serum and in ice-chilled tubes containing or Potassium Ethylene Diamine Tetra Acid (K3EDTA) for plasma (Vacutainer Systems, Becton Dickinson, Plymouth, U.K.). Blood was centrifuged for 15 minutes at 2.000 g at 4°C, within 15 - 30 minutes after collection and stored at -<70°C. Serum clinical chemistry tests included the measurement of γ-glutamyltransferase, alanine aminotransferase, aspartate aminotransferase, alkaline phosphatase, glucose, insulin, triglycerides, free fatty acids total cholesterol, HDL-cholesterol, LDL-cholesterol, and phospholipids were analyzed with enzymatic techniques (Boehringer-Mannheim, Mannheim, Germany) on an Olympus AU400 clinical chemistry analyzer (Olympus-Diagnostica Europe, Hamburg, Germany). Six serum apolipoproteins (apolipoproteins A-I, A-II, B, C-I, C-III and E) and 47 plasma proteins (Human InflammationMAP™ 1.0; http://www.rulesbasedmedicine.com/products-services/Human-InflammationMAP.asp) were analyzed by bead-based multiplexed immunoassay at the biomarker testing laboratory Rules Based Medicine (RBM; Austin, Texas, U.S.A.). Total adiponectin was measured using MesoScale Diagnostics assays (Cat# K151IYC-1) (Meso Scale Discovery; Gaithersburg, MD, U.S.A.). For gene expression analysis 2.5 mL blood was collected in PAXgene tubes (BD, Erembodegem, Belgium) and stored according to the manufacturer’s instructions. EtG was determined in morning urine samples as previously described (23). RNA extraction and handling

Alcohol, immune response and lipid metabolism |
89
RNA was isolated using PAXgene Blood RNA Kit (Qiagen, Venlo, the Netherlands) according to manufacturer’s instructions. The Quality control, RNA labeling, hybridization and data extraction were performed at ServiceXS (Leiden, the Netherlands). RNA concentration was measured using a Nanodrop ND-1000 spectrophotometer (Nanodrop Technologies, Wilmington, DE, U.S.A.). The RNA quality and integrity was determined using Lab-on-Chip analysis on an Agilent 2100 Bioanalyzer (Agilent Technologies, Inc., Santa Clara, CA, U.S.A.). Average RNA yield of the samples was 10.3 μg (range 1.9 - 28 μg) and the average RNA Integrity Number (RIN) score was 8.9 (range 6.8 - 9.6). The labeling reaction included a globin reduction step. Four different peptide nucleic acids (PNAs) were used to block the 3’ends of globin transcripts. Due to the addition of the globin PNA sequences to the labeling reaction, the labeling of globin transcripts is hampered in favor of the other transcripts, which are typically underrepresented in blood cells. As a consequence, the signal strength of non-globin genes is much higher after globin reduction. Biotinylated cRNA was prepared using the Illumina TotalPrep RNA Amplification Kit (Ambion, Inc., Austin, TX, U.S.A.) according to the manufacturer’s specifications starting with 500 ng total RNA. Per sample, 750 ng of cRNA was used to hybridise to the Sentrix HumanHT-12 v3 Expression BeadChips (Illumina, Inc., San Diego, CA, U.S.A.). Each BeadChip contains twelve arrays. Hybridization and washing were performed according to the Illumina standard assay procedure. Scanning was performed on the Illumina iScanner (Illumina, Inc., San Diego, CA, U.S.A.). Image analysis and extraction of raw expression data was performed with Illumina Genomestudio 2010 Gene Expression software with background subtraction and no normalization. Probe level data were submitted to quantile normalization in GeneSpring GX 11.0 (Agilent Technologies, Santa Clara, CA, U.S.A.) and probes were filtered on detection P value (>0.99 in at least one sample). This resulted in normalized data for 19,378 probes. Statistical analysis Serum and plasma variables at the end of the intervention were compared between treatments with a mixed analysis of variance model that included terms for treatment, period and the interaction between period and treatment (indicating possible carryover effects). The so-called 80% rule was applied to the multiplex inflammatory protein dataset to retain only those plasma analytes for which ≥80% of the values were above the detection limit for ≥1 of the 2 treatment groups (24), resulting in retention of 29 of the 47 antigens measured in plasma. Values below the detection limit that remained in the truncated data set were replaced by a value of half of the detection limit. Values for remaining samples that were not measurable on the standard curve for a specific protein were set at 0.1 times the detection limit for that protein. Statistical analyses were performed using the SAS statistical software package (SAS version 8.2 and 9, SAS Institute, Cary, NC, U.S.A.). Statistical significance was defined as P < 0.05. For gene expression data, an additional threshold was applied to select genes that were up-regulated (>0%) in ≥15 subjects or down-regulated (<0%) in ≥15 subjects (Figure 5.1). The cut-off of 15 subjects was based on

| Chapter 5
90
the average number of subjects that showed intervention-induced alterations in significantly changed circulating markers. These remaining genes were used for biological interpretation and network construction.
Figure 5.1: Flow chart of probe selection and number of probes and specific genes changed between the two interventions in the microarray analysis. Biological interpretation Functional analysis of the gene expression data was performed by using Ingenuity Pathway Analysis version 8.7 (Ingenuity Systems Inc, Redwood City, CA, U.S.A.), identifying significantly enriched pathways and gene lists (P < 0.05). Networks were built in MetaCore version 6.1 (GeneGo,St Joseph, MI, U.S.A.), using direct interactions or shortest path algorithm (max 2 steps and with filter for human data). Results Subjects and compliance All 24 men enrolled completed the study without any serious adverse events. Mean (± SEM) age and BMI of the men were 25.5 ± 3.3 y and 23.5 ± 2.5 kg/m2. Weekly urinary EtG levels were assessed to check individual compliance to treatments. This revealed eight positive urine samples during the orange juice-drinking period, although all ≤0.5 mg/mL, and seven negative samples during the vodka orange juice-drinking period out of the 192 samples analyzed (overall compliance of 92%). Another indicator for compliance was the 8.8% increase in HDL-cholesterol after vodka and juice compared with juice consumption (Table 5.1).
Expressed: 19,378 probes
Changed (P < 0.05): 1,070 probes
Down-regulated in ≥15 subjects: 382 probes (345 unique Entrez gene IDs)
Up-regulated in ≥15 subjects: 496 probes (455 unique Entrez gene IDs)
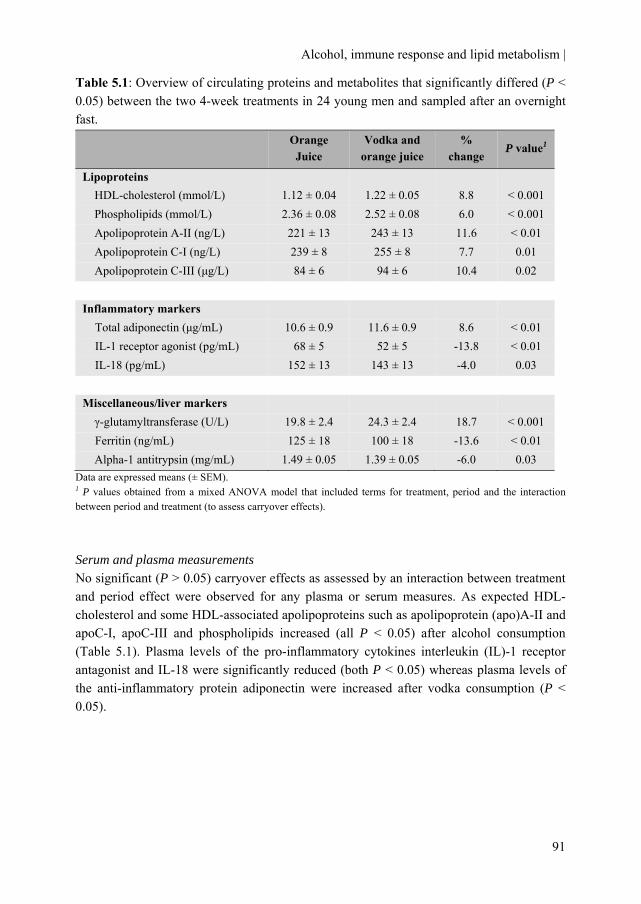
Alcohol, immune response and lipid metabolism |
91
Table 5.1: Overview of circulating proteins and metabolites that significantly differed (P < 0.05) between the two 4-week treatments in 24 young men and sampled after an overnight fast.
Data are expressed means (± SEM). 1 P values obtained from a mixed ANOVA model that included terms for treatment, period and the interaction between period and treatment (to assess carryover effects). Serum and plasma measurements No significant (P > 0.05) carryover effects as assessed by an interaction between treatment and period effect were observed for any plasma or serum measures. As expected HDL-cholesterol and some HDL-associated apolipoproteins such as apolipoprotein (apo)A-II and apoC-I, apoC-III and phospholipids increased (all P < 0.05) after alcohol consumption (Table 5.1). Plasma levels of the pro-inflammatory cytokines interleukin (IL)-1 receptor antagonist and IL-18 were significantly reduced (both P < 0.05) whereas plasma levels of the anti-inflammatory protein adiponectin were increased after vodka consumption (P < 0.05).
Orange Juice
Vodka and orange juice
% change
P value1
Lipoproteins HDL-cholesterol (mmol/L) 1.12 ± 0.04 1.22 ± 0.05 8.8 < 0.001 Phospholipids (mmol/L) 2.36 ± 0.08 2.52 ± 0.08 6.0 < 0.001 Apolipoprotein A-II (ng/L) 221 ± 13 243 ± 13 11.6 < 0.01 Apolipoprotein C-I (ng/L) 239 ± 8 255 ± 8 7.7 0.01 Apolipoprotein C-III (μg/L) 84 ± 6 94 ± 6 10.4 0.02
Inflammatory markers Total adiponectin (μg/mL) 10.6 ± 0.9 11.6 ± 0.9 8.6 < 0.01 IL-1 receptor agonist (pg/mL) 68 ± 5 52 ± 5 -13.8 < 0.01 IL-18 (pg/mL) 152 ± 13 143 ± 13 -4.0 0.03
Miscellaneous/liver markers γ-glutamyltransferase (U/L) 19.8 ± 2.4 24.3 ± 2.4 18.7 < 0.001 Ferritin (ng/mL) 125 ± 18 100 ± 18 -13.6 < 0.01 Alpha-1 antitrypsin (mg/mL) 1.49 ± 0.05 1.39 ± 0.05 -6.0 0.03

| Chapter 5
92
Table 5.2: Overview of differentially expressed pathways and number of genes changed based on Ingenuity Pathway Analysis, ranked on most significantly changed pathway in functional group.
Functional group Pathways / lists P value # changed Signaling Glucocorticoid receptor signaling 0.0017 22 Acute myeloid leukemia signaling 0.0047 9 Estrogen receptor signaling 0.0151 10 Chronic myeloid leukemia signaling 0.0158 9 PI3K/AKT signaling 0.0204 10 Neuregulin signaling 0.0288 8 BMP signaling pathway 0.0324 7 GNRH signaling 0.0347 10 G Beta gamma signaling 0.0372 8 Androgen signaling 0.0417 9 Immune response Antigen presentation pathway 0.0028 7
Crosstalk between dendritic cells and natural killer cells
0.0044 10
Leukocyte extravasation signaling 0.0095 14 Oncostatin M signaling 0.0135 5 PKCΘ¸ signaling in T lymphocytes 0.0151 10 GM-CSF signaling 0.0155 7 B Cell receptor signaling 0.0166 12 IL-15 signaling 0.0407 6 T Cell receptor signaling 0.0457 8
Role of NFAT in regulation of the immune response
0.0468 12
(Lipid) metabolism Mechanism of gene regulation by peroxisome proliferators via PPARα
0.0065 10
Citrate cycle 0.0069 5 PPARα/RXR activation 0.0257 12 Other Role of NFAT in cardiac hypertrophy 0.0178 14 Selenoamino acid metabolism 0.0214 5 Apoptosis Apoptosis signaling 0.0224 8 Pro-apoptosis 0.0316 5 TNF-R1 signaling 0.0479 5
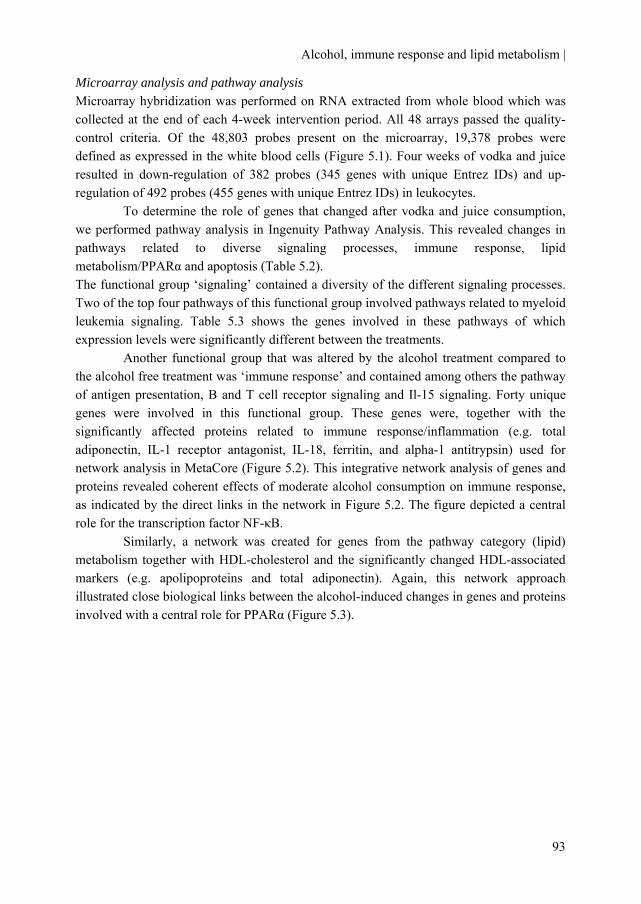
Alcohol, immune response and lipid metabolism |
93
Microarray analysis and pathway analysis Microarray hybridization was performed on RNA extracted from whole blood which was collected at the end of each 4-week intervention period. All 48 arrays passed the quality-control criteria. Of the 48,803 probes present on the microarray, 19,378 probes were defined as expressed in the white blood cells (Figure 5.1). Four weeks of vodka and juice resulted in down-regulation of 382 probes (345 genes with unique Entrez IDs) and up-regulation of 492 probes (455 genes with unique Entrez IDs) in leukocytes.
To determine the role of genes that changed after vodka and juice consumption, we performed pathway analysis in Ingenuity Pathway Analysis. This revealed changes in pathways related to diverse signaling processes, immune response, lipid metabolism/PPARα and apoptosis (Table 5.2). The functional group ‘signaling’ contained a diversity of the different signaling processes. Two of the top four pathways of this functional group involved pathways related to myeloid leukemia signaling. Table 5.3 shows the genes involved in these pathways of which expression levels were significantly different between the treatments.
Another functional group that was altered by the alcohol treatment compared to the alcohol free treatment was ‘immune response’ and contained among others the pathway of antigen presentation, B and T cell receptor signaling and Il-15 signaling. Forty unique genes were involved in this functional group. These genes were, together with the significantly affected proteins related to immune response/inflammation (e.g. total adiponectin, IL-1 receptor antagonist, IL-18, ferritin, and alpha-1 antitrypsin) used for network analysis in MetaCore (Figure 5.2). This integrative network analysis of genes and proteins revealed coherent effects of moderate alcohol consumption on immune response, as indicated by the direct links in the network in Figure 5.2. The figure depicted a central role for the transcription factor NF-κB.
Similarly, a network was created for genes from the pathway category (lipid) metabolism together with HDL-cholesterol and the significantly changed HDL-associated markers (e.g. apolipoproteins and total adiponectin). Again, this network approach illustrated close biological links between the alcohol-induced changes in genes and proteins involved with a central role for PPARα (Figure 5.3).
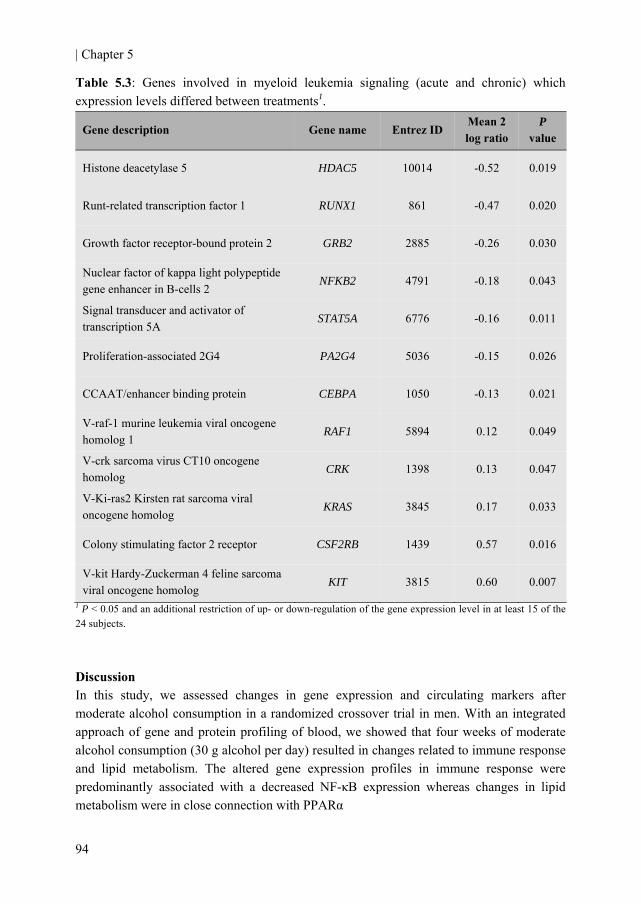
| Chapter 5
94
Table 5.3: Genes involved in myeloid leukemia signaling (acute and chronic) which expression levels differed between treatments1.
1 P < 0.05 and an additional restriction of up- or down-regulation of the gene expression level in at least 15 of the 24 subjects. Discussion In this study, we assessed changes in gene expression and circulating markers after moderate alcohol consumption in a randomized crossover trial in men. With an integrated approach of gene and protein profiling of blood, we showed that four weeks of moderate alcohol consumption (30 g alcohol per day) resulted in changes related to immune response and lipid metabolism. The altered gene expression profiles in immune response were predominantly associated with a decreased NF-κB expression whereas changes in lipid metabolism were in close connection with PPARα
Gene description Gene name Entrez ID Mean 2 log ratio
P value
Histone deacetylase 5 HDAC5 10014 -0.52 0.019
Runt-related transcription factor 1 RUNX1 861 -0.47 0.020
Growth factor receptor-bound protein 2 GRB2 2885 -0.26 0.030
Nuclear factor of kappa light polypeptide gene enhancer in B-cells 2
NFKB2 4791 -0.18 0.043
Signal transducer and activator of transcription 5A
STAT5A 6776 -0.16 0.011
Proliferation-associated 2G4 PA2G4 5036 -0.15 0.026
CCAAT/enhancer binding protein CEBPA 1050 -0.13 0.021
V-raf-1 murine leukemia viral oncogene homolog 1
RAF1 5894 0.12 0.049
V-crk sarcoma virus CT10 oncogene homolog
CRK 1398 0.13 0.047
V-Ki-ras2 Kirsten rat sarcoma viral oncogene homolog
KRAS 3845 0.17 0.033
Colony stimulating factor 2 receptor CSF2RB 1439 0.57 0.016
V-kit Hardy-Zuckerman 4 feline sarcoma viral oncogene homolog
KIT 3815 0.60 0.007
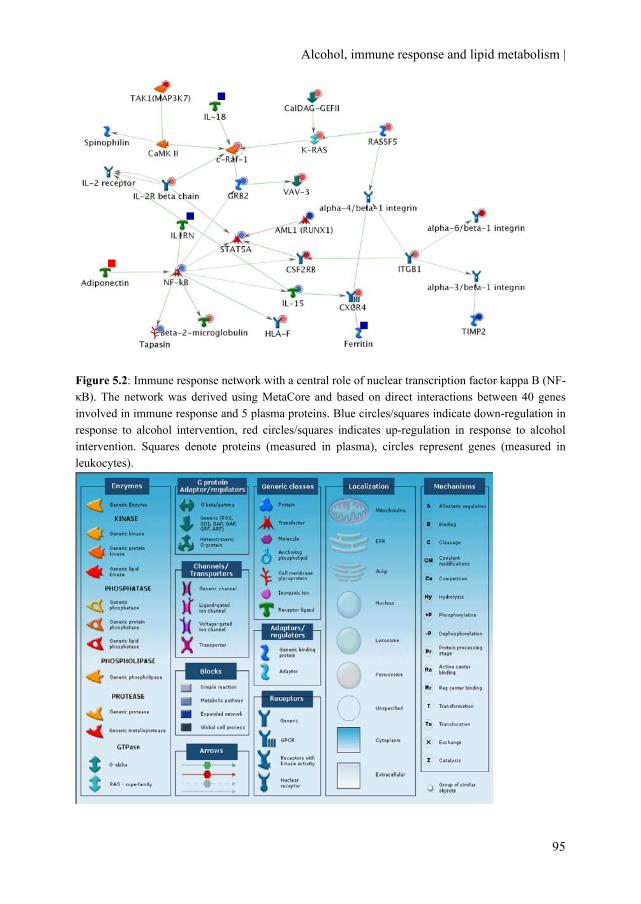
Alcohol, immune response and lipid metabolism |
95
Figure 5.2: Immune response network with a central role of nuclear transcription factor kappa B (NF-κB). The network was derived using MetaCore and based on direct interactions between 40 genes involved in immune response and 5 plasma proteins. Blue circles/squares indicate down-regulation in response to alcohol intervention, red circles/squares indicates up-regulation in response to alcohol intervention. Squares denote proteins (measured in plasma), circles represent genes (measured in leukocytes).
| Chapter 5
96
We observed altered expression profiles in white blood cells related to acute and chronic myeloma and lymphoma signaling. Expression of the genes encoding for signal transducer and activator of transcription 5A (STAT5A) and runt-related transcription factor 1 (RUNX1) (a.k.a. AML1, acute myeloid leukemia 1) were down-regulated after moderate alcohol consumption compared with the abstention period. Activation of STAT5A has been shown to be essential for the tumorigenesis. The altered expression levels in pathways of myeloma and lymphoma signaling in our crossover study might provide mechanistic support for findings of several observational studies (25;26). In these large prospective cohort studies an inverse association between alcohol consumption and risk of non-Hodgkin lymphoma was reported.
Figure 5.3: Network around peroxisome proliferator-activated receptor alpha (PPARα). The network was derived using MetaCore and based on shortest path (max 2 steps) between 11 genes involved in PPAR regulated pathways or citrate cycle and 4 plasma proteins. Blue circles/squares indicate down-regulation in response to the alcohol intervention, red circles/squares indicate up-regulation in response to alcohol intervention. Squares denote proteins (measured in plasma), circles represent genes (measured in leukocytes).

Alcohol, immune response and lipid metabolism |
97
We observed a down-regulation of NF-κB after prolonged moderate vodka and juice consumption compared to juice only consumption. The various direct connections of NF-κB with other immune-related gene expression and protein levels underlined the pleiotropic regulator function of NF-κB in inflammatory responses. Our findings of prolonged alcohol consumption on NF-κB are in concord with observations after acute consumption in which is shown that acute alcohol prevents NF-κB activation which lead to an inhibition in pro-inflammatory cytokines such as TNF-α an IL-1ß at the protein as well as the mRNA level (18). We did observe lower IL-18 levels after moderate alcohol consumption, in line with a previous study among diabetic men (27).
We and others have previously reported increased circulating adiponectin concentrations after moderate alcohol consumption (28-30). Adiponectin was present in both the immune response and PPARα /lipid metabolism networks. This adds to the notion that adiponectin might be an important link between inflammation and lipid metabolism. Indeed several lines of evidence suggest an inverse association between adiponectin and markers of inflammation (31) and with favorable lipid profiles (32) in observational studies. Gene expression of ADIPOQ in these white blood cells did not change between treatments, despite the increased levels after moderate alcohol consumption. However, adiponectin is predominantly expressed in the adipose tissue. The alcohol-induced increase of the protein can largely be attributed to increased expression of the adiponectin gene in adipose tissue (23).
We found a substantial decrease in plasma ferritin concentrations after the vodka treatment compared with the control treatment. Ferritin is one of the key proteins regulating iron homeostasis. Growing evidence has shown that even moderately increased iron stores, represented by high-normal ferritin concentrations, are associated with insulin resistance (33) and type 2 diabetes. The results of our randomized trial are in contrast with observational research which shows a positive association with alcohol consumption and ferritin concentrations (34-36). If confirmed in other trials, decreased ferritin concentrations might be a new and relatively unexplored mechanism that may explain the lowered risk of type 2 diabetes associated with moderate consumption. Gene expression of ferritin in white blood cells did not change between treatments, probably because the protein is predominantly expressed in liver tissue.
The observations of increased HDL-cholesterol and apolipoproteins after alcohol consumption are consistent with previous findings in 132 healthy men (37). Previous studies by our group showed similar increases of HDL-cholesterol in young men (38) and middle-aged men (39;40) and women (41) after alcohol consumption.
Strong points of the study are its randomized crossover design, the high compliance to the treatments throughout the study and the integrated approach of both proteins and gene expression profiles. However, several limitations warrant consideration. First, we used a specific type of tissue, i.e. white blood cells, for gene profiling. Although these cells might not be representative for all tissues directly affected by alcohol consumption (e.g. liver and adipose tissue), these cells were chosen because of their

| Chapter 5
98
important roles in inflammatory responses and the immune system. Furthermore, their expression profiles have previously been shown to reflect metabolic changes due to short-term and longer term nutritional adaption in healthy humans (20;21). Second, whole blood was collected for RNA isolation. As globin RNA was removed from the samples the gene expression profiles can be assigned to the white blood cell population. Since the white blood cell population consists of a range of cell types present in the blood samples, it can not be completely excluded that changes in gene expression might reflect changes in white blood cell type distribution in blood. Third, we only measured specific proteins based on a priori expected changes (inflammatory markers and lipoproteins) which might have biased our results. However, the analysis of whole-genome expression data and subsequent pathway analyses were relatively unbiased, since all genes were measured and this analysis indicated the same processes being affected. Furthermore, the network analysis revealed integrated effects (shown by the direct connections in both immune response and lipid/lipoprotein metabolism network) which might represent a close biological connection between the changes in genes and proteins due to alcohol consumption.
In conclusion, a comprehensive and integrated approach of gene and protein profiling of blood showed that moderate alcohol consumption resulted in changes in immune response and lipid metabolism. Our integrated and large-scale profiling revealed potential new functional pathways and physiological mechanisms that may explain some of the health effects that moderate alcohol consumption exerts. Authors’ contributions MMJ provided partial funding, designed the study, analyzed and interpreted the data and wrote the manuscript. MJE and LP participated in data collection, analyzed and interpreted the data and helped in drafting the manuscript. RFW helped designing the study and critically reviewed the content for important intellectual content. HFJH provided funding, designed the study and critically reviewed the manuscript for important intellectual content. All authors read and approved the final manuscript. Acknowledgement This project is partially supported by the European Research Advisory Board (ERAB) grant no: EA 08 21 and by the Dutch Foundation for Alcohol Research (SAR). We gratefully acknowledge the volunteers for participation; I Klöpping, H Fick, D Rouwendaal, A Speulman, I van den Assum, J Jacobs, C Hoeflaken, J Jansen for practical work during the study; K Toet, W Vaes, M von Lipzig, L Bok and M Rondhuis for laboratory analyses; and E Dutman for data management.

Alcohol, immune response and lipid metabolism |
99
References 1. Pickup JC. Inflammation and activated innate immunity in the pathogenesis of type 2 diabetes.
Diabetes Care 2004;27:813-23.
2. Kolb H, Mandrup-Poulsen T. An immune origin of type 2 diabetes? Diabetologia 2005;48:1038-50.
3. Spranger J, Kroke A, Mohlig M et al. Inflammatory Cytokines and the Risk to Develop Type 2 Diabetes: Results of the Prospective Population-Based European Prospective Investigation into Cancer and Nutrition (EPIC)-Potsdam Study. Diabetes 2003;52:812-7.
4. Thorand B, Baumert J, Kolb H et al. Sex differences in the prediction of type 2 diabetes by inflammatory markers: results from the MONICA/KORA Augsburg case-cohort study, 1984-2002. Diabetes Care 2007;30:854-60.
5. Corrao G, Rubbiati L, Bagnardi V, Zambon A, Poikolainen K. Alcohol and coronary heart disease: a meta-analysis. Addiction 2000;95:1505-23.
6. Koppes LL, Dekker JM, Hendriks HF, Bouter LM, Heine RJ. Moderate alcohol consumption lowers the risk of type 2 diabetes: a meta-analysis of prospective observational studies. Diabetes Care 2005;28:719-25.
7. Romeo J, Warnberg J, Nova E, Diaz LE, Gomez-Martinez S, Marcos A. Moderate alcohol consumption and the immune system: a review. Br J Nutr 2007;98 Suppl 1:S111-S115.
8. Pai JK, Hankinson SE, Thadhani R, Rifai N, Pischon T, Rimm EB. Moderate alcohol consumption and lower levels of inflammatory markers in US men and women. Atherosclerosis 2006;186:113-20.
9. Albert MA, Glynn RJ, Ridker PM. Alcohol consumption and plasma concentration of C-reactive protein. Circulation 2003;107:443-7.
10. Imhof A, Froehlich M, Brenner H, Boeing H, Pepys MB, Koenig W. Effect of alcohol consumption on systemic markers of inflammation. Lancet 2001;357:763-7.
11. Imhof A, Woodward M, Doering A et al. Overall alcohol intake, beer, wine, and systemic markers of inflammation in western Europe: results from three MONICA samples (Augsburg, Glasgow, Lille). Eur Heart J 2004;25:2092-100.
12. Romeo J, Warnberg J, Nova E, Diaz LE, Gonzalez-Gross M, Marcos A. Changes in the immune system after moderate beer consumption. Ann Nutr Metab 2007;51:359-66.
13. Sierksma A, van der Gaag MS, Kluft C, Hendriks HF. Effect of moderate alcohol consumption on fibrinogen levels in healthy volunteers is discordant with effects on C-reactive protein. Ann N Y Acad Sci 2001;936:630-3.:630-3.
14. Vazquez-Agell M, Sacanella E, Tobias E et al. Inflammatory markers of atherosclerosis are decreased after moderate consumption of cava (sparkling wine) in men with low cardiovascular risk. J Nutr 2007;137:2279-84.
| Chapter 5
100
15. Beulens JW, van den BR, Kok FJ, Helander A, Vermunt SH, Hendriks HF. Moderate alcohol consumption and lipoprotein-associated phospholipase A2 activity. Nutr Metab Cardiovasc Dis 2008;18:539-44.
16. Mandrekar P, Catalano D, Szabo G. Inhibition of lipopolysaccharide-mediated NF-κB activation by ethanol in human monocytes. Int Immunol 1999;11:1781-90.
17. Mandrekar P, Dolganiuc A, Bellerose G et al. Acute alcohol inhibits the induction of nuclear regulatory factor κB activation through CD14/toll-like receptor 4, interleukin-1, and tumor necrosis factor receptors: a common mechanism independent of inhibitory κB alpha degradation? Alcohol Clin Exp Res 2002;26:1609-14.
18. Mandrekar P, Catalano D, White B, Szabo G. Moderate alcohol intake in humans attenuates monocyte inflammatory responses: inhibition of nuclear regulatory factor κB and induction of interleukin 10. Alcohol Clin Exp Res 2006;30:135-9.
19. van Erk MJ, Blom WA, van OB, Hendriks HF. High-protein and high-carbohydrate breakfasts differentially change the transcriptome of human blood cells. Am J Clin Nutr 2006;84:1233-41.
20. Bouwens M, van de Rest O, Dellschaft N et al. Fish-oil supplementation induces antiinflammatory gene expression profiles in human blood mononuclear cells. Am J Clin Nutr 2009;90:415-24.
21. Bakker GC, van Erk MJ, Pellis L et al. An antiinflammatory dietary mix modulates inflammation and oxidative and metabolic stress in overweight men: a nutrigenomics approach. Am J Clin Nutr 2010;91:1044-59.
22. Bottcher M, Beck O, Helander A. Evaluation of a new immunoassay for urinary ethyl glucuronide testing. Alcohol Alcohol 2008;43:46-8.
23. Joosten MM, Beulens JW, Kersten S, Hendriks HF. Moderate alcohol consumption increases insulin sensitivity and ADIPOQ expression in postmenopausal women: a randomised, crossover trial. Diabetologia 2008;51:1375-81.
24. Bijlsma S, Bobeldijk I, Verheij ER et al. Large-scale human metabolomics studies: a strategy for data (pre-) processing and validation. Anal Chem 2006;78:567-74.
25. Allen NE, Beral V, Casabonne D et al. Moderate alcohol intake and cancer incidence in women. J Natl Cancer Inst 2009;101:296-305.
26. Kanda J, Matsuo K, Inoue M et al. Association of alcohol intake with the risk of malignant lymphoma and plasma cell myeloma in Japanese: a population-based cohort study (Japan Public Health Center-based Prospective Study). Cancer Epidemiol Biomarkers Prev 2010;19:429-34.
27. Marfella R, Cacciapuoti F, Siniscalchi M et al. Effect of moderate red wine intake on cardiac prognosis after recent acute myocardial infarction of subjects with Type 2 diabetes mellitus. Diabet Med 2006;23:974-81.
28. Sierksma A, Patel H, Ouchi N et al. Effect of moderate alcohol consumption on adiponectin, tumor necrosis factor-α, and insulin sensitivity. Diabetes Care 2004;27:184-9.
Alcohol, immune response and lipid metabolism |
101
29. Beulens JW, van Loon LJ, Kok FJ et al. The effect of moderate alcohol consumption on adiponectin oligomers and muscle oxidative capacity: a human intervention study. Diabetologia 2007;50:1388-92.
30. Imhof A, Plamper I, Maier S, Trischler G, Koenig W. Effect of drinking on adiponectin in healthy men and women: a randomized intervention study of water, ethanol, red wine, and beer with or without alcohol. Diabetes Care 2009;32:1101-3.
31. Hung J, McQuillan BM, Thompson PL, Beilby JP. Circulating adiponectin levels associate with inflammatory markers, insulin resistance and metabolic syndrome independent of obesity. Int J Obes (Lond) 2008;32:772-9.
32. Kantartzis K, Rittig K, Balletshofer B et al. The relationships of plasma adiponectin with a favorable lipid profile, decreased inflammation, and less ectopic fat accumulation depend on adiposity. Clin Chem 2006;52:1934-42.
33. Wrede CE, Buettner R, Bollheimer LC, Scholmerich J, Palitzsch KD, Hellerbrand C. Association between serum ferritin and the insulin resistance syndrome in a representative population. Eur J Endocrinol 2006;154:333-40.
34. Whitfield JB, Zhu G, Heath AC, Powell And LW, Martin NG. Effects of alcohol consumption on indices of iron stores and of iron stores on alcohol intake markers. Alcohol Clin Exp Res 2001;25:1037-45.
35. Milman N, Kirchhoff M. Relationship between serum ferritin and risk factors for ischaemic heart disease in 2235 Danes aged 30-60 years. J Intern Med 1999;245:423-33.
36. Jiang R, Manson JE, Meigs JB, Ma J, Rifai N, Hu FB. Body Iron Stores in Relation to Risk of Type 2 Diabetes in Apparently Healthy Women. JAMA 2004;291:711-7.
37. Lecomte E, Herbeth B, Paille F, Steinmetz J, Artur Y, Siest G. Changes in serum apolipoprotein and lipoprotein profile induced by chronic alcohol consumption and withdrawal: determinant effect on heart disease? Clin Chem 1996;42:1666-75.
38. Beulens JWJ, van den Berg R, Kok FJ, Helander A, Vermunt SHF, Hendriks HFJ. Moderate alcohol consumption and lipoprotein-associated phospholipase A2 activity. Nutrition, Metabolism and Cardiovascular Diseases 2008;18:539-44.
39. van der Gaag MS, van Tol A, Scheek LM et al. Daily moderate alcohol consumption increases serum paraoxonase activity; a diet-controlled, randomised intervention study in middle-aged men. Atherosclerosis 1999;147:405-10.
40. Beulens JW, Sierksma A, van TA et al. Moderate alcohol consumption increases cholesterol efflux mediated by ABCA1. J Lipid Res 2004;45:1716-23.
41. Sierksma A, Vermunt SH, Lankhuizen IM et al. Effect of moderate alcohol consumption on parameters of reverse cholesterol transport in postmenopausal women. Alcohol Clin Exp Res 2004;28:662-6.

Chapter 6
Alterations in total and high-molecular weight adiponectin after three weeks of moderate alcohol
consumption in premenopausal women
Michel M. Joosten Renger F. Witkamp Henk F.J. Hendriks
Submitted in revised form
| Chapter 6
104
Background: Moderate alcohol consumption is associated with a reduced risk of type 2 diabetes. It also increases concentrations of adiponectin, a hormone inversely associated with type 2 diabetes risk. However, the rate at which this increase occurs is unclear. Objective: To examine the effect of moderate alcohol consumption on the weekly alterations in levels of both total and high-molecular weight (HMW) adiponectin and associated markers of glucose and lipid metabolism. Methods: In a randomized, open-label, crossover trial, 24 normal-weight, premenopausal women who were regular alcohol consumers, received 66 cL of beer (~26 g alcohol) or 66 cL of alcohol-free beer (<0.5 g alcohol) daily for 3 weeks preceded by a 1-week washout. Blood samples were collected weekly after an overnight fast for measurement of plasma total and HMW adiponectin and markers of glycemia and lipid metabolism. Results: There was a significant interaction (P < 0.05) between the two treatments over time for both plasma HWM and total adiponectin concentrations. Within three weeks, moderate alcohol consumption significantly increased plasma total (8.2%; P = 0.01) and HMW (8.2%; P = 0.02) adiponectin levels compared with abstention. Changes over time in total adiponectin were positively associated with changes in HMW adiponectin during the nonalcoholic beer (r = 0.80; 95% confidence interval (CI): 0.55, 0.92) and beer (r = 0.82; 95% CI: 0.58, 0.93) intervention. Alcohol consumption did not affect the ratio HMW to total adiponectin nor serum glucose, insulin, hemoglobin A1c or triglyceride levels compared with abstention during the 3-week intervention periods. Conclusions: Moderate alcohol consumption concomitantly increases plasma total and HMW adiponectin concentrations compared to abstention in premenopausal women. These effects were evident after at least three weeks of consumption. No changes were observed in other markers of insulin sensitivity. Trial registration: Clinicaltrials.gov ID no.: NCT00524550.
Alcohol and alterations in adiponectin |
105
Introduction Moderate alcohol consumption is associated with a reduced risk of type 2 diabetes (1;2). This association could – in addition to improved insulin sensitivity and favorable changes in triglycerides (3;4) – partially be explained by increased circulating adiponectin levels (5). Adiponectin is an adipose tissue-specific adipokine involved in glucose and lipid metabolism (6). It is positively associated with insulin sensitivity (7) and inversely with inflammatory markers (8). Moreover, higher adiponectin levels have been consistently associated with a lower risk of type 2 diabetes (9) and cardiovascular disease (10). In observational studies alcohol consumption has been positively associated with adiponectin concentrations (11-13), an effect confirmed in short-term randomized trials of alcohol administration (14-17).
Acute alcohol consumption, however, does not alter postprandial levels of adiponectin (18;19) suggesting a longer period of alcohol consumption is needed to increase adiponectin levels. Also, almost all of these short-term trials only included men whereas adiponectin levels differ between men and women (20) and lower levels are observed in premenopausal compared to postmenopausal women (21;22). Moreover, the majority of these trials investigated only total adiponectin levels, whereas the high-molecular weight (HMW) isomer of adiponectin has been proposed as the most active metabolic form (23-25).
Hence, this trial was designed to investigate the weekly alterations in levels of both HMW and total adiponectin and associated markers of glucose and lipid metabolism by changes in alcohol consumption over a 3-week period in a group of premenopausal women. Methods Study design The study used a randomized, open label, placebo-controlled, crossover design, consisting of two 3-week periods, each preceded by a one week washout. Subjects daily consumed two cans (66 cL) of beer (~26 g alcohol) or two cans of alcohol-free beer (Amstel, the Netherlands) for three weeks during dinner. The study was conducted at TNO (a Dutch acronym for applied scientific knowledge) Quality of Life (Zeist, the Netherlands). Subjects were instructed to maintain their habitual body weight, food and physical activity pattern and were told not to consume any additional alcohol during the entire study (including washout periods). Body weight was measured weekly wearing indoor clothing, without shoes, wallet and keys using a digital weight scale with a precision of 0.1 kg (SECA, model 701, Germany). Blood and urine sampling was done weekly for eight weeks after an overnight fast. Compliance was monitored by weekly measurement of ethyl glucuronide, a direct phase II metabolite of alcohol consumption in the urine and increase in serum HDL-cholesterol. Cut-off limit to assess compliance during alcohol free intervention for urinary ethyl glucuronide values was set at >0.25 mg/mL (positive sample), to obtain a high
| Chapter 6
106
sensitivity but avoid positive results due to unintentional ethanol exposure. Cut-off limit during the beer intervention was set at ethyl glucuronide values <0.5 mg/mL (2.2 μmol/L) (negative sample) (4). Study subjects Subjects were recruited from a pool of volunteers of TNO Quality of Life. Eligible premenopausal women consumed between 5 and 21 units of alcohol per week, were apparently healthy, between 20 to 40 years, used phase I or II oral contraceptives, had a BMI between 19 and 25 kg/m2, refrained from smoking and had no family history of alcoholism. They gave written informed consent and received compensation for their participation. The study was approved by an independent centralized ethics committee (METOPP, Tilburg, the Netherlands). This trial is registered at Clinicaltrials.gov, number NCT00524550. Handling and analysis of blood and urine samples Ethyl glucuronide samples in morning urine were sampled and treated as described previously (4). Blood samples were obtained weekly from the anticubital vein of the forearm and collected in tubes containing clot activator for serum and in ice-chilled tubes containing or potassium ethylene diamine tetra acid (K3EDTA) for plasma (Vacutainer Systems, Becton Dickinson, Plymouth, U.K.) and were centrifuged for 15 minutes at 2.000 g at 4°C, within 15 - 30 minutes after collection and stored at <-70°C. Biochemical determinations in blood were performed at TNO Quality of Life using Olympus analytical equipment and reagents except for adiponectin. Plasma total and HMW adiponectin concentrations were determined by an enzyme-linked immunosorbent assay (ELISA) (Catalogue number: 47-ADPHU-E01; Alpco Diagnostics, Salem, NH, U.S.A.). The intra-assay coefficients of variation for the two forms of adiponectin were 5.4% for total and 5.0% for HWM adiponectin. Statistics Variables over time were compared between treatments using a mixed analysis of variance model that included fixed terms for treatment, time, treatment sequence (indicating possible carry-over effects), and the interaction between treatment and time and random terms for subject and period. Body weight was included in the model as a random factor to correct for potential fluctuations in body weight. Orthogonal polynomials were used to test for linear or quadratic trends. Regression analyses were performed to describe the slopes of the time trend curve for both beverages. For the correlation between changes over time in adiponectin and HMW adiponectin, a Fisher’s z transformation was applied on individual correlations to correct for deviations from the normal distribution and a 95% confidence intervals (CI) were calculated. Statistical analyses were performed using the SAS statistical software package (SAS version 8, SAS Institute, Cary, NC, U.S.A.). Data are presented as mean ± SEM unless specified otherwise. Statistical significance was defined as P < 0.05.
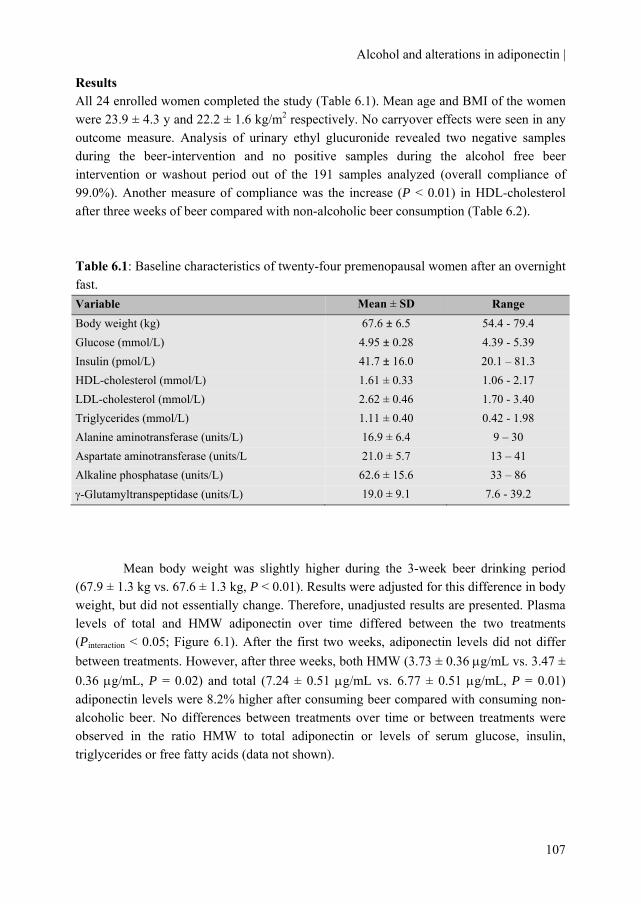
Alcohol and alterations in adiponectin |
107
Results All 24 enrolled women completed the study (Table 6.1). Mean age and BMI of the women were 23.9 ± 4.3 y and 22.2 ± 1.6 kg/m2 respectively. No carryover effects were seen in any outcome measure. Analysis of urinary ethyl glucuronide revealed two negative samples during the beer-intervention and no positive samples during the alcohol free beer intervention or washout period out of the 191 samples analyzed (overall compliance of 99.0%). Another measure of compliance was the increase (P < 0.01) in HDL-cholesterol after three weeks of beer compared with non-alcoholic beer consumption (Table 6.2). Table 6.1: Baseline characteristics of twenty-four premenopausal women after an overnight fast. Variable Mean ± SD Range Body weight (kg) 67.6 ± 6.5 54.4 - 79.4 Glucose (mmol/L) 4.95 ± 0.28 4.39 - 5.39 Insulin (pmol/L) 41.7 ± 16.0 20.1 – 81.3 HDL-cholesterol (mmol/L) 1.61 ± 0.33 1.06 - 2.17 LDL-cholesterol (mmol/L) 2.62 ± 0.46 1.70 - 3.40 Triglycerides (mmol/L) 1.11 ± 0.40 0.42 - 1.98 Alanine aminotransferase (units/L) 16.9 ± 6.4 9 – 30 Aspartate aminotransferase (units/L 21.0 ± 5.7 13 – 41 Alkaline phosphatase (units/L) 62.6 ± 15.6 33 – 86 γ-Glutamyltranspeptidase (units/L) 19.0 ± 9.1 7.6 - 39.2
Mean body weight was slightly higher during the 3-week beer drinking period (67.9 ± 1.3 kg vs. 67.6 ± 1.3 kg, P < 0.01). Results were adjusted for this difference in body weight, but did not essentially change. Therefore, unadjusted results are presented. Plasma levels of total and HMW adiponectin over time differed between the two treatments (Pinteraction < 0.05; Figure 6.1). After the first two weeks, adiponectin levels did not differ between treatments. However, after three weeks, both HMW (3.73 ± 0.36 μg/mL vs. 3.47 ± 0.36 μg/mL, P = 0.02) and total (7.24 ± 0.51 μg/mL vs. 6.77 ± 0.51 μg/mL, P = 0.01) adiponectin levels were 8.2% higher after consuming beer compared with consuming non-alcoholic beer. No differences between treatments over time or between treatments were observed in the ratio HMW to total adiponectin or levels of serum glucose, insulin, triglycerides or free fatty acids (data not shown).
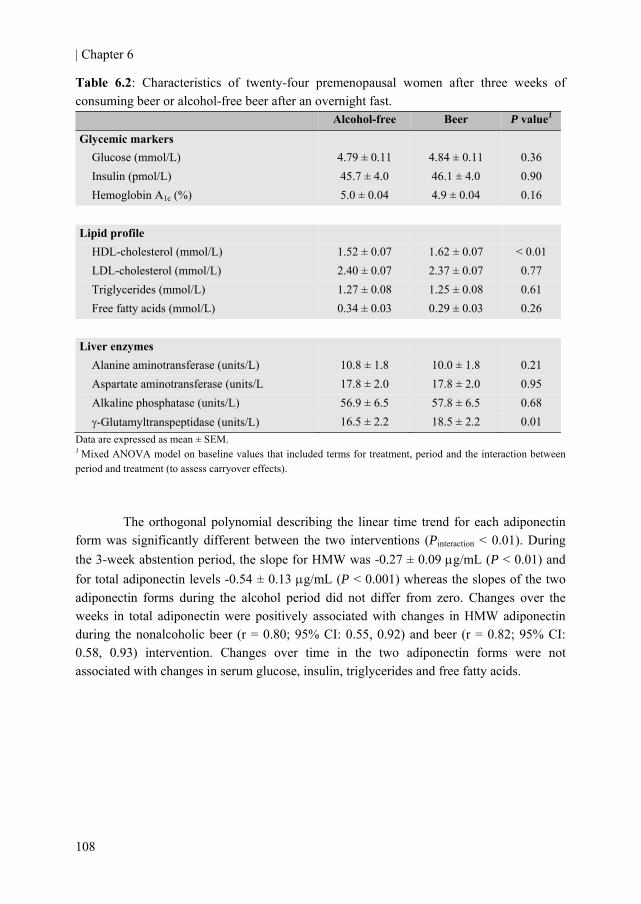
| Chapter 6
108
Table 6.2: Characteristics of twenty-four premenopausal women after three weeks of consuming beer or alcohol-free beer after an overnight fast.
Alcohol-free Beer P value1
Glycemic markers Glucose (mmol/L) 4.79 ± 0.11 4.84 ± 0.11 0.36 Insulin (pmol/L) 45.7 ± 4.0 46.1 ± 4.0 0.90 Hemoglobin A1c (%) 5.0 ± 0.04 4.9 ± 0.04 0.16
Lipid profile HDL-cholesterol (mmol/L) 1.52 ± 0.07 1.62 ± 0.07 < 0.01 LDL-cholesterol (mmol/L) 2.40 ± 0.07 2.37 ± 0.07 0.77 Triglycerides (mmol/L) 1.27 ± 0.08 1.25 ± 0.08 0.61 Free fatty acids (mmol/L) 0.34 ± 0.03 0.29 ± 0.03 0.26
Liver enzymes Alanine aminotransferase (units/L) 10.8 ± 1.8 10.0 ± 1.8 0.21 Aspartate aminotransferase (units/L 17.8 ± 2.0 17.8 ± 2.0 0.95 Alkaline phosphatase (units/L) 56.9 ± 6.5 57.8 ± 6.5 0.68 γ-Glutamyltranspeptidase (units/L) 16.5 ± 2.2 18.5 ± 2.2 0.01
Data are expressed as mean ± SEM. 1 Mixed ANOVA model on baseline values that included terms for treatment, period and the interaction between period and treatment (to assess carryover effects).
The orthogonal polynomial describing the linear time trend for each adiponectin form was significantly different between the two interventions (Pinteraction < 0.01). During the 3-week abstention period, the slope for HMW was -0.27 ± 0.09 μg/mL (P < 0.01) and for total adiponectin levels -0.54 ± 0.13 μg/mL (P < 0.001) whereas the slopes of the two adiponectin forms during the alcohol period did not differ from zero. Changes over the weeks in total adiponectin were positively associated with changes in HMW adiponectin during the nonalcoholic beer (r = 0.80; 95% CI: 0.55, 0.92) and beer (r = 0.82; 95% CI: 0.58, 0.93) intervention. Changes over time in the two adiponectin forms were not associated with changes in serum glucose, insulin, triglycerides and free fatty acids.
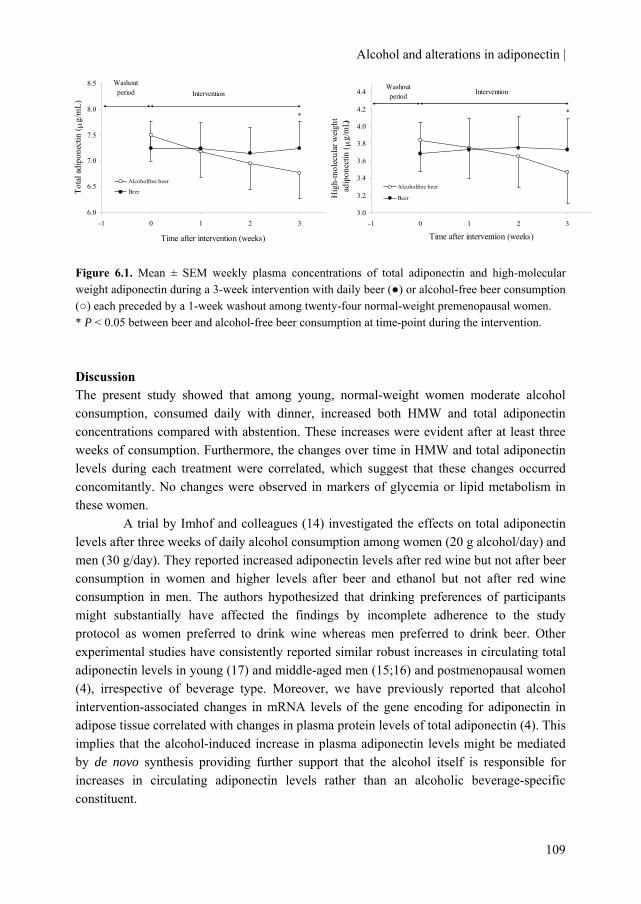
Alcohol and alterations in adiponectin |
109
6.0
6.5
7.0
7.5
8.0
8.5
-1 0 1 2 3
Time after intervention (weeks)
Tota
l adi
pone
ctin
( μg/
mL)
Alcoholfree beer
Beer
Washout period Intervention
*
3.0
3.2
3.4
3.6
3.8
4.0
4.2
4.4
-1 0 1 2 3
Time after intervention (weeks)
Hig
h-m
olec
ular
wei
ght
ad
ipon
ectin
( μ
g/m
L)
Alcoholfree beer
Beer
Washout period Intervention
*
Figure 6.1. Mean ± SEM weekly plasma concentrations of total adiponectin and high-molecular weight adiponectin during a 3-week intervention with daily beer (●) or alcohol-free beer consumption (○) each preceded by a 1-week washout among twenty-four normal-weight premenopausal women. * P < 0.05 between beer and alcohol-free beer consumption at time-point during the intervention. Discussion The present study showed that among young, normal-weight women moderate alcohol consumption, consumed daily with dinner, increased both HMW and total adiponectin concentrations compared with abstention. These increases were evident after at least three weeks of consumption. Furthermore, the changes over time in HMW and total adiponectin levels during each treatment were correlated, which suggest that these changes occurred concomitantly. No changes were observed in markers of glycemia or lipid metabolism in these women.
A trial by Imhof and colleagues (14) investigated the effects on total adiponectin levels after three weeks of daily alcohol consumption among women (20 g alcohol/day) and men (30 g/day). They reported increased adiponectin levels after red wine but not after beer consumption in women and higher levels after beer and ethanol but not after red wine consumption in men. The authors hypothesized that drinking preferences of participants might substantially have affected the findings by incomplete adherence to the study protocol as women preferred to drink wine whereas men preferred to drink beer. Other experimental studies have consistently reported similar robust increases in circulating total adiponectin levels in young (17) and middle-aged men (15;16) and postmenopausal women (4), irrespective of beverage type. Moreover, we have previously reported that alcohol intervention-associated changes in mRNA levels of the gene encoding for adiponectin in adipose tissue correlated with changes in plasma protein levels of total adiponectin (4). This implies that the alcohol-induced increase in plasma adiponectin levels might be mediated by de novo synthesis providing further support that the alcohol itself is responsible for increases in circulating adiponectin levels rather than an alcoholic beverage-specific constituent.
| Chapter 6
110
The data revealed that the difference in adiponectin levels between the two treatments are mainly due to a decrease in adiponectin levels during abstention rather than an increase during alcohol consumption. This, and the fairly similar mean HDL-cholesterol levels prior to the interventions compared to after the alcohol intervention, might confirm that the women were indeed habitual drinkers (which was an inclusion criterion for the present study). Furthermore, the ratio of HMW to total adiponectin over the weeks did not differ between treatments. This, also reflected by the high correlations between changes in HMW and total adiponectin, points out that the intervention-induced changes in HMW and total adiponectin levels occur concurrently. Despite different physiological mechanisms, the observed adiponectin-kinetics resemble in part the alcohol-induced increase in apolipoprotein A-I and HDL-cholesterol, although in these cases higher levels were already seen after 5 and 10 days of alcohol consumption, respectively, compared with abstention (26).
In line with previous clinical trials with other groups of young and relatively healthy subjects, we did not observe changes in markers of insulin sensitivity (27;28) or triglycerides levels (29) after moderate alcohol consumption. Studies that did find an effect on insulin levels after alcohol consumption were performed in middle-aged, relatively less insulin-sensitive (3;30) or diabetic subjects (31-33) and lasted between four weeks to up to a year. This suggests that the effect of moderate alcohol intake on markers of glycemia occurs after a longer period of alcohol administration and/or in subjects with (slightly) impaired glucose tolerance rather than in young and insulin sensitive subjects.
Strong points of the study are its randomized crossover design, the high compliance to the treatments throughout the study and the measurement of HMW and total adiponectin with a more sensitive and precise method (Enzyme-linked immunosorbent assay (ELISA)) instead of quantitative western blotting (17) and within the same ELISA (4). Some limitations warrant consideration. The study duration of three weeks of alcohol consumption was relatively short. May be more profound differences would have appeared in adiponectin levels or markers of glycemia if the study persisted longer. Secondly, the women investigated were relatively young and healthy and thus at low risk for type 2 diabetes. However, studies have shown that the association between moderate alcohol consumption and a lower risk of type 2 diabetes also holds in younger women (34) and among subjects already at low risk for diabetes on the basis of multiple combined low-risk lifestyle behaviors (30).
In conclusion, daily moderate alcohol consumption for at least three weeks concomitantly increased total and HMW adiponectin compared with abstention in premenopausal women. Increased circulating adiponectin levels may contribute to a reduced risk for type 2 diabetes in moderate drinkers, not only in postmenopausal women and young and middle-aged men but also among normal-weight, premenopausal women.
Alcohol and alterations in adiponectin |
111
Authors’ contributions MMJ provided partial funding, designed and conducted the study, collected, analyzed and interpreted the data and wrote the draft manuscript. RFW helped designing the study and critically reviewed the content for important intellectual content. HFJH provided funding, designed the study and critically reviewed the manuscript for important intellectual content. All authors read and approved the final manuscript. Acknowledgements This project is partially supported by the European Research Advisory Board (ERAB) grant no: EA 08 21 and by the Dutch Foundation for Alcohol Research (SAR). We gratefully acknowledge the volunteers for participation, H Fick, D Rouwendaal, A Speulman, J Jansen, I Klöpping, I van den Assum, J Jacobs, E Busink, C Hoeflaken for practical work during the studies; J Catsburg, W Vaes and L Bok for laboratory analyses; E Dutman for data management and S Bijlsma and C Rubingh for statistical support.

| Chapter 6
112
References 1. Koppes LL, Dekker JM, Hendriks HF, Bouter LM, Heine RJ. Moderate alcohol consumption
lowers the risk of type 2 diabetes: a meta-analysis of prospective observational studies. Diabetes Care 2005;28:719-25.
2. Baliunas DO, Taylor BJ, Irving H et al. Alcohol as a risk factor for type 2 diabetes: A systematic review and meta-analysis. Diabetes Care 2009;32:2123-32.
3. Davies MJ, Baer DJ, Judd JT, Brown ED, Campbell WS, Taylor PR. Effects of moderate alcohol intake on fasting insulin and glucose concentrations and insulin sensitivity in postmenopausal women: a randomized controlled trial. JAMA 2002;287:2559-62.
4. Joosten MM, Beulens JW, Kersten S, Hendriks HF. Moderate alcohol consumption increases insulin sensitivity and ADIPOQ expression in postmenopausal women: a randomised, crossover trial. Diabetologia 2008;51:1375-81.
5. Beulens JW, Rimm EB, Hu FB, Hendriks HF, Mukamal KJ. Alcohol consumption, mediating biomarkers, and risk of type 2 diabetes among middle-aged women. Diabetes Care 2008;31:2050-5.
6. Berg AH, Combs TP, Scherer PE. ACRP30/adiponectin: an adipokine regulating glucose and lipid metabolism. Trends Endocrinol Metab 2002;13:84-9.
7. Snijder MB, Heine RJ, Seidell JC et al. Associations of Adiponectin Levels With Incident Impaired Glucose Metabolism and Type 2 Diabetes in Older Men and Women: The Hoorn Study. Diabetes Care 2006;29:2498-503.
8. Hung J, McQuillan BM, Thompson PL, Beilby JP. Circulating adiponectin levels associate with inflammatory markers, insulin resistance and metabolic syndrome independent of obesity. Int J Obes (Lond) 2008;32:772-9.
9. Li S, Shin HJ, Ding EL, van Dam RM. Adiponectin Levels and Risk of Type 2 Diabetes: A Systematic Review and Meta-analysis. JAMA 2009;302:179-88.
10. Pischon T, Girman CJ, Hotamisligil GS, Rifai N, Hu FB, Rimm EB. Plasma Adiponectin Levels and Risk of Myocardial Infarction in Men. JAMA 2004;291:1730-7.
11. Englund Ogge L, Brohall G, Behre CJ, Schmidt C, Fagerberg B. Alcohol Consumption in Relation to Metabolic Regulation, Inflammation, and Adiponectin in 64-Year-Old Caucasian Women: A population-based study with a focus on impaired glucose regulation. Diabetes Care 2006;29:908-13.
12. Thamer C, Haap M, Fritsche A, Haering H, Stumvoll M. Relationship Between Moderate Alcohol Consumption and Adiponectin and Insulin Sensitivity in a Large Heterogeneous Population. Diabetes Care 2004;27:1240.
13. Pischon T, Girman CJ, Rifai N, Hotamisligil GS, Rimm EB. Association between dietary factors and plasma adiponectin concentrations in men. Am J Clin Nutr 2005;81:780-6.
Alcohol and alterations in adiponectin |
113
14. Imhof A, Plamper I, Maier S, Trischler G, Koenig W. Effect of drinking on adiponectin in healthy men and women: a randomized intervention study of water, ethanol, red wine, and beer with or without alcohol. Diabetes Care 2009;32:1101-3.
15. Sierksma A, Patel H, Ouchi N et al. Effect of moderate alcohol consumption on adiponectin, tumor necrosis factor-α, and insulin sensitivity. Diabetes Care 2004;27:184-9.
16. Beulens JW, van Beers RM, Stolk RP, Schaafsma G, Hendriks HF. The effect of moderate alcohol consumption on fat distribution and adipocytokines. Obesity (Silver Spring) 2006;14:60-6.
17. Beulens JW, van Loon LJ, Kok FJ et al. The effect of moderate alcohol consumption on adiponectin oligomers and muscle oxidative capacity: a human intervention study. Diabetologia 2007;50:1388-92.
18. Avogaro A, Sambataro M, Marangoni A et al. Moderate alcohol consumption, glucose metabolism and lipolysis: the effect on adiponectin and tumor necrosis factor alpha. J Endocrinol Invest 2003;26:1213-8.
19. Greenfield JR, Samaras K, Hayward CS, Chisholm DJ, Campbell LV. Beneficial postprandial effect of a small amount of alcohol on diabetes and cardiovascular risk factors: modification by insulin resistance. J Clin Endocrinol Metab 2005;90:661-72.
20. Laughlin GA, Barrett-Connor E, May S. Sex-specific association of the androgen to oestrogen ratio with adipocytokine levels in older adults: the Rancho Bernardo Study. Clin Endocrinol (Oxf) 2006;65:506-13.
21. Hong SC, Yoo SW, Cho GJ et al. Correlation between estrogens and serum adipocytokines in premenopausal and postmenopausal women. Menopause 2007;14:835-40.
22. Leung KC, Xu A, Craig ME, Martin A, Lam KS, O'Sullivan AJ. Adiponectin isoform distribution in women--relationship to female sex steroids and insulin sensitivity. Metabolism 2009;58:239-45.
23. Hara K, Horikoshi M, Yamauchi T et al. Measurement of the high-molecular weight form of adiponectin in plasma is useful for the prediction of insulin resistance and metabolic syndrome. Diabetes Care 2006;29:1357-62.
24. Bobbert T, Rochlitz H, Wegewitz U et al. Changes of adiponectin oligomer composition by moderate weight reduction. Diabetes 2005;54:2712-9.
25. Seino Y, Hirose H, Saito I, Itoh H. High-molecular-weight adiponectin is a predictor of progression to metabolic syndrome: a population-based 6-year follow-up study in Japanese men. Metabolism 2009;58:355-60.
26. Sierksma A, van der Gaag MS, van TA, James RW, Hendriks HF. Kinetics of HDL cholesterol and paraoxonase activity in moderate alcohol consumers. Alcohol Clin Exp Res 2002;26:1430-5.
| Chapter 6
27. Zilkens RR, Burke V, Watts G, Beilin LJ, Puddey IB. The Effect of Alcohol Intake on Insulin Sensitivity in Men: A randomized controlled trial. Diabetes Care 2003;26:608-12.
28. Gonzalez-Ortiz M, Pascoe-Gonzalez S, Kam-Ramos AM, Martinez-Abundis E. Effect of tequila on homocysteine, insulin secretion, insulin sensitivity, and metabolic profile in healthy men. Journal of Diabetes and its Complications 2005;19:155-9.
29. Clevidence BA, Reichman ME, Judd JT et al. Effects of Alcohol Consumption on Lipoproteins of Premenopausal Women : A Controlled Diet Study. Arterioscler Thromb Vasc Biol 1995;15:179-84.
30. Joosten MM, Grobbee DE, van der A DL, Verschuren WM, Hendriks HF, Beulens JW. Combined effect of alcohol consumption and lifestyle behaviors on risk of type 2 diabetes. Am J Clin Nutr 2010;91:1777-83.
31. Bantle AE, Thomas W, Bantle JP. Metabolic effects of alcohol in the form of wine in persons with type 2 diabetes mellitus. Metabolism 2008;57:241-5.
32. Shai I, Wainstein J, Harman-Boehm I et al. Glycemic effects of moderate alcohol intake among patients with type 2 diabetes: a multicenter, randomized, clinical intervention trial. Diabetes Care 2007;30:3011-6.
33. Marfella R, Cacciapuoti F, Siniscalchi M et al. Effect of moderate red wine intake on cardiac prognosis after recent acute myocardial infarction of subjects with Type 2 diabetes mellitus. Diabet Med 2006;23:974-81.
34. Wannamethee SG, Camargo CA, Jr., Manson JE, Willett WC, Rimm EB. Alcohol drinking patterns and risk of type 2 diabetes mellitus among younger women. Arch Intern Med 2003;163:1329-36.
115
Chapter 7
Alcohol-induced increase in lipoproteins does not alter inflammatory response after low-dose in vivo
endotoxin challenge in men
Michel M. Joosten Martine Boetje
Renger F. Witkamp Henk F.J. Hendriks
Submitted in revised form
| Chapter 7
116
Background: Circulating high-density lipoprotein (HDL)-cholesterol and its associated surface lipids apolipoprotein A-I (apoA-I) and phospholipids have been shown to play an important role in the detoxification of lipopolysaccharides (LPS). Moderate alcohol consumption increases HDL-cholesterol, apoA-I and phospholipids. Objective: to the study was to investigate whether the alcohol-induced increase in lipoproteins attenuates the inflammatory response after a low-dose in vivo endotoxin challenge. Design: In a randomized, crossover trial, 22 men (age: 21-31 y) consumed vodka (30 g/day alcohol) with orange juice or orange juice for four weeks. After each four-week period, subjects were intravenously challenged with a low-dose endotoxin (0.06 ng/kg body weight) bolus. Blood was sampled before and for six hours after the LPS bolus. Results: Four weeks of vodka consumption increased HDL-cholesterol (10.3%; P < 0.001), apoA-I (11.9%; P < 0.001), apolipoprotein C-I (7.4%; P < 0.001) and phospholipids (7.8%; P < 0.001) compared with juice consumption. Inflammatory cytokine and leukocyte responses after the LPS bolus did not differ between treatments. However, tolerance to endotoxin was observed in leukocyte (P < 0.05) and TNF-α responses (P < 0.01) during the second challenge with LPS. Conclusions: Despite improved lipoprotein profiles, alcohol consumption did not attenuate the inflammatory response after a low dose in vivo endotoxin challenge. Trial registration: Clinicaltrials.gov ID no.: NCT 00918918
Alcohol, HDL surface lipids and LPS response |
117
Introduction In addition to the well-recognized function of lipoproteins in cholesterol and lipid transport, a large body of evidence has demonstrated that lipoproteins also play an important role in the host defense system (1). Lipopolysaccharide (LPS) (also called endotoxin), a component of the gram-negative bacterial cell wall, is among the most potent modulators of the host’s innate immune system. Although all lipoproteins have been demonstrated to bind LPS, it mainly binds to high-density lipoprotein (HDL)-cholesterol (60%) in addition to low-density lipoprotein (LDL)-cholesterol (25%) and very low-density lipoprotein (VLDL)-cholesterol (12%) when added to whole human normal blood (2;3). Increasing circulating HDL-cholesterol levels has shown to attenuate the inflammatory effect of endotoxin both in men (4) and mice (5). Conversely, lowering lipoprotein levels rendered animals more susceptible to LPS-induced lethality (6). Studies in both animals and humans suggest that, not HDL-cholesterol itself, but the associated surface apolipoprotein A-I (apoA-I) (7-9) and the phospholipids (2;5;10) are largely responsible for the protective effect against endotoxin-evoked infection. Moreover, increasing phospholipid content of circulating lipoproteins has been shown to decrease the adverse effects of endotoxin in rabbits (11) and mortality in pigs (12).
Moderate alcohol consumption is well-known for its HDL-raising properties, (13;14) which may account for 50% of the protective effect observed in the relation between alcohol consumption and cardiovascular disease (15;16). Besides the increase in HDL-cholesterol, alcohol consumption also increases its associated surface lipids apoA-I, and phospholipids independent of type of beverage (17). Theoretically, this alcohol-induced increase in lipoproteins could increase the scavenging capacity of endotoxin, thereby minimizing the amount of endotoxin available to elicit inflammatory activation.
The injection of a dose of endotoxin into humans has been used for decades as a model to study the interrelationships between infection and the host response (18-20). Using this well-established model of endotoxemia in apparently healthy volunteers, we compared the impact of the alcohol-induced increase in HDL-cholesterol and its associated surface lipids on the sensitivity toward a low-dose in vivo endotoxin challenge in men. Materials and Methods Study design The study used a randomized, open label, crossover design, consisting of two four-week periods. Subjects consumed two miniatures (50 ml each) of vodka (Smirnoff, U.K.) (30 g/day alcohol; ~2 drinks according to the U.S. Department of Agriculture (USDA) guidelines (21)) with 200 ml orange juice (Appelsientje, the Netherlands) or only orange juice for four weeks during dinner. The study was conducted at TNO (a Dutch acronym for applied scientific research) Quality of Life, in Zeist, the Netherlands. The study was approved by an independent centralized ethics committee (METOPP; Tilburg, the Netherlands) and is registered at Clinicaltrials.gov, number NCT 00918918. Allocation to

| Chapter 7
118
treatment order was randomized according to BMI and age. Blood sampling was done on the morning after four weeks of each treatment period, after an overnight fast.
Compliance was monitored by weekly measurement of urinary ethyl glucuronide (EtG), a direct phase II metabolite of ethanol formed by action of UDP- glucuronosyl transferase. EtG has been reported to be a superior marker with 100% sensitivity as a biomarker of recent drinking. It persists in the urine up to ~75 - 85 h after last intake (22). Cut-off limit to assess compliance during juice intervention for urinary EtG values was set at >0.25 mg/mL (positive sample), to obtain a high sensitivity but avoid positive results due to unintentional ethanol exposure. Cut-off limit during vodka intervention was set at EtG values <0.5 mg/mL (2.2 μmol/L) (negative sample). Additional measures of compliance were the increase of HDL-cholesterol and the return of empty bottles of vodka. Subjects We recruited 24 apparently healthy, non smoking male subjects between 21 and 40 years. Subjects were eligible if they consumed between 5 and 28 units of alcohol per week, were free of any medication at the beginning of the study, and had a BMI between 18 and 27 kg/m2 and had no family history of alcoholism. Subjects gave written informed consent and received a compensation for their participation. They were instructed to maintain their habitual body weight, food pattern and physical activity pattern and were told to refrain from any alcoholic products during the entire study except the vodka supplied by TNO. Experimental protocol On the morning after each intervention, after an overnight fast, study participants came to the premises. Blood pressure and heart rate were measured by means of OMRON HEM-7080IT-E (Kyoto, Japan). A catheter was inserted in an antecubital vein. At t = 0, blood was drawn for baseline measurements. Subsequently, subjects received a bolus infusion of 0.06 ng/kg body weight of endotoxin (Escherichia coli lipopolysaccharide, Catalog Number: 1235503, lot G3E069; United States Pharmacopeial Convention Inc, Rockville, MD, U.S.A.) in the antecubital vein. Heart rate and blood pressure were recorded and blood samples were collected at t = 0, 1, 2, 3, 4, 5 and 6 hours after endotoxin challenge. Blood and urine analysis Blood samples were obtained from the anticubital vein of the forearm and collected in tubes containing clot activator for serum and in ice-chilled tubes containing or Potassium Ethylene Diamine Tetra Acid (K3EDTA) or lithium heparin for plasma and whole blood (Vacutainer Systems, Becton Dickinson, Plymouth, U.K.). Blood was centrifuged for 15 minutes at 2.000 g at 4°C, within 15 - 30 minutes after collection and stored at <-70°C.
Clinical chemistry, high sensitive C-reactive protein (hsCRP), phospholipids and total leukocytes were analyzed by ADVIA 120/2120 Hematology system (Bayer Diagnostics, U.S.A.). Apolipoproteins in serum were analyzed by bead-based multiplexed immunoassay at the biomarker testing laboratory Rules Based Medicine (RBM; Austin,

Alcohol, HDL surface lipids and LPS response |
119
Texas, U.S.A.). Tumor Necrosis Factor alpha (TNF-α) was measured by Ultra-Sensitive ELISA (Invitrogen, Paisley, U.K.) and Interleukin (IL)-6 by Luminex using Bio-plex Pro-Assays (Bio-Rad Laboratories, Hercules, CA, U.S.A.), both in plasma according to the manufacturers' specifications. Plasma total adiponectin and lipoprotein binding protein (LBP) were measured using MesoScale Diagnostics assays (Cat# K151IYC-1 and K151BXC-1) (Meso Scale Discovery; Gaithersburg, MD, U.S.A.) and plasma soluble CD14 (sCD14) was measured by means of an immuno-enzymometric (Cat# DC140) (R&D systems; Abingdon, U.K.). EtG was determined was analyzed using a triple quadrupole Ultra Performance LC/MS in MRM mode (Waters, Saint-Quentin en Yvelines, France) as previously described (23). Statistical analyses Statistical analyses were performed using the SAS statistical software package (SAS versions 8.2 and 9.1, SAS Institute, Cary, NC, U.S.A.). Variables at the end of the intervention were compared between treatments with a mixed analysis of variance model that included terms for treatment, period and the interaction between period and treatment (indicating possible carryover effects). The inflammatory responses over time between treatments were compared with a mixed analysis of variance model that included terms for treatment, time, period the interaction between time and treatment and the interaction between period and treatment. Correlation coefficients were computed according to Pearson’s correlation coefficient or Spearman rank order (for non-normally distributed variables) to assess associations in intervention-induced relative changes between lipoproteins and apolipoproteins and to asses associations between lipoproteins and endotoxin-induced peak response of inflammatory markers. Data are presented as means and SEM unless otherwise specified. Statistical significance was defined as P < 0.05. Results Intervention Two of the 24 subjects underwent just one LPS challenge and were excluded for further analyses. Mean age and BMI of the 22 men were 25.0 y (range: 21 - 31 y) and 23.3 kg/m2 (range: 19.1 - 27.2 kg/m2). Compliance to treatments was assessed by weekly urinary EtG levels revealing eight positive samples during the juice-drinking period (although all <0.5 mg/mL) and five negative samples during the vodka-drinking period out of the 176 samples analyzed (overall compliance of 93%).
No carryover effects were observed for any outcome measures. HDL-cholesterol significantly increased by 10.3% (P < 0.001) after the vodka juice compared to juice consumption. Also, apoA-I (11.6%; P < 0.001), apolipoprotein C-I (apoC-I) (7.4%; P < 0.001), phospholipids (7.8%; P < 0.001) and total adiponectin (11.3%; P < 0.001) increased significantly after the vodka juice intervention. Baseline levels of other markers after each four-week period did not differ between treatments (Table 7.1).
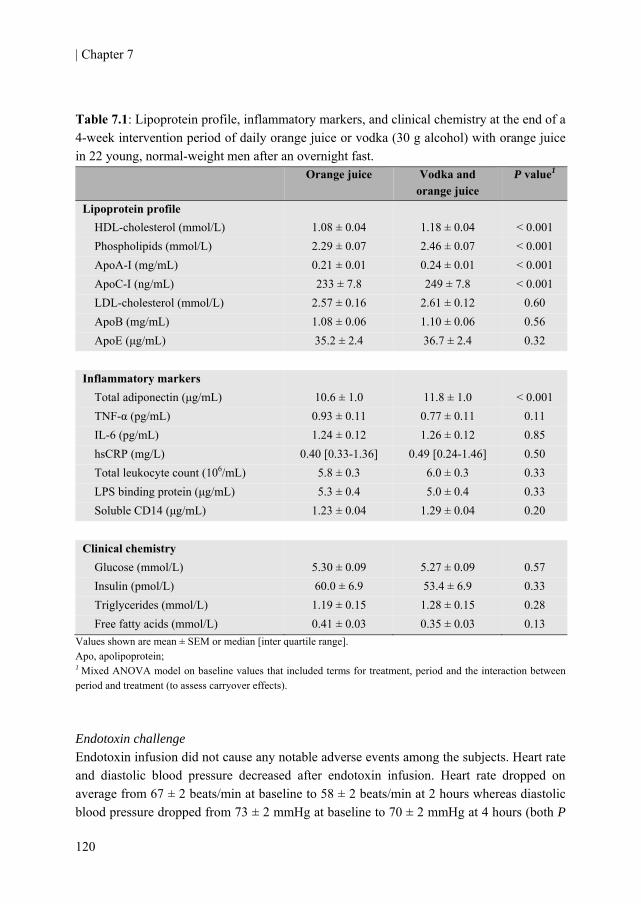
| Chapter 7
120
Table 7.1: Lipoprotein profile, inflammatory markers, and clinical chemistry at the end of a 4-week intervention period of daily orange juice or vodka (30 g alcohol) with orange juice in 22 young, normal-weight men after an overnight fast.
Values shown are mean ± SEM or median [inter quartile range]. Apo, apolipoprotein; 1 Mixed ANOVA model on baseline values that included terms for treatment, period and the interaction between period and treatment (to assess carryover effects). Endotoxin challenge Endotoxin infusion did not cause any notable adverse events among the subjects. Heart rate and diastolic blood pressure decreased after endotoxin infusion. Heart rate dropped on average from 67 ± 2 beats/min at baseline to 58 ± 2 beats/min at 2 hours whereas diastolic blood pressure dropped from 73 ± 2 mmHg at baseline to 70 ± 2 mmHg at 4 hours (both P
Orange juice Vodka and orange juice
P value1
Lipoprotein profile HDL-cholesterol (mmol/L) 1.08 ± 0.04 1.18 ± 0.04 < 0.001 Phospholipids (mmol/L) 2.29 ± 0.07 2.46 ± 0.07 < 0.001 ApoA-I (mg/mL) 0.21 ± 0.01 0.24 ± 0.01 < 0.001 ApoC-I (ng/mL) 233 ± 7.8 249 ± 7.8 < 0.001 LDL-cholesterol (mmol/L) 2.57 ± 0.16 2.61 ± 0.12 0.60 ApoB (mg/mL) 1.08 ± 0.06 1.10 ± 0.06 0.56 ApoE (μg/mL) 35.2 ± 2.4 36.7 ± 2.4 0.32
Inflammatory markers Total adiponectin (μg/mL) 10.6 ± 1.0 11.8 ± 1.0 < 0.001 TNF-α (pg/mL) 0.93 ± 0.11 0.77 ± 0.11 0.11 IL-6 (pg/mL) 1.24 ± 0.12 1.26 ± 0.12 0.85 hsCRP (mg/L) 0.40 [0.33-1.36] 0.49 [0.24-1.46] 0.50 Total leukocyte count (106/mL) 5.8 ± 0.3 6.0 ± 0.3 0.33 LPS binding protein (μg/mL) 5.3 ± 0.4 5.0 ± 0.4 0.33 Soluble CD14 (μg/mL) 1.23 ± 0.04 1.29 ± 0.04 0.20
Clinical chemistry Glucose (mmol/L) 5.30 ± 0.09 5.27 ± 0.09 0.57 Insulin (pmol/L) 60.0 ± 6.9 53.4 ± 6.9 0.33 Triglycerides (mmol/L) 1.19 ± 0.15 1.28 ± 0.15 0.28 Free fatty acids (mmol/L) 0.41 ± 0.03 0.35 ± 0.03 0.13
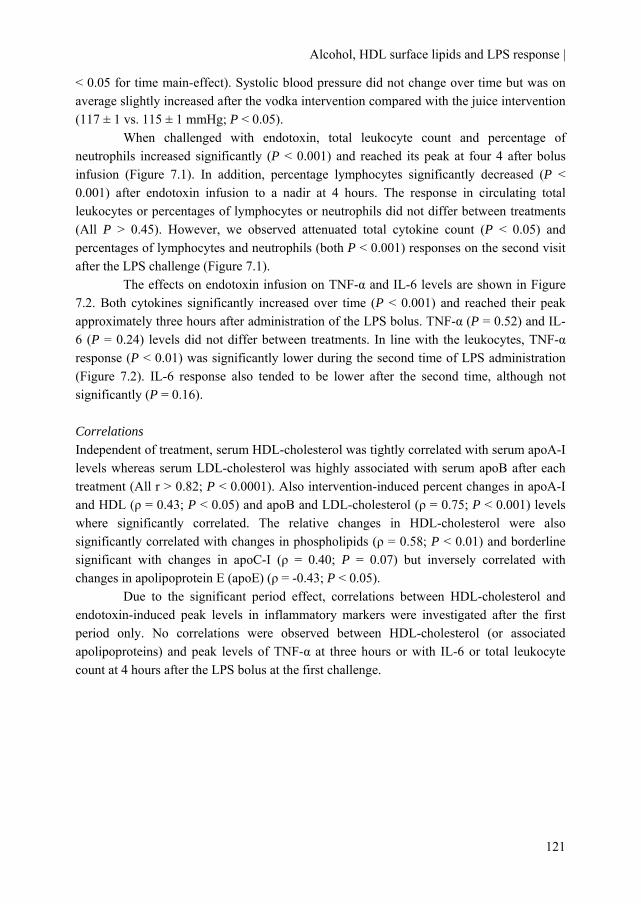
Alcohol, HDL surface lipids and LPS response |
121
< 0.05 for time main-effect). Systolic blood pressure did not change over time but was on average slightly increased after the vodka intervention compared with the juice intervention (117 ± 1 vs. 115 ± 1 mmHg; P < 0.05).
When challenged with endotoxin, total leukocyte count and percentage of neutrophils increased significantly (P < 0.001) and reached its peak at four 4 after bolus infusion (Figure 7.1). In addition, percentage lymphocytes significantly decreased (P < 0.001) after endotoxin infusion to a nadir at 4 hours. The response in circulating total leukocytes or percentages of lymphocytes or neutrophils did not differ between treatments (All P > 0.45). However, we observed attenuated total cytokine count (P < 0.05) and percentages of lymphocytes and neutrophils (both P < 0.001) responses on the second visit after the LPS challenge (Figure 7.1).
The effects on endotoxin infusion on TNF-α and IL-6 levels are shown in Figure 7.2. Both cytokines significantly increased over time (P < 0.001) and reached their peak approximately three hours after administration of the LPS bolus. TNF-α (P = 0.52) and IL-6 (P = 0.24) levels did not differ between treatments. In line with the leukocytes, TNF-α response (P < 0.01) was significantly lower during the second time of LPS administration (Figure 7.2). IL-6 response also tended to be lower after the second time, although not significantly (P = 0.16). Correlations Independent of treatment, serum HDL-cholesterol was tightly correlated with serum apoA-I levels whereas serum LDL-cholesterol was highly associated with serum apoB after each treatment (All r > 0.82; P < 0.0001). Also intervention-induced percent changes in apoA-I and HDL (ρ = 0.43; P < 0.05) and apoB and LDL-cholesterol (ρ = 0.75; P < 0.001) levels where significantly correlated. The relative changes in HDL-cholesterol were also significantly correlated with changes in phospholipids (ρ = 0.58; P < 0.01) and borderline significant with changes in apoC-I (ρ = 0.40; P = 0.07) but inversely correlated with changes in apolipoprotein E (apoE) (ρ = -0.43; P < 0.05).
Due to the significant period effect, correlations between HDL-cholesterol and endotoxin-induced peak levels in inflammatory markers were investigated after the first period only. No correlations were observed between HDL-cholesterol (or associated apolipoproteins) and peak levels of TNF-α at three hours or with IL-6 or total leukocyte count at 4 hours after the LPS bolus at the first challenge.
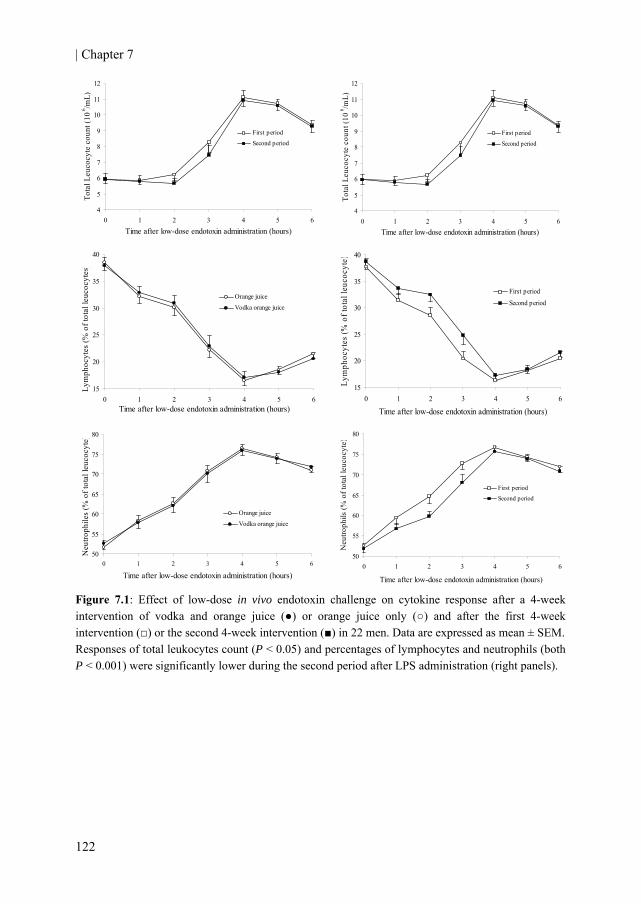
| Chapter 7
122
4
5
6
7
8
9
10
11
12
0 1 2 3 4 5 6Time after low-dose endotoxin administration (hours)
Tota
l Leu
cocy
te c
ount
(10
6 /mL)
First period
Second period
4
5
6
7
8
9
10
11
12
0 1 2 3 4 5 6Time after low-dose endotoxin administration (hours)
Tota
l Leu
cocy
te c
ount
(10
6 /mL)
First period
Second period
15
20
25
30
35
40
0 1 2 3 4 5 6Time after low-dose endotoxin administration (hours)
Lym
phoc
ytes
(% o
f tot
al le
ucoc
ytes
)
Orange juice
Vodka orange juice
15
20
25
30
35
40
0 1 2 3 4 5 6
Time after low-dose endotoxin administration (hours)
Lym
phoc
ytes
(% o
f tot
al le
ucoc
yte)
First period
Second period
50
55
60
65
70
75
80
0 1 2 3 4 5 6
Time after low-dose endotoxin administration (hours)
Neu
troph
iles
(% o
f tot
al le
ucoc
yte)
Orange juice
Vodka orange juice
50
55
60
65
70
75
80
0 1 2 3 4 5 6
Time after low-dose endotoxin administration (hours)
Neu
troph
ils (%
of t
otal
leuc
ocyt
e)
First period
Second period
Figure 7.1: Effect of low-dose in vivo endotoxin challenge on cytokine response after a 4-week intervention of vodka and orange juice (●) or orange juice only (○) and after the first 4-week intervention (□) or the second 4-week intervention (■) in 22 men. Data are expressed as mean ± SEM. Responses of total leukocytes count (P < 0.05) and percentages of lymphocytes and neutrophils (both P < 0.001) were significantly lower during the second period after LPS administration (right panels).
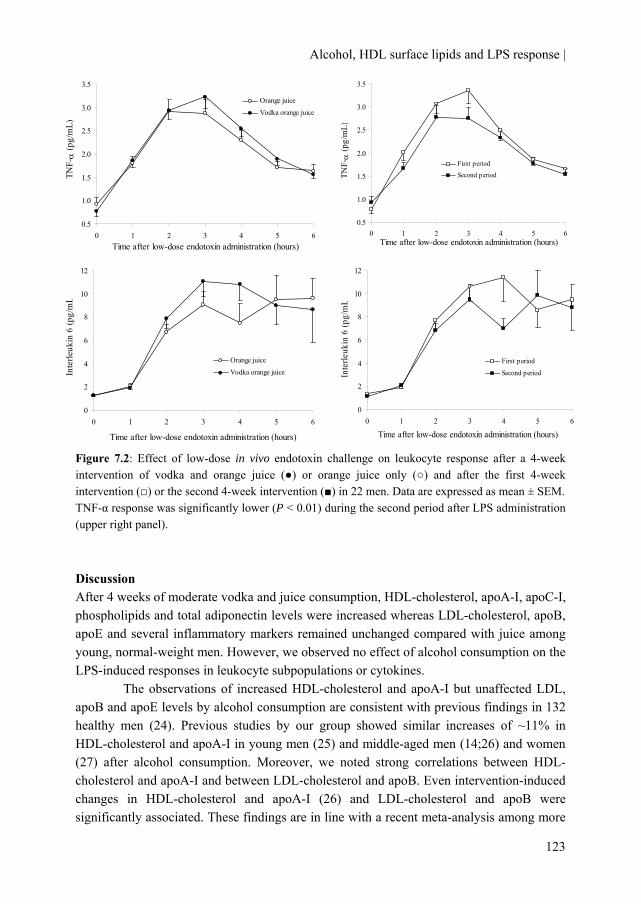
Alcohol, HDL surface lipids and LPS response |
123
0.5
1.0
1.5
2.0
2.5
3.0
3.5
0 1 2 3 4 5 6Time after low-dose endotoxin administration (hours)
TNF-α
(pg/
mL)
Orange juice
Vodka orange juice
0.5
1.0
1.5
2.0
2.5
3.0
3.5
0 1 2 3 4 5 6Time after low-dose endotoxin administration (hours)
TNF-α
(pg/
mL)
First period
Second period
0
2
4
6
8
10
12
0 1 2 3 4 5 6
Time after low-dose endotoxin administration (hours)
Inte
rleuk
in 6
(pg/
mL
Orange juice
Vodka orange juice
0
2
4
6
8
10
12
0 1 2 3 4 5 6
Time after low-dose endotoxin administration (hours)
Inte
rleuk
in 6
(pg/
mL
First period
Second period
Figure 7.2: Effect of low-dose in vivo endotoxin challenge on leukocyte response after a 4-week intervention of vodka and orange juice (●) or orange juice only (○) and after the first 4-week intervention (□) or the second 4-week intervention (■) in 22 men. Data are expressed as mean ± SEM. TNF-α response was significantly lower (P < 0.01) during the second period after LPS administration (upper right panel). Discussion After 4 weeks of moderate vodka and juice consumption, HDL-cholesterol, apoA-I, apoC-I, phospholipids and total adiponectin levels were increased whereas LDL-cholesterol, apoB, apoE and several inflammatory markers remained unchanged compared with juice among young, normal-weight men. However, we observed no effect of alcohol consumption on the LPS-induced responses in leukocyte subpopulations or cytokines.
The observations of increased HDL-cholesterol and apoA-I but unaffected LDL, apoB and apoE levels by alcohol consumption are consistent with previous findings in 132 healthy men (24). Previous studies by our group showed similar increases of ~11% in HDL-cholesterol and apoA-I in young men (25) and middle-aged men (14;26) and women (27) after alcohol consumption. Moreover, we noted strong correlations between HDL-cholesterol and apoA-I and between LDL-cholesterol and apoB. Even intervention-induced changes in HDL-cholesterol and apoA-I (26) and LDL-cholesterol and apoB were significantly associated. These findings are in line with a recent meta-analysis among more

| Chapter 7
124
than 300,000 people which showed that HDL-cholesterol and apoA-I had very similar shape and magnitude of associations with risk of vascular diseases, as did LDL-cholesterol and apoB (28).
Besides increased HDL-cholesterol and apoA-I, we also found increased levels of apoC-I and total adiponectin. Similar to apoA-I and phospholipids, several human studies suggest that apoC-I can function as part of the innate host defense mechanism against infection. In old age high plasma levels of apoC-I protect against mortality from infection independent of HDL-cholesterol (29). Moreover, apoC-I levels are also correlated with increased survival in patients with severe sepsis (30). In concord with previous findings (23;31;32), we also found higher adiponectin levels after regular moderate alcohol consumption compared with abstention. Adiponectin levels are inversely associated with markers of inflammation (33;34). Moreover, it has been shown that adiponectin exerts anti-inflammatory effects via macrophages, suppressing the production of pro-inflammatory cytokines in response to LPS (35).
Despite the increases in HDL-cholesterol and several associated surface markers important for LPS detoxification, the inflammatory response after the LPS bolus did not differ between treatments. Possibly, a potential anti-inflammatory effect could have counteracted by a pro-inflammatory effect after moderate alcohol consumption. Concentrations of increased lipopolysaccharide-binding protein (LBP), soluble CD14 (sCD14) and endotoxin levels (36), suggestive of increased permeability or ‘leaky gut’ (37), and a decreased endotoxin-binding capacity of whole blood (38) have been reported in persons with chronic alcohol misuse. Both LBP and CD14 play a role in the response to gram negative compounds depending on their concentration and environment (39;40). For example, they transfer LPS to the signaling receptor complex MD-2/Toll-like receptor 4 (TLR4) on macrophages. However, plasma LBP or sCD14 levels were unaffected by moderate alcohol consumption. Also, in observational research moderate amounts of alcohol, comparable as used in our study, were not associated with endotoxemia in apparently healthy men (41).
Alternatively, the unaltered response after LPS administration between treatments might be due to tolerance to the endotoxin. Peak and averaged values of total leukocyte and cytokine responses were lower the second administration compared to the first administration. These are strong indications for tolerance. Although tolerance to LPS has been described before in humans after days (42;43) or 2 weeks (44), it has never been described as late as 4 weeks after a previous challenge. This tolerance could have obscured potential treatment effects due to the randomized crossover design of our study. We compared treatments taking into account results after the first LPS administration period only. This did not materially change our findings (data not shown). However, our study was not designed for such a comparison and was therefore highly underpowered.
Regardless of possible increased anti-inflammatory properties of HDL-cholesterol and its associated surface lipids, a functional consequence of the alcohol-induced elevation in HDL is an increased cholesterol efflux. The improved cholesterol efflux is mediated by
Alcohol, HDL surface lipids and LPS response |
125
stimulating early steps in reverse cholesterol transport (17) and by ATP-binding cassette transporter protein A1 (ABCA1) (26). Furthermore, increased paraoxonase (PON) activity has been observed after moderate alcohol consumption (14;27). PON, an enzyme entirely complexed to HDL-cholesterol, may protect against atherosclerosis by its anti-oxidative properties (45).
Experimental endotoxemia can provide unique insights into the relationship of inflammation and metabolic disturbances (20;46). Nevertheless, several limitations of this model warrant consideration. Based on previous research that showed HDL-mediated decreases in inflammatory responses in humans (4;7;10), we chose LPS as an inductor of inflammation. It should be noted that endotoxin is just one of many ways to activate the immune system. Second, the dose of endotoxin might have been too low to pick up differences in HDL-cholesterol’s anti-inflammatory potential, compared with previous research where they used 1-4 ng/kg body weight (4;7;19;46). Fourth, structural differences in LPS derived from different strains exist. However, both the dose (0.06 ng/kg bodyweight) and strain of LPS have been used before (44;47) and give physiological relevant rather than supra physiological elevations of TNF-α. With this model we succeeded to mimic a more naturally occurring endotoxemia, as seen in humans e.g. after a high fat meal (48). Finally, we induced a more acute rather than chronic low-grade inflammation. Especially the latter has been proposed to be associated with several diseases states. Therefore, low-dose endotoxin administration for a longer period might more closely mimic this low-grade inflammatory state.
To summarize, moderate alcohol consumption (approximately two to three drinks a day) for four weeks increases serum HDL-cholesterol, apoA-I, apoC-I and phospholipids, which all have been linked to play important roles in the detoxification of LPS. This improvement of lipoprotein profile did not attenuate the inflammatory response after a low dose of LPS bolus, possibly due to tolerance to the endotoxin. Whether the increase in HDL-cholesterol and its associated surface lipids after moderate alcohol consumption has potent anti-inflammatory properties in vivo warrants further clarification. Acknowledgement We would like to thank the volunteers for participation; I Klöpping, H Fick, D Rouwendaal, A Speulman, J Jansen, I van den Assum, J Jacobs, and C Hoeflaken for practical work during the study; M Rondhuis, W Vaes, B Fabriek, M von Lipzig and L Bok and others for laboratory analyses; D Dijkstra for preparing the LPS solution; and E Dutman for data management. The research described in this article was partly funded by the Dutch Foundation for Alcohol Research (SAR).
| Chapter 7
126
References 1. Khovidhunkit W, Kim MS, Memon RA et al. Thematic review series: The Pathogenesis of
Atherosclerosis. Effects of infection and inflammation on lipid and lipoprotein metabolism mechanisms and consequences to the host. J Lipid Res 2004;45:1169-96.
2. Kitchens RL, Thompson PA, Munford RS, O'Keefe GE. Acute inflammation and infection maintain circulating phospholipid levels and enhance lipopolysaccharide binding to plasma lipoproteins. J Lipid Res 2003;44:2339-48.
3. Levels JH, Abraham PR, van den EA, van Deventer SJ. Distribution and kinetics of lipoprotein-bound endotoxin. Infect Immun 2001;69:2821-8.
4. Pajkrt D, Doran JE, Koster F et al. Antiinflammatory effects of reconstituted high-density lipoprotein during human endotoxemia. J Exp Med 1996;184:1601-8.
5. Levine DM, Parker TS, Donnelly TM, Walsh A, Rubin AL. In vivo protection against endotoxin by plasma high density lipoprotein. Proc Natl Acad Sci U S A 1993;90:12040-4.
6. Feingold KR, Funk JL, Moser AH, Shigenaga JK, Rapp JH, Grunfeld C. Role for circulating lipoproteins in protection from endotoxin toxicity. Infect Immun 1995;63:2041-6.
7. Birjmohun RS, van Leuven SI, Levels JHM et al. High-Density Lipoprotein Attenuates Inflammation and Coagulation Response on Endotoxin Challenge in Humans. Arterioscler Thromb Vasc Biol 2007;27:1153-8.
8. Thaveeratitham P, Plengpanich W, Naen-Udorn W, Patumraj S, Khovidhunkit W. Effects of human apolipoprotein A-I on endotoxin-induced leukocyte adhesion on endothelial cells in vivo and on the growth of Escherichia coli in vitro. Journal of Endotoxin Research 2007;13:58-64.
9. Massamiri T, Tobias PS, Curtiss LK. Structural determinants for the interaction of lipopolysaccharide binding protein with purified high density lipoproteins: role of apolipoprotein A-I. J Lipid Res 1997;38:516-25.
10. Parker TS, Levine DM, Chang JC, Laxer J, Coffin CC, Rubin AL. Reconstituted high-density lipoprotein neutralizes gram-negative bacterial lipopolysaccharides in human whole blood. Infect Immun 1995;63:253-8.
11. Cue JI, DiPiro JT, Brunner LJ et al. Reconstituted high density lipoprotein inhibits physiologic and tumor necrosis factor alpha responses to lipopolysaccharide in rabbits. Arch Surg 1994;129:193-7.
12. Goldfarb RD, Parker TS, Levine DM et al. Protein-free phospholipid emulsion treatment improved cardiopulmonary function and survival in porcine sepsis. Am J Physiol Regul Integr Comp Physiol 2003;284:R550-R557.
13. Hendriks HF, Veenstra J, van TA, Groener JE, Schaafsma G. Moderate doses of alcoholic beverages with dinner and postprandial high density lipoprotein composition. Alcohol Alcohol 1998;33:403-10.
Alcohol, HDL surface lipids and LPS response |
127
14. van der Gaag MS, van Tol A, Scheek LM et al. Daily moderate alcohol consumption increases serum paraoxonase activity; a diet-controlled, randomised intervention study in middle-aged men. Atherosclerosis 1999;147:405-10.
15. Rimm EB, Williams P, Fosher K, Criqui M, Stampfer MJ. Moderate alcohol intake and lower risk of coronary heart disease: meta-analysis of effects on lipids and haemostatic factors. BMJ 1999;319:1523-8.
16. Mukamal KJ, Jensen MK, Gronbaek M et al. Drinking frequency, mediating biomarkers, and risk of myocardial infarction in women and men. Circulation 2005;112:1406-13.
17. van der Gaag MS, van TA, Vermunt SH, Scheek LM, Schaafsma G, Hendriks HF. Alcohol consumption stimulates early steps in reverse cholesterol transport. J Lipid Res 2001;42:2077-83.
18. Hardardottir I, Grunfeld C, Feingold KR. Effects of endotoxin on lipid metabolism. Biochem Soc Trans 1995;23:1013-8.
19. Godin PJ, Fleisher LA, Eidsath A et al. Experimental human endotoxemia increases cardiac regularity: results from a prospective, randomized, crossover trial. Crit Care Med 1996;24:1117-24.
20. Andreasen AS, Krabbe KS, Krogh-Madsen R, Taudorf S, Pedersen BK, Moller K. Human endotoxemia as a model of systemic inflammation. Curr Med Chem 2008;15:1697-705.
21. U.S. Department of Health and Human Services and U.S. Department of Agriculture. Dietary Guidelines for Americans, 2005. Washington D.C.: Government Printing Office, 2005.
22. Bottcher M, Beck O, Helander A. Evaluation of a new immunoassay for urinary ethyl glucuronide testing. Alcohol Alcohol 2008;43:46-8.
23. Joosten MM, Beulens JW, Kersten S, Hendriks HF. Moderate alcohol consumption increases insulin sensitivity and ADIPOQ expression in postmenopausal women: a randomised, crossover trial. Diabetologia 2008;51:1375-81.
24. Lecomte E, Herbeth B, Paille F, Steinmetz J, Artur Y, Siest G. Changes in serum apolipoprotein and lipoprotein profile induced by chronic alcohol consumption and withdrawal: determinant effect on heart disease? Clin Chem 1996;42:1666-75.
25. Beulens JWJ, van den Berg R, Kok FJ, Helander A, Vermunt SHF, Hendriks HFJ. Moderate alcohol consumption and lipoprotein-associated phospholipase A2 activity. Nutrition, Metabolism and Cardiovascular Diseases 2008;18:539-44.
26. Beulens JW, Sierksma A, van TA et al. Moderate alcohol consumption increases cholesterol efflux mediated by ABCA1. J Lipid Res 2004;45:1716-23.
27. Sierksma A, Vermunt SH, Lankhuizen IM et al. Effect of moderate alcohol consumption on parameters of reverse cholesterol transport in postmenopausal women. Alcohol Clin Exp Res 2004;28:662-6.
28. The Emerging Risk Factors Collaboration. Major Lipids, Apolipoproteins, and Risk of Vascular Disease. JAMA 2009;302:1993-2000.
| Chapter 7
128
29. Berbee JF, Mooijaart SP, de Craen AJ et al. Plasma apolipoprotein CI protects against mortality from infection in old age. J Gerontol A Biol Sci Med Sci 2008;63:122-6.
30. Berbee JF, van der Hoogt CC, Kleemann R et al. Apolipoprotein CI stimulates the response to lipopolysaccharide and reduces mortality in gram-negative sepsis. FASEB J 2006;20:2162-4.
31. Sierksma A, Patel H, Ouchi N et al. Effect of moderate alcohol consumption on adiponectin, tumor necrosis factor-α, and insulin sensitivity. Diabetes Care 2004;27:184-9.
32. Beulens JW, van Loon LJ, Kok FJ et al. The effect of moderate alcohol consumption on adiponectin oligomers and muscle oxidative capacity: a human intervention study. Diabetologia 2007;50:1388-92.
33. Engeli S, Feldpausch M, Gorzelniak K et al. Association Between Adiponectin and Mediators of Inflammation in Obese Women. Diabetes 2003;52:942-7.
34. Hung J, McQuillan BM, Thompson PL, Beilby JP. Circulating adiponectin levels associate with inflammatory markers, insulin resistance and metabolic syndrome independent of obesity. Int J Obes (Lond) 2008;32:772-9.
35. Tsatsanis C, Zacharioudaki V, Androulidaki A et al. Adiponectin induces TNF-α and IL-6 in macrophages and promotes tolerance to itself and other pro-inflammatory stimuli. Biochemical and Biophysical Research Communications 2005;335:1254-63.
36. Schafer C, Parlesak A, Schutt C, Bode JC, Bode C. Concentrations of lipopolysaccharide-binding protein, bactericidal/permeability-increasing protein, soluble CD14 and plasma lipids in relation to endotoxaemia in patients with alcoholic liver disease. Alcohol Alcohol 2002;37:81-6.
37. Purohit V, Bode JC, Bode C et al. Alcohol, intestinal bacterial growth, intestinal permeability to endotoxin, and medical consequences: summary of a symposium. Alcohol 2008;42:349-61.
38. Schafer C, Greiner B, Landig J et al. Decreased endotoxin-binding capacity of whole blood in patients with alcoholic liver disease. J Hepatol 1997;26:567-73.
39. Heumann D, Lauener R, Ryffel B. The dual role of LBP and CD14 in response to Gram-negative bacteria or Gram-negative compounds. J Endotoxin Res 2003;9:381-4.
40. Kitchens RL, Thompson PA. Modulatory effects of sCD14 and LBP on LPS-host cell interactions. J Endotoxin Res 2005;11:225-9.
41. Amar J, Burcelin R, Ruidavets JB et al. Energy intake is associated with endotoxemia in apparently healthy men. Am J Clin Nutr 2008;87:1219-23.
42. Draisma A, Pickkers P, Bouw MP, van der Hoeven JG. Development of endotoxin tolerance in humans in vivo. Crit Care Med 2009;37:1261-7.
43. Astiz ME, Rackow EC, Still JG et al. Pretreatment of normal humans with monophosphoryl lipid A induces tolerance to endotoxin: a prospective, double-blind, randomized, controlled trial. Crit Care Med 1995;23:9-17.
Alcohol, HDL surface lipids and LPS response |
129
44. Erikstrup C, Ullum H, Pedersen BK. Short-term simvastatin treatment has no effect on plasma cytokine response in a human in vivo model of low-grade inflammation. Clin Exp Immunol 2006;144:94-100.
45. Watson AD, Berliner JA, Hama SY et al. Protective effect of high density lipoprotein associated paraoxonase. Inhibition of the biological activity of minimally oxidized low density lipoprotein. J Clin Invest 1995;96:2882-91.
46. Hudgins LC, Parker TS, Levine DM et al. A single intravenous dose of endotoxin rapidly alters serum lipoproteins and lipid transfer proteins in normal volunteers. J Lipid Res 2003;44:1489-98.
47. Starkie R, Ostrowski SR, Jauffred S, Febbraio M, Pedersen BK. Exercise and IL-6 infusion inhibit endotoxin-induced TNF-α production in humans. FASEB J 2003;02-0670fje.
48. Erridge C, Attina T, Spickett CM, Webb DJ. A high-fat meal induces low-grade endotoxemia: evidence of a novel mechanism of postprandial inflammation. Am J Clin Nutr 2007;86:1286-92.

130
131
Chapter 8
Short-term oral exposure to white wine transiently lowers serum free fatty acids
Michel M. Joosten Cees de Graaf
Annemarie Rietman Renger F. Witkamp Henk F.J. Hendriks
Appetite 2010 Aug;55(1):124-9
| Chapter 8
132
Background: Preingestive or cephalic phase responses, triggered by sensory stimulation of nutrients, influence the organism’s digestive and endocrine responses and substrate mobilization. Whether oral sensory stimulation with alcohol elicits cephalic phase responses is uncertain. Objective: To determine whether oral alcohol exposure, in the form of white wine, provokes cephalic phase responses in normal-weight and overweight subjects. Design: In a semi-randomized, crossover trial, eleven normal-weight (BMI 19-25 kg/m2) and eleven overweight (BMI 27-35 kg/m2) postmenopausal women sham-fed, after an overnight fast under three separate conditions four weeks apart, 41 g cake (750 kJ), 25 cL white wine (750 kJ; ~26 g alcohol) and 25 cL water. Blood was drawn prior to and for 30 min after two 3-minute episodes of modified sham feeding (MSF). Blood samples were analyzed for free fatty acid (FFA), triglyceride, glucose, pancreatic polypeptide (PP), insulin and alcohol concentrations. Results: Incremental area under the curves (IAUC) of FFA concentrations differed significantly (P < 0.001) between the three treatments but not between BMI categories (P = 0.11). After MSF with white wine, FFA concentrations dropped to a minimum of 77 ± 3% of baseline concentrations at t = 12 ± 2 min after baseline and returned to baseline after ~30 min, whereas after MSF with cake and water FFA concentrations gradually increased. IAUC of triglycerides, glucose, PP and insulin concentrations did not differ between the three treatments (All P > 0.05). Conclusions: Short-term oral white wine exposure substantially and temporarily decreases FFA concentrations suggesting a cephalic phase response of alcohol. This effect occurred regardless of BMI. Trial registration: Clinicaltrials.gov ID no.: NCT00652405.
Alcohol and the cephalic phase |
133
Introduction The digestion of food is generally being divided into the cephalic, gastric, and intestinal phases. Cephalic phase responses are physiologic changes in response to food cues such as thought, smell, sight and taste of palatable food. These preingestive responses are rapid (occurring within minutes after stimulation), transient (returning to near baseline within minutes) and relatively small compared to the magnitude achieved when food is actually being ingested (1). The main function of the cephalic phase may be essentially adaptive, preparing the digestive system for the reception, digestion and absorption of the nutrients from food (2).
The primary metabolic changes occurring during this phase are gallbladder contraction (3), gastric acid production (4), and stimulation of both the exocrine and endocrine pancreas (5). Its physiological relevance in response to meal ingestion becomes apparent when blocking (6) or bypassing (7) the cephalic phase, which has detrimental effects on postprandial glycemia and insulinemia. Moreover, modified sham feeding (MSF), a method to provoke cephalic phase responses, with fatty foods alters mobilization of free fatty acids (FFA), triglycerides and glucose in the postprandial state (8-12). These effects are absent when sham feeding with water (9;11).
Cephalic phase responses are thought to be mediated by the efferent component of the vagus nerve, which in turn induces changes in substrate utilization. Vagal stimulation can be measured indirectly by pancreatic polypeptide (PP) release after MSF (13). Sham feeding with foods rich in protein and fat and carbohydrates (13;14) indeed exert cephalic phase PP responses. Furthermore, oral fat (9;11;12) and carbohydrate exposure (15) have been shown to induce a cephalic phase insulin release.
Whether and to what extent tasting alcohol affects cephalic phase responses remains unclear. Since the cephalic phase plays a role in provoking physiological changes pivotal for food digestion, appetitive sensations (11;12) and food intake (14) it is important to know whether alcohol could exert a cephalic phase response (CPR). With this study we therefore wanted to investigate the effects on substrate mobilization and hormone release after oral white wine exposure. Methods The study used a semi-randomized, open-label, crossover design. It was part of an intervention in which subjects daily consumed white wine (~70 kcal/100 mL, ~26 g alcohol; Droë Steen; South Africa), followed by mineral water (Vittel, France) or vice versa. Subjects consumed these study substances for four weeks during dinner. Allocation to treatment order was randomized according to BMI category. The study was conducted at TNO (a Dutch acronym for applied scientific research) Quality of Life, in Zeist, the Netherlands. This study was conducted according to the guidelines laid down in the Declaration of Helsinki and all procedures involving human subjects were approved by an independent centralized ethics committee (METOPP; Tilburg, the Netherlands). Written

| Chapter 8
134
informed consent was obtained from all subjects. This trial is registered at clinicaltrail.gov as NCT00652405. Subjects We recruited 24 nonsmoking women from a pool of volunteers of TNO Quality of Life. We chose postmenopausal women to prevent possible effects of the menstrual cycle on CPR. Eligible subjects were apparently healthy, free of any medication use, had an absence of menses for at least 2 years, a BMI between 19 and 25 for normal-weight or 27 and 35 kg/m2 for overweight subjects and no family history of alcoholism. The overweight group had a BMI of 27 and higher to increase the potential contrast between the two BMI groups. BMI groups were matched for age and restraint eating score on the Dutch Eating Behavior Questionnaire (16) as differences may exit in cephalic phase response between restraint and unrestraint eaters (17). Experimental protocol Each subject was subjected to three experimental conditions 4 weeks apart from each other. The conditions were administered in a semi-counterbalanced order after a 10 h overnight fast: (a) sham-feeding cake (positive control), (b) sham-feeding 25 cL of water (negative control) and (c) sham-feeding 25 cL of white wine (13% vol). For logistic reasons the cake condition was always first. The order of sham feeding water or wine was the same as the treatment order of the intervention. All three stimuli were served at room temperature (isothermic). The energy content of the 41 g cake (Albert Heijn, The Netherlands; 5% protein, 41% carbohydrates and 54% fat) equaled the energy content of the 25 cL of white wine (~100% alcohol). High fat cake was chosen as it has been demonstrated to elicit a cephalic phase PP release (14).
Each test morning, an indwelling cannula was placed in the forearm for venous blood draws. During the experimental days subjects took, at t = 0 min (baseline), a bite or sip of the food, oral processed it without swallowing for as long as the stimulus felt comfortable in their mouth, and then expectorated the stimulus. Subjects repeated this procedure for a 3-min period in which half of the stimulus portion size was sham-fed. In a second 3-min period, from t = 4 min onwards, the other half of the stimulus was sham-fed. Taken together, a 6 min-stimulation period with a one min break for blood sampling was given. After each 3-min sham feed period, subjects were allowed to rinse their mouth once with water. Stimuli were weighed (Mettler Toledo, Switzerland) before and after sham feeding to check whether subjects had accidentally swallowed parts of the sham feed stimuli. Blood sampling for FFA, triglycerides glucose, PP and insulin took place at t = 0, 4, 8, 12, 16, 20 and 30 min. At t = 8 min additional blood and saliva were sampled to determine alcohol concentrations. Unstimulated saliva (to avoid possible CPR due to chewing) was collected for four minutes after t = 8 min.

Alcohol and the cephalic phase |
135
Blood and saliva sample analysis Blood samples were obtained from the anticubital vein of the forearm and collected in tubes containing clot activator for serum and in ice-chilled tubes containing or Potassium Ethylene Diamine Tetra Acid (K3EDTA) for plasma (Vacutainer Systems, Becton Dickinson, Plymouth, U.K.). Blood was centrifuged for 15 minutes at 2.000 g at 4°C, within 15 - 30 minutes after collection and stored at -80 °C. FFA, triglyceride, glucose and insulin determinations in serum were performed using Olympus analytical equipment and reagents. PP determinations in serum were performed using radioimmunoassay by using a commercially available kit (Euro-diagnostica, Sweden) with a detection limit of 3.1 pmol/L and intra-assay and inter-assay coefficient variations of 3.5% and 2.6% respectively. Alcohol concentrations in plasma and saliva were determined by headspace gas chromatography (18). The detection limit of the alcohol concentration in blood and saliva was 0.1 mmol/L. Concentrations below the detection limit were set at half the detection limit. Statistical analyses The rationale for the sample size was based on a previous study in women with a very similar experimental design to elicit a cephalic phase PP release (14). Cumulative changes in serum FFA, triglycerides, glucose, PP, and insulin responses were quantified as the incremental (delta from baseline) area under the 30 min time-concentration curve using the trapezoidal rule. Baseline values and incremental area under the curves (IAUCs) of each metabolite/hormone and alcohol concentrations were compared with a mixed analysis of variance (ANOVA) model that included terms for treatment, BMI category and their interaction. If a significant treatment effect occurred, a post hoc Tukey test was used and for IAUCs summary statistics such as time to peak / nadir (and percentage difference from each subject’s own baseline value (to compensate for baseline differences between normal-weight and overweight subjects) were computed. In case of a significant treatment effect, a responder was defined as having an increase or decrease of >14% from baseline serum concentration at two consecutive time points within 16 min after initiation of MSF. We used SAS statistical software package (SAS version 8, SAS Institute, Cary, NC, U.S.A.) to perform the statistical analyses. P values < 0.05 were considered statistical significant. Results are presented as mean (± SEM) unless otherwise specified. Results One normal-weight subject dropped out due to study-unrelated reasons, one overweight subject was left out of the analysis as she had swallowed parts of the sham feed stimuli on all three occasions. Overweight subjects had a significant higher BMI (mean ± standard deviation: 29.8 ± 2.6 vs. 22.8 ± 1.4 kg/m2; P < 0.0001) but did not differ in age (55.6 ± 3.0 vs. 56.0 ± 2.7 y; P = 0.82) or restraint eating score (2.7 ± 0.7 vs. 2.7 ± 0.7; P = 0.90) compared with normal-weight subjects respectively.

| Chapter 8
136
Tab
le 8
.1: S
erum
con
cent
ratio
ns o
f met
abol
ites a
nd h
orm
ones
at b
asel
ine
(t =
0) b
efor
e m
odifi
ed sh
am fe
edin
g ca
ke, w
ater
or w
hite
win
e in
no
rmal
-wei
ght (
N =
11)
and
ove
rwei
ght (
N =
11)
pos
tmen
opau
sal w
omen
afte
r an
over
nigh
t fas
t. W
hite
win
e Ove
rwei
ght
0.
65±
0.06
1.
70 ±
0.2
2 5.
73 ±
0.1
3
28.4
± 8
.0
65.2
± 6
.9
Dat
a ar
e ex
pres
sed
as m
ean
± SE
M. N
o in
tera
ctio
n ef
fect
s for
trea
tmen
t x B
MI c
ateg
ory
or m
ain
effe
cts f
or tr
eatm
ent a
t bas
elin
e w
ere
obse
rved
in m
etab
olite
s and
hor
mon
es,
all P
> 0
.05
(Mix
ed A
NO
VA
on
base
line
valu
es).
1 Sig
nific
ant m
ain
effe
ct fo
r BM
I cat
egor
y, P
< 0
.05
(Mix
ed A
NO
VA
on
base
line
valu
es).
Nor
mal
-wei
ght
0.
49 ±
0.0
6 1.
43 ±
0.2
2 5.
29 ±
0.1
3
23.7
± 8
.0
39.1
± 6
.9
Wat
er O
verw
eigh
t
0.62
± 0.
06
1.70
± 0
.22
5.57
± 0
.13
19
.8 ±
8.0
59
.6 ±
7.1
Nor
mal
-wei
ght
0.
44 ±
0.0
6 1.
36 ±
0.2
2 5.
19 ±
0.1
3
26.8
± 8
.0
44.3
± 6
.9
Cak
e O
verw
eigh
t
0.72
± 0.
06
1.71
± 0
.22
5.65
± 0
.13
24
.1 ±
8.0
64
.0 ±
6.9
Nor
mal
-wei
ght
0.
47 ±
0.0
6 1.
22 ±
0.2
2 5.
27 ±
0.1
3
28.7
± 8
.0
39.8
± 6
.9
Met
abol
ites
Fr
ee fa
tty a
cids
(mm
ol/L
)1
Trig
lyce
rides
(mm
ol/L
)
Glu
cose
(mm
ol/L
)1 H
orm
ones
Panc
reat
ic p
olyp
eptid
e (p
mol
/L)
In
sulin
(pm
ol/L
)1

Alcohol and the cephalic phase |
137
At baseline (t = 0 min) there were no differences in values of metabolites and hormones between the three treatments (Table 8.1). Overweight subjects had higher levels of FFA, glucose and insulin compared with normal-weight subjects at baseline (All P < 0.05). Expectorated stimuli weights and alcohol concentrations Stimuli weights after MSF increased by a mean of 13.9 ± 1.3 g after sham feeding cake, 15.8 ± 1.9 g after sham feeding white wine and 0.2 ± 1.3 g after sham feeding water due to the added weight of the saliva.
At t = 8 min, mean saliva (SAC) and blood alcohol concentrations (BAC) differed significantly between treatments (both P < 0.0001) but not between BMI categories (both P >0.80). SAC and BAC after wine exposure reached a mean of 152 ± 13 mmol/L and of 0.16 ± 0.02 mmol/L (Range: <0.1 - 0.44 mmol/L) respectively whereas no detectable alcohol levels were found after cake and water exposure (all <0.1 mmol/L). Three women (one normal-weight and two overweight women) had plasma alcohol levels below the detection limit (<0.1 mmol/L) at t = 8 min after MSF with white wine. Metabolites Mean serum FFA concentrations dropped after MSF with white wine and returned to near baseline values after MSF stopped whereas FFA concentrations after sham feeding cake and water resulted in a gradual increase over the 30 min time span (Figure 8.1). IAUC of serum FFA concentrations differed significantly (P < 0.001) between the three treatments. Post hoc analyses showed that IAUC of FFA after MSF with white wine differed significantly from IAUC of water (P < 0.001) and cake (P < 0.001), whereas water and cake did not differ (P = 0.79). The nadir of FFA concentrations after MSF white wine reached its minimum at t = 12 ± 2 min after baseline (12 ± 2 min for normal-weight and 12 ± 2 min for overweight women). At this time point, mean FFA concentrations dropped to 77 ± 3% of baseline values (79 ± 5% for normal-weight and 74 ± 4% for overweight women). Eighty-two percent (18/22; 9 normal- and nine overweight subjects) of the women could be marked as a responder after oral alcohol exposure (based on a drop of >14% in basal FFA concentration at two consecutive time points within 16-min after MSF). The effect even occurred in two of the three subjects who had no detectable blood alcohol concentrations at t = 8 min. Only 5% (1/22) and 0% (0/22) of the subjects showed such a decrease after orosensory stimulation with water and cake respectively. No main effect for BMI category (P = 0.11) or interaction effect for BMI category x treatment (Pinteraction = 0.35) were observed (Figure 8.1).
Mean serum triglyceride concentrations after the three MSF treatments remained close to fasting concentrations (Figure 1). IAUC of serum triglycerides concentrations did not differ between the three treatments (P = 0.66) and BMI categories (P = 0.72). Also no interaction effect for BMI category x treatment (Pinteraction = 0.51) was observed.
Mean serum glucose concentrations after the three MSF treatments remained close to fasting concentrations (Figure 8.1). IAUC of serum glucose concentrations did not show
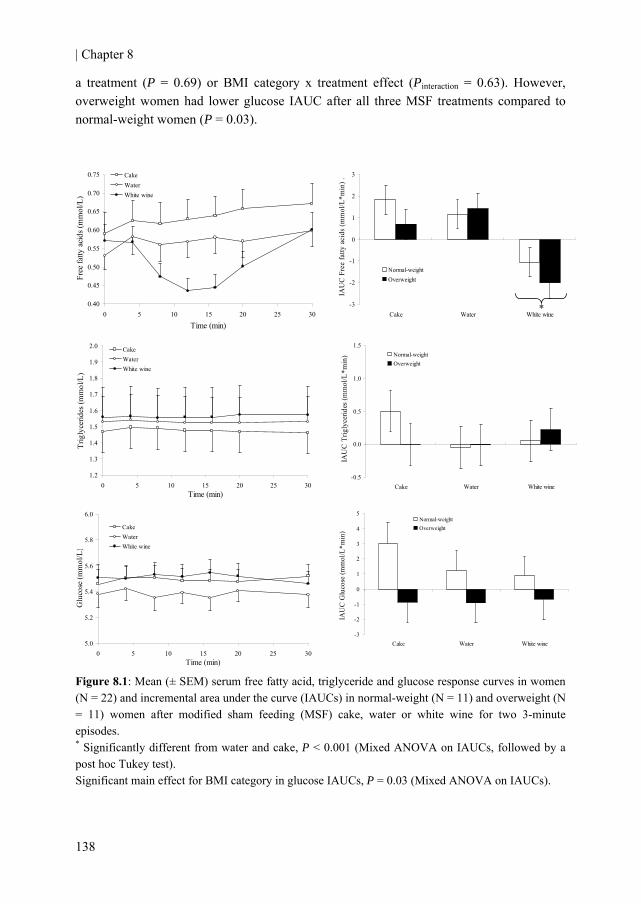
| Chapter 8
138
a treatment (P = 0.69) or BMI category x treatment effect (Pinteraction = 0.63). However, overweight women had lower glucose IAUC after all three MSF treatments compared to normal-weight women (P = 0.03).
0.40
0.45
0.50
0.55
0.60
0.65
0.70
0.75
0 5 10 15 20 25 30
Time (min)
Free
fatty
aci
ds (m
mol
/L)
CakeWaterWhite wine
1.2
1.3
1.4
1.5
1.6
1.7
1.8
1.9
2.0
0 5 10 15 20 25 30Time (min)
Trig
lyce
rides
(mm
ol/L
)
CakeWaterWhite wine
-0.5
0.0
0.5
1.0
1.5
Cake Water White wine
IAU
C T
rigly
cerid
es (m
mol
/L*m
in) Normal-weight
Overweight
5.0
5.2
5.4
5.6
5.8
6.0
0 5 10 15 20 25 30Time (min)
Glu
cose
(mm
ol/L
)
CakeWaterWhite wine
-3
-2
-1
0
1
2
3
4
5
Cake Water White wine
IAU
C G
luco
se (m
mol
/L*m
in)
Normal-weightOverweight
Figure 8.1: Mean (± SEM) serum free fatty acid, triglyceride and glucose response curves in women (N = 22) and incremental area under the curve (IAUCs) in normal-weight (N = 11) and overweight (N = 11) women after modified sham feeding (MSF) cake, water or white wine for two 3-minute episodes. * Significantly different from water and cake, P < 0.001 (Mixed ANOVA on IAUCs, followed by a post hoc Tukey test). Significant main effect for BMI category in glucose IAUCs, P = 0.03 (Mixed ANOVA on IAUCs).
-3
-2
-1
0
1
2
3
Cake Water White wine
IAU
C F
ree
fatty
aci
ds (m
mol
/L*m
in) .
Normal-weightOverweight
*
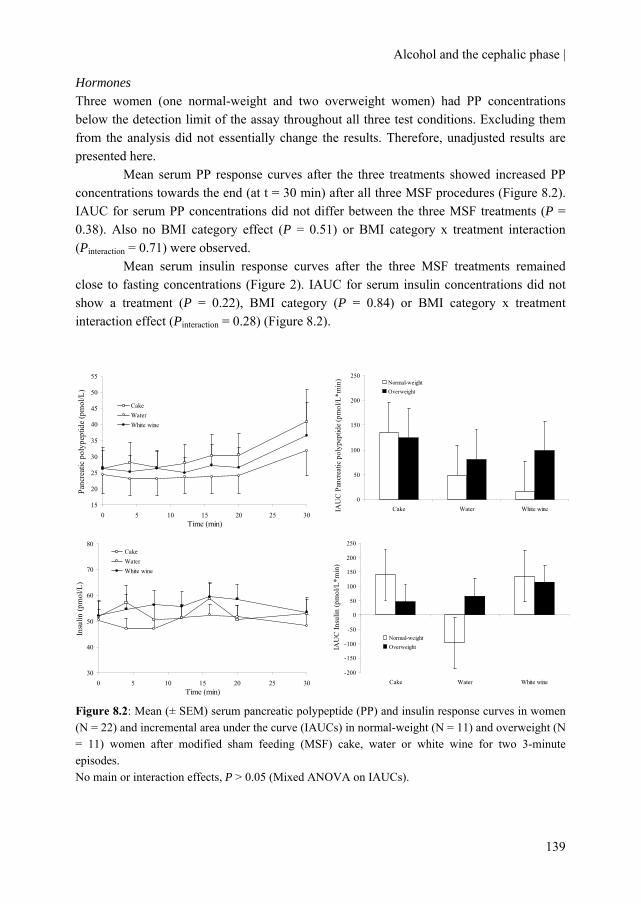
Alcohol and the cephalic phase |
139
Hormones Three women (one normal-weight and two overweight women) had PP concentrations below the detection limit of the assay throughout all three test conditions. Excluding them from the analysis did not essentially change the results. Therefore, unadjusted results are presented here.
Mean serum PP response curves after the three treatments showed increased PP concentrations towards the end (at t = 30 min) after all three MSF procedures (Figure 8.2). IAUC for serum PP concentrations did not differ between the three MSF treatments (P = 0.38). Also no BMI category effect (P = 0.51) or BMI category x treatment interaction (Pinteraction = 0.71) were observed.
Mean serum insulin response curves after the three MSF treatments remained close to fasting concentrations (Figure 2). IAUC for serum insulin concentrations did not show a treatment (P = 0.22), BMI category (P = 0.84) or BMI category x treatment interaction effect (Pinteraction = 0.28) (Figure 8.2).
15
20
25
30
35
40
45
50
55
0 5 10 15 20 25 30Time (min)
Panc
reat
ic p
olyp
eptid
e (p
mol
/L) .
CakeWaterWhite wine
0
50
100
150
200
250
Cake Water White wineIAU
C P
ancr
eatic
pol
ypep
tide
(pm
ol/L
*min
) Normal-weightOverweight
30
40
50
60
70
80
0 5 10 15 20 25 30Time (min)
Insu
lin (p
mol
/L)
CakeWaterWhite wine
-200
-150
-100
-50
0
50
100
150
200
250
Cake Water White wine
IAU
C In
sulin
(pm
ol/L
*min
)
Normal-weightOverweight
Figure 8.2: Mean (± SEM) serum pancreatic polypeptide (PP) and insulin response curves in women (N = 22) and incremental area under the curve (IAUCs) in normal-weight (N = 11) and overweight (N = 11) women after modified sham feeding (MSF) cake, water or white wine for two 3-minute episodes. No main or interaction effects, P > 0.05 (Mixed ANOVA on IAUCs).
| Chapter 8
140
Discussion The present study demonstrates that short-term oral exposure to white wine substantially and robustly decreases serum FFA concentrations, irrespective of BMI. This effect was rapid (occurring within minutes of MSF), transient (returning to baseline after ~20 min when MSF stopped) and small (relative to the magnitude achieved when alcohol is actually being ingested; 23% reduction compared to 47% reduction (19) in FFA concentrations), indicating a cephalic phase response (1). No alterations were observed in other metabolites or hormones.
To further ascertain that the decrease in FFA concentrations was a cephalic effect rather than a gastric or intestinal effect, several additional markers were evaluated. The weight, albeit crude, before and after mastification was determined, which indicated that little or none of the white wine was inadvertently swallowed during MSF. Furthermore, alcohol levels in saliva and plasma were measured. Despite a very small increase in mean plasma alcohol concentrations they remained ~60 times lower compared to ingestion of a similar amount of alcohol (19). Furthermore, triglyceride and glucose concentrations remained close to fasting concentrations after MSF with wine (Figure 8.1). It is well-documented that acute alcohol ingestion not only lowers FFA (19-22) but also strongly elevates triglyceride (19;23-25) and lowers glucose concentrations (23;26). We did not notice an increase in triglyceride or a decrease in glucose concentrations after MSF with alcohol. It thus seems unlikely that the relatively low and clinically irrelevant blood alcohol concentration could have evoked this substantial drop in FFAs without affecting triglycerides or glucose.
Despite evidence of a substantial decrease in FFA concentrations after MSF with wine, we did not document any changes in vagal activity. This is in line with a recent study in which MSF with both sweet and salty solutions did not increase PP (27). The lack of significant increases in cephalic phase PP levels in response to liquid stimuli suggests that in humans, chewing may be a required stimulus for vagal activation. However, also after MSF with cake, a stimulus that needs to be chewed, no significant increase in PP release was observed in our study. Prior observations showed that chewing gum, whether unflavored or flavored with a non-nutritive sweetener or the sweetener paired with a mint flavor, also did not significantly increase PP levels (27). Perhaps the amount of MSF stimuli might have been too little (14) and or the duration of MSF might have been too short (12;28) for a significant PP release. In three women serum PP concentrations even failed to reach the detection limit of the assay throughout all three treatments. This finding is in accordance with observations of others where healthy adults also had PP concentrations below the detection limit of the assay (29). Furthermore, in another study some men and women even lacked PP responses after swallowing a meal (13). We observed increased PP concentrations at the end of all three treatments in our study. This indicated that PP secreting cells were intact in our subjects and it also provided evidence that the analytical method was able to measure changes in PP concentrations.

Alcohol and the cephalic phase |
141
Whatever the mechanism from wine in the oropharyngeal cavity may be, it must elicit responses that increase FFA absorption from the bloodstream or decrease FFA supply from the adipose tissue to account for the decline in FFA concentrations after oral alcohol exposure. Increased storage of FFA is under control of acylation-stimulating protein (ASP). This stimulates storage of free fatty acids (FFA) as triglycerides in adipose tissue, but also increases glucose uptake (30). Since no changes in glucose were observed after MSF with wine, it seems unlikely that increased ASP activity could have explained this finding. A decreased supply of FFAs via lipoprotein lipase, out of chylomicron triglycerides is not very likely to be the cause, as this action predominantly occurs in the postprandial period (31). A plausible mechanism may be due to the altered activity of hormone-sensitive lipase (HSL), an enzyme responsible for hydrolysis of stored triacylglycerols in adipose tissue (32). HSL activity in adipose tissue is known to also be under control of the vagal nerve (33). Lowered activity of HSL results in a reduction in the rate of FFA release from adipose tissue stores.
Given the facts that the drop in FFA is preingestive and that the FFA response curve shows all characteristics of a cephalic phase response based on the magnitude and time span in which the effect occurred one can consider the effect cephalic rather than a gastric or intestinal. Furthermore, irrespective whether the effect is a ‘true’ cephalic phase effect or not, it still is of physiological relevance as the decrease in FFAs was substantial, robust and it occurred after stimulation durations likely to be encountered in normal drinking (~6 min). It implies that mere oral wine exposure without ingestion already triggers metabolism and may serve as a feed-forward system to optimize the absorption and utilization of dietary constituents such as alcohol.
As cephalic phase responses are known to affect satiation (34) and satiety (11;12) the sudden drop in FFA after oral wine exposure might possibly be associated with increased appetite sensations and energy intake as observed after alcohol consumption (35).
The acute drop in FFAs after oral exposure might also improve insulin sensitivity as observed after both acute alcohol consumption (21) and prolonged consumption (36). Acute decreases in serum FFA concentrations are directly related to improved insulin signaling (37) and glucose metabolism (38). It has been proposed that acute FFA reductions could reflect the improved insulin sensitivity observed after acute moderate alcohol consumption (21;39).
This study has only been executed with white wine. Whether similar findings will be found with other alcoholic beverages has yet to be investigated. It seems likely, however, that this would be the case for several reasons. FFA concentrations are decreased after acute alcohol consumption per se (19-22), and not only after white wine consumption. Secondly, other physiological effects described after alcohol consumption (e.g. increase in HDL-cholesterol (40)) are observed for all three types of alcoholic beverages.
Strong points of the study are its crossover design, its relatively large and homogenous group of subjects and the incorporation of both hormones and metabolites. Several limitations warrant consideration. The white wine differed in structure (liquid vs.
| Chapter 8
142
solid compared to the cake) and energy content (compared to water). However, differences in structure or amount of calories between stimuli are unlikely to have caused this robust and substantial drop in FFA concentrations after MSF with wine since both after sham feeding cake and water FFA concentrations gradually increased; a process that naturally occurs with prolonged fasting. Another control might have been a non-alcoholic wine or ethanol in water. We choose cake rather than an ethanol-related control solely to have an expected positive control for cephalic phase PP release.
We conclude that mere oral exposure to white wine is capable of reducing serum free fatty acid concentrations, regardless of BMI. Furthermore, this study demonstrates that stimulation durations likely to be encountered in normal drinking are sufficient to elicit such a temporarily but substantial and robust response. Further study of the cephalic phase response of alcohol, also in other beverages, on its physiological implications such as appetite and insulin sensitivity is warranted. Authors’contributions MMJ designed the protocol, interpreted the data, and drafted the manuscript. MMJ and AR performed the statistical analysis. CdG and RFW provided significant advice during designing the protocol and writing of the manuscript. HFJH was involved in the design of the protocol, provided significant advice during writing of the manuscript and obtained funding. The authors have no conflict of interest with respect to the work described in the manuscript. Acknowledgements This work is partially supported by the Dutch Foundation for Alcohol Research (SAR). We gratefully acknowledge the volunteers for participation; Henriëtte Fick, Desiree Rouwendaal, Ineke Klöpping, Angelique Speulman, Jolanda Jansen, Inge van den Assum, José Jacobs, Eric Busink, Christel Hoeflaken for practical work during the study; Jan Catsburg, Wouter Vaes, Marola von Lipzig, Lisette Bok, and Peter Eriksson for laboratory analyses; Ellen Dutman for data management; and Sabina Bijlsma for statistical support.
Alcohol and the cephalic phase |
143
References 1. Mattes RD. Physiologic Responses to Sensory Stimulation by Food: Nutritional Implications.
Journal of the American Dietetic Association 1997;97:406-13.
2. Zafra MA, Molina F, Puerto A. The neural/cephalic phase reflexes in the physiology of nutrition. Neuroscience & Biobehavioral Reviews 2006;30:1032-44.
3. Witteman BJM, Jebbink MCW, Hopman WPM, Masclee AAM, Lamers CBHW, Jansen JBMJ. Gallbladder responses to modified sham feeding: effects of the composition of a meal. Journal of Hepatology 1993;19:465-9.
4. Feldman M, Richardson CT. Role of thought, sight, smell, and taste of food in the cephalic phase of gastric acid secretion in humans. Gastroenterology 1986;90:428-33.
5. Konturek SJ, Konturek JW. Cephalic phase of pancreatic secretion. Appetite 2000;34:197-205.
6. Ahren B, Holst JJ. The cephalic insulin response to meal ingestion in humans is dependent on both cholinergic and noncholinergic mechanisms and is important for postprandial glycemia. Diabetes 2001;50:1030-8.
7. Teff KL, Engelman K. Oral sensory stimulation improves glucose tolerance in humans: effects on insulin, C-peptide, and glucagon. Am J Physiol 1996;270:R1371-R1379.
8. Mattes RD. Oral fat exposure alters postprandial lipid metabolism in humans. Am J Clin Nutr 1996;63:911-7.
9. Robertson MD, Jackson KG, Williams CM, Fielding BA, Frayn KN. Prolonged effects of modified sham feeding on energy substrate mobilization. Am J Clin Nutr 2001;73:111-7.
10. Robertson MD, Mason AO, Frayn KN. Timing of vagal stimulation affects postprandial lipid metabolism in humans. Am J Clin Nutr 2002;76:71-7.
11. Smeets AJ, Westerterp-Plantenga MS. Satiety and substrate mobilization after oral fat stimulation. Br J Nutr 2006;95:795-801.
12. Heath RB, Jones R, Frayn KN, Robertson MD. Vagal stimulation exaggerates the inhibitory ghrelin response to oral fat in humans. J Endocrinol 2004;180:273-81.
13. Witteman BJ, Edwards-Teunissen K, Hopman WP et al. Nutrient-specific effects of modified sham feeding on pancreatic polypeptide release. Eur J Clin Nutr 1994;48:556-60.
14. Crystal SR, Teff KL. Tasting fat: cephalic phase hormonal responses and food intake in restrained and unrestrained eaters. Physiol Behav 2006;89:213-20.
15. Just T, Pau HW, Engel U, Hummel T. Cephalic phase insulin release in healthy humans after taste stimulation? Appetite 2008;51:622-7.
16. van Strien T, Frijters J, Bergers G, Defares P. The Dutch Eating Behavior Questionnaire (DEBQ) for assessment of restrained, emotional, and external eating behavior. International journal of eating disorders 1986;5:295-315.
| Chapter 8
144
17. Teff KL, Engelman K. Palatability and dietary restraint: effect on cephalic phase insulin release in women. Physiol Behav 1996;60:567-73.
18. Sarkola T, Dahl H, Eriksson CJP, Helander A. Urinary ethyl glucuronide and 5-hydroxytryptophol levels during repeated ethanol ingestion in healthy human subjects. Alcohol Alcohol 2003;38:347-51.
19. Siler SQ, Neese RA, Hellerstein MK. De novo lipogenesis, lipid kinetics, and whole-body lipid balances in humans after acute alcohol consumption. Am J Clin Nutr 1999;70:928-36.
20. Avogaro A, Sambataro M, Marangoni A et al. Moderate alcohol consumption, glucose metabolism and lipolysis: the effect on adiponectin and tumor necrosis factor α. J Endocrinol Invest 2003;26:1213-8.
21. Avogaro A, Watanabe RM, Dall'Arche A, Vigili De Kreutzenberg S, Tiengo A, Pacini G. Acute Alcohol Consumption Improves Insulin Action Without Affecting Insulin Secretion in Type 2 Diabetic Subjects. Diabetes Care 2004;27:1369-74.
22. Fielding BA, Reid G, Grady M, Humphreys SM, Evans K, Frayn KN. Ethanol with a mixed meal increases postprandial triacylglycerol but decreases postprandial non-esterified fatty acid concentrations. Br J Nutr 2000;83:597-604.
23. Greenfield JR, Samaras K, Hayward CS, Chisholm DJ, Campbell LV. Beneficial postprandial effect of a small amount of alcohol on diabetes and cardiovascular risk factors: modification by insulin resistance. J Clin Endocrinol Metab 2005;90:661-72.
24. Dalgaard M, Thomsen C, Rasmussen BM, Holst JJ, Hermansen K. Ethanol with a mixed meal decreases the incretin levels early postprandially and increases postprandial lipemia in type 2 diabetic patients. Metabolism 2004;53:77-83.
25. Raben A, gerholm-Larsen L, Flint A, Holst JJ, Astrup A. Meals with similar energy densities but rich in protein, fat, carbohydrate, or alcohol have different effects on energy expenditure and substrate metabolism but not on appetite and energy intake. Am J Clin Nutr 2003;77:91-100.
26. Brand-Miller JC, Fatima K, Middlemiss C et al. Effect of alcoholic beverages on postprandial glycemia and insulinemia in lean, young, healthy adults. Am J Clin Nutr 2007;85:1545-51.
27. Teff KL. Cephalic phase pancreatic polypeptide responses to liquid and solid stimuli in humans. Physiol Behav 2010;99:317-23.
28. Robertson MD, Mason AO, Frayn KN. Timing of vagal stimulation affects postprandial lipid metabolism in humans. Am J Clin Nutr 2002;76:71-7.
29. Bruce DG, Storlien LH, Furler SM, Chisholm DJ. Cephalic phase metabolic responses in normal weight adults. Metabolism 1987;36:721-5.
30. Havel PJ. Update on Adipocyte Hormones: Regulation of Energy Balance and Carbohydrate/Lipid Metabolism. Diabetes 2004;53:S143-S151.
31. Coppack SW, Evans RD, Fisher RM et al. Adipose tissue metabolism in obesity: lipase action in vivo before and after a mixed meal. Metabolism 1992;41:264-72.
Alcohol and the cephalic phase |
145
32. Kraemer FB, Shen WJ. Hormone-sensitive lipase: control of intracellular tri-(di-)acylglycerol and cholesteryl ester hydrolysis. J Lipid Res 2002;43:1585-94.
33. Kreier F, Fliers E, Voshol PJ et al. Selective parasympathetic innervation of subcutaneous and intra-abdominal fat--functional implications. J Clin Invest 2002;110:1243-50.
34. Smeets AJ, Westerterp-Plantenga MS. Oral exposure and sensory-specific satiety. Physiol Behav 2006;89:281-6.
35. Caton SJ, Marks JE, Hetherington MM. Pleasure and alcohol: manipulating pleasantness and the acute effects of alcohol on food intake. Physiology & Behavior 2005;84:371-7.
36. Joosten MM, Beulens JW, Kersten S, Hendriks HF. Moderate alcohol consumption increases insulin sensitivity and ADIPOQ expression in postmenopausal women: a randomised, crossover trial. Diabetologia 2008;51:1375-81.
37. Belfort R, Mandarino L, Kashyap S et al. Dose-response effect of elevated plasma free fatty acid on insulin signaling. Diabetes 2005;54:1640-8.
38. Shah P, Vella A, Basu A et al. Elevated free fatty acids impair glucose metabolism in women: decreased stimulation of muscle glucose uptake and suppression of splanchnic glucose production during combined hyperinsulinemia and hyperglycemia. Diabetes 2003;52:38-42.
39. Tomie Furuya D, Binsack R, Emy Onishi M, Monteiro Seraphim P, Fabres Machado U. Low ethanol consumption induces enhancement of insulin sensitivity in liver of normal rats. Life Sciences 2005;77:1813-24.
40. van der Gaag MS, van Tol A, Scheek LM et al. Daily moderate alcohol consumption increases serum paraoxonase activity; a diet-controlled, randomised intervention study in middle-aged men. Atherosclerosis 1999;147:405-10.

146
147
Chapter 9
General discussion
| Chapter 9
148
The research described in this thesis aimed to contribute to a better understanding of the association between alcohol consumption and type 2 diabetes risk that has previously been found. To this end, two main research strategies were followed. First observational studies were applied to extend the evidence of this relation. Second, underlying physiological mechanisms were further investigated in controlled study settings.
This final chapter starts with a brief overview of the main findings, followed by a section on methodological considerations, a reflection of the findings and comparison with other studies. Finally, implications for public health and recommendations for future research are given. Main findings The main findings of the observational and experimental studies conducted and described within this thesis are summarized in Table 9.1. Prospective cohort studies The effect of change in alcohol consumption over time on diabetes risk depended on initial consumption level in U.S. middle-aged men. Only among initially rare and light drinkers, increases in alcohol consumption over time were associated with increased levels of total adiponectin and with a lower risk of type 2 diabetes. When considering these endpoints, men already consuming alcohol in moderation did not gain further health benefit from increased consumption. In line with data obtained from the general population, we found that moderate alcohol consumption is associated with a lowered risk of type 2 diabetes in Dutch men and women already at lower risk due to favorable lifestyle characteristics. In these subjects who carry a relatively low risk of developing diabetes on the basis of other lifestyle characteristics, alcohol consumption provided a considerably further decrease (about 40% or more) in the risk of diabetes. Randomized controlled trials The randomized intervention studies carried out showed that moderate alcohol consumption increased both total and high-molecular weight adiponectin levels by about 10% compared to abstention. These effects were not depending on beverage type (beer, wine or spirits), age (young and middle-aged subjects) or gender. Moreover, the increase in adiponectin concentrations could be attributed to increased de novo syntheses in adipose tissue as intervention-induced changes in total adiponectin protein levels correlated to changes in expression of the gene encoding adiponectin. Furthermore, the weekly alterations in both total and HMW adiponectin occurred concomitantly and were evident within three weeks of moderate alcohol consumption compared with abstention.
Among postmenopausal women, we observed favorable changes in fasting insulin and triglyceride levels after six weeks of moderate alcohol consumption but not in younger women and men after three and four weeks, respectively. An integrated approach of large-

General discussion |
149
scale profiling of proteins and genes revealed that moderate alcohol consumption for four weeks altered gene expression profiles of white blood cells and circulating proteins both related to immune response and lipid metabolism. However, we could not confirm that four weeks of moderate alcohol consumption resulted in a lower inflammatory response induced by a low dose in vivo endotoxin bolus, despite a 10% increase in HDL-cholesterol and several HDL-associated apolipoproteins in men. Finally, we found that short-term oral exposure of white wine without swallowing provoked a substantial decrease in circulating free fatty acid concentrations in normal-weight and overweight postmenopausal women. The free fatty acid concentrations returned to near baseline values in less than half an hour after the exposure to the wine stopped. Methodological considerations This section discusses methodological considerations which are important to take into account when interpreting the results. The research described in this thesis consisted of prospective cohort studies and randomized controlled trials, both subject to certain strengths and limitations. Although these have been pointed out in the discussion sections of each chapter, several general but iterative aspects will be briefly commented on to put the observed findings into perspective. Prospective cohort studies Compared with randomized trials results of prospective cohort studies can be easily generalized as they are based on the natural development of a trait in a real-life setting. The observational studies described in this thesis had several strengths, such as a prospective and long follow-up, large samples sizes, and verified cases of a hard end point: incident type 2 diabetes. However, there are, as with any prospective studies, certain limitations. In the following section some limitations specifically of interest in prospective studies on alcohol consumption will be addressed. Reference group One of the concerns related to observational studies with alcohol is also known as the "sick-quitter" hypothesis. It was proposed by Shaper and colleagues in 1988 (1) and substantiated later (2;3). This hypothesis argues that abstainers are an inappropriate control population because at least some of these people may abstain because of illness or former alcohol abuse or because alcohol interacts with prescription drugs they are taking. Obviously, comparisons of healthy drinkers with abstainers who take prescription drugs or who have underlying illnesses that raise one's risk for chronic diseases will produce a biased result in favor of the alcohol-consuming subjects. Because an individual’s health status informs such a decision, comparing current with former drinkers can be biased. This “sick-quitter” effect may also explain a small portion of the benefit attributed to alcohol in some studies on type

| Chapter 9
150
Tab
le 9
.1: S
umm
ary
of th
e m
ain
findi
ngs o
f the
pro
spec
tive
coho
rt st
udie
s and
rand
omiz
ed c
ross
over
tria
ls d
escr
ibed
in th
is th
esis
.
Est
imat
e (9
5% C
I)1
0.75
(0.6
2, 0
.90)
2
0.78
(0.6
0, 1
.00)
1.2 μg
/mL
(0.6
, 1.8
)
0.56
(0.3
2, 1
.00)
-1
1.9%
(-22
.1, -
1.6)
-8
.2%
(-15
.9 -0
.3)
10.6
% (6
.5, 1
4.7)
15
.4%
(1.4
, 29.
4 )
27.7
% (2
.8, 5
8.2)
8.
6 (3
.0, 1
4.2)
-1
3.8
(-30
.7, 3
.1)
-4.0
% (-
9.3,
1.3
) -3 -3
Mea
sure
Haz
ard
ratio
Haz
ard
ratio
Mea
n in
crem
ent
Haz
ard
ratio
M
ean
diff
eren
ce
Mea
n di
ffer
ence
M
ean
diff
eren
ce
Mea
n di
ffer
ence
Mea
n di
ffer
ence
M
ean
diff
eren
ce
Mea
n di
ffer
ence
M
ean
diff
eren
ce
Net
wor
k N
etw
ork
Out
com
e
Ver
ified
cas
es o
f inc
iden
t ty
pe 2
dia
bete
s (N
= 1
,905
)
Ver
ified
cas
es o
f inc
iden
t ty
pe 2
dia
bete
s (N
= 1
,905
)
Tota
l adi
pone
ctin
Ver
ified
cas
es o
f inc
iden
t ty
pe 2
dia
bete
s (N
= 6
97)
H
OM
A-I
R
Trig
lyce
rides
To
tal a
dipo
nect
in
HM
W a
dipo
nect
in
Adi
pose
mR
NA
ad
ipon
ectin
leve
ls
To
tal a
dipo
nect
in
IL-1
rece
ptor
ago
nist
IL
-18
Imm
une
resp
onse
PP
ARα
Bev
erag
e ty
pe a
nd a
mou
nt
A
lcoh
ol: i
ncre
ase
from
<5.
0 to
5.
0-29
.9 g
/day
with
in 4
yea
rs
Alc
ohol
: inc
reas
e of
7.5
g/d
ay
with
in 4
yea
rs
Alc
ohol
: inc
reas
e of
7.5
g/d
ay
with
in 4
yea
rs
Alc
ohol
: men
: 5.0
-29.
9 g/
day
wom
en: 5
.0-1
4.9
g/da
y
Whi
te w
ine:
25
g al
coho
l/day
V
odka
: 30
g al
coho
l/day
Dur
atio
n Pr
ospe
ctiv
e co
hort
stud
ies
20 y
ears
4 ye
ars
13 y
ears
Ran
dom
ized
cro
ssov
er tr
ials
6 w
eeks
4
wee
ks
Popu
latio
n
38,0
31 m
iddl
e-ag
ed m
en
697
mid
dle-
aged
men
35,6
25 m
en a
nd
wom
en
36 p
ost-
men
opau
sal
wom
en
24 y
oung
men
Cha
pter
2 2 2 3 4 4 4 4 4 5 5 5 5 5

General discussion |
151
8.2%
(2.5
, 13.
9)
8.2%
(1.0
, 15.
4)
-0.1
% (-
3.8,
3.6
)
10.3
% (5
.6, 1
5.0)
11
.9%
(6.1
, 17.
7 )
14.5
% (-
8.0,
37.
0)4
1.9%
(-5.
3, 9
.2) 4
-20.
3%
(-30
.3, -
10.4
)5
AU
C, A
rea
unde
r the
cur
ve; C
I, C
onfid
ence
inte
rval
; HD
L, H
igh-
dens
ity li
popr
otei
n; H
OM
A-I
R, H
omeo
stas
is m
odel
ass
essm
ent o
f ins
ulin
resi
stan
ce; H
MW
, Hig
h-m
olec
ular
w
eigh
t; PP
ARα,
Per
oxis
ome
prol
ifera
tor-
activ
ated
rece
ptor
alp
ha; T
NF-α,
Tum
or n
ecro
sis f
acto
r alp
ha; W
BC
, whi
te b
lood
cel
ls.
1 Alc
ohol
con
sum
ptio
n co
nditi
on v
s. no
alc
ohol
con
sum
ptio
n co
nditi
on.
2 vs.
alco
hol c
onsu
mpt
ion
<5.0
g/d
ay.
3 Net
wor
ks b
ased
on
gene
s tha
t wer
e si
gnifi
cant
ly d
iffer
ent e
xpre
ssed
bet
wee
n tre
atm
ents
. 4 A
fter a
n in
viv
o en
doto
xin
bolu
s (0.
06 n
g/kg
bod
y w
eigh
t).
5 A
fter m
odifi
ed sh
am-f
eedi
ng o
f win
e co
mpa
red
with
wat
er.
Mea
n di
ffer
ence
M
ean
diff
eren
ce
Mea
n di
ffer
ence
Mea
n di
ffer
ence
M
ean
diff
eren
ce
Mea
n di
ffer
ence
Mea
n di
ffer
ence
Mea
n di
ffer
ence
Tota
l adi
pone
ctin
H
MW
adi
pone
ctin
H
MW
/ to
tal a
dipo
nect
in
H
DL-
chol
este
rol
Apo
lipop
rote
in A
-I
AU
C6
hour
s TN
F-α
AU
C6
hour
s tot
al W
BC
AU
C30
min
free
fatty
aci
ds
Bee
r: 26
g a
lcoh
ol/d
ay
Vod
ka: 3
0 g
alco
hol/d
ay
Whi
te w
ine:
25
g of
alc
ohol
3 w
eeks
4 w
eeks
6 m
inut
es
24 p
re-
men
opau
sal
wom
en
22 y
oung
men
22 p
ost-
men
opau
sal
wom
en
6 6 6 7 7 7 7 8

| Chapter 9
152
2 diabetes as shown in the meta-analysis by Baliunas and colleagues in which they found lower risk reductions when only lifelong abstainers were included in the reference group (4). Our results, however, are not likely to be influenced by such bias. In the Dutch cohort, we used lifelong abstainers as referent. In this particular study, former drinker and thus potential ‘sick-quitters’ were included in the light drinking category. In parts of the analyses of changes in alcohol consumption we used current stable drinkers as a referent category instead of current non drinkers thereby bypassing this potential bias. Furthermore, in sensitivity analyses we removed current nondrinkers (which include people who might have given up drinking for health reasons) with minimal effect on the risk estimates. Therefore it is unlikely that our results are biased by the effect of sick-quitters. Confounding The results presented could be in part influenced by differences in (lifestyle) factors other than alcohol consumption that are associated with both exposure and disease but that do not lie in the causal pathway between the exposure and the outcome, i.e. confounding. In general, moderate drinkers tend to be leaner and eat better, exercise more and have a higher social economic status (5;6). However, drinkers are also more likely to be smokers and smoking is a risk factor for diabetes. Thus, it is overly simplistic to suggest that alcohol consumption is completely intertwined with a healthy lifestyle. In the two cohort studies presented, we indeed noted that moderate drinkers were likely to exercise and smoke more and were less likely to have a family history of diabetes. Also among females, but not among males, moderate drinkers tended to be leaner than abstainers. Finally, moderate drinkers were higher educated in the Dutch cohort. However, in the U.S. cohort all men were health professionals (e.g. dentists, optometrists, osteopaths, pharmacists, podiatrists, and veterinarians) and thus highly educated, which substantially reduced the potential confounding due to social economic status in this group. We therefore adjusted for a large number of important risk factors of type 2 diabetes such as age, body mass index (BMI), physical activity, smoking, family history of diabetes and several nutritional factors in both studies.
In the observational study on alcohol consumption and lifestyle factors among Dutch men and women, we examined the association of alcohol intake with risk of type 2 diabetes in strata of separate lifestyle behaviors based on body mass index, physical activity level, smoking, and adherence to a healthy diet and in strata of combined low-risk lifestyle behaviors. In the separate strata of each of the four individual lifestyle behaviors and in the strata of joint lifestyle behaviors, moderate alcohol consumers had consistently lower risk of type 2 diabetes compared to abstainers. This makes a compelling case that the inverse association between moderate alcohol and diabetes risk is not confounded by other lifestyle behaviors.
In the study on changes in alcohol consumption, we accounted for changes in several potential confounding factors. First we controlled for changes in hypertension, hypercholesterolemia, and CVD by including terms for these factors at the beginning and
General discussion |
153
end of the period of change in alcohol consumption in the model. Thus, our results accounted for changes in these risk factors and indirectly for risk factors strongly related to them. In sensitivity analyses, we accounted for the differences in BMI that may have occurred during the four-year periods between assessments of alcohol consumption by including BMI pre- and post- the period of change in alcohol consumption. This did not materially alter the results. We used the exact same approach to assess the effect of changes in physical activity, another important diabetes risk factor. Again, this yielded similar results. There was not sufficient variation in smoking status in this cohort, as the prevalence of current smokers was ~10%, to adjust for change in smoking status. Hence change in smoking was unlikely to be an important confounder. Our approach for dietary risk factors also inherently accounted for change in intake over time. For each dietary factor, we calculated a cumulative average over the period of follow-up, thus including both time points in the models. Because individual dietary factors are substantially less strongly associated with diabetes risk than are BMI and physical activity, it is unlikely that any remaining uncontrolled confounding that is not already accounted for drove the observed findings. Nevertheless, we cannot completely rule out the possibility of residual confounding. Although some residual confounding may attenuate the observed association, it is unlikely that a confounder of this magnitude would have remained undetected. Assessment of alcohol intake In the population based studies, we relied on self-reported alcohol consumption which was assessed by a food frequency questionnaire (FFQ). It is known that self-reported alcohol intake is generally being under-reported (7;8). Despite this and obvious other limitations, the FFQ is accepted as the standard tool for dietary assessment in large studies on diet and chronic disease. The FFQs used in our studies were validated against 24-hour recalls showing high correlations of over 0.7 (9-11). To further validate the self-reported alcohol intake, we also determined the relation between alcohol intake and HDL-cholesterol in a 6.5% sub-cohort of Dutch men and women. In line with previous observations, this analysis showed a linear association between alcohol intake and HDL-cholesterol concentrations in both men and women (12). This means that for alcohol intake an FFQ may be a reasonably valid method for ranking subjects according to intake rather than to estimate absolute amounts of intake although the actual amount and frequency of alcohol consumed by the subjects in these studies may differ from that reported. However, any misclassification due to the FFQ is unlikely to affect this rank order of alcohol consumption. Randomized crossover trials Mainly due to the limitations of observational studies, such as uncontrolled or residual confounding, findings from randomized trials are generally believed to provide the highest level of evidence. However, conducting large-scale, long-term, randomized controlled trials with hard endpoints such as type diabetes may be impossible due to obstacles in costs,

| Chapter 9
154
logistics and ethical issues. Strictly controlled short-term alcohol feeding studies on intermediates of type 2 diabetes are considered to provide an alternative strategy. Design of the trials All intervention studies described in this thesis used a randomized, crossover design. The term ‘randomized’ means that the subjects are randomly assigned to a sequence of treatments (e.g. alcohol vs. non-alcohol or vice versa) and ‘crossover’ means that all subjects participated in the different test conditions. This allowed for within subject comparison of effects, thereby controlling many unpredictable individual variables possibly related to outcome measures and increasing statistical power to detect significant differences. A possible issue with this design is potential ‘carryover’ effects between treatments, which could confound the estimates of the treatment effects. In the statistical models, we checked whether statistical significant carryover effects occurred but this was not the case. Therefore, the presented results are unlikely to be biased by carryover effects. Dose and type of study substance The amount of alcohol, which was provided in the form of white wine, beer or vodka to participants in the randomized trials, averaged around 25 g/day for women and 30 g/day for men. This amount equals 2.5 to 3 Dutch units or around 2 U.S. units and exceeds current recommendations. However, these guidelines are directed at prevention of all chronic diseases rather than on a maximum risk reduction of type 2 diabetes. Moreover, the amount used in the experimental trials represented the nadir of the association between alcohol consumption and type 2 diabetes based on several meta-analyses (4;13;14). In concert, daily alcohol administration of 30 g of alcohol/day for eight weeks improved insulin sensitivity among postmenopausal women compared with 15 g or 0 g of alcohol per day (15). Furthermore, our clinical intervention studies aimed to provide an underlying mechanism for the observed association and are not meant to directly translate in a public health message. Finally, since the interventions comprised a relatively short period of time, such an elevated dose ensured sufficient contrast between treatments to find significant differences in relevant outcome parameters.
We used commercially available alcoholic beverages and most of the times their most comparable control as study substances for the trial in order to mimic regular alcohol consumption. Nonetheless differences between study substances exits. However, both observational studies and short-term controlled trials comparing beer, wine and spirits found that the observed effects on type 2 diabetes risk or mediating markers such as adiponectin were independent from beverage type and thus due to the alcohol itself. Nevertheless we cannot rule out the fact that certain beverage-specific constituents other than alcohol (e.g. polyphenols in wine, juice or B vitamins in beer) may have affected specific anti-inflammatory processes or insulin sensitivity despite the fact that we selected comparable non alcoholic beverages as counterparts in most of the studies (e.g. white grape
General discussion |
155
juice vs. white wine and non-alcoholic beer vs. beer). Taken together, we do not think that choice of beverage has materially influenced our results to a large extent. Study population of the trials: Participants in the studies consisted of postmenopausal women and younger women and men who consumed alcohol on a regular basis. Therefore, the results may not readily be generalized to middle-aged men or abstainers. However, previous intervention trials of our group have shown that e.g. adiponectin levels are also increased after alcohol consumption in middle-aged men (16;17). Moreover, even among initial abstainers, increases in alcohol consumption were associated with an increment in adiponectin levels, as described in chapter 2. It is thus unlikely that, the findings, especially concerning the increased adiponectin, are limited to the investigated groups of subjects. Compliance to treatments: In any intervention study compliance to study treatments is key to obtain valid results. First compliance was monitored by weekly measurement of urinary ethyl glucuronide, a direct phase II metabolite of ethanol formed by action of UDP-glucuronosyl transferase. Ethyl glucuronide has been reported to be a superior marker with 100% sensitivity as a biomarker of recent drinking (18) and persists in the urine up to ~75 to 85 h after last intake. Additional measures of compliance were increase of serum HDL-cholesterol, daily questionnaires, and return of empty bottles. All of these measures suggested a high compliance to the study procedures. Sample sizes and duration of the trials The number of subjects in study, in addition to dose and intervention length, is crucial for statistical power to detect relevant differences. Most of the samples sizes were based on previous research either with moderate alcohol consumption or a comparable intervention, which enabled us to estimate realistic detectable differences in outcome measures between treatments. Furthermore, we also had a low drop-out rate during the studies which added to the retention of sufficient statistical power. Outcome measures Adiponectin and markers of inflammation and insulin sensitivity in blood were the main parameters measured in all interventions. These measures are thought to be important intermediates in the development of type 2 diabetes. Blood samples were obtained from the anticubital vein of the forearm and collected in tubes. Samples were centrifuged for 15 minutes at 2.000 g at 4°C, within 15 - 30 minutes after collection and stored at <-70°C. Samples were determined using validated assays according to the manufacturers’ specifications. Intra-assay and inter-assay variation usually were below 5%.
Besides circulating markers we also measured gene expression levels in various tissues by means of RT-PCR or microarray analysis. RNA quantity and quality were
| Chapter 9
156
verified and no serious deviations were observed. Labeling and hybridization of RNA for each tissue was conducted by the same person to minimize variation. Finally, we did not measure insulin sensitivity according to the golden standard: the euglycemic, hyperinsulinemic clamp technique. Instead, we used an indirect measure based on fasting levels of glucose and insulin (HOMA-IR) which correlates with the clamp technique (19). Comparison with other studies and interpretation of the findings Prospective cohort studies In concert with previous prospective population-based studies from different geographical regions (20-52), we observed an inverse association between moderate alcohol consumption and risk of type 2 diabetes among U.S. men and Dutch men and women. In contrast we did not observe an increased risk of diabetes in heavier consumption categories as was expected based on the reported U-shaped association. In the Dutch cohort, heavier alcohol intake was defined as any intake above current guidelines. This may have obscured a potential U-shaped curve since alcohol intake levels up to about 50 g of alcohol/day (4;14) are still protective against diabetes. In the U.S. cohort, we found a linearly inverse association between alcohol and diabetes, despite a more sophisticated categorization of alcohol intake which should have enabled us to detect a U-shaped curve. Changes in risk of type 2 diabetes were evident within a 4-year period following changes in alcohol intake (chapter 2). This is in line with observations of change in alcohol intake and subsequent change in risk of cardiovascular diseases (53-55) and mortality (56), although some inconsistency exists (57;58). Our findings suggest that the effect of alcohol consumption on diabetes risk has a relatively short latency time but may also be transient and reversible. Furthermore, the temporality of the relation between alcohol and diabetes risk may imply a causal association between alcohol intake and diabetes risk. Consistent with previous findings, we found that the association between alcohol consumption and type 2 diabetes appeared to be independent of other single (25;32;38) or joint (48;59) lifestyle factors related to diabetes risk. Our results (chapter 3) reflect similar additional protection from alcohol consumption for type 2 diabetes among otherwise healthy subjects as was previously shown for heart disease by Mukamal and colleagues (60). The results of these two studies together indicate that the relation is not likely to be explained by a healthier lifestyle of moderate drinkers in general. Also, it shows that the common suggestion by some that alcohol should be avoided since the same protection against theses diseases can be caused by other lifestyle habits may not be completely valid.

General discussion |
157
For the interpretation of observational data on alcohol consumption, one should bear in mind that such results are based on studies where individuals report their average intake as drinks per day, month or year which is in turn transformed into average intake/day. It is unlikely that most individuals drink every day. Yet, current guidelines do not reflect this in the definition for moderation and are based on this exact threshold of “1 drink per day for women or two drinks per day for men” instead of a general “average” metric over the course of a week or month instead. One can thus argue whether these observational data are optimal to derive absolute values for intake recommendations, as misjudgments with respect to the health effects of alcohol intake might occur. Randomized crossover trial Whether alcohol consumption improves markers of insulin sensitivity has been examined in several randomized trials of which an overview is given in chapter 1 (Table 1.1). The only two studies that did report significant changes in markers of insulin sensitivity had intervention periods of 8 weeks and were conducted with older and less insulin-sensitive but non-diabetic men and women (61) or postmenopausal women (15). In line with the latter (15), we also found (chapter 4) lowered fasting serum insulin and triglyceride levels and an improvement in insulin sensitivity as estimated by the homeostasis model assessment of insulin resistance (HOMA-IR) among postmenopausal.
However, the majority of the published studies did not find an improvement in (markers of) insulin sensitivity attributed to moderate alcohol consumption. These studies generally used younger adults (age <50 y) (62-67) or had a relatively short treatment period of alcohol consumption (all ≤4 weeks) (16;17;68). Hence, it was no surprise that we did not find changes in fasting serum insulin levels or other markers of insulin sensitivity in relatively young and insulin sensitive adults after 3 or 4 weeks of alcohol consumption compared with abstention (chapters 5 and 6). However, it should be noted that a myriad of other differences in designs between studies were present (e.g. difference in measurement of insulin sensitivity, dose of alcohol, beverage type, frequency of consumption, amount of participants). Therefore, it cannot be ruled out that experimental factors other than study population and duration are not important. In line with previous research, (16;17;66;69) moderate alcohol consumption increased circulating adiponectin levels (chapters 4-6). This effect was irrespective of beverage type suggesting it is the alcohol that provokes the effect. We could not confirm that alcohol particularly increased the high-molecular weight form of adiponectin, as previously shown (66). The increases in adiponectin after moderate alcohol consumption in the different studies were about 10%, which is a stronger effect than what can be obtained by similar changes in other macronutrients (i.e., a 10% shift in calories) (70;71).
| Chapter 9
158
Several lines of evidence suggest an inhibition of the pluripotent transcription factor nuclear factor kappa B (NF-κB) in white blood cells after acute alcohol consumption (72;73). In concord, we observed in chapter 5 down-regulation of the NF-κB and several physiologically related genes under its control after prolonged moderate alcohol consumption. Activation of the transcription factor NF-κB is a critical step in monocytes inflammatory cytokine production after exposure to bacterial stimuli such as LPS. Yet we did not observe an attenuated cytokine response after a low dose endotoxin administration in men after four weeks of alcohol consumption despite an improved lipoprotein profile (chapter 7). To the best of our knowledge, the preprandial effects of alcohol after mere oral exposure as described in chapter 8 have never been studied. However several studies on moderate alcohol consumption with a meal have shown several beneficial acute postprandial effects on glycemia (74;75) but also on free fatty acid (FFA) levels and insulin sensitivity (76). The temporary but substantial drop in FFA levels observed in the preprandial study could acutely improve insulin sensitivity and may in turn accumulatively over time result in a lower risk of type 2 diabetes. Public health implications: to drink or not to drink? The results in this thesis again underline that moderate alcohol consumption lowers the risk of type 2 diabetes. In addition, the results showed that the association is affected by change in consumption over time and that the association is not confounded by lifestyle behaviors that influence diabetes risk.
Although our results might be seen as suggesting that some individuals should consider adopting regular and moderate intake of alcohol, our findings, even if proven to be causal, are limited to a single outcome of type 2 diabetes. Besides reduced diabetes risk there is also compelling evidence that moderate alcohol intake affects several other health outcomes which should be taken into account. An average daily intake of one to two alcoholic beverages is associated with the lowest all-cause mortality (77) and a reduced risk of cardiovascular diseases (78;79) but also with higher risk of breast cancer among women (80) especially with risk of hormone-sensitive breast cancers (81;82). Besides these effects with moderate alcohol consumption, there is evidence for a positive associations between heavy alcohol consumption and risk of unintentional injuries (83), liver cirrhosis (84), some forms of cancer (85), and addiction which should also be taken into consideration. Current guidelines acknowledge this by recommending that if any alcohol is consumed at all, it should be consumed in moderation, and only by adults. Moreover, studies suggest adverse effects at even moderate amounts of alcohol consumption in specific individuals and situations. According to the U.S. National Institute of Alcohol Abuse and Alcoholism (86) and the Netherlands Health Counsel (87) people who should abstain include:
General discussion |
159
• Children and adolescents. • Women who are pregnant or planning to become pregnant. • Individuals with specific medical conditions (e.g. liver disease, pancreatitis). • Individuals taking medications that can interact with alcohol. • Individuals who plan to engage in activities that require alertness and skill (such as
driving a car). • Individuals who cannot restrict their drinking to moderate levels or are recovering
from alcoholism. For teetotalers it is undesirable to advise picking up the habit of consuming alcoholic beverages in moderation. Usually they have their motives to abstain (e.g. religion or family history of alcoholism). Some argue that moderate alcohol intake is only effective in middle-aged and older people to prevent chronic diseases. This seems especially the case for outcomes like cardiovascular diseases and type 2 diabetes that appear to be more malleable over the course of a lifetime than e.g. cancer. Indeed, research in this thesis has shown that adopting moderate alcohol intake later in life could reduce the risk of type 2 diabetes as is the case for risk of cardiovascular diseases (53;56). For younger adults there may be less health benefit from alcohol drinking throughout adulthood because the preventive effect of moderate alcohol consumption on these diseases can only work if there is an actual risk. These risks become evident at about middle age whereas risks associated with the negative consequence of alcohol consumption are prevalent throughout adulthood. On the other hand, although risks of chronic diseases become actual at older age, it has been generated by a series of events in the previous decades. It might therefore, be overly simplistic to ignore the fact that earlier signs of e.g. atherosclerosis (such as fatty streaks) can already be observed during adolescence. Furthermore, there is evidence that alcohol consumption does reduce the risk of type 2 diabetes (38) and cardiovascular diseases (88) among younger adults. Thus, it may be somewhat premature to suggest that only middle-aged and older adults can benefit from light or moderate alcohol consumption. Especially, since a fundamental principle of dietary guidelines is the concept that a healthy diet starting from a young age can mitigate such processes and hence reduce the risk of chronic diseases in later life. Guidelines for a healthy lifestyle generally do not recommend moderate alcohol consumption because of the risks associated with heavy alcohol consumption. Usually other lifestyle features are emphasized. A drawback with such an approach is that healthy lifestyle behaviors are often inter-correlated and may be most effective when present in combination and generally should not be considered mutually exclusive. Possibly, light to moderate alcohol consumption could be an additional part of such a healthy lifestyle.

| Chapter 9
160
However caution is warranted and tailored advice on alcohol consumption is essential. Heavy or excessive drinking should always be discouraged, whereas moderate alcohol consumption could be regarded as a complement, rather than an alternative, to other low-risk lifestyle habits. Guidelines and personal advice on alcohol consumption should consider the full range of benefits and risks to the individual including the consistent harms to the individual and society of drinking that exceeds recommended limits. A discussion with a health care provider is strongly advised for all people considering a change in their drinking habits. Future research recommendations Observational studies Genetic predisposition It is recommended to pay more attention to the genetic variation in genes coding for enzymes involved in alcohol metabolism since large-scale clinical trials with hard endpoints such as type 2 diabetes are not feasible in this field. An individual’s genetic composition does not change over time and is less likely to be associated with confounding factors. Therefore, research on the effect modifying potential of genetic variants, for example ADH and ALDH, which favor a casual relationship between alcohol intake and disease, may provide more insight. Along this line, a more sophisticated approach could be to compose a gene score based on some a priori chosen gene variants that predicts alcohol consumption. If this score is associated with both alcohol consumption and diabetes risk in another, independent cohort this would provide compelling evidence for a causal relationship between alcohol consumption and type 2 diabetes. Biomarkers mediating of the association between alcohol consumption and diabetes Although the association between moderate alcohol consumption and decreased risk of type 2 diabetes has been reported consistently, limited observational data are available on potential underlying mechanisms. For alcohol consumption and cardiovascular disease this relation may be mediated through HDL-cholesterol and non HDL-cholesterol factors, such as insulin sensitivity, inflammatory markers, lipid and haemostatic factors (12;89-91). For type 2 diabetes, adiponectin appeared to explain about 25% of the relation between alcohol and diabetes risk whereas circulating biomarkers of inflammation, endothelial dysfunction, and fasting insulin did not explain a substantial part of this association (92). However, this specific study solely consisted of middle-aged women, had a case control design, and was performed with a limited number of potential mediators. For example, triglyceride concentrations were not included in this model despite being an independent risk factor for diabetes (93). Compared with postmenopausal non-drinkers, postmenopausal drinkers have
General discussion |
161
lower triglyceride levels whereas male drinkers have higher triglyceride levels compared with male abstainers (94).
Nevertheless, studies like these may help to clarify the possible mechanisms underlying the observed association between moderate alcohol intake and diabetes. Therefore, future research should confirm the mediating effect of adiponectin, not only in women but also in men. Furthermore, additional potential mediators such as triglycerides and inflammatory markers such as TNF-α should be taken into account in these analyses besides the more traditional glycemic and inflammatory markers. Drinking pattern Measures of overall volume of alcohol consumption obscure the relative contributions of drinking frequency (how often alcohol is consumed), drinking quantity (how much alcohol is typically consumed on those days), and their individual contributions to diabetes risk have not been thoroughly investigated. Therefore, the effect of drinking pattern should be examined further in future studies. Randomized trials The physiological mechanisms that could account for the risk reduction in type 2 diabetes associated with moderate alcohol consumption are not completely understood. However, several theories have been proposed such as an improved insulin sensitivity, increased adiponectin levels, lowered inflammatory status and improved glycemic control. In order to provide more definite answers, future randomized trials with prolonged moderate alcohol consumption might consider using: • subjects with slightly impaired insulin sensitivity of increased risk of type 2
diabetes (and thus more likely to benefit from alcohol consumption), • sufficiently long treatment periods (preferably over six weeks of moderate alcohol
consumption to find improvements in insulin sensitivity), • other or more convincing intermediates of type 2 diabetes e.g.
- Profiling of other tissues besides blood that might be relevant tissues in the etiology of type 2 diabetes such as (visceral) adipose or liver tissue. - β-cell function and secretion of related incretin hormones such as glucagon-like peptide-1 (GLP-1) and gastric inhibitory peptide / glucose-dependent insulinotropic polypeptide (GIP). - Challenges of homeostasis (oral glucose tolerance test or euglycemic clamp to challenge insulin sensitivity /glycemic control or an endotoxin challenge to characterize the inflammatory or immune response.
• an integrated approach of metabolic, protein, and gene profiling of different tissues for the discovery of potential new biomarkers.
| Chapter 9
162
Finally, investigating the more acute effects associated with moderate alcohol consumption on e.g. preprandial (cephalic phase) or postprandial responses and its subsequent consequences could help to elucidate the relation between alcohol and insulin sensitivity or glycemia which in turn could accumulatively affect diabetes risk. Concluding remarks In conclusion, research presented in this thesis confirmed the reduced risk of type 2 diabetes associated with moderate alcohol consumption in two separate populations. Furthermore, it extended the association by showing the temporality of the association, and by expanding this relation to subjects already at lower risk of type 2 diabetes. Finally, it provided several plausible physiological mechanisms that may account for the lower risk of type 2 diabetes.
General discussion |
163
References 1. Shaper AG, Wannamethee G, Walker M. Alcohol and mortality in British men: explaining
the U-shaped curve. Lancet 1988;2:1267-73.
2. Shaper AG, Wannamethee SG. The J-shaped curve and changes in drinking habit. Novartis Found Symp 1998;216:173-88.
3. Rehm J, Irving H, Ye Y, Kerr WC, Bond J, Greenfield TK. Are lifetime abstainers the best control group in alcohol epidemiology? On the stability and validity of reported lifetime abstention. Am J Epidemiol 2008;168:866-71.
4. Baliunas DO, Taylor BJ, Irving H et al. Alcohol as a risk factor for type 2 diabetes: A systematic review and meta-analysis. Diabetes Care 2009;32:2123-32.
5. Sieri S, Krogh V, Saieva C et al. Alcohol consumption patterns, diet and body weight in 10 European countries. Eur J Clin Nutr 2009;63 Suppl 4:S81-100.
6. Wang L, Lee IM, Manson JE, Buring JE, Sesso HD. Alcohol consumption, weight gain, and risk of becoming overweight in middle-aged and older women. Arch Intern Med 2010;170:453-61.
7. Hoyer G, Nilssen O, Brenn T, Schirmer H. The Svalbard study 1988-89: a unique setting for validation of self-reported alcohol consumption. Addiction 1995;90:539-44.
8. Feunekes GIJ, van 't Veer P, van Staveren WA, Kok FJ. Alcohol Intake Assessment: The Sober Facts. Am J Epidemiol 1999;150:105-12.
9. Ocke MC, Bueno-de-Mesquita HB, Goddijn HE et al. The Dutch EPIC food frequency questionnaire. I. Description of the questionnaire, and relative validity and reproducibility for food groups. Int J Epidemiol 1997;26 Suppl 1:S37-S48.
10. Giovannucci E, Colditz G, Stampfer MJ et al. The assessment of alcohol consumption by a simple self-administered questionnaire. Am J Epidemiol 1991;133:810-7.
11. Gronbaek M, Heitmann BL. Validity of self-reported intakes of wine, beer and spirits in population studies. Eur J Clin Nutr 1996;50:487-90.
12. Rimm EB, Williams P, Fosher K, Criqui M, Stampfer MJ. Moderate alcohol intake and lower risk of coronary heart disease: meta-analysis of effects on lipids and haemostatic factors. BMJ 1999;319:1523-8.
13. Howard AA, Arnsten JH, Gourevitch MN. Effect of alcohol consumption on diabetes mellitus: a systematic review. Ann Intern Med 2004;140:211-9.
14. Koppes LL, Dekker JM, Hendriks HF, Bouter LM, Heine RJ. Moderate alcohol consumption lowers the risk of type 2 diabetes: a meta-analysis of prospective observational studies. Diabetes Care 2005;28:719-25.
15. Davies MJ, Baer DJ, Judd JT, Brown ED, Campbell WS, Taylor PR. Effects of moderate alcohol intake on fasting insulin and glucose concentrations and insulin sensitivity in postmenopausal women: a randomized controlled trial. JAMA 2002;287:2559-62.
| Chapter 9
164
16. Sierksma A, Patel H, Ouchi N et al. Effect of moderate alcohol consumption on adiponectin, tumor necrosis factor-α, and insulin sensitivity. Diabetes Care 2004;27:184-9.
17. Beulens JW, van Beers RM, Stolk RP, Schaafsma G, Hendriks HF. The effect of moderate alcohol consumption on fat distribution and adipocytokines. Obesity (Silver Spring) 2006;14:60-6.
18. Hoiseth G, Bernard JP, Stephanson N et al. Comparison between the urinary alcohol markers EtG, EtS, and GTOL/5-HIAA in a controlled drinking experiment. Alcohol Alcohol 2008;43:187-91.
19. Monzillo LU, Hamdy O. Evaluation of insulin sensitivity in clinical practice and in research settings. Nutr Rev 2003;61:397-412.
20. Stampfer MJ, Colditz GA, Willett WC et al. A prospective study of moderate alcohol drinking and risk of diabetes in women. Am J Epidemiol 1988;128:549-58.
21. Feskens EJ, Kromhout D. Cardiovascular risk factors and the 25-year incidence of diabetes mellitus in middle-aged men. The Zutphen Study. Am J Epidemiol 1989;130:1101-8.
22. Gurwitz JH, Field TS, Glynn RJ et al. Risk factors for non-insulin-dependent diabetes mellitus requiring treatment in the elderly. J Am Geriatr Soc 1994;42:1235-40.
23. Sugimori H, Miyakawa M, Yoshida K et al. Health risk assessment for diabetes mellitus based on longitudinal analysis of MHTS database. J Med Syst 1998;22:27-32.
24. Tsumura K, Hayashi T, Suematsu C, Endo G, Fujii S, Okada K. Daily alcohol consumption and the risk of type 2 diabetes in Japanese men: the Osaka Health Survey. Diabetes Care 1999;22:1432-7.
25. Ajani UA, Hennekens CH, Spelsberg A, Manson JE. Alcohol consumption and risk of type 2 diabetes mellitus among US male physicians. Arch Intern Med 2000;160:1025-30.
26. Wei M, Gibbons LW, Mitchell TL, Kampert JB, Blair SN. Alcohol intake and incidence of type 2 diabetes in men. Diabetes Care 2000;23:18-22.
27. Conigrave KM, Hu BF, Camargo CA, Jr., Stampfer MJ, Willett WC, Rimm EB. A prospective study of drinking patterns in relation to risk of type 2 diabetes among men. Diabetes 2001;50:2390-5.
28. Hu FB, Manson JE, Stampfer MJ et al. Diet, lifestyle, and the risk of type 2 diabetes mellitus in women. N Engl J Med 2001;345:790-7.
29. Kao WHL, Puddey IB, Boland LL, Watson RL, Brancati FL. Alcohol Consumption and the Risk of Type 2 Diabetes Mellitus: Atherosclerosis Risk in Communities Study. Am J Epidemiol 2001;154:748-57.
30. de Vegt F, Dekker JM, Groeneveld WJ et al. Moderate alcohol consumption is associated with lower risk for incident diabetes and mortality: the Hoorn Study. Diabetes Research and Clinical Practice 2002;57:53-60.
General discussion |
165
31. Meisinger C, Thorand B, Schneider A, Stieber J, Doring A, Lowel H. Sex Differences in Risk Factors for Incident Type 2 Diabetes Mellitus: The MONICA Augsburg Cohort Study. Arch Intern Med 2002;162:82-9.
32. Wannamethee SG, Shaper AG, Perry IJ, Alberti KG. Alcohol consumption and the incidence of type II diabetes. J Epidemiol Community Health 2002;56:542-8.
33. Watanabe M, Barzi F, Neal B et al. Alcohol consumption and the risk of diabetes by body mass index levels in a cohort of 5,636 Japanese. Diabetes Res Clin Pract 2002;57:191-7.
34. Carlsson S, Hammar N, Grill V, Kaprio J. Alcohol Consumption and the Incidence of Type 2 Diabetes: A 20-year follow-up of the Finnish Twin Cohort Study. Diabetes Care 2003;26:2785-90.
35. Lee DH, Ha MH, Kim JH et al. Gamma-glutamyltransferase and diabetes--a 4 year follow-up study. Diabetologia 2003;46:359-64.
36. Lu W, Jablonski KA, Resnick HE et al. Alcohol intake and glycemia in American Indians: the strong heart study. Metabolism 2003;52:129-35.
37. Nakanishi N, Suzuki K, Tatara K. Alcohol consumption and risk for development of impaired fasting glucose or type 2 diabetes in middle-aged Japanese men. Diabetes Care 2003;26:48-54.
38. Wannamethee SG, Camargo CA, Jr., Manson JE, Willett WC, Rimm EB. Alcohol drinking patterns and risk of type 2 diabetes mellitus among younger women. Arch Intern Med 2003;163:1329-36.
39. Lee DH, Folsom AR, Jacobs DR, Jr. Dietary iron intake and Type 2 diabetes incidence in postmenopausal women: the Iowa Women's Health Study. Diabetologia 2004;47:185-94.
40. Beulens JW, Stolk RP, Van der Schouw YT, Grobbee DE, Hendriks HF, Bots ML. Alcohol consumption and risk of type 2 diabetes among older women. Diabetes Care 2005;28:2933-8.
41. Waki K, Noda M, Sasaki S et al. Alcohol consumption and other risk factors for self-reported diabetes among middle-aged Japanese: a population-based prospective study in the JPHC study cohort I. Diabet Med 2005;22:323-31.
42. Hodge AM, English DR, O'Dea K, Giles GG. Alcohol intake, consumption pattern and beverage type, and the risk of Type 2 diabetes. Diabetic Medicine 2006;23:690-7.
43. Strodl E, Kenardy J. Psychosocial and non-psychosocial risk factors for the new diagnosis of diabetes in elderly women. Diabetes Res Clin Pract 2006;74:57-65.
44. Djousse L, Biggs ML, Mukamal KJ, Siscovick DS. Alcohol Consumption and Type 2 Diabetes Among Older Adults: The Cardiovascular Health Study. Obesity Res 2007;15:1758-65.
45. Sato KK, Hayashi T, Nakamura Y et al. Liver enzymes compared with alcohol consumption in predicting the risk of type 2 diabetes: the Kansai Healthcare Study. Diabetes Care 2008;31:1230-6.
| Chapter 9
166
46. Crandall JP, Polsky S, Howard AA et al. Alcohol consumption and diabetes risk in the Diabetes Prevention Program. Am J Clin Nutr 2009;90:595-601.
47. Imamura F, Lichtenstein AH, Dallal GE, Meigs JB, Jacques PF. Confounding by dietary patterns of the inverse association between alcohol consumption and type 2 diabetes risk. Am J Epidemiol 2009;170:37-45.
48. Mozaffarian D, Kamineni A, Carnethon M, Djousse L, Mukamal KJ, Siscovick D. Lifestyle risk factors and new-onset diabetes mellitus in older adults: the cardiovascular health study. Arch Intern Med 2009;169:798-807.
49. Roh WG, Shin HC, Choi JH, Lee YJ, Kim K. Alcohol consumption and higher incidence of impaired fasting glucose or type 2 diabetes in obese Korean men. Alcohol 2009;43:643-8.
50. Hozawa A, Okamura T, Tanaka T et al. Relation of Gamma-glutamyltransferase and alcohol drinking with incident diabetes: the HIPOP-OHP study. J Atheroscler Thromb 2010;17:195-202.
51. Joosten MM, Grobbee DE, van der A DL, Verschuren WM, Hendriks HF, Beulens JW. Combined effect of alcohol consumption and lifestyle behaviors on risk of type 2 diabetes. Am J Clin Nutr 2010;91:1777-83.
52. Boggs DA, Rosenberg L, Ruiz-Narvaez EA, Palmer JR. Coffee, tea, and alcohol intake in relation to risk of type 2 diabetes in African American women. Am J Clin Nutr 2010;92:960-6.
53. Mukamal KJ, Conigrave KM, Mittleman MA et al. Roles of drinking pattern and type of alcohol consumed in coronary heart disease in men. N Engl J Med 2003;348:109-18.
54. Sesso HD, Stampfer MJ, Rosner B, Hennekens CH, Manson JE, Gaziano JM. Seven-year changes in alcohol consumption and subsequent risk of cardiovascular disease in men. Arch Intern Med 2000;160:2605-12.
55. King DE, Mainous AG, III, Geesey ME. Adopting moderate alcohol consumption in middle age: subsequent cardiovascular events. Am J Med 2008;121:201-6.
56. Gronbaek M, Johansen D, Becker U et al. Changes in alcohol intake and mortality: a longitudinal population-based study. Epidemiology 2004;15:222-8.
57. Emberson JR, Shaper AG, Wannamethee SG, Morris RW, Whincup PH. Alcohol intake in middle age and risk of cardiovascular disease and mortality: accounting for intake variation over time. Am J Epidemiol 2005;161:856-63.
58. Wannamethee SG, Shaper AG. Taking up regular drinking in middle age: effect on major coronary heart disease events and mortality. Heart 2002;87:32-6.
59. Schulze MB, Hu FB. Primary prevention of diabetes: what can be done and how much can be prevented? Annu Rev Public Health 2005;26:445-67.
60. Mukamal KJ, Chiuve SE, Rimm EB. Alcohol consumption and risk for coronary heart disease in men with healthy lifestyles. Arch Intern Med 2006;166:2145-50.
General discussion |
167
61. Kim SH, Abbasi F, Lamendola C, Reaven GM. Effect of moderate alcoholic beverage consumption on insulin sensitivity in insulin-resistant, nondiabetic individuals. Metabolism 2009;58:387-92.
62. Cordain L, Bryan ED, Melby CL, Smith MJ. Influence of moderate daily wine consumption on body weight regulation and metabolism in healthy free-living males. J Am Coll Nutr 1997;16:134-9.
63. Cordain L, Melby CL, Hamamoto AE et al. Influence of moderate chronic wine consumption on insulin sensitivity and other correlates of syndrome X in moderately obese women. Metabolism 2000;49:1473-8.
64. Flanagan DEH, Pratt E, Murphy J et al. Alcohol consumption alters insulin secretion and cardiac autonomic activity. European Journal of Clinical Investigation 2002;32:187-92.
65. Gonzalez-Ortiz M, Pascoe-Gonzalez S, Kam-Ramos AM, Martinez-Abundis E. Effect of tequila on homocysteine, insulin secretion, insulin sensitivity, and metabolic profile in healthy men. Journal of Diabetes and its Complications 2005;19:155-9.
66. Beulens JW, van Loon LJ, Kok FJ et al. The effect of moderate alcohol consumption on adiponectin oligomers and muscle oxidative capacity: a human intervention study. Diabetologia 2007;50:1388-92.
67. Beulens JW, de Zoete EC, Kok FJ, Schaafsma G, Hendriks HF. Effect of moderate alcohol consumption on adipokines and insulin sensitivity in lean and overweight men: a diet intervention study. Eur J Clin Nutr 2008;62:1098-105.
68. Zilkens RR, Burke V, Watts G, Beilin LJ, Puddey IB. The Effect of Alcohol Intake on Insulin Sensitivity in Men: A randomized controlled trial. Diabetes Care 2003;26:608-12.
69. Imhof A, Plamper I, Maier S, Trischler G, Koenig W. Effect of drinking on adiponectin in healthy men and women: a randomized intervention study of water, ethanol, red wine, and beer with or without alcohol. Diabetes Care 2009;32:1101-3.
70. Lithander FE, Keogh GF, Wang Y et al. No evidence of an effect of alterations in dietary fatty acids on fasting adiponectin over 3 weeks. Obesity (Silver Spring) 2008;16:592-9.
71. Yeung EH, Appel LJ, Miller ER, III, Kao WH. The Effects of Macronutrient Intake on Total and High-molecular Weight Adiponectin: Results From the OMNI-Heart Trial. Obesity (Silver Spring) 2010;18:1632-7.
72. Mandrekar P, Catalano D, Szabo G. Inhibition of lipopolysaccharide-mediated NF-κB activation by ethanol in human monocytes. Int Immunol 1999;11:1781-90.
73. Mandrekar P, Dolganiuc A, Bellerose G et al. Acute alcohol inhibits the induction of nuclear regulatory factor κB activation through CD14/toll-like receptor 4, interleukin-1, and tumor necrosis factor receptors: a common mechanism independent of inhibitory κBα degradation? Alcohol Clin Exp Res 2002;26:1609-14.
74. Brand-Miller JC, Fatima K, Middlemiss C et al. Effect of alcoholic beverages on postprandial glycemia and insulinemia in lean, young, healthy adults. Am J Clin Nutr 2007;85:1545-51.
| Chapter 9
168
75. Greenfield JR, Samaras K, Hayward CS, Chisholm DJ, Campbell LV. Beneficial postprandial effect of a small amount of alcohol on diabetes and cardiovascular risk factors: modification by insulin resistance. J Clin Endocrinol Metab 2005;90:661-72.
76. Avogaro A, Watanabe RM, Gottardo L, de Kreutzenberg S, Tiengo A, Pacini G. Glucose Tolerance during Moderate Alcohol Intake: Insights on Insulin Action from Glucose/Lactate Dynamics. J Clin Endocrinol Metab 2002;87:1233-8.
77. Di Castelnuovo A, Costanzo S, Bagnardi V, Donati MB, Iacoviello L, de GG. Alcohol dosing and total mortality in men and women: an updated meta-analysis of 34 prospective studies. Arch Intern Med 2006;166:2437-45.
78. Maclure M. Demonstration of deductive meta-analysis: ethanol intake and risk of myocardial infarction. Epidemiol Rev 1993;15:328-51.
79. Corrao G, Rubbiati L, Bagnardi V, Zambon A, Poikolainen K. Alcohol and coronary heart disease: a meta-analysis. Addiction 2000;95:1505-23.
80. Allen NE, Beral V, Casabonne D et al. Moderate alcohol intake and cancer incidence in women. J Natl Cancer Inst 2009;101:296-305.
81. Li CI, Chlebowski RT, Freiberg M et al. Alcohol Consumption and Risk of Postmenopausal Breast Cancer by Subtype: the Women's Health Initiative Observational Study. J Natl Cancer Inst 2010;102:1422-31.
82. Lew JQ, Freedman ND, Leitzmann MF et al. Alcohol and risk of breast cancer by histologic type and hormone receptor status in postmenopausal women: the NIH-AARP Diet and Health Study. Am J Epidemiol 2009;170:308-17.
83. Taylor B, Irving HM, Kanteres F et al. The more you drink, the harder you fall: a systematic review and meta-analysis of how acute alcohol consumption and injury or collision risk increase together. Drug Alcohol Depend 2010;110:108-16.
84. Rehm J, Taylor B, Mohapatra S et al. Alcohol as a risk factor for liver cirrhosis: a systematic review and meta-analysis. Drug Alcohol Rev 2010;29:437-45.
85. World Cancer Research Fund (WCRF)/ American Institute for Cancer Research (AICR). Food, nutrition and physical activity and the prevention of cancer: A global perspective. Washington D.C: 2007.
86. National Institute of Alcohol Abuse and Alcoholism. FAQ for the general public. Accessed on 13-9-2010.
87. Gezondheidsraad. Richtlijnen goede voeding 2006. Den Haag: 2006.
88. Hvidtfeldt UA, Tolstrup JS, Jakobsen MU et al. Alcohol intake and risk of coronary heart disease in younger, middle-aged, and older adults. Circulation 2010;121:1589-97.
89. Mukamal KJ, Jensen MK, Gronbaek M et al. Drinking frequency, mediating biomarkers, and risk of myocardial infarction in women and men. Circulation 2005;112:1406-13.

General discussion |
169
90. Djousse L, Lee IM, Buring JE, Gaziano JM. Alcohol consumption and risk of cardiovascular disease and death in women: potential mediating mechanisms. Circulation 2009;120:237-44.
91. Gaziano JM, Buring JE, Breslow JL et al. Moderate alcohol intake, increased levels of high-density lipoprotein and its subfractions, and decreased risk of myocardial infarction. N Engl J Med 1993;329:1829-34.
92. Beulens JW, Rimm EB, Hu FB, Hendriks HF, Mukamal KJ. Alcohol consumption, mediating biomarkers, and risk of type 2 diabetes among middle-aged women. Diabetes Care 2008;31:2050-5.
93. DeFronzo RA, Ferrannini E. Insulin resistance. A multifaceted syndrome responsible for NIDDM, obesity, hypertension, dyslipidemia, and atherosclerotic cardiovascular disease. Diabetes Care 1991;14:173-94.
94. Ebrahim S, Lawlor DA, Shlomo YB et al. Alcohol dehydrogenase type 1C (ADH1C) variants, alcohol consumption traits, HDL-cholesterol and risk of coronary heart disease in women and men: British Women's Heart and Health Study and Caerphilly cohorts. Atherosclerosis 2008;196:871-8.

Summary

| Summary
172
Moderate alcohol consumption has been associated with a reduced risk of type 2 diabetes compared with abstention. Despite overwhelming evidence for this relation from observational studies and to some extent from clinical trials on intermediate endpoints, several questions concerning this relation remain. This thesis thus aimed to substantiate the evidence of the inverse association between moderate alcohol consumption and type 2 diabetes in different populations in observational studies and to provide underlying physiological mechanisms in clinical intervention studies. Observational studies Changes in alcohol consumption over time are associated with subsequent changes in risk of cardiovascular diseases and mortality but whether changes in alcohol consumption influence future diabetes risk was uncertain. Thus in chapter 2 we investigated among 38,031 middle-aged U.S. men if four-year changes in alcohol consumption affected subsequent type 2 diabetes risk. Among initially rare and light drinkers, moderate increases in alcohol consumption over a four-year time period were associated with a lower risk of type 2 diabetes. However, individuals already consuming alcohol in moderation did not receive further benefit from increased consumption. The results suggest that the effects of alcohol consumption on type 2 diabetes risk have a relatively short latency time but are also transient and reversible. Whether the lower risk of type 2 diabetes among subjects who consume alcohol is due to the alcohol drinking itself or whether, to some extent, it is due to other healthy lifestyle factors of drinkers is a continuing question. In chapter 3, we determined if alcohol drinking, in addition to having optimal weight, being physically active, nonsmoking, and consuming a healthy diet, had an effect on the risk of developing type 2 diabetes among 35,625 Dutch men and women. The results showed that even among subjects who are at lower risk of developing diabetes on the basis of other lifestyle characteristics, alcohol consumption provided considerably further decrease of about 40% in the risk of type 2 diabetes. Intervention studies Although moderate alcohol consumption has consistently been associated with a decreased risk of type 2 diabetes compared with abstaining it remains uncertain whether it improves insulin sensitivity. In chapter 4, we describe the results of a randomized, crossover trial among thirty-six apparently healthy postmenopausal women who received white wine (~25 g alcohol/day) or white grape juice daily during dinner for six weeks. Moderate alcohol consumption for six weeks improved insulin sensitivity by about 11% and adiponectin levels by about 12% in postmenopausal women. Furthermore, these data suggested a transcriptional mechanism leading to the alcohol-induced increase in adiponectin plasma levels.

Summary |
173
Moderate alcohol consumption has several acute effects on gene expression of white blood cells but longer term effects on gene expression are largely unknown. Thus in chapter 5 we examined with large-scale profiling of proteins and genes the effects of four weeks of moderate vodka (~30 g alcohol/day) consumption on inflammatory markers and gene expression profiles in blood of twenty-four younger men. This integrated approach of large-scale profiling of proteins and genes revealed that moderate alcohol consumption for four weeks altered gene expression profiles of white blood cells and circulating markers related to inflammation. Previously, we have shown that moderate alcohol consumption increased levels of adiponectin, a hormone inversely associated with type 2 diabetes risk. However, the rate at which this increase occurs is unclear and if this increase differs for specific forms of adiponectin was also uncertain. In chapter 6, we therefore examined the effect of moderate alcohol consumption on the weekly alterations in levels of both total and high-molecular weight (HMW) adiponectin in twenty-four premenopausal women. We observed that moderate beer consumption (~26 g alcohol/day) increased both the high-molecular weight form as the total adiponectin from by about 8% after at least three weeks of consumption compared with alcohol-free beer consumption. Alcohol consumption did not preferentially change the molecular weight distribution of adiponectin in these younger women. Circulating high-density lipoprotein (HDL)-cholesterol and its associated surface lipids apolipoproteins have been shown to play an important role in the detoxification of a specific endotoxin named LipoPolySaccarides (LPS). Moderate alcohol consumption increases HDL-cholesterol and several apolipoproteins. In chapter 7, we aimed to study whether the alcohol-induced increase in lipoproteins attenuated the inflammatory response after a low-dose in vivo endotoxin challenge. After four weeks of moderate vodka juice consumption (~30 g alcohol/day) several lipoproteins were increased by approximately 10% compared with four weeks of juice consumption in twenty-two men. However, we did not observe an attenuated inflammatory response over time after a low-dose in vivo endotoxin bolus. Preingestive or cephalic phase responses, triggered by sensory stimulation of macronutrients, influence the organism’s endocrine responses and substrate mobilization. However whether oral sensory stimulation with alcohol elicits cephalic phase responses was unknown. In chapter 8, we investigated whether short-term (~6 min) oral alcohol exposure, in the form of white wine(~25 g alcohol), provoked cephalic phase responses in eleven normal-weight and eleven overweight subjects. Oral white wine exposure in the oral cavity substantially (-20%) and temporarily (~20 min) decreased serum free fatty acid concentrations compared with water exposure regardless of BMI. This suggests a cephalic phase response of alcohol.

| Summary
174
The main findings, methodological considerations and interpretation of the findings of the studies described in this thesis are discussed in chapter 9. Directions for further research and implications for public health are mentioned

Lay summary in Dutch (Samenvatting voor niet-ingewijden)
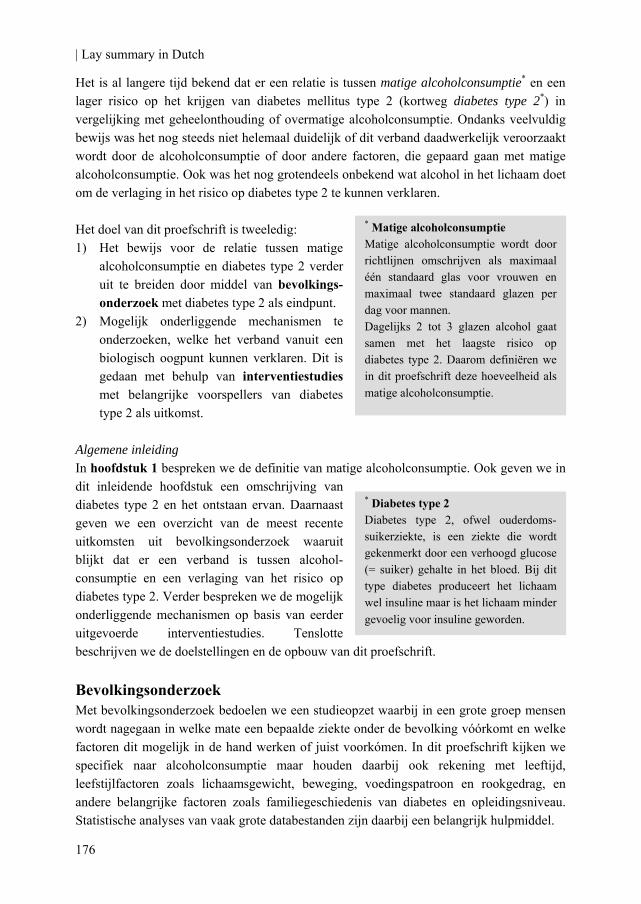
| Lay summary in Dutch
176
Het is al langere tijd bekend dat er een relatie is tussen matige alcoholconsumptie* en een lager risico op het krijgen van diabetes mellitus type 2 (kortweg diabetes type 2*) in vergelijking met geheelonthouding of overmatige alcoholconsumptie. Ondanks veelvuldig bewijs was het nog steeds niet helemaal duidelijk of dit verband daadwerkelijk veroorzaakt wordt door de alcoholconsumptie of door andere factoren, die gepaard gaan met matige alcoholconsumptie. Ook was het nog grotendeels onbekend wat alcohol in het lichaam doet om de verlaging in het risico op diabetes type 2 te kunnen verklaren. Het doel van dit proefschrift is tweeledig: 1) Het bewijs voor de relatie tussen matige
alcoholconsumptie en diabetes type 2 verder uit te breiden door middel van bevolkings-onderzoek met diabetes type 2 als eindpunt.
2) Mogelijk onderliggende mechanismen te onderzoeken, welke het verband vanuit een biologisch oogpunt kunnen verklaren. Dit is gedaan met behulp van interventiestudies met belangrijke voorspellers van diabetes type 2 als uitkomst.
Algemene inleiding In hoofdstuk 1 bespreken we de definitie van matige alcoholconsumptie. Ook geven we in dit inleidende hoofdstuk een omschrijving van diabetes type 2 en het ontstaan ervan. Daarnaast geven we een overzicht van de meest recente uitkomsten uit bevolkingsonderzoek waaruit blijkt dat er een verband is tussen alcohol-consumptie en een verlaging van het risico op diabetes type 2. Verder bespreken we de mogelijk onderliggende mechanismen op basis van eerder uitgevoerde interventiestudies. Tenslotte beschrijven we de doelstellingen en de opbouw van dit proefschrift. Bevolkingsonderzoek Met bevolkingsonderzoek bedoelen we een studieopzet waarbij in een grote groep mensen wordt nagegaan in welke mate een bepaalde ziekte onder de bevolking vóórkomt en welke factoren dit mogelijk in de hand werken of juist voorkómen. In dit proefschrift kijken we specifiek naar alcoholconsumptie maar houden daarbij ook rekening met leeftijd, leefstijlfactoren zoals lichaamsgewicht, beweging, voedingspatroon en rookgedrag, en andere belangrijke factoren zoals familiegeschiedenis van diabetes en opleidingsniveau. Statistische analyses van vaak grote databestanden zijn daarbij een belangrijk hulpmiddel.
* Matige alcoholconsumptie Matige alcoholconsumptie wordt door richtlijnen omschrijven als maximaal één standaard glas voor vrouwen en maximaal twee standaard glazen per dag voor mannen. Dagelijks 2 tot 3 glazen alcohol gaat samen met het laagste risico op diabetes type 2. Daarom definiëren we in dit proefschrift deze hoeveelheid als matige alcoholconsumptie.
* Diabetes type 2Diabetes type 2, ofwel ouderdoms-suikerziekte, is een ziekte die wordt gekenmerkt door een verhoogd glucose (= suiker) gehalte in het bloed. Bij dit type diabetes produceert het lichaam wel insuline maar is het lichaam minder gevoelig voor insuline geworden.

Samenvatting voor niet-ingewijden |
177
Effect van verandering in alcohol op diabetes Een relatief nieuwe methode om na te gaan hoe ´hard´ het veronderstelde verband tussen matige alcoholconsumptie en diabetes type 2 is, is om de ´tijdelijkheid´ van dit verband te onderzoeken. Met andere woorden: hoe beïnvloedt een toename of afname in alcohol-consumptie in een bepaalde tijdsperiode het risico op diabetes type 2? In hoofdstuk 2 hebben we beschreven hoe dit zich gedurende twintig jaar bij 38.031 Amerikaanse mannen van middelbare leeftijd ontwikkelt. Hierbij hebben we specifiek gekeken of veranderingen in de alcoholconsumptie over periodes van vier jaar een effect hadden op het risico op diabetes type 2 in de daaropvolgende vier jaar. Hierbij hebben we ook rekening gehouden met andere relevante veranderingen die mogelijk van invloed zijn, zoals lichaamsgewicht, lichaamsbeweging, rookgedrag en voedingspatroon. Uit het onderzoek bleek dat wanneer personen die slechts incidenteel alcohol dronken hun consumptie van alcoholhoudende drank verhoogden tot een matig niveau, dit leidde tot 10% hogere gehaltes van adiponectine* in het bloed en tot een 22% lagere kans op diabetes type 2. Omgekeerd, wanneer matige drinkers hun alcoholconsumptie verlaagden, nam het risico op diabetes type 2 toe tot een niveau dat vergelijkbaar was met het risico van mensen die aanvankelijk incidenteel alcoholhoudende dranken consumeerden. Bij mensen die bij aanvang van de studie matig dronken en in de loop der tijd hun consumptie verhoogden, bleek er echter geen sprake te zijn van extra bescherming tegen diabetes type 2. Deze resultaten laten zien dat het effect van alcohol op het risico op diabetes type 2 na een relatief korte tijd (vier jaar) zijn beslag krijgt, maar ook dat het effect in een zelfde tijdsperiode teniet gedaan kan worden wanneer de consumptiehoeveelheid veranderd. Nog effect van alcohol op diabetes bij een gezonde leefstijl? Diabetes type 2 kan veelal worden voorkomen door een gezonde leefstijl. Belangrijke elementen van een gezonde leefstijl zijn: het voorkómen van overgewicht, voldoende lichaamsbeweging, niet roken en een uitgebalanceerd voedingspatroon. Of bij mensen die er al een gezonde leefstijl op na hielden, matige alcoholconsumptie toch nog een toegevoegd gunstig effect heeft op het risico op diabetes type 2 was nog niet eerder onderzocht. In hoofdstuk 3 is beschreven hoe we dit bij 35.625 Nederlandse mannen en vrouwen tussen de 20 en 70 jaar gedurende 10 jaar hebben onderzocht. De resultaten lieten zien dat personen die zich hielden aan ten minste drie van de bovengenoemde beschermende leefgewoonten én daarnaast een matige hoeveelheid alcoholhoudende drank consumeren, 40% minder kans hebben op het ontwikkelen van diabetes type 2 dan geheelonthouders met een gezonde leefstijl.
* AdiponectineAdiponectine is een hormoon dat vrijwel alleen wordt gemaakt en afgegeven door het vetweefsel. Hoge gehaltes van dit hormoon in het bloed hangen samen met een hoge insuline-gevoeligheid, een lage ontstekingsgraad en een lager risico op diabetes type 2 en hart- en vaatziekten.
| Lay summary in Dutch
178
Interventiestudies Bij interventiestudies wordt aan een relatief kleine groep proefpersonen een bepaalde stof of behandeling gegeven. In de beschreven interventiestudies in dit proefschrift werden alcoholhoudende dranken en alcoholvrije controle dranken aan de proefpersonen gegeven. De interventiestudies duurden 8 tot 12 weken en zijn uitgevoerd volgens een zogenaamde 'gerandomiseerde cross-over' opzet. Dat betekent dat alle proefpersonen beide dranken (alcohol vs. alcoholvrij) hebben gekregen (= cross-over) maar in een willekeurige volgorde (= gerandomiseerd). Mannen dronken bij de avondmaaltijd dagelijks 3 standaard glazen en vrouwen 2,5 glazen. Een standaard glas bevat ongeveer 10 gram pure alcohol, ongeacht het type drank (bier, wijn of gedistilleerd). Aan het einde van beide periodes werd lichaamsmateriaal (bloed, vetweefsel, urine of speeksel) afgenomen om veranderingen in uitkomstmaten te bestuderen. Veranderingen in insulinegevoeligheid door alcohol Hoewel uit een groot aantal onderzoeken blijkt dat mensen die een matige hoeveelheid alcohol consumeren een verlaagd risico hebben op diabetes type 2 in vergelijking met geheelonthouders, was het nog onduidelijk of alcoholconsumptie de insulinegevoeligheid* van het lichaam verhoogt. In hoofdstuk 4 beschrijven we de resultaten van een klinische interventie-studie onder 36 vrouwen van middelbare leeftijd (na de overgang) die gedurende zes weken witte wijn en wit druivensap hebben gedronken. Matige alcoholconsumptie bleek de insulinegevoeligheid met 11% en het gehalte adiponectine in het bloed met 12% te laten toenemen in vergelijking met zes weken onthouding van alcoholhoudende drank. Bovendien bleek dat de toename van adiponectine in het bloed toe te schrijven was aan een toegenomen aanmaak van adiponectine in het vetweefsel. Effect van alcohol op witte bloedcellen Matige alcoholconsumptie heeft verschillende korte termijn effecten op de genexpressie (= het tot uitdrukking komen van erfelijke eigenschappen) van witte bloedcellen. Deze cellen spelen een belangrijke rol bij een ontsteking* en bij de afweer van het lichaam. De effecten van matige alcoholconsumptie op deze witte bloedcellen op een wat langere termijn zijn nog grotendeels onbekend. Om dit te onderzoeken hebben we in hoofdstuk 5 beschreven hoe we de veranderingen in eiwitten in bloed en in genexpressie van witte bloedcellen hebben onderzocht. Hiervoor hebben 24 jonge mannen vier weken lang dagelijks een mix van jus d’orange met wodka gedronken en vier weken alleen jus d’orange gedronken. De
* OntstekingEen beschermende reactie van lichaamsweefsel op een schadelijke prikkel, vaak gekenmerkt door een rode, warme, pijnlijke zwelling.
* InsulinegevoeligheidDit betekent de gevoeligheid van weefsels zoals lever en spieren voor insuline. Insuline zorgt ervoor dat glucose in de weefsels komt. Een verlaagde insulinegevoeligheid kan een voorspeller zijn van diabetes type 2.
Samenvatting voor niet-ingewijden |
179
veranderingen in zowel eiwitten als genexpressie liet zien dat na de periode van alcoholconsumptie verschillende processen op het gebied van ontsteking en vetmetabolisme waren veranderd. Deze veranderingen gaven inzicht in de manier waarop alcohol mogelijk de kans op diabetes type 2 verlaagt. Effect van alcohol op het hormoon adiponectine Eerder onderzoek heeft aangetoond dat matige alcoholconsumptie bij jonge mannen en bij mannen en vrouwen van middelbare leeftijd het adiponectinegehaltes in het bloed verhoogt (zie hoofdstuk 4). Of alcoholconsumptie ook bij jongere vrouwen de adiponectinewaarden in het bloed laat stijgen was nog niet eerder onderzocht. Ook de snelheid waarmee dit gebeurt, was nog onduidelijk. Bovendien was nog onvoldoende bekend of deze stijging na alcoholconsumptie ook optreedt voor de hoogmoleculaire vorm van adiponectine. Aangenomen wordt dat vooral deze vorm de ‘biologisch actieve’ vorm is. Daarom hebben we in hoofdstuk 6 bij 24 jonge vrouwen de wekelijkse veranderingen in de totale als de hoogmoleculaire vorm van adiponectine gemeten. We zagen dat in vergelijking met alcoholvrij bier, alcoholhoudend bier zowel het gehalte van de totale als de hoogmoleculaire vorm van adiponectine met ongeveer 8% liet toenemen. Deze stijgingen waren pas waarneembaar na minimaal drie weken van matige alcoholconsumptie. Effect van alcohol op kunstmatige ontstekingsreactie Matige alcoholconsumptie verhoogt de bloedwaardes van het HDL-cholesterol, ook wel het ‘goede’ cholesterol genoemd. Naast andere functies speelt dit HDL-cholesterol ook een belangrijke rol in de afvoer van schadelijke stoffen. Sommige van die schadelijke stoffen kunnen een ontstekingsreactie kunnen veroorzaken. In hoofdstuk 7 hebben we daarom onderzocht of de toegenomen waarde van HDL-cholesterol na alcoholconsumptie bij de proefpersonen leidt tot een lagere ontstekingsreactie. Hiervoor hebben 22 mannen gedurende vier weken dagelijks een mix van jus d’orange met wodka of alleen jus d’orange gedronken. Aan het einde van beide periodes werd bij de proefpersonen een milde ontstekingsreactie opgewekt door het toedienen van een schadelijke stof. Hoewel het HDL-cholesterol na vier weken matige alcoholconsumptie 10% hoger was dan na de vier weken zonder alcoholconsumptie, bleek er geen verschil te zijn in de ontstekingsreactie na beide periodes. Effect van proeven van alcohol op vrije vetzuren Het proeven van voedsel prikkelt bepaalde zintuigen in de mond. Deze prikkel bereidt het lichaam voor op het voedsel dat doorgeslikt gaat worden. In hoofdstuk 8 hebben we bij 22 vrouwen van middelbare leeftijd (na de overgang) onderzocht of het proeven van witte wijn gedurende 6 minuten zonder het door te slikken ook een dergelijke reactie opwekt. Na het proeven was de hoeveelheid vrije vetzuren (= een bron van kant-en-klare energie) in het bloed van de wijnproevers 20% lager dan in het bloed van de waterproevers. De daling in vrije vetzuren door het proeven van de wijn was tijdelijk (20 minuten). Mogelijk leidt de
| Lay summary in Dutch
180
daling van vrije vetzuren in het bloed ten gevolge van het proeven van alcohol tot een tijdelijke verhoging van de insulinegevoeligheid. Algemene discussie Tot slot wordt in hoofdstuk 9 een kort overzicht gegeven van de belangrijkste bevindingen van dit proefschrift. Ook worden de voor- en nadelen van de gebruikte onderzoeksmethoden besproken en worden de gevonden resultaten vergeleken met eerdere bevindingen in de wetenschappelijke literatuur. Vervolgens wordt de relevantie van de uitkomsten voor de volksgezondheid beschreven. Tenslotte, worden suggesties gedaan voor verder onderzoek op het gebied van matige alcoholconsumptie en diabetes type 2. Kortom, dit proefschrift heeft het verband tussen matige alcoholconsumptie en een lager risico op diabetes type 2 uitgebreid door in bevolkinsonderzoek aan te tonen dat: • het verband ook geldt voor mensen die door hun leefstijl al een verlaagde kans op
diabetes type 2 hebben • een toename in alcoholconsumptie tot een matig niveau leidt tot een daaropvolgende
verlaging in het risico op diabetes type 2. De toegenomen adiponectinegehaltes en insulinegevoeligheid en de veranderingen in ontstekingsprocessen na matige alcoholconsumptie in de interventiestudies kunnen de verlaging in risico op diabetes type 2 mogelijk verklaren.
Acknowledgement (Dankwoord)
| Acknowledgement
182
This is it! De uitkomsten van vier jaar wetenschappelijk onderzoek gebundeld in één boek. Meer dan 750.000 (driekwart miljoen!) persoonsjaren en gegevens van ruim 90.000 mensen uit bevolkingsonderzoeken in Nederland en Amerika, maar ook een slordige 546 liter witte wijn, 70 liter wodka, 665 liter (alcoholvrij)bier, 378 liter witte druivensap, 275 liter jus d’orange en 168 liter mineraalwater plus ongeveer 40 liter bloed, 6,4 liter urine, 36 gram vetweefsel en 70 milliliter speeksel van meer dan 108 verschillende proefpersonen uit vier klinische interventiestudies zijn nodig geweest voor dit resultaat. Het is dan eigenlijk overbodig om te zeggen dat ik al dit werk nooit alleen heb kunnen doen. Ik ben dan ook héél véél dank verschuldigd aan alle mensen die mij, op wat voor manier dan ook, hebben geholpen of bijgestaan in de afgelopen vier jaar. Ik wil beginnen met mijn copromotor en dagelijkse begeleider bij TNO Kwaliteit van Leven: Dr. Henk F.J. Hendriks (of mag ik na al die jaren wetenschappelijk onderzoek over de gezondheidseffecten van matige alcoholconsumptie spreken over Dr. Hendrinks?). Beste Henk, dank voor je vertrouwen in mij en dank voor de ruimte die je me hebt gegeven. Ik heb heel veel geleerd van je tomeloze enthousiasme, je kritische opmerkingen (met af en toe een gefronste wenkbrauw) en je nieuwe theorieën en invalshoeken. Naarmate de jaren verstreken, heb jij het steeds drukker gekregen. Toch had je altijd tijd voor me als dat nodig was. Dit heb ik erg gewaardeerd.
Uiteraard ben ik ook veel dank verschuldigd aan mijn promotor Prof. Renger F. Witkamp van de Wageningen Universiteit. Beste Renger, hoewel je tijdens mijn promotieonderzoek meer op afstand betrokken was, had je op kritische momenten altijd ruime de tijd voor mij of mijn manuscripten ondanks je overvolle agenda. Ook jou wil ik bedanken voor de prettige, informele en inspirerende samenwerking. Je toewijding en passie voor het wetenschappelijke onderzoek zullen me zeker bijblijven. Dr. Joline W.J. Beulens. Mijn voorgangster op een vergelijkbaar alcoholproject bij TNO. Beste Joline, Ik weet niet hoe je het weet te flikken maar alles lijkt je te lukken en ook nog in een rap tempo ook. Zoveel leuke publicaties in mooie tijdschriften en nu al ‘assistant professor’ aan het Universitair Medisch Centrum Utrecht. Ik ben bijzonder blij dat we hebben kunnen samenwerken en dat ik van je kritische en constructieve werkwijze heb kunnen leren. During my PhD project, I was given the opportunity to work for 5 months at the Harvard School of Public Health (HSPH) in Boston, MA, U.S.A. Dr. Kenneth J. Mukamal. Dear Ken, working with you was truly inspiring. I learned a lot from your way of thinking. It always took me some time to process your new and fancy (statistical) approaches and the valuable information you provided during our meetings at your office or at the Starbucks. Thanks to you, I learned that the taste of unsweetened iced coffee isn’t that bad after all.
Dr. Eric B. Rimm. Dear Eric, thank you for giving me the opportunity to work with you, your group and the Department of Nutrition of the HSPH. I appreciate it that you
Dankwoord |
183
will come to the Netherlands and participate in my dissertation despite your daughter’s 18th Birthday. Er is tijdens de afgelopen vier jaar ontzettend veel praktisch werk verzet om de klinische interventiestudies tot een goed eind te brengen. Zonder proefpersonen, geen interventie-studies en dus ook geen resultaten en geen data. Ik wil dan ook graag alle proefpersonen aan de alcoholstudies bedanken voor hun deelname, inzet en lichaamsmateriaal.
Daarnaast wil ik ook de Metabole Unit en de andere collega’s van gebouw elf die nauw betrokken zijn geweest bij de opzet en uitvoer van het praktische werk hartelijk bedanken: Henriëtte Fick, Inge van den Assum, Desiree Rouwendaal, Jose Jacobs voor de voorbereiding en de daadwerkelijke uitvoer, Angelique Speulman voor het sticker-, lab- en pipeteerwerk, Eric Busink, Christel Hoeflaken en Jolanda Jansen voor de werving van de proefpersonen en de assistentie rondom de interventiestudies, Wilfred Sieling voor de kostenschattingen, Ineke ‘HPA-as’ of ‘prefrontale voorkwab’ Klöpping voor de keuring en selectie, Ellen Dutman voor datamanagement (en voor de gesprekken over hoe het is als jonge, startende, voedingswetenschapper) en Wim Meuling voor de tips en adviezen tijdens het schrijven van de diverse protocollen voor de medisch ethische commissie.
Wouter ‘Grote vriend’ Vaes, Marola van Lipzig en Babs Fabriek: bedankt voor het uitzoeken van de juiste ‘kits’, het opzetten van de biochemische analyses van de bloedmonsters en het rapporteren van de waardes. Natuurlijk wil ik hier ook bedanken Jan Catsburg, Wilma Kreuing, Marco Rondhuis, Lisette Bok, Hans Verplanke, Karin Toet en andere analisten die de analyses daadwerkelijk hebben uitgevoerd. Linette Pellis en Marjan van Erk, hartelijk dank voor het analyseren van de genexpressiedata. Ook dank aan Cor Kistenmaker, Carina de Jong-Rubingh en Sabina Bijlsma voor de statistische adviezen.
Uiteraard wil ik ook mijn TNO ‘moeders’ en directe collega’s Alwine Kardinaal, Annette Stafleu, Gertruud Bakker, Lisette Brink, Esther Boelsma en Wilrike Pasman bedanken voor de gezelligheid tijdens de koffie- en lunchpauzes. Wilrike, ik zal het congres in Boedapest of het ‘Easter egg’ incident niet gauw vergeten.
Tijdens mijn project heb ik twee stagiaires mogen begeleiden Annemarie en Martine. Annemarie, jij bent inmiddels zelf aio. Heel veel succes met je project en dank voor je inzet tijdens mijn project. Martine, ik weet zeker dat in jou ook een goede onderzoeker schuil gaat. Ook jou wil ik bedanken voor je bijdrage aan het onderzoek.
Tot slot wil ik de overige TNO collega’s bedanken die tijdens mijn werkzaamheden op wat voor manier bij hebben gedragen aan mijn promotie. Ook wil ik noemen ex-collega’s Diane, Soesila, Marijke, Karina, Linda en Lenka. Lenka, dank voor de leerzame carpool- en fietsritjes. Verder ben ik veel dank verschuldigd aan de Stuurgroep Alcohol Research (SAR) en haar leden, in het bijzonder Hans Burghoorn, Joep Stassen en Jack Verhoek. Daarnaast wil ik hier ook Barbara Schouten noemen voor haar kritische bijdrages.
| Acknowledgement
184
Dit is ook de plek waar ik de overige mede auteurs van de manuscripten in dit proefschrift in het zonnetje kan zetten. Many thanks to S.E. Chiuve and Prof. F.B. Hu, both from the HSPH. Prof. D.E. Grobbee, Dr. W.M.M. Verschuren en Dr. D.L. van de A, Dr. S Kersten en Prof. C de Graaf van de Wageingen Universiteit: allen bedankt! Daarnaast wil ik hier ook de overige leden van mijn promotiecommissie hier bedanken. Also a ‘big up’ to my fellow colleagues at the HSPH, especially my office mate Katharina Nimptsch and my practical supervisor Stephanie Chiuve. I don’t know how you put up with me and my questions over and over again. Thanks for your patience with me and for all the programming tips in Putty and Emacs/Pico.
Meghan R. Johnston, Vincent Moulis and Steph Calmat: thanks for the wonderful times during my stay in Boston outside of Harvard. Dear Meghan, I really enjoyed the girly cocktails, Harpoon fest, St Patty’s day and the ski trip to Sunday River, ME. Vince, thanks for the shelter in Brookline. The weekend trips to Stowe, VT, Holderness, NH and New Orleans, LA were awesome. Thanks for teaching me valuable French habits (e.g. drinking Ricard) and lessons (caca de fête, caca qui fouette). Ook dank aan alle mede aio’s en collega’s bij de WUR. Hoewel ik jullie niet geregeld sprak, heb ik erg genoten van mijn bezoeken aan de Universiteit. De PhD tours door Noordoost Amerika in 2007 en door Denemarken, Zweden en Finland in 2009 waren echt heel erg geslaagd! Cecile Povel, Rianne de Vlaming, Sandra Crispim en Sanne Griffioen-Roose: het organiseren van de PhD tour 2009 was een hele kluif maar mede dankzij jullie toch heel leuk. Met naam wil ik verder nog noemen Akke, Mirre, Nicolien en Pleunie.
Speciale dank voor mijn paranimfen Sanne en Michiel Balvers. Lieve Sanne, ik heb veel respect voor jou als persoon en wetenschapper. Ik heb veel geleerd van je kritisch kijk op dingen. Het weekendje Sint Petersburg na de PhD tour zal ik ook nooit vergeten. Ik vind het heel prettig dat jullie aan mijn zijde willen staan op deze, voor mij bijzondere, dag. Ik wens jullie allebei heel veel succes met het afronden van jullie PhD projecten! Ik wil nog enkele mensen bedanken die ik in de loop der tijd heb leren kennen in Wageningen. Te beginnen met mijn sportkameraden van het eerste uur: Jochem Sloothaak en Erik van der Galiën. Dank voor de afleiding aan de eettafel, in de gym of op de fiets gedurende al die jaren. Dennis Reinieren, ook jij behoort hier inmiddels toe. Pieter Blok, ‘Vinnie’, na al die fitnessavonden ben je ondertussen ook een ‘voedingsman’ geworden ☺. Echte voedingsmannen en trainingsmaten Frans, Jorn en Jasper: ook jullie bedankt voor het gezelschap bij de schranspartijen en bij de gewichten van de fitness. Mijn ‘chicas’ Wendy Wolters en Yvonne Zebregs, Marieke, Magda en de andere exleden van het Di-et-Tri bestuur en afdelingsgenoten van 14B: ook jullie wil ik bedanken voor het luisterende oor. Dit dankwoord is niet compleet zonder de Landal GreenParks/ Center Parcs/ Barcelona-gangers te noemen. Dank voor de broodnodige ontspanning tijdens de weekendjes weg!

Dankwoord |
185
Mijn vrienden uit Rotterdam e.o. in het bijzonder Maurice Buik, Kevin Schiks, Dennis van der Berg en Monique van Laar wil ik ook bedanken. Buikie, mijn beste maatje sinds mijn 10de. Hoewel we al lang niet meer samen naar school gaan, voetballen of werken ben je nog steeds mijn ‘pikkie’. Mijn ambities nopen mij soms tot forse aderlatingen. Sorry, dat ik door mijn verblijf in Boston er niet lijfelijk voor je kon zijn toen je het moeilijk had. Schiks en Berg, ik ben blij dat ik jullie als vrienden heb. De belevenissen tijdens onze eerste TdF trip zal ik echt nooit vergeten! Dat er nog veel TdF trips, vrijdagmails en kaartavondjes mogen volgen! Lieve Monique, als geen ander weet jij mij aan te voelen en te begrijpen. Dank voor de relativerende gesprekken tijdens de avondjes bij jou thuis, of tijdens de stedentrips in België, Italië en Marokko. Waar gaat onze volgende trip naar toe? Tot slot wil ik mijn familie bedanken. Mijn grote zus en voorbeeld Diana en schoonzus Janneke. Ik hoop na mijn promotie meer tijd te hebben zodat ik van mijn nichtje Keesje kan genieten. Als laatste wil ik mijn ouders bedanken. Lieve papa en mama, bedankt voor het veilige en warme nest waarin ik heb mogen opgroeien. Jullie hebben het voor mij mogelijk gemaakt op tot dit punt in mijn leven te komen. Ik hoop dat ik met de reizen naar Israël en Canada iets terug heb kunnen doen als blijk van waardering voor jullie onvoorwaardelijke liefde, zorg, steun en vertrouwen.


About the author
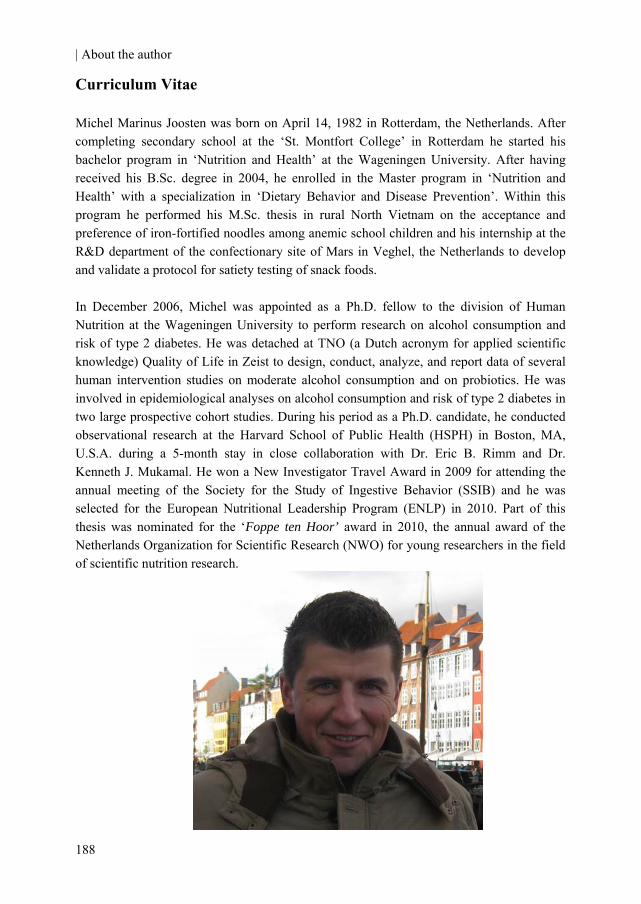
| About the author
188
Curriculum Vitae Michel Marinus Joosten was born on April 14, 1982 in Rotterdam, the Netherlands. After completing secondary school at the ‘St. Montfort College’ in Rotterdam he started his bachelor program in ‘Nutrition and Health’ at the Wageningen University. After having received his B.Sc. degree in 2004, he enrolled in the Master program in ‘Nutrition and Health’ with a specialization in ‘Dietary Behavior and Disease Prevention’. Within this program he performed his M.Sc. thesis in rural North Vietnam on the acceptance and preference of iron-fortified noodles among anemic school children and his internship at the R&D department of the confectionary site of Mars in Veghel, the Netherlands to develop and validate a protocol for satiety testing of snack foods. In December 2006, Michel was appointed as a Ph.D. fellow to the division of Human Nutrition at the Wageningen University to perform research on alcohol consumption and risk of type 2 diabetes. He was detached at TNO (a Dutch acronym for applied scientific knowledge) Quality of Life in Zeist to design, conduct, analyze, and report data of several human intervention studies on moderate alcohol consumption and on probiotics. He was involved in epidemiological analyses on alcohol consumption and risk of type 2 diabetes in two large prospective cohort studies. During his period as a Ph.D. candidate, he conducted observational research at the Harvard School of Public Health (HSPH) in Boston, MA, U.S.A. during a 5-month stay in close collaboration with Dr. Eric B. Rimm and Dr. Kenneth J. Mukamal. He won a New Investigator Travel Award in 2009 for attending the annual meeting of the Society for the Study of Ingestive Behavior (SSIB) and he was selected for the European Nutritional Leadership Program (ENLP) in 2010. Part of this thesis was nominated for the ‘Foppe ten Hoor’ award in 2010, the annual award of the Netherlands Organization for Scientific Research (NWO) for young researchers in the field of scientific nutrition research.
About the author |
189
List of publications Publications in peer-reviewed journals Joosten MM, de Graaf C, Rietman A, Witkamp RF, Hendriks HFJ. Short-term oral exposure to white wine transiently lowers serum free fatty acids. Appetite. 2010; 55:124-9. Joosten MM, Balvers MGJ, Verhoeckx KC, Hendriks HFJ, Witkamp RF. Plasma anandamide and other N-acylethanolamines are correlated with their corresponding free fatty acid levels under both fasting and non-fasting conditions in women. Nutrition & Metabolism. 2010; 7;49. Joosten MM, Grobbee DE, van der A DL, Verschuren WM, Hendriks HFJ, Beulens JWJ. Combined effect of alcohol consumption and lifestyle behaviors on risk of type 2 diabetes. American Journal of Clinical Nutrition. 2010; 91:1777-83. Joosten MM, Beulens JWJ, Kersten S, Hendriks HFJ. Moderate alcohol consumption increases insulin sensitivity and ADIPOQ expression in postmenopausal women: a randomised, crossover trial. Diabetologia. 2008; 51:1375-81. Le TH, Joosten MM, van der Bijl J, Brouwer ID, de Graaf C, Kok FJ. The effect of NaFeEDTA on sensory perception and long-term acceptance of instant noodles by Vietnamese schoolchildren. Food Quality and Preference. 2007; 18:619–26. Accepted paper Joosten MM, Chiuve SE, Mukamal KJ, Hu FB, Hendriks HFJ, Rimm EB. Changes in alcohol consumption and subsequent risk of type 2 diabetes in men. Diabetes, 2011. Submitted papers Joosten MM, Witkamp RF, Hendriks HFJ. Alterations in total and high-molecular weight adiponectin after moderate alcohol consumption in premenopausal women. Joosten MM, Boetje M, Witkamp RF, Hendriks HFJ. Alcohol-induced increase in lipoproteins does not alter inflammatory response after low-dose in vivo endotoxin challenge in men. Joosten MM, van Erk MJ, Pellis L, Witkamp RF, Hendriks HFJ. Moderate alcohol consumption alters leukocyte gene expression profiles and proteins related to immune response and lipid metabolism in men.
| About the author
190
Other publication Joosten MM and Hendriks HFJ. Gezondheidaspecten van matige alcoholconsumptie Past alcohol in een gezond voedingspatroon? Nederlands Tijdschrift voor Voeding & Diëtetiek. 2010; 65:7-10. (in Dutch). Abstracts in scientific journals Joosten MM, Witkamp RF, Hendriks HFJ. Postprandial peripheral N-acylethanolamides are associated with free fatty acids but not with sensations of appetite and well-being in young normal-weight women. Appetite. 2009; 52:840 (Poster presentation). Joosten MM, De Graaf K, Witkamp RF, Hendriks HFJ. Oral sensory stimulation with alcohol lowers serum free fatty acids in women. Appetite. 2009; 52:840 (Oral presentation). Joosten MM, De Graaf K, Witkamp RF, Hendriks HFJ. Oral sensory stimulation with alcohol suppresses free fatty acids in women. European Journal of Clinical Nutrition. 2009; 63 S3:11 (Poster presentation).
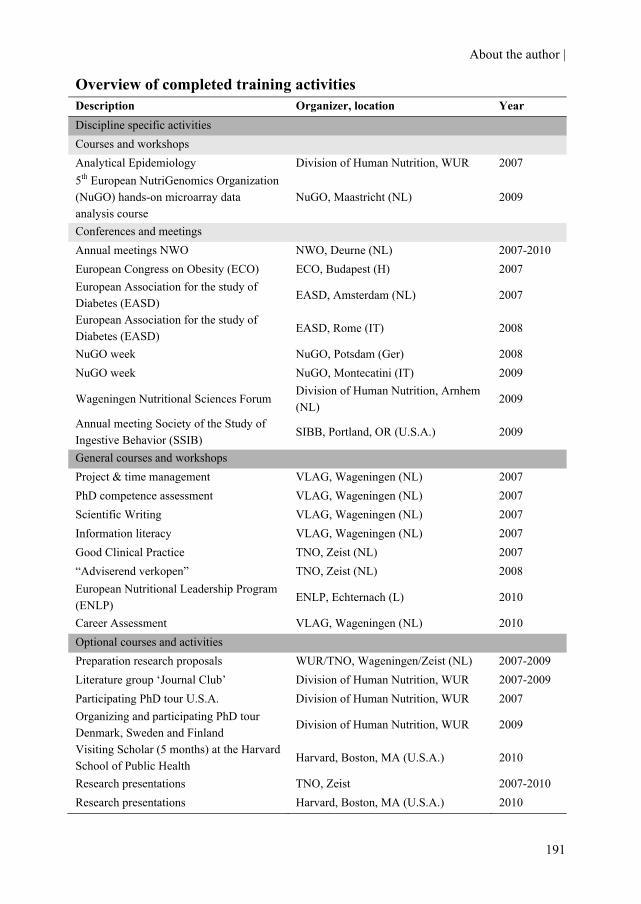
About the author |
191
Overview of completed training activities Description Organizer, location Year Discipline specific activities Courses and workshops Analytical Epidemiology Division of Human Nutrition, WUR 2007 5th European NutriGenomics Organization (NuGO) hands-on microarray data analysis course
NuGO, Maastricht (NL) 2009
Conferences and meetings Annual meetings NWO NWO, Deurne (NL) 2007-2010 European Congress on Obesity (ECO) ECO, Budapest (H) 2007 European Association for the study of Diabetes (EASD)
EASD, Amsterdam (NL) 2007
European Association for the study of Diabetes (EASD)
EASD, Rome (IT) 2008
NuGO week NuGO, Potsdam (Ger) 2008 NuGO week NuGO, Montecatini (IT) 2009
Wageningen Nutritional Sciences Forum Division of Human Nutrition, Arnhem (NL)
2009
Annual meeting Society of the Study of Ingestive Behavior (SSIB)
SIBB, Portland, OR (U.S.A.) 2009
General courses and workshops Project & time management VLAG, Wageningen (NL) 2007 PhD competence assessment VLAG, Wageningen (NL) 2007 Scientific Writing VLAG, Wageningen (NL) 2007 Information literacy VLAG, Wageningen (NL) 2007 Good Clinical Practice TNO, Zeist (NL) 2007 “Adviserend verkopen” TNO, Zeist (NL) 2008 European Nutritional Leadership Program (ENLP)
ENLP, Echternach (L) 2010
Career Assessment VLAG, Wageningen (NL) 2010 Optional courses and activities Preparation research proposals WUR/TNO, Wageningen/Zeist (NL) 2007-2009 Literature group ‘Journal Club’ Division of Human Nutrition, WUR 2007-2009 Participating PhD tour U.S.A. Division of Human Nutrition, WUR 2007 Organizing and participating PhD tour Denmark, Sweden and Finland
Division of Human Nutrition, WUR 2009
Visiting Scholar (5 months) at the Harvard School of Public Health
Harvard, Boston, MA (U.S.A.) 2010
Research presentations TNO, Zeist 2007-2010 Research presentations Harvard, Boston, MA (U.S.A.) 2010

The experimental trials described in this thesis were performed at TNO (a Dutch acronym for applied scientific knowledge) Quality of Life, Zeist, the Netherlands. The research described in this thesis was financially supported by the Dutch Ministry of Economic Affairs and the Dutch Foundation for Alcohol Research (SAR) and a research grant from the European Research Advisory Board (ERAB) grant no 08 21. The printing of this thesis was kindly supported by: Wageningen University, Wageningen, the Netherlands TNO Quality of Life, Zeist, the Netherlands Nederlandse Brouwers, The Hague, the Netherlands Productschap Wijn, The Hague, the Netherlands Commissie Gedistilleerd van het Productschap Dranken, The Hague, the Netherlands Heineken International, Amsterdam, the Netherlands Design cover: Proefschriftmaken.nl Lay-out: Michel M. Joosten Printed by: BOXPress, Oisterwijk || Proefschriftmaken.nl Back cover Squares are photographs of alcohol under a microscope. These photographs were taken after the alcoholic beverages have been crystallized on a slide and shot under a polarized light microscope. From top to bottom:
• Vodka • White table wine • Pilsner beer
Reprinted with permission of Michael W. Davidson of Molecular Expresssions from the Florida State University, Tallahassee, FL, U.S.A. Copyright © Michel M. Joosten, 2010
Copyright © 2022 FDOKUMEN