Depression and inflammation: implications for cardiovascular ...
551
1 A Depression and inflammation: implications for cardiovascular disease Samantha Lawes 2020 University College London Thesis submitted for the degree of Doctor of Philosophy
-
Upload
khangminh22 -
Category
Documents
-
view
0 -
download
0
Transcript of Depression and inflammation: implications for cardiovascular ...

1
A
Depression and inflammation: implications for cardiovascular disease
Samantha Lawes
2020
University College London
Thesis submitted for the degree of Doctor of Philosophy


2
Student Declaration
I, Samantha Lawes, confirm that the work presented in this thesis is my own. Where
information has been derived by other sources, I confirm that this has been indicated in the
thesis.
Signed: __________________ Date: _____________


3
Acknowledgements
Firstly I would like to thank my supervisor Dr Livia Carvalho for her help, guidance and
encouragement throughout my PhD, especially in the laboratory. I have learned so many skills
under her tutelage and without her the Resist Study would not have been possible. I would
also like to thank my second supervisor Professor Andrew Steptoe for his support and
patience, both personal and professional over the years. In particular I would like to thank him
for tirelessly reading and providing feedback on everything I wrote, no matter how boring it
was! I will always remember my time in the Psychobiology group with great fondness. I would
also like to thank the British Heart Foundation for sponsoring my PhD research.
I owe a huge debt of gratitude to my colleagues at UCL, so many of whom I now
consider great friends. Special thanks goes to Ruth Hackett who has been my constant
sounding board and whose unwavering reassurance saw me through the dark times. I’m not
sure I could have got through it without her. I would like to thank Amy Ronaldson, Lydia Poole
and Dorina Cadar for all the advice, support and laughter and for tolerating my incessant
complaining! I would also like to mention Suchita Nadkarni from Queen Mary whom I am
indebted to for helping me deal with the trauma of flow cytometry. It’s because of these people
that I have made it through this PhD with my sanity intact….hopefully.
I must also thank my wonderful family. There aren’t many real superheroes but luckily
I have one as a Dad. He has been my eternal cheerleader and my best friend. Thank you for
making my world safe enough that I could follow my dreams. I love you. I dedicate this thesis
to my amazing daughters, Charley, Yve-Chanté and Jada who are the pride and joy of my life.
Being your mum is the best job I’ll ever have.

4
Abstract
There is extensive evidence linking inflammation with depression, but the nature of this
relationship remains unclear. This PhD consisted of two studies that aimed to investigate the
interaction of immune and neuroendocrine function in major depressive disorder (MDD) and
examine the effects of depressive symptoms and inflammation on mortality risk.
Study 1 sought to garner more information about the relationship between immune
activation and HPA-axis function using data from an observational, case-control study
including people with MDD and healthy controls.
In Study 1a differences in inflammatory cytokines and HPA-axis function, and
associations between them were examined. Results indicated increased inflammation, a
flattened cortisol awakening response under the curve (CAR AUC) and impaired corticosteroid
function in depressed people. Furthermore there was evidence of a negative association
between inflammation and diurnal cortisol rhythm.
In Study 1b changes in depressive symptoms, inflammatory cytokines and HPA-axis
function were investigated longitudinally in people with MDD. The results demonstrated an
improvement in depressive symptoms and mineralocorticoid sensitivity. We also observed a
trend towards an improvement in the CAR AUC and an apparent trend towards a negative
pattern of association between change in inflammation and change in the CAR.
In Study 1c differences in Treg frequency were assessed between people with MDD
and healthy controls. The findings showed no difference between the groups and no
association with either inflammation or HPA-axis function.
Study 2 investigated the combined effects of depressive symptoms and inflammation
on CVD and all-cause mortality risk in a longitudinal cohort study of older people. The results

5
showed that the combination of both factors confers a considerable increase in CVD mortality
risk for men.
Together these studies indicate that there is a relationship between inflammation and
HPA-axis dysfunction in MDD and that men with depressive symptoms and increased
inflammation constitute a high-mortality risk phenotype.

6
Impact Statement
There are a number of ways in which the knowledge presented in this thesis could be/has
been put to a beneficial use. These include:
i. Future research: Depression affects over 300 million people worldwide, with the
majority of patients failing to make a complete recovery, therefore it remains a key area
of research. Efforts to identify the biological underpinnings of depression are aimed at
identifying people who are at risk of developing the condition and finding more effective
treatments. This is one of the first pieces of empirical work comprehensively
investigating the relationship between immune and endocrine dysfunction in people
with depression. By linking two areas of research that have been largely investigated
separately, this research fills a critical gap in the literature and opens up new
challenges and opportunities for academic enquiry.
ii. Clinical practice: Current National Institute for Health and Clinical Excellence (NICE)
guidelines recommend the use of the QRISK2 risk assessment tool to assess risk for
the primary prevention of CVD. To date this has not included measures of circulating
inflammatory markers. There has been some debate about whether inflammation
should be included, with the main uncertainty being whether the modest increases in
risk associated with higher inflammation have clinically meaningful effects on health.
The findings from this PhD demonstrates that men with comorbid depressive
symptoms and high inflammation are almost four times as likely to die from CVD and
therefore do constitute a clinically meaningful risk category. In light of this, it might be
worth considering inflammation as a cardiovascular risk factor in depressed men. This
could help identify patients who may benefit from targeted preventative treatment, such
as anti-inflammatories. It may also improve screening efficacy and cardiovascular
outcomes.

7
iii. I have presented my work on the ELSA study at the Psychoneuroimmunology
Research Society conference (2016) and it was subsequently published in the journal
Psychological Medicine (2018). During my PhD I also contributed to an article
examining whether physical activity explained the association between elevated
inflammation and subsequent depressive symptoms which was published in Brain,
Behaviour and Immunity (2019). I hope to submit a paper from the Resist Study in
2020.
iv. I have included the findings from my research into academic lectures given to Medical
(MBBS BSc) students, Population Heath Sciences (BSc) students and Health,
Nutrition and Exercise (BSc) students. I have also incorporated this knowledge into
non-academic presentations within the National Health Service (NHS), including
community cardiac nurses and psychological well-being practitioners. I also co-led the
Healthy Psychology module for the BSc in Population Health Sciences, assisting with
curriculum design, and wrote exam questions for the Medical students.

8
Table of Contents
1. Literature review: Depression and inflammation ................................................... 24
1.1 Introduction ................................................................................................... 24
1.2 Depression: Prevalence and diagnosis ......................................................... 24
1.2.1 Prevalence ............................................................................................. 24
1.2.2 Diagnosis ............................................................................................... 27
1.3 Depression: aetiology ................................................................................... 31
1.3.1 Structural brain alterations ..................................................................... 33
1.3.2 Neuroplasticity and neurogenesis .......................................................... 34
1.3.3 Brain activity .......................................................................................... 35
1.3.4 Genetic effects ....................................................................................... 37
1.3.5 Stressful life events ................................................................................ 39
1.4 Depression and innate immunity ................................................................... 40
1.4.1 Pro-inflammatory cytokines and depression ........................................... 43
1.4.2 Anti-depressant treatment and inflammation .......................................... 63
1.4.3 Nonsteroidal anti-inflammatory drugs (NSAIDs) ..................................... 70
1.4.4 Cytokine inhibition .................................................................................. 71
1.4.5 Mechanisms of cytokine related depression ........................................... 75
1.5 Depression and neuroendocrine function ...................................................... 78
1.5.1 The hypothalamic-pituitary-axis and the stress response ....................... 78
1.5.1 HPA axis dysregulation and depression ................................................. 80
1.5.2 HPA axis and depression treatment ....................................................... 84
1.5.3 Diurnal HPA axis activity ........................................................................ 86
1.5.4 The role of the corticosteroid receptor .................................................... 98
1.5.5 Mechanisms of glucocorticoid resistance ............................................. 100
1.5.6 Measurement of GR function ............................................................... 104
1.5.7 Depression and the corticosteroid receptors ........................................ 108
1.6 Inflammatory neuroendocrine interaction in depression .............................. 126

9
1.6.1 Glucocorticoids effects on cytokines .................................................... 127
1.6.2 Cytokine effects on glucocorticoids ...................................................... 129
1.6.3 Summary of evidence .......................................................................... 138
1.6.4 Research aims .................................................................................... 139
1.7 Chapter summary ....................................................................................... 141
2. Study 1 - The Resist Study: Introduction and methods ....................................... 143
2.1 The Resist Study ........................................................................................ 143
2.2 Methods ...................................................................................................... 144
2.2.1 Study design ........................................................................................ 144
2.2.2 Sample size ......................................................................................... 144
2.2.3 Recruitment ......................................................................................... 145
2.2.4 Participants .......................................................................................... 150
2.2.5 Study protocol ...................................................................................... 152
2.2.6 Psychosocial Measures ....................................................................... 153
2.2.7 Biological Measures ............................................................................. 159
2.3 Data Storage ............................................................................................... 161
2.4 Statistical analyses ..................................................................................... 161
2.5 My involvement and contribution ................................................................. 162
3. Study 1a - The Resist Study results: .................................................................. 163
3.1 Introduction ................................................................................................. 163
3.2 Hypotheses ................................................................................................. 164
3.3 Biological measures .................................................................................... 167
3.3.1 Plasma IL-6 and TNF-α determination ................................................. 167
3.3.2 Corticosteroid receptor sensitivity ........................................................ 168
3.3.3 Calculation of diurnal cortisol parameters ............................................ 170
3.4 Statistical analysis....................................................................................... 172
3.5 Results ........................................................................................................ 173
3.5.1 Participants .......................................................................................... 173

10
3.5.2 Inflammatory biomarkers ..................................................................... 178
3.5.3 Corticosteroid receptor sensitivity ........................................................ 182
3.5.4 Diurnal cortisol ..................................................................................... 186
3.5.5 Inter-correlations between the systems ................................................ 189
3.5.6 Sensitivity analyses.............................................................................. 192
3.6 Discussion .................................................................................................. 194
3.6.1 Aims and hypotheses ........................................................................... 194
3.6.2 Summary of results .............................................................................. 195
3.6.3 Hypothesis 1: Differences in inflammatory biomarkers ......................... 196
3.6.4 Hypothesis 2: Differences in glucocorticoid sensitivity .......................... 200
3.6.5 Hypothesis 3: Differences in mineralocorticoid sensitivity .................... 201
3.6.6 Hypothesis 4: Differences in diurnal cortisol rhythm ............................. 202
3.6.7 Hypothesis 5: Immuno-neuroendocrine relationships ........................... 208
3.6.8 Perceived stress .................................................................................. 210
3.6.9 Strengths and limitations ...................................................................... 212
3.7 Conclusion .................................................................................................. 215
4. Study 1b - The Resist Study follow-up results: ................................................... 216
4.1 Introduction ................................................................................................. 216
4.2 Hypotheses ................................................................................................. 216
4.3 Biological measures .................................................................................... 219
4.3.1 Plasma IL-6 and TNF-α determination ................................................. 219
4.3.2 Corticosteroid receptor sensitivity ........................................................ 219
4.3.3 Calculation of diurnal cortisol parameters ............................................ 220
4.4 Statistical analysis....................................................................................... 220
4.5 Results: People with MDD at baseline and six week follow-up .................... 221
4.5.1 Participants .......................................................................................... 221
4.5.2 Inflammatory biomarkers ..................................................................... 222
4.5.3 Corticosteroid receptor sensitivity ........................................................ 227
4.5.4 Diurnal Cortisol .................................................................................... 230

11
4.5.5 Inter-correlations between the systems ................................................ 234
4.5.6 Sensitivity analyses.............................................................................. 235
4.6 Discussion .................................................................................................. 239
4.6.1 Aims and hypotheses ........................................................................... 239
4.6.2 Summary of results .............................................................................. 239
4.6.3 Hypothesis 1: Differences in inflammatory biomarkers ......................... 240
4.6.4 Hypothesis 2: Differences in corticosteroid receptor function ............... 241
4.6.5 Hypothesis 3: Differences in diurnal cortisol ......................................... 245
4.6.6 Hypothesis 4: Inter-correlations between the systems ......................... 248
4.6.7 Strengths and limitations ...................................................................... 249
4.6.8 Conclusion ........................................................................................... 251
5. Literature review: Regulatory T cells and depression ......................................... 252
5.1 T-cells and depression ................................................................................ 252
5.2 Regulatory T cells ....................................................................................... 255
5.3 Regulatory T cells in depression ................................................................. 257
6. Study 1c - The Resist Study results: .................................................................. 265
6.1 Introduction ................................................................................................. 265
6.2 Hypotheses ................................................................................................. 265
6.3 Biological measures .................................................................................... 266
6.3.1 Regulatory T cell determination ........................................................... 266
6.4 Statistical analysis....................................................................................... 275
6.5 Results ........................................................................................................ 275
6.5.1 Participants .......................................................................................... 275
6.5.2 CD4+CD25+FoxP3+ Treg frequency ................................................... 276
6.5.3 Correlations with inflammatory biomarkers .......................................... 276
6.5.4 Sensitivity analyses.............................................................................. 277
6.6 Discussion .................................................................................................. 278
6.6.1 Aims and hypotheses ........................................................................... 278
6.6.2 Summary of results .............................................................................. 278

12
6.6.3 Hypothesis 1: Differences in Tregs ...................................................... 279
6.6.4 Hypothesis 2: Relationships with inflammatory biomarkers .................. 282
6.6.5 Hypothesis 3: Relationships with neuroendocrine function ................... 283
6.6.6 Strengths and limitations ...................................................................... 283
6.6.7 Conclusion ........................................................................................... 285
7. Literature review: Understanding depression and inflammation in cardiovascular
disease mortality ....................................................................................................... 286
7.1 Introduction ................................................................................................. 286
7.2 Cardiovascular disease: pathogenesis and prevalence ............................... 286
7.2.1 Pathogenesis ....................................................................................... 286
7.2.2 Prevalence ........................................................................................... 288
7.3 Depression and cardiovascular disease: Introduction ................................. 289
7.4 Depression in patients with existing cardiovascular disease ....................... 289
7.5 Depression as a cardiovascular risk factor .................................................. 293
7.6 Mechanisms linking depression to CVD ...................................................... 295
7.6.1 Behavioural and psychosocial factors .................................................. 296
7.6.2 Biological factors .................................................................................. 301
7.7 Inflammation, depression and CVD ............................................................. 308
7.7.1 Biological pathways ............................................................................. 308
7.7.2 Association between depression and inflammation in CVD .................. 310
7.7.3 Depression, inflammation and CVD risk ............................................... 311
7.7.4 Gender differences in depression and mortality ................................. 314
7.8 Chapter summary ....................................................................................... 316
8. Study 2 - Combined influence of depressive symptoms and systemic inflammation on
all-cause and cardiovascular mortality in ELSA ......................................................... 317
8.1 Overview ..................................................................................................... 317
8.2 The English Longitudinal Study of Ageing (ELSA) Cohort ........................... 317
8.3 My contribution to the ELSA Study .............................................................. 318
8.4 Introduction ................................................................................................. 318

13
8.5 Hypotheses ................................................................................................. 320
8.6 Materials and methods ................................................................................ 320
8.6.1 Study Population .................................................................................. 320
8.6.2 Assessment of inflammation ................................................................ 321
8.6.3 Assessment of depressive symptoms .................................................. 321
8.6.4 Depressive symptoms and inflammation as a combined variable ......... 322
8.6.5 Mortality ............................................................................................... 322
8.6.6 Covariates ........................................................................................... 322
8.7 Statistical analysis....................................................................................... 323
8.8 Results ........................................................................................................ 325
8.8.1 Participants .......................................................................................... 325
8.8.2 Depressive symptoms and inflammation as a combined predictor of CVD
mortality 334
8.8.3 Depressive symptoms and inflammation as a combined predictor of all-cause
mortality 334
8.8.4 Effects of moderation and mediation .................................................... 335
8.9 Discussion .................................................................................................. 342
8.9.1 Aims and hypotheses ........................................................................... 342
8.9.2 Summary of results .............................................................................. 342
8.9.3 Depression, inflammation and mortality ............................................... 342
8.9.4 Effect of gender on the link between depressive symptoms, inflammation and
mortality 344
8.9.5 Study strengths and limitations ............................................................ 346
8.9.6 Conclusion ........................................................................................... 348
9. Discussion ......................................................................................................... 349
9.1 Overview ..................................................................................................... 349
9.2 Main findings and their implications ............................................................ 350
9.2.1 Study 1a: The Resist Study results: The association between inflammation and
HPA-axis function in people with MDD compared with healthy controls ............. 350

14
9.2.2 Study 1b: The Resist Study follow-up results: Changes in depression and
associations with inflammatory biomarkers and HPA-axis function at 6 week follow-up
357
9.2.3 Study 1c: The Resist Study results: Alterations in regulatory T-cells and their
association with inflammation and HPA-axis function in people with depression 360
9.2.4 Study 2: Combined influence of depressive symptoms and systemic
inflammation on all-cause and cardiovascular mortality in the English Longitudinal Study
of Ageing (ELSA) ............................................................................................... 362
9.3 Overall summary of findings in this thesis ................................................... 365
9.4 Methodological issues and limitations ......................................................... 365
9.4.1 The study samples ............................................................................... 365
9.4.2 Biological measurement issues ............................................................ 368
9.4.3 Antidepressant use .............................................................................. 371
9.5 Suggestions for future research .................................................................. 372
9.5.1 The heterogeneity of depression .......................................................... 373
9.5.2 HPA-axis measurement ....................................................................... 375
9.6 Final conclusions ........................................................................................ 376
10. References ..................................................................................................... 378
10.1 Patient information sheet for participants with MDD .................................... 517
10.2 On-line advert recruiting participants with MDD .......................................... 523
10.3 Signposting sheet for on-line participants .................................................... 524
10.4 UCL posters for recruiting participants with MDD ........................................ 526
10.5 Letters of invitation for healthy controls via GP practices ............................ 527
10.6 Consent form .............................................................................................. 528
10.7 Example page from cortisol sampling diary ................................................. 530
10.8 Beck Depression Inventory II ...................................................................... 531
10.9 List of Threatening Events .......................................................................... 534
10.10 Perceived Stress Scale ............................................................................... 536
10.11 Childhood Experience of Care and Abuse Questionnaire............................ 538

15
10.12 Center for Epidemiologic Studies Depression Scale ................................... 546
10.13 Kaplan-Meier Survival curves ..................................................................... 547

16
List of Tables
Table 1.1 DSM-V diagnostic criteria for major depression Adapted from the Diagnostic
and statistical manual of mental disorders 5th edition. 2013. ....................................... 30
Table 1.2 Meta-analyses of cross sectional studies comparing pro-inflammatory
cytokine levels between depressed people and controls ............................................. 50
Table 1.3 Longitudinal studies assessing associations between pro-inflammatory
cytokines and depressive symptoms ........................................................................... 59
Table 1.4 Meta-analyses exploring the effects of antidepressants on cytokine levels . 67
Table 1.5 In vitro measurement of GR function in depression ................................... 113
Table 3.1. Sociodemographic characteristics of the study sample at baseline (n=67) 175
Table 3.2. Clinical characteristics of the study sample at baseline (n=67) ................. 176
Table 3.3. Mean inflammatory and corticosteroid receptor sensitivity parameter values
and p values from analyses comparing differences between people with MDD at
baseline and healthy controls.................................................................................... 180
Table 3.4. Mean cortisol parameter values and p values from analyses comparing
differences between people with MDD at baseline and healthy controls. .................. 188
Table 3.5. Correlations between inflammatory biomarkers and HPA-axis parameters in
people with MDD and healthy controls ...................................................................... 190
Table 3.6. Correlations between biological and perceived stress in people with MDD
and healthy controls .................................................................................................. 191
Table 4.1. Clinical characteristics of people with MDD at baseline and follow-up (n=34)
................................................................................................................................. 222
Table 4.2. Mean inflammatory and corticosteroid receptor sensitivity parameter values
and p values from analyses comparing differences in people with MDD at baseline and
follow-up (n=34). ....................................................................................................... 225
Table 4.3. Mean cortisol parameter values and p values from analyses comparing
differences between people with MDD at baseline and follow-up .............................. 233
Table 4.4. Correlations between change in inflammatory biomarkers and change in
HPA-axis parameters in people with MDD ................................................................ 234
Table 4.5. Correlations between changes in biological and psychological variables in
people with MDD ...................................................................................................... 235

17
Table 4.6. Mean inflammatory and corticosteroid receptor sensitivity parameter values
and p values from analyses comparing differences in people with MDD at baseline and
follow-up according to depressive symptom resolution (n=34) .................................. 238
Table 5.1. Studies examining regulatory T cell levels in people with depression ....... 262
Table 6.1. Flow cytometry fluorochrome-conjugated antibody panel. ........................ 267
Table 6.2. Fluorescence-minus-one (FMO) controls. ................................................ 269
Table 6.3. Correlations between Tregs, and inflammatory biomarkers/HPA-axis
parameters in people with MDD and healthy controls ............................................... 277
Table 8.1. Baseline characteristics of men and women aged 52-89 years by depressive
symptoms and inflammation level ............................................................................. 326
Table 8.2. Characteristics of participants included and excluded from the analyses . 332
Table 8.3 Association between depressive symptoms/inflammation and all-cause and
cardiovascular mortality by sex ................................................................................. 336
Table 8.4. Mediation analyses (n=5,328) .................................................................. 341

18
List of Figures
Figure 1.1 The immune system ................................................................................... 42
Figure 1.2 Balance of pro and anti-inflammatory cytokines. ........................................ 42
Figure 1.3 The hypothalamic-pituitary-adrenal axis. .................................................... 80
Figure 1.4 The circadian rhythm of HPA axis function ................................................. 87
Figure 1.5 Translocation of the GR from the cytoplasm to the nucleus ....................... 99
Figure 2.1 Recruitment pathways for people with depression. .................................. 149
Figure 2.2. Flow diagram of participant data collection and attrition from the Resist
Study. ....................................................................................................................... 151
Figure 3.1 The glucocorticoid sensitivity assay. ........................................................ 169
Figure 3.2. Plasma IL-6 levels in healthy controls and people with MDD at baseline. 178
Figure 3.3. Plasma TNF-α levels in healthy controls and people with MDD at baseline.
................................................................................................................................. 179
Figure 3.4. LPS induced IL-6 in healthy controls and people with MDD at baseline. . 182
Figure 3.5. Dexamethasone suppression of LPS induced IL-6 in healthy controls and
people with MDD at baseline. ................................................................................... 183
Figure 3.6. Dexamethasone inhibition of LPS stimulated IL-6 levels in healthy controls
and people with MDD at baseline. ............................................................................ 184
Figure 3.7. Prednisolone suppression of LPS induced IL-6 in healthy controls and
people with MDD at baseline. ................................................................................... 185
Figure 3.8. MDD versus healthy controls: Mean salivary cortisol values across the day
averaged across all participants. ............................................................................... 187
Figure 3.9. Depressed individuals with and without a history of childhood sexual abuse:
difference in the CAR between groups. ..................................................................... 194
Figure 4.1. Plasma IL-6 levels in people with MDD at baseline and follow-up (n=34).
................................................................................................................................. 223
Figure 4.2. Plasma TNF-α levels in people with MDD at baseline and follow-up (n=34).
................................................................................................................................. 224
Figure 4.3. LPS induced IL-6 in people with MDD at baseline and follow-up (n=32).. 227
Figure 4.4. DEX suppression of LPS induced IL-6 in people with MDD at baseline and
follow up (n=32). ....................................................................................................... 228

19
Figure 4.5. DEX inhibition of LPS stimulated IL-6 levels in people with MDD at baseline
and follow-up (n = 20). .............................................................................................. 228
Figure 4.6. PRED suppression of LPS induced IL-6 in people with MDD at baseline and
follow up (n=32). ....................................................................................................... 229
Figure 4.7. MDD baseline versus follow-up: Mean salivary cortisol values across the
day averaged across all participants ......................................................................... 232
Figure 4.8. Plasma IL-6 levels at baseline and follow-up according to symptom
reduction. .................................................................................................................. 237
Figure 4.9. Prednisolone suppression of LPS induced IL-6 at the highest concentration,
10-6, at baseline and follow-up, according to symptom resolution. ............................. 237
Figure 6.1. Flow cytometry gating strategy for Tregs. .............................................. 274
Figure 6.2. The frequency of peripheral CD4+CD25+FoxP3 Treg cells in healthy
controls and people with MDD. ................................................................................. 276
Figure 7.1.Stages in the development of atherosclerosis .......................................... 287
Figure 7.2. Interactions between inflammatory signalling and CVD related pathways.
................................................................................................................................. 309
Figure 8.1. Adjusted hazard ratios for CVD and all-cause mortality according to levels
of depressive symptoms and inflammation in men. ................................................... 340

20
List of Abbreviations
ACS: Acute coronary syndrome
ACTH: Adrenocorticotropic hormone
APA: American Psychological Association
AUC: Area under the curve
BDI: Beck Depression Inventory
BDNF: Brain-derived neurotrophic factor
BMI: Body Mass index
CABG: Coronary artery bypass graft
cAMP: Cyclic adenosine monophosphate
CAR: Cortisol awakening response
CBT: Cognitive behavioural therapy
CES-D: Center for Epidemiological Studies-Depression
CHD: Coronary heart disease
CI: Confidence interval
CISR: Clinical Interview Schedule-Revised
CNS: Central nervous system
CRH: Corticotropin-releasing-hormone
CRP: C-reactive protein
CSF: Cerebrospinal fluid
CVD: Cardiovascular disease
DA: Dopamine
DEX: Dexamethasone
DIGS: Diagnostic interview for genetic studies
DSH: Data Safe Haven
DST: Dexamethasone suppression test
DSM-V: Diagnostic and Statistical Manual of Mental Disorders
DST: Dexamethasone suppression test

21
ES: Effect size
ELISA: Enzyme-linked immunosorbent assay
ELSA: English Longitudinal Study of Ageing
FACS: Fluorescence-activated cell sorting
FMO: Fluorescence minus one
fMRI: functional magnetic resonance imaging
GAD: Generalised anxiety disorder
GR: Glucocorticoid receptor
GRE: Glucocorticoid response element
GC: Glucocorticoid
GHQ: General health questionnaire
GWAS: Genome wide association study
HRSD: Hamilton Rating Scale for Depression
HF: Heart Failure
HIV: Human immunodeficiency virus
HPA: Hypothalamic-pituitary-adrenal
HRV: Heart-rate variability
HS: High sensitivity
HSE: Health Survey for England
IAPT: Improving access to psychological therapies
ICD-10 International: International Classification of Diseases and Related Health
Problems
IDO: Indoleamine 2,3-dioxygenase
IFN-α: Interferon-alpha
IFN-γ: Interferon-gamma
IL: Interleukin
IL-1β: Interleukin-1 beta
IL-1rα: Interleukin-1 receptor alpha
LPS: Lipopolysaccharide

22
MDD: Major depressive disorder
MFQ: Mood and feelings questionnaire
MI: Myocardial infarction
MR: Mineralocorticoid receptor
MRI: Magnetic resonance imaging
mRNA: Messenger RNA
NA: Noradrenaline
NHS: National Health Service
NICE: National Institute for Health and Clinical Excellence
NSAID: Non-steroidal anti-inflammatory drug
PMBC: Peripheral blood mononuclear cell
PET: Positron emission tomography
pg/ml: Picograms/millilitre
PRED: Prednisolone
PST: Prednisolone suppression test
PSNS: Parasympathetic nervous system
PTSD: Post traumatic stress disorder
PVN: Paraventricular nucleus
RA: Rheumatoid arthritis
RR: Relative risk
SCD: Sudden cardiac death
SES: Socioeconomic status
SLC6A4: Serotonin transporter gene
SLE: Systemic lupus erythematosus
SMD: Standard mean difference
SNP: Single nucleotide polymorphism
SNS: Sympathetic nervous system
SNRI: Selective noradrenlin reuptake inhibitor
SSRI: Selective serotonin reuptake inhibitor

23
TCA: Tricyclic antidepressant
TGF-β: Tumour necrosis factor-beta
Tregs: Regulatory T-cells
TNF-α: Tumour necrosis factor-alpha
TRD: Treatment resistant depression
TRP: Tryptophan
TSST: Trier social stress test
WHO: World Health Organisation
WMD: Weighted mean difference
VSMCs: Vascular smooth muscle cells
5-HT: 5-hydroxytryptamine (Serotonin)
5-HTT: Serotonin transporter
5-HTTLPR: Serotonin-transporter-linked promoter region

24
1. Literature review: Depression and inflammation
1.1 Introduction
This chapter will describe the role of inflammation in the pathogenesis of depression.
This will begin with a brief overview of the prevalence and mortality data regarding
depression, and current guidelines for diagnosis. Following this evidence for the role of
immune dysregulation in the pathogenesis of depression will be presented, with a
particular focus on interaction between inflammatory activation and neuroendocrine
dysfunction. Additionally, this chapter will describe the evidence for alterations in
adaptive immunity in people with depression. The aim of this chapter is to demonstrate
the complexity of the biology of depression and highlight some of the limitations of current
work to date.
1.2 Depression: Prevalence and diagnosis
1.2.1 Prevalence
Depression is a common yet devastating mental disorder, characterized by low mood, a
reduced ability to experience pleasure, complex psychological, physical and social
symptoms and in severe cases, suicidal ideation. Depression affects over 300 million
people, is the leading cause of disability worldwide and has become a major contributor
to the overall global burden of disease (World Health Organisation, 2017b). In the UK,
one in five people become depressed during their lifetime (Royal College of Psychiatrists,
2011). A number of socio-demographic correlates of depression are consistent across
cultures. Women are twice as likely to develop depression compared with men and being
separated, divorced or widowed is also associated with increased risk. The relationship
between depression and age varies across countries. In high income countries, younger

25
people (18-34 years) are more likely to develop depression than older people (65+),
however in low income countries being younger is associated with reduced risk. Low
income is associated with depression in high income countries, however in low-middle
income countries no significant association has been observed (Kessler & Bromet,
2013).
In addition to the psychological effects of depression, this disorder is associated with a
wide variety of physical health conditions such as asthma, rheumatoid arthritis,
inflammatory bowel disease, metabolic syndrome, coronary heart disease, diabetes
mellitus and chronic pain, thereby further increasing its burden of disease (Slavich &
Irwin, 2014). Furthermore, the presence of depressive symptoms worsens health status
substantially more when comorbid with these diseases, than when the diseases occur
alone (Moussavi et al., 2007). Depression has also been associated with infectious
diseases. In patients with human immunodeficiency virus (HIV) infection, depression
negatively affects disease progression, leading to increased risk of developing Acquired
Immune Deficiency Syndrome (AIDS) as well as an increased likelihood of AIDS-related
death (Leserman, 2008). The association between depression and physical health
outcome also appears to be bi-directional. A systematic review and meta-analysis
showed that the risk of depression is trebled for people with two or more chronic physical
conditions compared to those with no physical condition (Read et al., 2017).
Epidemiological studies have consistently demonstrated an increased mortality
associated with depression in both community and psychiatric samples (Cuijpers & Smit,
2002;Lasserre et al., 2016;L. A. Pratt et al., 2016;E. R. Walker et al., 2015;Wulsin et al.,
2005;Wulsin et al., 1999) and in people suffering from stroke (Bartoli et al., 2013),
coronary heart disease (CHD) (Barth et al., 2004;Fan et al., 2014;Q. Wu & Kling, 2016),
chronic kidney disease (Palmer et al., 2013), cancer (Chida et al., 2008) and diabetes
(Lin et al., 2009). Depression has also been specifically associated with mortality in
studies of older adults (Geerlings et al., 2002;Schoevers et al., 2009;Teng et al., 2013).

26
However, there is some inconsistency in the literature, with some studies reporting null
findings (Callahan et al., 1998;Cuijpers, 2001;Hybels et al., 2002;McCusker et al., 2006).
A meta-analysis of 293 prospective studies, including 1,813,733 participants from 35
countries, associating depression at baseline with increased mortality at follow-up, was
conducted by Cuijpers et al. (2014). The analysis included studies of general community
samples as well as specific patient groups. The authors reported that the risk of mortality
in depressed people was 1.52 times that in non-depressed people. Furthermore, the risk
was similar between specific patient populations as well as healthy community-based
samples. This finding suggests that the association between depression and mortality
may be better explained by dysfunction in common biological pathways or lifestyle
factors, as opposed to disease-specific mechanisms.
Differences in mortality according to symptom severity has also been explored. A meta-
analysis of 22 studies, including 18,705 participants, was conducted by Cuijpers et al.
(2013) and compared patients with MDD (major depressive disorder), also known as
clinical depression, to individuals with subthreshold depression, identified by the
presence of depressive symptoms using self-report questionnaires. The authors
reported that both MDD and subthreshold depression were associated with mortality.
Furthermore there was no significant difference in mortality risk between the two types
of depression, suggesting that even mild symptoms of depression can increase the risk
of death. The association between depressive symptoms and mortality across the full
continuum of severity was investigated by White et al. (2015) using data from the English
Longitudinal Study of Ageing (ELSA). Depressive symptoms were associated with
increased mortality risk even when symptom severity was low. The duration of
depressive symptoms has also been associated with mortality in a dose-response
manner, using data from the same cohort (White et al., 2016).
It is still unclear exactly what mechanisms account for the increased mortality rate in
depressed people, however it is likely to be partly explained by the mediating effects of

27
health behaviours. Compared with non-depressed individuals, people with depression
are less likely to be physically active and more likely to be sedentary (Schuch et al.,
2017), more likely to be smokers (Luger et al., 2014), more likely to engage in substance
abuse (Davis et al., 2008), less likely to adhere to medication regimes for chronic illness
(Grenard et al., 2011) and more likely to eat a pro-inflammatory diet, characterised by
high levels of processed meats and trans fats (Lassale et al., 2018). Such general
unhealthy lifestyles will inevitably contribute to the fact that depressed individuals are
more at risk for adverse health outcomes, such as CHD, as these are also important risk
factors for physical illness. However, health behaviours have been shown to explain only
62% of the mortality risk associated with depressive symptoms and 38.5% of the graded
association between the duration of depressive symptoms and mortality risk (White et
al., 2016;White et al., 2015). An alternative explanation is that depressive symptoms
reflect physiological changes which increase the risk of mortality.
1.2.2 Diagnosis
In clinical practice, the most commonly used method for diagnosing MDD is the
structured clinical interview. Interviews are based on diagnostic criteria from the
Diagnostic and Statistical Manual (DSM-V) produced by the American Psychiatric
Association (APA) (American Psychiatric Association, 2013) (see Table 1.1 for a
summary of the DSM-V criteria for MDD) and the International Statistical Classification
of Diseases and Related Health Problems (ICD-10) produced by the World Health
Organization (WHO) (Montgomery, 2016).
According to the DSM-V, MDD is diagnosed by a combination of any five or more
symptoms out of nine occurring during the same two-week period. One of these
symptoms must be depressed mood or anhedonia (loss of interest or pleasure).
Additional cognitive (worthlessness or guilt, concentration, indecisiveness, recurrent
thoughts of suicide) and physiological (appetite, weight, sleep and movement) symptoms

28
need to be present and the symptoms need to disrupt normal social and occupational
functioning. The frequency and duration requirements for each symptom during the two-
week period vary but most have to be present “nearly every day”.
These criteria emerged out of a need to devise a common language for the purpose of
both describing the disorder and providing treatment (B. A. Fischer, 2012). Whilst this
system may appear to be largely broad and rather subjective, it has been useful and
effective in clinical practice, in raising public awareness and in encouraging the
development of specialized forms of psychotherapy (Goldberg, 2011;Sibille & French,
2013). This has resulted in the acceptance by many that depression is homogeneous in
nature and that it is usually a ‘major’ disorder, an idea that is now being called into
question.
Firstly, with the exception of the first symptom, all other eight symptoms contain sub-
symptoms (e.g. fatigue or loss of energy). Secondly, three symptoms contain opposites
(significant weight loss or gain, insomnia or hypersomnia and psychomotor agitation or
retardation). This scoring method has the potential to create over 1,000 combinations of
symptoms that would all qualify the individual for a diagnosis of MDD (Fried & Nesse,
2015a) resulting in four main symptom subtypes: melancholic, atypical, psychotic and
anxious depression (Femke Lamers et al., 2018). Melancholic depression, also referred
to as ‘endogenous’ or ‘typical’ depression, is characterised by loss of pleasure or
nonreactive mood, plus three or more of the following symptoms: distinct quality of mood,
mood that is worse in the morning, early morning awakening, psychomotor changes,
weight loss or decreased appetite, excessive guilt and completed suicide. Atypical
depression is characterised by mood reactivity plus two or more of the following
symptoms: weight gain or increased appetite, hypersomnia, leaden paralysis, and
interpersonal rejection sensitivity. Psychotic or ‘delusional’ depression is severe major
depression with psychotic features, marked by delusions or hallucinations, as well as
over-valued feelings of guilt and worthlessness, severe psychomotor disturbance and

29
cognitive symptoms, characterised by deficits in attention, psychomotor speed,
executive functioning and memory (Harald & Gordon, 2012). Finally, anxious depression
is usually described as major depression with a high level of anxiety, however it may also
be identified as anxiety with depression to a lesser degree or depression caused by
anxiety (Parker & Manicavasagar, 2005). Due to the fact that the other three subtypes
are frequently comorbid with anxiety disorders, anxious depression may overlap with any
of them. Furthermore, there is little evidence of any specific biological or psycho-social
correlates of anxious depression other than an early age of onset, causing some to argue
that it should not qualify as a specific subtype of depression (Harald & Gordon, 2012). In
light of all this, it is hardly surprising that patients with depression exhibit a wide range of
different symptoms.
It is also important to note that many mild cases of depression remit without any
treatment at all, suggesting that they are a self-regulating, adaptive response to life
stress (Wakefield, 1997). Depression may also be a response to drugs or may reflect
hormonal dysfunction in physical illness such as seen in Cushing’s syndrome (Goldberg,
2011). Symptoms may be confused with the depressed phase of bipolar disorder and
there are five particular subtypes of depression that require a specific clinical approach
(somatic, depression with panic attacks, depression in people with obsessional traits,
depression accompanying known physical illnesses and pseudo-demented depression).
Depression is also often co-morbid with other psychiatric disorders, such as anxiety and
personality disorders.

30
Table 1.1 DSM-V diagnostic criteria for major depression Adapted from the Diagnostic
and statistical manual of mental disorders 5th edition. 2013.
A. Five (or more) of the following symptoms present during the same 2-week period
and represent a change from previous functioning; at least one of the symptoms is
either (1) depressed mood or (2) anhedonia
B. Symptoms cause clinically significant distress or impairment in social,
occupational, or other important areas of functioning
C. Episode is not attributable to the physiologic effects of a substance or another
medical condition
1. Depressed mood most of the day (e.g. feels sad, empty, hopeless)
2. Markedly diminished interest or pleasure in almost all activities nearly every day
3. Significant appetite changes or significant weight loss or gain
4. Insomnia or hypersomnia nearly every day
5. Psychomotor agitation or retardation
6. Fatigue or loss of energy
7. Feelings of worthlessness or excessive guilt
8. Diminished ability to think or concentrate or indecisiveness
9. Thoughts of death or suicidal ideation or attempt
Many studies use cut-off scores on validated questionnaires such as the Beck
Depression Inventory (BDI) (A. T. Beck et al., 1996b) or the Hamilton Rating Scale for
Depression (HRSD) (Hamilton, 1960) to establish the presence of depressive symptoms.
Many of these patients will also meet the criteria for MDD and vice versa. Unlike the DSM
there are no essential core symptoms and no requirement for symptoms to disrupt
normal daily functioning (Fried & Nesse, 2015b). This adds further variability to
depressed samples.

31
Whether or not these categorical models of depression map onto any biological substrate
has yet to be determined. Needless to say, no biological test for depression is included
in the DSM-V. It is also becoming increasingly clear that the clinical variations in MDD
are hindering the identification of biomarkers and that different subtypes may reflect
different pathophysiological mechanisms (Antonijevic, 2006). It is therefore unlikely that
a disorder as complex, heterogeneous and widely diagnosed as depression will reflect a
single biological process. Depression not only affects the brain but potentially many other
peripheral organs (Halaris, 2009;McIntyre et al., 2007;Moulton et al., 2015). The notion
of depression as a biological syndrome is supported by the fact that it often has a lifelong
trajectory, mimicking the disease course of neuro-generative disorders which often
include recurring episodes of increasing severity, reduced treatment response and
shorter remission periods (Sibille & French, 2013). To date a clear, comprehensive, and
coherent disease model has yet to emerge and it is most likely that developments in
understanding the pathophysiology of depression will arise from the inter-disciplinary
efforts of many different research fields
1.3 Depression: aetiology
For the last 50 years, the monoamine hypothesis has dominated neurobiological
accounts of depression (Willner et al., 2013). This hypothesis states that the underlying
pathophysiological basis of depression is a deficiency in monoamine levels, including
serotonin (5-HT), dopamine (DA) and/or noradrenaline (NA), at functionally important
receptor sites in the brain. This hypothesis is supported by evidence from animal studies
(Krishnan & Nestler, 2011) and by the mechanism of action of antidepressants, which
cause the short-term increase of monoamine synaptic concentrations, thereby correcting
these deficiencies, and as such has remained the principle theoretical framework for
antidepressant drug development.
32
However, studies of monoamine metabolites and post-mortem brain studies of
depressed patients have yet to provide conclusive evidence for this deficiency (Ferrari &
Villa, 2017). Furthermore the inability of this model to completely explain either the
pathophysiology of depression or the mechanism of action of antidepressants was
highlighted in a study by Miller et al. (1996). The study examined the effects of NA and
5-HT depletion in antidepressant-remitted individuals and healthy controls. The authors
reported NA and 5-HT depletion led to relapse in patients who were in remission,
however it did not lead to depressive symptoms in controls. Furthermore, a meta-
analysis of 52 studies, demonstrated that monoamine depletion decreased mood in
subjects with a family history of MDD and in antidepressant-free patients with MDD in
remission, but did not decrease mood in healthy people (Ruhé et al., 2007). These
findings suggest that monoamines are likely involved in the maintenance of
antidepressant response and may potentially identify individuals who may be vulnerable
to depressive episodes, however they fail to demonstrate a causal link. The intuitive
appeal of this conclusion is strengthened by length of time required for the therapeutic
action of antidepressant treatments to be induced, usually several weeks, despite the
fact that monoamine levels increase within minutes (Ferrari & Villa, 2017).
Newer generation antidepressants have been developed over the years, primarily in
order to reduce the frequency of troublesome, unwanted side effects. However whilst
tolerability has improved, increases in clinical effect have been minimal (Willner et al.,
2013). For approximately 60% of depressed patients, treatments including both
psychotherapy and psychopharmacology do not result in disease remission (Papakostas
& Ionescu, 2015) and of those patients who do respond, many of them will respond just
as well to placebo (Kirsch et al., 2008). Furthermore, approximately 30% of patients do
not respond to treatment at all despite multiple attempts and are considered to be
suffering from treatment resistant (refractory) depression (TRD) (Mrazek et al., 2014).
Although a universal definition of TRD has yet to be clarified, the general consensus is

33
that TRD can be identified by the failure to respond to two or more mechanistically
dissimilar antidepressants (McIntyre et al., 2014).
The limited success of antidepressants may be a reflection of a wider, more complex
neurobiology of depression including genetic effects, changes in neurocircuitry,
neuroplasticity, structural brain alterations and changes in the main neurobiological
systems that mediate the stress response such as the hypothalamic–pituitary–adrenal
(HPA) axis, the autonomic nervous system and the immune system (Kupfer et al., 2012).
I will provide a brief overview of potential aetiological explanations below, before focusing
my attention on the role of the immune system and HPA-axis in the context of depression.
1.3.1 Structural brain alterations
Studies using neuroimaging techniques have reported structural abnormalities in brain
volumes in depressed patients and have been reported across diverse brain networks
(Shen et al., 2017). The most consistent evidence comes from structural magnetic
resonance imaging (MRI) studies which demonstrate that hippocampal volume is
reduced in patients with depression. A meta-analysis of 143 studies showed that when
compared with a healthy brain, depression was associated with smaller grey matter
volume of the basal ganglia, thalamus, hippocampus and various frontal regions
(Kempton et al., 2011). Another meta-analysis by Schmaal et al. (2016) which used
three-dimensional brain MRI data from 1,728 MDD patients and 7,199 controls from 15
research samples worldwide, showed that relative to controls, patients had significantly
lower grey hippocampal volumes but did not show differences in any other subcortical
structures. In addition, a meta-analysis of 193 voxel-based morphometry studies,
demonstrated a depression-specific reduction in hippocampal volume (Goodkind et al.,
2015).

34
Researcher have also investigated the connectivity between brain networks by
examining changes in white matter structure. Altered connectivity in frontal-limbic
circuits, which are involved in communication between brain regions that are involved in
emotion processing, have been shown to significantly predict treatment outcome in
patients with MDD (Korgaonkar et al., 2014). Studies have used diffusion tensor imaging
to investigate white matter microstructure abnormalities in depressed patients. Meta-
analyses of studies measuring fractional anisotropy, a technique used to infer
connectivity between regions, have identified reductions in the left superior longitudinal
fasciculus (M. L. Murphy & Frodl, 2011) and in the white matter fascicles connecting the
prefrontal cortex within cortical (frontal, temporal and occipital lobes) and subcortical
areas (amygdala and hippocampus) (Liao et al., 2013). A more recent study, using data
from the UK Biobank investigated differences in both subcortical grey matter volume and
white matter integrity between depressed individuals and controls in 8,590 participants
(Shen et al., 2017). The authors reported no significant differences in grey matter but
significant reductions were found global white matter integrity in depressed individuals
versus controls. It should, however be noted that findings in this area are inconsistent
and are often complicated by co-morbidities. Furthermore, any clear cause–effect
relationships between these pathological changes and any cognitive aspects of
depression have yet to be demonstrated (Leistedt & Linkowski, 2013).
1.3.2 Neuroplasticity and neurogenesis
A popular hypothesis for the aetiology of depression concerns reductions in neurotrophic
factors which regulate brain plasticity (brain remodeling by forming new neural
connections). Evidence exists for disrupted neuroplasticity and neurogenesis
(generation of new neurons from neural stem or progenitor cells) (Otte et al., 2016).
These studies have predominantly focused on the role of brain-derived neurotrophic
factor (BDNF), a protein essential for neuronal development and survival, synaptic
plasticity, and cognitive function, which is expressed abundantly in adult limbic structures

35
(Krishnan & Nestler, 2008). Reduced levels of BDNF has been observed in the serum of
patients with MDD (Molendijk et al., 2014) and a reduction in BDNF messenger RNA
(mRNA) levels have also been noted in the leukocytes of patients with MDD. A post-
mortem study has also reported a decrease in BDNF levels in the brains of suicide
victims compared with non-suicide controls (Karege et al., 2005). Furthermore, both
pharmacological and non-pharmacological antidepressant therapies have also been
shown to normalize BDNF levels (Molendijk et al., 2014). Another effect of many
antidepressant treatments is the initiation of hippocampal neurogenesis. Blockade of
hippocampal neurogenesis in murine models inhibits the effects of most antidepressant
treatments (Sahay & Hen, 2007). However the exact mechanism involved in how new
neurons improve mood are still unclear.
1.3.3 Brain activity
It seems reasonable to assume that changes in molecular brain structure as discussed
above may be accompanied by changes in brain activity. In fact, experiments examining
brain function such as functional magnetic resonance imaging (fMRI) and positron-
emission tomography (PET), report that activity in the amygdala and prefrontal cortex is
associated with feelings of dysphoria and is chronically increased in people with
depression, returning to normal levels following successful antidepressant therapy
(Drevets, 2001;Ressler & Mayberg, 2007). Complimenting these findings, studies have
investigated the effects of deep brain stimulation on people with TRD. Mayberg et al.
applied stimulation (via surgical implantation of electrodes) to the white matter tracts
adjacent to the subgenual cingulate gyrus and reported a prominent and sustained
remission of symptoms (Mayberg et al., 2005). Similar results have been observed
following deep brain stimulation of the nucleus accumbens, a region associated with
reward and feelings of pleasure (Schlaepfer et al., 2008).

36
Evidence from neuroimaging studies also exists for abnormalities in neural pathways
which suggest that people with depression may have an attentional bias to negative
stimuli. Findings show increases in activity in the amygdala, ventral striatal and medial
prefrontal cortex in response to fearful stimuli (Dannlowski et al., 2007;Fales et al.,
2008;Fu et al., 2008;Keedwell et al., 2005;Surguladze et al., 2005) and reduced ventral
striatal activity in response to positive stimuli (Epstein et al., 2006;Surguladze et al.,
2005).
Studies have also used quantitative electroencephalographic measures of
“spontaneous” brain activity to predict response to antidepressants. Bruder et al. showed
that treatment responders had greater alpha activity compared with non-responders and
healthy controls at occipital sites (2008). Increases in pre-treatment theta activity has
also been observed in the rostral anterior cingulate cortex (rACC) of responders
compared with non-responders (Mulert et al., 2007; Pizzagalli et al., 2001). However this
association has not been consistently observed (Cook et al., 2002).
Neuroimaging studies have also provided evidence for response to antidepressant
medication. Positron emission tomography (PET) and functional magnetic resonance
imaging (fMRI) studies have reported increased baseline (rACC) activity in MDD patients
who responded to treatment (R. J. Davidson et al., 2003;Mayberg et al., 1997;Saxena et
al., 2003). A meta-analysis of 23 studies demonstrated that baseline activity in the rACC
has been shown to reliably predict response to SSRI treatment (Pizzagalli, 2011).
Interestingly, low activity in the rACC predicts remission following cognitive behavioral
therapy (CBT) (Roiser et al., 2012).

37
1.3.4 Genetic effects
It is a well-established finding that depression clusters strongly in families. Twin/family
based heritability estimates for MDD are approximately 35% and first degree-relatives of
MDD patients are three times more likely to develop the condition than the general
population (Geschwind & Flint, 2015). These estimate can increase to 70% if severity,
relapse rate and age of onset are taken into account (Menke et al., 2012b).
For 40 years the search for candidate genes involved in the aetiology of depression has
been underway. Over 100 candidate genes, based on pathophysiological notions, have
been investigated to date, however studies have often been met with limited success
(Shadrina et al., 2018). The most frequently investigated candidate gene is SLC6A4,
which codes for the serotonin transporter that is responsible for the uptake of serotonin
at the synaptic cleft to the presynaptic neuron, and is the drug target of SSRIs. The
promoter region of SLC6A4, contains a polymorphism (5-HTTLPR) which has either a
44bp insertion or deletion, resulting in a long or short variation of this gene (Heils et al.,
1995). The short allele is associated with decreased expression of SLC6A4 mRNA and
lower serotonin reuptake in vitro (Heils et al., 1996;Lesch et al., 1996). Furthermore, it
has been associated with various affective disorders (Serretti et al., 2006) and with
poorer antidepressant response, especially in patients of Caucasian ancestry who were
treated with SSRIs (Porcelli et al., 2012). In a seminal epidemiological study, Caspi et
al. investigated whether 5-HTTLPR was associated with risk of depression in a cohort of
847 participants (2003). They found that the individuals with the short allele exhibited
more depressive symptoms and suicidality in response to stressful life events than
individuals homozygous for the long allele. Moreover, childhood maltreatment predicted
depression in adulthood only in adults carrying a short allele but not among long/long
homozygotes. This study provides evidence for a gene-by-environment (G X E)
interaction, in which the risks of depression conferred on an individual by genetic variants
are dependent on environmental exposure to stress. These findings have been

38
consistently reproduced (Eley et al., 2004;Jacobs et al., 2006;Kendler et al.,
2005;Wilhelm et al., 2006;Zalsman et al., 2006) with a couple of notable exceptions
(Gillespie et al., 2005;Surtees et al., 2006). However recently, a large candidate gene
study found no clear evidence for any gene polymorphism associations with depression
or any polymorphism-by-environment moderator effects (Border et al., 2019).
Advances in microchip technology enabled researchers to conduct genome-wide
association studies (GWAS) which search the entire genome for small variations, called
single nucleotide polymorphisms (SNPs), which occur more frequently in people with
depression, independently of any explanatory hypothesis. However GWAS involving
tens of thousands of patients have failed to identify specific loci which can account for
the development of depression. A mega-analysis of GWAS for MDD analysed more than
1.2 million SNPs in 18,759 European individuals (Ripke et al., 2013). No SNPs achieved
genome-wide significance and further exploratory analyses failed to provide robust
findings. These null findings were replicated in a GWAS combining the results of 17
population-based studies (n=34,549) (Hek et al., 2013).
This result is not entirely surprising as the risk of MDD is highly polygenic and MDD
phenotypes are highly heterogeneous. In addition, the effects of common main genetic
variants for complex human diseases are often small and therefore require far larger
sample sizes than historically available with existing consortia. However, studies which
have used a more homogeneous phenotypic approach have yielded significant results.
A recent GWAS investigated three depression-related phenotypes: broad depression,
probable MDD, and ICD-coded MDD in 322,580 UK Biobank participants (Howard et al.,
2018). The authors reported 17 genetic variants associated across the three phenotypes.
Gene sets were enriched in excitatory neurotransmission, mechanosensory behaviour,
post synapse, neuron spine and dendrite functions. Furthermore a recent genome-wide
association meta-analysis based on 135,458 cases and 344,901 controls, identified 44
independent loci associated with clinical features of MDD (Wray et al., 2018). The results

39
implicated brain regions which also show anatomical differences between MDD cases
and controls, confirming that depression is a brain disorder. They also showed significant
associations with educational attainment and BMI, consistent with both factors being
causal. An ongoing search for consistent genetic variants that contribute to depression
is currently being conducted by the Psychiatric Genomics Consortium
(http://www.med.unc.edu/pgc).
1.3.5 Stressful life events
Stressful life events have been shown to predict subsequent depressive episodes
(Kendler et al., 1999;Kessler, 1997). Historically, studies have often focused on stressful
events in adulthood, usually in the preceding 12 months before onset of depressive
symptoms. These include events such as a serious illness, death of spouse, marital
separation, loss of a job or major financial crisis (Brugha et al., 1985). Furthermore, in
recent decades levels of stress have increased reflecting changing social and economic
demands, coinciding with a rapid rise in the prevalence of depression (Kessler et al.,
2003).
The literature also supports a strong relationship between events in childhood and
depression (M. Li et al., 2016b). This includes physical and sexual abuse, physical and
emotional neglect and exposure to domestic violence, with the more ‘silent’ types of
abuse (neglect and emotional abuse) being the strongest risk factors (Infurna et al.,
2016;Mandelli et al., 2015). Longitudinal studies have shown that adverse childhood
experiences predict symptom severity, recurrence and time to remission (Fuller-
Thomson et al., 2014;Gilman et al., 2013;Rhebergen et al., 2012). Furthermore, the
relationship between the number and severity of adverse life events and the risk, severity
and chronicity of MDD appear to be dose–response in nature (M. Li et al., 2016b).

40
Despite the robust literature demonstrating the link between childhood maltreatment and
depression, the biological mechanisms mediating this relationship remain poorly
understood and understudied (McLaughlin, 2016). Most research in this field has focused
on neurobiology. As previously mentioned, hippocampal atrophy is strongly associated
with depression (Schmaal et al., 2016). Reduced hippocampal volume has also been
observed in people with early life adversity (McCrory et al., 2010) and there are findings
to suggest that smaller volume may mediate the association between childhood abuse
and adult depression (Rao et al., 2010;Vythilingam et al., 2002).
Another way that childhood maltreatment might increase the risk of depression is by
increasing sensitivity to stressors later in life (Kendler et al., 2004).
Neuroendocrinological processes involved in the psychophysiological response to stress
may be altered by adverse childhood experience. The role of the hypothalamic-pituitary-
adrenal (HPA) axis, a complex set of neuronal and endocrine interactions that comprise
the stress response, has been well documented in relation to stress regulation (Gunnar
& Quevedo, 2007). Chronic activation of the HPA-axis has been associated with both
hippocampal atrophy, childhood maltreatment and depression (R. T. Liu, 2017), although
the degree to which this is mediating the link remains unclear. The role of the HPA-axis
in depression will discussed in more detail in section 1.5.
1.4 Depression and innate immunity
The immune system may also play an important role in the development and
maintenance of depression and a vast amount of evidence supports an association
between depressive symptoms and immune dysfunction (Irwin & Miller, 2007;A. H. Miller
et al., 2009;A. H. Miller & Raison, 2016;Raison et al., 2006). The immune system is a
complex network of organs and processes that provide protection against infection and

41
disease. The immune system can be broadly divided into two subsystems, innate and
adaptive immunity, with extensive communication between the two (Dranoff, 2004).
The innate immune response functions as the first line of defence against infection and
is rapid, broad and short lived. Mechanisms of innate immunity include phagocytes such
as monocytes, neutrophils and macrophages, which ingest and destroy microbes, and
natural killer cells, which respond to viral infection. Before it is overwhelmed, the innate
system signals the adaptive immune response via signalling molecules known as
cytokines. The adaptive immune system is a far more sophisticated line of defence and
provides specific, long lasting protection. It is mediated by B-lymphocytes which produce
antibodies, helping to identify and inactivate target cells, and T-lymphocytes which
directly kill target pathogens and orchestrate the cell-mediated immune response (see
Figure 1.1) (Toben & Baune, 2015).
The innate and adaptive immune systems have a collaborative, bi-directional
relationship, thus maintaining homeostasis (state of equilibrium). Immune cells from both
the innate and adaptive systems secrete cytokines (signalling molecules), whose primary
function is to regulate and mediate immunity. Pro-inflammatory cytokines such as
interleukin-6 (IL-6), tumour-necrosis-factor-alpha (TNFα), and the acute phase reacant
C-reactive protein (CRP), promote inflammation. Anti-inflammatory cytokines such as
interleukin-10 (IL-10), interleukin-35 (IL-35) and transforming growth factor beta (TGF-β)
inhibit inflammation (see Figure 1.2).

42
Innate immunity is the critical line of defence against infection. Innate immunity is mediated by white blood cells including basophils, dendritic cells, eosinophils, mast cells, monocytes and macrophages, neutrophils and natural killer cells, as well as soluble factors, such as complement proteins. The adaptive immune response is slower to respond and consists of highly specialised cells which are able to recognize and remember specific pathogens. It consists of antibodies, B cells, and T cells (CD4+ and CD8+ T lymphocytes).
Figure 1.2 Balance of pro and anti-inflammatory cytokines.
Pro-inflammatory cytokines such IL-1, IL-6 and TNF-α and CRP drive the inflammatory response, whereas anti-inflammatory cytokines such as IL-10, IL-35 and TGF-β inhibit inflammation. Pro-inflammatory cytokines have been shown to be increased in people with depression.
Adapted from: Grainger, D. n.d.
Figure 1.1 The immune system

43
However, the traditional view of the immune system as the guardian against pathogens
and infection has been replaced by an appreciation of its role in the regulation of
homeostatic processes throughout the body, including bi-directional interaction with
other organ systems, such as the endocrine system and central nervous system (CNS)
(Toben & Baune, 2015). As a result of this paradigm shift, researchers have explored
the influence of immune processes within several CNS related disorders including
autoimmune diseases, brain injuries, stroke, neurodegenerative diseases and
depression (Capuron & Dantzer, 2003;Klegeris et al., 2007).
Much of the focus on immune activation in depression has been on the role of the innate
immune response and inflammation (Dantzer et al., 2008;A. H. Miller et al., 2009), The
most reliable biomarkers of increased immune response in depressed patients are
elevations in the pro-inflammatory cytokines, IL-6, TNFα, and CRP in peripheral blood
(Dowlati et al., 2010;Haapakoski et al., 2015;Howren et al., 2009;Zorrilla et al., 2001). In
this review, we will present evidence for the role of the innate immune response before
turning our attention to adaptive immunity.
1.4.1 Pro-inflammatory cytokines and depression
The cytokine hypothesis of depression was formulated over 20 years ago and proposes
that internal stressors (e.g. infection or disease) and external stressors (e.g. diet,
psychological distress) activate the immune system, via the release of pro-inflammatory
cytokines, resulting in a range of behavioural, neuroendocrine and neurotransmitter
alterations that are associated with depression (Maes, 1995). The behavioural changes,
otherwise known as ‘sickness behaviour’, include reduced sociability, loss of appetite,
tiredness, disrupted sleep, low mood and irritability, as well as impaired concentration
and memory (Dantzer et al., 2008). These changes in motivation enable the individual to
cope with infection, e.g. via energy conservation (Dantzer, 2001).

44
Evidence from animal studies supports the likely causal nature of this hypothesis. It has
been repeatedly shown that administration of IL-1β or TNF-α to mice or rats induces the
entire range of sickness behaviors in a concentration and time dependent manner
(Dantzer, 2001). These animals assume a hunched position in the corner of their cage
and show little interest in their surroundings. They display decreased locomotor activity,
social withdrawal, loss of appetite, increased sleep, altered cognition and increased
sensitivity to pain. These data were additionally supported by pharmacological
experiments using administration of lipopolysaccharide (LPS), a bacterial toxin which
induces inflammation. LPS induces expression of pro-inflammatory cytokine expression
in the brain (Breder et al., 1994;van Dam et al., 1992) as well as sickness behaviour in
rats (Stepanichev et al., 2014). Administration of anti-inflammatory cytokines, in
particular IL-10, (Bluthe et al., 1999;Dantzer et al., 1999a) and chronic treatment with
antidepressants (Dunn et al., 2005) diminishes the behavioural signs of sickness
attenuates much of the depressive like behaviour associated with pro-inflammatory
cytokines and LPS. IL-10 deficient mice also demonstrate an exaggerated sickness
behaviour in response to administration of LPS compared to wild-type mice (Dantzer et
al., 2008). This exaggerated behaviour is associated with an increased expression of
pro-inflammatory cytokine genes in the brain. These findings support the idea that the
balance of pro and anti-inflammatory cytokines is essential to the regulation of the
behavioral response to stress (see Figure 2).
Animal data also indicates that psychological stress activates pro-inflammatory cytokines
and their signaling pathways both peripherally and in the CNS. Psychological stressors
such as restraint or social isolation have been shown to increase concentrations of IL-
1β and TNF-α in brain regions involved in emotional regulation, and in the periphery of
rats (Madrigal et al., 2002;K. A. O'Connor et al., 2003). Furthermore, depressive-like
symptoms induced by social isolation can be reversed by administration of the soluble
IL-1 receptor antagonist (IL-1ra) (Pugh et al., 1999). Neuronal cell loss following restraint

45
induced stress is also associated with increased concentrations of TNF-α (Madrigal et
al., 2002).
Stress studies in humans produces similar results. Exposure to brief, natural stress such
as taking an examination or experience of stressful life events such as death of a spouse
is associated with increased circulating inflammatory markers (Kiecolt-Glaser et al.,
2002;Marshall et al., 1998). Stressful life events are also associated with increased risk
for many physical health morbidities that involve inflammatory pathophysiology (S.
Cohen et al., 2007;Tosevski & Milovancevic, 2006), including CVD (Steptoe & Kivimaki,
2013). Stress experienced during academic exam periods has been associated with
increased TNF-α, IL-6, IL-1Ra and interferon gamma (IFN-γ) (Maes et al., 1998). An
experimental paradigm has also been employed to study the inflammatory effects of
acute stress. Psychosocial stress tasks such as the Stroop colour-word interference task,
public speaking, mental arithmetic, anger recall, and the Trier Social Stress Test (TSST)
are typically used to induce moderate psychological stress in a laboratory setting. A
meta-analysis of 49 studies that measured the effects of acute stress on circulating
inflammatory markers reported significant stress-related increases in circulating IL-1β,
IL-6, IL-10 and TNF-α but not CRP (Marsland et al., 2017).
Chronic stress, such as caregiving, is also associated with inflammatory activation in
healthy people. One study involving 120 mothers of children newly diagnosed with
cancer, demonstrated that circulating levels of IL-6 increased over the first 6 months
following the child’s diagnosis and remained high at 12-month follow-up (Walsh et al.,
2018). Another study including 33 adults caring for a family member with glioblastoma
and 47 controls who were relatively free of major stress, showed that caregivers'
monocytes showed increased expression of genes bearing response elements for
nuclear-factor kappa B (NFϰB), a key pro-inflammatory transcription factor (G. E. Miller
et al., 2014). A similar study including 11 familial caregivers of brain-cancer patients and
10 matched controls, showed that caregiver’s monocytes demonstrated heightened

46
expression of transcripts with response elements for NFϰB. Caregivers also showed
increased CRP and IL-1Ra (G. E. Miller et al., 2008). A longitudinal community study
followed older men and women who were caregiving for a spouse with dementia and
106 non-caregivers over 6 years (Kiecolt-Glaser et al., 2003). They found that the
average rate of increase in IL-6 was four times as large in caregivers compared to non-
caregivers. Furthermore, the increase in IL-6 among former caregivers was maintained
even several years after the death of the spouse. This finding was independent of
physical comorbidities, medications, or health behaviors that might have accounted for
caregivers' increased IL-6 levels. Further analysis also revealed that this was not simply
a function of depressive symptoms. In a systematic review of 41 studies, increased levels
of CRP were associated with chronic psychosocial stress such as employment stress,
unemployment stress, caregiver stress and discrimination (Johnson et al., 2013).
However, a larger review of 151 studies which focused on stress biomarkers in informal
dementia caregivers found there was mixed evidence for alterations in immune function,
possibly due to multiple methodologies and variability in biomarkers (Allen et al., 2017).
A more recent review of psychosocial stress of caregiving and inflammatory biomarkers
found little evidence of a relationship between stress and inflammation (Potier et al.,
2018). However it should be noted that few of the studies included provided data on
important potential confounding factors, such as the presence of chronic disease or
comorbidities known to be associated with inflammation.
Early-life stress, particularly childhood maltreatment, has been shown to be an
independent risk factor for inflammation in adulthood. Danese et al. (2007) examined the
effect of maltreatment on CRP levels in 866 people from the Dunedin Multidisciplinary
Health and Development Study and reported that maltreated children showed a
significant and graded increase in the risk for clinically relevant CRP levels, 20 years
later, independently of the influence of co-occurring early life risks and adult health and
health behavior. Carpenter et al. (2010) measured plasma IL-6 response to the TSST in
69 healthy adult subjects without depression, 19 of whom had experienced moderate-
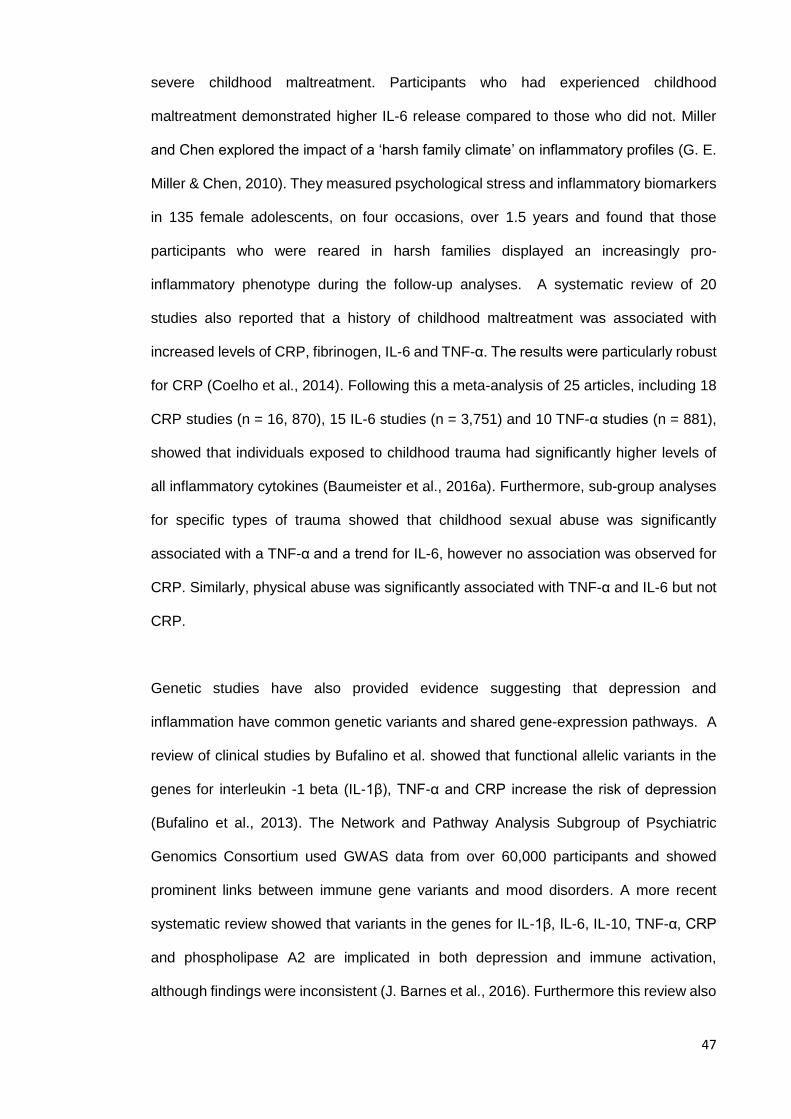
47
severe childhood maltreatment. Participants who had experienced childhood
maltreatment demonstrated higher IL-6 release compared to those who did not. Miller
and Chen explored the impact of a ‘harsh family climate’ on inflammatory profiles (G. E.
Miller & Chen, 2010). They measured psychological stress and inflammatory biomarkers
in 135 female adolescents, on four occasions, over 1.5 years and found that those
participants who were reared in harsh families displayed an increasingly pro-
inflammatory phenotype during the follow-up analyses. A systematic review of 20
studies also reported that a history of childhood maltreatment was associated with
increased levels of CRP, fibrinogen, IL-6 and TNF-α. The results were particularly robust
for CRP (Coelho et al., 2014). Following this a meta-analysis of 25 articles, including 18
CRP studies (n = 16, 870), 15 IL-6 studies (n = 3,751) and 10 TNF-α studies (n = 881),
showed that individuals exposed to childhood trauma had significantly higher levels of
all inflammatory cytokines (Baumeister et al., 2016a). Furthermore, sub-group analyses
for specific types of trauma showed that childhood sexual abuse was significantly
associated with a TNF-α and a trend for IL-6, however no association was observed for
CRP. Similarly, physical abuse was significantly associated with TNF-α and IL-6 but not
CRP.
Genetic studies have also provided evidence suggesting that depression and
inflammation have common genetic variants and shared gene-expression pathways. A
review of clinical studies by Bufalino et al. showed that functional allelic variants in the
genes for interleukin -1 beta (IL-1β), TNF-α and CRP increase the risk of depression
(Bufalino et al., 2013). The Network and Pathway Analysis Subgroup of Psychiatric
Genomics Consortium used GWAS data from over 60,000 participants and showed
prominent links between immune gene variants and mood disorders. A more recent
systematic review showed that variants in the genes for IL-1β, IL-6, IL-10, TNF-α, CRP
and phospholipase A2 are implicated in both depression and immune activation,
although findings were inconsistent (J. Barnes et al., 2016). Furthermore this review also

48
reported that increased mRNA expression of cytokines predicted antidepressant
response.
Depression is also more prevalent in patients with chronic inflammatory diseases such
as cardiovascular disease and type 2 diabetes compared with the general population
(Steptoe, 2007). Moreover up to 50% of patients with autoimmune diseases such as
rheumatoid arthritis and multiple sclerosis experience depressive symptoms (Pryce &
Fontana, 2016). Pro-inflammatory cytokines also induce MDD in patients with medical
illness but no history of depression. Patients receiving inflammation-based treatments
develop symptoms closely resembling depression. Interferon-alpha (IFN-α) is a potent
inducer of pro-inflammatory cytokines and is used to treat infectious diseases or cancer.
IFN-α therapy has been shown to induce symptoms consistent with a diagnosis of MDD
in patients in 30-70% of patients (Schaefer et al., 2012). It has been shown that this may
be partly due to an increased biological sensitivity to IFN-α, evidenced by larger gene
expression changes and specific signatures in those patients who develop IFN-α-
induced depression (Hepgul et al., 2016). In addition, pre-treatment administration of the
SSRI paroxetine results in significantly fewer cases of depression, minimizing the effects
of IFN-α (Musselman et al., 2001). Treatment with IL-2 also induces similar effects, which
are entirely reversible upon cessation of therapy (Denicoff et al., 1987).
Despite the similarity of symptoms between sickness and depression, the nature of the
syndromes is different. Sickness behaviour is an adaptive response to infection and
spontaneously remits upon recovery, unlike depression which persists over time.
Depression could therefore be seen as a maladaptive response to stress, that occurs
when the stimulus is chronic or intense, or when an individual is vulnerable to depression,
for example, in individuals with a history of childhood maltreatment (Dantzer et al., 2008).
The majority of human literature is cross sectional and six meta-analyses show increases
in circulating inflammatory cytokines in depressed individuals compared with non-

49
depressed (Dowlati et al., 2010;Goldsmith et al., 2016b;Hiles et al., 2012b;Howren et al.,
2009;Kohler et al., 2017;Y. Liu et al., 2012) (see Table 1.2).
The most consistent cross-sectional findings are increased levels of circulating IL-6 and
TNF-α in depressed people. A cumulative meta-analysis was also conducted in which
the results from individual studies were added chronologically to determine an aggregate
effect estimate (Haapakoski et al., 2015). The purpose of such an analysis is to explore
whether further studies are needed to accept or reject a hypothesis. The authors
examined the strength of the association between IL-6, IL-1β, CRP, and TNF-α with MDD
in 58 studies. A robust association was confirmed between both IL-6 and CRP and
depression, which remained relatively stable after controlling for the effects of age,
gender, body mass index (BMI) and study size or quality. However the association
between TNF-α and depression was weaker and less consistent, largely due to
heterogeneity in estimates and variability in sub group analyses. It is unclear whether
this reflects a truly weaker relationship or is due to poor control of confounding variables
or inaccuracies in measurement. It should also be noted that these studies were limited
to one-time assessments of inflammatory biomarkers and depression and therefore
distinctions between chronic and acute states could not be made. Furthermore cross-
sectional studies are unable to establish the direction of association between
inflammatory markers and depression.

50
Table 1.2 Meta-analyses of cross sectional studies comparing pro-inflammatory cytokine levels between depressed people and controls
Author/year Cytokines Population; sample size Results
Dowlati et al.
2010
TNF-α 13 studies; n = 788 (438 MDD, 350
controls)
There were significantly higher concentrations of TNF-α in
depressed people compared with controls WMD = 3.97 pg/ml
(95% CI, 2.24 - 5.71)
IL-1β 9 studies; n = 513 (267 MDD, 246 controls) There was no significant difference in IL-1β levels between the
depressed group and controls WMD = -1.58 pg/ml (95% CI, 3.59 -
0.43)
IL-2 5 studies; n = 292 (153 MDD, 139 controls) There was no significant difference in IL-2 levels between the
depressed group and controls WMD = -5.75 pg/ml (95% CI, 100.45
- 88.96)
IL-6 16 studies; n = 892 (492 MDD, 400
controls)
There were significantly higher concentrations of IL-6 in
depressed people compared with controls WMD = 1.78 pg/ml
(95% CI, 1.23 - 2.33)
IL-8 4 studies; n = 382 (205 MDD, 177 controls) There was no significant difference in IL-18 levels between the
depressed group and controls WMD = -0.39 pg/ml (95% CI, 2.13 -
1.35)

51
Table 1.2 continued. Meta-analyses of cross sectional studies comparing pro-inflammatory cytokine levels between depressed people and controls
Author/year Cytokines Population; sample size Results
IFN-γ 4 studies; n = 238 (131 MDD, 107
controls)
There was no significant difference in IFN-γ levels between the
depressed group and controls WMD = -6.63 pg/ml (95% CI, 25.91 -
12.65)
Goldsmith et al.
2016
TNF-α 7 studies; n = 697 (346 MDD, 351
controls)
There were significantly higher concentrations of TNF-α in
depressed people compared with controls ES = 0.05 (95% CI, -
0.10 - 0.19)
IL-1β 3 studies; n = 262 (105 MDD, 157
controls)
There was no significant difference in IL‐1β levels between the
depressed group and controls, ES = 0.21 (95% CI, -0.04 - 0.47)
IL-2 2 studies; n = 100 (82 MDD, 8 controls) There were significantly lower concentrations of IL-2 in
depressed people compared with controls ES = 0.54 (95% CI, -
0.90 to -0.17)
IL-6 7 studies; n = 416 (205 MDD, 211
controls)
There were significantly higher concentrations of IL-6 in
depressed people compared with controls ES = 0.39 (95% CI,
0.20 - 0.59)

52
Table 1.2 continued. Meta-analyses of cross sectional studies comparing pro-inflammatory cytokine levels between depressed people and controls
Author/year Cytokines Population; sample size Results
IL-8 3 studies; n = 263 (126 MDD, 137
controls)
There was no significant difference in IL‐8 levels between the
depressed group and controls, ES = 0.08 (95% CI, -0.16 - 0.32)
IL-12 2 studies; n =195 (82 MDD, 113 controls) There were significantly lower concentrations of IL-12 in
depressed people compared with controls ES = -0.44 (95% CI, -
0.44 to -0.14)
IFN-γ 4 studies; n = 421 (195 MDD, 226
controls)
There was no significant difference in IFN-γ levels between the
depressed group and controls, ES = -0.03 (95% CI = -0.24 - 0.16)
Hiles et al. 2012 IL-6
96 studies (MDD/depressive symptoms
and controls)
There were significantly higher concentrations of IL-6 in
depressed people compared with controls, d = 0.46 (99% CI,
0.34 - 0.58)
Howren et al.
2009
CRP 49 studies; n = 51,234 (MDD/depressive
symptoms)
CRP was positively associated with depression, d = 0.15 (95%
CI, 0.10 - 0.21)
IL-1 14 studies; n = 756 (MDD/depressive
symptoms)
IL-1 was positively associated with depression, d = 0.35 (95%
CI, 0.03 - 0.67)

53
Table 1.2 continued. Meta-analyses of cross sectional studies comparing pro-inflammatory cytokine levels between depressed people and controls
Author/year Cytokines Population; sample size Results
IL-1rα 9 studies; n = 1,214 IL-1rα was positively associated with depression, d = 0.25 (95%
CI, 0.04 - 0.46)
IL-6 61 studies; n = 24,873 (MDD/depressive
symptoms) (MDD/depressive symptoms)
IL-6 was positively associated with depression, d = 0.25 (95%
CI, 0.18 - 0.31)
Kohler et al. 2017 TNF-α 42 studies; n = 3077 (1620 MDD, 1457
controls)
There were significantly higher concentrations of TNF-α in
depressed people compared with controls, ES = 0.68 (95% CI,
0.43 - 0.92)
IL‐1β 22 studies; n = 1506 (779 MDD, 727
controls)
There was no significant difference in IL‐1β levels between the
depressed group and controls, ES = 0.03 (95% CI, −0.29 - 0.35)
IL-1rα 4 studies; n = 258 (148 MDD, 110
controls)
There were significantly higher concentrations of IL-1rα in
depressed people compared with controls, ES = 0.45 (95% CI,
0.08 - 0.82)
IL-6 42 studies; n = 2770 (1587 MDD, 1183
controls)
There were significantly higher concentrations of IL-6 in
depressed people compared with controls, ES = 0.62 (95% CI,
0.49 - 0.76)

54
Table 1.2 continued. Meta-analyses of cross sectional studies comparing pro-inflammatory cytokine levels between depressed people and controls
Author/year Cytokines Population; sample size Results
IL-12 4 studies; n =436 (135 MDD, 301 controls) There were significantly higher concentrations of IL-12 in
depressed people compared with controls, ES = 1.23 (95% CI,
0.28 - 2.18)
IL-17 3 studies; n = 191 (85 MDD, 106 controls) There was no significant difference in IL‐17 levels between the
depressed group and controls, ES = 0.12 (95% CI, −0.54 - 0.30)
IL-18 5 studies; n = 278 (135 MDD, 143
controls)
There were significantly higher concentrations of IL-18 in
depressed people compared with controls, ES = 1.72 (95% CI,
0.38 - 3.06)
IL-8 7 studies; n = 523 (306 MDD, 217
controls)
There was no significant difference in IL‐8 levels between the
depressed group and controls, ES = 0.03 ((95% CI,−0.35 -0.41)
IFN-γ 17 studies; n = 1470 (700 MDD, 770
controls)
There were significantly lower concentrations of IFN-γ in
depressed people compared with controls, ES = -0.48 (95% CI, -
0.94 to -0.02)
Liu et al. 2012 TNF-α 15 studies (MDD and controls) There were significantly higher concentrations of TNF-α in
depressed people compared with controls, SMD = 0.56 (95% CI,
0.13 - 0.99)

55
Table 1.2 continued. Meta-analyses of cross sectional studies comparing pro-inflammatory cytokine levels between depressed people and controls
Author/year Cytokines Population; sample size Results
IL-1β 10 studies There was no significant difference in IL-1β levels between the
depressed group and controls, SMD = −0.53 (99% CI, −1.36 - 0.32)
IL-6 18 studies There were significantly higher concentrations of IL-6 in
depressed people compared with controls, SMD = 0.68 (95% CI,
0.44 - 0.92)
Abbreviations: IL = interleukin; TNF- tumour necrosis factor, IFN = interferon; CRP = C-reactive protein; WMD = weighted mean difference; pg/ml = picogram/millilitre;
CI = confidence interval, d = Cohen’s d, MDD = major depressive disorder, SMD = standard mean difference, ES = effect size

56
Several studies have also reported significant associations between inflammatory
markers and severity of depressive symptoms (Alesci et al., 2005;G. E. Miller et al.,
2002b;Motivala et al., 2005). The association remains even for mild symptoms which do
not meet criteria for MDD (Suarez et al., 2004). However it should be noted that after
adjustment for confounding variables, such as BMI, some studies show a significantly
attenuated association (G. E. Miller et al., 2002b) and in others the association loses
significance completely (Kop et al., 2002).
To address the issue of causation, several longitudinal studies have been conducted to
determine whether elevated inflammation predicts symptoms of depression or whether
depression predicts elevated inflammatory markers (see Table 1.3). Several studies
have shown a significant association between increased levels of CRP at baseline and
subsequent depressive symptoms in otherwise healthy people (Gimeno et al.,
2009;Khandaker et al., 2014;Wium-Andersen et al., 2013;Zalli et al., 2016). Gender
differences have also been reported, with baseline CRP predicting worsening depression
for women, but not for men (Niles et al., 2018). Repeated exposure to CRP was also
observed in a cohort of 2,068 older people (J. A. Bell et al., 2017a). Transient
inflammation (I episode) was not associated with developing depression, however
repeated exposure (2 episodes) was associated with increased risk of future depressive
symptoms among women, but not in men. However findings regarding CRP are
inconsistent, with the association either not reaching significance (Copeland et al.,
2012;Deverts et al., 2010;Glaus et al., 2018;Huang et al., 2019;Khandaker et al.,
2014;Stewart et al., 2009) or losing significance after adjusting for confounders (Chu et
al., 2018).
Studies investigating IL-6, also show that increased cytokine levels at baseline predict
depressive symptoms at follow up (Chu et al., 2018;Gimeno et al., 2009;Khandaker et
al., 2014;Kivimaki et al., 2014;Zalli et al., 2016). The association with IL-6 and symptom
resolution has also been investigated. Using data from the Whitehall II study, Virtanen et

57
al. (2015) showed that individuals with repeatedly low IL-6 levels were more likely to
experience depression remission at follow-up compared with those with repeatedly high
levels. The effects of chronically elevated levels of inflammation on common mental
health disorders have also been investigated using the same cohort. Kivimaki et al.
(2014) examined the association between IL-6 and the cumulative 10-year risk of
common mental disorder among 2,757 people. Compared to participants with low IL-6 at
the beginning of the study, those with high IL-6 had a greater likelihood of common
mental disorder 10 years later. Furthermore, they found that more incidents of elevated
IL-6 a participant experienced, the greater their 10-year risk of common mental disorder,
suggesting a dose-response relationship. The association was similar for both men and
women and was unaffected by acute inflammation, obesity, smoking and drug
treatments. It should be noted that studies using this cohort rely on questionnaire data
which is not the same as a clinical diagnosis of depression. In addition the data is from
an occupational cohort which underrepresents both women and individuals from ethnic
backgrounds and contains people who are likely to be healthier than the general
population. However the repeated measures design is able to capture the chronicity of
inflammation and the direction of association. A recent study by Huang et al. (2019)
showed that baseline IL-6 predicted future depressive symptoms 7 years later, in 166
middle-aged male twins recruited from the Vietnam Era Twin Registry. In contrast,
baseline IL-6 did not predict 6-year change in depressive symptoms in 263 healthy, older
men and women (Stewart et al., 2009).
Only one meta-analysis of longitudinal studies has been conducted to date and showed
that elevated IL-6 and CRP have a small but significant association with the subsequent
development of depressive symptoms (Valkanova et al., 2013). The associations
remained significant after adjusting for a variety of confounders. The effects was larger
for CRP than for IL-6, however that may have been a result of the number of studies
included (eight studies for CRP, n=14,832 and three studies for IL-6, n=3,695).
Alternatively it may reflect a more general role for CRP in driving the inflammatory

58
response (Dantzer & Kelley, 2007). These findings provide support for a biological
pathway from inflammation to depression. However, it remains unclear whether
inflammation is a mediating risk factor or a causal factor.
Studies have also shown a significant association between increased depressive
symptoms at baseline and subsequent levels of CRP (Copeland et al., 2012;Deverts et
al., 2010;Huang et al., 2019;Niles et al., 2018). However some studies have reported
differential findings, with one only observing an association in black people, not white
people (Deverts et al., 2010) and one observing an association in men, but not women
(Niles et al., 2018). Copeland et al. (2012) investigated the effect of current and
cumulative episodes of depression on future CRP and reported that the association
between current depression and CRP was attenuated after controlling for BMI, smoking,
and medication use. In contrast the association between cumulative depression and
CRP remained significant after adjusting for confounders. A significant association
between increased depressive symptoms at baseline and subsequent levels of IL-6 has
also been reported (Stewart et al., 2009), although null findings have also been reported
(Huang et al., 2019). Furthermore, sub-types of depression may be differentially
associated with future IL-6. “Atypical-melancholic” and “unspecified” MDD have been
associated with decreased IL-6 and TNF-α levels, whereas other MDD subtypes were
not associated with any inflammatory markers (Glaus et al., 2014). The authors
speculate that this could be due to decreased levels of monocytes observed in MDD, a
major source of IL-6 concentration (Whooley et al., 2008) or the anti-inflammatory effects
of increased cortisol, which is also observed in MDD (Duivis et al., 2011). Taken together,
these findings suggest that the association between inflammation and depression may
be bidirectional.

59
Table 1.3 Longitudinal studies assessing associations between pro-inflammatory cytokines and depressive symptoms
Author/year Cytokines Population; sample size
Follow-up Depression measure
Results
Bell et al. 2017 CRP 2,068 8 years CES-D Transiently CRP did not predict depressive symptoms
Repeated CRP predicted depressive symptoms (OR = 1.60 (95% CI, 1.00 -
2.55))
Copeland et al.
2012
CRP 1,420 12 years Young Adult
Psychiatric
Assessment
CRP did not predict depressive symptoms
Cumulative baseline depressive symptoms predicted CRP (β = 0.04, p =
<0.0001)
Chu et al. 2018 CRP, IL-6 2731 9 years CIS-R Baseline IL-6 predicted diurnal variation in mood (RR = 1.75 (95% CI, 1.13–
2.69))
No association between CRP and depressive symptoms
Deverts et al.
2010
CRP 2,544 5 years CES-D Baseline depressive symptoms predicted CRP in black people only (β = 0.031,
p<0.001)
Baseline CRP did not predict depressive symptoms
Gimeno et al.
2009
CRP, IL-6 3339-3070,
(30% women)
11.8 years GHQ Baseline CRP (β = 0.038, p = 0.036) and IL-6 (β = 0.041, p = 0.018) predicted
depressive symptoms
Baseline depressive symptoms did not predict CRP or IL-6

60
Table 1.3 continued. Longitudinal studies assessing associations between pro-inflammatory cytokines and depressive symptoms
Author/year Cytokines Population; sample size
Follow-up
Depression measure
Results
Glaus et al. 2018 CRP, TNF-
α, IL-6
3118 (53.7%
women)
5.5 years DIGS Baseline combined melancholic and atypical MDD predicted increased CRP (β
= 0.29 (95% CI, 0.03–0.55))
Baseline atypical MDD predicted increased CRP (β = 0-32 (95% CI, 0.10 –
0.55))
Baseline combined melancholic and atypical MDD predicted decreased IL-6
(β = -0.74 (95% CI, -1.30 to -0.18))
Baseline TNF-α associated with decreased risk of MDD (β = 0.86 (95% CI,
0.78 – 0.95))
Huang et al. 2019 CRP, IL-6 166 (83 pairs)
male twins
7 years BDI-II Baseline CRP did not predict depressive symptoms
Baseline depressive symptoms predicted CRP (β = 0.33, p <0.05)
Baseline IL-6 predicted depressive symptoms (β = 0.22, p <0.05)
Baseline depressive symptoms did not predict IL-6
Khandaker et al.
2014
CRP, IL-6 2447 9 years CIS-R, MFQ No association between CRP and depressive symptoms
Baseline Il-6 predicted depressive symptoms (OR = 1.55 (95% CI, 1.13-2.14))
Kivimaki et al.
2014
IL-6 2757 (24.6%
women)
10 years GHQ Baseline Il-6 predicted depressive symptoms (OR = 1.40 (95% CI, 1.07–1.82))

61
Table 1.3 continued. Longitudinal studies assessing associations between pro-inflammatory cytokines and depressive symptoms
Author/year Cytokines Population; sample size
Follow-up
Depression measure
Results
Niles et al. 2018 CRP 13,775 (59%
women)
4 years CES-D Depressive symptoms predicted CRP in men only (β = 0.03, p = 0.034)
CRP predicted depressive symptoms in women only (β = 0.03, p = 0.006)
Stewart et al.
2009
CRP, IL-6 263 (51.7%
women)
6 years BDI-II No association between CRP and depressive symptoms
Baseline depressive symptoms predicted IL-6 (β = 0.16, p = 0.01)
Baseline IL-6 did not predict depressive symptoms
Virtanen et al.
2015
IL-6 2,419 (33.9%
women)
6.5 years GHQ Low baseline Il-6 predicted depressive symptom remission (RR = 1.15 (95% CI,
1.06–1.25))
Wium-Anderson
et al. 2103
CRP 73,131 Average 5
years
Antidepressant
use and
hospitalisation
with depression
Increasing CRP levels were associated with increasing risk for hospitalization
with depression (P = 4 × 10⁻⁸ for trend)
Zalli et al. 2016 CRP, IL-6 656 (64.5%
women)
5 years CES-D IL-6 predicted depressive symptoms (OR = 2.44, p = 0.030)
CRP IL-6 predicted depressive symptoms (OR = 1.81, p = 0.052)
Abbreviations: CIS-R = Clinical Interview Schedule – Revised; MFQ = Mood and Feelings Questionnaire; GHQ = General Health Questionnaire, OR = odds ratio;
RR = relative risk; BDI-II = Beck Depression Inventory-II; DIGS = Diagnostic Interview for Genetic Studies; PHQ = Patient Health Questionnaire; CRP = C-Reactive
Protein; IL-6 = Interleukin-6; TNF-α = Tumour Necrosis Factor – alpha; MDD = Major Depressive Disorder; CES-D = Center for Epidemiologic Studies Depression
Scale.

62
The relationship between early life stress, depression and inflammation in adulthood has
also been investigated prospectively. Danese et al. (2008) followed a birth cohort of 1000
individuals followed up to age 32 years as part of the Dunedin Multidisciplinary Health
and Development Study. Childhood maltreatment during the first decade of life was
assessed retrospectively and participants were assessed for current MDD and
circulating inflammatory biomarkers. The results showed that depression was associated
with high levels of CRP, however this association was attenuated and lost significance
after controlling for childhood maltreatment. Participants who had current depression and
a history of childhood maltreatment had higher risk of CRP levels compared to controls.
Moreover, even in the absence of a current depressive episode, people with a history of
maltreatment were more significantly more likely to show high CRP levels than controls.
However this risk was not significant for those with depression but no history of childhood
maltreatment. These findings suggest that a childhood maltreatment may significantly
contribute to the comorbidity of depression and inflammation. Furthermore it may explain
why some depressed people exhibit elevated inflammation and others do not. The
heterogeneity in the literature may reflect variation in the prevalence of childhood
maltreatment. However, it should be noted that in this study, CRP was not measured
before the onset of depression, therefore the direction of the effect was not tested.
Many studies have also investigated central inflammation in patients with MDD, focusing
on cytokines in the cerebrospinal fluid (CSF) and immune cells in the brain, including
microglia, astrocytes and oligodendrocytes (Enache et al., 2019). Microglia, the
macrophages of the CNS, produce several pro-inflammatory cytokines including
interleukin IL-1, IL-6, IL-12, and TNF-α (Mondelli et al., 2017). Astrocytes, the dominant
glial cell in the CNS, are phagocytic and produce IL-6 and TNF-α (Rajkowska &
Stockmeier, 2013). Oligodendrocytes, also glial cells, plays a key role in myelination and
produce IL-1 (Mechawar & Savitz, 2016). Historically, most studies investigating central
immunity have focused on post-mortem brain tissue. However an increasing number of
studies are now using PET (positron emission tomography) scans to investigate

63
microglia activation in vivo (Enache et al., 2019). A recent systematic review and meta-
analysis was conducted investigating studies focusing on markers of central
inflammation in patients with MDD compared with controls (Enache et al., 2019). The
authors reported that depressed patients have higher CSF levels of IL-6 and TNF-α,
increased microglia activation and reduced astrocytes and oligodendrocytes compared
with controls. Furthermore, they observed little correlation between central and
peripheral markers of inflammation. These findings suggests that central inflammation
may not be a result of peripheral inflammation in MDD, although this lack of association
could also be an effect of changes to the permeability of the blood brain barrier (A. H.
Miller & Raison, 2016)
1.4.2 Anti-depressant treatment and inflammation
The effects of anti-depressant medication on cytokine levels has also been the focus of
research studies, however results are inconsistent. Four meta-analyses have
investigated circulating levels of inflammatory markers before and after antidepressant
treatment in people with depression (see Table 1.4). The most consistent finding is a
reduction in IL-6 levels following treatment (Hiles et al., 2012a;Kohler et al.,
2018;Wiedlocha et al., 2018), although the effect has sometimes been small (Hannestad
et al., 2011). Findings regarding other cytokines, such as, TNF-α. CRP and IL-1β, largely
due to the high levels of heterogeneity observed in the studies and the fact they tend to
have small sample sizes and short duration.
To further complicate the issue, inflammation appears to be differentially related to
treatment response to specific medications. In the Genome-Based Therapeutic Drugs
for Depression study, a multicenter open-label randomized clinical trial, 241 men and
women with MDD were randomly allocated to 12-week treatment with either escitalopram
(SSRI) or nortriptyline, a tricyclic antidepressant (TCA) (Uher, 2013). Baseline CRP
differentially predicted treatment outcome with the two drugs. Patients with low levels of

64
CRP (<1 mg/L), showed greater symptom reduction with escitalopram and patients with
higher CRP levels, showed greater symptom reduction with nortriptyline. Similarly in the
Combining Medications to Enhance Depression Outcomes trial, participants were
randomised to a 12 week treatment of either escitalopram plus placebo (SSRI
monotherapy) or bupropion plus escitalopram (Jha et al., 2017). Bupropion is a non-
serotonergic antidepressant which inhibits dopamine reuptake, increases brain
extracellular dopamine concentration and reduces inflammation. Patients with low CRP
level (<1 mg/L) responded better to SSRI monotherapy whereas those with higher levels
responded better to the combination of bupropion and SSRI.
Interaction between inflammatory proteins and medication may help explain variation in
treatment outcome. A study by Yoshimura et al. (2009) compared plasma IL-6 and TNF-
α levels among SSRI responsive or SNRI responsive depressed patients and healthy
controls. Both IL-6 and TNF-alpha were significantly higher in depressed patients than
in healthy controls and treatment with antidepressants significantly reduced levels of
both. In addition, IL-6 level but not TNF-alpha, was higher in SSRI-refractory than SSRI-
responsive depressed patients, and higher in SNRI-refractory than SNRI-responsive
depressed patients. Strawbridge et al. (2015) examined data from 35 studies and
reported that IL-6 levels decreased following antidepressant treatment, regardless of
outcome. However TNF-α levels decreased only in those who responded, whereas
treatment resistance was associated with persistently elevated TNFα. In addition, when
the authors combined IL-6, TNF-α and CRP as a composite measure of inflammation,
they found a trend between baseline inflammation and future antidepressant response.
However Kohler et al. (2018) analysed data from 45 studies and reported that whilst IL-
6 and TNFα were reduced following treatment, reductions were not significantly
associated with treatment response.
However there is evidence from in vitro studies that antidepressants can also stimulate
inflammation. Both imipramine (TCA) and venlafaxine (SSRI) increased the production

65
of IL-6 in depressed, SSRI-pretreated patients and when the drugs were used at a higher
concentrations. A study by Szuster-Ciesielska et al. (2003) reported that whilst
clomipramine (TCA), inhibited stimulated levels of IFN-γ, it also enhanced unstimulated
levels. The finding that co-incubation with immunostimulants may modulate the
immunomodulatory effect of antidepressants has implications for depressed individuals
with elevated inflammatory biomarkers. It is possible that antidepressants might have
differential effects, depending on pre-existing levels of inflammation. A review by
Baumeister et al. (2016b) demonstrated that in vitro incubation with some
antidepressants, such as clomipramine and fluoxetine, decrease production of IL-6,
(IFN)-γ and TNF-α, whilst others, such as mirtazapine and venlafaxine, tend to increase
production. In addition, the effects of anti-inflammatory effects of antidepressants appear
to be dose-dependent. Diamond et al. (2006) showed that exposure to a low
concentration of desipramine (TCA) resulted in an increase in IFN-γ and IL-10
production, whilst inhibiting them at higher doses.
The effects of non-pharmacological therapies on inflammation have also been explored.
A study including un-medicated women suffering from first-episode depression,
reductions in IL-6 were associated with a reduction in depressive symptoms following
seven weeks of CBT (Gazal et al., 2013). However, a similar study reported that whilst
seven weeks of CBT was associated with a reduction in depressive symptoms, IL-6 and
TNF-α, there was no association between symptom remission and change in cytokines
(Moreira et al., 2015). A systematic review by Lopresti (2017) reported that overall, the
evidence suggests that CBT may reduce inflammatory biomarkers and that the
reductions are likely to be clinically meaningful.
Taken together, these results do appear to suggest that there is some degree of
normalisation of cytokine levels following both antidepressant treatment and
psychotherapy. Broadly speaking, elevations in inflammatory biomarkers during
depressive episodes may represent a general over-activation of the immune system,

66
which stabilizes upon symptom resolution (Hiles et al., 2012a). Furthermore, consistently
high levels of inflammation may contribute to treatment resistance, indicating that anti-
inflammatory medication may have a role to play in the treatment of those who do not
respond to conventional therapies. However whilst immunomodulation appears to be
evident, the effect is not always anti-inflammatory, with some cases of activated
inflammation depending on dose, sample type, co-incubation and the specific protein
being measured. To explore this line of enquiry further, studies have investigated
whether the use of anti-inflammatory drugs could improve antidepressant response.

67
Table 1.4 Meta-analyses exploring the effects of antidepressants on cytokine levels
Author/year Population Sample size Cytokines Results
Hannestad et al. 2011
MDD 6 studies (n=115) IL-1β IL-1β was significantly decreased after antidepressant treatment SMD=−0.52 (95% CI −0.83 to −0.20)
13 studies (n=274)
IL-6
There was no significant difference in IL-6 after antidepressant treatment SMD=−0.32 (95% CI −1.06 – 0.43)
13 studies (n=438) TNF-α There was no significant difference in TNF-α after antidepressant treatment SMD=−0.13 (95% CI: −0.55 - 0.29)
Hiles et al. 2012 MDD/depressive symptoms
14 studies
IL-6
IL-6 was significantly decreased after antidepressant treatment SMD=−0.42 (95% CI −0.78 to −0.06)
3 studies
IL-10
No significant effect of antidepressants was observed for IL-10 SMD=−0.45 (95% CI −1.03 to 0.14).
8 studies
CRP CRP was marginally significantly decreased after antidepressant treatment SMD=−0.57 (95% CI −1.14 to 0.01).

68
Table 1.4 continued. Meta-analyses exploring the effects of antidepressants on cytokine levels
Author/year Population Sample size Cytokines Results
Kohler et al. 2018 MDD 24 studies (n=722) IL-6 IL-6 was significantly decreased after antidepressant treatment (Hedges g =−0.454, P<0.001).
10 studies (n = 331) IL-10 IL-10 was significantly decreased after antidepressant treatment (Hedges g =−0.566, P = 0.012).
23 studies (n = 797) TNF-α TNF-α was significantly decreased after antidepressant treatment (Hedges g =−0.202, P = 0.015).
Więdłocha et al. 2018
MDD 4 studies (n = 88) IL-1β IL-1β was significantly decreased after treatment with SSRI only SMD = − 0.434 (95% CI − 0.903–0.348)
7 studies (n = 191)
IL-2
There was no significant difference in IL-2 after antidepressant treatment (p > 0.05).
5 studies (n = 140)
IL-4
IL-4 was significantly decreased after antidepressant treatment (SMD = − 0.726 (95% CI − 1.269 to − 0.184).
17 studies (n = 542)
IL-6 IL-6 was significantly decreased after antidepressant treatment (SMD = − 0.701 (95% C: − 1.024 to − 0.379)

69
Table 1.4 continued. Meta-analyses exploring the effects of antidepressants on cytokine levels
Author/year Population Sample size Cytokines Results
6 studies (n = 154) IL-10 IL-10 was significantly decreased after antidepressant treatment (SMD = − 0.763 (95% CI − 1.247 to − 0.278)
9 studies (n = 325)
CRP
There was no significant difference in CRP after antidepressant treatment (p > 0.05).
16 studies (n = 457)
TNF-α
There was no significant difference in TNF-α after antidepressant treatment (p > 0.05).
6 studies (n = 154) IFN-γ There was no significant difference in IFN-γ after antidepressant treatment (p > 0.05).
Abbreviations: MDD = Major Depressive Disorder; IL = interleukin; TNF-𝛼 = tumour necrosis factor- alpha, IFN-γ = interferon-gamma; CRP = C-reactive protein; CI
= confidence interval, MDD = major depressive disorder, SMD = standard mean difference.

70
1.4.3 Nonsteroidal anti-inflammatory drugs (NSAIDs)
Several clinical trials have been conducted to test the anti-depressant effects of anti-
inflammatory drugs, in particular nonsteroidal anti-inflammatory drugs (NSAIDs) and
cytokine inhibitors. NSAIDs inhibit the enzyme cyclooxygenase 2 (COX-2), which is
responsible for the production of pro-inflammatory cytokines (Muller et al., 2006). Several
studies have investigated the efficacy of using NSAIDs in combination with anti-
depressants in patients with MDD. A meta-analysis of four studies which used the
selective COX-2 inhibitor, celecoxib, showed that patients receiving adjunctive celecoxib
had significantly improved depression scores compared to anti-depressant plus placebo
(Na et al., 2014). However, potential issues such as heterogeneity and publication bias
could not be sufficiently assessed due to the small number of trials included. The
antidepressant effect of NSAID monotherapy was assessed in a meta-analysis of five
randomised controlled trials (RCTs) in patients with active osteoarthritis (Iyengar et al.,
2013). The authors reported a trend towards reduction of depression symptoms in
patients taking NSAID compared to placebo. A subsequent meta-analysis by Kohler et
al. investigated anti-inflammatory treatment in people with depression, regardless of
concomitant disease or whether the anti-inflammatory treatment was used alone or in
conjunction with antidepressants (2014). The study demonstrated a beneficial effect of
NSAIDs on depressive symptoms with no evidence of increase risk of adverse effects.
More recently, a meta-analysis of 6 RCTs including both MDD and bipolar disorder
reported a significant moderate antidepressant effect of anti-inflammatory medication,
comparable with effect sizes reported in clinical trials of antidepressants (Husain et al.,
2017).
However NSAIDs are broad-spectrum anti-inflammatory drugs that also act on other
biological targets, such as glucocorticoid receptors, which are also implicated in
depression pathophysiology (Kappelmann et al., 2018). Therefore the exact mechanism
by which they exert their antidepressant effects is still unclear. NSAIDs also increase the

71
risk of CVD, a well-established depression co-morbidity (Mukherjee et al., 2001). In
addition, most studies investigating NSAIDs in depression use medical populations,
making it difficult to determine whether the improvement in depressive symptoms is due
to improvement in physical illness. The use of cytokine inhibitors may be more useful in
elucidating any anti-inflammatory effects on depression as their mechanism of action
targets specific cytokine pathways and both TNF-α and IL-6 blockade have received
particular attention in this regard.
1.4.4 Cytokine inhibition
TNF-alpha
The relatively recent development of drugs which inhibit the production of cytokines has
provided a new way of investigating the relationship between depression and
inflammation. Anti-cytokine treatment is used to treat chronic inflammatory conditions
and antidepressant activity has been investigated in clinical trials where depressive
symptoms were measured as a secondary outcome. The most commonly studied drugs
are TNF-α inhibitors. These have been shown to reduce depressive-like symptoms in an
animal model of stress (Camara et al., 2015;Krügel et al., 2013). In clinical studies, TNF-
α inhibitors have been shown to reduce depressive symptoms in people with rheumatoid
arthritis (RA) (Uguz et al., 2009) psoriasis (Tyring et al., 2006;C. Y. Wu et al., 2016)
irritable bowel disease (Horst et al., 2014) and Crohn’s disease (Lichtenstein et al.,
2002;Persoons et al., 2005). A study by Arisoy et al (2013) also reported that TNF-α
inhibitors significantly decreased depressive symptoms in people with ankylosing
spondylitis. More importantly, this reduction was not associated with changes in markers
of clinical disease activity. Similarly, a study by Uguz et al. (2009) reported that patients
with RA taking anti‐TNF‐α drugs had a significantly lower frequency of any depressive
symptoms compared to patients not receiving the drugs. As with the previous study, the
reduction in symptoms was not associated with any clinical characteristics of RA. This

72
provides further support for the theory that inflammatory activation underpins the
pathophysiology of depression. Two meta-analyses of the effect on TNF-α inhibitor
therapy on depression in people with chronic physical illness have been conducted
(Abbott et al., 2015;Kappelmann et al., 2018). Authors from both studies reported a small
but significant beneficial effect on depression across a variety of clinical populations.
TNF-α inhibition and depression has also been explored longitudinally. Using a
nationwide cohort study, 980 patients with psoriatic arthritis or psoriasis who had
received anti-TNF therapy were followed over approximately 2 years (C. Y. Wu et al.,
2016). The prevalence of patients taking regular antidepressants before starting
biologics therapy was about 20%. The authors reported a 40% reduction in this
prevalence after anti-TNF therapy at follow up. Together, these findings suggest that
patients with chronic inflammatory conditions who take TNF‐α inhibitors experience an
improved affective state and consequently require less antidepressant medications.
To date only a few studies have been conducted to explicitly examine the effects of TNF-
α inhibition on depressive symptoms in people with MDD. The first study to do this was
a randomized, placebo-controlled trial by Maas et al. (2010) where older patients (>60
years) with TRD were randomized to either a single 3-mg/kg dose of the TNF-α inhibitor
infliximab or placebo. The trial was unable to demonstrate a positive effect of the drug
and the trial was prematurely interrupted due to difficulties with patient recruitment.
Following this, Raison et al. (2013b) conducted a single-site, parallel-group, randomized,
double blind trial comparing the effects of infliximab with placebo, in 60 medically stable
MDD patients who were moderately resistant to treatment, as determined by a score ≥2
on the Massachusetts General Hospital Staging method for treatment resistance. Whilst
the authors reported no significant difference in depression scores between the two
groups over time, they did observe an interaction between treatment time and baseline
CRP. Patients who had higher CRP (>5mg/L) at baseline demonstrated greater symptom
reduction with Infliximab, whereas patients who had lower CRP (<5mg/L) demonstrated

73
greater symptom reduction with placebo. Exploratory analyses restricted to patients with
high CRP showed that infliximab treatment resulted in treatment response in 62% of
patients compared with placebo which resulted in treatment response in 33% of patients.
Baseline TNF-α levels were also higher in responders compared to non-responders. The
authors concluded that TNF-alpha antagonism does not have generalized efficacy in
people with TRD but may reduce symptoms in those with a high inflammatory profile.
This supports the notion that a subset of adults with MDD comorbid with elevated
inflammation may be differentially responsive to anti-inflammatory intervention, however
this result needs further replication. A subsequent study was conducted on this sample
to explore the mechanisms of action involved in the response to infliximab (Mehta et al.,
2013). Differential gene expression was examined in peripheral blood mononuclear cells
(PBMCs) from infliximab responders compared to non-responders. Results showed that
148 transcripts were significantly associated with response to infliximab and were distinct
from placebo responders. Transcripts predictive of infliximab response were enriched in
pathways related to both glycolysis and gluconeogenesis and to lipid and cholesterol
homeostasis. Furthermore, responders also demonstrated greater inhibition of genes
related to apoptotic pathways through TNF signalling. The authors conclude that
infliximab response involved regulation of metabolic genes and inhibition of genes
related to innate immune activation. Therefore patients with comorbid depression,
metabolic syndrome and elevated inflammatory markers may benefit from novel anti-
inflammatory treatments for depression, such as anti-TNF.
Interleukin-6
To date there is a far smaller literature regarding IL-6 inhibition and depression.
Preclinical evidence suggests that inhibition of IL-6 signaling may offer protection against
depressive-like behavior using IL-6 knockout mice (Chourbaji et al., 2006). In response
to stress (i.e., forced swim, tail suspension, foot shock), wild-type mice exhibited an
increase in hippocampal IL-6 expression compared to knockout mice, whereas knockout

74
mice were more resilient to stress compared to wild-type. In another study the brain
tissue of rats showed elevated levels of IL-6 following stress exposure. Central
administration of IL-6 also produced depressive-like behaviours in mice and
administration of antidepressants failed to reduce the effect. Moreover IL-6 blockade
prevented the IL-6-induced behavioural changes and attenuated the IL-6 production in
the brain (Sukoff Rizzo et al., 2012). Similar results were reported in a study using a
social defeat stress model in mice (Hodes et al., 2014). Mice susceptible to stress had
significantly higher IL-6 levels compared to controls and these effects were persistent
following subsequent chronic stress (>1 month). However the injection of IL-6
monoclonal antibodies was able to successfully block the development of social
avoidance. Taken together, these data indicate that IL-6 may have a pathophysiological
role underlying depression and suggest that modulation of the IL-6 signaling pathway
may have therapeutic potential.
Sirukumab is a human monoclonal antibody which inhibits IL-6 and is designed for the
treatment of inflammatory conditions. Results from clinical trials in patients with
autoimmune disease suggest that treatment with the drug may improve mental health
outcomes. In a phase I, double-blind, placebo-controlled study investigating the efficacy
of sirukumab in patients with systemic lupus erythematosus (SLE), mental health was
measured as a secondary outcome (Szepietowski et al., 2013). The patient‐reported
outcome data suggests that SLE patients experienced clinically relevant improvements
in mental health. Similarly, in a phase II, randomized, placebo-controlled study of the
safety and efficacy of sirukumab in patients with RA, Smolen et al. (2014) measured
disability-related functional outcomes, including mental health. Significant improvements
were reported with sirukumab compared to placebo. These findings have led to the
suggestion that sirukumab may also alleviate MDD symptoms (A. J. Zhou et al., 2017).
Clinical studies exploring IL-6 blockade in MDD have yet to be published, therefore the
studies described above should be interpreted with caution. They provide a rationale for

75
hypothesizing that IL-6 blockade may be beneficial in the treatment of depression, but
proof-of-concept studies are warranted. A randomized, placebo-controlled, double-blind
phase II study testing the efficacy and safety of sirukumab in participants with MDD is
currently underway (NCT02473289). Until more data is available, lL-6 blockade may be
considered a promising approach in the treatment of depression.
Additional clinical trials have been conducted investigating the effects of add-on anti-
inflammatory medications, such as antibiotics. Minocycline is an antibiotic which can
cross the blood-brain barrier and reduce inflammation. Following a pilot study, which
showed that adjunctive minocycline leads to improvement in depressive symptoms of
TRD (Husain et al., 2015), a larger clinical trial is currently being conducted to determine
its efficacy and acceptability as a treatment option for TRD patients (NCT 03947827).
Omega-3 polyunsaturated fatty acids (omega-3 PUFAs) have also been tested
pharmacologically in the treatment of depression. PUFAs can reduce the production of
inflammatory cytokines and can reduce inflammation through their precursor arachidonic
acid. A recent meta-analysis of double-blind randomized placebo-controlled trials
demonstrated that supplementation with omega-3 PUFAs with eicosapentaenoic acid
are effective at reducing symptoms of depression (Liao et al., 2019). In addition, a clinical
trial of a novel anti-inflammatory drug, a P2X7 receptor blocker, is currently being
conducted to test its efficacy as an adjunct treatment to antidepressant medication TRD
(EudraCT 2018-001884-21). These lines of enquiry are promising, although it is not yet
clear whether these drugs will be effective only as augmentation for antidepressant
medications, or will they be effective as a monotherapy?
1.4.5 Mechanisms of cytokine related depression
The pathways through which cytokines contribute to the development and maintenance
of depression have also been investigated. Findings suggest that cytokine interactions
are so extensive, they span every physiological domain associated with depression

76
pathology (A. H. Miller et al., 2009). The majority of evidence covers neurotransmitter
metabolism, neural plasticity and neuroendocrine function. To date, it is unclear whether
inflammatory processes during depression are initiated locally within the brain or whether
they originate in the periphery and access the brain via mechanisms such as 1) passage
through leaky regions in the blood-brain-barrier, 2) active uptake via transport molecules,
3) activation of endothelial cells and perivascular macrophages in the cerebral
vasculature, producing local inflammation and 4) binding to receptors at peripheral vagal
nerve afferents and relaying cytokine signals to relevant brain regions (Felger & Lotrich,
2013). Neurotransmitter metabolism and neural plasticity will be briefly discussed,
however this PhD will focus predominantly on the interaction between cytokines and
neuroendocrine function.
Neurotransmitter metabolism
As previously mentioned, the action of monoamines have dominated depression
research. Once cytokines reach the brain they can affect the synthesis, release and
reuptake of monoamine neurotransmitters (A. H. Miller et al., 2009). The most studied
neurotransmitter in the context of depression is 5-HT and research has focused on
cytokine effects on the serotonergic system. Polymorphisms in 5-HTTLPR have been
shown to influence pathogenesis of cytokine-induced depression in patients receiving
IFN-α treatment. The 'high transcription' serotonin transporter (5-HTT) genotype was
associated with significantly fewer symptoms of depression (Bull et al., 2008). In vitro
studies have also shown that cytokines upregulate 5-HTT, thereby reducing availability
of 5-HT at the synapse (Morikawa et al., 1998;Ramamoorthy et al., 1995;Zhu et al.,
2006). In addition, treatment with the SSRI, paroxetine, has been shown to reduce IFN-
α induced depression (Musselman et al., 2001). Taken together these findings suggest
that both drugs and gene polymorphisms that affect 5-HT metabolism influence the
development of cytokine-induced depression.

77
Another way in which cytokines influence serotonergic pathways is via monoamine
synthesis, including induction of the enzyme indoleamine 2,3-dioxygenase (IDO). IDO is
a metabolic enzyme in the tryptophan–kynurenine pathway that converts tryptophan
(TRP), the precursor of 5-HT, to kyurenine, resulting in reduced synthesis of 5-HT
(Hestad et al., 2017). In murine studies, IDO blockade has been shown to inhibit LPS-
induced depressive-like behaviour (J. C. O'Connor et al., 2009) and in humans, patients
with inflammatory conditions and those treated with immunotherapy demonstrate
reduced levels of plasma TRP and increased IDO and kyurenine (Bonaccorso et al.,
2002;Capuron et al., 2002b;Dantzer et al., 2010).
Additional experiments have been conducted using an acute TRP depletion technique.
Participants drink a TRP-free amino acid solution and within 4-12 hours plasma TRP
declines to 10–50% of baseline levels. Brain serotonin has been shown to decline in
association with TRP depletion in both animals and healthy volunteers (Moore et al.,
2000). A mega-analysis of studies investigating TRP depletion in people with depression
reported that depletion results in a clinically significant recurrence of depressive
symptoms in approximately 50% of remitted depressed patients (L. Booij et al., 2002).
Neural plasticity
Whilst cytokines are usually associated with inflammation in the periphery, in the CNS
their role is more pleiotropic. During homeostatic conditions, cytokines support
neurogenesis and contributes to cognitive function. However during chronic
inflammatory activation, cytokines can produce a host of central abnormalities including
decreased neurogenesis, increased apoptosis, impaired cognitive function and
increased oxidative stress (A. H. Miller et al., 2009). Peripheral administration of LPS
has been shown to produce impaired hippocampal neurogenesis, increased levels of
TNF‐α and IL‐1β in the hippocampus, impaired spatial learning and memory and
reduced expression of brain‐derived neurotrophic factor (BDNF) (C. W. Wu et al., 2007).

78
In addition cytokine blockade has been shown to prevent the effects of stress on
cognition, neurogenesis and neurotrophic factors (Barrientos et al., 2003;Ben
Menachem-Zidon et al., 2008). Furthermore, cytokines are able to increase glutamate
release (Ida et al., 2008) and decrease the expression of glutamate transporters (Tilleux
& Hermans, 2007), resulting in decreased re-uptake. Glutamate is a major excitatory
synaptic neurotransmitter and increased levels are associated with both CNS disorders
and mood disorders (Mathews et al., 2012).
1.5 Depression and neuroendocrine function
One of the most consistently observed mechanistic effects of cytokines is their impact
on neuroendocrine function. The association between immune activation and
neuroendocrine function will be the focus for the rest of this chapter. Firstly, this next
section will describe the literature regarding neuroendocrine changes in depression and
then evidence for an interaction of the immune system with the neuroendocrine system
within the context of depression will be presented.
1.5.1 The hypothalamic-pituitary-axis and the stress response
Selye originally described stress as a non-specific response of the body to any demand
placed upon it, both physiological and psychological (Selye, 1998). It is now customary
to consider a stressor as a situation or experience that threatens an individual’s ability to
adapt and cope (Lazarus & Folkman, 1984) and confers a real or perceived threat to
homeostasis. Maintenance of homeostasis in the presence of a stressor results in a
‘stress response’, involving the activation of a complex range of responses involving the
endocrine, nervous, and immune systems. Several structures play important roles in the
regulation of the stress response, including the brain stem noradrenergic neurons, the
sympatho-adrenal-medullary system, parasympathetic systems and the hypothalamic-

79
pituitary-adrenal (HPA) axis (S. M. Smith & Vale, 2006). Although these systems interact,
this PhD will predominantly focus on the role of the HPA axis in depression.
The HPA-axis (Figure 1.3) is the principle endocrine system involved in the stress
response (Pariante, 2006). Upon experiencing a stressful event, the amygdala, an area
of the brain that contributes to emotional processing, activates the hypothalamus.
Neurons in the paraventricular nucleus (PVN) of the hypothalamus release corticotropin-
releasing hormone (CRH) into the blood vessels connecting the hypothalamus and the
pituitary gland. CRH stimulates the anterior pituitary gland to produce and secrete
adrenocorticotropic hormone (ACTH) into the general circulation. ACTH, in turn, induces
glucocorticoid synthesis from the adrenal glands, causing the release of glucocorticoids
(GC) (Raison & Miller, 2003). Glucocorticoids subsequently interact with their receptors
– the glucocorticoid receptor (GR) and the mineralocorticoid receptor (MR) to exert their
function (see Section 1.5.5 for a full description). These hormones also inhibit further
release of CRH from the hypothalamus and ACTH from the pituitary, forming a negative
feedback loop (Figure 1.3).
Cortisol, the human glucocorticoid, plays an important role in regulating homeostasis
under basal conditions and during stress. It regulates metabolic, autonomic and
cardiovascular systems, as well as moderating behaviour. (Girod & Brotman, 2004).
However, glucocorticoids are perhaps best known for their role as profound immune
regulators, protecting the host against chronic inflammatory and autoimmune responses
(Silverman & Sternberg, 2012). In addition, glucocorticoids have a powerful effect on the
neural pathways projecting from the hippocampus, amygdala and prefrontal anterior
cingulate cortex to the PVN, regulating neuronal survival and neurogenesis, as well as
influencing the size of anatomical structures such as the hippocampus, which is involved
in cognitive functions such as memory formation and emotional appraisal (E. R. de Kloet
et al., 2007a;Nemeroff & Vale, 2005).

80
1.5.1 HPA axis dysregulation and depression
Stress is known to play a fundamental role in precipitating episodes of depression in
predisposed individuals (Checkley, 1996). Considering the role the HPA-axis plays in
mediating the stress response and brain function, it is not surprising that abnormalities
in function have been observed in depressed people. One of the most robust findings in
biological psychiatry is that individuals with depression exhibit hyperactivity of the HPA
axis (Pariante & Lightman, 2008). This phenomenon effectively represents a prolonged
stress response, regardless of an actual stressor. MDD patients demonstrate increased
concentrations of cortisol in plasma, urine, and cerebrospinal fluid (CSF), an amplified
cortisol response to ACTH and enlarged pituitary and adrenal glands (Pariante & Miller,
2001).
Figure 1.3 The hypothalamic-pituitary-adrenal axis.

81
A meta-analysis of 361 studies, spanning four decades and including 18,454 individuals,
reported that approximately 60% of depressed individuals have increased levels of
cortisol and ACTH compared to non-depressed (Stetler & Miller, 2011). These alterations
are thought to be secondary to increased release of CRH. Depressed patients exhibit
increased CRH in the CSF, increased CRH mRNA and protein in the PVN of the
hypothalamus and a blunted response to ACTH challenge (Pariante & Miller, 2001). HPA
axis abnormalities have also been observed post mortem in the brains of suicide victims,
in particular a reduction of CRH receptors in the frontal cortex (Merali et al., 2004) and
increased weight of adrenal glands (Dumser et al., 1998).
The degree of hyperactivity varies considerably across patient groups and clinical
symptomology (Stetler & Miller, 2011). Evidence suggests that patients who remit have
more pronounced normalization of an initially dysregulated HPA-axis compared to those
who do not (Hennings et al., 2009), although findings in this area are inconsistent
(Ahrens et al., 2008). HPA-axis hyperactivity is most strongly associated with
melancholic depression, which accounts for about 25-30% of depressed patients
(Leistner & Menke, 2018). Psychotic depression, the most severe subtype, accounting
for 15-33% of depressed patients, is accompanied by the most severe HPA-axis
hyperactivity (Schatzberg, 2015). A recent study using data from the English Longitudinal
Study of Ageing (ELSA), showed that higher cortisol was more strongly associated with
somatic rather than cognitive-affective symptoms (Iob et al., 2019).
Whilst MDD is strongly associated with HPA-axis hyperactivity, in contrast hypo-
activation of the HPA axis, characterised by low levels of CRH secretion and
hypocortisolism, has been associated with post-traumatic stress disorder (PTSD) and
atypical, seasonal depression (Juruena et al., 2004). Hypocortisolism has been
repeatedly reported in patients who have experienced a traumatic event and
subsequently developed PTSD (Heim et al., 2000a). Furthermore hypocortisolism is also
present in healthy people experiencing chronic stress as well as in patients with stress-

82
related somatic disorders, such as hypertension, chronic fatigue syndrome, fibromyalgia,
chronic pain syndromes, rheumatoid arthritis and asthma (Heim et al., 2000a;Wirtz et al.,
2007). Atypical depression (characterised by hypersomnia, fatigue, increased appetite
and weight gain) accounts for approximately 15-30% of depression cases (Stetler &
Miller, 2011). Overall, evidence suggests that people with atypical depression have lower
levels of cortisol than people with melancholic depression, usually indistinguishable from
that of healthy controls (Juruena et al., 2018).
Over production of cortisol is thought to damage or impede brain function, including
impaired hippocampal neurogenesis, neuronal survival, neuronal excitability, learning,
and memory (J. Herbert et al., 2006). In animal studies, chronic corticosterone exposure
has been shown to decrease hippocampal neuronal proliferation in mice (David et al.,
2009). In addition, adrenalectomy reduces levels of glucocorticoids and increases
hippocampal neurogenesis in rats, which is subsequently reversed with corticosterone
replacement (Gould et al., 1992). Impaired HPA-axis function, resulting in increased
cortisol secretion and creating a cascade of hippocampal damage has been termed the
“glucocorticoid cascade hypothesis” (Sapolsky et al., 1986). This hypothesis is now
widely accepted as a pathophysiological pathway leading to brain changes associated
with depression.
In humans, the effects of cortisol on brain structure and function are best characterised
by patients with Cushing’s syndrome, which is a collection of symptoms which develop
as a result of glucocorticoid excess. Depression occurs in about 60% of patients with
Cushing's Syndrome, however these symptoms remit upon normalisation of cortisol
levels (W. F. Kelly et al., 1996). Furthermore, premature cerebral atrophy and cognitive
impairments also occur in these patients (N. E. Simmons et al., 2000). The effects of
cortisol on the hippocampus may be particularly relevant to depression in a number of
ways. Firstly, the hippocampus is thought to be an important site for negative feedback
inhibition (S. M. Smith & Vale, 2006). It contains a high number of both GR and MR and

83
glucocorticoid infusion into the hippocampus has been shown to reduce glucocorticoid
release in response to stress. Secondly, the hippocampus is critically involved in mood
processing and so damage may contribute to the debilitating symptoms of depression
(Anacker et al., 2011). In addition, hippocampal damage may explain the memory
defects observed in depressed individuals. Cognitive deficits are a core component of
MDD and evidence suggests that alteration in cortisol levels can impair both learning
and memory (Lupien et al., 2002).
Cortisol effects on the hippocampus could also help explain why people who experience
childhood maltreatment are more susceptible to adult depression. Repeated exposure
to stress in early life resulting in activation of the stress response and chronic cortisol
release may damage the developing hippocampus. There is some evidence to suggest
that brain regions have distinctly different periods of vulnerability during development.
The sensitive-period hypothesis postulates that stress-sensitive brain regions have
independent developmental stages when they are particularly vulnerable to the effects
of early stress (Andersen et al., 2008). Preclinical data show that exposure of the
immature hippocampus to CRH results in cell loss (Brunson et al., 2001) and a particular
subset of cells in the immature hippocampus, but not in the adult hippocampus, have
been shown to release CRH in response to stress (Y. Chen et al., 2004). Childhood
maltreatment during this vulnerable period may therefore result in a ‘diathesis’ for
depression. Severe or prolonged stress in early life triggers activation of the HPA-axis
and cortisol release. This damages the developing hippocampus, resulting in a reduced
ability for the HPA-axis to normalise and an increased sensitivity to stressors later in life.
The experience of further stress in adulthood then results in hyper-activation of the HPA-
axis, further damaging the brain and predisposing the individual to depression.
Animal studies have also shown that early-life stress produces persistent increases in
HPA axis activity (Meaney, 2001). Clinical studies in healthy people (Power et al., 2012)
and people suffering from PTSD (D. Bremner et al., 2007;J. D. Bremner et al., 2003)

84
have shown that childhood maltreatment is associated with lower morning cortisol levels
and a flattening of the diurnal cycle. Adults who experienced childhood abuse also exhibit
enhanced stress reactivity in response to standardized psychosocial stressors
(Carpenter et al., 2011;Heim et al., 2000b;Heim et al., 2002;A. Suzuki et al., 2014).
There is also evidence to suggest that hypercortisolaemia may play a role in
antidepressant resistance (Juruena et al., 2013). Excess glucocorticoids may impair the
modulation of neurotransmission. Specifically, increased production of cortisol
decreases levels of serotonin and norepinephrine availability in the synaptic cleft (Y. P.
Zhang et al., 2018). Following on from this finding, studies have investigated the effects
of anti-glucocorticoid treatment in patients with depression, although they are still at the
proof-of-concept stage. Anti-glucocorticoid drugs decrease the levels of cortisol either
through inhibition of biosynthesis or through antagonism of glucocorticoid receptors
(Price et al., 1996). The importance of baseline cortisol on the efficacy of these drugs
has been examined in a meta-analysis of nine studies by Lombardo et al. (2019) who
showed that patients treated with cortisol synthesis inhibitors, treatment responders had
significantly higher baseline cortisol levels compared with non-responders, however
baseline cortisol was not associated with treatment response in patients treated with a
GR antagonist. This finding supports the notion that personalised treatment for patients
with mood disorders may provide the greatest benefit.
1.5.2 HPA axis and depression treatment
Animal studies demonstrated that antidepressant medication may alter HPA-axis activity
(N Barden et al., 1995;Peeters et al., 1994). Following on, clinical studies have also
provided evidence of normalized HPA axis activity after successful treatment with
antidepressants (Heuser et al., 1996;Linkowski et al., 1987). Plasma and saliva cortisol
has been shown to be reduced following treatment with SSRIs (Dziurkowska et al.,
2013;Hernandez et al., 2013), specifically: mirtazapine (Schmid et al., 2006;Schule et

85
al., 2003;Schüle et al., 2009); amitriptyline (Rota et al., 2005); citalopram (Nikisch et al.,
2005); paroxetine (Nickel et al., 2003); sertraline (Ahmed et al., 2011;Cooney & Dinan,
2000); fluoxetine (Jazayeri et al., 2010) and escitalopram (Ahmed et al., 2011;Park et
al., 2015). However findings are inconsistent with some studies reporting null effects
(Deuschle et al., 2003;Kauffman et al., 2005;Muck-Seler et al., 2002;Rao et al., 2005)
and some reporting time-dependent effects, with shorter administration leading to
increased plasma cortisol and longer administration leading to decreased cortisol (Sagud
et al., 2002).
Depressed patients with hypercortisolaemia are also less likely to achieve a significant
response to antidepressants. A meta-analysis of 34 studies investigating changes in
cortisol and treatment response, including 1,049 depressed patients, reported that 56%
of participants had similar cortisol levels before and after treatment, regardless of
symptom improvement (McKay & Zakzanis, 2010). A more recent meta-analysis of 39
studies also reported that responders and non-responders did not differ in either central
HPA-axis markers (CRH and ACTH) or cortisol (S. Fischer et al., 2017a). However,
further investigation revealed that when their analysis was restricted to studies which
used cortisol from urine or saliva as opposed to blood, non-responders had higher pre-
treatment levels than responders. This can be explained by HPA-axis interaction with the
monoamine systems which are targeted by antidepressants. For example, CRH
receptors are abundantly expressed in extra-hypothalamic areas, which constitute the
main regions of the 5-HT and NA systems (Valentino & Commons, 2005;Valentino & Van
Bockstaele, 2008). During stress CRH can modulate 5-HT and NA activity by shifting the
firing pattern from phasic to tonic (Joëls & Baram, 2009). In addition, hypercortisolaemia
could be a reflection of reduced negative feedback. Impaired glucocorticoid signalling
not only results in hyperactivity of the HPA-axis but also in a reduced ability to inhibit
inflammation (Quan et al., 2003;D. Wang et al., 2011). As already discussed, cytokines
upregulate 5-HTT, reducing the bio-availability of 5-HT (Morikawa et al.,
1998;Ramamoorthy et al., 1995;Zhu et al., 2006). Therefore the interplay between

86
alterations in HPA-axis functioning and increased inflammation could potentially render
specific individuals less likely to benefit from antidepressant treatment.
Cortisol levels following psychological therapy have also been explored. A systematic
review and meta-analysis by Fischer et al. (2017b) reported that higher cortisol levels
before starting psychological therapy predicts more depressive symptoms or reduced
improvement at the end of treatment, although this association was by trend only. The
authors speculate that psychological therapy might be ineffective for people with more
pronounced HPA-axis dysregulation because high levels of cortisol may result in
cognitive impairment, reducing the ability of the patient to successfully engage in therapy.
1.5.3 Diurnal HPA axis activity
HPA-axis researchers are also interested in the diurnal rhythm of cortisol. Cortisol
secretion fluctuates according to a circadian rhythm (Figure 1.4). Under basal (i.e.,
unstressed) conditions, cortisol levels rise throughout the early hours, increasing sharply
around 30 minutes after waking. This is referred to as the cortisol awakening response
(CAR) (Fries et al., 2009). There is then a subsequent decline throughout the day with
lowest levels occurring around midnight. The circadian rhythm is regulated by a central
clock in the suprachiasmatic nucleus of the ventral hypothalamus, which is governed by
light input received from the retina, allowing biological processes to be entrained by
sunlight, and subsequently oscillate according to a 24 hour cycle (Spiga et al., 2014).
HPA-axis dysregulation and altered cortisol rhythm, can result in a change in the size of
the CAR, the degree of decline in cortisol across the day (the slope) and the total or
average level of cortisol across the day (area under the curve (AUC), all of which have
been associated with negative health outcomes (Adam et al., 2017).

87
Under basal (unstressed) conditions, cortisol secretion shows a clear circadian variation over a 24 hour period. The decline of cortisol across the day is referred to as the cortisol ‘slope’.
Depression and the CAR
The CAR is considered a measure of the sensitivity of the HPA-axis to naturally occurring
stress (waking up) (Dedovic & Ngiam, 2015). The CAR can be calculated by either
calculating change over time across multiple time points within the first 60 minutes or by
calculating the CAR AUC, or the overall volume of cortisol released during this first hour.
Expert consensus guidelines on the main aspects of CAR assessment has been
published summarizing the evidence regarding methodological factors affecting CAR
assessment and providing clear direction for future research (Stalder et al., 2016).
A number of studies have investigated the association between subclinical depression
and CAR. Dedovic et al. (2010) compared young healthy adults with moderate and high
levels of depressive symptoms and controls. They reported that people with sub-clinical
levels of depressive symptoms failed to show a significant increase in cortisol levels after
awakening. Furthermore, people with more severe symptoms also demonstrated lower
Figure 1.4 The circadian rhythm of HPA axis function

88
CAR AUC. A similar study in Mexican–American people with no clinical diagnosis of
depression, showed that depressive symptoms were associated with flattening of the
CAR. Additional analyses showed that attenuation of the initial rise in the CAR (difference
between awakening and + 30 minutes) was a significant predictor of depressive
symptomatology (Mangold et al., 2011). In contrast to these findings a study by
Pruessner et al. (2003b) investigating mild levels of depressive symptomatology in
healthy young men reported that increased symptoms were associated with a greater
CAR AUC.
Alterations in CAR have also been associated with psychological traits known to increase
vulnerability to depression. High levels of neuroticism (Madsen et al., 2012;Portella et
al., 2005) and high-trait negative affect (Polk et al., 2005) have been associated with
increased CAR in healthy volunteers. However, a negative correlation has also been
observed between levels of neuroticism and CAR (Mangold et al., 2012). Furthermore
some studies report no association at all (Hill et al., 2013;van Santen et al., 2011).
Hopelessness has been associated with increased CAR AUC (Sjogren et al., 2006),
whereas worry, rumination and loneliness have been associated with flattened CAR
(Cropley et al., 2015;Leah D Doane & Adam, 2010;Kuehner et al., 2007). Associations
have also been made between CAR and anticipation of future stressful events. For
example, the CAR has been shown to be higher on work days compared to non-work
days (Kunz-Ebrecht et al., 2004;Schlotz et al., 2004). Furthermore, this difference was
associated with chronic work overload and worry (Schlotz et al., 2004).
Clinical depression has also been associated with both increased and lowered or blunted
CAR. Findings from a large cohort study, including 1,588 middle-aged people, revealed
that people with current and remitted MDD showed a significantly higher CAR compared
with controls (Vreeburg et al., 2009a). Similar results have been reported in adult women
(Dienes et al., 2013) adolescent females (Ulrike et al., 2013) and older people
(Rhebergen et al., 2015). In contrast, a blunted CAR has been observed in women with

89
mild-to-moderate clinical depression compared with controls (Stetler & Miller, 2005). The
authors reported that although both groups showed similar cortisol levels initially upon
awakening, the depressed group failed to show a significant increase in the following 30
minutes and levels remained significantly lower at 60 minutes post-awakening,
compared with controls. In a study of depressed patients admitted for inpatient
psychotherapy CAR was also found to be blunted in depressed as compared to non-
depressed patients (Huber et al., 2006).
A family history of depression may also be associated with higher CAR, suggesting a
degree of heritability. A study including 49 young people without depression but who had
a parent with a history of MDD, compared CAR with 55 controls without depression and
no reported depression in a first-degree relative (Mannie et al., 2007). Participants with
a family history of depression showed greater CAR levels compared to controls. Similar
results were reported in a study which showed that non-depressed individuals with a
parental history of depression had a higher CAR than those without, which was similar
to that observed in people with depression (Vreeburg et al., 2010).
A number of studies have shown that childhood maltreatment disturbs the CAR.
However, findings are mixed, with some studies suggesting that maltreatment leads to
an increased CAR and some suggesting a blunted CAR. Childhood abuse was
associated with lower morning cortisol levels at awakening, in a study of older adults,
irrespective of depressive symptoms (Wielaard et al., 2018). Increased CAR AUC was
observed in non-depressed participants only and this was associated with childhood
abuse. Childhood physical abuse and sexual abuse have been associated with greater
CAR in fibromyalgia patients. Sensitivity analyses revealed that the results were not
attributable to effects of depression. Another study has reported higher CAR in
maltreated depressed adolescents compared to non-maltreated adolescents (Quevedo
et al., 2017). In contrast, a study investigated the long-term relationship between early
maltreatment and basal cortisol secretion in 623 adults adopted as children (van der Vegt

90
et al., 2009). The CAR AUC was lower in people who reported severe neglect or abuse
compared with non-abused participants. A meta-analysis examining childhood
maltreatment and diurnal cortisol regulation reported blunted waking cortisol levels but
no association between childhood maltreatment and the CAR (Bernard et al., 2017).
A systematic review and meta-analysis of 147 studies was conducted by Chida and
Steptoe (2009) exploring the association between the CAR and psychosocial factors
including general life stress, job stress, depression, hopelessness, fatigue, burnout,
exhaustion, anxiety, and negative affect, as well as positive psychological traits such as
well-being and happiness. Analyses were conducted using both and the change score
of cortisol from the level recorded on waking (CAR) and the calculated AUC over the
waking period (CAR AUC). The authors reported that general life stress were associated
with an increased CAR and CAR AUC. In contrast, fatigue, burnout, or exhaustion were
characterized by a reduced CAR and the CAR AUC was negatively related to
posttraumatic stress syndrome, suggesting differential associations between CAR and
specific psychosocial factors. No overall association was observed between depression
and CAR, however rather than being a null association, this reflected the contradictory
findings in the literature. These inconsistencies may be due to methodological issue such
as poor controlling for confounding variables or may reflect the wide range of symptom
severity, with some studies restricting the sample to patients with MDD and some
including people with subclinical symptoms. Another systematic review was conducted
including 151 studies examining the effects of stress on cortisol in informal dementia
caregivers (Allen et al., 2017). They reported that the most consistent finding was that
caregiving was generally associated with elevated cortisol levels. This increase was
evident at single time points, in the CAR and across diurnal secretion. Due to the
heterogeneity in the findings, a meta-analysis using p-curve analysis was conducted on
709 findings from 212 studies (Boggero et al., 2017). The authors reported inconclusive
results for the CAR, however the AUC during the waking period was positively associated
with depression.
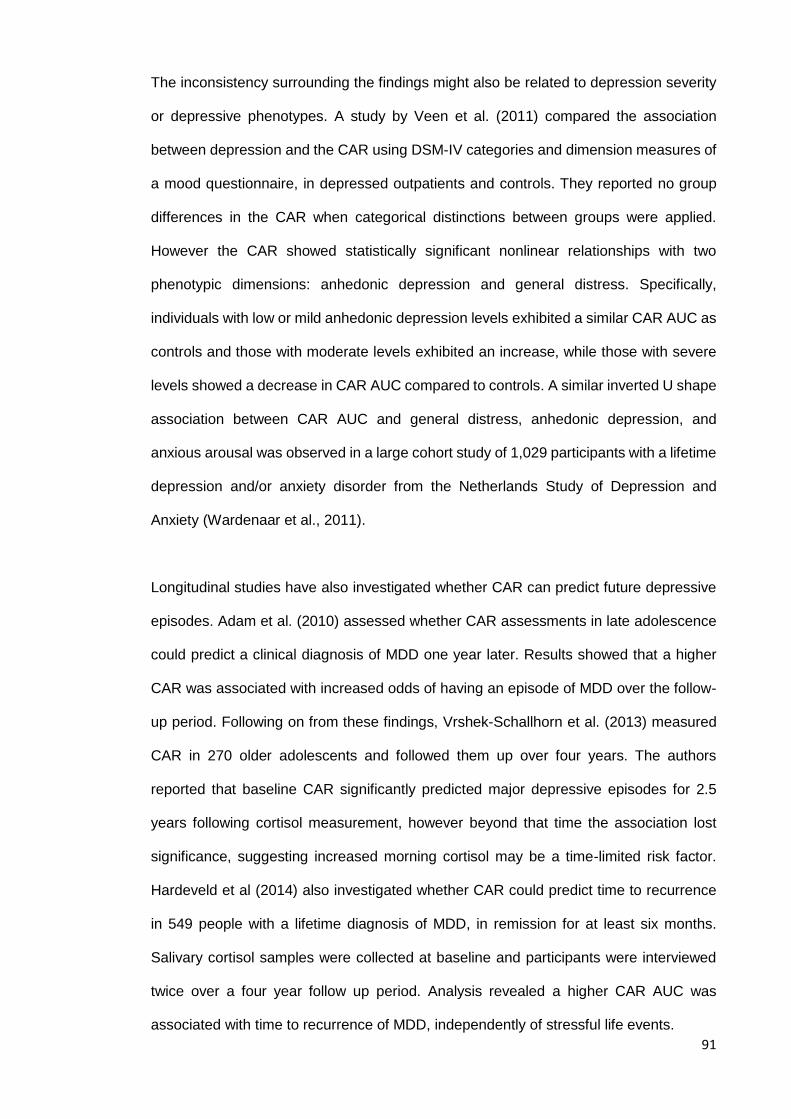
91
The inconsistency surrounding the findings might also be related to depression severity
or depressive phenotypes. A study by Veen et al. (2011) compared the association
between depression and the CAR using DSM-IV categories and dimension measures of
a mood questionnaire, in depressed outpatients and controls. They reported no group
differences in the CAR when categorical distinctions between groups were applied.
However the CAR showed statistically significant nonlinear relationships with two
phenotypic dimensions: anhedonic depression and general distress. Specifically,
individuals with low or mild anhedonic depression levels exhibited a similar CAR AUC as
controls and those with moderate levels exhibited an increase, while those with severe
levels showed a decrease in CAR AUC compared to controls. A similar inverted U shape
association between CAR AUC and general distress, anhedonic depression, and
anxious arousal was observed in a large cohort study of 1,029 participants with a lifetime
depression and/or anxiety disorder from the Netherlands Study of Depression and
Anxiety (Wardenaar et al., 2011).
Longitudinal studies have also investigated whether CAR can predict future depressive
episodes. Adam et al. (2010) assessed whether CAR assessments in late adolescence
could predict a clinical diagnosis of MDD one year later. Results showed that a higher
CAR was associated with increased odds of having an episode of MDD over the follow-
up period. Following on from these findings, Vrshek-Schallhorn et al. (2013) measured
CAR in 270 older adolescents and followed them up over four years. The authors
reported that baseline CAR significantly predicted major depressive episodes for 2.5
years following cortisol measurement, however beyond that time the association lost
significance, suggesting increased morning cortisol may be a time-limited risk factor.
Hardeveld et al (2014) also investigated whether CAR could predict time to recurrence
in 549 people with a lifetime diagnosis of MDD, in remission for at least six months.
Salivary cortisol samples were collected at baseline and participants were interviewed
twice over a four year follow up period. Analysis revealed a higher CAR AUC was
associated with time to recurrence of MDD, independently of stressful life events.

92
CAR has been explored in relation to symptom remission. In a study by Aubry et al.
(2010) cortisol parameters were compared between patients who were in remission for
at least three months and controls. Analysis revealed that CAR AUC was 51% higher in
remitted patients compared to controls, suggesting a persistent exaggerated cortisol
response, despite clinical recovery. A similar result was reported by Bhagwagar et al.
(2003) who found that patients in clinical remission exhibited increased CAR compared
to controls. Another study showed that a decrease in the CAR is predictive of
antidepressant response (J. Beck et al., 2015). Patients who demonstrated a higher
decrease in CAR following treatment with a serotonin–norepinephrine reuptake inhibitor
(SNRI) also showed a reduction in depressive symptoms at follow up, whereas patients
who did not demonstrate a reduction in CAR, failed to achieve remission. Ruhe et al.
(2015) explored the longitudinal effects of SSRI treatment on cortisol in medication-free
depressed patients and healthy controls. In contrast to the previous findings, CAR values
were lower in the depressed group compared to controls, although this result failed to
reach significance. However symptom remission was robustly associated with increased
CAR in participants with depression after 12 weeks of SSRI therapy. Furthermore, the
remitters had higher CARs at endpoint than controls at study-entry.
A study exploring the effects of antidepressants on cortisol including 1,526 people with
either current or past depression, compared CAR between antidepressant and non-
users (Manthey et al., 2011). Tricyclic antidepressant (TCA) users demonstrated a
flattened CAR compared to those treated with SSRI, other antidepressants or non-users.
The authors speculate that specific antidepressants may have a differential effect on the
HPA-axis. Another study compared the effects of SSRI and SNRI on waking cortisol
(Harmer et al., 2003). SSRI significantly enhanced the CAR, there was no effect of SNRI
treatment.
To date the evidence suggests that the CAR may be heritable, however, as it is also
greatly influenced by environmental factors, it may also represent a measure of

93
vulnerability to depression, particularly concerning daily stress. However, longitudinal
studies have demonstrated that increased CAR is associated with depression onset and
recurrence, independently of stressful life events. There is also evidence to suggest
differential effects on the CAR according to the type of stress experienced or the nature
and severity of the depressive symptoms exhibited. The CAR may therefore be
considered an index of coping which becomes dysregulated once it cannot meet the
demands of stress. It is possible that beyond a certain level, persistent increased CAR
may become downregulated and blunted. This could explain why some studies have
reported increased CAR and others blunted CAR in relation to depression (Dedovic &
Ngiam, 2015).
Depression and the cortisol slope
The decline in cortisol from morning to evening over the waking day is known as the
cortisol slope. Like the CAR, the slope can be quantified in a number of ways and
calculations include the number and timing of the cortisol samples across the waking
day. These slopes are usually calculated by either taking a simple difference between
the morning measure and the evening measure or by taking a simple difference divided
by the total time between the two samples. Where multiple data points are available
linear regression is used to apply a line of best fit and the slope of this line is used to
estimate cortisol diurnal slope (Adam & Kumari, 2009).
The association between cortisol slope and MDD has been examined in adolescents.
Doane et al. (2013) compared cortisol slope in 300 adolescents with current and past
MDD with controls. The authors reported that past and current MDD were both
associated with a flatter slope compared with no history of MDD. Negative emotion,
including sadness and loneliness, was associated with flatter slopes and partially
accounted for the associations between MDD and cortisol rhythm. Using the same
sample, Adam et al.(2010) reported that higher baseline CAR was associated with a

94
significantly increased risk of developing MDD one year later, even when excluding
individuals with baseline MDD. This suggests that a heightened CAR may play a role in
the aetiology of MDD.
Self-reported depressive symptoms have been associated with a flatter slope in a
random sample of 257 men and women (Sjogren et al., 2006) and a study on 126 MDD
outpatients and 106 healthy controls reported that flatter diurnal cortisol patterns were
associated with family history of mental illness, symptom severity and higher suffering
levels (Hsiao et al., 2010). A flatter slope was also observed in women with MDD
compared with controls, and with depression severity (Jarcho et al., 2013). Furthermore
flatter diurnal cortisol slopes were associated with reduced cortisol response to the DST,
suggesting that flatter cortisol rhythms in depression may reflect impaired GR function,
particularly for those women with severe symptoms.
However, inconsistencies do exist in the literature. A study including 57 MDD patients
and 40 healthy controls reported no significant difference in the diurnal cortisol variation
between groups (Doolin et al., 2017). The authors speculate that this may be due to
inconsistencies in saliva sampling. Another small study also reported no significant
difference in cortisol slope in 13 medicated depressed patients compared with 13 healthy
controls (Assies et al., 2004). In another study daily cortisol slope was steeper in the
depressed compared to the non-depressed group, however the sample size was small
(N=30) (S. H. Booij et al., 2015). A systematic review and meta-analysis by Adam et al.
(2017) investigated diurnal cortisol slopes and physical and mental health outcomes,
including depression symptoms and disorders. Flatter slopes were significantly
associated with depression, however as most of the studies were cross sectional in
nature, it was impossible to determine the direction of causality.
Chronic stress has been linked to flattened slope (Adam et al., 2017) and steeper slope
(Ockenfels et al., 1995;Steptoe et al., 2000). A recent study explored whether HPA-axis

95
genetic variation explains the heterogeneity in the findings (Starr et al., 2019). The
authors reported that whilst chronic stress did not directly predict diurnal slope,
adolescents at low genetic risk appeared to adapt to chronic stress over six months with
a high waking cortisol and steeper diurnal decline. Childhood maltreatment has also
been with associated diurnal slope. In a study of adoptees, people who reported
moderate maltreatment had a steeper diurnal slope and those who reported severe
maltreatment had a flatter slope compared to non-maltreated adoptees (van der Vegt et
al., 2009). This suggests that the nature of this relationship is influenced by the level of
severity of early maltreatment. However, a meta-analysis of 27 studies reported no
association between childhood maltreatment and cortisol slope (Bernard et al., 2017).
To my knowledge only one study has explicitly investigated the effects of SSRIs on
cortisol slope. The study included 64 non-depressed men and women who were
randomised to SSRI or placebo for six days (Ronaldson et al., 2018). Results showed
that women receiving SSRIs had significantly steeper cortisol slopes compared with
those receiving placebo. There was no effect of medication on cortisol slope in men.
Antidepressant effects on cortisol slope have not been explored in people with
depression.
Depression and the cortisol AUC
The AUC is a summary measure of the total or average level of cortisol across the day
(Adam & Kumari, 2009) and changes in AUC have also been reported in people with
depression. In a study assessing salivary cortisol levels in 45 females caring for a stroke
survivor, Saban et al. (2012) found that cortisol levels were significantly lower across the
day in women with a high level of depressive symptoms compared to women with a low
level. Lower cortisol concentrations were also observed in 401 men and women in
Canada with depressive symptoms (Marchand et al., 2014). In contrast, O’Brien et al.
(2004) reported a 53% increase in the AUC in 61 older people with MDD, compared with

96
40 healthy controls. Higher mean levels of cortisol have also been reported in clinically
depressed young women compared to controls (Dienes et al., 2013). In another study
no difference in AUC was observed between women with MDD compared to controls
(Gonul et al., 2017).
Cortisol levels have also been investigated in relation to anti-depressant response. In a
study of 208 depressed patients, responders had significantly lower cortisol levels than
those who did not respond (Ventura-Junca et al., 2014). Hinkelmann et al. (2012) also
examined cortisol AUC in 52 MDD patients before and after 3 weeks of SSRI therapy in
conjunction with an add-on treatment modulating the mineralocorticoid receptor in
comparison to healthy controls. Results showed that SSRI treatment reduced cortisol in
depressed patients to the level of healthy control within three weeks. Moreover,
symptoms remission was strongly correlated with decreases in cortisol secretion. Ruhe
et al. (2015) also showed a decrease in AUC in 70 initially drug-free MDD patients
following SSRI treatment. More recently, a preliminary study including 13 adolescents
with MDD, showed no differences in AUC between those with remitting symptoms
compared to those with persistent symptoms (Klimes-Dougan et al., 2018).
A study including 429 international adoptees explored the influence of childhood
maltreatment on anxiety and the AUC (van der Vegt et al., 2010). The results showed
that in adoptees with an anxiety disorder, severe maltreatment was associated with a
lower AUC than non-maltreated adoptees. In adoptees without an anxiety disorder, no
difference in the AUC was observed between participants who did or did not experience
severe maltreatment in childhood. This suggests that early life adversities may modify
the relationship between mood disorders and basal cortisol secretion in adulthood.

97
Morning and evening cortisol
A systematic review and meta-analysis was conducted by Knorr et al. (2010) including
20 case–control studies, including 1,354 patients with depression and 1,052 controls.
Initial findings showed that cortisol was increased in the morning and in the evening in
depressed patients compared to controls, however subsequent meta-regression
revealed that the difference in cortisol levels may be associated with age and the intra-
assay variability of the cortisol kits and not associated with depression scores. The
authors conclude that there is no firm evidence for a difference of salivary cortisol in
depressed patients.
The antidepressant effects of morning cortisol have also been investigated. A study by
Harmer et al. (2003) studied the effect of six-day administration of the SSRI citalopram
and the SNRI reboxetine and on waking cortisol in healthy volunteers. They reported that
citalopram significantly increased waking cortisol, whilst there was no effect of
reboxetine.
Overall, the evidence suggests that depression is associated with dysregulation of HPA
axis function, however the literature is not consistent concerning the direction of the
dysregulation. For example, both heightened and blunted CARs have been reported, as
have increased and decreased AUC. CAR appears to have a degree of heritability but is
also associated with daily stress, specific psychological traits and severity of symptoms.
Findings regarding antidepressant response are also conflicting. Clinical remission has
been associated with both increased and decreased CAR and results concerning the
AUC show both decreases and no change. Evidence regarding the cortisol slope is less
conflicting, with most studies reporting a flatter slope in depressed people. However the
effects of antidepressants on cortisol slope have yet to be determined in MDD. There
appears to be a complex and important relationship between HPA-axis dysregulation

98
and depression, however the mechanisms underlying this dysregulation are still unclear.
The prevailing model focuses on reduced corticosteroid receptor sensitivity.
1.5.4 The role of the corticosteroid receptor
As previously mentioned, the inhibitory effect of glucocorticoids on the HPA-axis is
mediated by two intracellular receptors: the mineralocorticoid receptor (MR) and the
glucocorticoid receptor (GR). GRs are ubiquitously expressed and regulate function
throughout the body, although numbers may differ according to cell type (Pariante,
2004). In contrast, MRs are selectively expressed in tissue such as the brain, heart,
kidney and colon. MR expression is particularly high in the hippocampus and other
limbic‐pre-fronto-cortical regions (E. R. de Kloet et al., 2016).
The inactivated GR is located in the cytoplasm of the cell, where it resides as a complex
with molecular chaperone molecules, including several heat shock proteins. Upon
glucocorticoid ligand binding, such as cortisol or dexamethasone (a synthetic
glucocorticoid), conformational changes occur in the GR (“activation”) and it dissociates
from the chaperone proteins and translocates to the nucleus (Figure 5). There it binds
to specific glucocorticoid response elements (GREs) in regulatory DNA areas (Juruena
et al., 2004) or interacts with other transcription factors.

99
The inactivated GR resides primarily in the cytoplasm, in a complex with chaperone proteins that serve to stabilize the unbound receptor. Upon binding to the glucocorticoid (”activation”), the GR sheds its chaperone proteins and translocates to the nucleus. It then binds to specific regulatory DNA areas in target genes (GREs) where it either activates or represses gene transcription. GRE: glucocorticoid response element; mRNA: messenger RNA
GREs can confer either positive or negative regulation on the genes to which they are
linked. Typical target genes that are negatively regulated by GR include a large number
of inflammatory proteins, including IL-6 and TNF-α (De Bosscher & Haegeman, 2009).
Once activated, the GR cannot rebind with glucocorticoid, as it is dissociated from the
chaperone complex, and is recycled (W. B. Pratt, 1993).
The MR is highly expressed in limbic regions of the brain and binds with high affinity to
naturally occurring glucocorticoids such as cortisol and corticosterone, suggesting that it
is actively occupied most of the time (Pariante & Lightman, 2008). It is believed to play
a role in the regulation of circadian fluctuations in these hormones and has been shown
to be both necessary and sufficient to maintain low basal corticosterone levels and low
HPA-axis activity during the nadir of the circadian cycle (E. R. De Kloet et al.,
Figure 1.5 Translocation of the GR from the cytoplasm to the nucleus

100
1998;Spencer et al., 1998). Conversely, the GR preferentially binds to synthetic
glucocorticoids, such as dexamethasone and has reduced affinity with endogenous
glucocorticoids. As such, it is thought to be more important in regulating the stress
response, when levels of cortisol are high and maintaining normal levels of HPA axis
activity at the peak of the circadian cycle (Juruena et al., 2006;Spencer et al., 1998).
However it has also been shown that during the circadian peak or acute stress the MR
also plays a role in facilitating GR regulation of the HPA-axis (Spencer et al., 1998),
suggesting that rather than working independently of one another, they function co-
operatively.
Evidence suggests that homeostasis depends on the coordination and balance of these
two receptors (E. R. de Kloet et al., 2007b). In the early stages of the stress response,
cortisol increases attention, vigilance and emotional responses, as well as facilitating a
behavioural response and the MR receptors appear to mediate these actions. In the later
stage of the stress response, following increases in the levels of cortisol, the GR
receptors become activated and this enables the cessation of the stress response. The
GR also enables memory formation of the successful behavioural response in dealing
with the stressor, preparing the individual for future stressful events. It is therefore
imperative that the actions of the MR and GR are appropriately coordinated. If stress
signalling occurs inappropriately, impairment in cognitive function and behavioural
adaptation occurs, as is observed in depression (E. R. de Kloet et al., 2005). Once the
balance between MR and GR function is disturbed, the individual is less able to maintain
homeostasis in the presence of an adverse experience, leading to HPA-axis
dysregulation, further increasing depression risk.
1.5.5 Mechanisms of glucocorticoid resistance
The biological impact of glucocorticoids is not only influenced by the level of
glucocorticoids released by the HPA-axis but also by how sensitive the tissue is to their

101
effects and many factors can affect this sensitivity (Quax et al., 2013). It is possible that
hypercortisolism exhausts the ability of the GR to recycle and therefore impairs its ability
to respond adequately to further stimulation (Pariante & Miller, 2001). However the
literature on GR number in depression, discussed below, does not provide much support
for this hypothesis. Glucocorticoid receptor affinity can also influence glucocorticoid
sensitivity. Patients with Cushing syndrome demonstrate decreased glucocorticoid
receptor affinity in PBMCs (Hagendorf et al., 2005). Conversely, glucocorticoid receptor
affinity might be normal in patients with chronic hypocortisolism. It is thought that 30% of
all patients who receive glucocorticoid treatment demonstrate glucocorticoid resistance,
specifically 4–10% of asthma patients, 30% of rheumatoid arthritis patients, almost all
chronic obstructive pulmonary disease and sepsis patients (P. J. Barnes & Adcock,
2009;Dendoncker & Libert, 2017) and 10–30% of untreated acute lymphoblastic
leukaemia patients (Haarman et al., 2003).
Glucocorticoid bioavailability could affect GR sensitivity. The vast majority of circulating
glucocorticoids are bound to plasma proteins, mostly to cortisol-binding globulin (CBG)
and only free, unbound glucocorticoids are biologically active (around 10%) (Quax et al.,
2013). Therefore, CBG levels determine the actual amount of cortisol available. CBG
levels have been associated with cortisol and ACTH levels following social stress
challenge in healthy people, suggesting a role for CBG in HPA-axis regulation (Kumsta
et al., 2007). However there is no evidence of increased CBG in depressed people
compared to controls (Deuschle et al., 1996;Leake et al., 1989).
In addition, the intracellular bioavailability of free cortisol is regulated 11-β-hydroxysteroid
dehydrogenase (11βHSD) (Oakley & Cidlowski, 2013). 11βHSD is a family of enzymes
which modulate the effects of glucocorticoids. 11βHSD type 1 converts inactive cortisone
into active cortisol. Conversely 11βHSD type 2 converts cortisol into inactive cortisone.
Changes in the expression of these enzymes can influence GR sensitivity (Whorwood et
102
al., 2001). There is some evidence to suggest that 11β-HSD2 activity is decreased in
depressed patients (Zhai et al., 2015).
Another possibility is that people with GR sensitivity may have a genetic predisposition
i.e. there may be genetic variants in the GR gene (NR3C1) which influence function. In
recent years a number of common SNPS have been shown to be associated with
glucocorticoid sensitivity, including ER22/23EK, 9β, N363S, TthIIIl, NR3C1-1, and BclI
(A. T. Spijker & Van Rossum, 2012). These SNPs have also been associated with mood
disorders. The ER22/23EK SNP has repeatedly been associated with a higher risk of
depression (Bet et al., 2009;van Rossum et al., 2006;van West et al., 2006) and clinical
response to antidepressant treatment (van Rossum et al., 2006). An association between
the ER22/23EK and 9β SNPs and depressive symptoms in combination with childhood
adversity has also been observed suggesting a gene X environment interaction. The BclI
polymorphism is also associated depression risk (Brouwer et al., 2006;Krishnamurthy et
al., 2008;H. Y. Lee et al., 2009;van Rossum et al., 2006) and treatment response
(Brouwer et al., 2006).
SNPs in the MR gene (NR3C2) have also been associated with MR function. The
MR180V allele has been associated with increased cortisol response to both perceived
chronic stress and acute laboratory stress (DeRijk et al., 2006;van Leeuwen et al., 2011)
and with depressive symptoms (Kuningas et al., 2007). A weak association was also
observed between this SNP and the CAR after a low dose of dexamethasone in elderly
people (DeRijk et al., 2011). There is increasing evidence for sex differences in MR
functionality. Common MR haplotypes (groups of genes inherited together from a single
parent), have been associated with sex differences in suppression of the CAR following
dexamethasone in healthy people (van Leeuwen et al., 2010) and with depression risk
in women (Klok et al., 2011b) and with sex-specific depression susceptibility following
childhood maltreatment (C. H. Vinkers et al., 2015).

103
Genetic variation in the FKBP5 gene may provide a genetic contribution to GR
resistance. FKBP5 is a protein which forms part of the chaperone complex required for
ligand-binding of the GR and subsequent compartmentalisation. Variations in the FKBP5
gene lead to increased intracellular protein expression, influencing GR function (A. T.
Spijker & Van Rossum, 2012). Alleles associated with increased expression of FKBP5
following GR activation, lead to an increased GR resistance and impaired HPA-axis
function in healthy controls (Binder, 2009) and are associated with antidepressant
response and the recurrence of depressive episodes (Binder et al., 2004).
Another potential mechanism of GR resistance is gene expression due to alternative
splicing. Whilst there is only one gene which codes for the GR, there are nine exons give
rise to several splice variants (Quax et al., 2013). Most of the research has focused on
GRα and GRβ. GRα is the biologically active isoform, whereas GRβ is inactive and
incapable of glucocorticoid binding. However several genes are regulated by GRβ and it
is thought to negatively inhibit GRα, impairing its transcriptional activity suggesting that
high levels of GRβ may lead to glucocorticoid resistance. Interestingly, the expression of
GRβ is increased by proinflammatory cytokines and increased levels of GRβ have been
associated with glucocorticoid resistance in a variety of inflammatory diseases (Oakley
& Cidlowski, 2013). Reduced expression of GRα mRNA has been shown in post mortem
brain tissue (Perlman et al., 2004;M. Webster et al., 2002) and in PBMCs in depressed
patients (Carvalho et al., 2014;Matsubara et al., 2006). However to date, the role for GRβ
in depression has yet to be determined.
Post mortem studies have shown decreased MR mRNA in the hippocampus (Klok et al.,
2011a;Lopez et al., 1998;Medina et al., 2013) and PVN (Qi et al., 2013) of depressed
patients and a difference in GR:MR ratio in depressed patients compared to controls
(Medina et al., 2013;Qi et al., 2013).
104
1.5.6 Measurement of GR function
Over the years different approaches have been developed to test GR function, both in
vitro and in vivo. Studies either measure GR number directly or assess the influence of
glucocorticoids on GR function. In light of the obvious methodological issues associated
with accessing GRs in the brain, most investigations rely on using peripheral cells, such
as immune cells. Although differences have been observed in density between immune
and neuronal GRs, similarity has been demonstrated in affinity and steroid specificity
(Lowy, 1989). Furthermore Yehuda et al. (2004) showed a high correlation between the
inhibitory effect of dexamethasone and GR sensitivity in mononuclear leukocytes, both
in vitro and in vivo. In light of this evidence and given their obvious availability, the
evaluation of peripheral cells presents a plausible model of GR investigation (Pariante &
Miller, 2001).
Two different in vitro approaches have been used to explore GR number. Cytosolic
binding assays involve lysing the cells and incubating the cytosolic fraction of the lysate
with steroid (A. H. Miller et al., 1998). As previously described, once the GR has become
activated it translocates from the cytoplasm to the nucleus, thereby leaving a reduced
number of GRs in the cytosolic fraction. The disadvantage of this method is that the
reduced number of GRs could represent either a reduction in the overall expression of
GR, suggesting downregulation, or an increase in the number of GRs in the nucleus,
suggesting increased activation. The second approach, whole cell binding, overcomes
this issue and measures total cellular GRs. Whist these techniques are able to provide
useful data regarding GR number, they do not provide information regarding their
biological effects (Quax et al., 2013).
In vitro studies investigating GR function involve isolating and cultivating immune cells
(Leistner & Menke, 2018). Glucocorticoids are known to inhibit the proliferation of PBMCs
in response to polyclonal mitogens and earlier studies focused on these effects (Pariante

105
& Miller, 2001). PBMCs were incubated with concanavalin A, phytohemaglutinin and
pokeweed mitogen, followed by dexamethasone, and proliferative responses were
measured. More commonly nowadays, whole blood or isolated monocytes are co-
incubated with the bacterial endotoxin LPS, which is known to stimulate an immune
response, and various concentrations of dexamethasone in order to determine
proinflammatory cytokine production. The specific concentration of dexamethasone
required for 50% inhibition of the maximum LPS-induced cytokine production observed
(in the absence of dexamethasone), is referred to as the ‘inhibitory concentration 50’
(IC50). The IC50 is an index negatively associated with glucocorticoid sensitivity
(Leistner & Menke, 2018). Reduced dexamethasone-induced inhibition of either cytokine
production or mononuclear cell proliferation is interpreted as partial glucocorticoid
resistance (Carvalho & Pariante, 2008). Throughout this thesis, in vitro assays will be
referred to as ‘glucocorticoid sensitivity assays’.
Genetic expression studies have also been conducted. Transcriptional profiling has been
conducted in RNA from post mortem brain tissue and from peripheral blood (Leistner &
Menke, 2018), mRNA expression has been measured in many cell types and GR protein
has been measured using cytosolic binding and Western blot techniques (Carvalho &
Pariante, 2008).
In vivo studies have predominantly used the dexamethasone suppression test (DST).
The DST was first used as a diagnostic tool for screening for Cushing syndrome (Carroll
et al., 1968). Dexamethasone binds to the glucocorticoid receptors and inhibits synthesis
of ACTH, leading to a decrease of cortisol concentrations. Thus the DST is able to
measure the negative feedback mechanism of the HPA axis. Usually an oral dose of
1.5mg dexamethasone is given to the participant at 11.00pm and plasma/saliva cortisol
(and sometimes ATCH) is measured at various times the following day. Cortisol
concentrations exceeding 5 µg/dl are considered an abnormal DST result and indicative
of glucocorticoid resistance (reduced receptor sensitivity) (Kunugi et al., 2006). Non-

106
suppression of the DST has been correlated with reduced dexamethasone-induced
inhibition of lymphocyte proliferation in vitro (Carvalho & Pariante, 2008). However, the
DST has been criticised for lacking the sensitivity and specificity to reliably differentiate
mood disorder patients from other psychiatric populations or healthy controls (Arana et
al., 1985;Braddock, 1986).
The CRH receptors can also be investigated using the corticotrophin-releasing hormone
(CRH) challenge test. Following intravenous administration of CRH, ACTH levels are
measured assessing the responsivity of the pituitary to CRH (Leistner & Menke, 2018).
A bolus injection with 1 μg/kg or 100 μg of CRH is administered and ACTH and cortisol
levels are evaluated in the following 1–2 hours, in regular time intervals. Healthy people
demonstrate an increase in ACTH between 5 and 15 minutes after CRH injection with a
peak response in ACTH between 10 and 15 min and a peak response in cortisol levels
between 30 and 60 min following infusion (C. de Kloet et al., 2006).
To improve the sensitivity of the DST and further explore the neuroendocrine feedback
of the HPA axis, the DST was combined with the CRH test, developing the
dexamethasone/corticotropin releasing hormone (Dex/CRH) challenge test (Von Werne
Baes et al., 2012). A single, oral dose of 1.5mg dexamethasone is given to the participant
at 11.00pm, followed by an intravenous bolus of 100μg CRH, the next day at 3pm.
Patients stay in a supine position throughout the test. Blood samples are then taken at 5
time intervals between 3.00pm and 4.15pm to test for cortisol and ACTH concentrations.
The 3pm blood sample measures dexamethasone suppression and the subsequent
samples measure CRH response (Leistner & Menke, 2018).
Despite its popularity, the DST is not without its limitations. Firstly, not all MDD patients
are non-suppressors, therefore the DST may be a marker of a specific
pathophysiological subtype (W. A. Brown & Shuey, 1980). Secondly, dexamethasone
only binds to the GR and therefore is unable to probe MR function and has a much longer

107
half-life compared with cortisol. A suppression test was devised by Pariante et al. (2002)
using prednisolone, a synthetic glucocorticoid that is more similar to cortisol in its ability
to bind to both the GR and MR, as well as having a similar half-life. As such, the
prednisolone suppression test (PST) provides an indirect measure of GR and MR-
mediated negative feedback on the HPA axis and can be used both in vitro and in vivo.
It has therefore been proposed as a more naturalistic test for the HPA axis.
The PST and DST have been used in combination in depressed people to explore MR
function. Results have shown evident dissociation between the cortisol responses to
dexamethasone and to prednisolone, in patients compared with controls (Juruena et al.,
2006). As both glucocorticoids probe the GR and only prednisolone probes the MR, any
difference in sensitivity between them can be interpreted as a selective MR sensitivity.
Indeed results from research using both glucocorticoids show that depressed patients
show less suppression than controls following dexamethasone administration but show
normal suppression by prednisolone. Furthermore, in controls there is a correlation
between prednisolone and dexamethasone suppression, indicating equal sensitivity. In
contrast, no such correlation is present in depressed patients. In a similar fashion to the
DST, an oral dose of 5mg prednisolone is given to the participant at 10.00pm and saliva
cortisol is measured at various times the following day.
These findings are consistent with studies examining MR function in depression, using
the MR antagonist, spironolactone. Spironolactone is a potent anti-mineralocorticoid
which blocks the MR. An oral dose of 200-300mg spironolactone is administered to the
participant and blood or salivary cortisol is measured before ingestion at baseline and
every 30 minutes for up to six hours (Hinkelmann et al., 2016;Young et al., 2003). Studies
exploring MR function have also used fludrocortisone which is a synthetic corticosteroid
which acts largely as a powerful mineralocorticoid, with some weak glucocorticoid activity
(Nicolaides et al., 2000). Blood samples are taken at baseline and patients are

108
administered 0.5mg of fludrocortisone. Blood samples are then taken every hours for up
to five hours and cortisol levels are measured (Lembke et al., 2013).
1.5.7 Depression and the corticosteroid receptors
Over the last 30 years, many studies have explored glucocorticoid function in people with
depression. Due to the fact that the GR preferentially binds to synthetic GCs and most
depression studies have used the DST, there is a vast bias towards studies investigating
GR function compared to MR function. Furthermore, because the MR has a high affinity
for endogenous corticosteroids and is therefore believed to be occupied most of the time,
it was thought that the GR was more important in the stress response (Pariante & Miller,
2001). This section will first describe studies investigating corticosteroid receptor number
in people with depression, before moving on to corticosteroid receptor sensitivity.
Corticosteroid receptor number and depression
Whilst the majority of early studies investigating GR number reported no difference
between people with depression and healthy controls (Maguire et al., 1997;Rupprecht et
al., 1991a;Rupprecht et al., 1991b;Schlechte & Sherman, 1985;A. Wassef et al., 1990;A.
A. Wassef et al., 1992) a few studies have found a reduction in the number of GRs in
depressed people (Gormley et al., 1985;Sallee et al., 1995;Whalley et al., 1986). Oral
dexamethasone administration also significantly decreased glucocorticoid receptor
number in DST suppressors, compared to non-suppressors (Gormley et al., 1985;Lowy
et al., 1988;A. Wassef et al., 1990). More recently, a study by Calfa et al. (2003) showed
a reduced number of GRs on lymphocytes from non-medicated depressed patients
compared with healthy controls. Following subsequent antidepressant treatment a
significant increase in GR number was observed in the depressed people. Furthermore
this increase was above the level of GRs observed in the control group. Depressed
patients have also been shown to have fewer GR number compared to patients with

109
other psychiatric disorders (Yehuda et al., 1993). Furthermore, in a study by Sallee et al.
(1995) investigating GR number in depressed adolescents, a reduction in cytosolic GR
binding at baseline predicted antidepressant response, and GR number increased
following successful antidepressant treatment. The finding that antidepressants
upregulate GR binding is supported by a number of animal studies which demonstrate
that antidepressant treatment upregulates GR protein and mRNA in the brain (Pariante
& Miller, 2001).
The inconsistency in the findings may be due to patient heterogeneity, cell populations
studied and methodological differences. Most of the studies which reported a reduction
in GR number in depressed people compared to controls used cytosolic binding assays,
however most of the studies which reported no difference used whole cell binding
assays. The combination of findings (no difference in whole cell numbers and reductions
in cytosolic numbers) suggests that GR alterations observed in depressed people may
be due to increased translocation to the nucleus or an increase in the number of GRs
which have shed their chaperone proteins following recent activation and are therefore
no longer able to bind with the ligand and reactivate. As excess cortisol levels
overburdening the GR could result in either of these outcomes, this would provide
support for the theory that GR downregulation is secondary to hypercortisolism.
Corticosteroid receptor function and depression
In vitro measurement
In vitro studies of GR function have consistently reported significant decreased sensitivity
in depressed patients (see Table 5). Wodarz et al. (1991;1992) and Rupprecht et al.
(1991c) reported a significantly weaker suppressive effect of in vitro dexamethasone on
mitogen-induced lymphocyte proliferation in severely depressed people. Furthermore,
there was no impairment in GR function in clinically recovered patients (Wodarz et al.,

110
1992). Two studies by Lowry et al. (1984;1988) have also shown that oral and in vitro
dexamethasone inhibition of lymphocyte proliferation is reduced in depressed people
who are also non-suppressors on the DST. It should be noted here that the non-
suppression of cortisol and lymphocyte proliferation in the same participants, using
dexamethasone both orally and in vitro, demonstrates the utility of in vitro studies as
direct measures of GR function (Pariante, 2004). Reduced inhibition of natural killer cell
mediated cytotoxicity following in vitro cortisol administration has also been observed in
MDD patients compared with controls (A. H. Miller et al., 1987). The relationship between
depressive severity and GR function has also been explored in vitro (Tanke et al., 2008).
An association between dexamethasone suppression of lymphocyte proliferation and
MDD symptom severity was observed in 13 MDD patients.
Dexamethasone inhibition of LPS-stimulated cytokines in whole blood has also been
used to explore GR function in psychiatric populations. Rohleder et al. (2004) reported
that less dexamethasone was required for the suppression of both IL-6 and TNF-α in
PTSD patients compared to controls, reflecting increased GR sensitivity. Miller et al.
(2005b) measured dexamethasone inhibition of LPS-stimulated IL-6, in response to an
acute bout of psychological stress, in 72 women, 36 with MDD and 36 healthy controls.
All participants underwent a 17-minute mock-job interview before providing blood
samples. Depressed participants demonstrated increased GR sensitivity compared with
controls, prior to the stressor. However following the stressor sensitivity decreased
among depressed individuals and increased among controls, suggesting a dysregulated
stress response.
Studies have also explored GR function and antidepressant treatment. The effects of
sertraline on glucocorticoid sensitivity has been investigated in PBMCs in PTSD patients
(Yehuda et al., 2006). Results showed that sertraline reduced GR sensitivity compared
with controls, which is line with the findings that PTSD patients exhibit enhanced
sensitivity to glucocorticoids (Yehuda et al., 2004). Calfa et al. (2003) showed an

111
increase in cortisol inhibition of mitogen-induced lymphocyte proliferation in depressed
people following 4 weeks of antidepressants, to a level even higher than that found in
healthy controls. In contrast, a study by Bauer et al. (2003) demonstrated reduced
inhibition of T-cell proliferation and cytokine production in TRD patients following both
oral and in vitro administration of dexamethasone. Furthermore, Carvalho et al. (2008)
showed that 24 hour incubation of whole blood with clomipramine decreased
glucocorticoid inhibition of LPS induced IL-6 in controls but not in TRD patients.
Therefore, TRD patients also demonstrated a lack of antidepressant effect in vitro
suggesting that restoration of GR function is dependent on clinical remission. However
it should be noted that this observed reduction in GR sensitivity following antidepressants
is thought to be transient and specific to in vitro studies.
Chronic stress has also been associated with GR resistance. In a study measuring job
strain in men, those who were highly exhausted had reduced GR sensitivity compared
to non-exhausted employees (Wirtz et al., 2003). Highly exhausted employees also had
elevated levels of CRP. In a study including 120 mothers of children with newly
diagnosed cancer, those women who demonstrated higher levels of distress across the
12 months following their child’s diagnosis showed increased glucocorticoid resistance.
Another study examined glucocorticoid signaling in people caring for a family member
with glioblastoma and healthy controls whose lives were free of major stressors (G. E.
Miller et al., 2014). Results showed that caregivers demonstrated reduced expression of
genes with response elements for the glucocorticoid receptor, however, there were no
differences in functional glucocorticoid sensitivity between the groups; hydrocortisone
was equally effective at inhibiting cytokine production following monocyte stimulation
with LPS. A similar study including familial caregivers of brain-cancer patients, also
showed that the caregiver’s monocytes showed diminished expression of transcripts
bearing response elements for glucocorticoids compared to controls (G. E. Miller et al.,
2008). A longitudinal study also provided evidence for an association between

112
psychological distress and the development of glucocorticoid resistance in mothers of
children newly diagnosed with cancer (Walsh et al., 2018).
Gene expression analyses following GR induction have also been conducted alongside
neuroendocrine tests to investigate any genetic influences on GR function. Spijker et al.
(2010) examined LPS-stimulated (ex vivo) whole blood gene expression in MDD
patients. They identified a gene expression profile (CAPRIN1, CLEC4A, KRT23, MLC1,
PLSCR1, PROK2, ZBTB16) that serves as a molecular signature of MDD. Interestingly,
from the seven genes identified, six are related to immune cell proliferation and one is
related to regulation of circadian rhythm by the suprachiasmatic nuclei. Considerable
evidence demonstrates that antidepressants enhance GR signalling in vitro via mRNA
expression, GR protein level and GR function (Carvalho & Pariante, 2008).

113
Table 1.5 In vitro measurement of GR function in depression
Author/year Sample Study design GR measurement protocol Statistical
analysis
Results
Bauer et al.
2003
36 TRD inpatients (15
men, 21 women), 31
healthy controls (12 men,
19 women) mean age
49yr
Difference in glucocorticoid
sensitivity between
pharmacologically treated
MDD inpatients and healthy
controls
DEX suppression of mitogen
induced T-cell proliferation,
LPS-induced IL-2 and TNF-α
in isolated PBMCs.
Comparison with DST
ANOVA, no
covariates
Decreased glucocorticoid sensitivity in
TRD patients compared to controls
Carvalho et
al. 2008
15 TRD patients, 28
healthy controls, mean
age 47
Difference in glucocorticoid
sensitivity between
pharmacologically treated
TRD patients and healthy
controls
DEX, PRED cortisol and
corticosterone inhibition of
LPS-induced IL-6 levels in
whole blood
Mann–
Whitney
Decreased glucocorticoid sensitivity in
controls following incubation with
antidepressants. No effect of
antidepressants on glucocorticoid
sensitivity in controls
Calfa et al.
2003
16 MDD patients,
untreated (4 men, 12
women), 13 MDD patients
treated (9 men and 4
women) and 16 healthy
controls (12 men, 4
women), mean age 39yr
Difference in glucocorticoid
sensitivity between
pharmacologically
untreated MDD patients,
pharmacologically treated
MDD patients and healthy
controls
Cortisol suppression of
mitogen-induced lymphocyte
proliferation.
ANOVA
Covariates:
basal
cortisol
Decreased glucocorticoid sensitivity in
MDD patients compared to controls.
Increased glucocorticoid sensitivity in
MDD patients following treatment

114
Table 1.5 continued. In vitro measurement of GR function in depression
Author/year Sample Study design GR measurement protocol Statistical
analysis
Results
Lowy et al.
1984
12 MDD inpatients (7
men, 5 women), 12
matched controls, mean
age 31yr
Difference in glucocorticoid
sensitivity between MDD
inpatients and healthy
controls
DEX suppression of mitogen
induced lymphocyte
proliferation
Student's t-
test,
ANOVA
Decreased glucocorticoid sensitivity in
MDD patients compared to controls
Lowy et al.
1988
21 MDD inpatients (9
men, 12 women), 23 non-
depressed psychiatric
patients (15 men, 8
women) and 15 controls
(9 men, 6 women), mean
age 31yr
Difference in glucocorticoid
sensitivity between MDD
inpatients, non-depressed
psychiatric patients and
healthy controls
DEX suppression of mitogen
induced lymphocyte
proliferation. Comparison
with DST
Student's t-
test,
ANOVA
Decreased glucocorticoid sensitivity in
DST non-suppressors compared to
suppressors regardless of depression
status
Miller et al.
2005
36 women with MDD and
36 healthy female
controls, mean age 27yr
Difference in glucocorticoid
sensitivity between women
with MDD and healthy
controls in response to
acute psychological stress
DEX suppression of LPS-
induced IL-6 and TNF-α in
PMBCs
ANOVA, no
covariates
Decreased glucocorticoid sensitivity in
women with MDD following stressor
compared to controls

115
Table 1.5 continued. In vitro measurement of GR function in depression
Author/year Sample Study design GR measurement protocol Statistical
analysis
Results
Rupprecht
et al. 1991c
12 severe MDD patients
(3 men, 9 women) and 13
healthy controls (3 men,
10 women), mean age
48yr
Difference in glucocorticoid
sensitivity between
severely depressed people
and healthy controls
DEX suppression of mitogen
induced lymphocyte
proliferation following
glucocorticoid depletion
ANOVA, no
covariates
Decreased glucocorticoid sensitivity in
severely depressed people compared to
controls
Tanke et al.
2008
13 MDD inpatients (5
men, 8 women) mean age
48yr
Relationship between
glucocorticoid sensitivity
and depressive symptom
severity
DEX suppression of mitogen
induced lymphocyte
proliferation
Logistic
regression
Negative association between
glucocorticoid sensitivity and depressive
symptom severity
Wodarz et
al. 1991
12 severe MDD inpatients
(3 men, 9 women) and 13
matched healthy controls,
mean age 48yr
Difference in glucocorticoid
sensitivity between
depressed patients and
healthy controls
DEX suppression of mitogen-
induced lymphocyte
proliferation
ANOVA Decreased glucocorticoid sensitivity in
depressed people compared to controls

116
Table 1.5 continued. In vitro measurement of GR function in depression
Author/year Sample Study design GR measurement protocol Statistical
analysis
Results
Wodarz et
al. 1992
12 severe MDD inpatients
( 3 men, 9 women) and 13
matched healthy controls,
mean age 48yr
Difference in glucocorticoid
sensitivity between patients
after clinical recovery from
severe MDD and healthy
controls
DEX suppression of mitogen-
induced lymphocyte
proliferation
ANOVA No difference in glucocorticoid sensitivity
between clinically recovered MDD
patients and healthy controls
Abbreviations:|GR = glucocorticoid receptor; TRD = treatment resistant depression; MDD = major depressive disorder; DEX = dexamethasone; LPS =
lipopolysaccharide; IL-2 = interleukin-2, TNF-α = tumour necrosis factor – alpha; PBMCs = peripheral blood mononuclear cells; ANOVA = analysis of variance.

117
In vivo measurement
DST studies
In vivo measurement of glucocorticoid effects on immune function using oral
dexamethasone have produced similar results as in vitro studies. Studies have
demonstrated elevated cortisol levels in depressed patients following oral
dexamethasone suppression, with decreased levels observed after recovery (Carroll et
al., 1976;Carroll et al., 1968;Holsboer et al., 1982). More recently, a study by Jarcho et
al. (2013) including 26 pre-menopausal depressed women and 23 never depressed
controls, reported that reduced cortisol response to the DST was associated with flatter
cortisol slope. This suggests that flatter diurnal cortisol patterns may be a result of
impaired glucocorticoid sensitivity.
As previously mentioned, depression is not universally associated with increased cortisol
levels. Melancholic depression is however reliably associated with elevations in cortisol
(Leistner & Menke, 2018). It is not surprising then that melancholic individuals also
exhibit non-suppression after the DST (Rush & Weissenburger, 1994). A meta-analysis
of DST studies examining cortisol suppression in patients with psychotic and
nonpsychotic depression and with melancholic/endogenous and non-melancholic
depression was conducted by Nelson and Davis (1997). They found that the non-
suppression rate was significantly higher in patients with psychotic depression (64%)
compared with patients with nonpsychotic depression (41%). Non-suppression was also
significantly higher in patients with melancholic depression (36%) compared to non-
melancholic (12%), however the effect size was smaller than for the
psychotic/nonpsychotic distinction. These findings are supported by evidence that
people with psychotic depression exhibit higher basal cortisol levels compared to people
with non-psychotic depression (Stetler & Miller, 2011).

118
DST results have also been shown to predict clinical outcome following successful
antidepressant treatment. In a study of 20 patients, with initially abnormal test results,
clinical remission was observed approximately three weeks after normalisation of the
HPA-axis (Holsboer et al., 1982). DST normalisation in conjunction with clinical remission
was also observed in 31 MDD in-patients following drug treatment (Greden et al., 1983).
Ribeiro et al. (1993) conducted a meta-analysis of 144 studies exploring the DST and
treatment response or clinical outcome in MDD. The authors reported that whilst baseline
DST result did not predict treatment response or clinical outcome, non-suppression post
treatment was associated with early relapse and poor outcome. In a more recent study
of 208 depressed patients receiving antidepressant treatment, no difference was
observed in DST suppression between the responders and non-responders (Ventura-
Junca et al., 2014). However most recently, cortisol levels following the DST were shown
to be higher in non-responders in a meta-analysis by Fischer et al. (2017a). DST results
have also been shown to predict treatment response following psychological therapy (S.
Fischer et al., 2017b). Taken together, these studies provide robust evidence that GR
sensitivity is decreased in depression (Holsboer, 2000;Leistner & Menke, 2018;Pariante
& Miller, 2001).
Increased suppression following the DST has been observed in people with a history of
childhood abuse. Newport et al. (2004) reported that depressed women with a history of
childhood abuse exhibited greater cortisol suppression than those with no abuse history,
no MDD or both. Secondary analysis of PTSD produced similar results. Increases
suppression indicates enhanced sensitivity of the HPA-axis to negative feedback and is
a robust finding in PTSD (Yehuda et al., 2004). These findings may therefore reflect
PTSD comorbidity rather than MDD. Chronic stress and GR function has also been
investigated in vivo. Contrary to in vitro findings, increased sensitivity was reported in a
study including 12 men suffering from job-related exhaustion compared to 12 matched
healthy controls following the DST (Menke et al., 2014).

119
Dex-CRH test
The majority of studies report increased cortisol and ACTH levels in depressed people
following CRH administration, despite dexamethasone pre-treatment (Bardeleben &
Holsboer, 1989;Gonul et al., 2017;Heuser et al., 1994;Holsboer-Trachsler et al.,
1991;Holsboer et al., 1987;Modell et al., 1997;von Bardeleben & Holsboer, 1991).
Increased cortisol levels following dex-CRH challenge is also associated with age
(Heuser et al., 1994;Rybakowski & Twardowska, 1999;von Bardeleben & Holsboer,
1991) and severity of symptoms (Kunugi et al., 2006;von Bardeleben & Holsboer, 1991)
sleep (Friess et al., 2008) Feedback inhibition following the dex-CRH test has also been
shown to be compromised in medication free MDD patients compared with controls
(Paslakis et al., 2011;Sher et al., 2013). However some studies have also reported no
difference in cortisol response in MDD patients compared with controls (Carpenter et al.,
2009a;Spitzer et al., 2018). In clinically remitted MDD patients, higher cortisol levels on
the DEX/CRH test were also associated with relapse (Appelhof et al., 2006;Aubry et al.,
2007;Zobel et al., 2001) and frequency of recurrence (Hatzinger et al., 2002). Mokhtari
et al. (2013) conducted a meta-analysis of the literature including eight studies of the
DEX/CRH test in patients with MDD and healthy controls. The authors confirmed the
finding that depressed patients release significantly more cortisol after the DEX/CRH test
in comparison with healthy controls and reported a relatively large effect size of 1.34
(95% CI: 0.70–1.97).
Increased cortisol responses to the DEX/CRH test have been reported in healthy adults
(without psychopathology) who were considered to have vulnerability factors such as
chronic inhibited temperament (Tyrka et al., 2008b) and childhood parental loss (Tyrka
et al., 2008a). However, Ising et al. (2005) investigated GR function in 74 healthy people
at high genetic risk for depression compared with controls and found no difference
between the groups. The authors conclude that rather than being a vulnerability factor

120
for depression, dysregulation of the HPA-axis is a ‘neurobiological scar’ which develops
as a result of depression.
Several studies have investigated response to the DEX/CRH test before and after
pharmacotherapy. Despite heterogeneity in the types of drugs used, overall the findings
suggest normalisation of the HPA-axis following treatment (Ising et al., 2007). Differential
effects of various antidepressants on DEX/CRH test results in depressed patients have
also been observed. In a study of 40 MDD patients, those receiving SNRI treatment
showed a gradual and significant reduction in cortisol and ACTH response, which was
greatest after five weeks of treatment (Schule et al., 2006). In contrast, those receiving
a noradrenergic and specific serotonergic antidepressant (NaSSA), showed significant
reductions within one week. Sarubin et al. (2014) conducted a randomised, open-label
5-week trial including 60 MDD in-patients. Patients were treated with either the atypical
antipsychotic drug quetiapine fumarate extended release (QXR) or the SSRI
escitalopram for 5 weeks. The DEX/CRH test was performed before and after treatment.
Whilst both medications showed similar clinical effects on depressive symptoms, the
QXR group demonstrated immediate cortisol inhibition (week one) whereas the SSRI
group showed a brief increase of cortisol release (week one), followed by a comparable
decrease at follow up. For those patients who do not respond to antidepressant
medication, there is evidence that successful electroconvulsive therapy can be effective
in normalising cortisol response in the DEX/CRH test (Kunugi et al., 2006;Yuuki et al.,
2005).
The DEX/CRH test has also been studied in people with MDD and a history of childhood
maltreatment (Heim et al., 2008a). Plasma ACTH and cortisol concentrations were
measured in response to DEX/CRH administration 49 healthy men, with and without
MDD. Men with a history of childhood trauma demonstrated increased ACTH and cortisol
compared with non-abused men. Furthermore, abused men with current MDD showed

121
increased responsiveness compared with both controls and men with MDD but without
childhood abuse experience.
Increased response was also associated with severity and duration of symptoms. A
similar study was conducted in 40 patients with severe mood disorder (Watson et al.,
2007). Contrary to the previous study, there was no difference in cortisol response to the
DEX/CRH test between patients reporting greater emotional neglect in childhood and
controls. However, patients with lower reported levels of emotional neglect demonstrated
an exaggerated response compared to controls. The relationship between emotional
neglect and GR function was moderated by family history of mood disorder. Familial
mood disorder was associated with a greater HPA axis response, suggesting that genetic
susceptibility may interact with early adverse life events, resulting in reduced GR
mediated negative feedback. Following this a systematic review was conducted by Von
Werne Baes et al. (2012). They reported that overall, early life stress is associated with
GR resistance in both depressed and healthy people. The authors suggest that this is
partially attributable to an imbalance between GR and MR.
Dexamethasone-induced gene expression
Gene expression pattern has also been in investigated following oral dexamethasone
administration. Menke et al. (2012a) conducted an in vivo dexamethasone challenge test
and compared GR-mediated changes in gene expression in PBMCs between 18
depressed patients and 18 healthy controls. They reported that the top dexamethasone
regulated genes were less stimulated in depressed patients than in controls, reflecting
reduced GR sensitivity. FKBP5, DUSP1 and ZBTB16 were within the top genes
regulated by dexamethasone and these genes have all been associated with mood
disorders. The study also showed that GR-stimulated gene expression is a better tool
for discrimination between depressed patients and controls than either unstimulated
gene expression or dexamethasone suppression of plasma cortisol. An investigation into

122
FKBP5 expression, following in vivo dexamethasone challenge, has also been
conducted (Menke et al., 2013). FKBP5 mRNA expression was analysed in the PBMCs
of 68 depressed patients and 87 healthy controls, at baseline and after oral
dexamethasone administration. Patients carrying the risk allele (rs1360780) showed a
reduced induction of dexamethasone-stimulated FKBP5 mRNA compared to controls.
Interestingly, patients carrying the risk allele also demonstrated impaired cortisol
suppression, leading the authors to propose their findings as a potential explanation as
to why a disturbed HPA axis is not consistently found in patients suffering from major
depression.
MR function
In light of the aforementioned DST results and evidence presented earlier that MR
expression is reduced in the depressed brain, it is possible that depression is also
accompanied by decreased MR activity. This hypothesis was first explored by Young et
al. (2003) in a pilot study of 12 depressed patients and 12 controls. Participants were
administered spironolactone, an MR antagonist, and corticotropin and cortisol secretion
was measured in whole blood. In contrast to their expectations, the authors reported that
MR blockade resulted in a significant increase in cortisol levels in both groups,
suggesting that the MR is functional in depressed patients. In addition, depressed
patients demonstrated an actual increase in cortisol secretion rather than a delay in the
circadian fall, as observed in controls, suggesting that MR is functionally more active in
depressed patients. Patients also demonstrated a significant increase in corticotropin
levels, which was not observed in controls further indicating increased MR function.
However conflicting findings have been reported. Hinkelmann et al. (2016) conducted a
randomised, double-blind, within-subject cross-over study, including 48 depressed
patients and 45 controls. Participants received either spironolactone, an MR antagonist,
or placebo in the afternoon and the effects on cortisol were measured at various time

123
points during the same day. The results showed an increase in cortisol levels across
groups following spironolactone treatment. However depressed patients exhibited
elevated cortisol compared to controls following placebo but not following
spironolactone. These results are interesting because if the GR is impaired in
depression, as a vast body of evidence suggests, then we would expect to see significant
differences in cortisol release after MR blockade. In a heathy person, the GR would be
still be able to inhibit the HPA-axis, despite the lack of MR binding, and so the effect of
spironolactone would be modest. However in a depressed person with an impaired GR,
the effect of MR blockade would eliminate HPA-axis inhibition, resulting in a substantially
higher increase in cortisol. Therefore in this study, the results do not support GR
resistance in depression but suggest that impaired MR signalling may be responsible for
hypercortisolaemia in MDD (Hinkelmann et al., 2016).
MR dysfunction has also been observed specifically in people with psychotic MDD
(Lembke et al., 2013). Cortisol levels were assessed in 14 people with psychotic MDD,
16 people with non-psychotic MDD and 19 controls before and after fludrocortisone
administration. There were no differences in baseline cortisol across the groups or
between people with non-psychotic MDD and controls post fludrocortisone. However
cortisol levels were significantly increased in people with psychotic MDD compared to
controls following fludrocortisone administration, suggesting impaired MR feedback
inhibition.
MR function has been more extensively explored in patients with TRD. In a single-blind,
repeated-measure design study, prednisolone (5 mg) or dexamethasone (0.5 mg) was
administered to 18 severe TRD inpatients and 14 healthy volunteers (Juruena et al.,
2006). Salivary cortisol was collected the following day. Depressed patients has higher
baseline cortisol compared to controls after both treatments, however the depressed
patients showed impaired suppression by dexamethasone and normal suppression by
prednisolone, suggesting differential sensitivity. However a correlation was observed

124
between prednisolone suppression and dexamethasone suppression in controls,
suggesting equal sensitivity. The authors interpret these findings as an indication of
impaired GR function and retained MR function in depression.
In a study by Juruena et al. (2009) the PST was administered to 45 in-patients with TRD
and 46 controls. Results showed that whilst in-patients with severe TRD had higher
salivary cortisol levels compared with controls, both after placebo and after prednisolone
administration, the suppressive effect of prednisolone was similar in both groups. Given
that: 1) DST results in people with depression report impaired GR function; 2) both MRs
and GRs are active in negative feedback of the HPA-axis and 3) prednisolone is active
at both receptor sites, it seems plausible that MRs may play a compensatory role and
increase their signalling in the context of impaired GR function. However the authors also
reported that when analysis was stratified according to treatment response following
intensive in-patient therapy, they observed increased post-prednisolone cortisol output
in the non-responders compared with the treatment-responsive group, suggesting
impaired suppression. This observation was not made in the placebo condition. The
authors conclude that the compensatory role of the MR in depressed people is not
functional in severely treatment-resistant patients (Juruena et al., 2009).
In light of this finding, response to the PST was investigated in relation to antidepressant
treatment (Juruena et al., 2010). Saliva cortisol was measured in 28 in-patients with TRD
following either placebo or prednisolone administration, before and after an inpatient
treatment. The findings showed that the response to prednisolone does not change
before and after inpatient treatment, even in those who respond clinically. This suggests
that it is a stable aspect of HPA axis activity and is not modulated by improvement in
symptoms. This is in contrast to evidence showing that the response to dexamethasone
changes with symptom improvement. The authors were also able to repeat their previous
findings and show that a subgroup of patients demonstrated an impaired response to
prednisolone at baseline which was associated with a lack of future response to

125
treatment. This response did not change between admission and follow-up. Therefore,
MR dysfunction may be a stable biomarker of poor prognosis and treatment resistance
(Juruena et al., 2010).
Otte et al. (2010) investigated whether GR modulation with either an MR agonist
(fludrocortisone) or an MR antagonist (spironolactone) alongside SSRI therapy could
improve efficacy. 64 MDD patients were randomised to fludrocortisone, spironolactone
or placebo the first 3 weeks during five weeks of treatment. Whilst there was no
difference in depression scores or response times overall between the groups, among
the responders, patients receiving fludrocortisone and SSRI improved treatment
response by six days. This suggests that, in patients who respond to antidepressant
treatment, stimulation of MR improves the effects of SSRIs.
MR blockade was also used in a study by Juruena et al. (2013) who explored the effect
of a) stimulation with prednisolone; b) prednisolone with spironolactone and c)
spironolactone alone on GR/MR function in 24 TRD patients and 24 controls. TRD
patients had increased cortisol levels compared to controls in all three conditions. As
expected, in controls, spironolactone increased cortisol compared to placebo.
Additionally, administration of spironolactone plus prednisolone decreased the
suppressive effect of prednisolone. However in TRD patients, cortisol levels did not
increase in response to spironolactone and the combination of spironolactone with
prednisolone had no effect on the suppressive effects of prednisolone. This suggests an
inability of MR to exhibit negative feedback on the HPA-axis in TRD patients (Juruena et
al., 2013).
Overall, taken together with the existing data on GR function, the findings suggest that
an imbalance between the GR and MR may be important in the dysregulation of the
HPA-axis. The evidence for GR resistance in depression is consistent, however the role
of the MR in depression is still largely unclear, with many questions still unanswered. MR

126
expression appears to be decreased in depression and yet MR function appears to be
increased, although not for all subgroups. It has been shown that GR function is
necessary for HPA-axis feedback inhibition when cortisol is high but also that MR can
both facilitate GR signalling (Spencer et al., 1998) and compensate for its impairment
(Juruena et al., 2009). Therefore the balance between these two receptors is thought to
be important to HPA-axis regulation and imbalance may be a risk factor for mental health
disorders (E. R. de Kloet, 2014). To date only one study has investigated both GR and
MR function in MDD (Juruena et al., 2006). Further studies are required examining both
GR and MR function simultaneously in this population. To date MR function in
depression has only been investigated in vivo. Whilst these studies provide an indirect
measure of MR-mediated negative feedback on the HPA axis, the do not measures MR
function directly. In vitro studies are therefore required to directly probe the MR in
depressed people.
1.6 Inflammatory neuroendocrine interaction in depression
So far this thesis has presented evidence for both immune activation with increased
levels of cytokines, and HPA-axis hyperactivity with GR resistance in depressed people.
However the presence of both inflammation and hypercortisolism is rather puzzling.
Glucocorticoids are critical in supressing inflammation and autoimmune responses
(McEwen et al., 1997;Silverman & Sternberg, 2012) and are believed to play a major role
in protecting the brain against inflammation (Nadeau & Rivest, 2003). This suppressive
effect appears to not always be present in depressed people. Indeed growing data
suggests that inflammation itself may contribute to glucocorticoid resistance (Pace et al.,
2007b). In the following section I will first discuss how neuroendocrine abnormalities can
exacerbate inflammation and then I will examine the effects of inflammation on
neuroendocrine function.

127
1.6.1 Glucocorticoids effects on cytokines
Reduced glucocorticoid inhibition on inflammation
Neuroendocrine systems can influence inflammatory systems in two ways. Firstly,
dysfunctional glucocorticoid signalling could be less capable of inhibiting a pro-
inflammatory response. A study exploring the effects of chronic stress in caregivers
showed that whilst their cortisol levels were the same as that of the controls, their gene
expression profiles in PBMCs shifted from glucocorticoid signalling to inflammatory
signalling through diminished expression of transcripts bearing response elements for
each pathway (G. E. Miller et al., 2008). This suggests that even without increased
cortisol, chronic stress can induce glucocorticoid resistance and increased inflammation.
Animal studies provide some evidence for a shift from glucocorticoid signalling to
inflammatory signalling. In a mouse model of social stress, mice demonstrated impaired
nuclear translocation of the GR and increased activation of NF-kappa β in macrophages
(Quan et al., 2003). The impact of reduced glucocorticoid signalling on inflammation has
been demonstrated in a study by Wang et al. (2011) where they observed the effects of
GR blockade on depressive-like behaviour in rats. Administration of GR antagonist 3
days before LPS injection resulted in blockade of GR, significantly increased depressive-
like behaviour and increased levels of TNFα and IFN-γ. However a similar study showed
GR blockade showed a decrease or no effect on cytokine release (B. Yang et al., 2008).
There is therefore some evidence to support the hypothesis that impaired GR function
leads to both inflammatory activation and depressive symptoms but this is by no means
conclusive.

128
Glucocorticoids may have pro-inflammatory effects
Secondly, there is a possibility that GCs could be pleiotropic and have context specific,
pro-inflammatory functions. This hypothesis is in direct contrast to the one above in that
it is not a dysfunctional GR that causes inflammation but that inflammation is a result of
normal glucocorticoid signalling (Horowitz et al., 2013). There is some evidence to
suggest that glucocorticoids can promote an adaptive inflammatory response and that
they are anti-inflammatory at very low and high doses but pro-inflammatory at
intermediate doses.
Mouse macrophages show increased phagocytosis following IFN-γ stimulation when
incubated with an intermediate dose of glucocorticoids, than when incubated with IFN-γ
alone (Warren & Vogel, 1985). Similarly, rat macrophages pre-treated with
glucocorticoids prior to LPS and IFN-γ stimulation have demonstrated increased levels
of IL-6 and TNF-α (Smyth et al., 2004). Furthermore this increase in inflammatory
activation occurs in a dose-response fashion, but only at intermediate concentrations (T.
Y. Zhang & Daynes, 2007). Taken together these studies have implications for patients
with depression, as cortisol levels in depressed people are only modestly elevated,
similar to the studies above (Fang et al., 1981;Halbreich et al., 1985).
The timing of glucocorticoid administration may also have an impact on the nature of its
inflammatory effects. For example, prior exposure to corticosterone in rats before LPS
stimulation, resulted in increased IL-1β, TNF-α and IL-6 levels. However exposure to
corticosterone after LPS stimulation suppressed this pro-inflammatory response (Frank
et al., 2010). These findings are further supported by studies involving ‘stress induced
priming’. Frank et al. (2012) exposed rates to inescapable tailshock (a paradigm used to
induce acute stress and depressive-like behaviour) and then challenged the
hippocampal microglia with LPS ex-vivo, resulting in increased IL-6, IL-1β and NK-kβ.
Prior treatment with either GR antagonist or adrenalectomy blocked this response.
129
The importance of timing has also been shown in clinical studies. In a study by Barber
et al. (Barber et al., 1993) hydrocortisone treatment 12 or 144 hours before LPS
administration resulted in increased levels of IL-6 and TNF-α, however hydrocortisone
treatment either immediately before or 6 hours before LPS resulted in a reduction in
inflammatory cytokines. A study in healthy people showed that baseline cortisol
concentrations did not exert an anti-inflammatory effect and that an intermediate
concentration of cortisol treatment before LPS injection resulted in maximal inflammatory
responses, whilst a high dose had no effect (Yeager et al., 2011). Finally, glucocorticoids
may also increase cytokine production via metabolic pathways. Increased levels of
cortisol results in an increase in central obesity, insulin resistance and dyslipidaemia.
This increase of adipose tissue can then increase levels of IL-6 (Yudkin et al., 2000).
There is also some evidence for MR signalling effects on cytokine production in murine
models (J. Chen et al., 2016). MR agonist has been shown to enhance production of L-
1β and IL-6 mRNA induced by LPS in both cerebrospinal fluid and prefrontal cortex of
rats (Bay-Richter et al., 2012). Furthermore, a positive correlation was observed between
IL-1β in CSF and depressive-like behaviour.
1.6.2 Cytokine effects on glucocorticoids
HPA-axis function
Cytokines can affect neuroendocrine function via two main mechanisms: activation of
the HPA-axis and direct effects on the GR (Horowitz et al., 2013). Firstly, cytokines have
been shown to promote the release of CRH, ACTH and cortisol (A. H. Miller et al., 2009).
Chronic administration of cytokines has been shown to increase CRH, ACTH and cortisol
in animal studies (Besedovsky & del Rey, 1996;Felger et al., 2007). This has also been
demonstrated in patients undergoing acute IFN-α treatment in the context of medical
illness. IFN-α is used clinically in the treatment of both cancer and infectious diseases

130
due to its antiviral and anti-proliferative effects (Pace & Miller, 2009a). It has been shown
to increase HPA-axis activity within a few hours, in vitro and in vivo, resulting in marked
increases in ACTH and cortisol (Gisslinger et al., 1993) and depressive symptoms
(Capuron et al., 2002a). ACTH and cortisol was measured in 14 patients with malignant
melanoma, before and after IFN-α therapy (Capuron et al., 2003). ACTH and cortisol
responses were significantly higher in the patients who subsequently developed
depressive symptoms compared to those who did not. Furthermore, the degree of
hyperactivity after the first dose of IFN-α predicts depressive symptoms, suggesting
some patients may have a pre-existing sensitivity of the HPA axis and predisposition to
depression. In contrast, chronic exposure to IFN-α therapy has been associated with a
flattening of the diurnal cortisol slope and increased evening plasma cortisol
concentrations in in 33 patients receiving treatment for hepatitis C (Raison et al., 2010).
Furthermore, these effects were correlated with increases in depression. Release of
TNF-α has also been shown to elevate levels of ACTH, CRH, and cortisol (Black,
1994;Dantzer et al., 1999b) and upregulate the HPA-axis (Ma et al., 2016). These studies
are of particular importance because they suggest a direction of causality, namely that
increased inflammation causes HPA-axis dysfunction. However it is still unclear whether
this is a result of the effects of cytokines on HPA-axis activity or an effect on the GR
(Horowitz et al., 2013). Furthermore, it should also be noted that these findings were
made in people with very serious advanced diseases that are known to affect immune
function, so they may not generalise to people with depression and no physical illness.
A few cross-sectional studies have reported concurrent indices of plasma cortisol levels
and circulating inflammatory markers in people with MDD compared with healthy
controls, with the majority focusing on IL-6 and TNF-α. Several studies have reported
Increased plasma cortisol in conjunction with increased IL-6 in depressed people
(Carvalho et al., 2008;Carvalho et al., 2013;Karlović et al., 2012;Martinac et al.,
2017;Trzonkowski et al., 2004). However, other studies have reported similar plasma
cortisol levels between depressed people and controls alongside increased IL-6 in the

131
depressed groups (Alesci et al., 2005;Humphreys et al., 2006;Maes et al., 1995;Maes et
al., 1993b) and one study reported no difference in either plasma cortisol or IL-6 in
depressed patients compared with controls (Marques-Deak et al., 2007). Higher plasma
cortisol has also been reported along with both increased TNF-α (Y. Chen et al.,
2017;Kahl et al., 2017;Kahl et al., 2015) and decreased TNF-α (Rudzki et al., 2017) in
depressed patients compared with controls. However, lower plasma cortisol and lower
TNF-α levels have also been reported in MDD patients (Lopes et al., 2012). In general,
studies reporting plasma cortisol levels provide inconsistent support for the notion that
increased inflammation activates the HPA-axis in MDD.
Studies investigating saliva cortisol and circulating inflammatory cytokines are fewer and
have often focused on sub-group comparisons. Simmons et al. (2018) reported higher
saliva cortisol in depressed participants with reduced appetite compared with healthy
controls but there was no difference in either IL-6 or CRP. Conversely, in depressed
participants with increased appetite both IL-6 and CRP were increased but there was no
significant difference in cortisol, suggesting that the relationship between HPA-axis
function and inflammation may differ according to distinct depression subtypes. Another
study by Bauer et al. (2003) showed that basal morning saliva cortisol levels and TNF-α
levels did not differ between patients and controls
To date only two studies reported cortisol awakening response as an outcome measure.
Lamers et al. (2013) analysed data from 776 people from the Netherlands Study of
Depression and Anxiety and reported that CRP, IL-6 and TNF-α levels were significantly
elevated in atypical depression compared to controls. Regarding saliva cortisol, the CAR
AUC and diurnal slope was significantly higher in melancholic depression compared with
controls. This finding lends further support to the notion that depressive subtypes differ
in their biological correlates and suggests that HPA-axis hyperactivity is a distinct feature
of melancholic depression, whereas increased inflammation is a feature of atypical

132
depression. Verduijin et al. (2015) used data from the same cohort study to investigate
inflammatory and HPA-axis dysregulation across 8 consecutive stages of MDD
progression, from familial risk to chronic MDD. A linear increase of CRP, IL-6 and saliva
was observed across the entire sample. Significant trends of dysregulations in IL-6 and
cortisol AUC across stages were present for at-risk individuals, however no trends were
found in dysregulations for any of the mechanisms across more progressive stages of
full-threshold MDD. This suggests that the mechanisms involved in depression aetiology
may be less important in the progression and maintenance of MDD.
In order to address the conflicting nature of these findings a very recent systematic
review and meta-analysis was conducted. Perrin et al. (2019) included 32 studies
comparing cortisol and inflammatory cytokine levels in MDD patients compared with
controls and reported a trend for an association between increased cortisol and
increased IL-6 and TNF-α. The cross-sectional nature of study does not allow for causal
inference but this study provides support for an association between cytokine production
and HPA-axis activity. However, due to the lack of studies reporting cortisol within the
first hour of waking, it is still unclear whether there is a relationship between inflammation
and diurnal variations in cortisol. Further research is need to identify specific associations
between inflammatory biomarkers and diurnal cortisol parameters.
GR function
Secondly, cytokines are able to directly impair GR function. The effects of cytokines on
GR function are extensive and include GR translocation to the nucleus, GR protein-
protein interactions, GR binding to response elements on DNA and increased expression
of the GR isoforms GRα and GRβ (Pace & Miller, 2009b). Furthermore, cytokines can
affect the bioavailability of glucocorticoids by inhibiting 11βHSD (Kossintseva et al.,
2006) and CBG (Emptoz-Bonneton et al., 1997). Evidence also suggests that cytokines

133
can decrease GR translocation via a number of GR signalling pathways (Pace et al.,
2007a). For example, IFN-α activates the signal transducer and activator of transcription
(STAT) pathway, which binds to the activated GR in the nucleus preventing the GR
binding to its DNA response element (Hu et al., 2009). Nuclear factor-kB (NF-kB) also
disrupts GR function through a similar protein-protein interaction (Smoak & Cidlowski,
2004). Translocation of the GR from the cytoplasm to the nucleus is inhibited by
activation of the mitogen-activated protein kinase (MAPK) pathway (X. Wang et al.,
2004). Together these studies show that there are a plethora of ways in which cytokines
can impair GR function and increase HPA-axis activity.
A large body of evidence in cell models suggests that pro-inflammatory cytokine
administration (IL-1β, IL-2, IL-4,IL-15,TNF-α and IFN-α) can disrupt some aspect of GR
function (Goleva et al., 2002;Onda et al., 2006; Pace et al., 2011;Xu et al., 2004) however
the exact mechanism associated with each cytokine has yet to be identified (Horowitz et
al., 2013). TNF-α has also been shown to increase GRβ expression in cell models and
this increase was correlated with the development of GC resistance (J. C. Webster et
al., 2001). Cytokine induced GR resistance has also been demonstrated in animal
studies. GR resistance, as represented by DEX non-suppression, has been observed in
rats injected with herpes simplex-1 (HSV-1) and endotoxin (Bener et al.,
2007;Weidenfeld & Yirmiya, 1996). In another study IL-1 receptor knockout mice failed
to induce GR resistance in response to stress (Engler et al., 2008).
In humans, several studies have assessed the results of the DST in conjunction with
inflammatory biomarkers. An early study investigated whether IL-β production is related
to HPA-axis activity in depressed in-patients (Maes et al., 1993a). Cortisol levels before
and after the DST were measured, as well as mitogen-stimulated supernatant IL-β
production in PBMCs, in 28 depressed in-patients and 10 healthy controls. Results
showed a significant correlation between IL-β production and post-DST cortisol levels in
both the depressed and control groups. Up to 25% of the variance in the DST results

134
could be explained by IL-β production, supporting the hypothesis that HPA-axis
hyperactivity is enhanced by pro-inflammatory cytokines.
Another study by Landmann et al. (1997) compared TNF-α levels and plasma cortisol
levels, before and after oral administration of DEX, in depressed people and controls.
TNF-α and cortisol response to DEX did not differ between the groups. Circulating TNF-
α has also been investigated alongside peripheral GR function, as demonstrated by
reduced cutaneous glucocorticoid receptor sensitivity in people with TRD. Fitzgerald et
al. (2006) reported that TRD patients demonstrated a reduced vasoconstrictor response
to topical application of steroids and significantly higher levels of both IL-6 and TNF-α
compared to controls. Furthermore, there was a significant inverse correlation between
TNF-a concentration and vasoconstriction response in the MDD group. The results failed
to show a significant difference in plasma cortisol between the TRD patients and controls,
nor any correlation between plasma cortisol and inflammatory cytokines or depressive
symptoms. The authors speculate that these findings may reflect a direct influence of
inflammatory cytokines on the GR, as opposed to via increased HPA-axis activity and
subsequent hypercortisolaemia.
Lisi et al. (2013) assessed salivary cortisol circadian rhythm after low dose DST and
gene expression of IL-6 in MDD patients before and after 8 months of antidepressant
drug treatment. At baseline, IL-6 expression was markedly increased in the MDD patients
compared to healthy controls, although due to high variability this did not reach
significance. A strong trend to reduction at follow-up was observed although this also
failed to reach significance. DST results showed normal suppression in healthy controls,
whereas 30% of the depressed group demonstrated non-suppression and remained
non-suppressors at follow-up. However, they found no differences among the profiles of
daily cortisol secretions between the groups at either time point and inflammatory
changes were not associated with levels of circulating glucocorticoids. The authors
conclude that immune dysregulation in MDD is independent from HPA axis function.

135
However there is also conflicting evidence that elevated cytokines in depressed patients
are associated with GR resistance. Schuld et al. (2003) investigated the interaction of
inflammatory and HPA-axis changes MDD by studying TNF-α and IL-6 levels and ACTH
response to the combined DEX/CRH test on 14 MDD patients. TNF- α levels were
significantly and negatively correlated with the amount of ACTH released following the
DEX/CRH test. This suggests that HPA system over-activity is accompanied by a
reduced production of TNF-α. In contrast, IL-6 production was not correlated with HPA-
axis activity. The authors speculate that this discrepancy may be a reflection of a
difference in sensitivity of glucocorticoids to IL-6 and TNF-a. Higher IL-6 levels are known
to be needed to significantly stimulate the HPA-axis during experimental immune
stimulation in vivo (Schuld et al., 2000;Spath-Schwalbe et al., 1998). The findings from
this study stand in direct contrast to the plethora of studies which demonstrate both
increased HPA-axis activity and increased cytokine levels suggesting that cytokines
activate the HPA-axis. The negative correlation between TNF- α and the DEX/CRH test
results presented here suggest that HPA activity suppresses the cytokine system.
A similar result was replicated in a study by Himmerich et al. (2006), who examined
alterations in plasma levels of TNF-α, levels of its soluble receptors p55 (sTNF-R p55)
and p75 (sTNF-R p75) as well as response to the DEX/CRH test on admission and at
discharge in 70 depressed inpatients without inflammation. The authors reported a
negative correlation between TNF-α and the response to the CRH/DEX test at admission
and a trend towards a negative correlation with the cortisol response. This suggests that
HPA-axis activity in acute depression suppresses the release of TNF-α. Furthermore, a
positive correlation between TNF-α and CRH/DEX test outcome was observed in
remitted patients following successful antidepressant treatment and normalisation of the
HPA-axis. This implies that upon resolution of depressive symptoms, the TNF-α system
increases its control over the HPA-axis. Together the results of this study suggest that
during a depressive episode, the HPA-axis is activated, which in turn supresses the TNF-
α system. Upon remission, the HPA-axis normalizes. However the degree to which the

136
HPA-axis normalizes appears to be dependent on TNF-activity. Patients in remission
who demonstrate no increase or even a reduction in TNF-α between admission and
discharge showed greater HPA-axis normalisation, whilst patients with increased TNF-α
at discharge showed less normalisation. It should be noted that neither the Schuld
(2003) study nor the Himmerich et al. (2006) study used a control group, making
inferences about MDD rather tenuous.
A systematic review and meta-analysis of nine studies which reported DST results and
cytokine levels between depressed patients and controls, observed a trend for higher
GR resistance in depressed individuals which was associated with increased cytokine
levels Perrin et al. (2019). However it should be noted that DST studies measure
peripheral GR function only and do not directly measure GR sensitivity. Additionally,
findings cannot be translated into inferences regarding the CNS. Due to the small
number of studies included in this analysis, the authors adopted a broad inclusion criteria
including studies involving patients with co-morbidities such as cancer, resulting in
potential confounding.
Studies have also investigated in vitro measures of GR function and inflammatory
cytokines in MDD. An early cross-sectional study in 24 depressed inpatients and 8
healthy controls measured IL-6 production in culture supernatants of mitogen-stimulated
PBMCs and post-dexamethasone cortisol (Maes et al., 1993b). The authors reported
that IL-6 activity was significantly correlated with post-dexamethasone cortisol values
across the sample, suggesting that IL-6 may stimulate the HPA-axis. Carvalho et al.
(2008) measured GR function in people with TRD by glucocorticoid inhibition of LPS-
stimulated IL-6 levels following incubation with the tricyclic antidepressant,
clomipramine. Patients had higher plasma IL-6 and higher plasma cortisol compared with
controls. The authors observed no difference in GR sensitivity between the groups,
however fact that GR function appeared normal in the presence of hypercortisolaemia
suggests a functional GR difference between patients and controls.

137
Gene expression studies have also investigated mRNA levels of genes belonging to GR
function and inflammation in depressed people. Cattaneo et al. (2012) reported a
dissociation between biomarkers that predicted future response and those that were
targeted by antidepressants, before and after 8 weeks of antidepressant treatment.
Increased baseline levels of the inflammation-related genes, IL-1β, macrophage
inhibiting factor and TNF-α, predicted lack of response to antidepressants, but successful
antidepressant response was not associated with a reduction in the levels of these
genes. In contrast, successful antidepressant response was associated with a reduction
in the levels of the gene for IL-6 and GR associated gene expression. Another study by
Carvalho et al. (2014) compared gene expression between 47 medication-free
melancholic MDD inpatients and 42 healthy controls reported that immune cells in MDD
patients overexpress inflammatory genes and under express the active GR variant, GRα,
suggesting reduced sensitivity of monocytes to glucocorticoids. Furthermore, the
reduced GRα expression correlated strongly to the increased expression of inflammatory
genes.
A review of four studies that assessed GR function either by in vitro assays or gene
expression was unable to report a positive association between GR resistance and
inflammation (Perrin et al., 2019). However the effect sixe observed was larger than for
studies focused on DST results or plasma/saliva cortisol levels. However, it should be
noted that this analysis included a gene expression study, not reported in this review,
involving CHD patients with comorbid depression, which creates an issue of
confounding. In vitro studies provide the most direct and controlled measure of GR
sensitivity, therefore may be more likely to detect any significant effects. Further in vitro
studies required to test this hypothesis.
The conflicting findings in the overall literature likely reflect the variability of measures
used. Perrin et al. (2019) suggest that combining multiple independent measures of
HPA-axis function is likely to provide the best opportunity for detecting any trends and

138
allow for better comparison across studies. A more comprehensive characterisation of
GR function, in tandem with analysis of the major cytokines implicated in depression
such as IL-6 and TNF-α, would help to disentangle the complex relationship between
HPA-axis dysfunction and inflammation in MDD. Furthermore, studies should adopt
more stringent inclusion criteria, restricting study populations to MDD patients without
medical or psychiatric comorbidities. The inclusion of medication-free patients is also of
importance as antidepressants are known to modulate cytokines (Hiles et al.,
2012a;Kohler et al., 2018;Wiedlocha et al., 2018) and HPA-axis activity (Heuser et al.,
1996;Linkowski et al., 1987).
1.6.3 Summary of evidence
In summary, there is a vast amount of information implicating inflammation in the
pathogenesis of depression. Patients with depression show increased biomarkers for
inflammation, particularly IL-6, TNF-α and CRP, administration of cytokines induces
depressive symptoms and both acute and chronic stress activates an inflammatory
response. In addition, depressed people demonstrate a dysregulated HPA-axis, as
demonstrated by increased levels of glucocorticoids and disturbed diurnal rhythm,
although the direction of dysregulation regarding specific diurnal cortisol parameters is
not entirely clear. The presence of both inflammation and hypercortisolism in MDD
presents something of a paradox. Glucocorticoids should theoretically dampen down an
inflammatory response and yet it appears that they do not always do that.
This thesis has presented evidence for a complex interaction between inflammatory
activation and neuroendocrine function and suggested possible explanatory
mechanisms, including cytokine activation of the HPA-axis, cytokine induced GR
dysfunction and reduced inflammatory inhibition as a result of dysfunctional
glucocorticoid signalling. To date most studies have focused on either inflammation or
HPA-axis function, although a few have reported associations between the two, with

139
conflicting results. There seems to be a reciprocal relationship between inflammation
and HPA-axis function however the nature of this relationship has yet to be fully
elucidated.
In vitro assessment of GR sensitivity has rarely been explored in conjunction with
inflammation, despite that fact that it may offer the most effective measure. There is also
a very little known about MR function in depression and a complete lack of research
investigating any relationship with inflammation. Most studies report average cortisol
measures, only two studies have reported cortisol awakening responses and indices of
inflammation. To date there have been no studies reporting in vitro GR and MR function
results, diurnal cortisol outcomes and inflammatory cytokine levels in people with MDD
compared with controls. In order to address this gap in the literature, this PhD will
simultaneously investigate multiple biological differences between people with MDD and
healthy controls, including inflammatory cytokine levels (IL-6 and TNF-α), in vitro
assessments of GR and MR sensitivity and diurnal cortisol rhythm.
1.6.4 Research aims
The aim of Study 1 of this PhD is to investigate the relationship between the immune
system and HPA-axis function in people with depression.
Study 1a will focus on the following research questions:
1. How do inflammatory profiles differ between people with MDD and healthy controls?
2. How does glucocorticoid and mineralocorticoid sensitivity differ between people with
MDD and healthy controls?

140
3. How does diurnal cortisol rhythm differ between people with MDD and healthy
controls?
4. Is there an association between increased inflammation and HPA-axis function in
MDD?
In addition, it is unclear how these factors, and the relationships between them, change
in relation to symptom remission. There is some evidence to suggest that inflammation
is attenuated following successful antidepressant treatment and particularly high levels
of inflammation may contribute to treatment resistance. However there are mixed
findings with some findings reporting a pro-inflammatory effect of antidepressants.
Results regarding clinical recovery and diurnal cortisol are also mixed with no clear
agreement concerning the direction of association. GR function studies suggest
increased sensitivity following successful antidepressant treatment, however it is still
unclear whether MR sensitivity is associated with symptom remission. The longitudinal
association between inflammation and HPA-axis function has yet to be fully explored.
To date there have been no studies reporting in vitro GR and MR function results, diurnal
cortisol outcomes and inflammatory cytokine levels longitudinally in people with MDD.
Therefore, study 1b of this PhD will also investigate the following research questions:
1. Are changes in inflammatory markers associated with change in depressive
symptoms over time?
2. Are changes in glucocorticoid and mineralocorticoid sensitivity associated with
change in depressive symptoms over time?
3. Are changes in diurnal cortisol rhythm associated with change in depressive
symptoms over time?

141
4. Are changes in inflammation associated with changes in HPA-axis function over
time?
1.7 Chapter summary
Depression is a heterogeneous disorder, with high co-morbidity, a variable trajectory, an
unpredictable response to treatment, and as yet, no established mechanism. The
monoamine hypothesis, which remains the dominant model of depression, fails to
account for why some people develop depressive symptoms and others do not, or why
some people respond to treatment whilst others appear resistant. The aetiology of
depression is likely to be far more complex than simply a disorder of the brain, and will
almost certainly include alterations in multiple biological systems, including the immune
system and the HPA-axis.
A large body of evidence demonstrates alterations in immune function in depression, yet
this relationship is also far from simple. Depression is associated with increased
inflammation, however this is not a universal phenomenon. There is considerable
variability in biomarker levels between individuals and the effect sizes are small, likely
reflecting the heterogeneity of the condition. Inflammation may be causally related to
some cases of depression but not all, and the degree to which inflammation plays a role
is still unclear. Further complications arise from fact that inflammation is associated with
both physical and additional psychiatric disorders and is moderated by a multitude of
factors such as age, body mass index, gender, medication use and childhood
maltreatment. There appears to be a degree of normalisation of the inflammatory
response following antidepressant treatment, however findings are inconsistent.
The relationship between inflammation and depression may also be moderated by
glucocorticoids. Indeed one of the most reliable findings in depression research is
hyperactivity of the HPA-axis. However dysfunction is not evident in all depressed people

142
and the degree of hyperactivity varies considerably across patients groups.
Antidepressants may impact HPA-axis function, however the findings in this area are
inconclusive. Mounting evidence points to the role of the glucocorticoid receptor and GR
resistance is reliably demonstrated in depressed people, whilst the role of the MR is still
unknown. To further complicate things, the relationship between inflammatory cytokines
and glucocorticoid function is likely to be bidirectional, with alterations in either system
having consequences for the functionality of the other. However the exact nature of this
relationship has yet to be characterised. Taken together the evidence suggests that
immune dysregulation and HPA-axis dysfunction interact to influence the development
and maintenance of depression.
143
2. Study 1 - The Resist Study: Introduction and methods
2.1 The Resist Study
As outlined in Chapter 1, despite a robust literature demonstrating increased levels of
inflammation and a disturbed HPA-axis in MDD few clinical studies have investigated
associations between these aspects. In addition, an emerging body of research indicates
that there may be abnormalities in adaptive immune function in people with depression
and that this may also be associated with both inflammation and HPA-axis function.
However findings in this field are sparse and inconsistent. By taking a multiple biological
systems approach and exploring associations between these systems, the complex
underpinnings of MDD may be further elucidated. This may help us understand the
pathophysiology of depression and guide treatment.
The Resist Study was set up to: 1) explore the association between increased
inflammation and HPA-axis function in MDD and 2) explore any association between
Tregs and HPA-axis function in MDD. This study was an observational study which
assessed circulating inflammatory biomarkers, HPA-axis function, Tregs and
psychosocial measures. In addition, people with depression were also assessed at six
week follow-up to determine whether any changes in these parameters were associated
with changes in depression.
The inflammatory markers measured in the Resist Study included IL-6 and TNF-α.
Neuroendocrine parameters included diurnal cortisol profiles and corticosteroid receptor
sensitivity. Circulating Treg frequencies were also measured. Major depressive disorder
was measured by structured clinical interview. A number of psychosocial factors were
also measured via self-report. These included depressive symptoms, perceived stress,
life events and childhood maltreatment and health behaviours including smoking and
BMI. The focus of Chapters 3, 4 and 6 will be on the differences in these variables and

144
associations between them. Chapter 3 will focus on cross-sectional analyses of
inflammation and neuroendocrine function, chapter 4 will focus on the longitudinal follow-
up analyses and chapter 6 will focus on Treg frequencies.
2.2 Methods
2.2.1 Study design
The Resist Study was an observational, case-control study, including people with
symptoms of depression and healthy controls. Depressed people attended two
assessments: a baseline assessment and a follow-up up assessment six weeks later.
This follow up assessment was selected in order to ascertain whether any changes in
psychological symptoms were associated with any biological changes over time. Healthy
controls attended baseline assessment only. Full details of the study protocol are
provided in section 2.2.5.
2.2.2 Sample size
A statistical power analysis was performed for sample size estimation, based on data
from several studies. Haapakoski et al. (2015) published a cumulative meta-analysis
investigating studies comparing inflammatory biomarkers in MDD patients with healthy
controls. The authors reported a medium-sized effect for IL-6 (n= 31, combined d = 0.54,
total n (MDD) = 1045, total n (non-MDD) = 977) and a small effect for TNF-α (n = 31,
combined d = 0.40, total n (MDD) = 1214, total n (non-MDD) = 1262). Another study by
Huber et al. (2006) compared the CAR between depressed and non-depressed people
and reported a small effect size (d = 0.55). Grosse et al. (2015) published a study
comparing Tregs frequency between MMD patients and controls prior to antidepressant
treatment (n = 40 in each group). The study showed a medium affect size (d = 0.5). As
no previous studies have reported effect sizes for differences in GR or MR sensitivity

145
using corticosteroid inhibition of LPS-stimulated cytokines in whole blood, power
calculations directly relevant to these neuroendocrine parameters, could not be carried
out. Due to time and laboratory constraints, the Resist Study aimed to have a sample of
90 participants (MDD group n = 60, control group n = 30). We performed statistical power
analyses using G*Power software which revealed that with a sample of 60 depressed
participant and 30 controls we would have >65% power to detect any differences in IL-
6, TNF-α, Tregs and the CAR between depressed people and healthy controls.
2.2.3 Recruitment
We planned to recruit 90 participants, 60 people with symptoms of depression and 30
healthy controls. We decided upon this sample size to allow for attrition. Attrition is a
particularly large problem in mood disorder studies, where participants may feel less
motivated to attend assessments or provide samples, or may feel ashamed of their
symptoms.
We initially planned to recruit depressed participants via a randomised control trial,
PANDA, (UCL, 2015) in collaboration with Professor Glyn Lewis (GL) from the Division
of Psychiatry at University College London (UCL). The PANDA trial was investigating the
severity and duration of depressive symptoms that are associated with a clinically
important response to SSRIs in people with depression. The PANDA researchers
recruited depressed patients from primary care, who were not currently being treated
with antidepressants. They then randomised them to either sertraline or placebo and
followed them up at two, six and 12-week time points. We selected this trial because it
would have given us participants who were free from antidepressants at baseline. We
would then have been able to observe any effect of antidepressants on inflammatory
biomarkers. Our aim was to use the psychological data collected by the PANDA
researchers and to collect additional biological data at baseline and six-week follow-up.

146
Patients in the PANDA trial who had indicated that they agreed to be contacted with
information of any future studies relating to depression were considered for the Resist
study. At the baseline interview, the PANDA researcher assessed depressive symptoms
using the Clinical Interview Schedule-Revised (CIS-R) and the Patient Health
Questionnaire-9 (PHQ-9). If the participant was categorised as meeting depression
criteria for the Resist study they were given the Resist PIS and asked if they would also
like to be contacted by the Resist researcher to discuss the study in more detail. Details
of potential participants were then passed to the Resist researcher by telephone.
Recruitment began in August 2016, however uptake for the PANDA trial was very slow
and although seven participants were referred, we only successfully recruited one. Six
exclusions were due to physical co-morbidities and one was due to participant family
bereavement. In order to reach our target it was necessary for us to expand our
recruitment via additional methods.
In October 2016, we began recruiting directly from GP practices. In order to keep our
recruitment as parallel to the PANDA trial as possible, we worked alongside the same
Clinical Research Networks as the PANDA study. In total, we successfully recruited six
GP practices. GPs were asked to identify potential participants with depression during
consultation, provide them with a patient information sheet (Appendix 11.1) and refer
them via email to the researcher if they were interested in participating. Potential
participants were then contacted by phone to introduce the study and conduct screening,
if appropriate. 52 patients were referred via GP practices and we successfully recruited
18 people with symptoms of depression. 36 participants were excluded at screening, five
due to bi-polar disorder and the remaining 31 due to physical co-morbidities and /or
medications. Five patients did not attend their baseline assessment.
In January 2017, we approached iCope Psychological Therapies Service in Camden and
Islington, in collaboration with Professor Steve Pilling from the Division of Psychology
and Language Sciences at UCL, to discuss recruiting via their service. iCope is part of

147
the Camden and Islington NHS Foundation Trust and offers treatment for a range of
psychological problems, including anxiety and depression. Clients can self-refer or be
referred via their GP. The recruitment process consisted of an honorary assistant
psychological practitioner conducting monthly database searches of clients with
symptoms of depression, who had previously consented to being contacted regarding
research projects. A list of potential participants was then sent to a clinician for eligibility
screening. Potential participants were then referred to the study via email and were then
contacted by phone or email. In total, 97 potential participants were referred from iCope,
of which we successfully recruited 11 people with depression. 41 clients did not respond
to invitation, five declined, two were excluded (one for symptoms of anxiety only and one
for physical co-morbidity), one had incorrect contact details and two did not attend.
We also recruited people with depression online. We created a study page on the
website ‘Call For Participants’ (Call For Participants, 2018) (Appendix 11.2). This acted
as an advert for our study, which was published in a public, on-line community. Potential
participants were then able to contact us directly if they wished to partake. In order to
provide additional support for participants recruited online who may not yet be receiving
clinical care for depression, a signposting sheet was given to them at the baseline
assessment, containing information on how to seek help via their GP or local IAPT
service and contact information for mental health helplines (Appendix 11.3). We
successfully recruited two people with symptoms of depression via ‘Call For Participants’.
We also recruited people with depression through UCL. Posters were created and
displayed across the campus (Appendix 11.4) and the study was featured in the student
newsletter. Students or staff were then able to contact us directly is they wished to
participate. We recruited 13 people with symptoms of depression from UCL.
We initially planned to recruit healthy controls via the same GP practices as the PANDA
study. This method was chosen in order to demographically match our healthy controls

148
with our depressed participants as well as possible. Practice staff were provided with
eligibility criteria and asked to conduct a database search. A list of potential participants
was then passed to the GP for eligibility screening. Letters of invitation, containing the
researcher’s contact details, were sent out to patients, along with patient information
sheets (Appendix 11.5) via Docmail® (CFH Docmail Ltd, 2018). Upon receiving the letter
of invitation, people who were interested in joining the study contacted the researcher
either by phone or email. Mailings were sent out from three practices between October
2016 and March 2017, to 1,432 patients. This resulted in only two patients contacting
the researcher to discuss the study. Due to the low response rate and the associated
costs of conducting mail outs, we decided to recruit healthy controls from within UCL and
QMUL. We recruited four healthy controls from QMUL and 22 healthy controls from UCL.
Furthermore, we recruited a number of healthy controls from the NIHR Clinical Research
Network North West London (National Institute for Health Research, 2018). Staff who
were associated with supporting recruitment for our study in primary care volunteered to
be healthy controls. We recruited six healthy controls from NIHR. In total, we recruited
34 healthy controls and 45 people with MDD. Recruitment pathways are illustrated in
Figure 2.1.
All data were collected with the written informed consent of the participants. The study
obtained ethical approval in April 2016 (West Midlands - South Birmingham National
Health Service (NHS) Research Ethics Committee, 16/WM/0143). Additional approval
was obtained from the Health Research Authority in August 2016. The study was
published on ClinicalTrials.gov on January 2016 (ClinicalTrials.gov Identifier:
NCT02657798) (U.S. National Library of Medicine, 2018)

149
Abbreviations: DNA = did not attend; GAD = generalised anxiety disorder.
Figure 2.1 Recruitment pathways for people with depression.

150
2.2.4 Participants
A priori exclusion criteria included people with a diagnosis of other psychiatric disorders
such as psychosis, schizophrenia, bipolar disorder, mania, hypomania, dementia, and
eating disorder. Based on the baseline assessment we also excluded people who had a
primary diagnosis of generalised anxiety disorder (GAD), agoraphobia, panic disorder or
specific (isolated phobia). Full details of the measures used during assessments are
provided in section 2.2.6.
Inclusion criteria were that people had to be able to complete the psychological interview
and questionnaires in English and be between 18 and 74 years of age. In order to
exclude people who may have underlying systemic inflammation due to medical co-
morbidity, we excluded with significant physical illness (e.g. severe allergies,
hypertension, cancer and hematological, autoimmune, cardiovascular, endocrine,
pulmonary, renal, hepatic, gastrointestinal or neurological disease) as well as those who
had viral illnesses during the preceding two weeks. In order to control for the effects of
medications on inflammatory pathways we excluded people taking corticosteroid
medications, people with a history of hypersensitivity to corticosteroids or steroid use,
people who had been prescribed antibiotics in the last six months, anti-inflammatory
medication in the last three months or prescribed any medications for the treatment of
insomnia including hypnotic drug therapy, sedatives and melatonin in the last six weeks.
Furthermore, we excluded people who smoked more than 25 cigarettes per day, people
who were drug or alcohol dependent, pregnant or lactating women. The inclusion and
exclusion criteria for healthy controls was identical with one notable exception: healthy
controls needed to have no history or current symptoms of depression.
79 people in total consented to join the study, 45 people with symptoms of depression
and 34 healthy controls. Unfortunately, this was below our target; however, after 16
months of recruitment we decided that the due to the time constraints of the project,

151
further recruitment would not be possible. Out of these 79 participants, two healthy
controls were excluded at baseline due a BDI score of ‘mild mood disturbance’ (BDI
scores 14 and 16). This score was not substantiated by the CIS-R and so they were
unable to be recruited into the ‘depressed’ arm of the study. Eight depressed participants
were excluded at baseline due to a CIS-R primary diagnosis of GAD. In addition, two
depressed participants dropped out of the study after baseline assessment. One stated
that they no longer had time and the other gave no reason. Of the 69 participants
assessed at baseline, 61 provided baseline saliva samples. Three participants stated
that they had forgotten to post their samples, one was unable to take a sample due an
accident and four stated that they were unable to take the samples due to inconvenience
such as interfering with their work schedule. A flow diagram of participant data collection
and attrition is provided in Figure 2.2.
1 Eight participants failed to post diurnal cortisol samples after baseline assessments. Three forgot to post the samples. One was unable to take the samples due to an accident. Four were unable to take the samples due to inconvenience. 2 All participants provided blood samples at baseline. 3 13 participants failed to provide diurnal cortisol samples after follow-up assessment. Five were unable to take the samples due to inconvenience. Eight stated that they had forgotten to post them. 4 Problems with blood collection.
Figure 2.2. Flow diagram of participant data collection and attrition from the Resist Study.

152
2.2.5 Study protocol
Baseline: All participants attended baseline assessments at either their GP practice (if
they were recruited via the practice) or at UCL. Assessments were always conducted
between 8.00am and 9.00am to ensure homogeneity. Participants provided written
consent (Appendix 11.6). Following this the researcher conducted a brief interview to
collect demographic information. Participants were then asked to complete
questionnaires containing measures of depressive symptoms including depression,
perceived stress and life-time events. Depressed patients only were asked to complete
the CIS-R to provide a probable diagnosis of clinical depression. Following this, a
baseline blood sample was taken (approximately 50ml). Participants were then
presented with a saliva sampling kit and instructed on how to use them. The kit included
five pre-labelled ‘salivette’ collection tubes (Sarstedt, Leicester, UK) and a cortisol
sampling diary (Appendix 11.7). The cortisol diary contained instructions on how and
when to collect samples. These diaries were also used to record information on factors
likely to introduce variation in cortisol samples such as mood, exercise, and daily
stressors. Participants provided five saliva samples over the course of a day, on waking,
30 minutes after waking (30+), 60 minutes after waking (60+), 4pm and bedtime.
Participants stored their samples in the refrigerator before returning them to the
researcher via Freepost.
Follow-up (six weeks after baseline): Depressed participants only attended follow-up
assessments at either their GP practice or at UCL. Participants were asked to complete
questionnaires containing measures of psychiatric symptoms including depression,
affect, changes in sleep and appetite, perceived stress and childhood maltreatment.
Following this, a blood sample was taken. Participants were then presented with another
saliva sampling kit and asked to complete it exactly as before and post back to the
researcher.

153
2.2.6 Psychosocial Measures
Questionnaire measures were selected for several reasons. First, measures that had
been validated in healthy non-clinical populations were given preference. Second,
validated brief or shortened versions were chosen over full versions to reduce response
burden. Third, where measures were being administered twice, measures that have
been shown to be valid over repeated time-points were chosen. Two depression
measures were chosen and used simultaneously at baseline. This approach was
adopted to ensure that our identification of depressed people was robust and
generalisable across scales, as recommended by Fried and Nesse (2015b). Details of
the individual measures used are provided below and full versions of the study
questionnaires are provided in Appendices.
Sociodemographic information
Sociodemographic information was gathered from all participants to include age, body
mass index (BMI), ethnicity, marital status, employment status, smoking and alcohol
intake. All sociodemographic information was self-reported. BMI was calculated as
(kg/m2). Participants were characterised as normal (18.5 to 24.9) or overweight/obese
(25 and above). We did not have any participants who had a BMI under 18.5. Marital
status was defined as ‘married’ or ‘unmarried’ and ethnicity was defined as ‘white’ or
non-white’. Employment status was defined as ‘employed’ or ‘unemployed’. Smoking
was defined as ‘current smoker’ or ‘non-smoker’. Non-smokers included people who had
never smoked and those who had given up smoking. Alcohol consumption was defined
as ‘>one drink per month’ or ‘<one drink per month’.

154
Clinical information
Clinical information was collected from all participants and included physical health
comorbidities and medication history. Mental health history was also collected and
included number of previous depressive episodes, length of current depressive episode,
additional mental health comorbidities and treatment history, including both
pharmacotherapy and psychotherapy.
Depression
Depression was measured in two ways for depressed participants, interview (CIS-R) and
questionnaire (BDI-II), in order to allow internal replication. It was not possible to conduct
validity tests between the two measures, as their constructs are not identical (the CISR
includes mixed depression and anxiety, whereas the BDI-II only measures depression).
However, there was a positive correlation between the total scores of the two measures,
r=0.550, p=<0.001. Healthy controls were only asked to complete the BDI-II.
CISR
MDD was assessed during baseline interview using the computerised version of the
Clinical Interview Schedule-Revised (CIS-R) (Lewis et al., 1992). The CIS-R is a widely
used standardised measure of depression and anxiety disorders in community and
primary care research. It is a fully structured assessment, suitable for lay interviewers,
and as such can be self-administered using a personal computer. It is considered to be
one of the most reliable and valid measures of minor psychiatric disorders in the
community and is based on International Classification of Diseases, 10th Revision (ICD-
10) criteria (Head et al., 2013;World Health Organization, 1992).

155
The CIS-R produces a 10-item report, which is scored on a 0-4 scale (except the
depressive ideas item 0-5), depending on symptom severity and frequency (Lewis et al.,
1992). It yields diagnostic categories including, depressive disorder, generalised anxiety
disorder, mixed anxiety and depressive disorder as well as a total depression score of 0
to 21. The total depression score reflects the severity of depressive symptoms
experienced in the preceding week (Khandaker et al., 2014). A total score of 12 or more
indicates a clinically significant level of distress.
The CISR also includes a question about duration of current depressive episode. After
the depressive symptoms section the question asks about the following categories: less
than 2 weeks, between 2 weeks and 6 months, between 6 months and 1 year, between
1 and 2 years, between 2 and 5 years, between 5 and 10 years and more than 10 years.
In addition symptom scores for fatigue, concentration, and sleep problems are
calculated.
Beck Depression Inventory (BDI-II)
Depressive symptoms were also measured using the Beck depression Inventory II (BDI-
II) (Appendix 11.8). The BDI-II is also widely used as an outcome measure in studies of
depression in both clinical and non-clinical populations (A. T. Beck et al., 1996a). The
BDI-II has been comprehensively reviewed and found to demonstrate high reliability,
content and structural validity and be able to discriminate between depressed and non-
depressed participants (Y.-P. Wang & Gorenstein, 2013). It is has also been shown to
be sensitive to change across time and therefore suitable for use in studies with repeated
measures (Richter et al., 1998). It is also endorsed by the National Institute for Health
and Clinical Excellence (NICE) for use in primary care in measuring baseline depression
severity and responsiveness to treatment (Smarr & Keefer, 2011).

156
It is a 21-item self-report questionnaire which provides a group of four statements per
question. Participants are asked to choose one statement in each group which best
describes the way they have been feeling over the past two weeks. The questions refer
to this timeframe in order to correspond with the DSM‐IV criteria for major depressive
disorder. The BDI-II was scored by summing the scores of each item. A four‐point scale
indicates degree of severity; items are rated from 0 (not at all) to 3 (extreme form of each
symptom) with a highest possible score of 63 and a lowest possible score of 0. A score
of 0-13 indicates normal mood, 14-19 indicates mild depression, 20-28 indicates
moderate depression and 29-63 indicates severe depression (A. T. Beck et al., 1996a).
The Cronbach’s alpha for the BDI-II in this sample at baseline (n=69) was 0.95. The
Cronbach’s alpha at follow-up (n=35) was 0.87.
Life Events
Stress is widely acknowledged as an important factor in the aetiology of depression.
There is a wealth of evidence demonstrating a causal relationship between stressful life
events, such as a divorce or the death of a spouse, and the development of depression
(Kendler & Gardner, 2016). Life events were assessed using the List of Threatening
Experiences (LTE) questionnaire (Brugha et al., 1985) (Appendix 11.9). This is a widely
used measure and has been found to be valid and reliable in both psychiatric patients
(Brugha et al., 1985) and a population based sample (Rosmalen et al., 2012).
The LTE is a 12-item self-report questionnaire, which asks about unpleasant events over
the last 12 months. The LTS includes items such as ‘You yourself suffered a serious
illness, injury or an assault’ and ‘You had a separation due to marital difficulties’. In each
case, participants are asked to indicate whether each of the 12 different life events
occurred (yes/no). The LTE total score is the sum of the item scores (maximum
score=12).

157
Perceived Stress
The degree to which participants appraised the situations in their lives as stressful was
measured using the Perceived Stress Scale (PSS) (S. Cohen et al., 1983) (Appendix
11.10). The PSS was chosen because it provides additional data regarding life situations
that is not soley based on the qualities of the events themselves, but rather on personal
and contextual factors, such as an individual’s ability to cope. It has also been shown to
be reliable and valid in non-clinical populations (Roberti et al., 2006) and in a psychiatric
sample (Hewitt et al., 1992).
The PSS is a 10-item self-report questionnaire, which asks about feelings and thoughts
over the last month. The PSS includes items such as ‘In the last month, how often have
you felt that you were unable to control the important things in your life?’ and ‘In the last
month, how often have you felt difficulties were piling up so high that you could not
overcome them?’ In each case, respondents are asked how often they felt a certain way
and are scored on a five-point Likert scale, ranging from 0 ‘Never’ to 4 ‘Very often’. Items
4, 5, 7, and 8 are reverse scored. The Cronbach’s alpha for the PSS in this sample at
baseline (n=69) was 0.91. The Cronbach’s alpha at follow up (n=35) was 0.82.
Childhood Maltreatment
There is an extensive body of research which shows that childhood maltreatment
increases the risk of adult psychopathology (Thabrew et al., 2012). Exposure to physical,
sexual and emotional abuse and neglect have all been linked to depression in adulthood.
Childhood maltreatment was measured using the Childhood Experience of Care and
Abuse Questionnaire (CECA-Q) (Bifulco et al., 2005) (Appendix 11.11). The CECA-Q is
a self-report instrument that has been shown to be reliable and valid in a clinical
population (N. Smith et al., 2002) and a community sample (Bifulco et al., 2005). This

158
instrument is considered a first choice tool for broad clinical research (Thabrew et al.,
2012).
The CECA-Q is a self-report questionnaire used to assess neglect, antipathy, physical
abuse, and sexual abuse. There are 16 parental care items; 8 neglect items defined in
terms of parental disinterest in material care, health, schoolwork, and friendships and 8
antipathy items defined as parental hostility, coldness, or rejection. In each case,
respondents are asked to answer questions in terms of ‘How you remember your
mother/father in your first 17 years’, including items such as ‘She made me feel
unwanted” and “He would leave me unsupervised before I was 10 years old’. All items
were presented separately for each parent and were scored on a five-point Lickert scale
ranging from 1 ‘Yes definitely’ to 5 ‘No, not at all’. The mid-point, 3, was labelled as
‘Unsure’. Items 2, 3, 5, 8, 11, 12, 13 and 14 are reverse scored. A cut off score of 25, 22
or 24 or more indicates severity for maternal and paternal antipathy, maternal neglect
and paternal neglect, respectively. Cronbach’s alpha scores were determined for the two
CECA-Q dimensions of antipathy and neglect (n=66) and found to be 0.83 and 0.88,
respectively.
Physical abuse is defined in terms of hitting by parents or other older household
members. There is one screen item which asked ‘When you were a child or teenager
were you ever hit repeatedly with an implement (such as a belt or stick) or punched,
kicked or burnt by someone in the household?’ rated 0 ‘No’ or 1 ‘Yes’. In additions, there
are four supplementary items for assessing the severity of physical abuse which included
items such as ‘Did the hitting happen on more than one occasion?’ and ‘Were you ever
injured e.g. bruises, black eyes, broken limbs?. Items are rated 0 ‘No’ or 1 ‘Yes’ and
summed to give a total score of 0-4. A cut off score of one or more indicates severity.
There are also three screen items for sexual abuse which is defined by physical contact
or approach of a sexual nature by any adult, excluding consensual sexual contact with

159
peers. This section includes items such as ‘Did anyone force you or persuade you have
sexual intercourse against your wishes before age 17?’. Items are rated 0 ‘No’, 1 ‘Unsure’
or 1 ‘Yes’. Severe sexual abuse is assessed with seven additional items including items
such as ‘Was the other person a relative?’ and ‘Did this person do it to you on more than
one occasion?’ . Items are rated 0 ‘No’ or 1 ‘Yes’ and summed to give a total score of 0-
7. Scoring was based on initially summing the screening items and then summing the
severity items separately A cut off score of one or more indicates severity.
2.2.7 Biological Measures
Plasma IL-6 and TNF-α determination
Plasma IL-6 and TNF-α levels were measured at both baseline and follow-up
assessment. IL-6 and TNF-α production was measured using a commercially available
enzyme-linked immunosorbent assays (ELISA), from R&D Systems®, Inc. A more
detailed description of the cytokine determination assay protocols will be provided in
Section 3.3.1 of this thesis.
Cortisol sampling
Diurnal salivary cortisol secretion was measured at both baseline and follow up. Salivary
cortisol is routinely used as a measure of HPA-axis function. It has been shown to be a
reliable measure of ‘free’ unbound plasma cortisol, which is considered to be the
biologically active fraction (Kirschbaum & Hellhammer, 1989, 2000). High correlations
between salivary cortisol and unbound free cortisol level in plasma and serum have been
demonstrated, which are consistent throughout circadian rhythm (D. H. Hellhammer et
al., 2009). Saliva cortisol was chosen as a specimen over blood analysis for
methodological reasons. Saliva sampling is a comparatively inexpensive and non-
invasive method, avoiding issues associated with repeated venipuncture, making it an

160
ideal choice for ambulatory measurement of cortisol in naturalistic settings (Kirschbaum
& Hellhammer, 1989). Furthermore, salivary cortisol is stable at room temperature for
two weeks after sampling, allowing for participants to post their samples back to the
laboratory, without the need for centrifugation. A description of the calculation of diurnal
cortisol parameters will be provided in Section 4.3.1 of this thesis.
Corticosteroid receptor sensitivity
GR and MR sensitivity was measured by dexamethasone and prednisolone inhibition of
lipopolysaccharide (LPS) induced IL-6 levels in whole blood. IL-6 production was
measured using a commercially available Luminex technology kit for IL-6 from Bio-
RAD®. A more detailed description of the corticosteroid sensitivity assay protocol will be
provided in Section 3.3.3 of this thesis.
Measurement of Treg percentages
Peripheral blood mononuclear cell (PBMC) suspensions were prepared from sodium-
heparinized blood via Ficoll gradient centrifugation according to standard methods and
on the same day as the blood was collected. Samples were frozen in 10% dimethyl
sulfoxide (DMSO) and stored in liquid nitrogen until further analysis.
Tregs were identified as CD4+CD25+Foxp3+ cells. Membrane staining was be
performed to identify CD4 and CD25 and intracellular staining was performed to identify
FoxP3. Stained cells were analysed using flow cytometry. A more detailed description of
the Treg measurement protocol will be provided in Section 6.3.1 of this thesis.

161
2.3 Data Storage
All Resist data were handled according to the Data Protection Act 1998 as well as UCL
Information Security Policy. The project was registered with the UCL Data Protection
Office and the Health Research Authority. All data were anonymized using unique study
IDs. UCL’s Data Safe Haven (DSH), a technical solution for transferring and storing
information that is highly confidential, was used to store and handle data. DSH has been
certified to the ISO27001 information security standard and conforms to the NHS
Information Governance Toolkit. All paper questionnaires were anonymised and stored
in a locked filing cabinet in locked offices at UCL. Biological samples were assigned a
study identification number and did not display any personal data. They were held at
UCL and QMUL laboratories for relevant analysis, with access limited to members of the
study team. All saliva samples were recoded to ensure anonymity before being
transported to the University of Dresden for analysis via secure international courier.
Following analysis, these samples were destroyed in Dresden. The results of the saliva
analyses were returned to UCL electronically in password-protected spreadsheets and
are currently stored in password-protected computer files. Plasma and samples from
each participant are currently being securely stored in -20°C freezers in a code-protected
laboratory. Leukocyte samples are currently being securely stored in liquid nitrogen in a
code-protected laboratory. Anonymised raw data were entered onto a computer
database for statistical analysis. All data from the Resist Study may be kept in the secure
manner described above for up to 20 years prior to being destroyed.
2.4 Statistical analyses
All statistical analyses were performed using SPSS version 22.0 software (SPSS Inc.,
Chicago, Illinois, USA). The significance level was set to p<0.05 (two-tailed) for all
analyses. Specific details of statistical analyses carried out are included in chapters 4

162
and 5 which deal with IL-6 and TNF-α levels, corticosteroid receptor function, diurnal
cortisol, and measurement of regulatory T cell percentages.
2.5 My involvement and contribution
The research question regarding depressive symptoms and inflammatory biomarkers
was established between myself and Dr Livia Carvalho who has worked extensively in
this field. Dr Carvalho established the collaboration with the PANDA Study and
introduced me to Professor Glyn Lewis. Together we designed the Resist study. I was
responsible for the development and creation of all the study materials. I applied for all
regulatory approvals and was responsible for all recruitment and data collection. I
conducted all psychological interviews and was solely responsible for all blood and saliva
sampling. I also carried out all corticosteroid receptor sensitivity assays, plasma IL-6 and
TNF-α determination assays and Treg flow cytometry assays. I was responsible for the
recoding of all the saliva samples collected and organised their transport to the University
of Dresden for cortisol analysis. I created the dataset for the study and undertook all of
the data entry. I conducted all the statistical analyses myself, with help from my PhD
supervisors

163
3. Study 1a - The Resist Study results:
The association between TNF-α, IL-6 and HPA-axis function in people with MDD
compared with healthy controls
3.1 Introduction
As described in the literature review, evidence suggests an important role for immune
activation and neuroendocrine dysfunction in the pathology of depression. Increases in
levels of pro-inflammatory cytokines such as IL-6 and TNF-α, have been robustly
reported in depressed patients. Dysregulation of the HPA-axis is one of the most
consistent neurobiological findings in this population, although the exact nature of
disturbances in diurnal rhythm and the role of the MR are yet to be clarified. Inflammatory
cytokines activate the HPA-axis, resulting in an increase in cortisol, and glucocorticoids
are known to suppress the production of inflammatory cytokines during immune
challenge. It is therefore reasonable to hypothesize that inflammatory and
neuroendocrine alterations in depression might interact, yet, to date, these systems have
largely been investigated separately. The few that have investigated relationships
between the two have reported conflicting results. Furthermore, studies have often relied
on single but variable measures of HPA-axis function, adding to the inconsistency. By
examining differences in multiple biomarkers across both systems and exploring any
association between them, we hope to advance our understanding of the complex
mechanisms involved. In this section I will present results from the Resist Study
concerning differences in and associations between inflammation and HPA-axis function
in depressed people compared with healthy controls. These results may tell us more
about the ways in which these different biological systems interact in the pathophysiology
of depression.

164
3.2 Hypotheses
Many cross-sectional studies have demonstrated increased levels of inflammatory
biomarkers in depressed people. Several meta-analyses have reported increased levels
of IL-6 and TNF-α (Dowlati et al., 2010;Goldsmith et al., 2016b;Hiles et al.,
2012b;Howren et al., 2009;Kohler et al., 2017;Y. Liu et al., 2012). A cumulative meta-
analysis also confirmed the findings for IL-6 ((Haapakoski et al., 2015). We sought to
replicate this finding in the current sample. Therefore I hypothesise that people with
MDD will have significantly increased levels of inflammation compared with
healthy controls, specifically increased levels of plasma IL-6 and TNF-a
(hypothesis 1).
Regarding neuroendocrine function, in vitro studies of the GR have consistently reported
decreased sensitivity in depressed patients (Bauer et al., 2003;Calfa et al., 2003;Lowy
et al., 1984;Lowy et al., 1988;G. E. Miller et al., 2005b;Rupprecht et al., 1991c;Tanke et
al., 2008;Wodarz et al., 1991;Wodarz et al., 1992). In vivo, DST studies (Gormley et al.,
1985;Lowy et al., 1988;A. Wassef et al., 1990) and Dex-CRH studies (Bardeleben &
Holsboer, 1989;Gonul et al., 2017;Heuser et al., 1994;Holsboer-Trachsler et al.,
1991;Holsboer et al., 1987;Modell et al., 1997;von Bardeleben & Holsboer, 1991) also
provide robust evidence that GR sensitivity is decreased in depression. Overall there is
a lack of studies investigating the MR in depression and what evidence there is, is mixed,
with some studies demonstrating retained sensitivity (Juruena et al., 2006;Juruena et al.,
2009), some demonstrating increased sensitivity (Young et al., 2003) and some
demonstrating impairment (Hinkelmann et al., 2016;Juruena et al., 2009;Juruena et al.,
2013;Lembke et al., 2013). Therefore, in order to address this gap in the literature, this
study will explore both GR and MR sensitivity between people with MDD. Based on the
findings above, I hypothesise that people with MDD will exhibit significantly
decreased glucocorticoid sensitivity (hypothesis 2) and significantly different
mineralocorticoid sensitivity compared with controls (hypothesis 3).

165
The evidence for hyperactivity of the HPA-axis in depression is robust, however findings
regarding depression and diurnal cortisol profiles are mixed. The majority of cross-
sectional and longitudinal studies provide evidence for associations between increased
CAR and clinical depression (Dienes et al., 2013;Hardeveld et al., 2014;Rhebergen et
al., 2015;Ulrike et al., 2013;Vreeburg et al., 2009a). However, other studies have
reported lowered or blunted CAR in depressed people (Huber et al., 2006;Stetler & Miller,
2005). Similarly, both increases and decreases in the CAR have been associated with
symptom remission (J. Beck et al., 2015;Ruhe et al., 2015). Increased AUC has also
been reported in clinically depressed people (Dienes et al., 2013;O'Brien et al., 2004),
however one study found no difference between depressed people and controls (Gonul
et al., 2017). Most studies have reported a flatter slope in depressed people (Adam et
al., 2017;Hsiao et al., 2010;Jarcho et al., 2013), although there is also some
inconsistency with some a few studies reporting either a steeper slope (S. H. Booij et al.,
2015) or no difference between depressed people and healthy controls (Assies et al.,
2004;Doolin et al., 2017). In order to address these inconsistencies in the literature we
compared diurnal cortisol rhythms between people with MDD and healthy controls.
Based on the balance of findings, I hypothesise that people with MDD will exhibit
significantly altered diurnal cortisol secretion compared to healthy controls,
including increased CAR, increased AUC and flatter cortisol slope (hypothesis 4).
In terms of the relationship between these pathways, very few MDD studies have
explored associations between these parameters. One study demonstrated that the
degree of DEX non-suppression following the DST was associated with IL-6 levels in
PBMCs in both depressed people and healthy controls (Maes et al., 1993b). Another
study showed that plasma TNF-α was correlated with peripheral GR resistance following
topically applied glucocorticoids in depressed people only (Fitzgerald et al., 2006).
Conversely, TNF-α has been negatively associated with HPA-axis function following the
DEX/CRH test in depressed people in two studies (Himmerich et al., 2006;Schuld et al.,
2003). Whilst the findings presented are conflicting, there is a robust literature

166
demonstrating that depression is accompanied by both increases in inflammatory
cytokines and decreases in GR sensitivity. It is therefore reasonable to suppose that
these factors may be associated. An association between inflammation and MR
sensitivity has yet to be explored.
Baseline serum/saliva cortisol has been positively associated with inflammatory
biomarkers in both depressed people and healthy controls (Y. Chen et al., 2017;Cubala
& Landowski, 2014). IL-1β mRNA has been negatively associated with the CAR (Doolin
et al., 2017) and IL-6 has been positively associated with the AUC in depressed people
but not controls (Maes et al., 1995). To date, the relationship between TNF-α and diurnal
cortisol rhythm in MDD patients have not been explored. In order to address these gaps
in the literature we investigated whether there was any association between
inflammatory biomarkers and HPA-axis parameters. Therefore, I hypothesise that
inflammatory biomarkers will be significantly, positively associated with
increased CAR, AUC and flatter slope and negatively associated with GR
sensitivity in people with MDD (hypothesis 5).
As well as being associated with depression, inflammation is also associated with
perceived stress (Johnson et al., 2013;G. E. Miller et al., 2008;G. E. Miller et al.,
2014;Walsh et al., 2018) and stressful life events (Kiecolt-Glaser et al., 2002;Maes et al.,
1998;Marshall et al., 1998) in healthy people. It has also been associated with childhood
maltreatment (Carpenter et al., 2010;Coelho et al., 2014;G. E. Miller & Chen, 2010) in
both healthy and people with MDD (Danese et al., 2008;Zeugmann et al., 2013). GR
resistance has also been associated with perceived stress in healthy people (Menke et
al., 2014;G. E. Miller et al., 2008;G. E. Miller et al., 2014;Walsh et al., 2018) and with
childhood maltreatment in both depressed and healthy people (Von Werne Baes et al.,
2012). Little is known about the relationship between psychosocial factors and MR
function. The findings for the effects of perceived stress on diurnal cortisol are conflicting.
Evidence exists for both positive associations (Allen et al., 2017;Boggero et al.,

167
2017;Chida & Steptoe, 2009) and negative associations (Boggero et al., 2017) between
stress and the CAR in healthy people. Similarly perceived stress has been positively
associated (Ockenfels et al., 1995;Steptoe et al., 2000) and negatively associated (Adam
et al., 2017) with the slope. Findings regarding diurnal cortisol and childhood
maltreatment are also mixed, with some studies suggesting that maltreatment leads to
an increased CAR (Quevedo et al., 2017;Wielaard et al., 2018) in both depressed and
non-depressed people and some suggesting a blunted CAR (van der Vegt et al., 2009).
Moderate maltreatment has been associated with a steeper diurnal slope and severe
maltreatment with a flatter slope (van der Vegt et al., 2009). However, a meta-analysis
reported no association between either the CAR or the slope and childhood adversity
(Bernard et al., 2017). In order to investigate any effects of these psychosocial factors,
exploratory analyses will be conducted including any of the variables which differ
between the groups.
3.3 Biological measures
3.3.1 Plasma IL-6 and TNF-α determination
Protocol
Sodium-heparinised blood was centrifuged (500g, room temp, 10mins). The plasma was
then removed, avoiding any red cells, transferred to 1.5ml polypropylene tubes, and
stored at -20° until analysis. Plasma IL-6 and TNF-α levels were determined using
commercially available, solid-phase enzyme-linked immunosorbent assays (ELISA) from
R&D Systems®, Inc. The inter- and intra-assay coefficient of variation (CV) for IL-6
analysis was 7.8% and 7.4% respectively, and the mean minimum detectable dose was
0.039pg/ml. The inter- and intra-assay coefficient of variation (CV) for TNF-α analysis
was 6.5% and 2% respectively, and the mean minimum detectable dose was 0.049pg/ml.
The assays were performed in duplicate.

168
3.3.2 Corticosteroid receptor sensitivity
Reagents
RPMI 1640 medium (Sigma, 500ml, sterile, R8758); foetal calf serum (FCS) (Gibco
10270); penicillin/streptomycin (Sigma, 500ml, sterile, P4458); HEPES buffer (Fisher
BioReagents, 1M solution, pH 7.3, BP299-100); penicillin/streptomycin (Sigma, sterile,
P4458-100ml); LPS (Sigma), 10mg, L2630; DEX (Sigma), D4902; prednisolone (Sigma),
P-6004.
Protocol
GR and MR sensitivity was measured by dexamethasone and prednisolone inhibition of
LPS-stimulated IL-6 levels using in vitro glucocorticoid and mineralocorticoid sensitivity
assays, retrospectively (See Figure 1). The protocol for both assays was identical apart
from the choice of corticosteroid. The protocol was based on a previously published
method with slight modifications (Carvalho et al., 2008). This method was chosen over
an in vivo Dex/CRH test as it is a more direct measure of corticosteroid receptor function.
Sodium-heparinised blood was diluted ten-fold using RPMI 1640 medium supplemented
with 10% foetal calf serum, 2.5% hepes buffer and 1% PEN-STREP (Penicillin-
Streptomycin). The following concentrations of dexamethasone and prednisolone were
used: 10-6, 10-7, 10-8, and 3 x 10⁻⁹. 540µl of diluted blood was then added to each well.
Samples were incubated for 24 hours in a humidified atmosphere containing 5% CO2.
After incubation, plates were centrifuged (1000 x g, 4°C, 10mins) and the cell culture
supernatant was carefully collected and stored at -20° until analysis. The assays were
performed in duplicate.
IL-6 level measurement was carried out using a commercially available Luminex
technology kit for IL-6 from Bio-RAD®. The inter- and intra-assay coefficient of variation

169
(CV) for IL-6 analysis was 6.8% and 4.5% respectively, and the mean minimum
detectable dose was 0.36 pg/ml.
Of the 67 participants who were included in the analysis, seven healthy control samples
were excluded due to researcher error, leaving a study sample of 60 (23 HC and 37
MDD).
Figure 3.1 The glucocorticoid sensitivity assay.
Glucocorticoid suppression was calculated by normalising all data to LPS-stimulated IL-
6 levels in the absence of either DEX or prednisolone expressed as 100%. Specifically,
the calculation of the percentage inhibition of IL-6 by the glucocorticoids was as follows:
Percentage inhibition for each concentration of DEX and prednisolone was then
calculated using GraphPad Prism version 5 (GraphPad Software Inc., San Diego, CA,
USA) in order to calculate the log inhibitory concentration 50% (IC50) values of the dose-

170
response curve of DEX and prednisolone suppression of IL-6 production. The IC50
represents the concentration of substance or drug required to bring about 50% functional
inhibition. Log IC50 values are inversely proportional to glucocorticoid sensitivity. Higher
log IC50 values indicate that more DEX or prednisolone was required to suppress IL-6
production by 50%, and thus decreased GR and/or MR sensitivity.
Due to difficulty in converging dose-response curves for IC50 values in Graphpad, we
were unable to compute DEX log IC50 values for 12 MDD participants and PRED log IC50
values for 21 MDD participants and 10 healthy controls. Therefore DEX log IC50 values
were successfully computed for 48 participants (25 MDD and 23 HC) and PRED log IC50
values were successfully computed for 29 participants (16 MDD and 13 HC).
3.3.3 Calculation of diurnal cortisol parameters
All saliva samples were collected using ‘salivettes’ (Sarstedt, Leicester, UK) and were
stored at -20°C for analysis at a later date. Cortisol levels were measured using a time-
resolved immunoassay with fluorescence detection at the University of Dresden. The
inter- and intra-assay coefficient of variation (CV) for cortisol analysis was <9% and <6%
respectively.
Four different indices of HPA axis function were computed: cortisol awakening response
(CAR), cortisol output during first hour of awakening (CAR AUC), total cortisol output
(AUC) and cortisol slope across the day. Of the 61 participants who provided saliva
samples, two had extreme values and were excluded from the analysis, leaving a sample
of 59 (28 HC and 31 MDD). Of the 59 participants included in the analysis, there were
some missing cortisol samples as follows: one at waking + 60 minutes, three at 4pm and
one at bedtime.

171
The CAR was calculated by subtracting the waking from the waking + 30 min values.
When calculating the CAR, five participants were excluded who declared a waking
sample collection time before the waking time, one participant who failed to post their
sampling diary and one participant who failed to note their waking time. 13 individuals
were also excluded who reported a delay of >15 min between waking and taking the
‘waking’ sample, leaving a sample of 39 (20 HC and 19 MDD). A long delay between
waking and providing the ‘waking’ sample can produce misleading CAR results, but a
delay of less than 15 minutes does not seem problematic (Dockray et al., 2008).
The slope of decline in cortisol across the day was calculated by computing the
difference between waking and bedtime values and dividing by the time elapsed between
the two samples, expressed in nmol/L/min. Higher values indicate a steeper decrease in
cortisol over the day. Cortisol slope was calculated if the participant had waking cortisol
and bedtime cortisol. 58 participants had sufficient data for the calculation of cortisol
slope (one participant did not provide a bedtime sample) (27 HC and 31 MDD).
The CAR AUC, or overall volume of cortisol released during the first hour, was calculated
using the cortisol AUC with respect to ground method, as described by Pruessner and
colleagues (J. C. Pruessner et al., 2003a). The CAR AUC calculation included waking,
waking + 30 minutes and waking + 60 minutes samples. Therefore, CAR AUC was
calculated for the 58 participants who provided these saliva samples successfully. Total
cortisol output over the day was assessed by calculating the cortisol AUC with respect
to ground (with 30+ excluded). Cortisol AUC was calculated only for those who provided
saliva samples for waking, waking + 60, 4pm and bedtime cortisol. Therefore, cortisol
AUC was calculated for the 55 participants who provided all these saliva samples
successfully (25 HC and 30 MDD). There was no significant difference mean waking
times between people with MDD and healthy controls (t(55) = -1.179, p = 0.243). The
mean waking time for people with MDD was 7.26am (SD = 1.39) and the mean waking
time for healthy controls was 6.57am (SD = 1.17).

172
3.4 Statistical analysis
Kolmogorov-Smirnov tests were used to test for the normality of the distribution and a
natural log transformation was conducted when the test revealed deviation from
normality. Log transformations did not normalise the distribution for age, BDI scores at
baseline, PSS scores at baseline and LTE scores, so non-parametric tests were
performed to compare the groups on these variables. Regarding the CECA.Q, a
composite variable was computed to summarise how many adversities had been
experienced by each participant, following the guidelines published by Bifulco et al.
(2005). This strategy was based on a previously published method with slight
modifications (Trotta et al., 2016). Non-parametric tests were also used for this variable.
LPS values, all percentage inhibition values and plasma IL-6 and TNF-α values were not
normally distributed in both groups. Log transformation normalised the distributions for
baseline LPS, all percentage inhibition values and plasma IL-6. Non-parametric tests
were applied for the analysis of TNF-α. In relation to salivary cortisol, normality tests
revealed that baseline cortisol levels at waking + 60 minutes, 4pm and bedtime were not
normally distributed. Log transformations normalised the distributions for these variables.
All other baseline cortisol variables were normally distributed. Levene’s test was used to
test for homogeneity of variance and corrected T-tests were used were appropriate.
Independent-Samples Mann-Whitney U tests and chi-square tests were used to
compare the MDD group with the control group on all socio-demographic and clinical
characteristics. Differences in biological parameters between the groups were conducted
using Independent Samples T-tests and Independent-Samples Mann-Whitney U tests.
For comparison of more than two groups, One-way ANOVA analysis or Kruskal–Wallis
test were performed, as appropriate. Where there were significant differences between
the groups on any of the sociodemographic variables, multivariable linear regression
analyses were conducted, where the variables of interest were included as predictor

173
variables. Pearson’s R correlations and Spearman’s correlations were used to ascertain
whether there was any association between inflammatory and HPA-axis pathways and
between these biological pathways and baseline mood. All statistical analyses were
performed using SPSS version 22.0 (SPSS Inc., Chicago, Illinois, USA).
3.5 Results
3.5.1 Participants
At baseline, blood was successfully drawn from 37 people with MDD and from 32 healthy
controls. Saliva samples for cortisol measurement were collected from 31 people with
MDD and 30 healthy controls. Participants with at least one of these biological measures
(cortisol, cytokine measurement or receptor sensitivity) were included in the main sample
of this study (n = 69). Two healthy controls had both cortisol and cytokine values outside
3 SD from the mean and were removed from the analysis, leaving an analytic sample of
37 people with MDD and 30 controls.
Table 3.1 summarises the sociodemographic characteristics of the participants. Of the
67 participants included in the analysis, 37 had MDD and 30 were healthy controls. The
overall sample had an age range of 21-61 years (M = 32.72, SD = 10.24) and were
almost two-thirds women (62.7%). Two-thirds were normal weight (67.2% BMI<25) and
white (67.2%). Most were unmarried (82.1%) and employed (74.6%). 16.4% of the
sample were smokers and two-thirds of people consumed an alcoholic drink more than
once a month (67.2%).
There was no significant difference in age (U = 666.5, p =0.159), gender (χ2 = 0.010, df
= 1, p = 0.921), BMI (χ2 = 2.224, df = 1, p = 0.136) marital status (χ2 = 0.57, df = 1, p =
0.811), ethnicity (χ2 = 0.937, df = 1, p = 0.333) or employment status (χ2 = 2.175, df = 1,
p = 0.140) between the MDD group and controls. There was a significant difference in

174
smoking (χ2 = 6.778, df = 1, p = 0.009) and alcohol consumption (χ2 = 4.058, df = 1, p =
0.044). People with MDD were more likely to smoke (MDD: n = 10, 27%; controls: n = 1,
4.9%) and less likely to drink alcohol (MDD: n = 21, 56.8%; controls: n = 24, 80%)
compared with controls.
Table 3.2 summarises the clinical characteristics of the participants. Two thirds of the
people in the depressed group had experienced depression previously (67.6%). One
third of the depressed group were taking antidepressants (30%) and one fifth were
receiving psychotherapy at baseline (22%). Regarding severity of depressive symptoms,
almost half of the depressed group were experiencing severe depression (43.2%), 5.4%
had moderate depression, 10.8% had mild depression and 8.1% had mixed anxiety and
depressive disorder (mild).
As expected, BDI scores were found to be very low among the controls (BDI<3) and
there was a significant difference between the groups (U = 1,109, p =<0.001). There was
also a significant difference in PSS scores between the two groups (U =1,064, p =
<0.001. People with MDD had significantly higher levels of perceived stress (Mdn =
23.00, IQR = 6) compared with controls (Mdn = 10.50, IQR = 7) There was no significant
difference in LTE scores (U = 611.5, p =0.460). In terms of childhood maltreatment, there
was a borderline significant difference between the groups in total adversity score (U =
552.5, p = 0.082). People with MDD were more likely to have experienced childhood
adversity (Mdn = 1.00, IQR = 2) compared with controls (Mdn = 0.00, IQR = 1). The
groups did not differ in their experience of physical abuse (χ2 = 0.472, df = 1, p = 0.492).
There was a significant difference in their experience of sexual abuse (χ2 = 4.433, df =
1, p = 0.035). People with MDD were more likely to have experienced childhood sexual
abuse (n = 13, 37.1%) compared with controls (n = 4, 13.8%).

175
Table 3.1. Sociodemographic characteristics of the study sample at baseline (n=67)
Abbreviations: MDD = major depressive disorder, SD = standard deviation; BMI = body mass index. *Median/interquartile range.
People with MDD
(n=37) Healthy controls
(n=30) Group difference
(p value)
Mean ± SD or Median
± IQR or N (%) Mean ± SD or Median
± IQR or N (%)
Age (years) *32 ± 23 *28 ± 7 0.159
Female 23 (62) 19 (63) 0.921
BMI 0.136
Normal 22 (60) 23 (77)
Overweight/obese 15 (41) 7 (23)
Marital status (Married) 7 (22) 5 (17) 0.811
Ethnicity (White) 24 (75) 22 (73) 0.333
Employed 25 (68) 25 (83) 0.140
Smoker 10 (27) 1 (3) 0.009
Alcohol (> 1 drink per month) 21 (57) 24 (80) 0.044

176
Table 3.2. Clinical characteristics of the study sample at baseline (n=67)
People with MDD
(n=37) Healthy controls
(n=30) Group difference
(p value)
Mean ± SD or Median
± IQR or N (%) Mean ± SD or Median
± IQR or N (%)
Previous depression 25 (68) - -
Antidepressant use at baseline 11 (30) - -
Psychotherapy at baseline 8 (22) - -
BDI II score *25 ± 13 *2 ± 3 <0.001
CISR score 22.51 ± 8.25 - -
CISR primary diagnosis
Mild depressive episode 19 (51) - -
Moderate depressive episode 2 (5) - -
Severe depressive episode 16 (43) - -
Abbreviations: MDD = major depressive disorder, SD = standard deviation; BDI – Beck Depression Inventory II, CISR = Clinical Interview Schedule-
Revised. *Median/interquartile range.

177
Table 3.2 continued. Clinical characteristics of the study sample at baseline (n = 67)
People with MDD
(n=37) Healthy controls
(n=30) Group difference
(p value)
Mean ± SD or Median
± IQR or N (%) Mean ± SD or Median
± IQR or N (%)
PSS score *23.00 ± 6 *10.50 ± 7 <0.001
LTE score *1 ± 3 *1 ± 2 0.460
Childhood maltreatment
Total adversity score *1.00 ± 2 *0.00 ± 1 0.082
Physical abuse 3 (9) 4 (14) 0.492
Sexual abuse 13 (37) 4 (14) 0.035
Abbreviations: MDD = major depressive disorder; SD = standard deviation; PSS = Perceived Stress Scale; LTE – List of Threatening Events.
*Median/interquartile range.

178
3.5.2 Inflammatory biomarkers
To analyse differences in inflammation, plasma IL-6 and TNF-α levels were compared
between the groups. There was no significant difference in IL-6 levels between people
with MDD and healthy controls (t(65) = -0.522, p = 0.604) (striped bar represents people
with MDD) (Table 3.3, Figure 3.2).
Data shown are raw values presented as mean ± SD in pg per ml. Healthy controls (n=30), people with MDD (n=37).
In contrast, there was a significant difference in TNF-α levels between the groups, (U =
843.50, p =<0.001). TNF-α levels were higher in people with MDD compared to in healthy
controls (Table 3.3, Figure 3.3.)
Figure 3.2. Plasma IL-6 levels in healthy controls and people with MDD at baseline.

179
Data shown are raw values presented as median ± interquartile range in pg per ml. * Statistically significant at P<0.05. Healthy controls (n=30), people with MDD (n=37).
Because the groups differed in terms of smoking and alcohol consumption, analyses
were carried out to ascertain whether these health behaviours impacted the findings.
Linear regression revealed that TNF-α levels were not attenuated by the inclusion of
these individual health factors as covariates. The results showed that the overall model
was statistically significant (F(3, 63) = 3.245, p = 0.028) and that the independent
variables explained 13.4% of the variance in TNF-α. Study group was significantly
associated with TNF-α levels (β = 0.388, t(66) = 3.063, p = 0.003. However smoking
status and alcohol consumption were not significantly associated with TNF-α (β = -0.094,
t(66) = -0.758, p = 0.451; and β = 0.151, t(66) = 1.248, p = 0.217, respectively).
Figure 3.3. Plasma TNF-α levels in healthy controls and people with MDD at baseline.

180
Table 3.3. Mean inflammatory and corticosteroid receptor sensitivity parameter values and p values from analyses comparing differences
between people with MDD at baseline and healthy controls
People with MDD
(n=37) Healthy controls
(n=30) Group difference
(p value)
Mean ± SD or median ±
interquartile range
Mean ± SD or median ±
interquartile range
Plasma IL-6 (pg/ml) (n=67) 0.83 ± 0.82 0.63 ± 0.40 0.604
Plasma TNF-α (pg/ml) (n=67) *0.96 ± 0.45 *0.72 ± 0.22 <0.001
IL-6 concentration with LPS only (pg/ml) (n=60) 151.15 ± 103.28 150.87 ± 80.54 0.527
% LPS induced IL-6 levels with DEX 10-6 (pg/ml) (n=55) 19.74 ± 26.73 6.02 ± 2.87 0.011
% LPS induced IL-6 levels with DEX 10-7 (pg/ml) (n=58) 27.61 ± 34.58 9.05 ± 6.43 0.004
% LPS induced IL-6 levels with DEX 10-8 (pg/ml) (n=60) 79.85 ± 80.28 47.15 ± 17.26 0.220
% LPS induced IL-6 levels with DEX 3 x 10⁻⁹ (pg/ml) (n=59) 123.56 ± 84.58 99.09 ± 36.12 0.776
% LPS induced IL-6 levels with PRED 10-6 (pg/ml) (n=57) 46.90 ± 68.22 12.43 ± 4.56 0.001
% LPS induced IL-6 levels with PRED 10-7 (pg/ml) (n=60) 83.30 ± 87.69 49.05 ± 16.15 0.634
Abbreviations: MDD = major depressive disorder; DS = standard deviation; IL = interleukin; pc = picogram; ml = millilitre; TNF = tumour necrosis factor;
LPS – lipopolysaccharide; DEX = dexamethasone; PRED = prednisolone. Mean and median scores represent raw values. *median/interquartile range.

181
Table 3.3. continued. Mean inflammatory and corticosteroid receptor sensitivity parameter values and p values from analyses comparing differences between people with MDD at baseline and healthy controls
People with MDD
(n=37) Healthy controls
(n=30) Group difference
p-value
Mean ± SD Mean ± SD
% LPS induced IL-6 levels with PRED 10-8 (pg/ml) (n=60) 148.70 ± 95.58 97.25 ± 28.12 0.494
% LPS induced IL-6 levels with PRED 3 x 10⁻⁹ (pg/ml) (n=53) 164.13 ± 118.01 109.61 ± 46.37 0.750
DEX IC50 (n=48) 9.50E-8 ± 1.67E-7 1.91E-8 ± 2.20E-8 0.034
PRED IC50 (n=29) 1.68E-7 ± 2.63E-7 1.29E-7 ± 1.06E-7 0.597
Abbreviations: MDD = major depressive disorder; SD = standard deviation; IL = interleukin; pc = picogram; ml = millilitre; DEX = dexamethasone; PRED
= prednisolone. Mean and median scores represent raw values.

182
3.5.3 Corticosteroid receptor sensitivity
Firstly, LPS induced IL-6 levels were measured and compared between the groups, in
the absence of corticosteroids. Stimulation with LPS increased IL-6 levels in MDD
patients and in healthy controls to similar levels, (t(58) = 0.637, p = 0.527) (Table 3.3,
Figure 3.4.).
Data shown are raw values presented as mean ± S.E.M. in pg per ml. in Healthy controls (n=23), people with MDD (n=37).
Next, corticosteroid sensitivity in people with MDD and healthy controls was investigated.
Data are presented as glucocorticoid inhibition of LPS-stimulated IL-6 levels as a
percentage. Both DEX and PRED induced a concentration-dependent inhibition of LPS-
stimulated IL-6 levels in both groups.
There was a difference in the effects of in vitro incubation with DEX between the groups.
In people with MDD, IL-6 levels were higher after incubation with DEX compared with
controls at the highest concentration, 10-6 ((F(1, 43) = 7.07, p =0.011) . Including smoking
status and alcohol consumption in the analysis showed that the overall model was not
statistically significant (F(3, 51) = 2.188, p = 0.101). Study group was significantly
Figure 3.4. LPS induced IL-6 in healthy controls and people with MDD at baseline.

183
associated with IL-6 levels (β = 0.362, t(54) = 2.486, p = 0.016). However smoking status
and alcohol consumption were not significantly associated with IL-6 levels (β = -0.063,
t(54) = -0.443, p = 0.659; and β = 0.151, t(54) = 1.971, p = 0.276, respectively).
LPS-stimulated IL-6 levels were also higher in people with MDD after incubation with
DEX at the second highest concentration, 10-7 (F(1, 54.52) = 8.82, p =0.004). Including
smoking status and alcohol consumption in the analysis showed that the overall model
was statistically significant (F(3, 54) = 3.598, p = 0.019). Study group was significantly
associated with IL-6 levels (β = 0.410, t(57) = 2.986, p = 0.004). However smoking status
and alcohol consumption were not significantly associated with IL-6 levels (β = -0.033,
t(57) = -0.249, p = 0.805; and β = 0.239, t(57) = 1.850, p = 0.070, respectively). However
this difference was not present at the two lowest concentrations 10-8, and 3 x 10⁻⁹
(p>0.05). (Table 3.3, Figure 3.5). The dose-response curve is shown in Figure 3.6.
Data shown are raw values presented as mean ± SD in pg per ml. * Statistically significant at P<0.05. Healthy controls (n=23), people with MDD (n=37).
Figure 3.5. Dexamethasone suppression of LPS induced IL-6 in healthy controls and
people with MDD at baseline.

184
Data are shown as mean ± S.E.M of the % DEX inhibition. Healthy controls (n = 23), people with MDD (n = 37).
There was also a significant difference in DEX IC50 values between the groups (t(24.9)
= -2.248, p = 0.034). Compared to healthy controls, people with MDD required a
significantly larger concentration of DEX to inhibit LPS-induced IL-6 by 50% (Table 3.3).
These findings suggests that GR sensitivity was reduced in people with MDD compared
to controls.
There was a difference in the effects of in vitro incubation with PRED between the groups
(Figure 3.7). In people with MDD, LPS-stimulated IL-6 levels were higher after incubation
compared with controls at the highest concentration of PRED,10-6 (F(1, 51.68) = 12.94,
p =0.001). However this difference was not present at the lower concentrations (p>0.05).
A slope for baseline PRED IC50 values was unable to converge, therefore a dose
response curve for PRED has not been presented here.
Figure 3.6. Dexamethasone inhibition of LPS stimulated IL-6 levels in healthy controls
and people with MDD at baseline.

185
Data shown are mean ± SD in pg per ml. * Statistically significant at P<0.05. Healthy controls (n=23), people with MDD (n=37).
Including smoking status and alcohol consumption in the analysis showed that the overall
model was statistically significant (F(3, 44) = 4.171, p = 0.011) and that the independent
variables explained 22.1% of the variance in DEX IC50 values. Study group was
significantly associated with DEX IC50 values (β = 0.458, t(47) = 3.115, p = 0.003),
however smoking status and alcohol consumption were not significantly associated with
DEX IC50 (β = -0.218, t(47) = -1.480, p = 0.146; and β = 0.275, t(47) = 1.971, p = 0.055,
respectively). In contrast, there was no significant difference in prednisolone IC50 values
between the groups (t(20.6) = -0.537, p = 0.597) (Table 3.3). Overall these findings
suggest that there was less functional ability of the MR to respond to corticosteroids in
depressed people.
Figure 3.7. Prednisolone suppression of LPS induced IL-6 in healthy controls and
people with MDD at baseline.

186
3.5.4 Diurnal cortisol
The analyses of diurnal cortisol in relation to study groups are summarised in Table 3.4.
A graphical representation of mean cortisol values across the day in both the MDD and
controls groups is provided in Figure 3.8. There was a significant difference in waking
cortisol + 30 minutes between people with MDD and healthy controls (t(57) = 2.419, p =
0.019). Waking cortisol + 30 minutes was lower (M = 6.84, SD = 4.19) compared to
controls (M = 9.88, SD = 5.43). After adjustment for smoking and alcohol the overall
model was not statistically significant (F(3, 55) = 2.323, p = 0.085). Study group was no
longer significantly associated with waking cortisol + 30 (β = -0.259, t(58) = -1.873, p =
0.066). Smoking status and alcohol consumption were also not significantly associated
waking cortisol + 30 (β = -0.090, t(58) = -0.146, p = 0.279; and β = 0.002, t(58) = 0.015,
p = 0.988, respectively).
There was also a significant difference between the groups regarding the CAR AUC
(t(56) = 2.670, p = 0.010). The CAR AUC was smaller in the MDD groups (M = 6.57, SD
= 3.36) compared to controls (M = 9.15, SD = 4.00). After adjustment for smoking and
alcohol the overall model was not statistically significant (F(3, 54) = 2.473, p = 0.071).
Study group was significantly associated with CAR AUC (β = -0.301, t(57) = -2.174, p =
0.034), with smaller values in the participants with MDD. However smoking status and
alcohol consumption were not significantly associated with CAR AUC (β = -0.090, t(57)
= -0.672, p = 0.504; and β = 0.028, t(57) = 0.214, p = 0.832, respectively).
There were no significant differences between the groups in terms of waking cortisol
(t(57) = 1.200, p = 0.235), waking + 60 minutes (t(56) = 1.658, p = 0.103), cortisol at 4pm
(t(54) = -1.439, p = 0.156), bedtime cortisol (t(56) = 0.895, p = 0.375), CAR (t(37) = 1.628,
p = 0.112), AUC (t(53) = 0.953, p = 0.345) or cortisol slope (t(56) = 1.152, p = 0.254).

187
Saliva samples were taken on waking (n=59), waking+30mins (n=59), waking+60mins (n=58), 4pm (n=56) and at bedtime (n=58) in people with MDD (red line) and healthy controls (black line). Error bars represent SEM. Data shown are raw values.* Statistically significant at P<0.05.
0
2
4
6
8
10
12
Waking Waking + 30minutes
Waking + 60minutes
4pm Bedtime
Co
rtis
ol m
mo
l/l
Sampling times
Healthy controls
MDD
*
Figure 3.8. MDD versus healthy controls: Mean salivary cortisol values across the day
averaged across all participants.

188
Table 3.4. Mean cortisol parameter values and p values from analyses comparing differences between people with MDD at baseline and
healthy controls.
People with MDD
(n=37)
Healthy controls
(n=30)
Group difference
(p value)
Diurnal cortisol parameters Mean ± SD
Mean ± SD
Waking cortisol (nmol/L) (n=59) 5.82 ± 3.24 6.95 ± 4.01 0.235
Waking cortisol +30 minutes (nmol/L) (n=59) 6.84 ± 4.19 9.88 ± 5.43 0.019
Waking cortisol +60 minutes (nmol/L) (n=58) 5.52 ± 3.79 7.17 ± 3.93 0.103
4pm cortisol (nmol/L) (n=56) 2.10 ± 1.52 1.80 ± 1.88 0.156
Bedtime cortisol (nmol/L) (n=58) 0.82 ± 1.61 0.98 ± 1.42 0.375
CAR (nmol/L) (n=39) 0.98 ± 4.53 3.28 ± 4.31 0.112
CAR AUC (nmol/L) (n=58) 6.57 ± 3.37 9.15 ± 4.00 0.010
AUC (nmol/L) (n=55) 45.71 ± 23.50 51.80 ± 23.69 0.345
Cortisol slope (nmol/L) (n=58) 0.01 ± 0.00 0.01 ± 0.00 0.254
Abbreviations: MDD = major depressive disorder; SSD = standard deviation; nmol = nanomoles; L = litre; CAR = cortisol awakening response; AUC =
area under the curve. Mean and median scores represent raw values.

189
3.5.5 Inter-correlations between the systems
To explore the relationship between HPA-axis function and inflammatory activation,
differences in correlations between variables were examined. All biological correlations
are presented in Table 3.5. There was a significant negative correlation between IL-6
and the CAR AUC in healthy controls (r = -0.532, p = 0.004). A similar pattern of
association was observed in the MDD group, however this failed to reach Bonferroni
significance (r = -0.423, p = 0.018). There were negative patterns of association between
IL-6 and the AUC in both groups (HC: (r = -0.474, p = 0.017), MDD: (r = -0.451, p =
0.012)), which again failed to reach adjusted significance. There also appeared to be a
negative pattern of association between TNF-α and the CAR AUC and the AUC in the
MDD group, but not in the control group (MDD: CAR AUC (r = -0.357, p = 0.049), AUC
(r = -0.378, p = 0.039), HC: CAR AUC (r = -0.097, p = 0.63), AUC (r = -0.165, p = 0.43)).
However this was not significant following Bonferroni correction.
To explore the relationships between biological factors and perceived stress, differences
in correlations between the groups were examined. Correlations were only conducted on
biological variables which were shown to be significantly different between groups. The
results are presented in Table 3.6. No significant correlations were observed.

190
Table 3.5. Correlations between inflammatory biomarkers and HPA-axis parameters in
people with MDD and healthy controls
IL-6 TNF-α
MDD
DEX IC50 -0.088 0.313
PRED IC50 0.092 0.156
CAR -0.066 -0.018
CAR AUC -0.423* -0.357*
AUC -0.451* -0.378*
Cortisol slope -0.348 -0.190
Healthy Controls
DEX IC50 -0.154 0.039
PRED IC50 0.120 0.231
CAR -0.202 0.011
CAR AUC -0.532≠ -0.097
AUC -0.474* -0.165
Cortisol slope -0.314 -0.016
Abbreviations: MDD = major depressive disorder; DEX = dexamethasone; PRED = prednisolone; IL = interleukin, TNF-α = tumour necrosis factor alpha, CAR = cortisol awakening response; AUC = area under the curve. Note: * p<0.05;** p<0.01; ≠ p<0.008 (critical p-value after Bonferroni correction.

191
Table 3.6. Correlations between biological and perceived stress in people with MDD and healthy controls
Perceived stress score
Correlation coefficient p-value
MDD
TNF-α -0.261 0.119
% LPS induced IL-6 levels with DEX 10-6 0.244 0.171
% LPS induced IL-6 levels with DEX 10-7 0.186 0.284
DEX IC50 -0.051 0.810
% LPS induced IL-6 levels with PRED 10-6 0.209 0.236
Waking cortisol +30 minutes (nmol/L) 0.030 0.871
CAR AUC 0.019 0.921
Healthy Controls
TNF-α 0.217 0.249
% LPS induced IL-6 levels with DEX 10-6 0.001 0.996
% LPS induced IL-6 levels with DEX 10-7 -0.067 0.761
DEX IC50 -0.017 0.939
% LPS induced IL-6 levels with PRED 10-6 -0.204 0.352
Waking cortisol +30 minutes (nmol/L) -0.308 0.110
CAR AUC -0.342 0.081
Abbreviations: MDD = major depressive disorder; DEX = dexamethasone; PRED = prednisolone; IL = interleukin, TNF-α = tumour necrosis factor alpha, CAR = cortisol awakening response; AUC = area under the curve; BDI = Beck Depression Inventory; PSS = Perceived Stress Scale; LTE = List of Threatening Experiences. Note: p<0.007 = critical p-value after Bonferroni correction.

192
3.5.6 Sensitivity analyses
Depressive symptom severity
Given that depressive symptom severity has been associated with increased
inflammation and HPA-axis dysfunction, I ran exploratory analyses in order to identify
whether any differences in the findings emerged when the analysis was restricted to
people with moderate/severe depressive symptoms at baseline. The main analyses were
repeated following the removal of those participants who scored <20 on the BDI,
indicating a score of mild depression. This decision was based on the guidelines from
Beck et al. which suggest that a score of 20 denotes the cut-off for moderate depression
(1996a). The BDI was chosen instead of the CISR as it is a more conservative and more
widely used scale, and has been endorsed by NICE for use in measuring baseline
depression severity (Smarr & Keefer, 2011). According to the BDI, 11 people had mild
baseline depressive symptoms (score <20) and were removed from the analysis,
resulting in a reduced MDD sample of 26.
The results confirmed the findings from the main analysis for both inflammatory
biomarkers. There was no significant difference between the groups for IL-6 (p = >0.05)
and TNF-α was significantly higher in the MDD group compared with controls (p = 0.002).
Regarding corticosteroid receptor function, the results for the effects of in vitro incubation
with both DEX and PRED remained unchanged. In the MDD group, LPS-stimulated IL-6
levels were significantly higher after incubation with DEX at 10-6 (p = 0.019) and 10-7 (p
= 0.014) and with PRED at 10-6 (p = 0.011), compared with controls. However the
difference in DEX IC50 values between the groups lost significance (p = 0.151), likely
reflecting a loss of power.
The result for waking cortisol +30 minutes became borderline significant, with lower
levels in the MDD group (p = 0.058). However a significant difference emerged for waking

193
cortisol +60 minutes (t(46) = 2.183, p = 0.034), with cortisol levels being lower in the
MDD group (M = 4.66, SD = 3.04) compared with controls (M = 7.17, SD = 3.93). The
difference in the CAR AUC remained significant, with lower levels in the MDD group (p
= 0.021). In addition, the difference in the AUC became borderline significant (t(44) =
1.982, p = 0.054). The AUC was lower in the MDD group (M = 39.17, SD = 18.58)
compared with controls (M = 51.80, SD = 23.69). There were no significant differences
in the CAR or cortisol slope using the restricted analysis (p = >0.05).
Childhood sexual abuse
As previously shown, the MDD and control group differed significantly in terms of
experiencing childhood sexual abuse, with the MDD group experiencing significantly
higher levels than controls. Therefore, I also ran an exploratory analysis to determine
whether there were any biological differences between depressed people with and
without a history of abuse. The main analyses were repeated including two groups;
depressed individuals with a history of childhood sexual abuse and depressed individuals
without a history of childhood sexual abuse. Due to the fact that there was a borderline
significant difference in terms of total adversity score, I also conducted a sensitivity
analysis for this composite variable. I observed a similar pattern of results for both
analyses, therefore only the sexual abuse findings are presented.
The results showed that there was no significant difference in inflammatory activation or
in corticosteroid sensitivity parameters between the groups (all p = >0.05). Regarding
diurnal cortisol, there was a difference between the groups regarding the CAR (t(17) = -
2.354, p = 0.031). Depressed individuals with no history of childhood sexual abuse had
a significantly flatter CAR than those with a history of abuse (MDD with no history of
abuse: M = -1.33, SD = 4.6; MDD with a history of abuse: M = 3.05, SD = 3.48), (see
Figure 3.9). There were no other significant differences in diurnal cortisol parameters (all
p = >0.05).

194
Blue line = depressed with history of abuse; red line = depressed with no history of abuse. Error bars represent SEM.
3.6 Discussion
3.6.1 Aims and hypotheses
The aim of this study was to compare differences in inflammatory cytokines,
corticosteroid receptor sensitivity and diurnal cortisol rhythm in depressed people
compared with healthy controls. I also sought to explore whether there are any
associations between a) any of these biological parameters and b) between biological
and psychological parameters. I hypothesised that people with MDD would have
significantly increased levels of inflammation compared to controls, specifically increase
in plasma IL-6 and TNF-α (hypothesis 1). I hypothesised that people with MDD would
exhibit significantly decreased GR sensitivity compared with controls (hypothesis 2) and
significantly different MR sensitivity (hypothesis 3). I hypothesised that people with MDD
will exhibit significantly altered diurnal cortisol secretion compared to controls,
Figure 3.9. Depressed individuals with and without a history of childhood sexual
abuse: difference in the CAR between groups.
0
1
2
3
4
5
6
7
8
9
10
Waking Waking + 30 minutes
Co
rtis
ol
mm
ol/l
Sampling times

195
specifically increased CAR, increased AUC and flatter cortisol slopes (hypothesis 4). We
hypothesised that in people with MDD, inflammation will be significantly correlated with
HPA-axis function, specifically a negative correlation between inflammation and GR
sensitivity and a positive correlation between IL-6 and the AUC (hypothesis 5). I also
conducted an exploratory analysis to investigate possible associations between any
altered biological pathways and psychosocial stress.
3.6.2 Summary of results
The results showed that hypothesis 1 was partially confirmed: Inflammatory activation
was increased in depressed people compared to controls, as indicated by significantly
higher TNF-α levels in the MDD group than in the control group. In contrast, there were
no significant differences in IL-6. Hypothesis 2 was confirmed: I observed decreased GR
sensitivity in the MDD group compared with healthy controls. This was indicated by the
fact that depressed people required a significantly larger concentration of DEX to inhibit
LPS-induced IL-6 at the two highest concentrations. Furthermore DEX IC50 values were
higher in the MDD group. Hypothesis 3 was confirmed: I observed decreased MR
sensitivity in the MDD group, indicated by the fact that depressed people required a
significantly larger concentration of PRED to inhibit LPS-induced IL-6 at the highest
concentration. Hypothesis 4 was not confirmed: contrary to my prediction, the MDD
group exhibited a smaller CAR AUC compared with controls. There was no significant
difference in the AUC or slope between the groups. Hypothesis 5 was not confirmed: a
significant relationship between IL-6/TNF-α and the CAR AUC/AUC was observed in the
MDD group, however counter to expectations, these associations were negative. Neither
inflammatory biomarker was associated with GR sensitivity. No associations between
biological variables and perceived stress were observed. I will discuss possible
explanations for these findings later in the Discussion section.

196
Exploratory analyses revealed that restricting the depressed sample to only those with
moderate/severe symptoms had no effect on the findings regarding inflammation. Whilst
LPS-induced IL-6 levels were higher than controls after incubation with DEX at the two
highest concentrations in the restricted sample, the IC50 findings lost significance. MR
sensitivity results remained unchanged. There was no effect on the findings for CAR
AUC. Additional exploratory analyses to examine the influence of childhood sexual
abuse, showed that depressed individuals with no history of childhood sexual abuse had
a significantly flatter CAR than those with a history of abuse sexual abuse. There was no
significant differences in inflammatory activation or in corticosteroid sensitivity
parameters between depressed people with or without a history of abuse. I will discuss
possible explanations for this pattern of results later in the Discussion section.
3.6.3 Hypothesis 1: Differences in inflammatory biomarkers
In the current study TNF-α levels were significantly higher in people with depression but
there was no difference in levels of IL-6. These findings are in contrast to the literature
which robustly demonstrates increases in both TNF-α and IL-6 in depressed people
(Dowlati et al., 2010;Goldsmith et al., 2016b;Kohler et al., 2017;Y. Liu et al., 2012). In
fact increased IL-6 levels is considered among the most reliable of findings in this field,
and is supported by data from cross-sectional meta-analyses (Haapakoski et al.,
2015;Hiles et al., 2012b;Howren et al., 2009), predictive associations of IL-6 with the
future development of depression (Chu et al., 2018;Gimeno et al., 2009;Glaus et al.,
2014;Khandaker et al., 2014;Kivimaki et al., 2014;Valkanova et al., 2013;Virtanen et al.,
2015), evidence of a dose–response relationship (Kivimaki et al., 2014) and associations
with therapeutic response to antidepressants (Hiles et al., 2012a;Kohler et al.,
2018;Wiedlocha et al., 2018). To my knowledge only one other study has reported similar
findings. Zou (2018) compared 117 MDD patients with 102 healthy controls and reported
that compared to healthy controls, the patients with MDD had significantly higher levels
TNF-α, however there was no significant differences in the levels of IL-6.

197
There are number of possible explanations for why we observed different results. Firstly,
several of the studies mentioned above did not restrict their sample to individuals who
met criteria for MDD as defined by the DSM-V or ICD-10, but relied on the presence of
depressive symptoms using brief questionnaires (e.g., General Health Questionnaire
(GHQ); Hamilton Rating Scale for Depression (HAM-D); Beck Depression Inventory
(BDI)) (Gimeno et al., 2009;Goldsmith et al., 2016b;Hiles et al., 2012a, 2012b;Howren et
al., 2009;Kivimaki et al., 2014;Valkanova et al., 2013;Virtanen et al., 2015). As discussed
in Chapter 1, Section 1.2, these instruments do not include any essential core symptoms
or require symptoms to disrupt normal daily functioning, and do not provide a diagnosis
of a clinical disorder (Fried & Nesse, 2015b). In addition, questionnaires such as the
GHQ focus on cognitive symptoms, ignoring the somatic aspects of depression. This is
of particular relevance as somatic symptoms such as insomnia, increased appetite, and
weight gain appear to be differentially related to inflammation, suggesting that depressive
symptoms have different biological correlates (Duivis et al., 2013;F. Lamers et al., 2013).
It is therefore possible that the findings from these studies reflect a broader sample than
in this study which only included people who met ICD-10 criteria for MDD and therefore
reflected a more homogenous phenotype. Whilst meta-analyses indicate an overall
increase in inflammation in MDD, they also demonstrate a considerable amount of
heterogeneity. Methodological and sampling differences further exacerbate this
variability.
In addition, many of the studies above did not exclude or account for physical (Chu et
al., 2018;Glaus et al., 2014;Goldsmith et al., 2016a;Hiles et al., 2012b;Khandaker et al.,
2014) or psychiatric co-morbidities (Chu et al., 2018;Dowlati et al., 2010;Goldsmith et al.,
2016a;Haapakoski et al., 2015;Hiles et al., 2012a, 2012b;Howren et al., 2009;Kivimaki
et al., 2014;Valkanova et al., 2013;Virtanen et al., 2015). The results from these studies
may well be confounded by inflammation which has an alternative aetiology.
Interestingly, the only study which reported similar findings to the present study, used
both a clinical diagnosis of MDD based on DSM-V criteria and a depressive symptom

198
questionnaire (Zou et al., 2018). This was also the only study to incorporate
comprehensive exclusions similar to the current study, including people with other
psychiatric comorbidities, physical health conditions such as autoimmune diseases,
cancer, systemic diseases, chronic infection and those taking immunomodulatory
treatment or antibiotic therapy. In light of these observations, it may be that our findings
reflect a more pure MDD sample than is often included in depression research. It is
crucial that samples constituting more homogeneous phenotypes are taken into account
in future studies.
Another possible explanation may be related to depressive subtypes. Whilst the
association between depression and inflammation may seem conclusive, it may not
apply to all cases. MDD is a psychiatrically heterogeneous disorder and it is reasonable
to assume that this heterogeneity may also be reflected in levels of inflammation. In
recent years, evidence has emerged for differential associations between depression
subtypes and inflammation (B. W. J. H. Penninx et al., 2013). Melancholic and non-
melancholic patients have been shown to exhibit differential inflammatory profiles and
there is some evidence that cytokine levels normalize with clinical improvement only in
melancholic depression (Rothermundt et al., 2001). Data from 776 people from the
Netherlands Study of Depression and Anxiety demonstrated that people with atypical
depression had significantly higher levels of inflammatory markers compared with people
with melancholic depression (F. Lamers et al., 2013). Another study also reported that
IL-6 levels were higher in atypical cases versus melancholic cases of depression (Rudolf
et al., 2014). However it should be noted that some studies have reported no difference
(Dunjic-Kostic et al., 2013;Karlović et al., 2012). A more recent systematic review
reported that IL-6 is increased in melancholic vs. non-melancholic MDD but that there
are no differences in TNF-α between subgroups, suggesting that only IL-6 has the
potential to discriminate between the MDD subtypes (C. Yang et al., 2018). It therefore
remains to be shown whether inflammation is of pathogenic significance for all types of
depression. In the present study, subtypes such as melancholic and atypical depression

199
were not identifiable using our chosen measures, therefore it is unclear which subgroups
our sample captured. This may explain why this study was unable to provide support for
the hypothesis that MDD is associated with comprehensive inflammatory activation.
Another possible explanation may be related to the effect of antidepressants in our study.
There is some evidence that cytokine plasma concentrations change during treatment
with antidepressants, although the results are conflicting. The most consistent finding is
a reduction in IL-6 levels following treatment with several different antidepressants (Hiles
et al., 2012a;Kohler et al., 2018;Wiedlocha et al., 2018). Furthermore, a meta-analysis
investigating inflammation in MDD and clinical response showed that IL-6 levels
decreased with antidepressant treatment, regardless of symptom remission
(Strawbridge et al., 2015). Due to the fact that one third of our depressed participants
were taking various antidepressants, analysis comparing differences in IL-6 between
depressed people taking antidepressants, depressed people not taking antidepressants
and healthy controls were conducted. There were no significant differences between the
groups (p = >0.05), suggesting that there was no effect of antidepressant use.
It is possible that the elevated TNF-α observed in the present study could be explained
by TRD. Persistently elevated TNF-α has been associated with treatment resistance, as
shown in a study by Strawbridge et al. (2015) where significant decreases in TNF-α were
observed only in treatment responders. Further support for the role of TNF-α in TRD
comes from studies investigating the TNFα antagonist, Infliximab, which has been shown
to reduce depressive symptoms in patients with TRD, particularly in those people with
high inflammatory profiles (Raison et al., 2013a). This may explain why another meta-
analysis, which did not include treatment response in their analysis, reported that
antidepressant treatment did not reduce TNF-α levels (Hannestad et al., 2011). Given
that in our sample two thirds of the people in the depressed group had experienced
depression previously, analyses comparing differences in TNF-α between those who had
experienced previous depression and those who had not, were conducted. The results

200
of this analysis showed that depressed individuals with a history of depression had
significantly higher levels of TNF-α compared with controls (p = 0.002), however whist
depressed individuals without a history of depression also had higher levels of TNF-α,
this did not reach significance (p = 0.060). This should be interpreted with caution as the
depressed group with no history was very small (n=12) and the result was borderline
significant, suggesting a similar trend.
3.6.4 Hypothesis 2: Differences in glucocorticoid sensitivity
In line with my hypothesis, GR sensitivity was reduced in depressed people compared
with healthy controls. To reiterate, in the present study, I used an in vitro glucocorticoid
sensitivity assay which measured glucocorticoid inhibition of LPS-stimulated IL-6 levels
in peripheral, whole blood. This technique has not been used previously to compare
basal GR sensitivity in MDD patients and healthy controls. Reduced sensitivity was
demonstrated by increased LPS-stimulated IL-6 levels in the presence of the two highest
concentrations of DEX and by increased IC50 values. The finding reported here supports
the literature which has consistently reported significant decreased sensitivity in
depressed patients. In vitro studies on immune cells from peripheral blood have shown
that the ability of glucocorticoids to inhibit mitogen-induced lymphocyte proliferation is
impaired in depressed patients (Lowy et al., 1984;Lowy et al., 1988;Rupprecht et al.,
1991c;Wodarz et al., 1991;Wodarz et al., 1992). In vivo studies using the DST have
produced similar results. People with depression consistently demonstrate increased
cortisol following oral DEX administration (Holsboer, 2000;Leistner & Menke,
2018;Pariante & Miller, 2001). DEX administration also significantly decreases mitogen-
induced lymphocyte proliferation in DST suppressors, compared to non-suppressors
(Gormley et al., 1985;Lowy et al., 1988;A. Wassef et al., 1990).

201
3.6.5 Hypothesis 3: Differences in mineralocorticoid sensitivity
In line with my prediction, depressed people demonstrated impaired MR function
compared with controls, demonstrated by decreased inhibition of LPS-stimulated IL-6 in
the presence of the highest concentration of PRED. This is also in line with a study by
Juruena et al. (2013) who also reported that MR blockade increased cortisol and
decreased the suppressive effect of prednisolone in controls but not TRD patients.
Findings from a study by Hinkelmann et al. (2016) reported that depressed patients
exhibited higher baseline cortisol values compared to healthy individuals, however they
observed no difference in cortisol between groups following MR antagonism. The authors
suggest that these results indicate impaired MR function base on the following reasoning:
if the GR was impaired in MDD, MR blockade would result in significantly increased
cortisol as the HPA-axis would be entirely disinhibited. If however, the MR was impaired,
the GR would be able to inhibit the HPA-axis once cortisol levels had risen. Therefore
the lack of cortisol increase following MR blockade suggests intact GR function, which
means that the difference in basal cortisol must be a reflection of impaired MR function.
In the present study we also observed impaired DEX suppression, therefore we can only
conclude that both the GR and MR are dysregulated in people with MDD.
MR dysfunction has also been observed in people with psychotic MDD (Lembke et al.,
2013). Cortisol levels were significantly increased in people with psychotic MDD
compared to controls following treatment with MR agonist. Psychosis was an exclusion
criteria in the present study, so we can only infer that MR dysfunction was observed in
non-psychotic depression. These findings are in contrast with the findings of Young et
al. (2003) and Juruena et al. (2006) who both reported that the MR is functional in
depressed patients. Two subsequent studies by Juruena et al. (2010;2009) also reported
that MR function was similar in TRD patients and controls, however they did observe
impaired MR sensitivity in those patients who failed to respond to intensive in-patient
therapy compared with those who did. Furthermore, this response did not change

202
between admission and follow-up, suggesting that the MR may not be functional in
severely treatment-resistant patients. In the current study we did not recruit any severely
TRD in-patients and so it is unlikely that our lack of findings reflect severe TRD. However
to explore this further secondary analysis was conducted with a subset of depressed
individuals who had mild baseline depressive symptoms in order to explore whether the
effect remained (score >20) (n=11). Results showed that there was no change in the
findings, with decreased MR sensitivity still present at the highest concentration of PRED
(p = 0.014). Therefore this study does not support the hypothesis that depression severity
is the only factor for MR deficiency.
The null finding in relation to the PRED IC50 value may be a reflection of the fact that
prednisolone is less sensitive at lower concentrations compared with dexamethasone,
therefore higher concentrations may be required to reach the IC50. Furthermore, due to
financial constraints we were only able to use four concentrations of each corticosteroid,
making it more difficult to create the dose-response curve necessary to compute the
IC50values.
3.6.6 Hypothesis 4: Differences in diurnal cortisol rhythm
In contrast to my hypothesis this study found that waking cortisol + 30 minutes and the
CAR AUC was reduced in depressed people, compared with controls. The findings in
the current study are in line with a study by Dedovic et al. (2010) who observed a blunted
CAR in people with sub-clinical depression. The findings also support previous studies
which found a blunted CAR in patients with MDD (Doolin et al., 2017;Huber et al.,
2006;Stetler & Miller, 2005) as well as those which have reported an association between
psychological traits known to increase vulnerability to depression and attenuation of the
CAR, such as neuroticism, loneliness and worry (Cropley et al., 2015;Leah D Doane &
Adam, 2010;Kuehner et al., 2007;Mangold et al., 2012). Furthermore, increases in CAR
have been associated with clinical remission following SSRI therapy (Ruhe et al., 2015)

203
However there is a great deal of heterogeneity in the literature and our findings are also
at odds with other studies. A large cohort study showed that both currently depressed
and remitted MDD patients had an increased CAR compared with controls (Vreeburg et
al., 2009a). Increased CAR has also been associated with clinical depression in women
(Dienes et al., 2013) adolescent females (Ulrike et al., 2013) and older people
(Rhebergen et al., 2015). Increased CAR has been reported in remitted MDD patients
compared with controls (Aubry et al., 2010;Bhagwagar et al., 2003) and decreases in
CAR have been shown to be predictive of antidepressant response (J. Beck et al., 2015).
Longitudinal studies have also shown that increases in CAR AUC are associated with
time to recurrence in remitted patients (Hardeveld et al., 2014). In healthy populations
increased CAR has been associated with depressive symptoms (M. Pruessner et al.,
2003b), neuroticism (Madsen et al., 2012) and high-trait negative affect (Polk et al.,
2005). Furthermore longitudinal studies have shown that higher CAR in adolescence
predicts future diagnosis of MDD (Adam et al., 2010;Vrshek-Schallhorn et al., 2013). The
largest meta-analysis to date reported that the AUC during the waking period was
positively associated with depression (Boggero et al., 2017).
The heterogeneity in the findings may reflect methodological inconsistencies. The
majority of the studies mentioned above, including the present study, only collected
saliva samples on a single day. It has been suggested that samples collected on a single
day are more susceptible to state factors and that CAR determination over two to six
days is required for reliable trait measures (J. Hellhammer et al., 2007). The conflicting
findings in the literature may therefore be a reflection of situational factors, rather than a
reliable measure of HPA-axis activity.
Possible mechanisms underlying the attenuated CAR AUC observed in the present study
can only be speculated on. One potential explanation is that in people with chronic or
recurrent depression, the regulatory mechanisms underlying the CAR become
exhausted, as is seen in patients who exhibit hypocortisolaemia (Chida & Steptoe,

204
2009). Hypocortisolism has been reported in PTSD patients, in healthy people
experiencing chronic stress and in patients with stress-related somatic disorders (Heim
et al., 2000a;Wirtz et al., 2007). Hypocortisolism may be a consequence of hippocampal
atrophy. Increased cortisol secretion creates a cascade of hippocampal damage
(Sapolsky et al., 1986). The hippocampus is part of a mood regulatory network (Anacker
et al., 2011), involved in HPA-axis negative feedback inhibition (S. M. Smith & Vale,
2006) and is involved in memory formation and emotional appraisal (Nemeroff & Vale,
2005). It is possible that in the early stages of depression, HPA-axis hyperactivity and
subsequent hypercortisolaemia damages the hippocampus, resulting in decreased
ability to meet these regulatory demands, resulting in HPA-axis exhaustion and
hypocortisolism. This hypothesis is supported by studies showing that hippocampal
volume is associated with a reduced CAR in depressed people (Dedovic et al., 2010)
and healthy people (J. C. Pruessner et al., 2005;M. Pruessner et al., 2007). In the present
study only 25% of the depressed group had been experiencing the current depressive
episode for more than 2 years, however given that 68% of depressed people had a
history of previous depressive episodes, the potential explanation of an exhausted HPA-
axis is plausible.
Another possibility is that increases in the CAR may be affected by the disrupted sleep
often observed in people with depression. Depression is associated with sleep
disturbances such as altered sleep continuity, sleep depth and REM sleep (Baglioni et
al., 2016;M. J. Murphy & Peterson, 2015). In the majority of people, cortisol is secreted
in two-four distinct bursts over the waking period (Chida & Steptoe, 2009). If depressed
people experience disrupted sleep or wake up during an earlier phase of the pre‐
awakening cortisol rise, these bursts may be secreted over a longer period of time,
reducing the intensity of the CAR. It is also possible that the CAR was affected by
antidepressant use. Animal studies have shown that antidepressant medication may
alter HPA-axis activity (N Barden et al., 1995;Peeters et al., 1994) and cortisol is reduced
in depressed people following treatment with SSRIs (Dziurkowska et al.,

205
2013;Hernandez et al., 2013). In order to explore whether sleep influenced the results
for the CAR AUC in the present study, analyses were conducted to investigate whether
sleep problems predicted CAR AUC values. Comparisons with healthy controls could not
be conducted as CIS-R data was only collected for depressed patients. Results showed
that sleep did not predict CAR AUC in people with depression (p = 0.05).
Childhood abuse and the CAR
There was also an effect of childhood sexual abuse on the CAR in depressed people.
Depressed people who had not experienced sexual abuse had a significantly flatter CAR
compared with those who had. Our findings are in line with studies which have shown
that childhood trauma leads to increased HPA-axis activity (Heim et al., 2008b;Heim et
al., 2000b;Kumari et al., 2013). Heim et al. (2000b) found that women with current
depressive symptoms and a history of childhood abuse exhibited increased cortisol
stress responses compared with non-abused depressed women. In a similar study with
men, Heim et al. (2008b) showed that men with current MDD and history of childhood
trauma exhibited increases in cortisol responses to Dex/CRH test compared with
depressed men without a history of childhood abuse. Increased neuroendocrine function
has also been observed in depressed abused children compared with depressed non-
abused (Kaufman et al., 1997). Our findings also support studies examining the CAR
specifically. A study by Quevedo et al. (2017) reported higher CAR in maltreated
depressed adolescents compared to non-maltreated depressed adolescents. Another
study by Lu et al. (2016) reported that people with a history of childhood trauma exhibited
an enhanced CAR and CAR AUC, regardless of depression score. Most notably, there
was no association between MDD in participants with no trauma history and with
elevated cortisol levels. Childhood abuse has also been significantly correlated with
increased CAR AUC, in a study of older adults, although this was only observed in non-
depressed participants (Wielaard et al., 2018).

206
However the literature regarding relations between HPA-axis markers and history of
childhood maltreatment are conflicting and findings from the current study are at odds
with other studies which indicate that hypo-activity of the HPA axis in adults is associated
with a history of childhood abuse in healthy people (D. Bremner et al., 2007;J. D.
Bremner et al., 2003;Carpenter et al., 2011;Carpenter et al., 2009b;Hinkelmann et al.,
2013;Power et al., 2012;Voellmin et al., 2015) and people with depression (Hinkelmann
et al., 2013). Morning cortisol levels have explicitly been shown to be lower in people
who report severe neglect or abuse compared with non-abused participants (van der
Vegt et al., 2009). Regarding the CAR specifically, a meta-analysis examining childhood
maltreatment and diurnal cortisol regulation reported blunted waking cortisol levels but
no association between childhood maltreatment and the CAR (Bernard et al., 2017).
Our findings are in accordance with the hypothesis of a long-lasting impact of stressful
experiences during childhood on HPA-axis activity. The ‘Risky Families Model’ (Repetti
et al., 2002) posits that childhood adversity creates a cascade of risk, beginning early in
life. This includes psychological vulnerabilities, such as deficits in social competence and
emotion regulation, and an inclination to compensate for them with poor health
behaviours. Constant or recurrent exposure to stress, alongside deficits in emotion
processing, social competence, and behavioural self-regulation may lead to alterations
in HPA axis function. The effects of a biologically dysregulated response to stress may
be particularly harmful during early childhood when the normal development of biological
regulatory systems occurs. Furthermore they may be cumulative over the lifespan, result
in chronically increased cortisol, which in time leads to wear and tear known as allostatic
load (McEwen, 1998). This can be interpreted as an inability to adapt to stress and
effectively ‘turn off’ the biological stress response when appropriate (McEwen, 2007). As
previously described chronic activation of the HPA-axis may result in the mechanisms
underlying the CAR becoming exhausted. This notion is supported by evidence that
stress response dysregulation associated with childhood maltreatment may be mediated
by epigenetic modifications such as increased methylation of the GR (McGowan et al.,

207
2009;Perroud et al., 2011;Tyrka et al., 2012) and demethylation of FKBP5 (Klengel et
al., 2013).
Childhood maltreatment may therefore result in a distinct form of depression with
different neuroendocrine function compared with depression without maltreatment.
Maltreated depressed patients exhibit unique clinical features, such as prolonged and
more severe depression and a lower responsiveness to treatment compared with non-
maltreated depressed patients (Quevedo et al., 2017). This hypothesis is supported by
evidence that depressed patients with history of abuse have a lower responsiveness to
treatment compared to those with no history (Harkness et al., 2012;Nanni et al.,
2012;Shamseddeen et al., 2011) and an increased risk of developing recurrent and
persistent depressive episodes (Nanni et al., 2012). This had led clinicians to suggest
that depressed patients with history of childhood maltreatment, may require specialized
clinical approaches (Shamseddeen et al., 2011). This thesis has already called into
question the assumption that depression is a homogeneous disorder. Given that the
clinical and biological variations in MDD are extensive, with different subtypes reflecting
different pathophysiologies, it is not unreasonable to suggest that the additional
experience of childhood maltreatment may result in a unique phenotype. In the present
study, a history of childhood adversity may have increased the CAR in depressed people
to a level above that of those with no history, but not to the level of healthy controls.
Another influencing factor may be the effect of disrupted sleep. This section has already
discussed how sleep disturbances may interact with diurnal cortisol rhythm, resulting in
a blunting of the CAR. It is also possible that the hyper-vigilance and arousal which
accompanies irregular sleep patterns may result in the increased CAR observed in our
depressed sample. Support for this hypothesis comes from findings which show that
childhood maltreatment is associated with sleep disorders in adulthood (Anda et al.,
2006;Bader et al., 2007a;Bader et al., 2007b;Daniel P Chapman et al., 2013;D. P.
Chapman et al., 2011;Schafer & Bader, 2013). Findings using data from the World

208
Mental Health Survey has shown that childhood sexual abuse in particular is associated
with both sleep disturbances and mood disorders in adulthood (Gal et al., 2011). In a
study of women participants with a history of childhood sexual abuse reported
significantly greater rates of sleep disturbances than controls above and beyond
depression (Noll et al., 2006). Sleep disturbances were also associated with depression.
Childhood sexual abuse is also associated with more awakenings and arousal (Bader et
al., 2007a;Bader et al., 2007b), more nightmares (Agargun et al., 2003) and insufficient
sleep in adulthood (Daniel P Chapman et al., 2013). In the study by Quevedo et al. (2017)
where higher CAR was reported in maltreated depressed adolescents compared to non-
maltreated depressed, a trend was also observed for higher insomnia in depressed
participants who has experienced maltreatment. However this interpretation ought to be
taken with caution and further research is necessary to provide more robust support for
this explanation.
3.6.7 Hypothesis 5: Immuno-neuroendocrine relationships
The results provided evidence of a relationship between inflammatory activation and
diurnal cortisol rhythm. IL-6 was negatively associated with the CAR and CAR AUC in
both groups. TNF-α was associated with reduced CAR AUC and AUC in the depressed
group only, suggesting a link between dysregulation of the HPA axis and immune
system. (Huber et al., 2006;Stetler & Miller, 2005). To date there is only one study to
assess diurnal cortisol rhythm and plasma TNF-α in people with MDD. Lamers et al.
(2013) used data from 776 people from the Netherlands Study of Depression and Anxiety
to compare inflammatory markers, including TNF-α, and saliva cortisol awakening curves
in people with melancholic depression, atypical depression and healthy controls. The
observed that people with melancholic depression had significantly higher CAR AUC
compare with controls, however there was no significant difference in TNF-α.
Conversely, people with atypical depression had significantly higher levels of TNF-α
compared with controls but no significant difference in CAR AUC. This finding suggests

209
that HPA-axis hyperactivity is a distinct feature of melancholic depression, whereas
increased inflammation is a feature of atypical depression.
Studies reporting both TNF-α and cortisol levels have reported conflicting results. Higher
plasma cortisol has been reported along with both increased (Y. Chen et al., 2017;Kahl
et al., 2017;Kahl et al., 2015) and decreased TNF-α (Rudzki et al., 2017) in depressed
patients compared with controls. Lower plasma cortisol and lower TNF-α levels have
also been reported in MDD patients (Lopes et al., 2012). This is the first study to assess
diurnal cortisol rhythm and TNF-α in people with MDD, regardless of subtypes. A
negative association between the CAR and TNF-α was reported in patients with ADHD
(Corominas-Roso et al., 2017) and similarly, an inverse association between waking
cortisol and TNF-α was observed in a population-based sample (DeSantis et al., 2012).
This result supports the notion that dysregulation of the HPA-axis, as seen in depression,
may be associated with higher levels of inflammation, however the direction of the
association remains unclear
Together, these results suggest possible underlying neurobiological differences between
depressed people and controls and that impaired HPA-axis activity could be less capable
of inhibiting a pro-inflammatory response. Examining the directionality of the causal
relationships is beyond the scope of this thesis, however the reasons for these
associations may be speculated on. In the initial stages of stress, activation of the HPA-
axis occurs, resulting in secretion of cortisol and subsequent down-regulation of pro-
inflammatory cytokines. However, a prolonged stress response and chronic stimulation
of the HPA-axis may lead to HPA-axis fatigue, resulting in hypocortisolism. This is
accompanied by shift in the cytokine milieu with increased production of pro-
inflammatory cytokines and decreased production of anti-inflammatory cytokines
(Varghese et al., 2016). Persistent HPA-axis hyperactivity may also result in GR
downregulation. Hypercortisolism could theoretically exhaust the capacity of the GR to
recycle, resulting in a reduced ability to provide negative feedback.

210
Animal models of stress provide some evidence for a shift from glucocorticoid signalling
to inflammatory signalling (Quan et al., 2003;D. Wang et al., 2011), although this finding
has not always been replicated (B. Yang et al., 2008). A study exploring the effects of
chronic stress in caregivers also showed that the gene expression profiles shifted from
glucocorticoid signalling to inflammatory signalling (G. E. Miller et al., 2008). There is
therefore some evidence to support the hypothesis that impaired GR function leads to
both inflammatory activation and depressive symptoms but this is by no means
conclusive.
3.6.8 Perceived stress
The results provided no evidence of a correlation between biological dysregulation in
depressed people and perceived stress. This is surprising given that psychosocial stress
has been associated with increased inflammatory cytokines in many studies (Hansel et
al., 2010;Rohleder, 2014). TNF-α specifically has previously been associated with work
stress in non-depressed people (Grossi et al., 2003;von Känel et al., 2008) and people
who report high stress perception have a significantly higher production of TNF-alpha
(Maes et al., 1998). There is also evidence that life stress is associated with dysregulated
CAR and CAR AUC (Boggero et al., 2017;Chida & Steptoe, 2009) and with GR
resistance (Menke et al., 2014;G. E. Miller et al., 2008;G. E. Miller et al., 2014;Walsh et
al., 2018). Furthermore, a robust and causal association exists between stress and MDD
(Hammen, 2005). Given that in the present study depressed people reported increased
levels of stress and demonstrated increased TNF-α levels and a dysregulation of the
HPA-axis compared with controls we would expect to see some associations.
There is evidence to suggest that the type and timing of stress may exert differential
effects on inflammation and depression. A longitudinal study with cancer patients
showed that whilst childhood trauma and recent life events were risk factors for higher
depressive symptoms, only childhood trauma and not recent events explained the

211
association between TNF-α and depressive symptoms (Archer et al., 2012). A cross-
sectional study including 214 MDD patients 180 healthy controls reported that whilst
there was a relationship between childhood sexual abuse and both TNF-α and IL-6 in
MDD patients, levels of TNF-α and IL-6 were not associated with recent stressful
experiences (Grosse et al., 2016a). In this study we did not observe any association
between childhood adversity and inflammation, however the lack of association of more
recent stressors with biological dysregulation may be due to their timing. Recent life
stress may occur in a less vulnerable stage compared to early life, when the immune
function is more plastic. Following stress exposure, an immature immune system can
develop a hyper-sensitive response pattern, leading to chronic inflammation (G. E. Miller
et al., 2011). By adulthood people may have developed better resilience to stress and
adopted psychosocial resources which moderate its effects. Indeed this speculative
explanation is supported by the sociodemographic nature of this sample, which
contained a high proportion of university staff/students from high socioeconomic
backgrounds. It is therefore possible that the current sample may be biased towards
individuals who are possess more protective factors (social support and coping skills)
than would be observed in the larger population. This may have acted as a confounding
variable, buffering the effects of stress and mitigating any biological sequelae (Potier et
al., 2018). Thus, the present study could be under-estimating the true magnitude of
associations between biological disparities and psychosocial stress.
Another possible explanation for this could be that psychosocial factors are differentially
associated with HPA-axis function. A systematic review and meta-analysis by Chida and
Steptoe (2009) reported that work stress and general life stress were associated with an
increased CAR, whereas fatigue, burnout, or exhaustion were associated with a reduced
CAR. It is therefore possible the lack of association reported here is a reflection of
heterogeneity in psychosocial factors. In the present study the measures used did not
enable the discrimination of ‘stress types’ therefore it is not possible to test this
hypothesis.

212
3.6.9 Strengths and limitations
This study has both strengths and weaknesses. The diagnoses of depression was
always carried out using the CIS-R, which is a fully structured assessment and
considered to be one of the most reliable and valid measures of minor psychiatric
disorders in the community (Head et al., 2013;Lewis et al., 1992). Furthermore
depression status was confirmed by a specific scale, BDI-II, a widely used outcome
measure in studies of depression in both clinical and non-clinical populations (A. T. Beck
et al., 1996a). The groups did not differ significantly on socio-demographic factors, with
the exception of smoking and alcohol consumption and these were controlled for in
sensitivity analyses. The study only included participants without other comorbid
psychiatric or medical disorders. The prevalence of depression is higher in patients than
in the general public. Wang et al. (2017) estimated that the prevalence of depression in
different specialties varied from 17.0% to 53.0%. Depression is particularly prevalent in
patients with chronic inflammatory and autoimmune diseases (Pryce & Fontana,
2016;Steptoe, 2007). Furthermore, medications used to treat medical disorders can also
affect the biological pathways investigated. Therefore, in order to determine that any
differences observed could reasonably be attributed to organic depression, a highly
selected sample was included. Consequently, the inclusion criteria used in this study
increases the internal validity but decreases the external validity and the generalisability
of the results.
However, our sample size was small and we did not reach our recruitment target, which
limited statistical power. It is therefore possible that this study was underpowered to
detect certain effects. This factor also reduced the number of subgroup analyses that
could be included, such as comparisons between treatment groups. As has already been
discussed in this section, it is possible that there were different
inflammatory/neuroendocrine profiles between depressed participants undergoing

213
specific therapies or between participants with different subtypes of depression. Larger
studies of people with MDD are needed to establish the robustness of the findings.
We also included individuals who had mixed depression and anxiety. The CISR has a
hierarchy so that if someone meets criteria for both depression and anxiety then the
primary diagnosis is depression and the secondary diagnosis is anxiety. The high
comorbidity rate of depression with anxiety disorders meant that excluding these
participants would have devastated our recruitment. Regarding secondary diagnoses,
we recruited 13 people with GAD, nine with mixed depression and anxiety disorder
(mild), three with panic disorder, three with mixed depression and anxiety, one with GAD
(mild), one with agoraphobia and one with specific (isolated) phobia. In total we also
recruited three individuals with a primary diagnosis of ‘mixed depression and anxiety
disorder (mild)’ and these participants were coded as ‘mild depression’. We recruited six
participants with no secondary diagnoses, all of whom had a primary diagnosis of mild
depression. Anxiety is highly prevalent in MDD populations and is associated with worse
outcomes. Due to our small sample size we did not have enough power to stratify our
results according to secondary diagnoses. However it should be borne in mind that our
sample was psychiatrically heterogeneous.
The study was cross-sectional, so no causal conclusions can be drawn. It is possible
that depressive symptoms activate the immune system, resulting in neuroendocrine
changes. As discussed in Chapter 1, stressful life events (Kiecolt-Glaser et al., 2002)
and chronic stress (Walsh et al., 2018) are associated with increased inflammatory
biomarkers. However, it is also possible that heightened inflammation precedes the
development of depression as demonstrated by those patients receiving inflammation-
based pharmacotherapy (Capuron et al., 2009). Furthermore, we observed a relationship
between HPA-axis dysregulation and cytokine production, however it is not possible to
determine the direction of this relationship.

214
Regarding childhood maltreatment, our use of retrospective measures may have
influenced our findings. A systematic review and meta-analysis by Baldwin et al. (2019)
including 16 studies and 25,471 individuals, found that prospective and retrospective
measures of childhood maltreatment showed poor agreement. Moreover, more than half
of individuals with prospective observations of childhood maltreatment did not report it
retrospectively. It is therefore possible that in this study participants may have under
reported experiences of childhood adversity.
It is unknown how closely the participants adhered to the cortisol saliva sampling protocol
in this study. When measuring hormones known to have a profound circadian rhythm,
the exact timing of sample collection is of paramount importance (Kudielka et al., 2003).
Furthermore, cortisol levels are influenced by several other factors, such as caffeine,
food intake and nicotine consumption, affecting what would otherwise be a typical cortisol
profile. Indeed research has shown that a significant number of individuals do not comply
with saliva sampling regimen unless they are aware of being monitored (Kudielka et al.,
2003). Lack of fidelity may have therefore reduced the reliability of our cortisol data.
Cortisol samples were also collected on a single day and as already discussed, this
makes them more susceptible to situational factors, possible further reducing reliability.
Additionally, night-time cortisol was not measured so it was not possible to assess total
24 hour cortisol output. Cortisol levels reach its lowest level at about midnight and then
rise throughout the early hours, increasing sharply around 30 minutes after waking (Fries
et al., 2009). In order to explore whether sleep disruption played a role in the reduced
CAR observed in the MDD group, examining the gradual night-time increase in these
participants would have been of interest.
Regarding corticosteroid receptor sensitivity, performing assays in whole blood rather
than in isolated PBMCs may have influenced our findings. This analysis does not account
for differences in immune cell populations, which could vary between participants
(Burnsides et al., 2012). However this technique is fast and given the time limitations of

215
this study, it was considered the most appropriate. Future studies could carry out these
tests in isolated PBMCs to validate these findings. Moreover, these assays only provide
a proxy measure of GR and MR sensitivity via corticosteroid suppression of LPS-induced
IL-6 release. The addition of assays measuring gene expression of GR up and
downregulated genes would help to establish GR responsiveness. Measurement of
receptor levels may also add value to these findings, by determining receptor mRNA
levels, measuring the rate of translocation of the receptors into the cell nuclei or DNA
binding. Future studies could include measures of receptor levels and sensitivity to
provide a more comprehensive investigation of the mechanisms involved.
3.7 Conclusion
In conclusion, these results indicate that inflammatory activation is increased, whilst GR
and MR function is reduced in people with depression. We also observed a flattening of
the CAR in depressed people. Furthermore, there appears to be a relationship between
inflammatory cytokines and diurnal cortisol rhythm. However it is not clear from these
findings whether these factors change with improvements in depressive symptoms. In
the following chapter I will present the findings from the follow-up analysis, which will
explore whether any observed psychological changes are accompanied by biological
changes. The results of this may tell us more about how these systems interact.

216
4. Study 1b - The Resist Study follow-up results:
Changes in depression and associations with inflammatory biomarkers and
HPA-axis function at 6 week follow-up
4.1 Introduction
As outlined in Chapter 3, findings from the Resist Study demonstrated inflammatory
activation and neuroendocrine dysfunction in depressed people compared with controls.
Recent evidence suggests that the dysfunction observed in biological pathways in people
with depression may normalise following symptom resolution and that persistently high
levels of inflammation may contribute to treatment resistance. It is therefore of interest
to explore whether any changes in physiological parameters in depressed people during
the six week follow-up period are associated with any changes in depressive symptoms.
If the inflammatory and neuroendocrine disturbances previously observed are indeed a
physical manifestation of MDD, we would expect that any degree of normalisation would
be, at least in part, associated with symptom remission. To date no study has
investigated changes in circulating inflammatory cytokines, GR and MR function and
diurnal cortisol rhythm simultaneously in MDD patients, over time. In this section I will
present results from the follow-up part of the Resist Study. Baseline measurements of
depressive symptoms, inflammatory cytokines, diurnal cortisol parameters and
corticosteroid receptor function in depressed people at baseline were compared with
measurements at six weeks. These results may tell us more about the underlying
pathways involved in clinical recovery and help identify those who may be less likely to
respond to conventional treatment.
4.2 Hypotheses
Meta-analyses have consistently demonstrated that IL-6 levels are reduced following
antidepressant treatment, although the effect may be small (Hannestad et al., 2011;Hiles

217
et al., 2012a;Kohler et al., 2018;Wiedlocha et al., 2018). However findings regarding
TNF-α are inconclusive. IL-6 levels have been shown to decrease following
antidepressant treatment, regardless of outcome (Strawbridge et al., 2015). However
TNF-α levels appear to decrease only in those who respond. Furthermore treatment
resistance has been associated with persistently elevated TNF-α. Other findings suggest
that reductions in both IL-6 and TNF-α are not associated with treatment response
(Kohler et al., 2018). Psychological therapy has also been shown to reduce inflammatory
biomarkers, including IL-6 and TNF-α (Lopresti, 2017). In general, there appears to be
some degree of normalisation of cytokine levels following antidepressant treatment.
Furthermore, persistently high levels of inflammation may contribute to treatment
resistance. Therefore I hypothesise that any change in depressive symptoms will
be influenced by baseline levels of inflammation and predicted by change in
inflammation over time (hypothesis 1).
Regarding corticosteroid receptor function, there is some evidence that increased GR
number in depressed people is associated with antidepressant treatment and that
antidepressants upregulate GR binding (Calfa et al., 2003;Sallee et al., 1995). Cortisol
inhibition of mitogen-induced lymphocyte proliferation improves in MDD patients
following antidepressant therapy (Calfa et al., 2003), whilst pharmacologically treated
TRD in-patients show reduced inhibition of T-cell proliferation and cytokine production
following in vitro administration of DEX (Bauer et al., 2003;Carvalho et al., 2008). These
findings suggest that restoration of GR function is dependent on clinical remission. In
vivo studies have also shown that increased GR sensitivity is associated with symptom
improvement (S. Fischer et al., 2017a;Greden et al., 1983;Holsboer et al., 1982),
however this has not always been reported (Ribeiro et al., 1993;Ventura-Junca et al.,
2014). Overall the findings suggest normalisation of the HPA-axis following treatment,
although differential effects of various antidepressants have also been observed.
Regarding MR function, there is evidence to suggest that MR sensitivity does not change
before and after antidepressant treatment, even in those who respond clinically (Juruena

218
et al., 2010). However individuals who do not respond to antidepressant treatment
demonstrate impaired MR sensitivity compared to those who do respond (Juruena et al.,
2010;Juruena et al., 2009). MR function may therefore be a predictor of treatment
response. Therefore I hypothesise that any change in depressive symptoms will be
influenced by corticosteroid sensitivity at baseline and predicted by change in
corticosteroid sensitivity over time (hypothesis 2).
In terms of diurnal cortisol rhythm, symptom remission has been robustly associated with
increased CAR following SSRI treatment in depressed people who had previously
exhibited a blunted CAR compared with controls (Harmer et al., 2003;Ruhe et al., 2015).
This is supported by findings from a large cohort study which showed that significantly
higher CARs were found in remitted patients compared to controls (Vreeburg et al.,
2009a). Higher AUC has also been observed in remitted patients compared with controls
(Aubry et al., 2010). Therefore I hypothesise that any change in depressive
symptoms will be influenced by diurnal cortisol rhythm at baseline and predicted
by change in cortisol rhythm over time (hypothesis 3).
In terms of the relationship between these pathways, only two MDD studies have
explored associations between changes in these parameters over time. Himmerich et al.
(2006) examined alterations in TNF-α and response to the DEX/CRH test on admission
and at discharge in MDD inpatients and reported a positive correlation between TNF-α
and CRH/DEX test outcome in remitted patients. In contrast, Lisi et al. (2013) assessed
cortisol circadian rhythm after low dose DST and gene expression of IL-6 in MDD
patients before and after 8 months of antidepressant drug treatment. IL-6 was reduced
at follow-up although was not significance. DST results showed normal suppression in
healthy controls, whereas 30% of the depressed group demonstrated non-suppression
and remained non-suppressors at follow-up. However, they found no differences among
the profiles of daily cortisol secretions between the groups at either time point and
inflammatory changes were not associated with levels of circulating glucocorticoids. In

219
light of the fact that we observed a negative association between IL-6/TNF-α and the
CAR AUC/AUC in depressed people in Study 1a, we would expect to see a relationship
between any changes in these pathways at follow-up. Therefore I hypothesise that any
change in inflammatory cytokines will be associated with change in CAR
AUC/AUC (hypothesis 4).
4.3 Biological measures
All assays were repeated as per the protocols in Chapter 3, Section 3.3.
4.3.1 Plasma IL-6 and TNF-α determination
35 participants with MDD attended follow-up assessments and 34 participants provided
blood samples. Plasma IL-6 and TNF-α data was available for all 34 participants at
follow-up.
4.3.2 Corticosteroid receptor sensitivity
Two participants were excluded from the corticosteroid receptor sensitivity analysis at
follow-up due to difficulties accessing the samples following incubation, resulting in a
sample of 32. DEX log IC50 values were successfully computed for 29 participants, 20 of
which also had DEX log IC50 values a baseline. PRED log IC50 values were successfully
computed for 20 participants, 12 of which also had PRED log IC50 values at baseline.
Therefore comparisons between log IC50 values at baseline and follow-up were
conducted in 20 people for DEX and 12 for PRED.

220
4.3.3 Calculation of diurnal cortisol parameters
Of the 35 depressed participants assessed at follow-up, 22 provided saliva samples. As
with the previous analysis, the cortisol data were cleaned and the same indices of HPA
axis function were computed. Of the 22 participants included in the follow-up analysis,
there were some missing cortisol samples: one at waking + 30 minutes and two at 4pm.
When calculating the CAR, we omitted 6 individuals who reported a delay of >15 min
between waking and taking the ‘waking’ sample and one individual who failed to provide
a sample at waking + 30 minutes, leaving a sample of 15. 11 participants had CAR data
at both time points and were included in the analytic sample. CAR AUC was calculated
for 21 participants and 20 had data at both time points and AUC was calculated for 20
participants, 18 of whom had data at both time points. All 22 participants had sufficient
data for the calculation of cortisol slope and 21 participants had data at both time points.
4.4 Statistical analysis
Kolmogorov-Smirnov tests were used to test for the normality of the distribution for all
variables at follow-up and a natural log transformation was conducted when the test
revealed deviation from normality. BDI and PSS scores at both time points were normally
distributed. LPS, percentage inhibition values, plasma IL-6 and plasma TNF-α values
were not normally distributed. Log transformation normalised the distributions for
baseline LPS, all percentage inhibition values and plasma IL-6. Non-parametric tests
were applied for the analysis of TNF-α. In relation to salivary cortisol, normality tests
revealed that follow-up cortisol levels at waking, waking + 30 minutes and bedtime were
not normally distributed. Log transformations normalised the distributions for these
variables.
Repeated Measures T-Tests were used to compare all parametric variables between
baseline and follow-up. Related-Samples Wilcoxon Signed Rank tests were used to

221
compare non-parametric variables. Where there were significant differences between
the time points on any of the biological variables, secondary analyses were conducted.
To determine whether severity of baseline depression affected the change in IL-6
repeated measures ANCOVAs were conducted, including baseline depression score as
a covariate. Separate analysis were conducted using CISR score and baseline BDI.
There was no difference between the results and so the BDI analyses have been
reported. In addition, to explore whether change in BDI score was a predictor of change
in IL-6, linear regression analyses were also conducted, with baseline BDI included as a
covariate. In order to determine whether any biological changes were influenced by age,
sex, smoking or alcohol consumption, repeated measures ANCOVAs were conducted
including these variables. Pearson’s R correlations and Spearman’s correlations were
used to ascertain whether there was any association between change in inflammatory
and HPA-axis pathways and between changes in these biological pathways and changes
in mood. Change scores were calculated as value at follow-up – value at baseline.
All statistical analyses were performed using SPSS version 22.0 (SPSS Inc., Chicago,
Illinois, USA).
4.5 Results: People with MDD at baseline and six week follow-up
4.5.1 Participants
Data is presented for participants who provided at least one biological sample at follow
up (n = 34). Table 4.1 summarises the clinical characteristics of the participants at
baseline and follow-up. One third of the depressed group were taking antidepressants
(32%) and one fifth were receiving psychotherapy (21%) at baseline. There were no
differences in either of these measures at follow-up. There was a significant difference
in BDI scores between baseline and follow-up t(33) = 3.952, p =<0.001). Participants had
significantly lower depressive symptoms at follow-up (M = 19.03, SD = 8.77) compared
with baseline (M = 24.59, SD = 7.74). However, the change in BDI score varied from -27

222
to 12 suggesting that some participants exhibited a decrease in depressive symptoms,
whilst others exhibited an increase. There was also a trend towards significance for PSS
score t(33) = 1.859, p = 0.072). Participants reported lower levels of perceived stress at
follow-up (M = 22.09, SD = 5.88) compared with baseline (M = 24.12, SD = 5.48).
Table 4.1. Clinical characteristics of people with MDD at baseline and follow-up (n=34)
Baseline
Follow-up
Group
difference (p value)
Mean ± SD or N (%) Mean ± SD or N (%)
Antidepressant use 11 (32) 11 (32) -
Psychotherapy 7 (21) 7 (21) -
BDI II score 24.59 ± 7.17 19.03 ± 8.77 <0.001
PSS score 24.12 ± 5.48 22.09 ± 5.88 0.072
Abbreviations: SD = standard deviation; BDI – Beck Depression Inventory; PSS = Perceived
Stress Scale.
4.5.2 Inflammatory biomarkers
To explore differences in inflammatory activation, plasma IL-6 and TNF-α levels were
compared between the time points. There was a trend towards significance for IL-6 (t(34)
= -1.785, p = 0.084). IL-6 levels were higher on average at follow-up compared to
baseline (Table 4.2, Figure 4.1, hashed bars represent baseline, checked bars represent
follow-up). This is in contrast to our expectations, as we would anticipate IL-6 to be
reduced in conjunction with decreased depressive symptoms.
We then explored whether the observed reduction in depressive symptoms remained
significant after controlling for baseline IL-6. Results from ANCOVA showed that there
was still a significant reduction in BDI score over time, independently of IL-6 (F(1,32) =

223
5.964, p = 0.020) and there was no significant interaction effect between the variables
(F(1,32) = 1.492, p = 0.231). Linear regression was also conducted to ascertain whether
change in IL-6 was associated with change in depression score over time, adjusted for
age, sex, smoking or alcohol consumption. Results showed that change in IL-6 was not
a significant predictor of change in BDI score (β = 0.422, p = 0.075). Reversed analyses
showed no significant difference in IL-6 over time after adjustment for baseline BDI score
and showed that change in BDI was not a significant predictor of change in IL-6 (both p
= >0.05).
Figure 4.1. Plasma IL-6 levels in people with MDD at baseline and follow-up (n=34).
Data shown are mean ± SD in pg per ml. * statistically significant at P<0.05

224
TNF-α levels were reduced in depressed people at follow-up, although this did not reach
significance (Z = -0.542, p = 0.588) (Table 4.2, Figure 4.2).
Figure 4.2. Plasma TNF-α levels in people with MDD at baseline and follow-up (n=34).
Data shown are median ± interquartile range in pg per ml.

225
Table 4.2. Mean inflammatory and corticosteroid receptor sensitivity parameter values and p values from analyses comparing differences
in people with MDD at baseline and follow-up (n=34).
Baseline
Follow-up Group
difference (p value)
Mean ± SD or
median ± interquartile range
Mean ± SD or median ±
interquartile range
Plasma IL-6 (pg/ml) (n=34) 0.77 ± 0.80 1.07 ± 0.89 0.084
Plasma TNF-α (pg/ml) (n=34) *0.94 ± 0.37 *0.84 ± 0.53 0.588
IL-6 concentration with LPS only (pg/ml) (n=32) 154.87 ± 107.98 148.57 ± 85.71 0.500
% LPS induced IL-6 levels with DEX 10-6 (pg/ml) (n=29) 20.99 ± 28.33 9.43 ± 7.88 0.061
% LPS induced IL-6 levels with DEX 10-7 (pg/ml) (n=31) 29.18 ± 36.42 13.07 ± 9.20 0.074
% LPS induced IL-6 levels with DEX 10-8 (pg/ml) (n=32) 82.94 ± 85.50 48.61 ± 21.78 0.185
% LPS induced IL-6 levels with DEX 3 x 10⁻⁹ (pg/ml) (n=32) 121.41 ± 84.68 93.96 ± 37.58 0.567
% LPS induced IL-6 levels with PRED 10-6 (pg/ml) (n=30) 49.95 ± 72.08 17.78 ± 11.43 0.012
% LPS induced IL-6 levels with PRED 10-7 (pg/ml) (n=32) 85.76 ± 93.69 46.33 ± 20.05 0.301
Abbreviations: MDD = major depressive disorder; DS = standard deviation; IL = interleukin; pc = picogram; ml = millilitre, TNF = tumour necrosis factor, LPS – lipopolysaccharide; DEX = dexamethasone; PRED = prednisolone. Mean and median scores represent raw values. *median/interquartile range.

226
Table 4.2 continued. Mean inflammatory and corticosteroid receptor sensitivity parameter values and p values from analyses comparing differences in people with MDD at baseline and follow-up (n = 34)
Baseline
Follow-up Group difference
(p value)
Mean ± SD Mean ± SD
% LPS induced IL-6 levels with PRED 10-8 (pg/ml) (n=32) 144.22 ± 96.43 97.52 ± 51.74 0.051
% LPS induced IL-6 levels with PRED 3 x 10⁻⁹ (pg/ml) (n=30) 166.07 ± 121.77 127.56 ± 76.81 0.639
DEX IC50 (% inhibition of LPS stimulated IL-6 levels) (n=20) 8.28E-8 ± 1.63E-7 1.94E-8 ± 1.83E-8 0.085
PRED IC50 (% inhibition of LPS stimulated IL-6 levels (n=12) 1.49E-7 ± 2.51E-7 2.25E-7 ± 2.27E-7 0.408
Abbreviations: MDD = major depressive disorder; SD = standard deviation; IL = interleukin; pc = picogram; ml = millilitre; DEX = dexamethasone; PRED = prednisolone. Mean and median scores represent raw values.

227
4.5.3 Corticosteroid receptor sensitivity
LPS induced IL-6 levels were measured and compared in depressed people between
baseline and follow-up, in the absence of corticosteroids. As expected, there was no
difference in IL-6 levels in MDD patients between the time points, (t(31) = -0.682, p =
0.5) (Table 4.2, Figure 4.3).
Data shown are mean ± SD in pg per ml.
Next, corticosteroid sensitivity was compared at baseline and follow-up. Data are
presented as glucocorticoid inhibition of LPS-stimulated IL-6 levels as a percentage.
There was a difference in the effects of in vitro incubation with DEX between the time
points. However, whilst IL-6 levels were lower after incubation with DEX for all
concentrations at follow-up, none of them reached significance (p>0.05) (Figure 4.4).
The dose-response curve is shown in Figure 4.5.
Figure 4.3. LPS induced IL-6 in people with MDD at baseline and follow-up (n=32).

228
Data shown are mean ± SD in pg per ml.
Figure 4.5. DEX inhibition of LPS stimulated IL-6 levels in people with MDD at baseline and follow-up (n = 20).
Data are shown as mean ± S.E.M of the % DEX inhibition.
Figure 4.4. DEX suppression of LPS induced IL-6 in people with MDD at baseline and
follow up (n=32).

229
LPS-stimulated IL-6 levels were also lower after incubation with PRED for all
concentrations at follow-up. There was a significant difference in the effects of in vitro
incubation with the highest concentration of PRED between the time points (t(29) =
2.690, p = 0.012). IL-6 levels decreased from baseline to follow-up, suggesting some
improvement in MR function. However this difference was not significant at the lower
concentrations (p>0.05) (Table 4.2, Figure 4.6).
Figure 4.6. PRED suppression of LPS induced IL-6 in people with MDD at baseline and
follow up (n=32).
Data shown are mean ± SD in pg per ml. * statistically significant at P<0.05.
The reduction in depressive symptoms lost significance after adjusting for baseline
PRED 10-6. Results from ANCOVA showed that there was no longer a significant
reduction in BDI score over time (F(1,30) = 0.55, p = 0.816) and there was no significant
interaction effect (F(1,30) = 0.980, p = 0.330). Linear regression was also conducted to
ascertain whether change in IL-6 levels was associated with change in depression score
over time, adjusted for age, sex, smoking or alcohol consumption. Results showed that
change in IL-6 was not a significant predictor of change in BDI score (β = 0.639, p =
0.158). Reversed analyses showed no significant difference in LPS-stimulated IL-6

230
levels over time after adjustment for baseline BDI score and showed that change in BDI
was not a significant predictor of change in IL-6 levels (both p = >0.05).
There was a trend towards significance for DEX IC50 values (t(19) = 1.816, p = 0.085).
DEX IC50 values were lower on average at follow-up compared with baseline. This
suggests that depressed people required a lower concentration of DEX to inhibit LPS-
induced IL-6 by 50% at follow-up. Neither baseline DEX IC50 (β = 2.571, p = 0.374) or
change in DEX IC50 were significant predictors of change in BDI over time (β = 2.733, p
= 0.337) after adjusting for age, sex, smoking or alcohol consumption (all p=>0.05). In
contrast, there was no significant difference in PRED IC50 values between the groups
(t(11) = -0.861, p = 0.408). A slope for the baseline PRED IC50 values was unable to
converge, therefore a dose response curve for PRED has not been presented here.
4.5.4 Diurnal Cortisol
The analyses of diurnal cortisol in relation to time points are summarised in Table 4.3. A
graphical representation of mean cortisol values across the day at baseline and follow-
up is provided in Figure 4.7. There was a borderline significant difference between the
time points in terms of waking cortisol + 60 minutes (t(20) = -1.944, p = 0.066). Saliva
cortisol levels were higher on average at follow-up compared to baseline. Results
showed that the observed reduction in BDI score was independent of cortisol at waking
+ 60 minutes (F(1,27) = 5.426, p = 0.028) and there was no significant interaction effect
(F(1,30) = 0.021, p = 0.886). Cortisol at waking + 60 minutes was not a significant
predictor of change in BDI score (β = -0.268, p = 0.312) adjusted for age, sex, smoking
and alcohol consumption. Reversed analyses showed no significant difference in cortisol
levels over time after adjustment for baseline BDI score and showed that change in BDI
was not a significant predictor of change in cortisol levels (both p = >0.05).

231
There was also a borderline significant difference between CAR AUC values (t(19) = -
1.957, p = 0.065). CAR AUC values increased on average at follow-up compared to
baseline, almost to the level observed in healthy controls, suggesting a normalisation of
the HPA-axis. The reduction in depressive symptoms lost significance after adjusting for
baseline CAR AUC. Results from ANCOVA showed that there was no longer a significant
reduction in BDI score over time (F(1,27) = 0.764, p = 0.390) and there was no significant
interaction effect (F(1,27) = 1.035, p = 0.318). Change in CAR AUC was not a significant
predictor of change in BDI score (β = 0.345, p = 0.112) adjusted for age, sex, smoking
and alcohol consumption. Reversed analyses showed no significant difference in CAR
AUC over time after adjustment for baseline BDI score and showed that change in BDI
was not a significant predictor of change in CAR AUC (both p = >0.05).
Cortisol slope also showed a trend towards significance (t(20) = -1.827, p = 0.083).
Cortisol slope values were higher on average at follow-up compared to baseline. The
reduction in BDI was not robust to adjustment for baseline cortisol slope (F(1,27) = 1.443,
p = 0.240) and there was no significant interaction effect (F(1,27) = 1.337, p = 0.258).
Change in cortisol slope was not a significant predictor of change in BDI score (β = 0.349,
p = 0.207) adjusted for age, sex, smoking and alcohol consumption. Reversed analyses
showed no significant difference in cortisol slope over time after adjustment for baseline
BDI score and showed that change in BDI was not a significant predictor of change in
cortisol slope (both p = >0.05).

232
Saliva samples were taken on waking, waking+30mins, waking+60mins, 4pm, 8pm, and at bedtime in people at baseline (red line) and at 6 week follow-up (blue line). Error bars represent S.E.M. Data shown are raw values.
-2
0
2
4
6
8
10
12
Waking Waking + 30minutes
Waking + 60minutes
4pm Bedtime
Co
rtis
ol/m
mo
l
Sampling times
Baseline
Follow-up
Figure 4.7. MDD baseline versus follow-up: Mean salivary cortisol values across the
day averaged across all participants

233
Table 4.3. Mean cortisol parameter values and p values from analyses comparing differences between people with MDD at baseline and
follow-up
Baseline
Follow-up Group difference (p value)
Diurnal cortisol parameters Mean ± SD Mean ± SD
Waking cortisol (nmol/L) (n=21) 5.68 ± 3.02 8.66 ± 7.76 0.327
Waking cortisol +30 minutes (nmol/L) (n=20) 6.54 ± 3.90 8.33 ± 1.14 0.342
Waking cortisol +60 minutes (nmol/L) (n=21) 4.76 ± 3.30 6.98 ± 4.04 0.066
4pm cortisol (nmol/L) (n=18) 2.04 ± 1.69 1.73 ± 1.46 0.182
Bedtime cortisol (nmol/L) (n=21) 0.63 ± 0.61 0.87 ± 0.19 0.160
CAR (nmol/L) (n=11) 0.33 ± 3.63 -0.77 ± 6.88 0.563
CAR AUC (nmol/L) (n=20) 6.2 ± 3.25 8.85 ± 5.22 0.065
AUC (nmol/L) (n=18) 39.73 ± 16.52 49.47 ± 28.88 0.204
Cortisol slope (nmol/L) (n=21) 0.01 ± 0.00 0.01 ± 0.01 0.083
MDD = major depressive disorder; SSD = standard deviation; nmol = nanomoles; L = litre; CAR = cortisol awakening response; AUC = area under the curve. Mean scores represent raw values.

234
4.5.5 Inter-correlations between the systems
To explore the relationship between change in HPA-axis function and change in
inflammatory activation, correlations between change scores were conducted. The
results are presented in Table 4.4. There was a negative pattern of association between
change in TNF-α and change in the CAR, suggesting that as TNF-α decreases the CAR
increases (r = -0.624, p = 0.040). However this was not significant following Bonferroni
correction. There were no other significant associations.
Table 4.4. Correlations between change in inflammatory biomarkers and change in
HPA-axis parameters in people with MDD
IL-6 TNF-α
MDD
DEX IC50 -0.152 0.245
PRED IC50 -0.028 0.406
CAR -0.464 -0.624*
CAR AUC -0.017 0.041
AUC -0.203 -0.025
Cortisol slope 0.118 0.248
Abbreviations: MDD = major depressive disorder; DEX = dexamethasone; PRED = prednisolone; IL = interleukin, TNF-α = tumour necrosis factor alpha, CAR = cortisol awakening response; AUC = area under the curve. Note: * p<0.05;** p<0.01; ≠ p<0.008 (critical p-value after Bonferroni correction).
Correlations were also conducted to explore the relationships between changes in
biological factors and changes in mood. The results are presented in Table 4.5. There
was a negative pattern of association between change in perceived stress and the AUC
(r = -0.530, p = 0.024). However this did not reach Bonferrroni significance. There was
also a trend towards a positive association between change in perceived stress and TNF-
α (r = 0.334, p = 0.053). Taken together these findings imply that as stress decreases,
there is a reduction in inflammation and a normalisation of HPA-axis function. No other
significant correlations were observed.

235
Table 4.5. Correlations between changes in biological and psychological variables in
people with MDD
BDI PSS
MDD
IL-6 0.237 0.180
TNF-α 0.249 0.334
DEX IC50 -0.116 -0.114
PRED IC50 -0.309 0.092
CAR -0.036 0.243
CAR AUC -0.018 -0.299
AUC -0.216 -0.530*
Slope 0.062 -0.336
Abbreviations: MDD = major depressive disorder; DEX = dexamethasone; PRED = prednisolone; IL = interleukin, TNF-α = tumour necrosis factor alpha, CAR = cortisol awakening response; AUC = area under the curve; BDI = Beck Depression Inventory; PSS = Perceived Stress Scale; LTE = List of Threatening Experiences. Note: * p<0.05; ** p<0.01; ≠ p<0.006 (critical p-value after Bonferroni correction).
4.5.6 Sensitivity analyses
As described in Section 4.5.1, overall participants had significantly lower depressive
symptoms, at follow-up compared with baseline. However this decrease was not a
universal phenomenon across the sample; 25 participants experienced a reduction in
BDI-II score, 7 experienced an increase and 2 did not experience any change. Therefore,
I also ran an exploratory analysis to investigate whether these clinical differences
impacted on the findings. The main analyses were repeated with the group split into
those who demonstrated a reduction in BDI-II score (n=25) and those who did not (n=9).
The results for inflammatory biomarker and corticosteroid receptor function are
presented in Table 4.6.

236
The stratified analysis showed that there was a significant increase in IL-6 at follow-up
for individuals who did not show any improvement in depressive symptoms (t(8) = -2.858,
p = 0.021). IL-6 levels were 0.85 ± 1.03pg/ml at baseline and 1.68 ± 1.21pg/ml at follow-
up. However for individuals who did show an improvement in depressive symptoms,
there was no significant change in IL-6 (t(24) = -0.409, p = 0.686). IL-6 levels were 0.75
± 0.72pg/ml at baseline and 0.86 ± 0.64pg/ml at follow-up. This finding suggests that the
increase in IL-6 observed in the main analysis is largely being driven by people with
persistent depressive symptoms (Table 4.6, Figure 4.8, hashed bars represent baseline,
checked bars represent follow-up). There was no significant change in TNF-α for
individuals who showed an improvement in depressive symptoms (Z = -1.257, p = 0.209)
or for individuals who did not show an improvement in depressive symptoms (Z = -0.840,
p = 0.401).
Regarding corticosteroid receptor sensitivity, there was a significant increase in MR
sensitivity at follow-up for individuals who showed an improvement in depressive
symptoms. LPS-stimulated IL-6 levels were lower at follow-up compared with baseline
following incubation with the highest concentration of prednisolone, 10-6 (t(20) = 2.491,
p = 0.022) (Table 4.6, Figure 4.9, hashed bars represent baseline, checked bars
represent follow-up). However for individuals who did not show an improvement in
depressive symptoms, whilst there was a reduction in IL-6 levels at follow-up, this did
not reach significance (t(8) = 1.027, p = 0.355). There was no significant correlation
between change in plasma IL-6 and change in MR sensitivity in either group (depression
decreased: (r = -0.029, p = 0.902); depression not decreased (r = -0.067, p = 0.865)).
Stratification by symptom recovery had not effect on GR sensitivity or saliva cortisol
findings (all p = >0.05).

237
People with MDD who experienced a reduction of depressive symptoms (n=25); no reduction (n=9). Data shown are mean ± SD in pg per ml. * statistically significant at P<0.05.
People with MDD who experienced a reduction of depressive symptoms (n=21); no reduction (n=9). Data shown are mean ± SD in pg per ml. * statistically significant at P<0.05.
Figure 4.8. Plasma IL-6 levels at baseline and follow-up according to symptom
reduction.
Figure 4.9. Prednisolone suppression of LPS induced IL-6 at the highest concentration,
10-6, at baseline and follow-up, according to symptom resolution.

238
Table 4.6. Mean inflammatory and corticosteroid receptor sensitivity parameter values and p values from analyses comparing differences in people with MDD at baseline and follow-up according to depressive symptom resolution (n=34)
Depressive symptoms reduced (n=25)
Depressive symptoms not reduced (n=9)
Baseline Follow-up P-value Baseline Follow-up P-value
Mean ± SD or
median ±
interquartile range
Mean ± SD or
median ±
interquartile range
Mean ± SD or
median ±
interquartile range
Mean ± SD or
median ±
interquartile range
Plasma IL-6 (pg/ml) (n=34) 0.75 ± 0.72 0.86 ± 0.64 0.686 0.85 ± 1.03 1.68 ± 1.21 0.021
Plasma TNF-α (pg/ml) (n=34) *0.92 ± 0.38 *0.84 ± 0.45 0.209 *0.99 ± 0.56 *1.10 ± 0.56 0.401
IL-6 concentration with LPS only (pg/ml) (n=32) 171.14 ± 116.88 154.31 ± 95.18 0.933 113.30 ± 70.08 113 ± 89 0.106
% LPS induced IL-6 levels with DEX 10-6 (pg/ml) (n=29) 24.50 ± 32.18 9.18 ± 7.37 0.055 13.20 ± 15.21 9.98 ± 9.38 0.798
% LPS induced IL-6 levels with DEX 10-7 (pg/ml) (n=31) 31.71 ± 40.46 13.26 ± 8.93 0.130 22.99 ± 24.84 12.61 ± 10.38 0.336
% LPS induced IL-6 levels with DEX 10-8 (pg/ml) (n=32) 91.21 ± 97.21 46.83 ± 17.28 0.251 61.81 ± 40.54 53.14 ± 31.39 0.513
% LPS induced IL-6 levels with DEX 3 x 10⁻⁹ (pg/ml) (n=32) 136.90 ± 93.97 98.17 ± 39.31 0.452 81.81 ± 39.57 83.21 ± 32.28 0.793
% LPS induced IL-6 levels with PRED 10-6 (pg/ml) (n=30) 58.54 ± 83.23 17.23 ± 11.04 0.022 29.89 ± 29.49 17.98 ± 12.61 0.335
% LPS induced IL-6 levels with PRED 10-7 (pg/ml) (n=32) 98.28 ± 104.46 48.10 ± 20.13 0.346 53.78 ± 49.04 41.82 ± 20.29 0.700
% LPS induced IL-6 levels with PRED 10-8 (pg/ml) (n=32) 156.78 ± 99.50 103.76 ± 53.87 0.126 112.14 ± 84.81 81.57 ± 44.67 0.189
% LPS induced IL-6 levels with PRED 3 x 10⁻⁹ (pg/ml) (n=30) 188.62 ± 128.74 132.41 ± 83.96 0.410 113.46 ± 88.71 116.26 ± 59.67 0.662 DEX IC50 (n=20)
8.44E-8 ± 1.72E-
7
1.71E-8 ± 1.62E-8 0.173 7.97E-8 ± 1.59E-7 2.38E-8 ± 2.23E-8 0.345 PRED IC50 (n=12) 1.21E-7 ± 2.07E-7 2.13E-7 ± 2.24E-7 0.542 1.78E-7 ± 3.06E-7 2.36E-7 ± 2.52E-7 0.638 Abbreviations:MDD = major depressive disorder; SD = standard deviation; IL = interleukin; TNF = tumour necrosis factor; pc = picogram; ml = millilitre; LPS – lipopolysaccharide; DEX
= dexamethasone; PRED = prednisolone. Mean and median scores represent raw values. *median/interquartile range.

239
4.6 Discussion
4.6.1 Aims and hypotheses
The aim of this study was to observe any changes in inflammatory and neuroendocrine
biomarkers in depressed people at baseline and six week follow-up, and explore whether
these changes predicted any change in depressive symptoms. I hypothesised that any
change in depressive symptoms will be influenced by baseline levels of inflammation
and predicted by change in inflammation over time (hypothesis 1). I hypothesised that
any change in depressive symptoms will be influenced by corticosteroid sensitivity at
baseline and predicted by change in corticosteroid sensitivity over time (hypothesis 2). I
hypothesised that any change in depressive symptoms will be influenced by diurnal
cortisol rhythm at baseline and predicted by change in cortisol rhythm over time
(hypothesis 3). Finally I hypothesised that any change in inflammatory cytokines will be
associated with change in CAR AUC/AUC (hypothesis 4).
4.6.2 Summary of results
The results showed that hypothesis 1 was not confirmed: there were no significant
changes in inflammatory biomarkers at follow-up. Hypothesis 2 was partially confirmed:
there was a significant increase in MR sensitivity over time and the reduction in BDI score
at follow-up was not robust to adjustment for MR sensitivity at baseline, however there
was no interaction between the two variables and the change in sensitivity was not a
significant predictor of change in BDI score. Hypothesis 3 was not confirmed: there were
no significant differences in diurnal cortisol at follow-up. Finally hypothesis 4 was not
confirmed: there were no significant association between change in inflammatory
cytokines and change in CAR AUC/AUC.

240
4.6.3 Hypothesis 1: Differences in inflammatory biomarkers
We did not observe any significant change in inflammation, despite observing a
significant reduction in depressive symptoms. Furthermore IL-6 appeared to be
increased, albeit not significantly, at follow-up. However, this may be explained by the
high variability in our IL-6 data, which had high standard deviations relative to the mean
values. This suggests that the mean score is a poor fit of the observed data and is
unlikely to represent the sample (Field, 2017). Furthermore, the change in IL-6 varied
from -2.46 to 3.67pg/ml, suggesting that some participants exhibited an increase in IL-6,
whilst others exhibited a decrease. Sensitivity analyses showed that the observed
increase in IL-6 was primarily driven by individuals who did not show any clinical
recovery, suggesting that increased inflammation may be associated with persistent
depressive symptoms.
This interpretation is also in line with a study which showed that cytokine levels are
associated with treatment response following antidepressant therapy. Plasma IL-6 levels
have been shown to be reduced in treatment responders compared with non-responders,
suggesting that higher IL-6 activity is associated with the refractoriness of depression,
and might be a predictor of treatment response (Yoshimura et al., 2009). A meta-analysis
by Hiles et al. (2012a) provided evidence which demonstrated that with a reduction in
depression, there is a co-occurring reduction in inflammation. Strawbridge et al. (2015)
examined data from 35 studies and reported that IL-6 levels decreased following
antidepressant treatment, regardless of outcome. Similar findings have been reported
regarding of non-pharmacological therapies. A reduction in depressive symptoms
following CBT therapy has been associated with reductions in IL-6 in un-medicated
women (Gazal et al., 2013). A systematic review by Lopresti (2017) also reported that
CBT may reduce inflammatory biomarkers.

241
Our results showed that TNF-α levels were decreased at follow-up, however this finding
did not reach significance. The literature regarding TNF-α and clinical remission are
inconclusive. Some studies have shown that levels of TNF-α are lower following
antidepressant treatment, although the effect size was small (Kohler et al., 2018). Other
studies have not found any significant effect of antidepressant treatment on TNF-α levels
(Hannestad et al., 2011;Wiedlocha et al., 2018). This inconsistency in the literature may
be explained by the finding that decreases in TNF-α may be restricted to treatment
responders (Strawbridge et al., 2015). The meta-analyses by Hannestad et al (2011) and
Wiedlocha et al. (2018), which reported null findings, did not consider treatment
response.
Treatment responders are usually classified as those who demonstrate a 50% reduction
in depressive symptoms (Hiles et al., 2012a;Masson & Tejani, 2013). The minimum
clinically important difference, defined as the minimum change in an outcome in which
the patient perceives a difference (usually because of a therapy/intervention), has been
identified as a 30% reduction by one study (Wilson, 2008) and as a change of at least 5
points on the BDI after treatment according to two studies (Dworkin et al., 2008;Hiroe et
al., 2005). In the present study, the mean reduction in depressive symptoms was modest,
22.61% or 5.56 points on the BDI-II. This is not surprising given that this was an
observational study and we did not intervene in treatment. Therefore it is possible that
the small reductions in depressive symptoms we observed reflect small reductions in
inflammation, which we were underpowered to detect.
4.6.4 Hypothesis 2: Differences in corticosteroid receptor function
We did not observe any significant change in GR sensitivity. Whilst LPS-induced IL-6
levels were lower for all DEX concentrations at follow-up, none of them reached
significance. There was however, a trend for lower DEX IC50 values at follow-up
compared to baseline, suggesting that depressed people required a lower concentration

242
of DEX to inhibit LPS-induced IL-6 by 50% at follow-up and therefore may have
experienced an improvement in GR function. However, neither baseline DEX IC50 values
nor change in DEX IC50 values were significant predictors of change in BDI over time.
Studies investigating the effects on antidepressants have provided evidence of
normalized HPA-axis feedback after successful treatment (Heuser et al., 1996;Linkowski
et al., 1987). An in vitro study of GR function has shown that following treatment, an
increase in GR number is concurrent with a tendency to improve depressive symptoms
(Calfa et al., 2003). In vivo studies have reported similar results. Depressed in-patients
who were also non-suppressors to the DST, demonstrated progressive normalisation of
DST responses in conjunction with clinical improvement (Greden et al., 1983). Other
studies have reported findings which support an opposite direction of effect. Patients with
initially abnormal DST results have demonstrated clinical remission three weeks after
normalisation of the HPA-axis (Holsboer et al., 1982). However, other studies report no
difference in DST suppression between the responders and non-responders (Ventura-
Junca et al., 2014). A recent meta-analysis showed that cortisol levels following the DST
were higher in non-responders (S. Fischer et al., 2017a). Similar results have been
reported following the DEX/CRH test. Reductions in cortisol and ACTH response have
been associated with SNRI and NaSSA treatment (Schule et al., 2006) and SSRI and
QXR treatment (Sarubin et al., 2014). Successful electroconvulsive therapy may also be
effective in normalising cortisol response in the DEX/CRH test (Kunugi et al., 2006;Yuuki
et al., 2005).
These findings concur with studies investigating severely treatment-resistant patients.
Bauer et al. (2003) showed that TRD patients demonstrated reduced inhibition of T-cell
proliferation and cytokine production following both oral and in vitro administration of
DEX. Similarly, Carvalho et al. (2008) showed that clomipramine increased
glucocorticoid inhibition of LPS induced IL-6 levels in the whole blood in healthy controls

243
but not in TRD patients. Together, these results suggest that recovery of GR function is
dependent on clinical remission.
We did observe a trend for improved GR function and so may speculate on possible
mechanisms of action. In the present study, one third of the depressed participants were
taking antidepressants, therefore it is possible that the trend for improved GR function
was a neurobiological effect of the medications. Four days of treatment with citalopram
has been shown to increase both glucocorticoid and mineralocorticoid receptor
sensitivity in healthy humans (Pariante et al., 2004). Antidepressants may target the GR
directly at various functional points, including GR mRNA expression, nuclear
translocation of the GR and GR-mediated gene transcription (Anacker et al., 2011). The
exact mechanism of action is still unidentified but one possibility is that antidepressants
enhance GR translocation and function via signal transduction pathways involving cyclic
adenosine monophosphate (cAMP) (Rangarajan et al., 1992). Miller et al. (2002a)
showed that the phosphodiesterase type-4 inhibitor, rolipram, which antagonizes cAMP
breakdown and therefore enhances cAMP-dependent protein kinase A activation,
increases GR-mediated gene transcription in vitro and significantly enhances GR
function. Antidepressants also influence other intracellular protein kinases (Nalepa &
Vetulani, 1991) which may be involved in decreases in GR-mediated gene transcription
(Budziszewska et al., 2000). Upon immediate glance this may appear to suggest a
reduction in GR function, however decreased GR expression can also reflect increased
GR-mediated gene transcription and subsequent GR downregulation, and therefore
reflect an increase in GR sensitivity. Finally, antidepressants may indirectly enhance GR
function by inhibiting membrane transporters, which eject glucocorticoids from the
cytoplasm, thus increasing the intracellular concentration of glucocorticoids (Pariante et
al., 2003).
There was a significant improvement in MR sensitivity, as demonstrated by increased
LPS-stimulated IL-6 levels in the presence of the highest concentration of PRED,10-6.

244
The observed reduction in BDI score at follow-up was not robust to adjustment for
baseline MR sensitivity, and there was no significant interaction between the two.
Additionally, the change in MR sensitivity was not a significant predictor of change in BDI
score. However, exploratory analyses showed that the improvement in MR sensitivity
was only significant in individuals who demonstrated a reduction in BDI-II score (n=21),
suggesting that clinical recovery may be moderated by MR function.
To my knowledge only one study has investigated MR function and treatment response.
Juruena et al. (2010) reported that the cortisol response to the PST did not change in
depressed people following antidepressant treatment, even in those who responded,
suggesting that MR function is not influenced by antidepressants or symptom remission.
The same authors also found that depressed patients tend to have a normal response
to prednisolone even in the presence of an impaired response to dexamethasone,
suggesting that there is no impairment of MR function associated with depression
(Juruena et al., 2006;Juruena et al., 2009). In contrast, we have shown that depressed
people do exhibit impairment in MR function and do demonstrate improvement alongside
clinical recovery.
One possible explanation for the divergent findings may be related to treatment
resistance. Although, participants in both studies were all classified as having unipolar
MDD according to either DSM-IV or ICD-10 criteria, patients in the Juruena studies
described above (2006, 2010;2009) were all considered to be treatment resistant on the
basis of previous non-response to at least two different antidepressants. In the present
study, we did not collect data regarding previous antidepressant use, however 65.7% of
the depressed participants had experienced previous depression. Therefore we were
able to conduct secondary analysis to explore whether recurrent depression may play a
role in MR function. We repeated the prednisolone suppression analysis on a subset of
individuals who had a history of at least one previous episode (n=19). Results showed
that there was no longer a significant difference in the effects of in vitro incubation with

245
the highest concentration of PRED between the time points (t(18) = 1.483, p = 0.155).
This finding suggests that MR function may be moderated by clinical improvement but
not in those with recurrent symptoms.
4.6.5 Hypothesis 3: Differences in diurnal cortisol
Whilst we did not observe any significant difference in diurnal cortisol rhythm over the
time-points, the findings for the CAR AUC did show a trend towards an increase. This
trend lends some support to a study by Ruhe et al. (2015) who reported increased CAR
in severely depressed patients who achieved remission following antidepressant
therapy. However in the present study, we did not find that the trend in increased CAR
was associated with change in symptoms. This may reflect the relatively small decrease
in depressive symptoms we observed. In the Ruhe et al. study, remission was defined
as ≤7 on the Hamilton Depression Rating Scale (HDRS) which denotes normal mood
(Zimmerman et al., 2013). A score of ≤13 indicates normal mood on the BDI-II (A. T.
Beck et al., 1996a). Only 4 of the participants in our study had a BDI score of ≤13,
therefore we were unable to determine whether clinical remission was associated with
CAR AUC.
The trend observed in our study also lends some support to findings from a large cohort
study which reported significantly higher CARs in remitted patients compared to controls
(Vreeburg et al., 2009a) and another study which also found higher CARs in drug-free
remitted patients (Aubry et al., 2010). In contrast, decreased CAR has also been
associated with antidepressant response in depressed people (J. Beck et al., 2015).
Evidence from healthy populations is also inconclusive. SSRI administration has been
found to increase (Harmer et al., 2003;Ronaldson et al., 2018) and decrease (U. Knorr
et al., 2012) waking cortisol.

246
We also observed a trend towards a steeper cortisol slope at follow-up, although this
was not associated with improvement in clinical symptoms. A steeper cortisol slope can
be due to increased waking or decreased evening cortisol values. In the present study
whist there was no significant change in evening cortisol (p = >0.05), suggesting that the
alteration in cortisol slope was driven by the increase in CAR AUC. In chapter 3 we
reported that the CAR AUC was reduced in the MDD group, compared with controls, a
finding which is supported by several other studies (Dedovic et al., 2010;Doolin et al.,
2017;Huber et al., 2006;Stetler & Miller, 2005). Increased waking cortisol is an adaptive
phenomenon, preparing the body upcoming challenges in the day ahead and has been
associated with increased cognition (Kramer et al., 2019;Law et al., 2013). Therefore if
this mechanism fails, as demonstrated by a blunted CAR/CAR AUC, this may result in
depressive symptoms. In contrast increased CAR has also been associated with
depression (Dienes et al., 2013;Rhebergen et al., 2015;Ulrike et al., 2013;Vreeburg et
al., 2009a). Furthermore, both hyperactivity and hypo-activity of the HPA-axis have been
associated with depression relapse (Bockting et al., 2012;Hardeveld et al., 2014). It may
therefore be that symptom remission is associated with normalisation of the HPA-axis,
regardless of the direction of the initial dysfunction.
It is difficult to compare our results with previous work because the relationship between
depression remission and cortisol slope has not yet been explored. One study has
investigated the effects of antidepressants and cortisol slope in healthy people.
Ronaldson et al. (2018) reported that women receiving SSRIs had significantly steeper
cortisol slopes compared with those receiving placebo but did not observe any effect of
medication on cortisol slope in men. In order to test whether there was any effect of sex
on our findings, secondary analysis was conducted. There was no main effect or
interactive effect of sex on cortisol slope (both p values > 0.05).
Antidepressants have been shown to have differential effects on cortisol. TCA use has
been associated with flattened CAR compared to other antidepressants in depressed

247
people (Manthey et al., 2011). SSRI has been shown to enhance the CAR in healthy
people compared to SNRI which had no effect (Harmer et al., 2003). However a recent
review of the effects of psychotropic medication on cortisol reported that antipsychotics
and antidepressants are associated with a reduction in cortisol secretion (Subramaniam
et al., 2019). In the present study all depressed individuals who were taking
antidepressants were receiving SSRI medications. One individual was receiving
benzodiazepine medication and one was receiving antipsychotic medication. Therefore
if there was any effect of medication on cortisol in this study, it is likely to be a mechanism
of SSRI therapy.
In terms of mechanisms, there are several ways in which SSRIs could alter HPA axis
function. The serotonin system and HPA axis are intricately related (Porter et al., 2004).
Serotonin receptor agonists have been shown to induce serum cortisol in healthy people
(Pitchot et al., 2002) and plasma cortisol in rats (Mikkelsen et al., 2004). SSRI medication
may therefore modulate cortisol levels via the serotonin receptors. Immunohistochemical
studies have demonstrated that serotonin receptors are present on neurons in the PVN
of the hypothalamus – a structure that initiates the activation of the HPA-axis (Lanfumey
et al., 2008).
SSRIs may also influence the HPA-axis via their effect on melatonin levels. Several
studies report lower plasma melatonin levels in depressed patients compared with
controls (Beck-Friis et al., 1985a;Beck-Friis et al., 1985b;Paparrigopoulos, 2002). There
is evidence that melatonin modulates the HPA-axis and restores function, particularly in
the context of stress from animal studies. Rats demonstrate hypertrophy of the adrenal
and pituitary glands following pinealectomy (Konakchieva et al., 1997;Wurtman et al.,
1959), decreased adrenocortical response when stressed and treated with melatonin
and increased HPA-axis sensitivity to the DST (Konakchieva et al., 1998). Melatonin has
also been found to increase GR mRNA expression (N. Barden et al., 2005) and inhibit
GR function in mice (Presman et al., 2006). Studies in depressed patients suggest that

248
antidepressants increase circulating melatonin levels (Bearn et al., 1989;Kennedy &
Brown, 1992;Palazidou et al., 1992;Schmid et al., 2006;Thompson et al., 1985). A study
by Carvalho et al. (2009) showed that melatonin synthesis was increased following
antidepressant treatment compared with placebo, independently of clinical remission.
As previously discussed, SSRIs could influence the HPA-axis via modulation of the GR
and in the present study we observed a trend for improved GR function. Flatter cortisol
slopes have previously been associated with impaired GR sensitivity (Jarcho et al.,
2013). In light of this, we assessed the correlations between GR sensitivity and cortisol
slope in depressed people at baseline and follow-up and found no significant
associations (p = >0.05).
4.6.6 Hypothesis 4: Inter-correlations between the systems
In line with our hypothesis, we observed a negative pattern of association between
change in TNF-α and change in the CAR, suggesting that as TNF-α decreases the CAR
increases, however this did not reach significance. We interpret this finding as follows:
TNF-α and the HPA axis have a reciprocal relationship, mutually influencing each other.
Increases in TNF-α stimulate the HPA axis, while the HPA axis suppresses TNF-α
production. It is possible that in people with chronic or recurrent MDD, HPA-axis
hyperactivity might eventually exhaust the regulatory mechanisms underlying the CAR,
resulting in an impaired cortisol response to stress. This reduced cortisol response might
then be less capable of inhibiting TNF-α production. Upon clinical improvement the HPA-
axis normalises and the CAR increases, gaining back control over the TNF-α system.
This may explain why we might observe an increase in CAR in association with a
decrease in TNF-α in a group people with MDD who demonstrate a reduction in
depressive symptoms.

249
This finding is in contrast to those of Himmerich et al. (2006) who examined alterations
in TNF-α and response to the DEX/CRH test on admission and at discharge in MDD
inpatients. They reported a positive correlation between TNF-α and CRH/DEX test
outcome in remitted patients following successful antidepressant treatment and
normalisation of the HPA-axis. Their interpretation of this finding is that during a
depressive episode, HPA-axis activity is increased, overriding the suppressive effects of
TNF-α. However, the inhibitory effects of the HPA axis on TNF-α are still active, leading
to a suppression of TNF-α production in depressed patients with a hyperactive HPA-axis.
Upon symptom remission, the HPA axis normalizes although, potentially increasing TNF-
α levels. This suggests that clinical remission is associated with increased TNF-α control
over the HPA-axis. An inverse association between TNF-α and the neuroendocrine
response to the DEX/CRH test in MDD has also been reported by Schuld et al.(2003)
cross-sectionally.
In light of these conflicting findings it may be that symptom remission is associated with
normalisation of the HPA-axis, and that the direction of the initial dysfunction determines
the associated effect on TNF-α. Therefore in the case of hyperactivity as demonstrated
by Himmerich et al. (2006), as the HPA-axis system normalises, TNF-α levels increase.
However in the case of HPA-axis exhaustion as implied by the findings of our study, as
the HPA-axis system normalises, TNF-α levels decrease. Larger longitudinal studies
exploring TNF-α and HPA-axis function in MDD are required to disentangle this
relationship.
4.6.7 Strengths and limitations
Many of the limitations of the present study were discussed in detail in Chapter 3 which
described the cross-sectional analysis. The main strength of this study is that it is the
first to investigate changes in inflammation, GR and MR function and diurnal cortisol

250
rhythm simultaneously in MDD patients, over time. Another strength of this study is the
low attrition rate, with ascertainment of clinical outcomes at follow-up in 95% of
depressed participants, however as previously mentioned sample size was relatively
small (n=35) which likely limited statistical power. It’s important to note that this was an
observational study and we did not interfere with any pharmacological or psychological
treatment. Furthermore, patients were taking several different SSRI medications and
some were receiving psychotherapy. Sample size limited the number of sub-group
analyses we could conduct, therefore we cannot be certain of any specific treatment
effects.
However, despite the lack of study intervention, we still observed a decrease in
depressive symptoms over time. It is not clear why we observed this improvement in
symptoms. Whilst the baseline assessment was not framed as a therapeutic encounter,
it is possible that participants found the interview helpful and provided them with an
opportunity to “get things off their chest”. For individuals who have few opportunities to
talk about mental health problems, such interviews have potential benefits (Latkin et al.,
2017). It is therefore possible that the improvement in clinical symptoms we observed
may only have been transient. Furthermore, this finding may possibly reflect demand
characteristics, where participants who had a positive experience during the baseline
interview may have unconsciously responded more optimistically to the questionnaires
at follow-up, in line with a misinterpretation of the aim of a study.
Our study was also limited by a relatively short follow-up period. Antidepressant
treatment duration ranged from 1-36 months, therefore it is possible that some people
were waiting for any therapeutic effect to occur. Larger studies of patients with MDD,
with longer follow-up are needed to establish the robustness of the findings.

251
4.6.8 Conclusion
In conclusion, these results indicate that improvements in depressive symptoms are
accompanied by increases in MR sensitivity. In addition they may be accompanied by
improved GR sensitivity and CAR AUC. These findings also tentatively imply that
changes in TNF-α might be associated with changes in the CAR. However no firm
conclusions can be made regarding these findings. Further longitudinal studies are
required to fully explore these relationships.

252
5. Literature review: Regulatory T cells and depression
5.1 T-cells and depression
In addition to evidence for increased innate immune responses, a body of evidence is
now beginning to emerge suggesting a role for the adaptive immune system in both the
pathophysiology and resolution of depression (A. H. Miller, 2010;Toben & Baune, 2015).
As previously mentioned, the adaptive arm of the immune system largely consists of
lymphocytes that exert a delayed response to inflammatory challenge. Lymphocytes are
broadly categorised into B cells and T cells. Activated B cells orchestrate the humoral
response via antibody secretion and activated T cells differentiate into either CD8+T cells
or CD4+T cells (Herkenham & Kigar, 2017). CD8+ or ‘cytotoxic T cells’ act as killer cells,
destroying infected cells. CD4+T cells are divided into subtypes: ‘T helper (Th) cells’,
which initiate immune responses and regulatory T cells (Tregs) which are
immunosuppressive. Most studies into adaptive immunity and depression have focused
on CD4+ and CD8+ proliferation.
Alterations in T cell function were first observed in patients with severe MDD. These
patients demonstrate significantly decreased PBMC proliferation in response to T cell
mitogens (Kronfol et al., 1983;Schleifer et al., 1984). Whilst subsequent studies have
reported conflicting results, meta-analyses have reported robust decreases in T cell
responses in both stressed and depressed individuals (T. B. Herbert & Cohen, 1993;Irwin
& Miller, 2007;Zorrilla et al., 2001). Decreased T cell function in depressed patients has
also been demonstrated in vivo using skin response to antigens (Hickie et al.,
1993;Sephton et al., 2009). Meta-analyses have also demonstrated that T cell number
and in vitro proliferation is significantly reduced in patients with depression (Irwin & Miller,
2007;Zorrilla et al., 2001). Increases in the CD4+/CD8+ ratio (Zorrilla et al., 2001) as well
as decreases (Pavon et al., 2006) have also been observed. Currently it is unclear what
the clinical implications of this imbalance might be on depression.

253
The exact mechanisms involved in T cell responses is not yet understood, however a
number of hypotheses have been suggested. Firstly, there is evidence of accelerated
apoptosis of CD4+T cells in patients with depression (Eilat et al., 1999;Ivanova et al.,
2007;Agnieszka Szuster-Ciesielska et al., 2008). Chronic stress also induces T-cell
apoptosis in humans and animals (Sakami et al., 2002;Shi et al., 2003). This increase in
apoptosis could be explained by tryptophan depletion (A. H. Miller, 2010). As previously
mentioned, cytokines induce IDO, which converts tryptophan to kyurenine, resulting in
reduced serotonin synthesis and increased depression (Dantzer et al., 2008;Hestad et
al., 2017). Tryptophan is also an essential proliferative stimulus for effector T cells, and
in situations of tryptophan depletion T cells undergo apoptosis (Beissert et al.,
2006;Mellor et al., 2003).
Secondly, T-cells could potentially be suppressed by glucocorticoids. As previously
discussed, activation of the HPA-axis and subsequent cortisol release is a characteristic
of depression. Furthermore, glucocorticoids are known to inhibit inflammation, mediate
cell redistribution and initiate T-cell apoptosis (McEwen et al., 1997). Despite the
intuitive appeal of this explanation, no association has been found between cortisol levels
and in vitro decreased T-cell proliferation in response to mitogen stimulation in patients
with depression (Kronfol et al., 1986). Further evidence against this hypothesis comes
from more recent studies which demonstrate that the inhibitory effect of cortisol on in
vitro T-cell proliferation is actually reduced in depressed patients (Bauer et al.,
2003;Pariante & Miller, 2001;Raison & Miller, 2003). Evidence also shows that
dexamethasone induced cell redistribution is greater in healthy controls compared to
TRD patients (Bauer et al., 2002). This may be the result of insufficient glucocorticoid
signalling. Several studies have reported a reduction in cytosolic GR binding in PBMCs
(Pariante & Miller, 2001). As previously discussed, this may be a result of exposure to
pro-inflammatory cytokines.

254
Furthermore, inflammatory cytokines, such as TNF-α, may also directly impair T-cell
function in patients with depression. As this thesis has already shown, TNF-α is robustly
associated with depression (Dowlati et al., 2010;Haapakoski et al., 2015;Howren et al.,
2009). Chronic exposure of TNF-α to T cells has been shown to decrease both
proliferation and cytokine production in murine models and in patients with rheumatoid
arthritis, both in vitro and in vivo (Cope et al., 1997;Cope et al., 1994;L. F. Lee et al.,
2008). Moreover, T cell function can be restored by treatment with anti TNF-α
monoclonal antibodies such as infliximab and adalimumab (Bayry et al., 2007;Cope et
al., 1994;L. F. Lee et al., 2008).
T cell function related polymorphisms have also been identified. A study by Wong et al.
(2008) found that two SNPs critical for antigen processing and T cell differentiation,
PSMB4 (proteasome beta4 subunit) and TBX21 (T bet) were associated with
susceptibility to MDD. Furthermore, analyses revealed a dose-response effect, with
participants who had three risk alleles being 10 times more likely to have the diagnosis
of MDD. They also identified four other SNPs important to T cell function which were
associated with antidepressant response (CD3E, PRKCH, PSMD9 and STAT3). Another
SNP in a proteasome gene (PSMD13), known to contribute to T cell function, has been
shown to confer a two-fold greater risk for treatment resistance depression (Minelli et al.,
2015). These findings suggest that T cell abnormalities may be involved in the aetiology
of depression.
T cell dysfunction could also explain the physical comorbidities associated with
depression (A. H. Miller, 2010). As discussed earlier this disorder is associated with a
wide variety of physical health conditions, including infectious disease and cancer.
Leserman et al. (2008) conducted a systematic review of studies investigating
depression and HIV progression and reported that chronic depression is associated with
decreases in CD4+T cells and greater risk for clinical decline and mortality in HIV
patients. Similarly data from the HIV Epidemiology Research Study showed that HIV+

255
women with chronic depressive symptoms had a significantly reduced CD4+T cell count
and were 2 times more likely to die than women with no depressive symptoms (Ickovics
et al., 2001). In a study involving 72 women with metastatic breast cancer, women
reporting more depressive symptoms showed suppressed T cell immunity indicated by
a decreased antigen response (Sephton et al., 2009). Interestingly suppressed T cell
immunity was also associated with higher mean diurnal cortisol concentrations,
highlighting the interaction between inflammatory and neuroendocrine function.
5.2 Regulatory T cells
Whilst immune activation is an obvious requirement for defence against pathogens, like
all biological process it needs to be controlled or risks becoming pathological. An
overactive or inappropriate immune response can lead to excess inflammation, resulting
in tissue damage and loss of organ function (Plitas & Rudensky, 2016). A subset of
CD4+T cells with immunosuppressive properties, known as regulatory T cells, or Tregs,
are known to supress the immune response, thereby maintaining immune homeostasis.
These cells act as messengers in the negative feedback loop of the immune response
and are the primary component in the maintenance of self-tolerance and prevention of
autoimmunity (Corthay, 2009). They are synthesized during inflammation to regulate the
production of pro-inflammatory cytokines and control unwanted immune responses by
various mechanisms, such as inhibition of antigen presenting cells, killing effector cells,
metabolic disruption via degradation of adenosine triphosphate and the secretion of anti-
inflammatory cytokines such as IL-10, IL-35 and TGF-β (Grant et al., 2015). Indeed,
animal studies demonstrate that depletion of Tregs in healthy individuals provokes an
acute inflammatory response that leads to lethal autoimmunity (Fontenot et al., 2003).
However, whilst Tregs control inflammation, inflammation also controls Tregs
(Klatzmann & Abbas, 2015). In the context of a highly inflammatory environment, Tregs
become unstable and lose their suppressive function (DuPage & Bluestone, 2016).

256
Tregs are characterised by expressing the CD4 T cell co-receptor, the interleukin (IL2)
receptor α-chain (CD25) and the lineage-specific transcription factor Foxp3 and are
identified as CD4+CD25+FoxP3+ Tregs (Plitas & Rudensky, 2016). Additional highly
expressed markers on Tregs include, cytotoxic T lymphocyte-associated antigen 4
(CTLA-4), glucocorticoid-induced tumour necrosis factor receptor family-related gene
(GITR), lymphocyte activation gene-3 and CD127 (Corthay, 2009). However growing
evidence suggests that these markers may not be strictly Treg specific, and appear to
be markers of general T cell activation. A truly specific molecular marker for Treg cells
has yet to be elucidated.
Multiple studies have assessed the frequency of Tregs in PBMCs of patients with
autoimmune diseases, often with conflicting results. Studies investigating Tregs in
rheumatoid arthritis have reported both increases (Han et al., 2008;van Amelsfort et al.,
2004) and decreases in Treg percentages in patients compared with controls (Lawson
et al., 2006), whereas others have found no evidence of any difference (Cao et al.,
2003;Mottonen et al., 2005). Similarly in multiple sclerosis increases (Kumar et al.,
2006), decreases (Venken et al., 2008) and no differences (Feger et al., 2007;Haas et
al., 2005) in Tregs have been reported. Increased Tregs have also been observed in
type 1 diabetes (Marwaha et al., 2010), whilst others have reported null findings (Brusko
et al., 2005;Lindley et al., 2005). Treg deficiency has been reported in patients with IPEX
syndrome (immunodysregulation, polyendocrinopathy and enteropathy, X-linked) which
is associated with autoimmune disease in multiple endocrine organs (Wildin et al.,
2002). The only research to demonstrate consistent findings has been regarding SLE.
Patients with SLE reliably show decreases in Tregs and this is associated with disease
severity (Gerli et al., 2009). A defect in the suppressive ability of Tregs has also been
observed in several autoimmune diseases (Costantino et al., 2008).

257
5.3 Regulatory T cells in depression
Given the role of Tregs in modulating cytokine production and the increased cytokine
levels observed in MDD, is seems plausible that Tregs may be implicated in the aetiology
of depression. Tregs produce the anti-inflammatory cytokines IL-10 and transforming
growth factor-β (TGF-β) (Haroon et al., 2012) and decreased levels of IL-10 and TGF-β,
as well as in increased IL-6/IL-10 ratio, have been observed in depressed people
(Dhabhar et al., 2009;L. Sutcigil et al., 2007). Nevertheless, there is limited data
investigating Tregs in depression. Studies using animal models of depression have
reported a decreased frequency of Tregs. Reduced Tregs have been significantly
associated with the onset of depressive-like behaviour in mice, in the context of a chronic
unpredictable mild stress paradigm (Hong et al., 2013). Treg cell depleted mice also
exhibited anxious and depressive behaviors in an elevated plus maze, tail suspension
task, and forced swim test when compared with the non-stressed wild-type group (S.-J.
Kim et al., 2012). In a rat model of postnatal depression, Tregs were decreased and
negatively associated with serum IL-1β and IL-6 (J. Li et al., 2016a). In addition,
treatment with the antidepressant fluoxetine resulted in a subsequent increase in Tregs.
In humans, the effect of acute psychological stress on Tregs has also been explored. In
a study by Freier et al. (2010), 31 healthy young males underwent a brief laboratory
stressor and effects on Tregs and other T cell subpopulations were measured. A
significant stress-induced decrease in Tregs and an increase in T effector cells was
observed, suggesting a shift towards an immune-enhancing environment. In contrast,
an increase in the proportion of Tregs was also observed in 41 undergraduate students
in response to examination stress, which was accompanied by an increase in
inflammatory cytokines (Hoglund et al., 2006). The association between inflammatory
and neuroendocrine responses to acute stress and Treg frequency have also been
investigated. In a study including 121 healthy older men and women from the Whitehall
II cohort, a blunted cortisol and elevated IL-6 response to acute psychophysiological

258
stress testing was associated with a greater Treg percentage three years later
(Ronaldson et al., 2015). Furthermore, the percentage of Tregs was independently
associated cross-sectionally with higher levels of depressive symptoms.
The course of Treg abnormalities have been explored in individuals at risk for mood
disorders. T cell subsets from 140 children of a parent with bipolar disorder were
assessed at three time-points: adolescence, young adulthood and adulthood. Tregs
exhibited a dynamic course over time with reduced levels of Tregs in adolescence,
which were correlated with a high expression of pro-inflammatory genes in monocytes,
and a reduced relative number of Th1, Th17 cells in young adulthood (Snijders et al.,
2016). Th1 cells produce IFN-γ, IL-2, and TFN-β (Romagnani, 1999) and Th17 cells
produce the highly inflammatory cytokine IL-17 (Tesmer et al., 2008). Both Th1 and Th17
cells are thought to play an important role in the induction of autoimmune diseases. This
study demonstrated a high inflammatory state at adolescence and an anti-inflammatory
state in young adulthood. In adulthood these states normalized. No significant
associations between Tregs and mood disorders were found. Tregs have also been
shown to be increased in women with postnatal depressive symptoms (Krause et al.,
2014). In a study of 100 pregnant women, Tregs were shown to be increased both
prenatally and postnatally in women with postnatal depression. Furthermore, Tregs also
strongly predicted postnatal depressive symptoms
Few studies have investigated Treg frequencies in psychiatric populations. Sommershof
et al. (2009) reported a 48% reduction in the proportion of Tregs in 19 PTSD patients
compared to 27 controls. Functionally, this reduction was associated with a significantly
increased ex vivo proliferation of anti-CD3 stimulated T cells, suggesting a potential
explanation for the increased susceptibility to infections, and inflammatory and
autoimmune diseases observed in PTSD. However findings are conflicting with a similar
study finding no differences in the proportion of Tregs between 23 PTSD patients and
matched controls, although they did observe a less suppressive phenotype (Jergović et

259
al., 2014). An increase in the proportion of Tregs in 26 medicated participants with stable
schizophrenia compared with and 17 healthy controls has also been reported (D. L.
Kelly et al., 2018). Elevated Tregs also correlated with fewer negative symptoms,
suggesting that Tregs may contribute to improved negative symptoms in successful
treatment in schizophrenia.
Decreases in Treg cell populations have been noted in patients with depression (Table
5.1). A study by Li et al. (2010) reported a decrease in CD4+CD25+ Tregs, IL-10 and
TGF-β and increased IL-2 in 27 patients with MDD compared to 27 healthy controls.
They also reported that in the overall sample, Tregs were correlated with inflammatory
cytokines, indicating a role for Tregs in the immune imbalance observed in MDD.
Furthermore they found lower levels of serotonin in the plasma and 5-HT1a receptor in
Tregs. This suggests a potential interaction between serotonin, its receptor, and Tregs
in major depression. These findings are in line with the monoamine theory of depression
postulates that the underlying pathology of depression is a depletion in the levels of
neurotransmitters (Delgado, 2000). Interestingly, serotonin also plays a role in immune
signalling in both innate and adaptive immune cells (Ahern, 2011). Further research is
needed to investigate the mechanism of action in the interaction between serotonin and
Tregs in depression. Another study reported a significant decrease in circulating Tregs
and a significant increase in Th17 cells in 40 MDD patients compared to 30 healthy
controls (Y. Chen et al., 2011). The study also showed that MDD patients had increased
serum IL-17 and a higher mRNA expression of the Th17 cell transcription factor, RORγt.
Further research is also needed regarding the relationship between Th17 cells and Tregs
in the pathogenesis of autoimmunity in MDD.
Grosse et al. (2016b) observed decreased percentages of Tregs, in association with
monocyte gene expression 50 MDD patients compared with 58 controls. In addition they
also observed increased serum epidermal growth factor (EGF) and increased
inflammatory monocyte gene expression (IL-6, IL-1β and TNF-α), further confirming
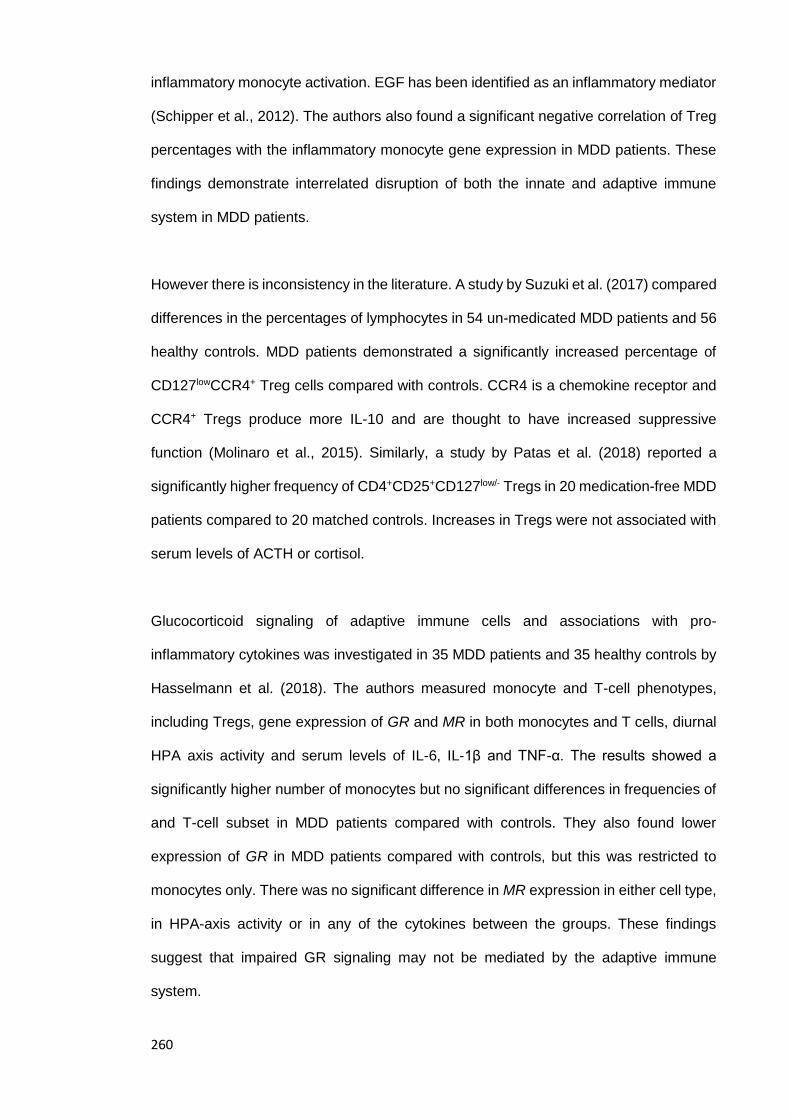
260
inflammatory monocyte activation. EGF has been identified as an inflammatory mediator
(Schipper et al., 2012). The authors also found a significant negative correlation of Treg
percentages with the inflammatory monocyte gene expression in MDD patients. These
findings demonstrate interrelated disruption of both the innate and adaptive immune
system in MDD patients.
However there is inconsistency in the literature. A study by Suzuki et al. (2017) compared
differences in the percentages of lymphocytes in 54 un-medicated MDD patients and 56
healthy controls. MDD patients demonstrated a significantly increased percentage of
CD127lowCCR4+ Treg cells compared with controls. CCR4 is a chemokine receptor and
CCR4+ Tregs produce more IL-10 and are thought to have increased suppressive
function (Molinaro et al., 2015). Similarly, a study by Patas et al. (2018) reported a
significantly higher frequency of CD4+CD25+CD127low/- Tregs in 20 medication-free MDD
patients compared to 20 matched controls. Increases in Tregs were not associated with
serum levels of ACTH or cortisol.
Glucocorticoid signaling of adaptive immune cells and associations with pro-
inflammatory cytokines was investigated in 35 MDD patients and 35 healthy controls by
Hasselmann et al. (2018). The authors measured monocyte and T-cell phenotypes,
including Tregs, gene expression of GR and MR in both monocytes and T cells, diurnal
HPA axis activity and serum levels of IL-6, IL-1β and TNF-α. The results showed a
significantly higher number of monocytes but no significant differences in frequencies of
and T-cell subset in MDD patients compared with controls. They also found lower
expression of GR in MDD patients compared with controls, but this was restricted to
monocytes only. There was no significant difference in MR expression in either cell type,
in HPA-axis activity or in any of the cytokines between the groups. These findings
suggest that impaired GR signaling may not be mediated by the adaptive immune
system.

261
The effects of anti-depressants on Treg populations have also been investigated.
Himmerich et al. (2010) measured Treg frequencies and plasma cytokine levels in 16
patients at the point of referral for a depressive episode. Patients were treated with
different kinds of antidepressant drugs according to their doctor’s choice and, following
six weeks of antidepressant therapy, Treg and cytokine levels were re-assessed, along
with improvements in mood. Results showed that levels of Tregs increased significantly
after antidepressant therapy, whilst depressive symptoms, IL-1β serum levels and LPS-
stimulated IL-1β and IL-6 production decreased significantly. The authors also reported
that whilst change in depressive symptoms was not correlated with change in Tregs, the
more severely depressed the patients were at baseline, the more their Tregs increased.
Following this, Grosse et al. (2015) investigated whether antidepressant therapy was
predictive of clinical response. Leukocyte subsets were examined in 40 medication-free
patients with non-psychotic MDD and 40 matched controls who were recruited to a
randomized double-blind antidepressant trial. Significantly lower levels of Tregs were
found in MDD patients compared with controls, prior to treatment. Following seven
weeks of treatment, a significant and substantial increase in Tregs was observed in MDD
patients and Treg percentages normalised, comparable with controls. However, the
increase in Tregs was not associated with clinical response. A more recent study
including 47 MDD patients who were being treated with antidepressants and 47 controls,
showed that the percentage and absolute count of Tregs were significantly higher in the
medicated, depressed group (Mohd Ashari et al., 2019). However, there was no
association between Treg frequency and severity of depressive symptoms.

262
Table 5.1. Studies examining regulatory T cell levels in people with depression
Author/year Sample Study design Treg
markers
Statistical
analysis,
covariates
Results
Chen et al.
2011
40 MDD patients (25 men, 15
women), mean age 35yr, 30
matched controls
Difference in Tregs and
Th17/Treg ratios between MDD
patients and controls
CD4+
CD25+
FoxP3+
Student’s t-
test
MDD patients showed reduced Tregs and
increased Th17 cells compared with controls
Grosse et al.
2015
40 medication-free inpatients
with melancholic, non-
psychotic MDD (16 men, 24
women) mean age 52yr, 40
matched healthy controls
Differences in percentages of
circulating Tregs between MDD
patients and controls before and
after treatment with either
venlafaxine or imipramine.
CD4+
CD25high
FOXP3+
ANCOVA;
age and sex
MDD patients showed reduced percentages of
Tregs compared with controls before treatment.
Increases in Tregs in MDD patients after
treatment. Treg levels were not predictors of
clinical outcome of treatment.
Grosse et al.
2016
50 MDD patients, mean age
33yr, 58 matched healthy
controls
Differences in levels of
circulating Tregs between MDD
patients and controls and
association with monocyte
activation
CD4+
CD25high
FoxP3+
ANCOVA;
age, gender,
BMI, smoking
Tregs decreased in MDD patients compared
with controls. No difference in MDD patients.
Tregs negatively correlated with inflammatory
monocyte activation in MDD patients.
Himmerich
et al. 2010
16 depressed patients (5
men,11 women), mean age
42yr
Differences in Treg percentages
in MDD patients before and after
antidepressant treatment
CD4+
CD25high
ANOVA Tregs increased and depression scores
decreased after antidepressant therapy.
Li et al. 2010 27 MDD patients (13 men,14
women), mean age 30yrs, 27
matched healthy controls
Differences in levels of
circulating Tregs between MDD
patients and controls
CD4+
CD25+
Student’s t-
test
MDD patients showed significantly decreased
numbers of Treg compared with controls.

263
Table 5.1 continued. Studies examining regulatory T cell levels in people with depression
Author/year Sample Study design Treg markers Statistical analysis,
covariates
Results
Patas et al.
2018
20 un-medicated
MDD patients (9 men,
11 women), mean
age 37yr, 20 matched
controls
Difference in T cell phenotype
and FoxP3 mRNA expression in
purified CD4+ T cells between
MDD patients and controls and
association with ACTH and
cortisol
CD4+
CD25high
CD127low/−
Paired Wilcoxon
signed-rank test,
Spearman’s rank
correlation test
MDD patients showed a significantly higher
frequency of Tregs and increased FoxP3
mRNA expression compared with controls
Suzuki et al.
2017
54 un-medicated
MDD patients (13
men, 41 women),
mean age 34yr, 56
matched controls
Difference in Treg percentage
between MDD patients and
controls and association with
sleep disturbance
CD25+
CD127Low
CCR4+
Student’s t-test
ANCOVA; BMI, age,
sex, batch effects
MDD patients showed a significantly
increased percentage of Tregs compared
with controls. Sleep disturbance not related
to Treg counts
Hasselmann
et al. 2018
34 un-medicated
MDD patients (25
women, 9 men),
mean age 32, 34
matched controls
Difference in monocyte and T cell
phenotype, cell-specific GR and
MR RNA expression, saliva
cortisol rhythm, IL-6, TNF-α and
IL-1β.
CD4+
CD25+
CD127−
Paired samples T-
test, repeated
measures ANOVA,
Spearman’s
correlation
MDD patients had higher frequency of
monocytes and lower GR expression in
monocytes compared to controls. No
difference in Tregs, cortisol, cytokines or
MR expression.
Abbreviations: MDD = major depressive disorder, Tregs = regulatory T cells, ANCOVA = analysis of covariance, BMI = body mass index, mRNA = messenger ribonucleic acid, ACTH = adrenocorticotropic hormone.

264
The exact mechanism by which antidepressants affect Tregs is not yet understood and
further studies investigating Treg function are required. The increase in Tregs during
treatment may explain the observe decrease in cytokines and may be particularly
important for those patients with severe MDD. It is plausible that Treg stimulation could
thus be used as an adjunct treatment of MDD with the aim of reversing inflammatory
activation and low mood.
Summary of evidence
Taken together these findings tentatively suggest that the adaptive arm of the immune
system may play an important role in the aetiology and treatment of MDD. However the
evidence is sparse and findings are inconsistent with some studies suggesting increased
Tregs and some suggesting decreased Tregs in people with depression. There appear
to be links between Tregs and cytokine levels, potentially highlighting a new focus of
research into how immunological pathways interact in the pathophysiology of
depression. Research investigating associations between Tregs and neuroendocrine
function in MDD has only just begun, however so far there is little evidence supporting a
relationship. To date no-one has investigated the association between Tregs and
circulating TNF-α levels, GR and MR sensitivity or diurnal cortisol patterns in depressed
patients.
Therefore, study 1 of this PhD will also investigate the following research questions:
1. Are Treg frequencies different between people with MDD and healthy controls?
2. Are Tregs associated with inflammatory activation or HPA-axis function in MDD?

265
6. Study 1c - The Resist Study results:
Alterations in regulatory T-cells and their association with inflammation and
HPA-axis function in people with depression
6.1 Introduction
In Chapter 6 I will present results from the Resist Study concerning differences in Treg
frequency between people with MDD and healthy controls and associations with both
inflammation and HPA-axis function. Exploring differences in Tregs between depressed
people and healthy controls, and associations with more established depression related
pathways, may teach us about the role of adaptive immunity in the pathophysiology of
depression.
6.2 Hypotheses
Only a small number of studies have explored Treg frequencies in MDD and the findings
are inconclusive. Five studies have reported decreased Tregs in depressed people
compared with controls (Y. Chen et al., 2011;Grosse et al., 2015;Grosse et al., 2016b;Y.
Li et al., 2010) whilst two have reported increased levels of Tregs (Patas et al., 2018;H.
Suzuki et al., 2017) and one has reported no difference (Hasselmann et al., 2018). In
order to address this inconsistency in the literature, we sought to explore differences in
Tregs between depressed people and healthy controls. On the balance of the evidence
to date, we hypothesise that people with MDD will have a significantly decreased
frequency of circulating Tregs compared with healthy controls (hypothesis 1).
To date only three studies have investigated the association between Tregs and
inflammatory activation in MDD, all showing a negative association with increases in pro-
inflammatory cytokines (Y. Chen et al., 2011;Grosse et al., 2016b;Y. Li et al., 2010).
Increases in Tregs following antidepressant therapy have also been associated with

266
decreases in pro-inflammatory cytokines (Himmerich et al., 2010). Only one study has
specifically explored the relationship between Tregs and IL-6, reporting an inverse
association (Grosse et al., 2016b). The relationship between Tregs and TNF-α has not
yet been clarified. Therefore we sought to explore the relationship between Tregs and
both IL-6 and TNF-α. In line with the previous findings regarding Il-6 and on the basis of
our findings from Study 1a regarding TNF-α, we hypothesise that the frequency of
circulating Tregs in people with MDD will be significantly, negatively associated
with inflammatory cytokines (hypothesis 2).
To date only two studies have explored the relationship between Tregs and
neuroendocrine dysregulation in MDD patients. Patas et al. (2018) found no associations
between serum levels of ACTH or cortisol and Tregs and Hasselmann (2018) reported
no difference in GR or MR expression in Tregs between MDD patients and healthy
controls. To date no one has investigated associations between Tregs and either GR
and MR function or diurnal cortisol rhythm in MDD. To address this gap in the literature,
we investigated whether there is any association between Tregs and HPA-axis function
in people with MDD. Based on the robust evidence for disturbed HPA-axis function in
MDD and tentative evidence for reduced Tregs we hypothesise that the frequency of
circulating Tregs in people with MDD will be significantly, negatively associated
with any disturbances in HPA-axis function (hypothesis 3).
6.3 Biological measures
6.3.1 Regulatory T cell determination
Reagents
Phosphate-buffered saline (PBS) (Gibco, pH 7.2, 1 X, 20012027); Ficoll® Paque Plus
(GE Healthcare, 17-1440-02), foetal calf serum (FCS) (Gibco 10270); RPMI 1640

267
medium (Sigma, 500ml, sterile, R8758); penicillin/streptomycin (Sigma, 500ml, sterile,
P4458); HEPES buffer (Fisher BioReagents, 1M solution, pH 7.3, BP299-100); Dimethyl
sulfoxide (Sigma, sterile-filtered, D2650-100ML), LIVE/DEAD Fixable Aqua Dead Cell
Stain Kit, Brilliant Violet 525 (L34965); anti-CD4 Alexa Fluor 700 (Biolegend, 877-246-
5343), anti-CD25 Brilliant Violet 650 (Biolegend, 877-146-5343); FoxP3 PE-Cyanine 7
(eBioscience, 25-4777-41); Foxp3/Transcription Factor Staining Buffer Set (eBioscience,
00-5523-00).
Panel
As mentioned in Chapter 5, Section 5.2, Tregs are characterised by high amounts of
extracellular CD4 and CD25 and intracellular expression of Foxp3, therefore these
markers were chosen to identify Tregs in this study. A fluorochrome-conjugated antibody
panel was created using FluoroFinder, LLC, and is presented in Table 6.1.
Table 6.1. Flow cytometry fluorochrome-conjugated antibody panel.
Laser Filter Marker Fluorochrome
641 730/45 CD4 AF700
405 660/20 CD25 BV650
561 780/60 FoxP3 PE-Cy7
405 525/50 Live/dead BV525
Controls
To ensure the accuracy of our FACS analysis we employed several methodologies
recommended by Tung and colleagues (2007); compensation controls, live/dead
discrimination and fluorescence-minus-one (FMO) controls.

268
Compensation controls: When conducting multi-fluorochrome flow cytometry, the
emission spectra of the various fluorochromes can overlap, resulting in detection in a
different channel, known as ‘spill-over’. In order to control for this, we corrected the
analysis of our FACS data using automatic compensation within FACSDiva software (BD
Biosciences, California, USA). Prior to analysing the samples, automatic compensation
was computed using single stained cells for each antibody used. A negative, unstained
control was also used. This compensation was then applied to the dataset and any
spectral overlap was automatically subtracted from the detected signal. Single cell
staining was only conducted once, prior to full sample analysis.
Live/dead discrimination: Dead cells have greater auto-fluorescence and non-specifically
bind to fluorochrome-conjugated antibodies, potentially leading to false positives.
Therefore it is essential that they are excluded from the analysis. Whilst identification of
dead cells can be partly achieved using a gate, based on forward and side scatter, this
method will not exclude all dead cells. Elimination of dead cells is further improved by
including a ‘live/dead’ stain, which stains dead cells much more brightly than live cells,
making them easier to identify. In this study, a live/dead stain was added to the samples
prior to fixation/permeabilization.
Fluorescence-minus-one (FMO) controls: FMO control is a strategy used to distinguish
between positive and negative cells when using multiple fluorochromes. An FMO control
consists of all the fluorochromes in a panel, minus the one being measured. By including
FMO controls in the analysis, the maximum fluorescence expected for a given subset, in
a given channel, when the fluorochrome-conjugated antibody used in that channel is
excluded, can be calculated. This allows for correct identification of the true upper
boundary for negative cells. Cells from the study sample were used for FMO analysis.
The FMOs used in the study are shown in Table 6.2.

269
Table 6.2. Fluorescence-minus-one (FMO) controls.
Antibody AF700 BV650 PE-Cy7 BV525
CD4 FMO --- CD25 FoxP3 Live/dead
CD25 FMO CD4 --- FoxP3 Live/dead
FoxP3 FMO CD4 CD25 --- Live/dead
Live/dead CD4 CD25 FoxP3 ---
Protocol
In vitro isolation of lymphocytes from human peripheral blood
Following previous plasma separation of the samples, PBS was added to the four
heparin plasma tubes to the 10ml level and inverted several times to mix. 10mls Ficoll-
Paque media was added to two 50ml polypropylene tubes, using a syringe. The diluted
blood sample was carefully layered (20mls) onto the Ficoll-Paque media solution
(10mls), to avoid mixing. The polypropylene tubes were centrifuged (1000 x g, room
temperature, 15 mins) and the upper plasma layer was drawn off using a sterile Pasteur
pipette, leaving the mononuclear cell layer undisturbed at the interface. The cells were
then transferred to a clean 50ml polypropylene tube, using a sterile Pasteur pipette and
PBS was added to a total volume of 50ml. The cells were suspended and re-centrifuged
(500 x g, room temperature, 10 mins). The supernatant was discarded and the cells were
gently re-suspended in 1ml of cold culture fluid (RPMI 1640 medium;
penicillin/streptomycin, HEPES buffer; foetal calf serum) and placed on ice. Viable cells
were then counted in a 1:20 Trypan Blue dilution (10µl cells; 90µl PBS; 100µl 0.4%
Trypan Blue) under a microscope using a hemocytometer. Cells which had excluded the
dye were counted. The cell suspension was then aliquoted into cryovials in volumes to
achieve 10 x 106 cells per vial and culture fluid was added were necessary to achieve a
total volume of 500µl per vial. 1ml of dimethyl sulfoxide was then added to a

270
polypropylene tube with 4mls of culture fluid and the solution was filtered. 500µl of the
solution was slowly added to each cryovial to achieve a final volume of 1ml. Cryovials
were then added to a 1°C/min freezing container (Nalgene® Mr. Frosty) and stored at -
80° for 24 hours, after which they were transferred to liquid nitrogen awaiting analysis.
Cell preparation
FACS analysis was conducted in batches of between 5 and 10 samples. PBMCs were
removed from liquid nitrogen and defrosted in 1ml of 37°C FCS. The cells were then
added to a 15ml polypropylene tube containing 10mls 37°C culture fluid and washed
(500 x g, room temperature, 5 mins). The supernatant was discarded, the cells were re-
suspended in 5ml of culture fluid and the wash was repeated. A final wash in 5mls PBS
was then performed, the supernatant was discarded and the cells were re-suspended.
Viable cells were then counted in a 1:4 dilution with 0.4% Trypan Blue, under a
microscope using a hemocytometer. Cells which had excluded the dye were counted.
The mean number of cells contained per cryovial were 8 x 10⁶.
Cell surface staining for single stain controls
5 x 10⁶ cells per antibody were added to four individual wells in a round bottomed 96 well
Corning® microplate and one labelled for each of the antibodies (CD4, CD25, FoxP3,
live/dead). The plate was then spun (500 x g, room temperature, 5 mins) and the
supernatant was discarded. 3µl of each conjugated antibody was added to
corresponding well with 100µl PBS and mixed. The plate was then wrapped in aluminium
foil and refrigerated for 30 minutes. The plate was then washed twice in 200µl of FACS
buffer (1 X PBS and 2% FCS; 500 x g, 5 mins). 200µl FACS buffer was added to each
control well and the cells were re-suspended, added to labelled 5ml polystyrene FACS
tubes, containing 100µl FACS buffer, covered with aluminium foil and refrigerated,
awaiting analysis.

271
Cell surface staining for viability dye, CD4 and CD25
5 x 10⁶ cells per sample were added to individual wells in a round bottomed 96 well
Corning® microplate for full panel staining. In order to include FMO controls, 5 x 10⁶ cells
per FMO were also added to individual wells. The plate was then spun (500 x g, room
temperature, 5 minutes) and the supernatant was discarded. 3µl of CD4, CD25 and
viability dye conjugated antibodies per sample was added to an Eppendorf 1.5ml
microcentrifuge tube, with 50µl PBS per sample, plus an additional 50µl PBS, and
vortexed. 50µl of the antibody mix was added to each sample well. 3µl of each individual
antibody was added to an Eppendorf 1.5ml microcentrifuge tube for each FMO, minus
the antibody being measured, with 100µl PBS, and vortexed. 50µl of each FMO antibody
mix was added to each FMO well. The plate was then wrapped in aluminium foil and
refrigerated for 30 minutes. The plate was then washed twice in 200µl of FACS buffer (1
X PBS and 2% FCS; 500 x g, 5 minutes). 200µl FACS buffer was added to the FMO
control for FoxP3 well and these cells were re-suspended, added to a 5ml polystyrene
FACS tube, containing 100µl FACS buffer, covered with aluminium foil and refrigerated.
Intracellular staining
Fixation and Permeabilization was conducted according to manufacturer instructions
(eBioscience, California, USA). Foxp3 Fixation/Permeabilization working solution was
prepared by mixing 1 part of Foxp3 Fixation/Permeabilization Concentrate with 3 parts
of Foxp3 Fixation/Permeabilization Diluent. 100µl of the working solution was added to
the sample/FMO wells and the cells were re-suspended, covered with foil and
refrigerated for 30 minutes. A 1X working solution of Permeabilization Buffer was
prepared by mixing 1 part of 10X Permeabilization Buffer with 9 parts of distilled water.
100 µl of Permeabilization Buffer was added to each sample/FMO well and the plate was
then washed (500 x g, room temperature, 5 minutes). The supernatant was discarded
and the wash was repeated. 6µl per sample of FoxP3 antibody was added to an

272
Eppendorf 1.5ml microcentrifuge tube with 200µl Permeabilization Buffer per sample and
vortexed. 100µl of the FoxP3 solution was added to each sample/FMO well, covered with
foil and incubated at room temperature for 30 minutes. 100 µl of Permeabilization Buffer
was added to each sample/FMO well and the plate was then washed (500 x g, 5
minutes). The wash was repeated. The cells were re-suspended in 200µl FACS buffer,
added to 5ml polystyrene FACS tubes, containing 100µl FACS buffer, covered with
aluminium foil and refrigerated, awaiting analysis.
Flow cytometry analysis for identification of Tregs
Stained cells were analysed by four-colour flow cytometry (LSR I, BD Biosciences,
California, USA) and analysed using Flowjo (Tree Star Inc. Ashland, Oregon, USA)
software. We employed a gating strategy to quantify Treg populations as follows:
1. In order to discern between living and dead cells, we first created a Forward Scatter
Area (FSC-A) versus Live/dead stain plot and a region was inserted around the viable
cell population (Figure 6.1(A), R1 - ‘Live cells’).
2. A FSC versus Side Scatter Area (SSC-A) gate was then applied to further identify
viable cells. FSC-A and SSC-A give an estimation of the size and granularity of the
cells respectively, allowing for the additional exclusion of debris and dead cells
(Figure 6.1(B), R2 - ‘Intact cells’).
3. A Side Scatter Width (SCC-W) versus FSC-A gate was then applied to eliminate
doublets (single events that consist of 2 independent cells). Flow cytometry is based
on single cell analysis and doublet discrimination allows for increased accuracy in
determining population frequency. Doublet exclusion can be performed by plotting
the width against the area for FSC and SSC. Doublets will have double width of single

273
cells, whilst the height is approximately the same. Therefore disproportions between
height and width can be used to identify doublets (Figure 6.1(C), R3 - ‘single cells’).
4. A Forward Scatter Height (FSC-H) versus FSC-A was also applied to eliminate
doublets. Doublets have increased area whilst similar height to single cells. Therefore
disproportions between height and area can be used to identify doublets (Figure
6.1(D), R4 - ‘Singlets’).
5. The cells were then gated by their expression of CD4 and CD25 to identify
CD4+CD25+ cells (Figure 6.1(E), R5 - ‘CD4+CD25+’).
6. Finally, the expression of FoxP3 was gated on CD4+CD25+cells to identify
CD+CD25+FoxP3 Tregs (Figure 6.1(F), R6 - ‘FoxP3’).
The final measure determines the percentage of CD4+CD25 T cells which co-express
FoxP3.

274
A) live cells were identified based on live/dead stain; (B) intact cells were selected based on forward and side scatter; (C) single cells were selected based on forward scatter area and side scatter width; (D) singlets were identified based on forward scatter area and forward scatter height; (E) T cells co-expressing CD4 and CD25 are shown; (F) expression of FoxP3 for a healthy control (n=179).
Figure 6.1. Flow cytometry gating strategy for Tregs.

275
6.4 Statistical analysis
The Frequency of Parent statistic was calculated in FlowJo (Tree Star Inc. Ashland,
Oregon, USA) to determine the percentage of CD4+CD25+ T cells represented by FoxP3
Tregs. Frequency of Parent is calculated by dividing the number of cells in the
subpopulation by the number of cells in its direct ancestor population.
Kolmogorov-Smirnov tests revealed that Treg frequency was normally distributed and
Levene’s test revealed that homogeneity of variance was equal for the groups.
Differences in Treg frequency between the groups were conducted using Independent
Samples T-tests. Pearson’s R correlations and Spearman’s correlations were used to
ascertain whether there was any association between Treg frequency and inflammatory
and HPA-axis pathways. One-way ANOVAs with Gabriel comparisons were used in
sensitivity analyses to explore the impact of childhood sexual abuse. All inferential
statistical analyses were performed using SPSS version 22.0 (SPSS Inc., Chicago,
Illinois, USA).
6.5 Results
6.5.1 Participants
Tregs were successfully isolated from 36 people with MDD and from 31 healthy controls.
The sociodemographic and clinical characteristics of the participants did not differ from
those reported in Chapter 3, Section 3.5.1, so are not presented again here.

276
6.5.2 CD4+CD25+FoxP3+ Treg frequency
The percentage of CD4+CD25+ cells expressing FoxP3 was compared between the
groups. There was no significant difference in Tregs between people with MDD and
healthy controls (t(65) = -0.364, p = 0.717) (Figure 6.2, striped bar represents people
with MDD).
People with MDD (n=36) healthy controls (n=31). Data shown are percentage of CD4+CD25+T cells, presented as mean ± SD.
6.5.3 Correlations with inflammatory biomarkers
To explore the relationship between Tregs and inflammatory activation, correlations
between variables were examined. Correlations are presented in Table 6.3. There were
no significant associations between Treg frequency and any of the other biological
variables. The only association to approach significance was with the CAR in healthy
controls (p = 0.078), suggesting that as Tregs increase, CAR values may also increase.
Figure 6.2. The frequency of peripheral CD4+CD25+FoxP3 Treg cells in healthy
controls and people with MDD.

277
Table 6.3. Correlations between Tregs, and inflammatory biomarkers/HPA-axis
parameters in people with MDD and healthy controls
Frequency of CD4+CD25+FoxP3 Tregs
MDD Healthy controls
Correlation coefficient
p-value Correlation coefficient
p-value
Inflammation
IL-6 0.071 0.680 0.098 0.601
TNF-α 0.138 0.421 0.139 0.455
Corticosteroid receptor function
DEX IC50 -0.043 0.842 0.101 0.604
PRED IC50 0.026 0.925 -0.254 0.401
Diurnal saliva cortisol
CAR 0.072 0.777 0.386 0.084
CAR AUC -0.123 0.518 0.245 0.208
AUC -0.133 0.492 -0.232 0.254
Cortisol slope -0.117 0.538 0.202 0.302
Abbreviations: MDD = major depressive disorder; IL-6 = interleukin 6; TNF-α = tumour necrosis factor alpha; DEX = dexamethasone, PRED = prednisolone, CAR = cortisol awakening response, AUC = area under the curve.
6.5.4 Sensitivity analyses
Depressive symptom severity
Exploratory analyses were conducted in order to identify whether any differences
between the groups emerged when the analysis was restricted to people with
moderate/severe depressive symptoms only. The main analysis was repeated following
the removal of those participants who were classified as experiencing mild depressive
symptom according to the BD-II. 11 people had mild baseline depressive symptoms
(score <20) and were removed from the analysis, resulting in a reduced MDD sample of
25 people with moderate to severe symptoms. Results showed that symptom severity
did not have an impact on the results. There was no significant difference in Tregs

278
between people with moderate/severe MDD and healthy controls (t(54) = -0.458, p =
0.649).
Antidepressant use
Little is known about the effects of anti-depressants on Treg populations. Therefore, I
ran exploratory analyses to determine whether there was any difference in Treg
frequency between depressed people taking antidepressants and depressed people who
were antidepressant free. Results showed that there was no difference in Treg frequency
between the groups (t(34) = -1.232, p = 0.226).
6.6 Discussion
6.6.1 Aims and hypotheses
The aim of this study was to compare differences in Tregs in depressed people
compared with healthy controls. I also sought to explore whether there are any
associations between Tregs and both inflammatory and neuroendocrine function. I
hypothesised that people with MDD would have significantly decreased frequency of
circulating Tregs compared with healthy controls (hypothesis 1). I also hypothesised that
the frequency of circulating Tregs in people with MDD would be significantly, negatively
associated with inflammatory cytokines (hypothesis 2) significantly associated with HPA-
axis function (hypothesis 3).
6.6.2 Summary of results
The results of this study do not provide support for these hypotheses. There was no
significant difference in circulating Tregs in depressed people compared to controls.
Sensitivity analysis, restricting the depressed sample to only those with moderate/severe

279
symptoms had no effect on the findings. Additional analyses examining the use of
antidepressants also showed no effect on the results. There were no significant
associations between circulating Tregs and inflammatory biomarkers and no significant
associations between circulating Tregs and HPA-axis function. I will discuss possible
explanations for these findings in the following sections.
6.6.3 Hypothesis 1: Differences in Tregs
According to our results the number of CD4+CD25+FoxP3+ cells in the PBMCs from
MDD patients was comparable to that from healthy controls, suggesting that there is no
significant decrease in the frequency of circulating Tregs in MDD. Our findings support
those of Hasselmann et al. (2018) who also reported no differences in Tregs between
antidepressant-free MDD patients and controls. However, this is in contrast to several
studies which have shown reduced Treg frequency in depressed people (Y. Chen et al.,
2011;Grosse et al., 2015;Grosse et al., 2016b;Y. Li et al., 2010). However there are also
inconsistencies in the literature with increased Treg frequency also being reported
(Patas et al., 2018;H. Suzuki et al., 2017).
The inconsistency in the literature may be attributed to variation in Treg markers. Some
studies defined Treg cells solely on the expression of the cell surface proteins and did
not include the classic intracellular marker of Treg cells, FoxP3 (Himmerich et al.,
2010;H. Suzuki et al., 2017). Furthermore there are inconsistencies in the choice of
cellular markers used, with some studies using additional activation markers, such as
CD127 (Hasselmann et al., 2018;Patas et al., 2018;H. Suzuki et al., 2017) and CCR4
(H. Suzuki et al., 2017). In the current study we focused on CD4, CD25 and FoxP3, which
are largely acknowledged to identify the major population of Treg cells (Plitas &
Rudensky, 2016).

280
However, CD4+CD25+FoxP3 Tregs are both phenotypically and functionally
heterogeneous and inclusion of co-stimulatory/co-inhibitory molecules may help further
identify functionally suppressive Tregs (X. Chen & Oppenheim, 2011). As such our null
finding may reflect insufficient Treg characterisation. However, several studies have
reported Treg reductions in MDD using the same classification as in the current study
(Y. Chen et al., 2011;Grosse et al., 2015;Grosse et al., 2016b). Tregs are a very active
area of research, and additional targets are still emerging (X. Chen & Oppenheim, 2011).
As a definitive molecular marker for Treg cells has yet to be elucidated, future studies
should incorporate functional analyses of the suppressive capacity of Tregs in order to
better determine their role in MDD.
To date, depressive symptom severity in relation to circulating Tregs has only been
explored in two studies. Himmerich et al. (2010) reported that baseline levels of Tregs
did not differ between those with mild symptoms and those with moderate to severe
symptoms. Mohd Ashari et al. (2019) also reported that depressive symptoms scores
were not correlated with Treg percentage or number in antidepressant treated MDD
patients. To explore any influence of symptom severity in the current study, secondary
analysis was conducted with a subset of depressed individuals who had moderate to
severe baseline depressive symptoms (score >20) (n=25). Results showed that there
was no change in the findings, with no significant difference in Tregs between the groups
(p = 0.649).
More conclusive findings have come from studies investigating the effects of
antidepressant therapy on Treg levels. Himmerich et al. (2010) found that Tregs
increased significantly during antidepressant treatment. Furthermore, the more severely
depressed the patients were at baseline, the more their Tregs increased. This finding
was replicated by Grosse et al. (2015) and Mohd Ashari et al. (2019) who also reported
that the percentage and absolute count of Tregs were significantly higher in depressed
people following antidepressant therapy. These findings are in line with those from

281
studies investigating autoimmune diseases, in which Tregs have been shown to increase
in patients responding to anti-inflammatory therapy (Boissier et al., 2009). However the
mechanism of action of antidepressants remains incompletely understood.
Antidepressants may activate Tregs in patients with MDD, restoring immune balance,
halting the inflammatory process and thereby reducing depressive symptoms.
Alternatively, antidepressants may influence Tregs indirectly, via their effects on cytokine
production. As discussed in Chapter 1, Section 1.4.3, antidepressants have been shown
to reduce pro-inflammatory cytokines such as IL-6 (Hiles et al., 2012a;Kohler et al.,
2018;Wiedlocha et al., 2018) and TNF-α (Kohler et al., 2018) and the activity of Tregs
can depend highly on the influence that these cytokines have on their differentiation,
maintenance and function (La Cava, 2008). IL-6 completely inhibits the generation of
Tregs (Bettelli et al., 2006) and reduces their suppressive effect (Wan et al., 2007) and
TNF-α has been shown to have both inhibitory effects (Valencia et al., 2006) and
stimulatory effects (X. Chen et al., 2007) depending on the expression of the TNF-α
receptors TNRF1 and TNFR2. In order to explore whether Treg frequency in people with
MDD varied according to antidepressant treatment in the current study, we conducted a
sensitivity analysis. The results showed no difference between those who were taking
antidepressants and those who were not (p = 0.226).
One possible explanation for the inconsistency in the findings regarding Treg frequencies
in MDD is the variability in markers used to characterise Treg populations. Some studies
rely only on the cell surface markers CD4 and CD25 (Himmerich et al., 2010;Li et al.,
2010;Patas et al., 2018;Suzuki et al., 2017) others include FoxP3 (Y. Chen et al.,
2011;Grosse et al., 2015;Grosse et al., 2016) and others include additional markers such
as CD127 (Hasselmann et al., 2018;Patas et al., 2018;H. Suzuki et al., 2017) and CCR4
(H. Suzuki et al., 2017). In the present study we characterised Tregs as
CD4+CD25+FoxP3 T cells. Ideally a common measure of Treg frequency would be used,
however in the absence of a consensus regarding Treg characterisation this is difficult.
This creates a challenge in this field of research.

282
6.6.4 Hypothesis 2: Relationships with inflammatory biomarkers
We did not observe a correlation between Tregs and pro-inflammatory cytokines. This is
contrast to findings from several studies which have reported a link between Tregs and
inflammatory activation (Y. Chen et al., 2011;Grosse et al., 2016b;Himmerich et al.,
2010;Y. Li et al., 2010). Li et al. (2010) reported decreases in Tregs and the anti-
inflammatory cytokines, IL-10 and TGF-β and increases in the pro-inflammatory
cytokine, IL-2, in MDD patients compared with controls. They also reported that in the
overall sample, Tregs were correlated with inflammatory cytokines. Chen et al. (2011)
found significantly higher Th17 cells, which produce the pro-inflammatory cytokines IL-
17, IL-21 and IL-22, and significantly lower Tregs, in MDD patients compared with
controls. This suggests that the balance between inflammation and regulation was tilted
towards an inflammatory state. Studies have shown that Th17 cell differentiation requires
both TGF-β and IL-6 (McGeachy et al., 2007), however the effect of TGF-β appears to
be dose-dependent, with very low concentrations resulting in Th17 cells and high
concentrations promoting production of Tregs (L. Zhou et al., 2008). Increased levels of
plasma/serum IL-6 have been robustly reported in people with MDD (Hiles et al., 2012b),
whilst the anti-inflammatory cytokine TGF-β1 is significantly lower in depressed patients
compared with controls (Musil et al., 2011;Levent Sutcigil et al., 2008). Therefore it has
been hypothesised that the cytokine milieu in MDD is favoured towards the development
of Th17 cells and the inhibition of Tregs (Y. Chen et al., 2011). Grosse et al. (2016b)
found that MDD patients aged ⩾ 28 years demonstrated decreased Tregs and this was
correlated with increased inflammatory monocyte gene expression (IL-6, IL-1β and TNF-
α). Tregs have also have also been shown to be increased following antidepressant
treatment in conjunction with decreases in IL-6 and IL-1β (Himmerich et al., 2010). Taken
together these findings show that impaired immune suppression and inflammatory
activation co-occur in the same depressed patients and suggest that Treg deficiency may
contribute to the inflammatory dysregulation observed in MDD.
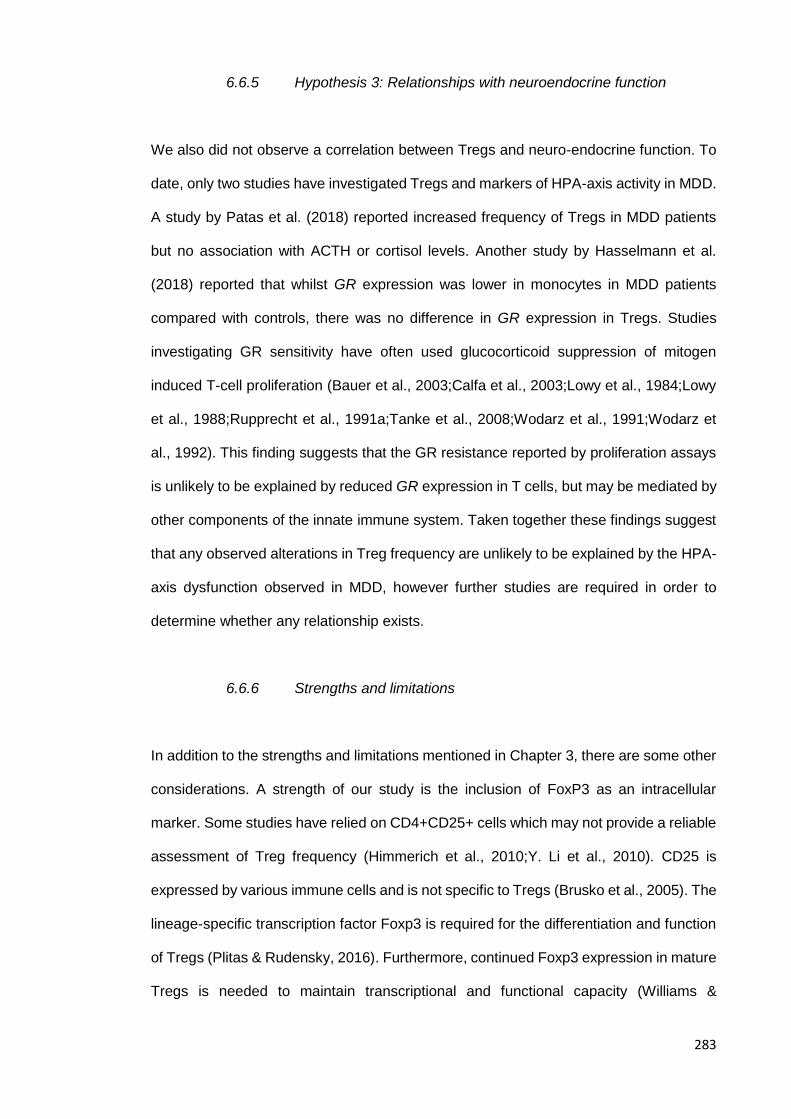
283
6.6.5 Hypothesis 3: Relationships with neuroendocrine function
We also did not observe a correlation between Tregs and neuro-endocrine function. To
date, only two studies have investigated Tregs and markers of HPA-axis activity in MDD.
A study by Patas et al. (2018) reported increased frequency of Tregs in MDD patients
but no association with ACTH or cortisol levels. Another study by Hasselmann et al.
(2018) reported that whilst GR expression was lower in monocytes in MDD patients
compared with controls, there was no difference in GR expression in Tregs. Studies
investigating GR sensitivity have often used glucocorticoid suppression of mitogen
induced T-cell proliferation (Bauer et al., 2003;Calfa et al., 2003;Lowy et al., 1984;Lowy
et al., 1988;Rupprecht et al., 1991a;Tanke et al., 2008;Wodarz et al., 1991;Wodarz et
al., 1992). This finding suggests that the GR resistance reported by proliferation assays
is unlikely to be explained by reduced GR expression in T cells, but may be mediated by
other components of the innate immune system. Taken together these findings suggest
that any observed alterations in Treg frequency are unlikely to be explained by the HPA-
axis dysfunction observed in MDD, however further studies are required in order to
determine whether any relationship exists.
6.6.6 Strengths and limitations
In addition to the strengths and limitations mentioned in Chapter 3, there are some other
considerations. A strength of our study is the inclusion of FoxP3 as an intracellular
marker. Some studies have relied on CD4+CD25+ cells which may not provide a reliable
assessment of Treg frequency (Himmerich et al., 2010;Y. Li et al., 2010). CD25 is
expressed by various immune cells and is not specific to Tregs (Brusko et al., 2005). The
lineage-specific transcription factor Foxp3 is required for the differentiation and function
of Tregs (Plitas & Rudensky, 2016). Furthermore, continued Foxp3 expression in mature
Tregs is needed to maintain transcriptional and functional capacity (Williams &

284
Rudensky, 2007). It is therefore essential to include CD4+CD25+FoxP3 Tregs in order
to ensure reliable measurement of functional Tregs.
There are also limitations to this study. First, we did not collect data on physical activity,
a lack of which can have negative consequences on immune function (Irwin & Miller,
2007). In addition we did not collect data on diet, which has also been shown to influence
Tregs, particularly vitamins A and D, gluten, fatty acids and probiotics (Issazadeh-
Navikas et al., 2012). Finally, we did not collect longitudinal data on Tregs due to financial
and time constraints and so were unable to investigate any changes in Tregs over time.
We explored whether our null finding might be explained by a lack of power. Previous
studies have used sample sizes ranging from 20-50 participants in each group, which is
line with our sample size. However as discussed above comparisons between findings
from these studies is difficult as it is unclear whether in fact they are measuring the same
cell populations. We therefore conducted a post-hoc power analysis to calculate the
sample size we would need to show a significant difference considering the effect size
we observed. The result suggested we would need a sample size of 3,086 to observe a
statistical difference, given an alpha of 0.05 and 80% power. This very large number
suggests that even though our sample size was fairly small, a reasonable increase would
not have impacted on the findings. This provides support for the argument that this
finding was a genuine null effect, and that the difference in Tregs between the groups
was negligible. Furthermore, the correlations between Tregs and inflammatory cytokines
were in the opposite direction to our hypothesis, making it very unlikely that a larger
sample would have shown the predicted negative association.
It is also worth noting that future studies should incorporate measures of cytokine
signalling in Tregs, such as the TNF receptors, TNFR1 and TNFR2. All human Tregs
express TNFR2 and at a much higher density than TNFR1 (Faustman & Davis, 2013).
CD4+CD25hi Tregs express the highest level of TNFR2, thus TNF is likely to activate

285
more functionally suppressive Tregs (Chen & Oppenheim, 2010). TNFR2 + Tregs are
highly suppressive in vitro, whereas TNFR2- Tregs have minimal suppressive function.
There is evidence from animal models that TNFR2 signalling promotes Treg activity.
TNFR2 activates and induces proliferation of Tregs (Chen et al., 2007) and TNFR2
expression indicated maximally suppressive Tregs in a mouse tumour model (Chen et
al., 2008). In a clinical trial of Type 1 diabetes, TNF-α agonists increased Treg production
(Faustman et al., 2012), however to date, TNF-α receptor expression on Tregs in patients
with depression has not been investigated.
6.6.7 Conclusion
In conclusion, these results indicate that there is no difference in Treg frequency between
people with MDD and healthy controls. Furthermore we found no evidence of any
relationship between Treg frequency and either inflammatory cytokines or markers of
HPA-axis function. Further studies using functional analyses of the suppressive capacity
of Tregs are required to explore their role in MDD.

286
7. Literature review: Understanding depression and inflammation in
cardiovascular disease mortality
7.1 Introduction
In this chapter I will define and describe the pathology and prevalence of CVD. I will then
provide evidence for depression as a risk factor for both CVD morbidity and mortality.
Following this I will describe the literature regarding current understandings of the
biological mechanisms linking depression and CVD, with a focus on the role of
inflammation. The aim of this chapter is to highlight the importance of depression in CVD
progression and prognosis and to try to shed some light on the role of inflammation as a
contributory factor. This chapter will also highlight some of the limitations of the work to
date.
7.2 Cardiovascular disease: pathogenesis and prevalence
7.2.1 Pathogenesis
Cardiovascular diseases (CVDs) are a group of disorders of the circulatory system and
include coronary heart disease (CHD; a disease of the blood vessels supplying the heart
muscle) and cerebrovascular disease (a disease of the blood vessels supplying the
brain). The main underlying pathological process in CVD is atherosclerosis, the
development of atheromatous plaques in the inner lining of the arteries (Hansson &
Hermansson, 2011). Historically, atherosclerosis was considered to be solely due to the
accumulation of fatty deposits in the arterial wall. However it is now acknowledged that
it is a complex disease characterized by intense immunological activity both at the
beginning of plaque formation through to the occurrence of an acute event resulting from
plaque erosion or rupture (Hansson & Libby, 2006;Pant et al., 2014). Whilst
atherosclerosis accumulates over the lifespan, global comparative risk assessment

287
studies have estimated that approximately 80% of deaths from CHD and nearly 70% of
deaths from stroke in the world were attributable to a small number of physiological and
behavioural risk factors, including hypertension, dyslipidaemia, smoking, high BMI,
alcohol use, low intake of fruits and vegetables and lack of physical inactivity (Ezzati et
al., 2003).
Box 1 shows the normal artery and boxes 2-4 show the progression of atherosclerosis. Adapted from Libby, Ridker & Hansson (2011)
The changes that occur in the artery during disease progression are illustrated in Figure
1. The artery is made up of three layers (See Figure 7.1, Box 1). The inner layer is the
intima and consists of a layer of endothelial cells. The middle layer is the media and
consists of vascular smooth muscle cells (VSMCs). The outer layer is the adventitia
which contains mast cells, nerve endings and microvessels. Atherogenesis is thought to
begin with alterations in the layer of endothelial cells in the intima (See Figure 7.1, Box
2). Hypercholesterolemia, hypertension and pro-inflammatory mediators can cause
activation of the endothelium and an inflammatory response in the artery wall. Activated
Figure 7.1.Stages in the development of atherosclerosis

288
endothelial cells, which usually resist attachment of passing white blood cells, express
leucocyte adhesion molecules. These adhesion molecules cause the passing white
blood cells to adhere to their surface. The captured cells, predominantly monocytes, then
migrate into the intima, where they mature into macrophages. At the same time, the
permeability of the endothelium increases, allowing low-density lipoprotein (LDL)
particles to cross into the artery wall. The macrophages then ingest the LDL particles
and become foam cells. Plaque formation also involves proliferation of SMCs in the
intima and additional recruitment of SMCs from the media (See Figure 7.1, Box 3). The
SMCs then synthesise collagen, elastin and proteoglycans which form the extracellular
matrix and form a fibrous cap that covers the plaque. Within the plaque, some of the
foam cells die and some release lipids. The accumulation of dead cells and lipids form a
lipid-rich necrotic core. The clinical consequences of plaque formation occur due to flow-
limiting stenosis (narrowing of the lumen), that in turn results in tissue ischaemia. If a
plaque ruptures it can trigger a thrombosis at the surface, which can interrupt blood flow
locally or detach to become an embolus and lodge in distal arteries (See Figure 7.1, Box
4). Furthermore, plaque rupture can result in the release of the pro-coagulant material in
the plaque's core, causing an increase in platelet aggregation, humoral coagulation and
formation of a thrombus. Ischemia can have life threatening consequences. If it occurs
in the coronary artery it can result in myocardial infarction (MI) and in the brain it can
result in ischemic stroke (Libby et al., 2011) (Hansson, 2005).
7.2.2 Prevalence
According to the World Health Organisation, CVD is the leading cause of death globally
(2017a). There were an estimated 17.9 million CVD related deaths in 2016, representing
31% of all deaths worldwide. Of those deaths, 85% were due to MI and stroke. In the UK
approximately 7 million people are living with CVD and CVD related deaths cause 25%
of all deaths each year (The British Heart Foundation, 2018). Healthcare costs relating
to CVD are estimated at £9 billion each year and costs to the UK economy is estimated

289
to be £19 billion annually (ibid). CHD is the one of the UK’s leading causes of death and
recent estimates reveal that it is responsible for over 66,000 deaths in the UK each year
(ibid). In the UK, one in seven men and one in twelve women die from CHD and it kills
more than twice as many women in the UK as breast cancer (ibid). Since the 1960s the
UK death rate from CVD has declined by more than 75% and the annual number of CHD
deaths in the UK has fallen by more than 50% (ibid). These reductions are largely
attributable to improvements in medical treatment and a reduction in risk factors,
particularly improvements in the management of hypertension (O'Flaherty et al., 2013).
Decreases in other CVD risk factors such as cholesterol, smoking and physical activity
are far more modest and are counteracted by increases in obesity and type 2 diabetes.
7.3 Depression and cardiovascular disease: Introduction
As mentioned in the previous section, there are a number of well-established risk factors
for CVD. More recently, a multitude of studies have confirmed an independent
association between depression (defined here as either MDD or significant depressive
symptoms with substantial functional impairment) and CVD. Depression is robustly
shown to increase cardiovascular risk (Correll et al., 2017;Cuijpers & Smit, 2002;Gan et
al., 2014;Nicholson et al., 2006;Rugulies, 2002;Van der Kooy et al., 2007;Q. Wu & Kling,
2016;Wulsin & Singal, 2003) and people with established CVD are more likely to
experience depressive episodes (Carney & Freedland, 2008;Thombs et al., 2006). In this
section, I will review the epidemiological evidence linking these two disorders before
moving on to discuss potential underlying mechanisms.
7.4 Depression in patients with existing cardiovascular disease
Depression is also common and persistent in people with established CVD. Depressive
symptoms occur in approximately 1 out of every 5 patients, a prevalence that is at least
3 times greater than in the general population (B. E. Cohen et al., 2015). Lane et al.

290
(2002) assessed the prevalence and persistence of symptoms of depression in 288
patients during the first 12 months following acute MI. Elevated depressive symptoms
were reported in 31% of patients during hospitalisation, in 38% four months later and in
37% 12 months later. A cross-sectional study of 1,024 patients with stable CHD showed
that 20% had elevated depressive symptoms (Ruo et al., 2003). A systematic review of
studies examining depression following acute MI, including data on more than 14,000
patients, confirmed this finding (Thombs et al., 2006).
A meta-analysis of 16 studies, involving 10,175 post-MI patients, investigated to what
extent depression independently predicts prognosis (Meijer et al., 2013). The association
between depression and cardiac events was partly attenuated after adjustment for
disease severity and health variables. However, after full adjustment for age, gender,
smoking, diabetes, BMI, history of MI, left ventricular ejection fraction (LVEF), and Killip
class, depressive symptoms were still associated with a 13% increased risk of future
cardiac events.
CVD severity is also associated with depression. LVEF, a measure of how much blood
is expelled from the left ventricle on each contraction (commonly expressed as a
percentage), was assessed alongside depressive symptoms in 1,989 MI patients (van
Melle et al., 2005). During hospitalisation, depressive symptoms was higher in patients
with LVEF dysfunction and lower LVEF was independently associated with a higher rate
of depression from 3-12 months following MI. Depressive symptoms are also strongly
associated with patient-reported health status, including symptom burden, physical
limitation, quality of life, and overall health, even after accounting for objective measures
of cardiac function in patients with CHD (Ruo et al., 2003).
Patients with comorbid CVD and depressive symptoms are at increased risk for recurrent
cardiovascular events and mortality. Meta-analyses have reported that depressed
patients are twice as likely to die or suffer future major cardiovascular events compared

291
with non-depressed (Barth et al., 2004;Meijer et al., 2011;Nicholson et al., 2006;van
Melle et al., 2004). Furthermore, a dose-response relationship has been observed
between depression symptoms during post-MI hospitalization and cardiac mortality
(Lesperance et al., 2002). Patients with higher baseline depression scores had worse
long-term cardiac prognosis regardless of symptom changes. Post-stroke depression
has also been associated with increased mortality (Bartoli et al., 2018;Cai et al., 2019).
Depression has been shown to increase incident heart failure (HF) in CVD patients as
well as increased hospitalisation in patients with established HF (Freedland et al.,
2011;Rutledge et al., 2006). A meta-analysis of 36 publications reported the presence of
clinically significant depression in 21.5% of HF patients (Rutledge et al., 2006).
Moreover, depressed HF patients demonstrate higher rates of death and secondary
events, increased health care use, and higher rates of hospitalization (Fan et al.,
2014;Jiang et al., 2001;Rutledge et al., 2006). Functional severity of heart failure is also
associated with depression. In a study including 682 hospitalised patients with chronic
HF, prevalence ranged from as low as 8% among patients with no limitation of physical
activity to as high as 40% among patients unable to carry on any physical activity without
discomfort (Freedland et al., 2003). Among patients undergoing coronary artery bypass
graft (CABG) surgery, depression is associated with prolonged hospitalisation
(Beresnevaitė et al., 2010), progression of CVD (Wellenius et al., 2008) and mortality
(Blumenthal et al., 2003). Depression also independently predicts mortality in patients
with an implantable cardioverter-defibrillator (van den Broek et al., 2013).
Depressive symptoms are even more prevalent in stroke survivors. A systematic review
and meta-analysis of 61 studies reported that 31% of stroke survivors experience
depression (Hackett & Pickles, 2014). The authors also report that depressive symptoms
resolve spontaneously within a few months of onset for most patients, with few receiving
any antidepressant treatment. A more recent meta-analysis and meta-regression

292
including 128 studies showed that depression was present in 33.5% of people after
stroke (Mitchell et al., 2017).
Despite improvements in medical treatment, intervention and care over the last 25 years,
the association between post-MI depression and mortality is stable (Meijer et al., 2011).
Faced with a wealth of studies exploring this relationship, the American Heart
Association conducted a systematic review on depression and adverse medical
outcomes after acute coronary syndrome (ACS), including 53 studies and 4 meta-
analyses (Lichtman et al., 2014). On the strength and consistency of the evidence
examined, they issued a scientific statement elevating depression to the status of a risk
factor for adverse medical outcomes in patients with ACS.
The association between depression and CVD is both complex and bidirectional (Lippi
et al., 2009). When depression and CVD present together, the prognosis for both
worsens (Dhar & Barton, 2016). Polsky et al. (2005) examined the risk of developing
significant depressive symptoms after a new medical diagnosis of various long term
conditions, including cancer, diabetes, hypertension, CHD, arthritis, chronic lung disease
and stroke. After eight years of follow-up, patients with CHD had consistently higher risk
of developing depression than those with other diagnoses. Kendler et al. (2009)
conducted a time-dependent analysis to clarify the causal relationship between MDD
and CHD in a large population-based sample of older, Swedish twins. They reported that
the risk of depression following CHD onset was greater than the risk of CHD following
MDD. The future risk for CHD was also strongly related to the severity and recurrence of
MDD. In contrast it has been shown that although depression may be triggered by CVD,
the adverse outcomes associated with depression are not explained by CVD severity
(Diez Roux et al., 2006;Lett et al., 2008).

293
7.5 Depression as a cardiovascular risk factor
Over 100 studies and eight meta-analyses have demonstrated that people with
depression are at increased cardiovascular risk compared to the general population
(Correll et al., 2017;Cuijpers & Smit, 2002;Gan et al., 2014;Nicholson et al.,
2006;Rugulies, 2002;Van der Kooy et al., 2007;Q. Wu & Kling, 2016;Wulsin & Singal,
2003). Nicholson et al. (2006) conducted a meta-analysis of 21 aetiological studies,
measuring depression with follow-up for fatal CHD/incident MI. The analysis included
124,509 participants and 416 cardiac events over a mean follow-up period of 10.8 years.
The results showed that people with depression had an 80% increased risk of developing
CHD. However lack of adjustment for confounding variables such as lifestyle and socio-
demographic factors, means that this result is likely to be an overestimation.
Findings from more recent meta-analyses of prospective cohort studies support an
association between depression and CVD risk. Gan et al. (2014) conducted an analysis
of 30 studies, including 893,850 participants and reported that individuals with
depression had a 30% increased risk of for CHD compared with non-depressed people.
This association remained significant after adjustment for confounders. Similarly,
another meta-analysis of 19 studies including 323,709 participants, reported that
depression was associated with a 31% increase in the risk of MI and a 36% increase in
the risk of coronary death (Q. Wu & Kling, 2016).
The most comprehensive large‐scale meta-analysis to date assessed the worldwide
prevalence and incidence of CVD in people with specific severe mental illness (Correll
et al., 2017). The analysis included 3,211,768 patients and 113,383,368 controls. CVD
prevalence was 11.7% in MDD patients and MDD was significantly associated with CVD
and CHD after adjusting for potential confounders. People with MDD also had a 72%
increased risk of CVD and a 63% increased risk of CHD and CVD related mortality.

294
Many studies have specifically reported an association between depressive symptoms
and CVD mortality in older people. Vinkers et al. (2004) followed 500 people, 85 years
and over, from the population-based Leiden 85-plus Study, for three years. Depression
was independently associated with a two-fold increase of all-cause mortality. Both CVD
mortality and non-CVD mortality contributed equally to the increased risk. Depressed
mood was also associated with an increased risk of CVD mortality in 3,701 men aged >
70 years in the US (B. W. Penninx et al., 1998), chronic depression was associated with
all-cause mortality in 1,784 older men and women in Taiwan (Teng et al., 2013) and both
moderate and severe depression predicted mortality in 3,746 non-demented older
community-living persons in Amsterdam (Schoevers et al., 2009). A meta-analysis of 52
studies, including 47,625 older people found that people with depressive symptoms had
a higher risk of stroke and all-cause mortality but not of MI (Eurelings et al., 2018).
However, these findings are not entirely consistent, with some studies reporting no
association (Callahan et al., 1998;Cuijpers, 2001;Hybels et al., 2002;McCusker et al.,
2006).
Evidence also extends to subclinical CVD processes such as peripheral atherosclerosis
(Seldenrijk et al., 2010), impaired endothelial function (van Dooren et al., 2016) and
increased arterial stiffness (M. Hamer et al., 2010;Seldenrijk et al., 2011). There is also
an association between lower, sub clinical symptoms of psychological distress and CVD
mortality in healthy people. A meta-analysis of 10 large prospective cohort studies from
the Health Survey for England, measured psychological distress in 68,222 participants
and followed them over 8 years (Russ et al., 2012). The authors observed a dose-
response relationship between psychological distress and mortality across the full range
of severity. Sub-clinically symptomatic patients had a 29% increased risk of CVD related
death and a 20% increased risk of all-cause mortality. This association remained after
adjusting for age, sex, SES, BMI, systolic blood pressure, physical activity, smoking
status, alcohol consumption and diabetes at baseline.

295
Finally, there is evidence that this relationship is bi-directional. A history of CVD can
increase the risk of developing depressive symptoms and clinical disorders, either
directly through physiological outcomes or indirectly via biological and psychosocial
modifications (B. W. Penninx, 2016). Comparatively few studies have investigated the
role of CVD in increasing the risk of depression. A Swedish study including 30,374 twins
reported that onset of CAD predicted concurrent and ongoing risk for depression
(Kendler et al., 2009). Furthermore, the effect of CAD onset on MDD risk was much
stronger than the reverse. There is also a high prevalence of depressive symptoms
following acute MI, which persist over time (Lauzon et al., 2003). Therefore, the
association between depression and CVD can be best considered a metaphorical
‘downward spiral’ in which depression and cardiovascular disease exist in a mutually
reinforcing relationship (B. W. Penninx, 2016).
7.6 Mechanisms linking depression to CVD
In light of the strength of evidence described in the previous section, it is clear that CVD
and depression are linked. However the definitive, underlying mechanisms associating
the two disorders have yet to be fully elucidated, making targeted pharmacological,
psychological and preventative interventions impossible (Halaris, 2013a). The difficulty
in identifying these mechanisms is due to the complex interactions between
psychological factors such as health behaviours and social isolation, and several
biological factors such as abnormalities in the autonomic nervous system, the vascular
and hematologic systems, the neuroendocrine system and the immune system,. Based
on the current literature, inflammation emerges as the dominant protagonist, involved in
all stages of CVD progression and a robust biomarker of clinical depression.
This section will briefly describe the main behavioural and biological underpinnings of
the co-morbidity between depression and CVD. However it is beyond the scope of this
thesis to provide a comprehensive discussion of available clinical and research data for

296
each of the mechanisms presented. In the following section, the specific role of
inflammation will be described in more detail.
7.6.1 Behavioural and psychosocial factors
Behavioural factors, including physical inactivity, medication non-adherence, smoking,
alcohol consumption and poor diet, and psychosocial factors, such as social isolation
often cluster together in people with depression (Bonnet et al., 2005). Furthermore, post-
MI patients are less likely to adhere to recommended behaviour and lifestyle changes
intended to reduce the risk of further cardiac events (Ziegelstein et al., 2000). Several
studies have shown that behavioural processes explain a substantial amount of the
association between depression and CVD (Gale et al., 2014;M. Hamer, 2012;M. Hamer
et al., 2008b;Whooley et al., 2008;Win et al., 2011). However due to the bidirectional
nature of these associations, it is difficult to determine causality (Whooley & Wong,
2013). Regardless of this, psychological interventions that aim to reduce CVD risk in
mental health populations are now encouraged to focus on health behaviours (M. Hamer
et al., 2008a;Whooley et al., 2008;Win et al., 2011).
Physical inactivity
The beneficial effects of physical activity on somatic disorders are well established (Aune
et al., 2015;Haskell et al., 2007;Warburton & Bredin, 2017). Furthermore, there is
evidence that physical activity also confers beneficial effects on mental health (Fox,
1999;Harvey et al., 2010;Wiles et al., 2007). A prospective study using data from the
Whitehall II cohort examined physical activity and symptoms of depression at three time
points, over 8 years, in 9,309 participants (Azevedo Da Silva et al., 2012). Results
showed that the recommended levels of physical activity were associated with reduced
risk of depressive symptoms and that experiencing depressive episodes was associated

297
with increased risk of not meeting the recommended levels of physical activity. These
findings were also observed in a study of 2,230 adolescents (Stavrakakis et al., 2012).
There is also evidence that physical inactivity may partially mediate the relationship
between depressive symptoms and mortality (Brummett et al., 2003;M. Hamer et al.,
2008a;M. Hamer et al., 2008b;Whooley et al., 2008;Win et al., 2011). In the Heart and
Soul Study, a prospective cohort study of 1,017 outpatients with stable CHD, depressive
symptoms were associated with a 50% greater rate of cardiovascular events (Whooley
et al., 2008). After adjustment for physical activity the association was reduced by 31.7%.
A similar study of 5,888 older adults reported that depressive symptoms and physical
inactivity independently increased CVD mortality risk and were strongly associated with
each other (Win et al., 2011). They concluded that physical inactivity accounted for a
significant proportion of the risk of cardiovascular mortality due to depressive symptoms.
Medication non-adherence
Depression may also lead to increased CVD mortality through its negative effects on
medication adherence. Depression has been associated with non-adherence to cardiac
medication (Gehi et al., 2005;Goldstein et al., 2017;Rieckmann et al., 2006) and
unsurprisingly non-adherence is associated with mortality in patients who have
experienced an MI (Rasmussen et al., 2007).
HF patients who have depressive symptoms and are non-adherent to their medication
are 5 times more likely to experience a cardiac event compared with those who are free
of depressive symptoms and medication adherent (J. R. Wu et al., 2013). In the Heart
and Soul study, medication non-adherence attenuated the association between
depressive symptoms and cardiovascular events by 5.3% (Whooley et al., 2008).
Smoking

298
According to the British Heart Foundation, smokers are almost twice as likely to
experience an MI compared with people who have never smoked (2019). Even passive
smoking (defined as non-smokers living with someone who smokes) is associated with
a 25-30% increase in risk of CHD (Whincup et al., 2004). Smoking cessation significantly
reduces the risk of cardiac events and mortality (Athyros et al., 2013). Research shows
the smoking rate for people with depression is about twice the rate in the general
population (Mathew et al., 2017) and the odds of successful abstinence are lower for
those with depression compared with non-depressed individuals (J. Cooper et al., 2016).
The association between depression and smoking is bidirectional, with smokers being
more likely to experience depression and those with a history of depression being more
likely to smoke (Breslau et al., 1998). Smoking has been proposed as a mediator in the
relationship between depression and CVD. In the Heart and Soul study, smoking
attenuated the association between depressive symptoms and cardiovascular events by
10.9% (Whooley et al., 2008).
Alcohol
The relationship between alcohol and CVD is a hotly debated topic, particularly regarding
the controversial U/J-shaped curve which refers to the potentially cardio protective effect
of moderate drinking. Findings from several studies indicate that low intake of alcohol
may have a beneficial effect on the reduction of CDV risk (Camargo et al., 1997;Gaziano
et al., 1993;Rimm et al., 1991;Suliga et al., 2019), although this claim has subsequently
been challenged (Toma et al., 2017). There is some evidence that alcohol affects
biological pathways implicated in CHD risk, such as hypertension (L. Chen et al.,
2008;Roerecke et al., 2017), BMI (Cho et al., 2015) and lipids (Holmes et al.,
2015;Tabara et al., 2016). A combined analysis of individual-participant data for 599,912
current drinkers in 83 prospective studies showed that there is no threshold which lower

299
alcohol consumption stopped being associated with lower CVD risk (except MI) (Wood
et al., 2018).
Much of the contention surrounding the ‘abstainer risk’ hypothesis comes from study
design limitations. Individuals who abstain from alcohol often do so due to increased
illness, disability, frailty, medication use or historical alcohol abuse (Fillmore et al., 2006)
and this could bias risk estimates for those who are lifelong abstainers (Rehm et al.,
2008). However several studies, where former drinkers are removed, continue to show
an increased risk of CVD in those who abstain compared with moderate drinkers (S. Bell
et al., 2017b;Bergmann et al., 2013;Mukamal et al., 2003). In order to assess whether
stability in alcohol intake levels are important in risk estimates O’Neill et al. (2018)
conducted a meta-analysis of six cohort studies, including 35,132 individuals, and
calculated alcohol intake trajectories over approximately 10 years. They reported that
those individuals who abstain from drinking (long term or more recently) and those who
inconsistently consume moderate amounts of alcohol intake have a higher risk of
experiencing CHD. These findings support the notion of a cardio protective effect of
moderate alcohol consumption, providing it is stable. Further research suggests that this
protective effect may be explained by inflammatory activation. A 12 year follow-up study
including 8,209 older people from the Whitehall II study showed that stable moderate
drinkers had lower concentrations of CRP, IL‐6 and IL‐1 RA compared to non-drinkers
during the following 12 years (Bell et al., 2017b).
The relationship between alcohol consumption and depression has also been
investigated, with conflicting results. Some studies have shown that heavy, binge
drinking is associated with an increased risk of depression (Choi & DiNitto, 2011;Paljärvi
et al., 2009;JianLi Wang & Patten, 2002), however this has not always been reported
(Haynes et al., 2005). Other studies have reported that people who drink in moderation
have a lower risk of depression compared to those who abstain (Gea et al., 2013;Gea et
al., 2012), however the reverse has also been reported (Haynes et al., 2005). Using data

300
from the Whitehall II Study, Bell & Britton (2015) followed 7,478 middle aged men and
women, who were free from depression at baseline, for 25-28 years. They found no
significant association between drinking patterns and subsequent depression. Another
study using the English Longitudinal Study of Ageing (ELSA) cohort also reported no
association between drinking patterns and depression in older adults (Garcia-Esquinas
et al., 2018). In the Heart and Soul study, regular alcohol consumption only attenuated
the association between depressive symptoms and cardiovascular events by 0.5%,
suggesting it is not an important biological mediator (Whooley et al., 2008).
Poor diet
Dietary patterns are also associated with both depression and CVD. In particular
adherence to a Mediterranean diet (a higher consumption of vegetables, fruit, whole
grains, fish and low-fat dairy) is associated with reduced cardiovascular risk (Dobrosielski
et al., 2017;Ros et al., 2014;Sofi et al., 2014) and lower depression incidence (Akbaraly
et al., 2009;Lassale et al., 2018;Molendijk et al., 2018).
A prospective study of 22,786 Spanish young adults reported that Mediterranean diet
was associated with both reduced CVD and depression (Carlos et al., 2018). In a study
of 2,171 patients with a history of MI, a Mediterranean style dietary pattern was
associated with less depressive symptoms (Rius-Ottenheim et al., 2017). The
association between depression and CVD risk was mediated by adherence to a
Mediterranean diet in the ATTICA study (Antonogeorgos et al., 2012). Additionally,
positive feelings had a protective effect on CVD risk and this was also mediated by
Mediterranean eating pattern. A Mediterranean has also been shown to mediate the
relationship between depression and ACS prognosis (Chrysohoou et al., 2011;Notara et
al., 2016).
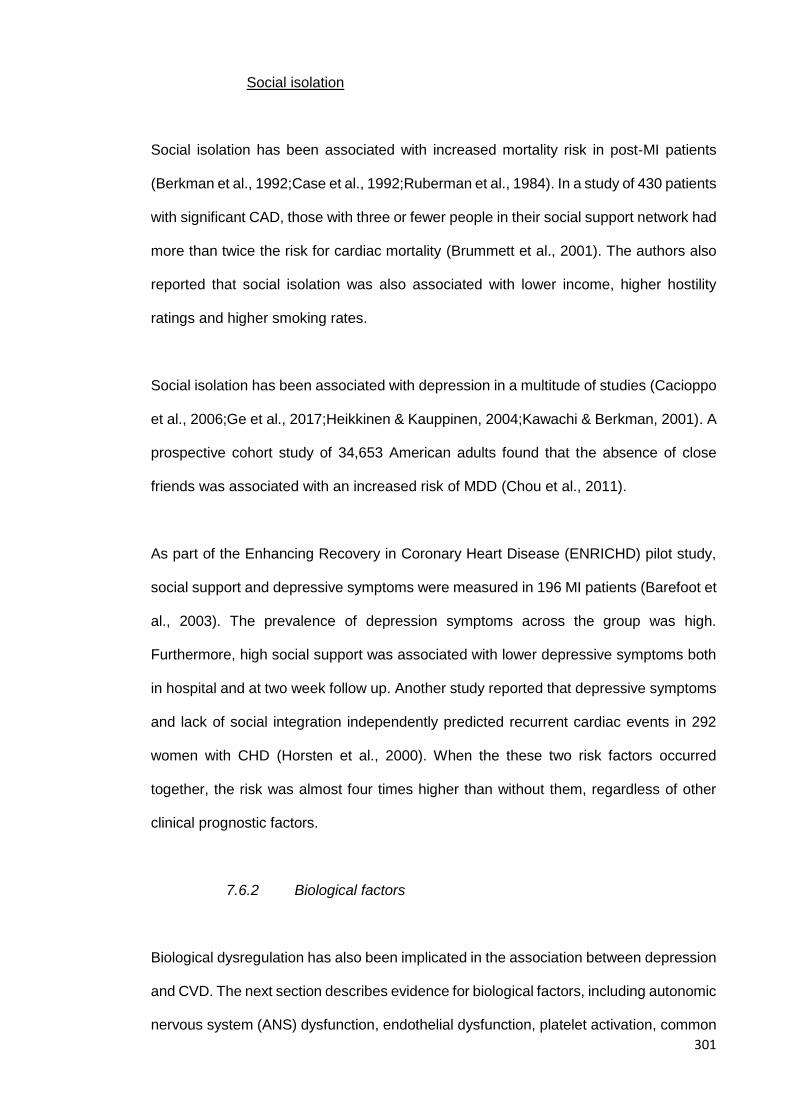
301
Social isolation
Social isolation has been associated with increased mortality risk in post-MI patients
(Berkman et al., 1992;Case et al., 1992;Ruberman et al., 1984). In a study of 430 patients
with significant CAD, those with three or fewer people in their social support network had
more than twice the risk for cardiac mortality (Brummett et al., 2001). The authors also
reported that social isolation was also associated with lower income, higher hostility
ratings and higher smoking rates.
Social isolation has been associated with depression in a multitude of studies (Cacioppo
et al., 2006;Ge et al., 2017;Heikkinen & Kauppinen, 2004;Kawachi & Berkman, 2001). A
prospective cohort study of 34,653 American adults found that the absence of close
friends was associated with an increased risk of MDD (Chou et al., 2011).
As part of the Enhancing Recovery in Coronary Heart Disease (ENRICHD) pilot study,
social support and depressive symptoms were measured in 196 MI patients (Barefoot et
al., 2003). The prevalence of depression symptoms across the group was high.
Furthermore, high social support was associated with lower depressive symptoms both
in hospital and at two week follow up. Another study reported that depressive symptoms
and lack of social integration independently predicted recurrent cardiac events in 292
women with CHD (Horsten et al., 2000). When the these two risk factors occurred
together, the risk was almost four times higher than without them, regardless of other
clinical prognostic factors.
7.6.2 Biological factors
Biological dysregulation has also been implicated in the association between depression
and CVD. The next section describes evidence for biological factors, including autonomic
nervous system (ANS) dysfunction, endothelial dysfunction, platelet activation, common

302
genetic factors, mental stress–induced ischemia, activation of the HPA-axis and
inflammation. It should be noted that many of these factors are also associated with poor
health behaviours and it is yet unclear to what degree they are behavioural
consequences or parallel mechanisms linking depression and CVD (Whooley & Wong,
2013).
Autonomic dysfunction
The autonomic nervous system (ANS) is divided into the sympathetic nervous system
(SNS) and the parasympathetic nervous system (PSNS) that act to increase and
decrease heart rate, cardiac contractility and vasodilation, respectively (Whooley &
Wong, 2013). Sympathetic activation can be caused by physical activity, coronary
ischemia, heart failure, and mental stress and has been shown to increase the risk of
adverse cardiovascular outcomes, including mortality (Curtis & O'Keefe, 2002).
Acute stress activates sympathetic and inhibits parasympathetic nerves as part of the
fight or flight response (B. W. Penninx, 2017). People with depression are thought to
have an ANS that is in a relative state of increased sympathetic and decreased
parasympathetic activation. Depressed CHD patients tend to have higher levels of
circulating catecholamines, such as norepinephrine, epinephrine, and cortisol, which are
markers of sympathetic activation (Carney et al., 2005b).
Another measure of ANS activity is heart-rate variability (HRV). HRV is the variation in
the time interval between heartbeats and reflects the balance between the SNS and
PSNS, with low HRV suggesting increased SNS activity or decreased PSNS activity.
Low HRV is a predictor for CVD and mortality (J. M. Dekker et al., 2000) and for somatic
symptoms associated with CVD such as, tachycardia, hypertension, serum triglycerides,
serum glucose, and low high-density lipoprotein (HDL) cholesterol (Licht et al., 2013).

303
A meta-analysis of 18 studies investigating the impact of depression on HRV, including
673 depressed participants without CVD and 407 controls, reported that depression is
associated with reduced HRV, which decreases with increasing depression severity
(Kemp et al., 2010). However findings are inconsistent with several studies reporting no
association (Kemp et al., 2013;Licht et al., 2008;Licht et al., 2015). These conflicting
results may be explained by antidepressant use, which has been consistently associated
with low HRV. In the meta-analysis by Kemp et al. (2010) TCAs were found to decrease
HRV, which was also confirmed in the studies by Licht et al. (2008;2015). Evidence also
exists for the reducing effects of SNRIs and SSRIs, but this effect appears to be much
smaller and findings are inconsistent (B. W. Penninx, 2017).
Decreased HRV has also been associated with depression in patients after acute MI
(Carney et al., 2005a;Carney et al., 2001) and in patients with depressive symptoms and
stable CAD (de Jonge et al., 2007). In 907 patients from the Cardiovascular Health
Study, Kop et al. (2010) reported that adjusting for HRV attenuated the association
between depression and increased cardiovascular mortality risk. However, the Heart and
Soul Study found that adjustment for HRV did not change the effect size of the
association between depressive symptoms and cardiovascular events (Whooley et al.,
2008).
Endothelial dysfunction
Endothelial dysfunction is also associated with most cardiac risk factors and is involved
in all stages of atherosclerosis (Hadi et al., 2005). The endothelium, or lining of the blood
vessel wall, can become inflamed in the presence of CVD risk factors such as smoking
and hypercholesterolemia. This results in an increase in vasoconstrictive and
prothrombotic factors, increasing the risk of a cardiac event. Depression has also been
associated with endothelial dysfunction, even in people free of other CVD risk factors
(Broadley et al., 2002;D. C. Cooper et al., 2011;Rybakowski et al., 2006). A meta-

304
analysis including 12 studies and 1,491 people, including healthy adults and
cardiovascular patients, found an association similar in magnitude to the association
between obesity and systolic blood pressure (D. C. Cooper et al., 2011). In patients with
traditional cardiac risk factors the association was even stronger.
Platelet activation
Factors that promote platelet activation and coagulation play a key role in thrombus
formation and the progression of CVD (Serebruany et al., 2003). Increased platelet
activity and elevated coagulation markers, particularly platelet factor 4 and beta-
thromboglobulin, have been observed in patients with depression and CVD (Kuijpers et
al., 2002;Serebruany et al., 2003;Shimbo et al., 2002), However data on platelet activity
in depression in general is inconclusive and demands further exploration (von Kanel,
2004). Measuring platelet function is complex and no single test currently exists.
Furthermore, several methodological issues mean that correlating measures of platelet
function with clinical outcomes is problematic (Gurbel et al., 2007).
Common genetic factors
For several decades, it has been known that CHD tends to cluster families (Dai et al.,
2016;Musunuru & Kathiresan, 2019;Rissanen, 1979;Rose, 1964). As previously
discussed, depression is also more common among first degree-relatives of individuals
who have been depressed (Geschwind & Flint, 2015). Scherrer et al. conducted a study
examining the genetic and environmental contributions to the covariation of depressive
symptoms and CVD in a sample of 6,903 male-male twins from the Vietnam Era Twin
Registry (2003). They found that CVD was more common among individuals reporting
five or more symptoms of depression and among those with more severe symptoms.
The genetic correlation between CVD and depression was significant and showed that
that nearly 20% of genetic influences were common across both phenotypes. A

305
systematic review of genome wide and candidate gene studies investigating genetic
variants associated with CVD and mood disorders reported 24 potential pleiotropic genes
that are likely to be shared between the two (Amare et al., 2017). Taken together, these
findings suggest that lifetime co-occurrence of these CVD and depression is partly
explained by common genetic risk factors.
As previously mentioned in Chapter 1, the short allele of a polymorphism in the promoter
region of the serotonin transporter gene (5-HTTLPR) is associated with increased risk
of depression in medically healthy individuals (Caspi et al., 2003;Serretti et al., 2007)
and poor antidepressant response (Porcelli et al., 2012). In the Heart and Soul study,
the association of 5-HTTLPR with depression and 24-hour urinary norepinephrine
excretion in 557 outpatients with CHD was examined (Otte et al., 2007). The authors
reported that the short allele was associated with depression and greater 24-hour urinary
norepinephrine excretion. These findings suggest that the 5-HTTLPR genotype may be
an important vulnerability factor for both depression and adverse outcomes in CHD
patients.
Activation of the HPA-axis
As previously discussed in Chapter 1, Section 1.5.2, hyperactivity of the HPA-axis and
elevated cortisol in depressed patients is an enduring and well-replicated finding
(Pariante & Lightman, 2008). It has also been posited that HPA-axis dysfunction may
contribute to the pathogenesis of depression and comorbid CVD. From a physiological
perspective, cortisol affects the metabolism of almost every tissue in the body and plays
an important role in lipid and glucose metabolism (Baxter & Forsham, 1972). HPA axis
dysregulation and the resulting prolonged exposure to elevated levels of glucocorticoids
is also related to many CVD risk factors such as hypertension, dyslipidemia, insulin
resistance, glucose intolerance, and central adiposity (B. R. Walker, 2007). In a
comprehensive review by Girod and Brotman (2004), three main physiological roles of

306
glucocorticoids are identified. Firstly, they prime the metabolic, autonomic,
psychological, haemostatic and cardiovascular aspects of the stress response in
preparation for everyday stress. Secondly, they suppress the inflammatory response and
cellular proliferation, preventing autoimmunity and circulatory collapse. Thirdly, they play
a role in body composition, affecting insulin resistance and lipogenesis. Whilst some of
these functions, such as the suppression of inflammation, may be beneficial to the
cardiovascular system, others such as hypertension and insulin resistance maybe
harmful. On balance it is likely that increased glucocorticoid production is deleterious to
cardiovascular health (Girod & Brotman, 2004).
Indeed, alterations in diurnal cortisol have been associated with CVD risk in several
observational studies. Salivary cortisol reactivity over the first 20 and 60 min after
awakening has been positively associated with progression of intima media thickness in
women (Eller et al., 2005). In the Multi-Ethnic Study of Atherosclerosis Stress Study,
coronary artery calcification was associated with a flatter decline in morning cortisol in
464 older men and women (Hajat et al., 2013). In the CARDIA Study, coronary
calcification was associated with a flatter cortisol slope in 718 healthy middle-aged adults
(Matthews et al., 2006). Cortisol AUC has also been associated with atherosclerosis of
the carotid arteries in 1,866 healthy, elderly people in the Rotterdam Study (M. J. Dekker
et al., 2008).
Cortisol patterning has also been explored in people with established CVD. CAD patients
have been shown to demonstrate higher 24 hour cortisol secretion and a flattened diurnal
slope, compared to clinically healthy controls (Nijm et al., 2007). The CAR has been
shown to be flattened in men with CVD (Vreeburg et al., 2009b). Flatter cortisol rhythms
have also been associated with depression in CAD patients (Bhattacharyya et al., 2008)
and CHD patients with a history of MI have been shown to have lower AUC values
compared to CHD patients who had no previous MI, suggesting that cortisol output is
associated with CHD severity (Merswolken et al., 2013). Alterations in diurnal cortisol

307
profile have also been associated with depressed mood in CABG surgery. In a study of
171 patients undergoing first-time, elective CABG surgery, a steeper cortisol slope
measured 60 days after surgery predicted reduced odds of depression 12 months after
surgery (Poole et al., 2016). However, the Heart and Soul Study found that adjustment
for 24-hour excretion of cortisol levels did not change the strength of association between
depressive symptoms and adverse cardiovascular events (Whooley et al., 2008).
Dysregulation of the HPA axis has also been associated with cardiovascular mortality.
In a study using data from the Whitehall II cohort, diurnal cortisol profiles were examined
in 4,047 civil servants who were follow up over a six year period (Kumari et al., 2011).
Results showed that flatter cortisol slopes were associated with increased risk of all-
cause mortality and that this was mainly driven by an increased risk of cardiovascular
deaths.
This contribution of HPA-axis dysfunction to depression and comorbid CVD may be
mediated, at least in part, by the loss of glucocorticoid receptor sensitivity. This was
investigated in a study by Nikkheslat et al. (2015) who measured plasma and salivary
cortisol, gene expression of GR and in vitro GR sensitivity in 83 CHD patients with and
without comorbid depression. Results showed that depressed CHD patients had lower
plasma and saliva cortisol levels and a reduction in GR expression and sensitivity. In a
study including 382 in-patients with mood disorder, non-suppression to the DST and
higher baseline serum cortisol predicted CVD death, suggesting that HPA axis
dysregulation may be a mediating factor between depression increased CVD mortality
risk (Jokinen & Nordstrom, 2009).
A potential mechanism whereby impaired GR sensitivity increases CVD risk is via
reduced negative feedback on inflammatory signalling, resulting in immune activation.
Importantly, disruptions of the HPA-axis may be enhanced by pro-inflammatory
cytokines, which further impair GR receptor functioning, creating a feed-forward cascade

308
and reflecting a complex bidirectional biological dialogue between the immune system
and the HPA-axis (Sasayama et al., 2011).
7.7 Inflammation, depression and CVD
As previously discussed in Chapter 1, Section 1.4.2, meta-analyses have robustly
demonstrated that inflammatory biomarkers (IL-6, TNF-α, CRP) are associated with
depression (Haapakoski et al., 2015). Chronic, systemic increases in pro-inflammatory
cytokines also predict CVD events and mortality in both healthy people (Cesari et al.,
2003;Danesh et al., 2008;Kaptoge et al., 2012;Kop et al., 2010;Woodward et al., 2007)
and patients with established disease (Heeschen et al., 2000;Kop et al., 2011). Results
from a meta-analysis of 54 prospective cohort studies, including 160,309 people with no
history of CVD, showed that CRP is consistently associated with CHD, ischaemic stroke
and mortality (Kaptoge et al., 2010). Indeed, atherosclerosis is now considered a
fundamentally inflammatory disease (Ross 1999). There is now a growing consensus
that inflammation may be a key biological link in the comorbidity of depression and CVD
(Golia et al., 2014;Halaris, 2013c;Joynt et al., 2003;Kop & Gottdiener, 2005;Lippi et al.,
2009).
7.7.1 Biological pathways
Over the past two decades a number of pro-inflammatory mediators have been shown
to play a central role in the initiation, progression, and complications of atherosclerosis.
These including acute-phase proteins, CRP, fibrinogen, immunoglobulins, adhesion
molecules, and cytokines (Halaris, 2013b). This role may be characterised by
interactions between inflammatory signalling cascades and several CVD related
pathways, as illustrated in Figure?. Inflammatory factors, such as CRP, activate the
classical complement cascade. The compliment system is a complex protein network of
the innate immune system that influences many processes involved in the development

309
and progression of atherosclerosis, (Carter, 2012;Hertle et al., 2014). The complement
system is thought to contribute to several aspects of endothelial dysfunction, including
promotion of endothelial cell activation, leukocyte adhesion, increased endothelial
permeability, monocyte infiltration into the extracellular matrix, and stimulation of
cytokine release from VSMCs (Steyers & Miller, 2014). Local inflammatory cytokines in
atherosclerotic plaques also initiate the adaptive immune response, resulting in the
infiltration of T-cells. CD4+ T helper cells and CD8+ cytotoxic T cells promote endothelial
dysfunction, lipid accumulation in macrophages with subsequent foam cell formation and
cell death (Ammirati et al., 2015). In addition, innate immune activation promotes
oxidative stress. Oxidative stress broadly describes an imbalance between reactive
oxygen species (ROS) and antioxidants (Sies, 2015). Macrophages release ROS, which
promote platelet activation, endothelial dysfunction, apoptosis and thrombosis of
atherosclerotic plaques (Cervantes Gracia et al., 2017;Santilli et al., 2015). Innate
immune cells also express tissue factor, which initiates the clotting cascade, resulting in
thrombus formation (Iba & Levy, 2018).
Adapted from Baune et al. (2012).
Figure 7.2. Interactions between inflammatory signalling and CVD related pathways.

310
7.7.2 Association between depression and inflammation in CVD
Studies examining both depression and inflammation cross-sectionally in CVD
populations have reported mixed results. Bankier et al. (2009) examined 72 stable CHD
outpatients with MDD and found a significant association between MDD and CRP.
Depressive symptoms have been associated with increased CRP in 65 patients who
were recovering from ACS (G. E. Miller et al., 2005a). Shimbo et al. (2006) measured
depression remission status three months after an ACS event in 103 patients and found
that persistent depression was significantly associated with raised CRP. A more recent
study including 164 post-ACS patients, depressive symptoms were independently
associated with elevated markers of IL-17 (Celano et al., 2017). Mixed findings were
reported by Lespérance et al. (2004) who studied 481 patients 2 months after
hospitalization for ACS. Depressed patients showed significantly higher levels of soluble
intercellular adhesion molecule 1 but not IL-6. Similarly Frasure-Smith et al. (2009) found
that CRP but not IL-6 was elevated in depressed cardiac patients compared with non-
depressed. In contrast, a study by Kim et al. (2018) including 969 ACS patients reported
that higher IL-6 and IL-18 levels were independently associated with depression. IL-6
was also shown to be associated with pre-operative depression in 236 patients two
weeks before cardiac surgery (Ai et al., 2005). Increased levels of TNF-α have also been
observed in depressed MI-patients compared with non-depressed (2014). Increased
TNF-α, but not IL-6 or IL-1beta, has also been associated with depression in heart failure
patients (Moorman et al., 2007).
However, some studies have only reported null findings. In a case-control study of 57
depressed patients and 46 non-depressed patients, who had all been hospitalized for
MI, Schins et al. (2005) reported no differences in IL-6 or TNF-α between groups.
Similarly, a study of 247 women who had survived acute MI found no evidence of a
relationship between depressive symptoms and CRP, IL-6 or IL-1ra (Janszky et al.,
2005). IL-1beta was also shown to be not associated with depression in older cardiac

311
patients (Lyness et al., 2001). However, a meta-analysis by Howren et al. (2009)
confirmed that CRP, IL-6, and IL-1 are associated with depression in CVD populations.
It should be noted that findings from studies including CVD patients need to be
interpreted with caution. Medications such as statins and aspirin are known to have anti-
inflammatory effects (Greenwood & Mason, 2007;Vane & Botting, 2003) and the
predictive effects of inflammatory cytokines on depression in ACS patients is attenuated
in patients taking statins (S. W. Kim et al., 2018). Despite these findings, medications
have not been consistently controlled for in the literature. Furthermore, the quality of
published evidence on CRP and CVD prognosis has been criticised by some, particularly
regarding publication bias, confounding and methodology, undermining the reliability of
this relationship (Hemingway et al., 2010).
7.7.3 Depression, inflammation and CVD risk
Given the fact that both depression and inflammation appear to exist simultaneously in
cardiac patients, it is possible that inflammation may moderate the relationship between
depression and CVD (Shimbo et al., 2005). Depression and inflammation may both be
causal to CVD but via independent pathways. Conversely, there may be a shared
aetiology that is itself associated with CVD. Inflammation may cause both depression
and CVD, with no direct relationship existing between depression and CVD. Finally,
depression may precede inflammation. In this scenario, inflammation may mediate the
relationship between depression and CVD, explaining its existence. Or depression may
moderate the relationship between inflammation and CVD, influencing its strength.
Prospective studies have attempted to explore this issue in both CVD and healthy
populations.
Several studies have investigated the role of depression status as a prognostic factor in
patients with existing CVD. A study by Frasure-Smith et al. (2007) explored the impact

312
of both depression and inflammation on cardiac prognosis in 741 men with stable CAD.
The authors reported that depression and CRP interacted in predicting future cardiac
events: only those men with low levels of depression and low levels of CRP
demonstrated low risk of major adverse cardiac events. In addition, the effect of CRP
was largely restricted to the non-depressed men and the effect of elevated depression
symptoms was largely restricted to those with lower levels of CRP. This finding does not
support the notion that inflammation is acting as a mediator or that inflammation and
depression are operating via separate pathways, but that both factors mutually influence
each other.
However, in another study, Frazier et al. (2009) measured CRP and depressive
symptoms in 490 patients following elective coronary stent insertion and followed them
up over two years. The results showed that both depression and CRP were predictive of
a future major adverse cardiac event. Furthermore, depression was a stronger predictor
when inflammatory proteins were removed from the analysis, suggesting that
inflammation may be a partial mediator of depression and cardiac outcomes. Vaccarino
et al. (2007) followed 559 women with suspected coronary ischemia over 5.9 years. They
reported that depression predicted CVD and that CRP explained 13% and IL-6 explained
4% of the association, suggesting a minor role of inflammation in the relationship
between depression and CVD. Similarly in the Heart and Soul study, which followed
1,017 stable CHD patients over 4.8 years, CRP only explained a small part of the
association between depressive symptoms and cardiovascular events (Whooley et al.,
2008).
Population-based studies of community samples have also explored these relationships,
mainly in older people. The results of these studies largely support the idea that
depressive symptoms and inflammatory biomarkers increase CVD risk independently.
Nabi et al. (2008) used data from 6,396 CHD free civil servants from the Whitehall II
Study, (4,453 men and 1,943 women) who were followed up over 11 years. Negative

313
affect, psychological distress, and inflammatory markers predicted incident CHD,
however there was no association between psychological factors and increased
inflammation. In a Canadian cohort study, including 1,794 participants, depression and
inflammation were associated at baseline and each significantly predicted CHD
separately (K. W. Davidson et al., 2009). Furthermore, when they were analysed in the
same model, each remained significant. In a nested case-referent study within the
Prospective Epidemiological Study of Myocardial Infarction (PRIME) study, Empana et
al. (2005) followed 9,758 healthy, middle-aged, CHD free men over 5 years and reported
that baseline depressed mood was associated with future CHD and that this association
remained stable after adjustment for inflammatory markers. Similar findings were
observed by Arbelaez et al. (2007), who showed that CRP did not mediate the
relationship between depressive symptoms and risk of ischemic stroke in 5,525 elderly
people. CRP was also shown not to explain any association between depression and
mortality in the National Diet and Nutrition Survey in older adults (2011).
However some studies do report minimal effects of mediation. A study by Surtees et al.
(2008b), including 19,649 people (41-80 years), found that baseline depression was
associated with incident ischemic heart disease (IHD) one year later and that CRP
explained 15% of the association. Hughes et al. (2016) followed 2,389 older men over
18 years and reported that CRP explained 7.3% of the association between depressive
symptoms and all-cause mortality. Findings from the Cardiovascular Health Study
showed that IL-6 attenuated the depression-CVD mortality association by 7.9% in older
people (Kop et al., 2010). In another study of 6,576 healthy people, CRP accounted for
5.5% of the association between psychological distress and CVD events (M. Hamer et
al., 2008a). Finally, Hiles et al. (2015) found that CRP explained 8.1 % and IL-6 10.9 %
of the effect of depression on cardiovascular events in a study including 1,692
participants. Taken together these studies suggest that whilst inflammation may confer
nominal effects of mediation, it is unlikely to explain the associations observed between
depression and CVD.

314
Given the fact that depression and inflammation appear to have largely independent
roles in the prediction of cardiovascular disease, it is possible that the presence of both
may further increase cardiovascular disease risk. To date only one study has
investigated the combined effect of depressive symptoms and elevated inflammation on
CVD development. Using data from the MONICA–KORA Augsburg Cohort Study,
Ladwig et al. (2005) analysed CRP and depressive symptoms in 3,021 healthy, older
men who were followed up over 7.7 years. They reported that compared with men who
had low CRP and no depressive symptoms, men with high CRP and depressed mood
had an increased risk of a future CHD event, however men with high CRP and no
depressed mood had no increased risk, indicating that there is a synergy between
inflammation and depression in CHD prediction. There was a significant interaction
between depressive symptoms and inflammation after adjustment for age, although this
lost significance in the fully adjusted model. The authors speculate that both conditions
may share a common underlying mechanism. However this study was restricted to older
men and so it is unclear whether this effect is present in women, therefore further studies
including both men and women are required.
7.7.4 Gender differences in depression and mortality
Largely due to the fact that more men die from CHD than women, and at a younger age
(40–60 years), there is a bias in the literature towards studies which include a majority
of men (Fairweather, 2014;Shaw et al., 2009). Furthermore, data are not typically
analysed separately according to sex. This means that our understanding of the factors
important to CVD risk are skewed in favour of men.
Some studies have reported sex differences in the association between late-life
depression and mortality, with several reporting a greater mortality risk in men. For
example, Ryan et al. (2008) explored the association between depression and four year
survival in 7,363 elderly people. They reported that increasing depression severity was

315
associated with incrementally higher mortality risk in men only. In women the association
between depression and mortality was less marked and only significant for severe
depression in the absence of treatment. Anstey & Luszcz (2002) measured depressive
symptoms in 1,947 elderly people and showed that in men, incident depression was
associated with mortality but not in women. MDD was shown to be an independent risk
factor for mortality in men only in a study of 1,000 elderly people by Jeong et al. (2013).
The relationship between depression and mortality risk was also shown to be
considerably stronger in men compared to women in the Bambuí Cohort Study of Aging
(Diniz et al., 2014). Differential effects have also been reported by a study showing that
chronic depression predicts increased mortality in older women and incident depression
predicts increased mortality in older men (Teng et al., 2013).
Regarding CVD specifically, a prospective cohort study of 3,701 elderly people found
that newly depressed mood was independently associated with an increased risk of CVD
mortality, new CVD events and new coronary heart disease events in men, but not
women (B. W. Penninx et al., 1998). Furthermore, newly depressed older men were
twice as likely to have a CVD event as those who were never depressed, whilst this
finding was not present in women. A systematic review reported that depression was
associated with significantly increased risk of cardiovascular death for men, but not
women (Wulsin et al., 1999). In contrast, a prospective longitudinal study of 860 women
from the Geelong Osteoporosis Study showed that baseline depression predicted 18-
year CHD incidence, adjusting for a wide variety of risk factors (O'Neil et al., 2016).
Sex differences in inflammation have been reported, including higher CRP levels in
women (by potentially up to 60%) compared to men, with and without CVD risk factors
(Sobhani et al., 2018). Furthermore, CRP is a strong independent risk factor for CVD in
women (Ridker et al., 1998). Increased inflammatory biomarkers are also associated
with several cardiovascular risk factors, such as high body mass index, blood pressure,
and smoking status in healthy, CVD-free women (Bermudez et al., 2002). This suggests

316
that increases in inflammation may be of particular importance for cardiovascular risk in
women. Whether the inflammation and depression link is particularly significant for
women is still unknown.
7.8 Chapter summary
Overall the evidence suggests that cardiovascular disease is epidemiologically linked to
both depression and inflammation. A robust literature has demonstrated that people with
depression or elevated inflammation are at increased mortality risk, particularly from
CVD. Furthermore depressive symptoms and inflammatory biomarkers co-vary in those
with established CVD. Despite the magnitude of literature in this field, the exact nature
of the relationship between these two conditions remains elusive. The majority of the
evidence suggests that depression and inflammation influences CVD risk via
independent pathways, with minimal effects of mediation or moderation. The effect of
combined depression and inflammation has only been investigated in one study and that
was restricted to older men only. It is still therefore unclear whether this combination
confers a significantly greater CVD risk than either depression or inflammation alone,
and whether this risk is increased in both men and women. Therefore, study 2 of this
PhD will investigate the following research questions:
a) Do people with both depressive symptoms and increased inflammation have
significantly greater CVD mortality risk than people with depressive symptoms
or inflammation alone?
b) Do depressive symptoms moderate the mortality risk associated with increased
inflammation or does inflammation mediate the association between depressive
symptoms and CVD mortality?

317
8. Study 2 - Combined influence of depressive symptoms and
systemic inflammation on all-cause and cardiovascular mortality in
ELSA
8.1 Overview
This chapter concerns the findings from our analysis of the ELSA dataset. As discussed
in Chapter 7 the combined effect of depression and inflammation on mortality has not
been investigated fully. The aim of this study was to prospectively investigate the
combined association of these factors with the prediction of CVD and all-cause mortality
in 5,328 older men and women from the ELSA cohort. A brief overview of the ELSA
cohort and study background is presented followed by the methods and results of this
study, and a discussion of the findings. The results of this study have been published in
Psychological Medicine (Lawes et al., 2018).
8.2 The English Longitudinal Study of Ageing (ELSA) Cohort
ELSA is a prospective study of community-dwelling people aged 50 and over, that
collects health, social and economic data. The present sample contains data from up to
seven waves of data collection, spanning fourteen years and includes objective and
subjective data relating to health, biological markers of disease, economic circumstance,
social participation and well-being. The study was designed to investigate the complex
relationships relating to the process of ageing, including health trajectories, life
expectancy and the relationship between physical and mental health. For more
information on ELSA see http://www.elsa-project.ac.uk/.
ELSA commenced in 2002, and the sample has been followed up every 2 years. Sample
members are drawn from respondents to the Health Survey for England (HSE). Data are
collected during face-to-face interviews, using computer-assisted interviewing and self-
completion questionnaires, with additional nurse visits for the assessment of biomarkers
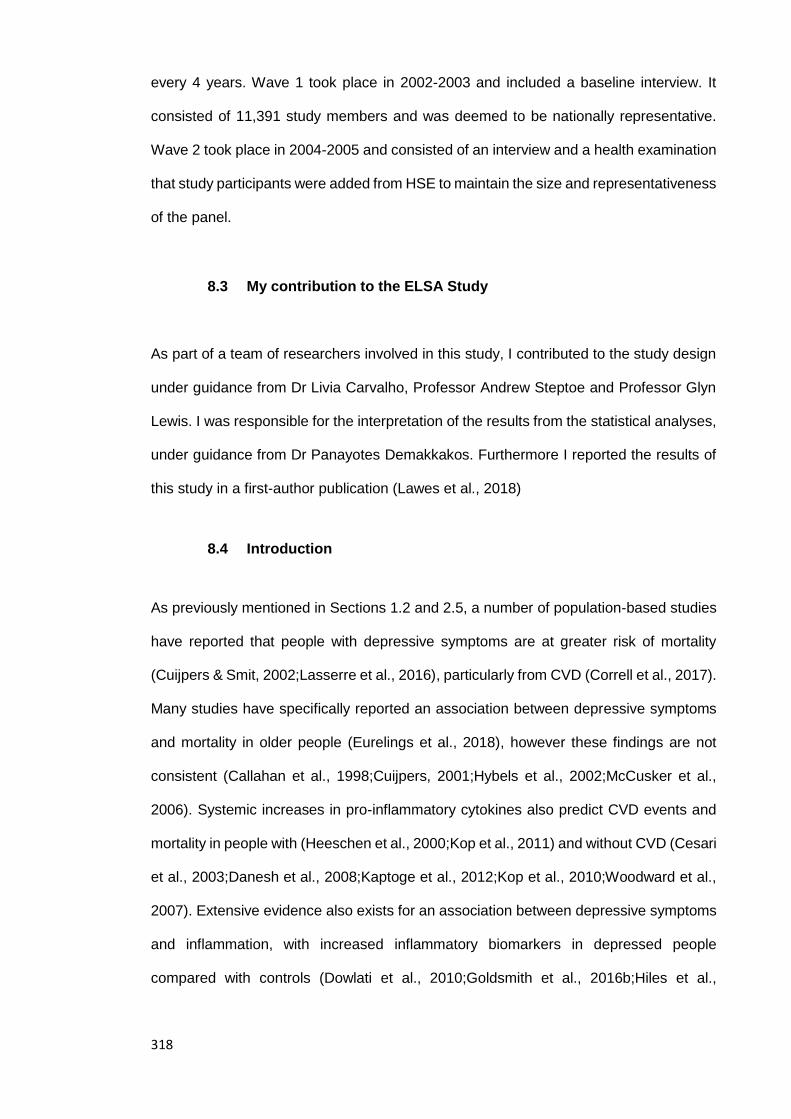
318
every 4 years. Wave 1 took place in 2002-2003 and included a baseline interview. It
consisted of 11,391 study members and was deemed to be nationally representative.
Wave 2 took place in 2004-2005 and consisted of an interview and a health examination
that study participants were added from HSE to maintain the size and representativeness
of the panel.
8.3 My contribution to the ELSA Study
As part of a team of researchers involved in this study, I contributed to the study design
under guidance from Dr Livia Carvalho, Professor Andrew Steptoe and Professor Glyn
Lewis. I was responsible for the interpretation of the results from the statistical analyses,
under guidance from Dr Panayotes Demakkakos. Furthermore I reported the results of
this study in a first-author publication (Lawes et al., 2018)
8.4 Introduction
As previously mentioned in Sections 1.2 and 2.5, a number of population-based studies
have reported that people with depressive symptoms are at greater risk of mortality
(Cuijpers & Smit, 2002;Lasserre et al., 2016), particularly from CVD (Correll et al., 2017).
Many studies have specifically reported an association between depressive symptoms
and mortality in older people (Eurelings et al., 2018), however these findings are not
consistent (Callahan et al., 1998;Cuijpers, 2001;Hybels et al., 2002;McCusker et al.,
2006). Systemic increases in pro-inflammatory cytokines also predict CVD events and
mortality in people with (Heeschen et al., 2000;Kop et al., 2011) and without CVD (Cesari
et al., 2003;Danesh et al., 2008;Kaptoge et al., 2012;Kop et al., 2010;Woodward et al.,
2007). Extensive evidence also exists for an association between depressive symptoms
and inflammation, with increased inflammatory biomarkers in depressed people
compared with controls (Dowlati et al., 2010;Goldsmith et al., 2016b;Hiles et al.,

319
2012b;Howren et al., 2009;Kohler et al., 2017;Y. Liu et al., 2012). However, it is unclear
whether the increased mortality risk in depressed people is due to inflammation.
As previously discussed, it is possible that inflammation may be mediating the
association between depression and mortality, however evidence is inconsistent. Some
studies demonstrate that depressive symptoms increase CVD risk independently of
inflammation (Arbelaez et al., 2007;K. W. Davidson et al., 2009;Empana et al., 2005;Nabi
et al., 2008), whilst others have reported minimal effects of mediation (M. Hamer et al.,
2008a;Hiles et al., 2015;Hughes et al., 2016;Kop et al., 2010;Surtees et al., 2008b). To
our knowledge only one study has investigated the combined effect of depressive
symptoms and elevated inflammation on CVD development. Ladwig et al. (2005) showed
that combined depressed mood and high inflammation conferred a significantly greater
risk of future cardiac events than either depressed mood or high inflammation alone in
older men. It is still unclear whether this combination confers a significantly greater CVD
risk than either depression or inflammation alone, and whether this risk is increased in
both men and women.
Gender differences have also been observed in the association between late-life
depression and mortality. Several studies report a greater mortality risk in men (Anstey
& Luszcz, 2002;Diniz et al., 2014;Jeong et al., 2013;Ryan et al., 2008;Teng et al., 2013),
particularly for CVD (B. W. Penninx et al., 1998;Wulsin et al., 1999). Sex differences in
inflammation have also been reported, including higher inflammation in women
compared to men (Sobhani et al., 2018). Furthermore, inflammation is a strong
independent risk factor for CVD in women (Bermudez et al., 2002;Ridker et al., 1998).
Whether the inflammation and depression link is particularly significant for women is still
unknown.
In this study, we used data from ELSA to investigate the combined effects of depressive
symptoms and inflammation on CVD and all-cause mortality risk in older men and
320
women. In particular, we sought to investigate whether depressive symptoms moderate
the mortality risk associated with increased inflammation or whether inflammation could
be mediating the association between depressive symptoms and mortality.
8.5 Hypotheses
Given that both depression and inflammation predict CVD and all-cause mortality, and
the combination of both factors has been shown to increase the risk of future cardiac
events in men (Ladwig et al., 2005), I hypothesise that people with both depressive
symptoms and inflammation will have significantly greater mortality risk than
people with depressive symptoms or inflammation alone (hypothesis 1).
The evidence for inflammation as a mediator suggests that any effect is likely to be
minimal, therefore I hypothesise that depressive symptoms and inflammation will
have largely independent effects on mortality (hypothesis 2).
8.6 Materials and methods
8.6.1 Study Population
The study included 5,328 people, aged 52 to 89 years, from an initial cohort of 8,670
who participated in the interview at wave 2. We excluded 1,084 individuals who did not
participate in the health examination survey, 134 who did not consent for their vital status
data to be included, 1,411 who were unable to provide a blood sample, 330 individuals
whose CRP values were unavailable or not reliable. The latter included samples which
were lost in the post, received later than five days after collection, considered unusable
by the laboratory or of insufficient amount to be analysed. Detailed information about
how the ELSA data was collected and processed into its current format and about how
each variable was coded is available at:

321
https://discover.ukdataservice.ac.uk/series/?sn=200011. We also excluded 155
participants from the analysis because their CRP levels were ≥20ml/L, allowing for the
elimination of individuals with acute inflammation, while another 229 participants were
excluded because of missing values in the covariates
8.6.2 Assessment of inflammation
Blood samples were taken by the study nurse at wave 2 and serum CRP was analysed
by Royal Victoria Infirmary, Newcastle. High sensitivity plasma CRP level was
dichotomised into two categories: <3mg/L was defined as normal and 3-20mg/L was
defined as high. This cut off point is based on guidelines from the Center for Disease
Control and Prevention and the American Heart Association suggesting that plasma CRP
values of >3.0mg/L might be predictive of cardiovascular disease (Pearson et al., 2003).
8.6.3 Assessment of depressive symptoms
Depressive symptoms were measured at wave 2 (2004-2005) using the eight-item
Centre for Epidemiological Studies Depression Scale 8 (CES-D8) which is a self-report
questionnaire designed to measure depressive symptomatology in the general
population (Radloff, 1977). Respondents were asked how often they felt depressed, felt
that everything was an effort, slept restlessly, were happy, felt lonely, enjoyed life, felt
sad, and could not get going. The two positive items (‘was happy’ and ‘enjoyed life’) are
reverse coded, so a higher score here also indicates a more depressed mood. We
subsequently derived a summary CES-D score by adding responses to all eight
dichotomous questions (possible range: 0–8). Exact wording of the different items can
be found in Appendix 11.12. The eight-item abbreviated version of the CES-D has been
widely used, is internally consistent, has been validated in both the general population
(Van de Velde et al., 2009) and older adults, and shows a comparable construct of
depression across eleven different countries (Missinne et al., 2014). The presence of

322
depressive symptoms was defined as CES-D ≥4 as per previous publications
(Demakakos et al., 2013;Mark Hamer et al., 2012;Malgaroli et al., 2017;Mhaoláin et al.,
2012;Steffick, 2000). This conservative threshold has been found to produce comparable
results to the >16 cut off on the well-validated 20-item CES-D scale (Radloff,
1977;Steffick, 2000).
8.6.4 Depressive symptoms and inflammation as a combined variable
In order to ascertain whether the combination of depressive symptoms and inflammation
predicts mortality, the variables based on wave 2 assessments were combined and four
new variables were computed: ‘no depressive symptoms/low inflammation’, ‘no
depressive symptoms/high inflammation’, ‘depressive symptoms/low inflammation’ and
‘depressive symptoms/high inflammation’.
8.6.5 Mortality
Mortality was ascertained for a mean 7.7 year period for consenting study members
(5,328) by linking to the UK National Health Service mortality register up until 12th
November, 2015. In England, all deaths need to be registered within five days, therefore
participants not registered as dead were assumed to be alive. Deaths were classified
according to International Classification of Diseases (ICD) 10th Edition. Deaths with
ICD10 codes ICD10 codes I00 to I99 were classified as cardiovascular deaths.
8.6.6 Covariates
All covariates were collected at wave two (2004-2005) with the exception of education
and sex which were collected at wave one. All covariates where determined by self-
report, with the exception of body mass index (BMI). Age was treated as a continuous
variable. Socioeconomic status (SES) was operationalized by using marital status

323
(married/cohabiting vs. not married/single/divorced), level of education (degree/higher/A-
level, GCSE/O-level/other, no qualifications) and total wealth in tertiles. Total wealth was
defined from the sum of financial, physical (e.g. businesses, land) and housing wealth,
minus debts and pension payments. Health behaviours included: smoking (never
smoked, ex-smoker, current smoker) and BMI (<25kg/m2, 25-29.99kg/m2, >30+kg/m2)
(Banks et al., 2006). The presence of chronic diseases were added as separate variables
and defined as yes/no. They were calculated as lifetime self-reported physician
diagnoses of chronic conditions (i.e. cardiovascular disease (myocardial infarction and
stroke), chronic lung disease, cancers (of any site) and emotional, nervous and
psychiatric problems).
The covariates were included because they have all been shown to be associated with
mortality and are therefore potential confounders (Marmot et al., 2012;Pletcher & Moran,
2017;N. D. Wong, 2014). Furthermore, health behaviours such as smoking and BMI were
included as they have been shown to mediate the relationship between depression and
mortality (Joynt et al., 2003).
8.7 Statistical analysis
Baseline characteristics were analysed by depressive symptoms and inflammation
levels. Statistical tests examined the associations of demographic variables with
depressive symptoms/inflammation levels. ANOVA tests were used for continuous
variables and Chi square tests were used for categorical variables.
Differences between the characteristics of the participants included and excluded from
the analysis were analysed. Statistical tests examined the difference in demographic
variables between included and excluded samples. ANOVA tests were used for
continuous variables and Chi square tests were used for categorical variables.

324
The association of depressive symptoms and inflammation levels (separately and in
combination) with CVD and all-cause mortality were assessed by Cox proportional
hazards regression models. The proportionality assumption was tested using Nelson-
Aalen cumulative hazard curves and Schoenfeld residuals. We inspected the plots and
the global test (p = 0.8052) confirming that we do not have a violation of the proportional
assumption. Survival time was measured in months, from the date of interview in wave
2 (2004-2005) to the date of death or 12 November 2015, whichever was first. Kaplan
Meier survival curves are available in Appendix 11.12.
We investigated whether there were significant interactions between age or sex and
depression/inflammation categories in order to determine whether the association
between depression/inflammation levels and mortality varied according to age or
between men and women. We used the likelihood ratio test to compare the goodness
of fit of a stratified model. We found no interaction between sex and depressive
symptoms, however we did find that the association between inflammation and mortality
varied significantly by sex (P value =0.013). There was also an age interaction between
inflammation and mortality, however this disappeared once we stratified our analysis by
sex, therefore we only present the sex-stratified analyses. We first fitted a basic
unadjusted model, which was followed by an age-adjusted model. We then additionally
adjusted for socioeconomic variables, health behaviours and chronic diseases.
To investigate moderation we tested whether a multiplicative interaction between
depressive symptoms and inflammation was significantly associated with mortality. To
investigate mediation we first examined the association between depressive symptoms
and mortality and then added inflammation to see how much of the association was
explained. All analyses were performed using STATA 13.0 (StataCorp LP, College
Station Texas).

325
8.8 Results
8.8.1 Participants
Table 8.1 represents social-demographic characteristics in depression/inflammation
categories in men and women separately. Men and women with concurrent depressive
symptoms and high inflammation were more likely to be poorer, less educated, more
likely to smoke, have a higher BMI and were more likely to have chronic lung disease
and emotional, nervous and psychiatric problems. There were no significant overall
differences in the frequency of cardiovascular disease or cancer between
depression/inflammation levels in either men or women.
There were 420 all-cause male deaths (including 112 CVD related) over mean of 7.6
years follow-up and 334 all-cause female deaths (including 109 CVD related) over a
mean of 7.8 years follow-up. Out of a total of 5,328 people, we identified 420 all-cause
deaths in men and 334 in women during 18,594 and 22,519 person-years, respectively.
An analysis was conducted to determine any differences between the analytic sample
and the excluded sample. Table 8.2 summarises the results. Participants included and
excluded from the analysis did not differ significantly in terms of sex. The group included
in the analysis was younger, less likely to be depressed, more likely to be married, more
educated and wealthier than the group who was excluded.

326
Table 8.1. Baseline characteristics of men and women aged 52-89 years by depressive symptoms and inflammation level
Men Women
Depressive symptoms/inflammation level
No
depressive
symptoms/
normal CRP
No
depressive
symptoms/
high CRP
Depressive
symptoms/
normal CRP
Depressive
symptoms/
high CRP
P value No
depressive
symptoms/
normal CRP
No
depressive
symptoms/
high CRP
Depressive
symptoms/
normal CRP
Depressive
symptoms/
high CRP
P value
Number 1,551 668 132 98 1,542 864 275 198
Mean age
(SD) (years) 64.9 (8.8) 67 (9.1) 64.5 (9.1) 66.9 (9.9) <0.001 65 (9.0) 66.5 (9.2) 67.3 (10.3) 67.4 (9.7) <0.001
Marital
status (%)
Married 1,252 (80.7) 501 (75) 79 (59.9) 60 (61) <0.001 1,023 (66.3) 530 (61.3) 128 (46.6) 83 (41.9) <0.001
Not married 299 (19.3) 167 (25) 53 (40) 38 (39) 519 (33.7) 334 (38.7) 147 (53.5) 115 (58.1)

327
Table 8.1. continued. Baseline characteristics of men and women aged 52-89 years by depressive symptoms and inflammation level
Men Women
Depressive symptoms/inflammation level
No
depressive
symptoms/
normal CRP
No
depressive
symptoms/
high CRP
Depressive
symptoms/
normal CRP
Depressive
symptoms/
high CRP
P
value
No
depressive
symptoms/
normal CRP
No
depressive
symptoms/
high CRP
Depressive
symptoms/
normal CRP
Depressive
symptoms/
high CRP
P value
Education
(%)
Degree/
Higher/
A-level
700 (45.1) 228 (34.1) 43 (32.6) 27 (27.6) <0.001 458 (29.7) 191 (22.1) 51 (18.6) 39 (19.7) <0.001
GCSE/O-
level/Other
qualification
444 (28.6) 203 (30.4) 37 (28) 27 (27.6) 555 (36) 281 (32.5) 98 (35.6) 53 (26.8)
No
qualification 407 (26.2) 237 (35.5) 52 (39.4) 44 (44.9) 529 (34.3) 392 (45.4) 126 (45.8) 106 (53.54)

328
Table 8.1. continued. Baseline characteristics of men and women aged 52-89 years by depressive symptoms and inflammation level
Men Women
Depressive symptoms/inflammation level
No
depressive
symptoms/
normal CRP
No
depressive
symptoms/
high CRP
Depressive
symptoms/
normal CRP
Depressive
symptoms/
high CRP
P
value
No
depressive
symptoms/
normal CRP
No
depressive
symptoms/
high CRP
Depressive
symptoms/
normal CRP
Depressive
symptoms/
high CRP
P
value
Total Wealth
(%)
Richest tertile 688 (44.4) 203 (30.4) 40 (30.3) 17 (17.4) <0.001 681 (44.2) 228 (26.4) 73 (26.6) 28 (14.1) <0.001
Intermediate
tertile 531 (34.2) 252 (37.7) 35 (26.5) 35 (35.7) 486 (31.5) 323 (37.4) 89 (32.4) 82 (41.4)
Poorest
tertile 332 (21.4) 213 (31.9) 57 (43.2) 46 (46.9) 375 (24.3) 313 (36.2) 113 (41.1) 88 (44.4)

329
Table 8.1. continued. Baseline characteristics of men and women aged 52-89 years by depressive symptoms and inflammation level
Men Women
Depressive symptoms/inflammation level
No
depressive
symptoms/
normal CRP
No
depressive
symptoms/
high CRP
Depressive
symptoms/
normal CRP
Depressive
symptoms/
high CRP
P
value
No
depressive
symptoms/
normal CRP
No
depressive
symptoms/
high CRP
Depressive
symptoms/
normal CRP
Depressive
symptoms/
high CRP
P
value
Smoking
status (%)
Never a
smoker 496 (32) 149 (22.3) 34 (25.8) 15 (15.3) <0.001 743 (48.2) 379 (43.9) 107 (38.9) 65 (32.8) <0.001
Ex-smoker 894 (57.6) 383 (57.3) 73 (55.3) 57 (58.2) 634 (41.1) 355 (41.1) 126 (45.8) 79 (39.9)
Current
smoker 161 (10.4) 136 (20.4) 25 (18.9) 26 (26.5) 165 (10.7) 130 (15.1) 42 (15.3) 54 (27.3)

330
Table 8.1. continued. Baseline characteristics of men and women aged 52-89 years by depressive symptoms and inflammation level
Men Women
Depressive symptoms/inflammation level
No
depressive
symptoms/
normal CRP
No
depressive
symptoms/
high CRP
Depressive
symptoms/
normal CRP
Depressive
symptoms/
high CRP
P
value
No
depressive
symptoms/
normal CRP
No
depressive
symptoms/
high CRP
Depressive
symptoms/
normal CRP
Depressive
symptoms/
high CRP
P
value
Body Mass
Index (%)
<25kg/m2 403 (26.8) 123 (19.3) 35 (27.8) 20 (23.5) <0.001 606 (40.5) 121 (14.9) 98 (37) 32 (17.5) <0.001
25-
29.99kg/m2 777 (51.7) 306 (48.1) 59 (46.8) 32 (37.7) 628 (42) 285 (35) 113 (42.6) 65 (35.5)
>30+kg/m2 323 (21.5) 207 (32.6) 32 (25.4) 33 (38.8) 262 (17.5) 408 (50.1) 54 (20.4) 86 (47)

331
Table 8.1. continued. Baseline characteristics of men and women aged 52-89 years by depressive symptoms and inflammation level
Men Women
Depressive symptoms/inflammation level
No
depressive
symptoms/
normal CRP
No
depressive
symptoms/
high CRP
Depressive
symptoms/
normal CRP
Depressive
symptoms/
high CRP
P
value
No
depressive
symptoms/
normal CRP
No
depressive
symptoms/
high CRP
Depressive
symptoms/
normal CRP
Depressive
symptoms/
high CRP
P value
Chronic
disease
CVD (% yes) 115 (7.41) 61 (9.13) 14 (10.61) 14 (14.29) 0.052 48 (3.11) 31 (3.59) 14 (5.09) 14 (7.07) 0.026
Cancer (%
yes) 85 (5.48) 46 (6.89) 7 (5.30) 11 (11.22) 0.093 139 (9.01) 58 (6.73) 26 (9.49) 14 (7.07) 0.191
Chronic lung
disease
(% yes)
78 (5.03) 70 (10.48) 10 (7.58) 18 (18.37) <0.001 55 (3.57 69 (8.00) 31 (11.31) 33 (16.67) <0.001
Emotional,
nervous,
psychiatric
problems
(% yes)
81 (5.22) 32 (4.79) 25 (18.94) 22 (22.45) <0.001 159 (10.31) 81 (9.40) 58 (21.17) 51 (25.76) <0.001
Abbreviations: CRP = C-reactive protein; SD = standard deviation; kg = kilogram; m2 = meters squared.

332
Table 8.2. Characteristics of participants included and excluded from the analyses
Participants included in the
survival analysis
(n=5,328)
Participants excluded due to
no mortality data
(n=281)
All other participants
excluded
(n=3,061)
P value
Men (%) 2,449 (45.95) 123 (43.77) 1,340 (43.78) 0.137
Mean age (SD) (years) 65.67 (9.16) 69.46 (10.29) 67.73 (9.75) >0.001
Depression status (% yes) 703 (13.19) 49 (19.07) 565 (19.60) >0.001
Marital status (% yes) 3,656 (68.62) 163 (58.01) 1,893 (61.84) >0.001
Education (%) >0.001
Degree/Higher/A-level 1,737 (32.60) 78 (28.36) 838 (27.41)
GCSE/O-level/Other 1,698 (31.87) 75 (27.27) 840 (27.48)
No qualification 1,893 (35.53) 122 (44.36) 1,379 (45.11)

333
Table 8.2. continued. Characteristics of participants included and excluded from the analyses
Participants included in the
survival analysis
(n=5,328)
Participants excluded due to
no mortality data
(n=281)
All other participants
excluded
(n=3,061)
P value
Wealth (%) >0.001
Wealthiest tertile 1,958 (36.75) 89 (32.01) 820 (27.84)
Intermediate tertile 1,833 (34.40) 83 (29.86) 938 (31.85)
Poorest tertile 1,537 (28.85) 106 (38.13) 1,187 (40.31)
Abbreviations: SD = standard deviation.
334
8.8.2 Depressive symptoms and inflammation as a combined predictor
of CVD mortality
In men, depressive symptoms alone were not associated with any significant increase in
risk of death, whilst high inflammation was associated with a 238% (HR: 3.38; 95% CI
2.23-5.10) increased risk. Men with both depressive symptoms and high inflammation
had a 584% (HR: 6.84; 95% CI 3.71-12.6) increased CVD mortality risk. This association
remained significant after adjustment for age, SES and health behaviours, with men who
had both depressive symptoms and high inflammation demonstrating a 289% (HR: 3.89;
95% CI 2.04-7.44) increased risk of death (P value <0.001) (Table 8.3 and Figure 8.1).
In women the associations were more modest and failed to reach significance (Table
8.3).
8.8.3 Depressive symptoms and inflammation as a combined predictor
of all-cause mortality
In men, the direction of results was similar for all-cause mortality. Depressive symptoms
alone were not associated with a significant increase in risk of death, whilst high
inflammation was associated with a 91% (HR: 1.91; 95% CI 1.55-2.36) increased risk,
compared to men with neither. Men with both depressive symptoms and high
inflammation had a 241% (HR: 3.41; 95% CI 2.39-4.86) increased mortality risk. This
association was attenuated after adjustment for age, SES and smoking. However the
association remained significant, with men who had both depressive symptoms and high
inflammation demonstrating a 140% (HR: 2.40; 95% CI 1.65-3.48) increased risk of
death (Figure 8.1).
The results for women were different. In the unadjusted model, both depressive
symptoms and high inflammation separately increased risk of death by 85% (HR: 1.85;
95% CI 1.32-2.59) and 48% (HR: 1.48; 95% CI 1.16-1.90), respectively. The combination
335
of both depressive symptoms and high inflammation increased risk to 89% (HR: 1.89;
95% CI 1.29-2.76), only marginally more than depressive symptoms alone. The
increased risk of depressive symptoms and high inflammation to all-cause mortality in
women was explained by age as after adjustments the risk was no longer significant
(Table 8.3).
8.8.4 Effects of moderation and mediation
Moderation analysis showed that an interaction term of depressive symptoms by
inflammation was not significantly associated with mortality in all categories: all-cause
mortality in men (p=.426); all-cause mortality in women (p=.155); CVD mortality in men
(p= .868) and CVD mortality in women (p=.481). This suggests that the mortality risk
conferred by increased levels of inflammation is not further augmented by depressive
symptoms. Mediation analysis showed that the strength of the association between
depressive symptoms and mortality was not reduced by including inflammation,
suggesting a direct effect of depressive symptoms on mortality risk (Table 8.4).

336
Table 8.3 Association between depressive symptoms/inflammation and all-cause and cardiovascular mortality by sex
Men Women
Depressive symptoms/inflammation level
No depressive
symptoms/
normal CRP
No depressive
symptoms/
high CRP
Depressive
symptoms/
normal CRP
Depressive
symptoms/
high CRP
No
depressive
symptoms/
normal CRP
No depressive
symptoms/
high CRP
Depressive
symptoms/
normal CRP
Depressive
symptoms /
high CRP
Model
All-cause mortality
Model 1 HR
(95% CI)
p-valuesa
1.00
(reference)
1.91
(1.55-2.36)
<0.001
1.42
(0.93-2.17)
0.104
3.41
(2.39-4.86)
<0.001
1.00
(reference)
1.48
(1.16-1.90)
0.002
1.85
(1.32-2.59)
<0.001
1.89
(1.29-2.76)
0.001
Model 2 HR
(95% CI)
p-valuesb
1.00
(reference)
1.63
(1.32-2.00)
<0.001
1.47
(0.97-2.25)
0.072
3.03
(2.12-4.32)
<0.001
1.00
(reference)
1.23
(0.96-1.57)
0.104
1.34
(0.95-1.87)
0.093
1.44
(0.98-2.10)
0.060
Model 3 HR
(95% CI)
p-valuesc
1.00
(reference)
1.54
(1.25-1.90)
<0.001
1.29
(0.84-1.98)
0.242
2.59
(1.80-3.74)
<0.001
1.00
(reference)
1.18
(0.92-1.51)
0.199
1.27
(0.90-1.78)
0.168
1.30
(0.89-1.92)
0.176

337
Table 8.3 continued. Association between depressive symptoms/inflammation and all-cause and cardiovascular mortality by sex
Men Women
Depressive symptoms/inflammation level
No depressive
symptoms/
normal CRP
No depressive
symptoms/
high CRP
Depressive
symptoms/
normal CRP
Depressive
symptoms/
high CRP
No
depressive
symptoms/
normal CRP
No
depressive
symptoms/
high CRP
Depressive
symptoms/
normal CRP
Depressive
symptoms /
high CRP
Model
All-cause mortality
Model 4 HR
(95% CI)
p-valuesd
1.00
(reference)
1.49
(1.20-1.84)
<0.001
1.27
(0.83-1.96)
0.273
2.40
(1.65-3.48)
<0.001
1.00
(reference)
1.09
(0.84-1.41)
0.536
1.18
(0.84-1.66)
0.336
1.15
(0.77-1.70)
0.501
Model 5 HR
(95% CI)
p-valuese
1.00
(reference)
1.46
(1.18-1.81
<0.001
1.24
(0.80-1.90
0.337
2.09
(1.43-3.07)
<0.001
1.00
(reference)
1.11
(0.85-1.44)
0.436
1.12
(0.79-1.58)
0.336
1.10
(0.74-1.65)
0.629

338
Table 8.3 continued. Association between depressive symptoms/inflammation and all-cause and cardiovascular mortality by sex
Men Women
Depressive symptoms/inflammation level
No
depressive
symptoms/
normal CRP
No
depressive
symptoms/
high CRP
Depressive
symptoms/
normal CRP
Depressive
symptoms/
high CRP
No
depressive
symptoms/
normal CRP
No
depressive
symptoms/
high CRP
Depressive
symptoms/
normal CRP
Depressive
symptoms /
high CRP
Model
Cardiovascular disease mortality
Model 1 HR
(95% CI)
p-valuesa
1.00
(reference)
3.38
(2.23-5.10)
<0.001
1.86
(0.79-4.38)
0.159
6.84
(3.71-12.6)
<0.001
1.00
(reference)
1.45
(0.96-2.2)
0.079
1.27
(0.66-2.44)
0.417
1.29
(0.61-2.71)
0.508
Model 2 HR
(95% CI)
p-valuesb
1.00
(reference)
2.81
(1.86-4.26)
<0.001
1.91
(0.81-4.51)
0.140
5.78
(3.13-10.68)
<0.001
1.00
(reference)
1.14
(0.75-1.73)
0.540
0.81
(0.42-1.56)
0.531
0.93
(0.44-1.97)
0.857
Model 3 HR
(95% CI)
p-valuesc
1.00
(reference)
2.56
(1.68-3.89)
<0.001
1.51
(0.63-3.62)
0.354
4.50
(2.39-8.47)
<0.001
1.00
(reference)
1.09
(0.71-1.67)
0.685
0.76
(0.39-1.46)
0.407
0.84
(0.40-1.80)
0.658
Model 4 HR
(95% CI)
p-valuesd
1.00
(reference)
2.43
(1.59-3.71)
<0.001
1.50
(0.63-3.60)
0.361
3.89
(2.04-7.44)
<0.001
1.00
(reference)
0.92
(0.59-1.44)
0.715
0.69
(0.35-1.33)
0.267
0.69
(0.32-1.50)
0.353

339
Table 8.3 continued. Association between depressive symptoms/inflammation and all-cause and cardiovascular mortality by sex
Men Women
Depressive symptoms/inflammation level
No
depressive
symptoms/
normal CRP
No
depressive
symptoms/
high CRP
Depressive
symptoms/
normal CRP
Depressive
symptoms/
high CRP
No
depressive
symptoms/
normal CRP
No
depressive
symptoms/
high CRP
Depressive
symptoms/
normal CRP
Depressive
symptoms /
high CRP
Model
Cardiovascular disease mortality
Model 5 HR
(95% CI)
p-valuese
1.00
(reference)
2.42
(1.58-3.69)
<0.001
1.44
(0.60-3.46)
0.413
3.25
(1.66-6.40)
0.001
1.00
(reference)
0.96
(0.62-1.50)
0.866
0.69
(0.35-1.35)
0.275
0.68
(0.32-1.49)
0.338
Abbreviations: HR = Hazard ratio; CI = Confidence interval; CRP= C-reactive protein. Cox regression survival analysis models, stratified by sex, are adjusted as follows: aInflammation and depressive symptoms as main effects; bas model 1, plus adjustment for age; cas model 2, plus adjustment for socioeconomic variables (marital status, level of education, total wealth), das model 3, plus adjustment for health behaviours (smoking, body mass index) and ea model 4, plus individually adjustment for chronic diseases (cardiovascular disease, cancers, chronic lung disease and emotional, nervous and psychiatric problems)

340
Figure 8.1. Adjusted hazard ratios for CVD and all-cause mortality according to levels of depressive symptoms and inflammation in men.
0
1
2
3
4
Mo
rta
lity
ris
k
lo w C R P
h ig h C R P
N o d e p re s s io n P o s s ib le D e p re s s io n
0
2
4
6
8
Mo
rta
lity
ris
k
N o d e p re s s io n P o s s ib le D e p re s s io n
C V D A ll c a u s e m o r ta lity
*
*
*
*
* Statistically significant at P<0.001. Abbreviations: CVD = Cardiovascular disease; CRP = C-reactive protein. Hazard ratios are adjusted for age, socioeconomic variables (marital status, level of education, total wealth), health behaviours (smoking, body mass index) and chronic diseases (cardiovascular disease, cancers, chronic lung disease and emotional, nervous and psychiatric problems). n=5,328

341
Table 8.4. Mediation analyses (n=5,328)
Model 1a Model 1 + dichotomous CRPb Model 1 + continuous CRPc
Men
All-cause mortality (420 deaths)
HR (95% CI) 1.61 (1.06-2.44) 1.56 (1.03-2.37) 1.65 (1.08-2.50)
Cardiovascular mortality (112 deaths)
HR (95% CI) 1.73 (0.83-3.61) 1.59 (0.76-3.29) 1.82 (0.73-3.79)
Women
All-cause mortality (334 deaths)
HR (95% CI) 1.01 (0.70-1.45) 1.02 (0.71-1.46) 1.00 (0.69-1.44)
Cardiovascular mortality (109 deaths)
HR (95% CI) 0.55 (0.27-1.13) 0.55 (0.27-1.14) 0.55 (0.27-1.13)
Abbreviations: HR = Hazard ratio; CI = Confidence interval; CRP= C-reactive protein Mediation analysis models, stratified by sex, are adjusted as follows: a Chronic symptoms of depression (wave 1 and wave 2) as main effects, plus adjustment for age, socioeconomic variables (marital status, level of education, household wealth) and chronic disease (cardiovascular disease, cancers, chronic lung disease); b as model, 1 plus adjustment for CRP dichotomised into two categories: <3mg/L defined as normal and 3-20mg/L defined as high; and c as model 1, plus adjustment for continuous CRP.

342
8.9 Discussion
8.9.1 Aims and hypotheses
The aim of this study was to examine the combined effect of depressive symptoms and
inflammation on CVD and all-cause mortality in a large cohort of older adults. We also
sought to investigate whether depressive symptoms moderate the mortality risk
associated with increased inflammation or whether inflammation could be mediating the
association between depressive symptoms and mortality. I hypothesised that people with
both depressive symptoms and inflammation will have significantly greater mortality risk
than people with depressive symptoms or inflammation alone (hypothesis1). I also
hypothesised that depressive symptoms and inflammation will have largely independent
effects on mortality (hypothesis 2).
8.9.2 Summary of results
The results from this study provide partial support for both these hypotheses. We found
that older men, with both depressive symptoms and high levels of inflammation, have a
significantly increased risk of CVD and all-cause mortality compared to men with
depressive symptoms or inflammation alone. However we found no significant increased
risk in women. In addition, our findings demonstrate independent effects of depressive
symptoms and inflammation on mortality, finding no evidence of either moderation or
mediation.
8.9.3 Depression, inflammation and mortality
We demonstrated an increased risk of all-cause mortality in the comparison between
men with high and low baseline levels of inflammation. The addition of depression to the
model increased the risk substantially suggestive of a particularly high-risk phenotype in
men. This supports findings in healthy, older men showing that high inflammation

343
predicted cardiovascular events only in people with depressed mood (Ladwig et al.,
2005). These findings suggest that depression and inflammation might cause CVD
through separate physiological pathways, such as elevated interleukin-6 upstream of
CRP (Ridker, 2016), triglycerides (Parekh et al., 2017), cortisol as a result of stress-
induced hyperactivity of the hypothalamic-pituitary-adrenal axis (Jokinen and Nordstrom,
2009), endothelial dysfunction (Chen et al., 2011) and platelet activation (Williams et al.,
2014).
Our study found no significant interaction between depressive symptoms and
inflammation on mortality and no effect of mediation, a finding which is supported by
other studies, but not by all. To our knowledge, there is only one other study which looked
at the potential synergistic effect of depressive symptoms and inflammation in the
prediction of cardiovascular events. Ladwig showed a significant interaction between
depressive symptoms and inflammation in the prediction of cardiovascular events,
suggesting a shared underlying mechanism (Ladwig et al., 2005). These authors,
however, have only investigated men.
Most previous studies have investigated the effects of inflammation mediating the
association between depression and all-cause or CVD mortality showing either no or
small effect. Similar to our study, Empana et al., (2005) showed that men with depressive
symptoms had a 53% increase in the odds of CHD and the association remained
unchanged when inflammatory markers were added to the model. Davidson et al., 2009
found that depressive symptoms increased the risk of incident CHD ; this risk was not
explained by increased inflammation in either men or women. Nabi et al., 2008 also
found an association between psychological distress and incident CHD which remained
after adjustment for inflammatory markers. Contrary to our study and the studies cited
above, there has also been reports of mediation. Hughes et al., (2016) reported an
association between depressive symptoms and all-cause mortality which was partly
explained by inflammation (CRP 7.3%). Inflammation partly mediated the predictive

344
value of depressive symptoms by 6.5% in cardiovascular mortality risk (Kop et al., 2010),
and by 8.1% in cardiovascular hospitalization (Hiles et al., 2015). This supports the
knowledge that other pathways are also involved on the depression and mortality link.
8.9.4 Effect of gender on the link between depressive symptoms,
inflammation and mortality
Clear sex-specific differences were observed in the inter-relationships of depressive
symptoms, inflammation and mortality in this study. The combination of depressive
symptoms and inflammation only conferred an increased mortality risk in men. A
previous population cohort study investigating inflammation and mortality also showed
sex differences. Ahmadi-Abhari et al. reported that high levels of CRP increased mortality
risk in men at lower clinical threshold categories than in women, most notably for CVD
mortality (2013). A similar trend has also been observed in the development of CHD. In
a study of older men and women, Cushman et al. showed that the presence of high
inflammation was predictive of CHD in men with intermediate Framingham Risk Scores,
whereas it only became predictive of CHD in women with a high Framingham risk (2005).
Furthermore a large meta-analysis showed that inflammation only discriminated 10-year
risk of cardiovascular events in men, but not in women (Kaptoge et al., 2012). Some
reports on the association between depression and inflammation also support our
findings, although not all. Two large population cohort studies have shown that major
depression/depressive symptoms and inflammation are more strongly associated in men
than in women (Ford and Erlinger, 2004, Elovainio et al., 2009). However in contrast, in
a study of 508 healthy adults, depressive symptoms were only associated with
inflammation in women, not in men (Ma et al., 2010). Furthermore, a study of women
with suspected coronary ischemia demonstrated a robust association between
depressive symptoms and inflammation which was not explained by CVD risk factors
(Vaccarino et al., 2007).

345
Further speculation on gender differences is inspired by a recent review from Raison and
Miller (2017). The authors propose that in evolutionary terms, depression may have
provided an adaptive advantage to women. Inflammation was detrimental to fertility in
ancestral environments (Van Bodegom, 2007; Schaller, 2011; Koybayashi, 2013).
Depressive symptoms promoted sickness behaviours (e.g. lethargy, psychomotor
slowing and social withdrawal) which provided increased protection against pathogens
(e.g. by conserving energy for an immune response), thereby reducing the need for a
high inflammatory response. This is supported by findings which show that women
demonstrate increased levels of depression in response to inflammatory challenge
compared to men (Moieni et al., 2015b; Udina et al, 2012). If women are more likely to
develop depression in response to immune activation then it is possible that the presence
of depressive symptoms is likely to reflect less severe underlying biological pathology
compared to men and consequently lower mortality risk. Whilst this explanation is
intuitively appealing, further research is required to confirm gender specific immune
mechanisms in depression.
Another possible explanation for our observed sex differences is the influence of sex
hormones, particularly the protective effect of oestrogen on the heart. In people under
75, the incident of cardiovascular related death is lower in women than in men (British
Heart Foundation, 2014), with the development of atherosclerosis occurring post
menopause in 95% of women (Fairweather, 2014). Even at 65-74 years of age, almost
two decades after the average occurrence of menopause, women have substantially
lower incidence of CVD compared to men. This suggests that former exposure to
endogenous estrogen may be atheroprotective long after menopause. Women have also
been shown to have longer telomeres than men (Gardner et al., 2014). Shorter telomeres
have been associated with early death in the general population (Weischer et al., 2012)
although findings are inconsistent (Bojesen, 2013). Telomere length has been more
robustly associated with CHD, independently of traditional vascular risk factors (Haycock
et al., 2014). It is not yet understood exactly why women differ from men in the

346
development of CHD, however to date women have been underrepresented in
cardiovascular trials, resulting in a bias towards factors which are relevant to disease
aetiology in men (Fairweather, 2014).
Current National Institute for Health and Clinical Excellence (NICE) guidelines
recommend the use of the QRISK2 risk assessment tool to assess risk for the primary
prevention of CVD in both men and women up to 84 years (National Institute for Health
and Care Excellence, 2014). There has been some debate as to whether or not the
addition of circulating inflammatory markers, such as CRP, should now be included in
screening measures for cardiovascular risk (Pearson et al., 2003, Peters et al., 2013).
The main uncertainty seems to be whether the modest increases in risk associated with
higher inflammation can significantly affect health. This is understandable when
considering that population studies have shown that CRP is a relatively moderate
predictor of CVD risk, yielding an odds ratio of 1.5 when comparing the top baseline
tertile with the bottom (Danesh et al., 2004). In addition, when compared to traditional
risk factors, such as smoking and total cholesterol, CRP only slightly improved their
predictive value. Our study demonstrates that men with comorbid depressive symptoms
and high inflammation constitute a clinically meaningful risk category. In light of these
findings, it might be worth considering inflammation as a cardiovascular risk factor in
depressed men. This could help identify patients who may benefit from targeted
prophylactic intervention, improving screening efficacy and cardiovascular outcomes.
8.9.5 Study strengths and limitations
The strengths of our study include the prospective design, the presence of both women
and men and the nationally representative nature of the ELSA cohort. Despite this, our
study also has limitations. The first limitation of this study is that we measured depressive
symptoms and inflammation at only one time point at wave 2 (2004-2005) and did not
investigate any change in levels at a later points. This design was chosen in order to

347
maximize the number of participants with inflammation and depressive symptoms at
baseline and to allow a longer follow-up period to capture mortality.
Nevertheless, we did not find an association of depressive symptoms and mortality in
the absence of inflammation. In a recent study using the same cohort, which considered
depressive symptoms across several years, a dose-response association was observed
between persistency of depressive symptoms across time and mortality risk (White et
al., 2016). Similar to these findings, data from the Longitudinal Aging Study Amsterdam
(LASA) also found that transient depressive episodes did not predict mortality although
chronic depression did (Geerlings et al., 2002). Secondly, we also did not control for
medication use in our analysis, as this data was not available. Statins, for example,
present anti-inflammatory effects (Antonopoulos et al., 2012) and therefore medication
use may have interfered with current findings. Thirdly, our study had a smaller proportion
of female deaths compared to male deaths and therefore it is unclear whether our lack
of association in women reflects an absence of an effect or is a result of insufficient
power. The only closest previous study to date investigated combined depressive
symptoms and inflammation in the development of CVD and was restricted to men. In
order to explore this we conducted a post hoc power calculation in STATA. The
calculation showed that the study was sufficiently powered to detect an effect in men for
both CVD and all-cause mortality (CVD & all-cause: power=1.00), however in women
there was insufficient power (CVD: power=0.52, all-cause: power=0.14). We cannot
speculate as to whether this is due to the fact that our effect size is very small or whether
there is in fact no effect in women. The only other study to investigate combined
depressive symptoms and inflammation in CVD development restricted their sample to
men only. Therefore, we had no prior effect on which to base a power calculation. Finally,
in our study depressive symptoms were measured by an 8 item self-reported
questionnaire, rather than a diagnostic interview. Short scales such as this have
previously been criticised for a lack of specificity. To address this, we defined depressive

348
symptoms using a conservative cut-off of 4, which increases the measure’s ability to
discriminate between true and false positives.
8.9.6 Conclusion
In conclusion, we demonstrated that men with concurrent depressive symptoms and
increased inflammation constitute a high-mortality risk phenotype. This risk is particularly
high for cardiovascular related death. These findings have clinical implications for the
treatment and prevention of depression and inflammation in men. Subgroups of
depressed individuals with comorbid inflammation may benefit from additional anti-
inflammatory pharmacotherapy. Further research is needed to investigate whether
combined interventions improve outcomes.

349
9. Discussion
9.1 Overview
There is a robust literature associating immune dysregulation with depression, however
the exact nature of this relationship is not completely understood. An interaction between
immune and neuroendocrine function provides a potential explanatory pathway. This
PhD consisted of two studies that aimed to explore the role of inflammation in
depression, using two different methods of investigation. Firstly, an observational case-
control study was used to assess differences in immune and HPA-axis function, and
associations between them, in people with MDD compared to healthy controls. In
addition, this study investigated the longitudinal association between inflammation and
HPA-axis function in relation to depressive symptom remission. Secondly, a prospective
cohort study was used to investigate the combined effects of depressive symptoms and
inflammation on mortality risk.
In Study 1a (presented in Chapter 3), differences in inflammatory cytokines, diurnal
cortisol rhythm and in vitro corticosteroid function were investigated cross-sectionally in
37 people with MDD and 30 healthy controls. Following on from this, in Study 1b
(presented in Chapter 4) changes in depressive symptoms, inflammatory cytokines,
diurnal cortisol parameters and corticosteroid receptor function were investigated
longitudinally in people with MDD. Study 1c (presented in Chapter 6) investigated
differences in Treg frequency and associations with inflammatory cytokines and
neuroendocrine function in people with MDD compared with healthy controls. Study 2
(presented in Chapter 8) assessed the combined effects of depressive symptoms and
inflammation on CVD and all-cause mortality risk in older people. In this chapter the
hypotheses and findings of these two studies will be briefly summarised and the
contribution of these studies to the literature will be highlighted. Limitations of this thesis,
implications of this work and ideas for future research will also be discussed.

350
9.2 Main findings and their implications
9.2.1 Study 1a: The Resist Study results: The association between
inflammation and HPA-axis function in people with MDD compared with
healthy controls
There is an extensive literature (Chapter 1, Section 1.4.2) implicating inflammation in the
pathogenesis of depression. Several meta-analyses show increases in pro-inflammatory
cytokines in depressed people compared with healthy controls (Dowlati et al.,
2010;Goldsmith et al., 2016b;Hiles et al., 2012b;Howren et al., 2009;Kohler et al.,
2017;Y. Liu et al., 2012). Longitudinally, inflammation has been associated with the
subsequent development of depressive symptoms (Valkanova et al., 2013) and
depressive symptoms have been associated with subsequent levels of inflammation
(Copeland et al., 2012;Deverts et al., 2010;Huang et al., 2019;Niles et al., 2018;Stewart
et al., 2009). However the pathways through which cytokines contribute to the
development and maintenance of depression are yet to be completely characterised.
A large body of evidence (Chapter 1, Section 1.5) indicates that dysregulation of the
HPA-axis also exists in depressed people (Stetler & Miller, 2011). However the direction
of dysregulation regarding specific diurnal cortisol parameters is unclear. Furthermore,
whilst there is robust evidence of reduced GR sensitivity in vitro (Bauer et al., 2003;Calfa
et al., 2003;Lowy et al., 1984;Lowy et al., 1988;G. E. Miller et al., 2005b;Rupprecht et
al., 1991c;Tanke et al., 2008;Wodarz et al., 1991;Wodarz et al., 1992) and in vivo
(Bardeleben & Holsboer, 1989;Gonul et al., 2017;Gormley et al., 1985;Heuser et al.,
1994;Holsboer-Trachsler et al., 1991;Holsboer et al., 1987;Lowy et al., 1988;Modell et
al., 1997;von Bardeleben & Holsboer, 1991;A. Wassef et al., 1990), the role of the MR
in MDD is not fully understood. There appears to be an association between
inflammation and HPA-axis function, however the nature of this relationship has yet to

351
be fully elucidated. The few studies that have explored this relationship have largely
reported single measures of HPA-axis function and produced conflicting results.
In Study 1a we hypothesised that people with MDD would exhibit increased levels of
inflammation (IL-6 and TNF-a), disturbed corticosteroid sensitivity (decreased GR
sensitivity, altered MR sensitivity) and altered diurnal cortisol secretion (increased CAR,
increased AUC and flatter cortisol slope), compared with healthy controls. It was also
hypothesised that increased inflammation would be associated with disturbances in
HPA-axis function in the depressed group. Finally, exploratory analyses were conducted
to investigate possible associations between any altered biological pathways and
psychosocial stress.
We observed evidence of dysregulation in both immune and neuroendocrine function in
people with MDD and some of the hypotheses were supported. Consistent with the
literature, TNF-α levels were increased in depressed people compared to controls,
however there were no significant differences in IL-6. In line with our prediction, both GR
and MR sensitivity was reduced in the MDD group. Contrary to expectations, the CAR
AUC was reduced in the MDD group, however there were no significant differences in
the AUC or slope between the groups. We also observed a relationship between
inflammatory activation and diurnal cortisol rhythm. IL-6 was negatively associated with
the CAR and CAR AUC in both groups, whereas TNF-α was associated with reduced
CAR AUC and AUC in the depressed group only. Neither inflammatory biomarker was
associated with corticosteroid sensitivity. No associations between biological and
psychosocial stress variables in depressed people were observed. Sensitivity analyses
restricting the sample to those with moderate/severe depressive symptoms did not alter
the pattern of results. Additional exploratory analyses to examine the influence of
childhood sexual abuse, showed that depressed people who had not experienced sexual
abuse had a significantly lower CAR compared with depressed people who had.

352
Study 1a has contributed to the field by showing dysregulation of multiple biological
pathways in people with MDD. It confirmed previous findings of increased inflammatory
activation in MDD, specifically plasma level of TNF-α (Dowlati et al., 2010;Goldsmith et
al., 2016b;Kohler et al., 2017;Y. Liu et al., 2012). However, contrary to the literature we
found no evidence of elevations in IL-6, despite this being the most reliable finding in this
field (Haapakoski et al., 2015). It is unclear why we observed this null finding, however
there are a number of possible explanations. The reliance on using brief questionnaires
to measure depressive symptoms by many published studies may reflect a broader
sample than in this study, which only included individuals who met criteria for MDD.
There is also the issue of confounding; much of the literature includes studies which fail
to exclude or account for physical or psychiatric co-morbidities. This inevitably allows for
the inclusion of inflammation which is not specific to MDD. Another consideration is that
inflammation may not be a universally related to all depressive subgroups. MDD is a
psychiatrically heterogeneous disorder and inflammatory cytokines may be differentially
associated with specific clusters of symptoms (C. Yang et al., 2018). There is also
tentative evidence to suggest that the elevated TNF-α we observed may reflect
individuals with more persistent depression, however this should be interpreted with
caution as this study was underpowered to perform subgroup analyses.
As hypothesised, GR sensitivity was reduced in depressed people compared with
healthy controls. This is in line with findings from several other in vitro studies (Lowy et
al., 1984;Lowy et al., 1988;Rupprecht et al., 1991;Wodarz et al., 1991;Wodarz et al.,
1992) which have used synthetic glucocorticoids to inhibit mitogen-induced lymphocyte
proliferation. Study 1a measured glucocorticoid inhibition of LPS-stimulated IL-6 levels
in peripheral whole blood, in vitro. To the best of my knowledge this has only been
previously used in a study investigating patients with TRD (Carvalho et al., 2008), PTSD
(Rohleder et al., 2004), and in depressed women undergoing acute stress testing (G. E.
Miller et al., 2005b). Many studies have used the DEX/CRH test in vivo (Bardeleben &
Holsboer, 1989;Gonul et al., 2017;Heuser et al., 1994;Holsboer-Trachsler et al.,

353
1991;Holsboer et al., 1987;Modell et al., 1997;von Bardeleben & Holsboer, 1991),
however this provides a measure of HPA-axis activity rather than a direct measure of
GR function (Pariante, 2004).
This study also reported impaired MR function in depressed people. The literature
regarding MR function in MDD is inconclusive, with studies reporting conflicting results.
There is some evidence to suggest that MR signalling is increased in MDD,
compensating for impaired GR function, but that this compensatory increase is absent in
a subgroup of severely depressed individuals who are exceptionally treatment resistant
(Juruena et al., 2010;Juruena et al., 2009). The balance between GR and MR may
therefore be crucial in identifying patients who may be the least responsive to treatment.
To date only one study has investigated both receptors in depression and this study only
included people with TRD, reporting impaired GR function and retained MR function.
(Juruena et al., 2006). In contrast to the findings reported by Juruena et al. (2006) we
observed impaired function in both receptors. Furthermore, secondary analyses
provided evidence that MR resistance was present even in those with mild symptoms.
To date, MR function in MDD has only been investigated in vivo, using oral administration
of either prednisolone or spironolactone.
Regarding diurnal cortisol rhythm, we found that waking cortisol + 30 minutes and the
CAR AUC was reduced in depressed people compared with controls, suggesting
reduced sensitivity of the HPA-axis to naturally occurring stress. Contrary to my
hypotheses, we observed no difference in either the AUC or the slope between
depressed people and controls. The literature in this field is enormously inconsistent.
Cross-sectional studies, longitudinal studies and those investigating antidepressant
response have all reported conflicting findings. However the largest and most recent
meta-analysis reported that the AUC during the waking period was positively associated
with depressive symptoms, which is in direct contrast to our finding (Boggero et al.,
2017). Our findings tentatively imply that the regulatory mechanisms underlying the CAR

354
may be exhausted in depressed people, possibly due to previous HPA-axis hyperactivity.
We also observed an effect of childhood sexual abuse on the CAR. Depressed people
who had not experienced sexual abuse had a significantly flatter CAR compared with
those who had. The literature is inconsistent regarding the HPA-axis and childhood
maltreatment. In line with our finding, studies specifically investigating the CAR and
childhood maltreatment in depressed adults have reported increased CAR in depressed
people with a history of childhood abuse compared to those without (Lu et al.,
2016;Quevedo et al., 2017). It is possible that this finding reflects a distinct subtype of
depression with different neuroendocrine function. However this interpretation should be
treated with caution and further research is needed.
The review of the published literature conducted for Chapter 1 found several studies
exploring both inflammation and neuroendocrine function in people with MDD and
associations between them, however results are conflicting. This could be explained by
the variability of measures used in this field and the reliance of single measures of HPA-
axis function. A recent review (Perrin et al., 2019) called for future research to combine
multiple independent measures of HPA-axis activity and GR function in order to provide
the best opportunity for detecting any trends in biological dysregulation. Therefore this
study has addressed this gap in the literature by including assessments of inflammatory
cytokine levels (IL-6 and TNF-α), in vitro measures of GR and MR sensitivity and diurnal
cortisol rhythm simultaneously.
We observed that higher levels of plasma TNF-α were associated with a less pronounced
CAR, in depressed people, however this association was not observed for healthy
controls. A flattening of the CAR has previously been associated with depressive
symptoms (Dedovic et al., 2010;Mangold et al., 2011) and MDD (Huber et al.,
2006;Stetler & Miller, 2005), however studies reporting both TNF-α and cortisol levels
have reported conflicting results. Higher plasma cortisol has been reported along with
both increased (Y. Chen et al., 2017;Kahl et al., 2017;Kahl et al., 2015) and decreased

355
TNF-α (Rudzki et al., 2017) in depressed patients compared with controls. Lower plasma
cortisol and lower TNF-α levels have also been reported in MDD patients (Lopes et al.,
2012). This is the first study to assess diurnal cortisol rhythm and TNF-α in MDD. A
negative association between the CAR and TNF-α has been reported in patients with
ADHD (Corominas-Roso et al., 2017) and similarly, an inverse association between
waking cortisol and TNF-α was observed in a population-based sample (DeSantis et al.,
2012).
This result supports the notion that dysregulation of the HPA-axis, as seen in depression,
may be associated with higher levels of inflammation, however the direction of the
association remains unclear. Due to the cross sectional nature of this study, we cannot
differentiate whether the reduced CAR we observed caused higher TNF-α levels or was
itself caused by higher TNF-α levels. It is possible that a chronically activated and
subsequently impaired HPA-axis is less capable of inhibiting a pro-inflammatory
response, resulting in a shift towards an inflammatory state (Varghese et al., 2016). It is
also possible that increased inflammatory cytokines activate the HPA-axis, leading to
subsequent dysregulation. This finding needs to be corroborated by further research. In
addition, whilst blood samples were taken between 8.00am and 10.00am, allowing us to
capture any dynamic relations between inflammation and the CAR and control for
circadian variabilities between the two, we cannot exclude the possible effects of
additional “third” variable that influences both cortisol rhythm and cytokine levels. Studies
experimentally altering cortisol or cytokine levels will provide more data regarding
causality.
Finally, we did not observe any associations between any of the biological variables
which differed between the groups and psychosocial stress. This finding was unexpected
given that we observed both inflammatory and neuroendocrine dysregulation alongside
reports of increased perceived stress in the MDD group. This could be explained by the
nature of our sample which included a high proportion of people from high socioeconomic

356
backgrounds, who may have better psychosocial resources. The lack of association may
also be a reflection of heterogeneity in psychosocial factors, as qualitatively different
types of stress were not explored in this study.
Strengths and limitations
The limitations of this study were addressed in Chapter 3. The main limitations were that
our sample size was small, limiting statistical power and the cross-sectional design,
which prevented us from drawing any causal conclusions. The study was further limited
by potential under-reporting of childhood adversity by the use of retrospective accounts.
It is also possible that participants did not adhere to the cortisol saliva sampling protocol
resulting in reduced reliability of our cortisol data. Additionally, performing the
corticosteroid receptor sensitivity assays in whole blood rather than in isolated PBMCs
prevented us from observing any differences in immune cell populations. Finally the
inclusion of gene expression assays would help to establish GR responsiveness.
Despite these considerations (and others discussed in Chapter 3) I believe this study
offers a novel contribution to the literature for several reasons. Firstly, this study
investigated associations between multiple biological pathways and suggests that there
is a relationship between TNF-α and diurnal cortisol rhythm in MDD. Secondly, this study
is the first to explore both GR and MR in a study of people with MDD compared to healthy
controls and has provided evidence for impaired function in both receptors. Thirdly, this
study has used an in vitro approach to determine receptor sensitivity.

357
9.2.2 Study 1b: The Resist Study follow-up results: Changes in
depression and associations with inflammatory biomarkers and HPA-axis
function at 6 week follow-up
Following on from Study 1a, Study 1b (presented in Chapter 4) compared baseline
measurements of depressive symptoms, inflammatory cytokines, diurnal cortisol
parameters and corticosteroid receptor function in depressed people at baseline and at
six weeks follow-up. There is robust evidence (Chapter 1, Section 1.4.3) that circulating
IL-6 levels are reduced following antidepressant treatment (Hannestad et al., 2011;Hiles
et al., 2012a;Kohler et al., 2018;Wiedlocha et al., 2018). However the findings regarding
TNF-α are less convincing (Hannestad et al., 2011;Hiles et al., 2012a;Wiedlocha et al.,
2018). There is conflicting evidence regarding corticosteroid receptor function and
antidepressant treatment (Chapter 1, Section 1.5.8). Increased GR function following
antidepressant therapy has been demonstrated in vitro in people with MDD (Calfa et al.,
2003) but not in those who are treatment resistant (Bauer et al., 2003;Carvalho et al.,
2008). In vivo findings suggest increased GR sensitivity is associated with symptom
improvement (S. Fischer et al., 2017a;Greden et al., 1983;Holsboer et al., 1982),
however null findings have also been reported (Ventura-Junca et al., 2014). There is
evidence suggesting that MR sensitivity does not change with antidepressant treatment
(Juruena et al., 2010), however treatment resistant individuals demonstrate impaired MR
sensitivity compared to those who respond (Juruena et al., 2010;Juruena et al., 2009).
Symptom remission has been robustly associated with increased CAR following SSRI
therapy (Harmer, Bhagwagar, Shelley, & Cowen, 2003;Ruhe et al., 2015). Higher AUC
has also been observed in remitted patients compared with controls (Aubry et al., 2010).
In Study 1b the associations between any changes in biological parameters and changes
in depressive symptoms were assessed in 34 people with MDD, over a six week follow-
up period. It was hypothesised that any changes in depressive symptoms would be
influenced by baseline levels of inflammation, corticosteroid sensitivity and diurnal
cortisol rhythm, and predicted by change in these biomarkers over time.
358
A significant reduction in depressive symptoms was observed at follow-up, however
contrary to our hypothesis we did not observe any significant changes in either IL-6 or
TNF-α. IL-6 appeared to be increased at follow-up, however the data exhibited high
variability. Additional analyses showed that in people who did not show any clinical
recovery, IL-6 levels were increased, suggesting that increased inflammation may be
associated with persistent depressive symptoms. TNF-α levels were decreased at follow-
up, however this did not reach significance. These null findings could be explained by
the modest reduction in depressive symptoms we observed, which may have reflected
small reductions in inflammation, which we were underpowered to detect.
We did observe a significant improvement in MR sensitivity, however there was no
significant association with improvement in depressive symptoms. Further analyses
showed that the improvement in MR sensitivity was only significant in individuals who
experienced a degree of clinical recovery and was not significant in those who had a
history of previous depressive episodes. This suggests that MR function may be
associated with clinical improvement but not in those with recurrent symptoms. We also
observed a trend for an increase in GR sensitivity over time and speculate that this may
be an effect of antidepressants. Previous studies have reported normalisation of HPA-
axis feedback after antidepressant treatment (Heuser et al., 1996;Linkowski et al., 1987).
One third of the depressed participants in the study were taking antidepressants,
therefore any improvement in GR function could be a neurobiological effect of
medication. To date MR function in depression has only been investigated longitudinally
in vivo.
We also observed a trend towards an increase for the CAR AUC at follow-up although
this was not associated with improvement in clinical symptoms. This is in agreement with
some but not all of the previous studies. In light of the blunted CAR AUC in our depressed
participants at baseline, reported in Chapter 3, these results may be interpreted as a

359
normalisation of the HPA-axis. We also observed a trend towards a steeper cortisol slope
independent of symptom remission. In the absence of a significant change in evening
cortisol this was likely driven by the increase in CAR AUC. Changes to cortisol slope
have not previously been explored longitudinally in depressed people.
In addition, we observed an apparent trend towards a negative pattern of association
between change in TNF-α levels and change in the CAR, suggesting that as TNF-α
decreases the CAR increases. This finding builds on the results from Study 1a which
demonstrated an association between increased TNF-α and a blunted CAR AUC in
depressed people at baseline. The implication of this finding is that in those people who
experience chronic or recurrent depression, an exhausted HPA-axis becomes incapable
of restraining a stimulated TNF-α system. Once clinical symptoms improve, the HPA-
axis normalises gaining back control over TNF-α production.
Strengths and limitations
The limitations of this study were addressed in Chapters 3 and 4. The main limitation of
the follow-up study was the relatively short follow-up period, which may not have been
able to capture any therapeutic effects in people who had recently started antidepressant
treatment. In addition it is not clear why we still observed a decrease in depressive
symptoms over time. Participants were not given any treatment or advice over this period
and none of the participants reported any change in their treatment at follow-up. It is
possible that the interviews provided some transient therapeutic benefit or that
participants may have unconsciously responded to the questionnaires more positively at
follow-up, having misinterpreted the aim of a study.
Despite these considerations (and others) these findings are novel and contribute to the
literature in this field by being the first to investigate changes in inflammation, diurnal
cortisol rhythm and in vitro corticosteroid function over time in the same MDD sample. It

360
has demonstrated that improvements in depressive symptoms co-occur with increased
MR sensitivity. Finally it has indicated a possible longitudinal relationship between TNF-
α and diurnal cortisol rhythm in MDD patients, although this interpretation should be
treated with caution and needs further corroboration.
9.2.3 Study 1c: The Resist Study results: Alterations in regulatory T-
cells and their association with inflammation and HPA-axis function in
people with depression
In Study 1c (presented in Chapter 6) I examined the differences in Treg frequency
between people with MDD and healthy controls, using data from the Resist Study. This
study built upon the findings of Study 1a by assessing the role of adaptive immune
function in MDD and any relationship with established depression related pathways.
There is only a small literature examining Tregs in MDD and the results to date are
inconclusive. Treg frequency has been shown to be both decreased (Y. Chen et al.,
2011;Grosse et al., 2015;Grosse et al., 2016b;Y. Li et al., 2010) and increased (Patas et
al., 2018;H. Suzuki et al., 2017) in depressed people compared with controls. Another
study has reported no difference between the groups (Hasselmann et al., 2018). There
is huge variability between these studies regarding markers used to characterise Treg
populations and the subsets with which they compare them. Study 1c has contributed
to the field by investigating the difference in the percentage of CD4+CD25+ T cells
expressing FoxP3 in people with MDD compared with controls. On the balance of the
evidence to date, it was hypothesised that depressed people would have a significantly
decreased frequency of circulating Tregs compared with healthy controls.
We also investigated the relationship between circulating Tregs and circulating
inflammatory biomarkers (IL-6 and TNF-α), in vitro GR and MR function and diurnal
cortisol rhythm. Findings from several studies have suggested an association between
Tregs and inflammatory activation (Y. Chen et al., 2011;Grosse et al., 2016b;Himmerich

361
et al., 2010;Y. Li et al., 2010). One study has reported an inverse association with IL-6
and TNF-α gene expression, but not circulating IL-6 levels (Grosse et al., 2016b).
Associations between Tregs and circulating TNF-α have not yet been investigated.
Taking the findings of Study 1a into consideration, we hypothesised that the frequency
of circulating Tregs in people with MDD would be significantly, negatively associated with
both IL-6 and TNF-α. To date only two studies have investigated Tregs and HPA-axis
activity simultaneously in MDD. A study by Patas et al. (2018) found no association with
serum ATCH or cortisol levls and another study by Hasselmann et al. (2018) reported no
difference in GR expression in Tregs in MDD patients compared with controls. To date
no one has investigated associations between Tregs and either GR/MR function or
diurnal cortisol rhythm in MDD. Based on our findings in Study 1a regarding disturbed
HPA-axis function and the tentative evidence for reduced Tregs in MDD we hypothesised
that the frequency of circulating Tregs in people with MDD would be significantly
associated with HPA-axis function.
The main finding of the study was that, in contrast to expectation, there was no significant
difference in circulating Tregs between depressed people and healthy controls. This
finding corroborates that of Hasselmann et al. (2018) who observed no differences in
Tregs in un-medicated MDD patients. Given the variability in methodology in this field,
the inconsistency in the findings regarding Treg frequencies in MDD is unsurprising.
Post-hoc power analysis supported the conclusion that the null effect we observed was
genuine and that the findings would not have reached significance with any reasonable
increase in sample size.
Contrary to hypothesis, we did not observe a correlation between Tregs and pro-
inflammatory cytokines in MDD. Grosse et al. (2016b) have previously reported a
negative association with gene expression of both IL-6 and TNF-α, however no
association was observed with serum levels of IL-6. Circulating TNF-α levels have not
previously been investigated in conjunction with Tregs in MDD. Theoretically we would
362
expect to see impaired immune suppression and inflammatory activation in the same
people, however given out null findings regarding Tregs this result is not surprising.
Similarly, we did not observe a correlation between Tregs and neuro-endocrine function
in depressed people. The literature regarding this relationship has only just begun,
however the evidence so far has provided little support for an association between the
two. Further studies are required in order to determine whether any relationship exists.
Strengths and limitations
The limitations of this study were addressed in Chapter 6. The main limitations were a
lack of data on physical activity, which is known to have negative consequences on
immune function and a lack of data on diet, which has also been shown to influence
Tregs. We also did not collect longitudinal data on Tregs and so were unable to
investigate any changes in Tregs over time.
Despite these limitations these findings are novel and contribute to the literature in this
field by being the first to investigate the difference in the percentage of CD4+CD25+ T
cells expressing FoxP3 in people with MDD compared with controls. Furthermore, the
relationship between Tregs and circulating IL-6 and TNF-α, or GR and MR sensitivity has
not yet been investigated. The null findings from this study suggest that there is no
difference in Tregs between people with MDD and healthy controls.
9.2.4 Study 2: Combined influence of depressive symptoms and
systemic inflammation on all-cause and cardiovascular mortality in the
English Longitudinal Study of Ageing (ELSA)
Moving on from the laboratory analyses in Study 1, Study 2 (presented in Chapter 8)
took an epidemiological approach to examining depressive symptoms and inflammation.
This study investigated the combined effects of depressive symptoms and inflammation

363
on CVD and all-cause mortality risk in 5,328 older men and women from the English
Longitudinal Study of Ageing (ELSA). The background to this study was that people with
depression or elevated inflammation are at increased mortality risk (Lasserre et al.,
2016;Schulz et al., 2002;Wulsin et al., 2005;Wulsin et al., 1999), particularly from CVD
(Correll et al., 2017;Laursen et al., 2007;Q. Wu & Kling, 2016). However the relationship
between these factors remains poorly understood. It has been proposed that
inflammation may mediate the association between depression and mortality, however,
evidence is inconsistent with majority of the evidence suggesting independent
associations (K. W. Davidson et al., 2009;Empana et al., 2005;M. Hamer et al.,
2011;Nabi et al., 2008;Surtees et al., 2008a) or minimal effects of mediation (Hiles et al.,
2015;Hughes et al., 2016;Kop et al., 2010;Vaccarino et al., 2007). One study has
examined the combined effects of depressive symptoms and inflammation on the
prediction of coronary events. Ladwig et al. (2005) showed that depressive symptoms
and CRP interact in the prediction of cardiovascular events, however this study was
restricted to men only. It remains unclear whether this combination confers a greater risk
than either depression or inflammation alone, in both men and women.
In addition, this study investigated whether depressive symptoms moderate the mortality
risk associated with CRP or whether CRP mediates the association between depressive
symptoms and mortality. Based on previous findings we hypothesised that people with
both depressive symptoms and elevated CRP would have significantly greater mortality
risk than people with depressive symptoms or increased CRP alone.
As predicted, we found that older men (≥50 years) with both depressive symptoms and
high levels of CRP had an increased risk of CVD and all-cause mortality, independent of
age, socioeconomic variables and health behaviours. This risk was considerably higher
than that conferred by high CRP alone. There was no significant increase in mortality
risk associated with depressive symptoms. However contrary to our hypothesis, neither
depressive symptoms or inflammation or the combination of both significantly predicted
CVD or all-cause mortality in older women. In addition, the results demonstrated

364
independent effects of depressive symptoms and inflammation on mortality, finding no
evidence of either moderation or mediation.
The sex-specific differences we observed in this study are of particular interest. Sex
differences regarding inflammation and CVD risk have been reported previously,
demonstrating increased vulnerability in men compared with women (Ahmadi-Abhari et
al., 2013;Cushman et al., 2005;Kaptoge et al., 2012). Possible explanations include the
protective influence of oestrogen which is thought to have cardio-protective effects until
approximately 70 years of age (Fairweather, 2014). Furthermore, men exhibit shorter
telomeres than women. Shorter telomeres have been associated with mortality and CVD
risk (Gardner et al., 2014;Haycock et al., 2014;Weischer et al., 2012). From an
evolutionary perspective, it is also possible that depression confers an adaptive
advantage for women. Depressive symptoms promote sickness behaviours, reducing
the need for an inflammatory response, which is harmful to fertility. Their presence is
therefore less likely to reflect severe biological pathology (A. H. Miller & Raison, 2016).
Strengths and limitations
The strengths of this study include the prospective design, the inclusion of both women
and men and the nationally representative nature of the cohort. The main limitations of
this study is that we measured depressive symptoms and inflammation at only one time
point only and that we did not control for medication use. Our study had a smaller
proportion of female deaths compared to male deaths possibly reflecting insufficient
power and depressive symptoms were measured by an 8 item self-reported
questionnaire, rather than a diagnostic interview.

365
9.3 Overall summary of findings in this thesis
Taken together, some but not all of our hypotheses were supported by the data in this
PhD. These studies have provided support for dysregulation in both immune and
neuroendocrine function in people with MDD, highlighting increased TNF-α production,
a blunted CAR AUC and reduced sensitivity of both the GR and MR. The results of this
PhD also indicate that there is a relationship between TNF-α and diurnal cortisol rhythm
in MDD. We have also demonstrated that men with concurrent depressive symptoms
and increased inflammation constitute a high-mortality risk phenotype. This work has
shed light on some previously unexplored associations and in combination these studies
contribute to the literature investigating depression and inflammation.
9.4 Methodological issues and limitations
The findings presented in this thesis have to be interpreted in the context of their
limitations. The shortcomings of each study were discussed at the end of every chapter.
Therefore, in this section only the most important issues and broader, overarching
limitations will be discussed.
9.4.1 The study samples
This PhD used two different samples. The samples for Study 1 were taken from the
Resist Study. Study 1 was an observational, case-control study of 37 people with MDD
and 30 healthy controls. In Study 2 the participants (n=5,328) were taken from the
English Longitudinal Study of Ageing epidemiological cohort at wave 2 (2004-2005). In
Study 1, one advantage of the sample used was that they all had a diagnosis of MDD.
This was obtained using the CIS-R, which is a fully structured diagnostic interview,
generating diagnoses which meet ICD-10 criteria for MDD. Therefore we did not solely
rely on the presence of depressive symptoms which may have resulted in a lack of

366
specificity. Another advantage was that each participant had to meet strict exclusion
criteria (see Section 2.2.4) in order to take part in the study. This reduced confounding
due to comorbid psychiatric or medical disorders and medication use which may have
affected the biological pathways under investigation. In Study 2, an advantage of the
sample was the inclusion of both women and men and the nationally representative
nature of the ELSA cohort.
However, these participant samples were not without limitations. In the Resist Study the
strict exclusion criteria vastly reduced the number of eligible participants due to the high
number of co-morbidities in this population. We planned to recruit 60 people with MDD
via a randomised control trial, PANDA. Due to low uptake we changed the recruitment
strategy to include participants from primary care practices across London, iCope
Psychological Therapies Service in Camden and Islington, UCL staff and students and
via an online website. In total, recruitment was conducted over a 16-month period but
despite these endeavours, we only achieved 62% of our target. Approximately 65% of
depressed patients have at least one concurrent psychiatric disorder and 60% have at
least one concurrent general medical condition (Otte, 2008). Comorbidity therefore
appears to be the rule rather than the exception. Feedback from GPs was that the
exclusion criteria was too restrictive. Furthermore, 56% of the patients that were
eventually referred from GP practices, were subsequently excluded during screening.
The consequence of this was that we had a smaller than anticipated sample size,
potentially resulting in a loss of power.
Another shortcoming of the recruitment strategy that applies to Study 1 is that the
recruitment method differed for the depressed participants and healthy controls. Due to
the low response rate and the associated costs of conducting mail outs via GP practices,
we decided to recruit healthy controls from the staff and student population at UCL and
QMUL and from staff within the NIHR Clinical Research Network. Consequently, this
367
sample came from a higher socioeconomic background than the depressed group and
are not representative of non-depressed people living in London.
Another consideration regarding the exclusion criteria is that whilst it increased the
internal validity of the study, enabling us to more confidently assess the biological
correlates of MDD, it also provided us with a sample which does not accurately represent
the MDD community. This artificially rendered our sample more medically healthy and
psychiatrically singular than in the general MDD population and decreased the
generalisability of the results.
Regarding the ELSA sample, there are very few ethnic minority participants, largely due
to costs associated with establishing representative oversamples (Steptoe et al., 2013).
When ELSA started in 2002, the national census indicated that 3.2% of men and women
aged 50 and over were from ethnic minorities. This is the same proportion as in ELSA,
therefore the sample is representative of the older population in England, but that leads
to a rather small number of black, Asian and minority ethnic people. In 2011 the national
census indicated that 19.5% of people were from ethnic minorities, therefore the ELSA
cohort may not adequately reflect the current general population in England. The 2014
Adult Psychiatric Morbidity Survey found the prevalence of common mental health
problems to vary significantly by ethnic group for women (McManus et al., 2016). Black
British women (29.3%) were more found to be more likely to have a common mental
health problem than white British women (20.9%). The under-representation of these
groups may impair the ability of ELSA to fully capture the burden of depressive symptoms
in women.
Additionally data regarding medication use is not collected in the early waves of ELSA.
For example, statins confer anti-inflammatory effects (Antonopoulos et al., 2012).
Antidepressants are also known to reduce circulating inflammatory biomarkers, including
CRP (Hiles et al., 2012a) and antidepressant use is prevalent in 10% of elderly people

368
in the UK (Tamblyn et al., 2019). Therefore medication use may have interfered with our
findings.
Finally, the use of a structured depression interview is not possible in ELSA given the
large, multipurpose design of the study. Thus, we relied on self-reported depressive
symptoms, measured by an eight-item questionnaire. As previously mentioned, short
scales such as this can result in a lack of specificity. Whilst we attempted to address this
issue by using a conservative cut-off score to define the presence of depressive
symptoms, it is possible that we still included false positives.
9.4.2 Biological measurement issues
In Study 1, diurnal cortisol secretion was measured using five saliva samples taken over
the course of one day. It has been suggested that samples collected on a single day are
more susceptible to state effects and that sampling over two to six days is required for
reliable trait measures (J. Hellhammer et al., 2007). This means that in our sample
diurnal rhythm may have been affected by transient, situational factors rather than long-
standing factors. Furthermore individuals suffering with depression often experience
disrupted routines, often as a result of sleep disturbance (Baglioni et al., 2016;M. J.
Murphy & Peterson, 2015). Therefore reliability may have been improved by taking
measures over the course of several days. The healthy control group would likely have
had less variability in their routine and so measurements over a single day may have
been more representative than in the depressed group. In addition, depressed people
often experience problems with memory (Roca et al., 2015) and a deficit in motivation
(Callaghan et al., 2018) making it less likely that they will adhere to the sampling protocol.
In fact on average, twice the number of depressed people compared with controls, failed
to provide at least one saliva sample at baseline (MDD = 6, HC = 3). At follow-up an
average of 16 depressed people failed to provide at least one sample. It therefore seems
that there that there may have been an issue of fidelity in the depressed group.

369
However it was decided to measure diurnal cortisol secretion over the course of one day
only in order to minimise participant burden. This was particularly relevant for the
depressed group as if the process had been overly cumbersome, it may also have
deterred them from attending follow-up. Recruitment and retention of depressed
participants is notoriously difficult in clinical research (J. S. L. Brown et al., 2019) and so
limiting the inconvenience and effort required is of paramount importance. In fact at
follow-up we observed a very low attrition rate (5%), which given our already small
sample size, was critical.
Cortisol can be measured in several biological specimens including saliva, blood, urine,
and hair. We chose to measure cortisol in saliva for a number of reasons. Firstly saliva
sampling is a comparitively inexpensive method and in order to investigate multiple
biological parameters we had to impose every reasonable financial constraint. Secondly,
saliva sampling is a non-invasive method, avoiding issues associated with repeated
venipuncture and allows for ambulatory assessment in a naturalistic setting, where
participants are collecting their own samples (Kirschbaum & Hellhammer, 1989).
Repeated blood sampling across the day would be impractical and would likely impact
on recruitment and retention. Furthermore, salivary cortisol is stable at room temperature
for two weeks after sampling, allowing for participants to post their samples back to the
laboratory, without any degradation. Finally, saliva cortisol provides a measure of ‘free’,
biologically active cortisol (Kirschbaum & Hellhammer, 1989, 2000). There are high
correlations between salivary cortisol and unbound free plasma cortisol consistent
throughout circadian rhythm (D. H. Hellhammer et al., 2009).
In Study 1 corticosteroid sensitivity was measured using glucocorticoid and
mineralocorticoid sensitivity assays. Specifically, GR and MR sensitivity was measured
by dexamethasone and prednisolone suppression of LPS induced IL-6 levels in whole
blood. We chose an in vitro method as this approach provides a more controlled and
direct measure of corticosteroid sensitivity compared with the DST. However, these

370
assays still only provide a proxy measure of receptor sensitivity. The addition of assays
measuring gene expression of GR up and downregulated genes would help to establish
GR responsiveness. Measurement of receptor mRNA levels, the rate of translocation of
the receptors into the cell nuclei or DNA binding would also be of value. In addition we
chose whole blood to allow for rapid measurement, however measurement in isolated
monocytes or lymphocytes would have allowed for a more focused measure of IL-6
suppression. The production of inflammatory cytokines differs between specific
leukocyte subsets. For example, LPS-induced IL-6 is mainly produced by monocytes
(Berczi, 1998). There are also differences in frequency of immune cell populations, which
could vary between participants (Burnsides et al., 2012). Finally, the inclusion of
additional outcomes known to be affected by glucocorticoids would allow us to examine
broader effects. The results of Study 1 should be interpreted with these issues borne in
mind.
In Study 1c we determined frequency of FoxP3 expressing cells within a CD4+CD25+
subset. There is a great deal of inconsistency in the literature regarding the markers used
to characterise Treg populations and the subsets with which they compare them, which
may account for the conflicting findings. For example, some studies measure the
percentage of Tregs in peripheral blood lymphocytes (2015;2016b;2010), another
determined the ratio of CD4+CD25+FoxP3 cells to CD4+ cells (2011), another quantified
the frequency of CD25highCD127low− T cells in a subset of CD4+ T cells (2018), another
measured the frequency of CD127lowCCR4+ and memory Tregs in PBMCs and another
identified the percentage of CD4+ CD25+CD127− cells in lymphocytes (2018). Some
studies rely only on the cell surface markers CD4 and CD25 (Himmerich et al., 2010;Y.
Li et al., 2010;Patas et al., 2018;H. Suzuki et al., 2017), whilst others include the classic
intracellular marker of Treg cells, FoxP3 (Y. Chen et al., 2011;Grosse et al.,
2015;Grosse et al., 2016b). We based our choice of Treg identification on the following
rationale. In humans, up to 30% of peripheral blood CD4+ T cells express CD25 (Ng et
al., 2001). However only 1~2% of CD4+ cells with the highest level of CD25 exhibit the

371
suppressive function of Tregs (Baecher-Allan et al., 2001;Baecher-Allan et al., 2002) and
high expression of FoxP3 (Miyara et al., 2009). In contrast, at least 50% of total FoxP3+
human Tregs are CD25low and some do not express CD25 at all, therefore identification
of Tregs based on CD25high will fail to capture the majority of human CD4+FoxP3+ Tregs
(X. Chen et al., 2010). Furthermore, activated CD4+ effector cells also express high
levels of CD25 (Seddiki et al., 2006), potentially leading to the identification of false
positives. Foxp3 is generally considered a master regulator of Treg function. The
essential role of FoxP3 is illustrated by the fact that mutations of the human FoxP3 gene
have been shown to cause IPEX syndrome (Bennett et al., 2001). FoxP3 expression is
critical for the survival of Tregs, their ability to produce IL-2 and proliferate following T
cell receptor engagement (Gavin et al., 2007). Furthermore, loss of FoxP3 expression
by fully differentiated Tregs causes a loss of suppressor function (Williams & Rudensky,
2007). Therefore the identification of FoxP3 expression in CD4+CD25+ cells is essential
for accurate Treg identification. By determining the percentage of CD4+CD25+ T cells
which express FoxP3 we can be more confident that we are measuring suppressive
Tregs and not effector cells. However in the absence of a consensus regarding Treg
characterisation and a common measure of Treg frequency, comparisons with other
studies is difficult. The results of Study 1c should therefore be treated with a great deal
of caution.
9.4.3 Antidepressant use
Study 1 was originally designed to explore the effect of antidepressants on the biological
pathways implicated in depression. We intended to recruit via a randomised control trial,
which was recruiting depressed patients from primary care, who were not currently being
treated with antidepressants. Participants were then to be randomised to either sertraline
or placebo and followed up over 12 weeks. We selected this trial because it would have
given us participants who were free from antidepressants at baseline and enabled us to
observe any antidepressant effects. However, due to the recruitment issues already
372
discussed, we decided to recruit from primary care directly. This inevitably meant that
we lost our ‘clean’ baseline and ended up recruiting people receiving a variety of
treatments. In fact 30% of the depressed group were taking antidepressants at baseline
with treatment duration ranging from 1-36 months. The consequence of this is that we
were no longer able to examine any causal effects of antidepressants and any
interpretations regarding changes in biology are merely speculative. Nonetheless, we
did include sensitivity analyses where appropriate, to explore whether any observed
biological changes may have been influenced by antidepressant use and found no
evidence of an effect.
Depressive symptoms significantly improved at follow-up, but it is unclear why. For those
individuals receiving antidepressant medication there could have been an effect of the
drug. However given that the therapeutic action of antidepressant treatments usually
takes several weeks to appear (Ferrari & Villa, 2017) and in our sample only 22% of
participants had been taking them for a minimum of six weeks, we cannot confidently
infer any treatment effect. Further issues come from our relatively short follow-up period,
which hinders our ability to capture any therapeutic effects in the 8% of people who had
only recently started antidepressant treatment. Furthermore, given the fact that 57% of
the depressed group were not receiving either antidepressant medication or
psychotherapy and we provided no therapeutic intervention, it is unclear why, overall,
their depressive symptoms improved.
9.5 Suggestions for future research
The studies presented in this thesis have highlighted gaps in the literature and
demonstrated the need for further research in this field. Suggestions for future research
were provided in the Discussion section of each chapter. In this section I will outline more
general ideas for future studies investigating the biological correlates of depression.

373
9.5.1 The heterogeneity of depression
Despite decades of research, very basic questions regarding depression remain
unanswered. Specifically, the aetiology of depression remains unclear and the
ineffectiveness of antidepressants beyond placebo for the majority of patients remains
unresolved. Research in depression typically involves three stages, firstly the researcher
selects a rating scale or clinical interview from a vast array of choices and a series of
mood, cognitive and somatic symptoms are measured. Secondly, these symptoms are
summed, creating a severity score which is compared to a pre-defined threshold, in order
to distinguish individuals with MDD from healthy controls. Thirdly, the researcher
investigates whether patients and controls differ in terms of biological markers (Studies
1a and 1) or physical health outcomes (Study 2), or whether biological markers are
associated with treatment response or symptom remission (Study 1b).
This poses several problems. As discussed in Chapter 1, Section 1.2, patients with
depression exhibit a wide range of different symptoms and may even present with the
opposite symptoms. For example, a patient who gains weight, sleeps too much and
moves around slowly would score the same as a patient who loses weight, can’t sleep
and moves around quickly. Fried et al. (2015a) identified 1,030 unique symptom profiles
in 3,073 MDD patients, calling into question the notion of MDD as a homogenous
syndrome. It seems therefore to make little sense to investigate biological markers in a
population who demonstrate such variability in symptoms. In addition, the definition of
MDD is indisputably vague. Symptom questionnaires such as the BDI, GHQ and HAM-
D differ greatly from the DSM-V criteria for MDD (Fried & Nesse, 2015b). A content
analysis of seven common depression scales produced 52 disparate symptoms with low
overlap with DSM-5 MDD (Fried, 2017). This inconsistency is reflected in the fact that
over the last century more than 280 measures of depression have been developed and
published, and dozens of MDD subtypes have been suggested and subsequently
discounted (Santor & Gregus, 2006). One would struggle to envision similar peculiarities

374
in establishing a diagnosis of a medical illness such as cancer of CVD. Thus the
assumption that these symptoms represents interchangeable indicators of the same
distinct disease category is questionable.
It has been suggested that MDD should not be understood as a homogenous condition,
but as heterogeneous cluster of symptoms, which have a reciprocal relationship with
each other (Fried, 2015). For example insomnia can cause fatigue, resulting in
concentration and psychomotor problems. Studies have also shown that specific MDD
symptoms differ in their relations with inflammatory biomarkers. Jokela et al. (2016)
demonstrated that independent associations with CRP were only evident with sleep
problems, tiredness or lack of energy and changes in appetite, in line with the notion of
sickness behaviour. Associations between inflammation and cognitive and emotional
symptoms of depression were not independent of other depression symptoms. A more
recent birth cohort study including 2,731 participants showed that IL-6 was specifically
associated with somatic/neurovegetative symptoms such as fatigue, sleep disturbances
and diurnal variation in mood (Chu et al., 2019). A study using the ELSA cohort reported
that CRP exhibited a stronger relationship with somatic than with cognitive-affective
symptoms (Iob et al., 2019). Another recent study also reported a specific association
between IL-6 and sleep disturbance in people with MDD (M. Wang et al., 2019).
Identifying specific symptom associations may help identify treatment targets and
markers of treatment response in clinical trials of anti-inflammatory drugs for the
treatment of depression. Clusters of symptoms also differ in their response to anti-
depressant treatment. Chekroud et al. (2017) showed that antidepressants were more
effective at treating core emotional symptoms than they were at treating sleep or atypical
symptoms. Furthermore, MDD symptoms differentially predict relapse (Chekroud et al.,
2016)
In light of these considerations, several practical improvements to MDD measurement
can be suggested. Firstly, more thorough assessments of compound symptoms could
375
be made. Insomnia and hypersomnia are opposites and combining them into ‘sleep’ is
unhelpful. Similarly, psychomotor retardation has four times the effect on impairment of
psychosocial functioning than psychomotor agitation (Fried & Nesse, 2014). Secondly,
as in Study 1a different depression instruments should be used simultaneously and
conclusions should be considered robust only if results generalise across scales. Finally,
by focusing on specific symptoms which provide more reliable units of measurement,
researchers may be able to make progress in identifying distinct underlying biological
processes. This could lead the way to a more personalised treatment of depression that
accounts for the heterogeneity of MDD.
9.5.2 HPA-axis measurement
Studies 1a and 1b provided evidence for the utility of incorporating multiple measures of
GR resistance and HPA-axis dysfunction. Dysregulation was observed in terms of GR
and MR sensitivity, as well as diurnal cortisol rhythm represented by a flattening of the
CAR AUC. This comprehensive approach allowed for the observation of a relationship
between inflammatory activation and HPA-axis dysfunction which may otherwise have
been overlooked.
Studies investigating inflammation and GR resistance have reported conflicting results.
A recent meta-analysis concluded that the variability of measures assessing GR
resistance makes interpretation of the literature difficult (Perrin et al., 2019). Studies often
rely on single measures of HPA-axis function, each of which has its own limitations.
Studies including plasma or salivary cortisol appear to provide the largest effect but often
fail to include assessments of diurnal cortisol rhythm. Diurnal variations in cortisol levels
are a well-established phenomenon of the HPA-axis and yet this aspect of dysregulation
is often overlooked. Most studies investigating inflammation and GR resistance measure
morning cortisol but fail to target the following hour, preventing the assessment of diurnal
rhythm (Perrin et al., 2019). The reliability of the cortisol data is also hindered by the fact

376
that the window of measurement spans 9.00am to 11.00am, creating widespread
variability. Furthermore, while cortisol levels indicate the degree of HPA-axis activation,
they do not directly probe the corticosteroid receptors.
Many studies rely on the DST as a measure of GR resistance, however this only provides
a measure of peripheral GR function and findings do not translate to the CNS. Whilst in
vitro assays also suffer from translational limitations, the do provide a more controlled,
direct measure of receptor sensitivity. The greatest effect size appears to come from
studies using an in vitro approach and/or GR expression (Perrin et al., 2019).
Furthermore, the inclusion of a measure of MR function is wholly absent among these
studies.
In light of these limitations, employing a combination of techniques to explore
associations between inflammation and HPA-axis function will maximise the likelihood
of observing any relationship between the two. There is a need for larger studies,
measuring various cytokines and using various measures of GR and MR resistance,
including in vitro assays and assessments of diurnal cortisol rhythm, in MDD. This will
provide a broad characterisation of the relationship between inflammation and HPA-axis
function.
9.6 Final conclusions
This thesis has presented the findings from two studies which have used a mixture of
laboratory testing and epidemiological methods. I believe each of the studies presented
have added something new to the field. Study 1a was the first to measure inflammation,
diurnal cortisol rhythm and GR and MR function simultaneously in a cohort of people with
MDD. The findings of this study suggest that depressed people experience dysregulation
regarding inflammatory cytokine production, diurnal cortisol rhythm and both GR and MR
sensitivity. In addition, the findings suggest a relationship between TNF-α and diurnal

377
cortisol rhythm in depression. Study 1b was the first to investigate changes in
inflammation, diurnal cortisol rhythm and in vitro corticosteroid function over time in the
same MDD sample. The results demonstrated that improvements in depressive
symptoms co-occur with increased MR sensitivity. Study 1c was the first to investigate
the difference in the percentage of CD4+CD25+ T cells expressing FoxP3 in people with
MDD compared with controls. Furthermore, it was the first to explore the relationship
between Tregs and circulating IL-6 and TNF-α, or GR and MR sensitivity in MDD. The
findings suggest that there is no difference in Tregs between people with MDD and
healthy controls. Finally Study 2 is the first to investigate the combination of inflammation
and depressive symptoms on mortality risk, in both men and women and demonstrated
that men who exhibit both risk factors constitute a high-mortality risk phenotype,
particularly in relation to CVD.

378
10. References
Abbott, R., Whear, R., Nikolaou, V., Bethel, A., Coon, J. T., Stein, K., & Dickens, C.
(2015). Tumour necrosis factor-α inhibitor therapy in chronic physical illness: A
systematic review and meta-analysis of the effect on depression and anxiety. J
Psychosom Res, 79(3), 175-184.
doi:http://dx.doi.org/10.1016/j.jpsychores.2015.04.008
Adam, E. K., Doane, L. D., Zinbarg, R. E., Mineka, S., Craske, M. G., & Griffith, J. W.
(2010). Prospective prediction of major depressive disorder from cortisol
awakening responses in adolescence. Psychoneuroendocrinology, 35(6), 921-
931. doi:10.1016/j.psyneuen.2009.12.007
Adam, E. K., & Kumari, M. (2009). Assessing salivary cortisol in large-scale,
epidemiological research. Psychoneuroendocrinology, 34(10), 1423-1436.
doi:10.1016/j.psyneuen.2009.06.011
Adam, E. K., Quinn, M. E., Tavernier, R., McQuillan, M. T., Dahlke, K. A., & Gilbert, K.
E. (2017). Diurnal cortisol slopes and mental and physical health outcomes: A
systematic review and meta-analysis. Psychoneuroendocrinology, 83, 25-41.
doi:https://doi.org/10.1016/j.psyneuen.2017.05.018
Agargun, M. Y., Kara, H., Ozer, O. A., Selvi, Y., Kiran, U., & Kiran, S. (2003). Nightmares
and dissociative experiences: the key role of childhood traumatic events.
Psychiatry & Clinical Neurosciences, 57(2), 139-145. doi:10.1046/j.1440-
1819.2003.01093.x
Ahern, G. P. (2011). 5-HT and the Immune System. Current Opinion in Pharmacology,
11(1), 29-33. doi:10.1016/j.coph.2011.02.004
Ahmadi-Abhari, S., Luben, R. N., Wareham, N. J., & Khaw, K. T. (2013). Seventeen year
risk of all-cause and cause-specific mortality associated with C-reactive protein,
fibrinogen and leukocyte count in men and women: the EPIC-Norfolk study.
European journal of epidemiology, 28(7), 541-550. doi:10.1007/s10654-013-
9819-6

379
Ahmed, A. H., Calvird, M., Gordon, R. D., Taylor, P. J., Ward, G., Pimenta, E., . . .
Stowasser, M. (2011). Effects of two selective serotonin reuptake inhibitor
antidepressants, sertraline and escitalopram, on aldosterone/renin ratio in
normotensive depressed male patients. Journal of Clinical Endocrinology &
Metabolism, 96(4), 1039-1045. doi:10.1210/jc.2010-2603
Ahrens, T., Deuschle, M., Krumm, B., van der Pompe, G., den Boer, J. A., & Lederbogen,
F. (2008). Pituitary-adrenal and sympathetic nervous system responses to stress
in women remitted from recurrent major depression. Psychosomatic Medicine,
70(4), 461-467. doi:10.1097/PSY.0b013e31816b1aaa
Ai, A. L., Kronfol, Z., Seymour, E., & Bolling, S. F. (2005). Effects of mood state and
psychosocial functioning on plasma Interleukin-6 in adult patients before cardiac
surgery. International Journal of Psychiatry in Medicine, 35(4), 363-376.
doi:10.2190/2elg-rdun-x6tu-fgc8
Akbaraly, T. N., Brunner, E. J., Ferrie, J. E., Marmot, M. G., Kivimaki, M., & Singh-
Manoux, A. (2009). Dietary pattern and depressive symptoms in middle age.
British Journal of Psychiatry, 195(5), 408-413. doi:10.1192/bjp.bp.108.058925
Alesci, S., Martinez, P. E., Kelkar, S., Ilias, I., Ronsaville, D. S., Listwak, S. J., . . . Gold,
P. W. (2005). Major Depression Is Associated with Significant Diurnal Elevations
in Plasma Interleukin-6 Levels, a Shift of Its Circadian Rhythm, and Loss of
Physiological Complexity in Its Secretion: Clinical Implications. The Journal of
Clinical Endocrinology & Metabolism, 90(5), 2522-2530. doi:10.1210/jc.2004-
1667
Allen, A. P., Curran, E. A., Duggan, A., Cryan, J. F., Chorcorain, A. N., Dinan, T. G., . . .
Clarke, G. (2017). A systematic review of the psychobiological burden of informal
caregiving for patients with dementia: Focus on cognitive and biological markers
of chronic stress. Neurosci Biobehav Rev, 73, 123-164.
doi:10.1016/j.neubiorev.2016.12.006
Amare, A. T., Schubert, K. O., Klingler-Hoffmann, M., Cohen-Woods, S., & Baune, B. T.
(2017). The genetic overlap between mood disorders and cardiometabolic

380
diseases: a systematic review of genome wide and candidate gene studies.
Translational Psychiatry, 7(1), e1007. doi:10.1038/tp.2016.261
American Psychiatric Association. (2013). Diagnostic and statistical manual of mental
disorders (DSM-5®): American Psychiatric Pub.
Ammirati, E., Moroni, F., Magnoni, M., & Camici, P. G. (2015). The role of T and B cells
in human atherosclerosis and atherothrombosis. Clin Exp Immunol, 179(2), 173-
187. doi:10.1111/cei.12477
Anacker, C., Zunszain, P. A., Carvalho, L. A., & Pariante, C. M. (2011). The
glucocorticoid receptor: pivot of depression and of antidepressant treatment?
Psychoneuroendocrinology, 36(3), 415-425.
doi:10.1016/j.psyneuen.2010.03.007
Anda, R. F., Felitti, V. J., Bremner, J. D., Walker, J. D., Whitfield, C., Perry, B. D., . . .
Giles, W. H. (2006). The enduring effects of abuse and related adverse
experiences in childhood. A convergence of evidence from neurobiology and
epidemiology. Eur Arch Psychiatry Clin Neurosci, 256(3), 174-186.
doi:10.1007/s00406-005-0624-4
Andersen, S. L., Tomada, A., Vincow, E. S., Valente, E., Polcari, A., & Teicher, M. H.
(2008). Preliminary evidence for sensitive periods in the effect of childhood
sexual abuse on regional brain development. Journal of Neuropsychiatry &
Clinical Neurosciences, 20(3), 292-301. doi:10.1176/appi.neuropsych.20.3.292
10.1176/jnp.2008.20.3.292
Anstey, K. J., & Luszcz, M. A. (2002). Mortality risk varies according to gender and
change in depressive status in very old adults. Psychosomatic Medicine, 64(6),
880-888.
Antonijevic, I. A. (2006). Depressive disorders - Is it time to endorse different
pathophysiologies? Psychoneuroendocrinology, 31(1), 1-15.
doi:10.1016/j.psyneuen.2005.04.004

381
Antonogeorgos, G., Panagiotakos, D. B., Pitsavos, C., Papageorgiou, C., Chrysohoou,
C., Papadimitriou, G. N., & Stefanadis, C. (2012). Understanding the role of
depression and anxiety on cardiovascular disease risk, using structural equation
modeling; the mediating effect of the Mediterranean diet and physical activity: the
ATTICA study. Annals of Epidemiology, 22(9), 630-637.
doi:10.1016/j.annepidem.2012.06.103
Antonopoulos, A. S., Margaritis, M., Lee, R., Channon, K., & Antoniades, C. (2012).
Statins as anti-inflammatory agents in atherogenesis: molecular mechanisms
and lessons from the recent clinical trials. Current Pharmaceutical Design,
18(11), 1519-1530.
Appelhof, B. C., Huyser, J., Verweij, M., Brouwer, J. P., van Dyck, R., Fliers, E., . . .
Schene, A. H. (2006). Glucocorticoids and relapse of major depression
(dexamethasone/corticotropin-releasing hormone test in relation to relapse of
major depression). Biological Psychiatry, 59(8), 696-701.
doi:10.1016/j.biopsych.2005.09.008
Arana, G. W., Baldessarini, R. J., & Ornsteen, M. (1985). The dexamethasone
suppression test for diagnosis and prognosis in psychiatry: commentary and
review. Archives of General Psychiatry, 42(12), 1193-1204.
Arbelaez, J. J., Ariyo, A. A., Crum, R. M., Fried, L. P., & Ford, D. E. (2007). Depressive
symptoms, inflammation, and ischemic stroke in older adults: a prospective
analysis in the cardiovascular health study. Journal of the American Geriatrics
Society, 55(11), 1825-1830. doi:10.1111/j.1532-5415.2007.01393.x
Archer, J. A., Hutchison, I. L., Dorudi, S., Stansfeld, S. A., & Korszun, A. (2012).
Interrelationship of depression, stress and inflammation in cancer patients: a
preliminary study. Journal of Affective Disorders, 143(1-3), 39-46.
doi:10.1016/j.jad.2012.05.023
Arisoy, O., Bes, C., Cifci, C., Sercan, M., & Soy, M. (2013). The effect of TNF-alpha
blockers on psychometric measures in ankylosing spondylitis patients: a

382
preliminary observation. Rheumatology International, 33(7), 1855-1864.
doi:http://dx.doi.org/10.1007/s00296-013-2671-x
Assies, J., Visser, I., Nicolson, N. A., Eggelte, T. A., Wekking, E. M., Huyser, J., . . .
Schene, A. H. (2004). Elevated salivary dehydroepiandrosterone-sulfate but
normal cortisol levels in medicated depressed patients: preliminary findings.
Psychiatry Res, 128(2), 117-122. doi:10.1016/j.psychres.2004.05.016
Athyros, V. G., Katsiki, N., Doumas, M., Karagiannis, A., & Mikhailidis, D. P. (2013).
Effect of tobacco smoking and smoking cessation on plasma lipoproteins and
associated major cardiovascular risk factors: a narrative review. Current Medical
Research & Opinion, 29(10), 1263-1274. doi:10.1185/03007995.2013.827566
Aubry, J. M., Gervasoni, N., Osiek, C., Perret, G., Rossier, M. F., Bertschy, G., &
Bondolfi, G. (2007). The DEX/CRH neuroendocrine test and the prediction of
depressive relapse in remitted depressed outpatients. J Psychiatr Res, 41(3-4),
290-294. doi:10.1016/j.jpsychires.2006.07.007
Aubry, J. M., Jermann, F., Gex-Fabry, M., Bockhorn, L., Van der Linden, M., Gervasoni,
N., . . . Bondolfi, G. (2010). The cortisol awakening response in patients remitted
from depression. J Psychiatr Res, 44(16), 1199-1204.
doi:10.1016/j.jpsychires.2010.04.015
Aune, D., Norat, T., Leitzmann, M., Tonstad, S., & Vatten, L. J. (2015). Physical activity
and the risk of type 2 diabetes: a systematic review and dose-response meta-
analysis. European Journal of Epidemiology, 30(7), 529-542.
doi:10.1007/s10654-015-0056-z
Azevedo Da Silva, M., Singh-Manoux, A., Brunner, E. J., Kaffashian, S., Shipley, M. J.,
Kivimaki, M., & Nabi, H. (2012). Bidirectional association between physical
activity and symptoms of anxiety and depression: the Whitehall II study.
European Journal of Epidemiology, 27(7), 537-546. doi:10.1007/s10654-012-
9692-8
Bader, K., Schafer, V., Schenkel, M., Nissen, L., Kuhl, H. C., & Schwander, J. (2007a).
Increased nocturnal activity associated with adverse childhood experiences in

383
patients with primary insomnia. Journal of Nervous & Mental Disease, 195(7),
588-595. doi:10.1097/NMD.0b013e318093ed00
Bader, K., Schafer, V., Schenkel, M., Nissen, L., & Schwander, J. (2007b). Adverse
childhood experiences associated with sleep in primary insomnia. Journal of
Sleep Research, 16(3), 285-296. doi:10.1111/j.1365-2869.2007.00608.x
Baecher-Allan, C., Brown, J. A., Freeman, G. J., & Hafler, D. A. (2001). CD4+ CD25high
regulatory cells in human peripheral blood. The Journal of Immunology, 167(3),
1245-1253.
Baecher-Allan, C., Viglietta, V., & Hafler, D. A. (2002). Inhibition of human CD4+ CD25+
high regulatory T cell function. The Journal of Immunology, 169(11), 6210-6217.
Baglioni, C., Nanovska, S., Regen, W., Spiegelhalder, K., Feige, B., Nissen, C., . . .
Riemann, D. (2016). Sleep and mental disorders: A meta-analysis of
polysomnographic research. Psychol Bull, 142(9), 969-990.
doi:10.1037/bul0000053
Baldwin, J. R., Reuben, A., Newbury, J. B., & Danese, A. (2019). Agreement Between
Prospective and Retrospective Measures of Childhood Maltreatment: A
Systematic Review and Meta-analysis. JAMA Psychiatry.
doi:10.1001/jamapsychiatry.2019.0097
Bankier, B., Barajas, J., Martinez-Rumayor, A., & Januzzi, J. L. (2009). Association
between major depressive disorder and C-reactive protein levels in stable
coronary heart disease patients. J Psychosom Res, 66(3), 189-194.
doi:10.1016/j.jpsychores.2008.09.010
Banks, J., Breeze, E., Lessof, C., & Nazroo, J. (2006). Retirement, health and
relationships of the older population in England: The 2004 English Longitudinal
Study of Ageing (Wave 2).
Barber, A. E., Coyle, S. M., Marano, M. A., Fischer, E., Calvano, S. E., Fong, Y., . . .
Lowry, S. F. (1993). Glucocorticoid therapy alters hormonal and cytokine
responses to endotoxin in man. J Immunol, 150(5), 1999-2006.

384
Bardeleben, U., & Holsboer, F. (1989). Cortisol response to a combined dexamethasone-
human corticotrophin-releasing hormone challenge in patients with depression.
Journal of Neuroendocrinology, 1(6), 485-488. doi:10.1111/j.1365-
2826.1989.tb00150.x
Barden, N., Reul, J., & Holsboer, F. (1995). Do antidepressants stabilize mood through
actions on the hypothalamic-pituitary-adrenocortical system? Trends in
Neurosciences, 18(1), 6-11.
Barden, N., Shink, E., Labbe, M., Vacher, R., Rochford, J., & Mocaer, E. (2005).
Antidepressant action of agomelatine (S 20098) in a transgenic mouse model.
Progress in Neuro-Psychopharmacology & Biological Psychiatry, 29(6), 908-916.
doi:10.1016/j.pnpbp.2005.04.032
Barefoot, J. C., Burg, M. M., Carney, R. M., Cornell, C. E., Czajkowski, S. M., Freedland,
K. E., . . . Sheps, D. (2003). Aspects of social support associated with depression
at hospitalization and follow-up assessment among cardiac patients. Journal of
Cardiopulmonary Rehabilitation, 23(6), 404-412.
Barnes, J., Mondelli, V., & Pariante, C. M. (2016). NPPR: Genetic Contributions of
Inflammation to Depression. Neuropsychopharmacology, 24, 24.
doi:http://dx.doi.org/10.1038/npp.2016.169
Barnes, P. J., & Adcock, I. M. (2009). Glucocorticoid resistance in inflammatory diseases.
Lancet, 373(9678), 1905-1917. doi:10.1016/s0140-6736(09)60326-3
Barrientos, R. M., Sprunger, D. B., Campeau, S., Higgins, E. A., Watkins, L. R., Rudy, J.
W., & Maier, S. F. (2003). Brain-derived neurotrophic factor mRNA
downregulation produced by social isolation is blocked by intrahippocampal
interleukin-1 receptor antagonist. Neuroscience, 121(4), 847-853.
Barth, J., Schumacher, M., & Herrmann-Lingen, C. (2004). Depression as a risk factor
for mortality in patients with coronary heart disease: a meta-analysis.
Psychosomatic Medicine, 66(6), 802-813.
doi:10.1097/01.psy.0000146332.53619.b2

385
Bartoli, F., Di Brita, C., Crocamo, C., Clerici, M., & Carra, G. (2018). Early Post-stroke
Depression and Mortality: Meta-Analysis and Meta-Regression. Front Psychiatry,
9, 530. doi:10.3389/fpsyt.2018.00530
Bartoli, F., Lillia, N., Lax, A., Crocamo, C., Mantero, V., Carra, G., . . . Clerici, M. (2013).
Depression after stroke and risk of mortality: a systematic review and meta-
analysis. Stroke Res Treat, 2013, 862978. doi:10.1155/2013/862978
Bauer, M. E., Papadopoulos, A., Poon, L., Perks, P., Lightman, S. L., Checkley, S., &
Shanks, N. (2002). Dexamethasone-induced effects on lymphocyte distribution
and expression of adhesion molecules in treatment-resistant depression.
Psychiatry Res, 113(1-2), 1-15.
Bauer, M. E., Papadopoulos, A., Poon, L., Perks, P., Lightman, S. L., Checkley, S., &
Shanks, N. (2003). Altered glucocorticoid immunoregulation in treatment
resistant depression. Psychoneuroendocrinology, 28(1), 49-65.
Baumeister, D., Akhtar, R., Ciufolini, S., Pariante, C. M., & Mondelli, V. (2016a).
Childhood trauma and adulthood inflammation: a meta-analysis of peripheral C-
reactive protein, interleukin-6 and tumour necrosis factor-α. Molecular Psychiatry,
21(5), 642-649. doi:10.1038/mp.2015.67
Baumeister, D., Ciufolini, S., & Mondelli, V. (2016b). Effects of psychotropic drugs on
inflammation: consequence or mediator of therapeutic effects in psychiatric
treatment? Psychopharmacology, 233(9), 1575-1589.
doi:http://dx.doi.org/10.1007/s00213-015-4044-5
Baxter, J. D., & Forsham, P. H. (1972). Tissue effects of glucocorticoids. Am J Med,
53(5), 573-589.
Bay-Richter, C., Hallberg, L., Ventorp, F., Janelidze, S., & Brundin, L. (2012).
Aldosterone synergizes with peripheral inflammation to induce brain IL-1beta
expression and depressive-like effects. Cytokine, 60(3), 749-754.
doi:10.1016/j.cyto.2012.08.016
Bayry, J., Siberil, S., Triebel, F., Tough, D. F., & Kaveri, S. V. (2007). Rescuing
CD4+CD25+ regulatory T-cell functions in rheumatoid arthritis by cytokine-

386
targeted monoclonal antibody therapy. Drug Discovery Today, 12(13-14), 548-
552. doi:10.1016/j.drudis.2007.05.002
Bearn, J., Franey, C., Arendt, J., & Checkley, S. A. (1989). A study of the effects of
desipramine treatment alone and in combination with L-triiodothyronine on 6-
sulphatoxymelatonin excretion in depressed patients. British Journal of
Psychiatry, 155, 341-347. doi:10.1192/bjp.155.3.341
Beck-Friis, J., Kjellman, B. F., Aperia, B., Unden, F., von Rosen, D., Ljunggren, J. G., &
Wetterberg, L. (1985a). Serum melatonin in relation to clinical variables in
patients with major depressive disorder and a hypothesis of a low melatonin
syndrome. Acta Psychiatr Scand, 71(4), 319-330.
Beck-Friis, J., Ljunggren, J. G., Thorén, M., Von Rosen, D., Kjellman, B. F., &
Wetterberg, L. (1985b). Melatonin, cortisol and ACTH in patients with major
depressive disorder and healthy humans with special reference to the outcome
of the dexamethasone suppression test. 10(2), 173-186.
Beck, A. T., Steer, R. A., & Brown, G. K. (1996a). Beck depression inventory-II. San
Antonio.
Beck, A. T., Steer, R. A., & Brown, G. K. (1996b). Beck depression inventory-II. San
Antonio, 78(2), 490-498.
Beck, J., Bruni, N., Brand, S., & Holsboer-Trachsler, E. (2015). Repeated Cortisol
Awakening Response as Predictor of Antidepressant Treatment Outcome with
Duloxetine. Neuropsychobiology, 71(2), 97-102. doi:10.1159/000370047
Beissert, S., Schwarz, A., & Schwarz, T. (2006). Regulatory T cells. J Invest Dermatol,
126(1), 15-24. doi:10.1038/sj.jid.5700004
Bell, J. A., Kivimaki, M., Bullmore, E. T., Steptoe, A., & Carvalho, L. A. (2017a). Repeated
exposure to systemic inflammation and risk of new depressive symptoms among
older adults. Translational Psychiatry, 7(8), e1208. doi:10.1038/tp.2017.155
Bell, S., Mehta, G., Moore, K., & Britton, A. (2017b). Ten-year alcohol consumption
typologies and trajectories of C-reactive protein, interleukin-6 and interleukin-1

387
receptor antagonist over the following 12 years: a prospective cohort study.
Journal of Internal Medicine, 281(1), 75-85. doi:10.1111/joim.12544
Bell, S., & Britton, A. (2015). Drinking pattern during midlife and risk of developing
depression during 28 years of follow-up: A prospective cohort study. Drug and
Alcohol Dependence, 155, 111-117. doi:10.1016/j.drugalcdep.2015.08.008
Bell, S., Daskalopoulou, M., Rapsomaniki, E., George, J., Britton, A., Bobak, M., . . .
Hemingway, H. (2017b). Association between clinically recorded alcohol
consumption and initial presentation of 12 cardiovascular diseases: population
based cohort study using linked health records. Bmj, 356, j909.
doi:10.1136/bmj.j909
Ben Menachem-Zidon, O., Goshen, I., Kreisel, T., Ben Menahem, Y., Reinhartz, E., Ben
Hur, T., & Yirmiya, R. (2008). Intrahippocampal transplantation of transgenic
neural precursor cells overexpressing interleukin-1 receptor antagonist blocks
chronic isolation-induced impairment in memory and neurogenesis.
Neuropsychopharmacology, 33(9), 2251-2262. doi:10.1038/sj.npp.1301606
Bener, D., Wohlman, A., Itzik, A., Yirmiya, R., Ben-Hur, T., & Weidenfeld, J. (2007).
Glucocorticoid resistance following herpes simplex-1 infection: role of
hippocampal glucocorticoid receptors. Neuroendocrinology, 85(4), 207-215.
doi:10.1159/000102976
Bennett, C. L., Christie, J., Ramsdell, F., Brunkow, M. E., Ferguson, P. J., Whitesell, L.,
. . . Ochs, H. D. (2001). The immune dysregulation, polyendocrinopathy,
enteropathy, X-linked syndrome (IPEX) is caused by mutations of FOXP3. Nature
Genetics, 27(1), 20.
Berczi, I. (1998). Neurohormonal host defense in endotoxin shock. Ann N Y Acad Sci,
840, 787-802. doi:10.1111/j.1749-6632.1998.tb09617.x
Beresnevaitė, M., Benetis, R., Taylor, G. J., Jurėnienė, K., Kinduris, Š., & Barauskienė,
V. (2010). Depression predicts perioperative outcomes following coronary artery
bypass graft surgery. Scandinavian Cardiovascular Journal, 44(5), 289-294.

388
Bergmann, M. M., Rehm, J., Klipstein-Grobusch, K., Boeing, H., Schutze, M., Drogan,
D., . . . Ferrari, P. (2013). The association of pattern of lifetime alcohol use and
cause of death in the European prospective investigation into cancer and nutrition
(EPIC) study. International Journal of Epidemiology, 42(6), 1772-1790.
doi:10.1093/ije/dyt154
Berkman, L. F., Leo-Summers, L., & Horwitz, R. I. (1992). Emotional support and survival
after myocardial infarction. A prospective, population-based study of the elderly.
Ann Intern Med, 117(12), 1003-1009.
Bermudez, E. A., Rifai, N., Buring, J., Manson, J. E., & Ridker, P. M. (2002).
Interrelationships among circulating interleukin-6, C-reactive protein, and
traditional cardiovascular risk factors in women. Arteriosclerosis, Thrombosis,
and Vascular Biology, 22(10), 1668-1673.
Bernard, K., Frost, A., Bennett, C. B., & Lindhiem, O. (2017). Maltreatment and diurnal
cortisol regulation: A meta-analysis. Psychoneuroendocrinology, 78, 57-67.
doi:10.1016/j.psyneuen.2017.01.005
Besedovsky, H. O., & del Rey, A. (1996). Immune-neuro-endocrine interactions: facts
and hypotheses. Endocrine Reviews, 17(1), 64-102. doi:10.1210/edrv-17-1-64
Bet, P. M., Penninx, B. W. J. H., Bochdanovits, Z., Uitterlinden, A. G., Beekman, A. T.
F., van Schoor, N. M., . . . Hoogendijk, W. J. G. (2009). Glucocorticoid receptor
gene polymorphisms and childhood adversity are associated with depression:
New evidence for a gene–environment interaction. American Journal of Medical
Genetics Part B: Neuropsychiatric Genetics, 150B(5), 660-669.
doi:doi:10.1002/ajmg.b.30886
Bettelli, E., Carrier, Y., Gao, W., Korn, T., Strom, T. B., Oukka, M., . . . Kuchroo, V. K.
(2006). Reciprocal developmental pathways for the generation of pathogenic
effector T H 17 and regulatory T cells. Nature, 441(7090), 235.
Bhagwagar, Z., Hafizi, S., & Cowen, P. J. (2003). Increase in concentration of waking
salivary cortisol in recovered patients with depression. Am J Psychiatry, 160(10),
1890-1891. doi:10.1176/appi.ajp.160.10.1890

389
Bhattacharyya, M. R., Molloy, G. J., & Steptoe, A. (2008). Depression is associated with
flatter cortisol rhythms in patients with coronary artery disease. J Psychosom
Res, 65(2), 107-113. doi:10.1016/j.jpsychores.2008.03.012
Bifulco, A., Bernazzani, O., Moran, P. M., & Jacobs, C. (2005). The childhood experience
of care and abuse questionnaire (CECA.Q): validation in a community series. Br
J Clin Psychol, 44(Pt 4), 563-581. doi:10.1348/014466505x35344
Binder, E. B. (2009). The role of FKBP5, a co-chaperone of the glucocorticoid receptor
in the pathogenesis and therapy of affective and anxiety disorders.
Psychoneuroendocrinology, 34 Suppl 1, S186-195.
doi:10.1016/j.psyneuen.2009.05.021
Binder, E. B., Salyakina, D., Lichtner, P., Wochnik, G. M., Ising, M., Putz, B., . . . Muller-
Myhsok, B. (2004). Polymorphisms in FKBP5 are associated with increased
recurrence of depressive episodes and rapid response to antidepressant
treatment. Nature Genetics, 36(12), 1319-1325. doi:10.1038/ng1479
Black, P. H. (1994). Immune system-central nervous system interactions: effect and
immunomodulatory consequences of immune system mediators on the brain.
Antimicrobial Agents & Chemotherapy, 38(1), 7-12.
Blumenthal, J. A., Lett, H. S., Babyak, M. A., White, W., Smith, P. K., Mark, D. B., . . .
Investigators, N. (2003). Depression as a risk factor for mortality after coronary
artery bypass surgery. The Lancet, 362(9384), 604-609.
Bluthe, R. M., Castanon, N., Pousset, F., Bristow, A., Ball, C., Lestage, J., . . . Dantzer,
R. (1999). Central injection of IL-10 antagonizes the behavioural effects of
lipopolysaccharide in rats. Psychoneuroendocrinology, 24(3), 301-311.
Bockting, C. L., Lok, A., Visser, I., Assies, J., Koeter, M. W., Schene, A. H., & research,
D. S. G. J. P. (2012). Lower cortisol levels predict recurrence in remitted patients
with recurrent depression: a 5.5 year prospective study. 200(2-3), 281-287.
Boggero, I. A., Hostinar, C. E., Haak, E. A., Murphy, M. L. M., & Segerstrom, S. C. (2017).
Psychosocial functioning and the cortisol awakening response: Meta-analysis, P-
390
curve analysis, and evaluation of the evidential value in existing studies.
Biological Psychology, 129, 207-230. doi:10.1016/j.biopsycho.2017.08.058
Boissier, M. C., Assier, E., Biton, J., Denys, A., Falgarone, G., & Bessis, N. (2009).
Regulatory T cells (Treg) in rheumatoid arthritis. Joint, Bone, Spine: Revue du
Rhumatisme, 76(1), 10-14. doi:10.1016/j.jbspin.2008.08.002
Bonaccorso, S., Marino, V., Puzella, A., Pasquini, M., Biondi, M., Artini, M., . . . Maes, M.
(2002). Increased depressive ratings in patients with hepatitis C receiving
interferon-alpha-based immunotherapy are related to interferon-alpha-induced
changes in the serotonergic system. J Clin Psychopharmacol, 22(1), 86-90.
Bonnet, F., Irving, K., Terra, J. L., Nony, P., Berthezene, F., & Moulin, P. (2005). Anxiety
and depression are associated with unhealthy lifestyle in patients at risk of
cardiovascular disease. Atherosclerosis, 178(2), 339-344.
doi:10.1016/j.atherosclerosis.2004.08.035
Booij, L., Van der Does, W., Benkelfat, C., Bremner, J. D., Cowen, P. J., Fava, M., . . .
Van der Kloot, W. A. (2002). Predictors of mood response to acute tryptophan
depletion. A reanalysis. Neuropsychopharmacology, 27(5), 852-861.
doi:10.1016/s0893-133x(02)00361-5
Booij, S. H., Bos, E. H., Bouwmans, M. E., van Faassen, M., Kema, I. P., Oldehinkel, A.
J., & de Jonge, P. (2015). Cortisol and alpha-Amylase Secretion Patterns
between and within Depressed and Non-Depressed Individuals. PLoS One,
10(7), e0131002. doi:10.1371/journal.pone.0131002
Border, R., Johnson, E. C., Evans, L. M., Smolen, A., Berley, N., Sullivan, P. F., & Keller,
M. C. (2019). No Support for Historical Candidate Gene or Candidate Gene-by-
Interaction Hypotheses for Major Depression Across Multiple Large Samples. Am
J Psychiatry, 176(5), 376-387. doi:10.1176/appi.ajp.2018.18070881
Braddock, L. (1986). The dexamethasone suppression test: fact and artefact. The British
Journal of Psychiatry, 148(4), 363-374.
Breder, C. D., Hazuka, C., Ghayur, T., Klug, C., Huginin, M., Yasuda, K., . . . Saper, C.
B. (1994). Regional induction of tumor necrosis factor alpha expression in the

391
mouse brain after systemic lipopolysaccharide administration. Proc Natl Acad Sci
U S A, 91(24), 11393-11397. doi:10.1073/pnas.91.24.11393
Bremner, D., Vermetten, E., & Kelley, M. E. (2007). Cortisol, dehydroepiandrosterone,
and estradiol measured over 24 hours in women with childhood sexual abuse-
related posttraumatic stress disorder. Journal of Nervous & Mental Disease,
195(11), 919-927. doi:10.1097/NMD.0b013e3181594ca0
Bremner, J. D., Vythilingam, M., Anderson, G., Vermetten, E., McGlashan, T., Heninger,
G., . . . Charney, D. S. (2003). Assessment of the hypothalamic-pituitary-adrenal
axis over a 24-hour diurnal period and in response to neuroendocrine challenges
in women with and without childhood sexual abuse and posttraumatic stress
disorder. Biological Psychiatry, 54(7), 710-718.
Breslau, N., Peterson, E. L., Schultz, L. R., Chilcoat, H. D., & Andreski, P. (1998). Major
depression and stages of smoking. A longitudinal investigation. Arch Gen
Psychiatry, 55(2), 161-166.
Broadley, A. J., Korszun, A., Jones, C. J., & Frenneaux, M. P. (2002). Arterial endothelial
function is impaired in treated depression. Heart, 88(5), 521-523.
Brouwer, J. P., Appelhof, B. C., van Rossum, E. F., Koper, J. W., Fliers, E., Huyser, J., .
. . Hoogendijk, W. J. (2006). Prediction of treatment response by HPA-axis and
glucocorticoid receptor polymorphisms in major depression.
Psychoneuroendocrinology, 31(10), 1154-1163.
doi:10.1016/j.psyneuen.2006.08.001
Brown, J. S. L., Murphy, C., Kelly, J., & Goldsmith, K. (2019). How can we successfully
recruit depressed people? Lessons learned in recruiting depressed participants
to a multi-site trial of a brief depression intervention (the 'CLASSIC' trial). Trials,
20(1), 131. doi:10.1186/s13063-018-3033-5
Brown, W. A., & Shuey, I. (1980). Response to dexamethasone and subtype of
depression. Arch Gen Psychiatry, 37(7), 747-751.
Bruder, G. E., Sedoruk, J. P., Stewart, J. W., McGrath, P. J., Quitkin, F. M., & Tenke, C.
E. (2008). Electroencephalographic alpha measures predict therapeutic

392
response to a selective serotonin reuptake inhibitor antidepressant: pre- and
post-treatment findings. Biological Psychiatry, 63(12), 1171-1177.
doi:10.1016/j.biopsych.2007.10.009
Brugha, T., Bebbington, P., Tennant, C., & Hurry, J. (1985). The List of Threatening
Experiences: a subset of 12 life event categories with considerable long-term
contextual threat. Psychological Medicine, 15(1), 189-194.
Brummett, B. H., Babyak, M. A., Siegler, I. C., Mark, D. B., Williams, R. B., & Barefoot,
J. C. (2003). Effect of smoking and sedentary behavior on the association
between depressive symptoms and mortality from coronary heart disease. The
American Journal of Cardiology, 92(5), 529-532.
Brummett, B. H., Barefoot, J. C., Siegler, I. C., Clapp-Channing, N. E., Lytle, B. L.,
Bosworth, H. B., . . . Mark, D. B. (2001). Characteristics of socially isolated
patients with coronary artery disease who are at elevated risk for mortality.
Psychosomatic Medicine, 63(2), 267-272.
Brunson, K. L., Eghbal-Ahmadi, M., Bender, R., Chen, Y., & Baram, T. Z. (2001). Long-
term, progressive hippocampal cell loss and dysfunction induced by early-life
administration of corticotropin-releasing hormone reproduce the effects of early-
life stress. Proc Natl Acad Sci U S A, 98(15), 8856-8861.
doi:10.1073/pnas.151224898
Brusko, T. M., Wasserfall, C. H., Clare-Salzler, M. J., Schatz, D. A., & Atkinson, M. A.
(2005). Functional defects and the influence of age on the frequency of CD4+
CD25+ T-cells in type 1 diabetes. Diabetes, 54(5), 1407-1414.
doi:10.2337/diabetes.54.5.1407
Budziszewska, B., Jaworska-Feil, L., Kajta, M., & Lason, W. (2000). Antidepressant
drugs inhibit glucocorticoid receptor-mediated gene transcription - a possible
mechanism. British Journal of Pharmacology, 130(6), 1385-1393.
doi:10.1038/sj.bjp.0703445
Bufalino, C., Hepgul, N., Aguglia, E., & Pariante, C. M. (2013). The role of immune genes
in the association between depression and inflammation: A review of recent

393
clinical studies. Brain, behavior, and immunity, 31, 31-47.
doi:http://dx.doi.org/10.1016/j.bbi.2012.04.009
Bull, S. J., Huezo-Diaz, P., Binder, E. B., Cubells, J. F., Ranjith, G., Maddock, C., . . .
Pariante, C. M. (2008). Functional polymorphisms in the interleukin-6 and
serotonin transporter genes, and depression and fatigue induced by interferon-
[alpha] and ribavirin treatment. Mol Psychiatry, 14(12), 1095-1104.
Burnsides, C., Corry, J., Alexander, J., Balint, C., Cosmar, D., Phillips, G., & Marketon,
J. I. (2012). Ex vivo stimulation of whole blood as a means to determine
glucocorticoid sensitivity. J Inflamm Res, 5, 89-97. doi:10.2147/jir.s33569
Cacioppo, J. T., Hughes, M. E., Waite, L. J., Hawkley, L. C., & Thisted, R. A. (2006).
Loneliness as a specific risk factor for depressive symptoms: cross-sectional and
longitudinal analyses. Psychology & Aging, 21(1), 140-151. doi:10.1037/0882-
7974.21.1.140
Cai, W., Mueller, C., Li, Y. J., Shen, W. D., & Stewart, R. (2019). Post stroke depression
and risk of stroke recurrence and mortality: A systematic review and meta-
analysis. Ageing Research Reviews, 50, 102-109. doi:10.1016/j.arr.2019.01.013
Calfa, G., Kademian, S., Ceschin, D., Vega, G., Rabinovich, G. A., & Volosin, M. (2003).
Characterization and functional significance of glucocorticoid receptors in
patients with major depression: modulation by antidepressant treatment.
Psychoneuroendocrinology, 28(5), 687-701.
Call For Participants. (2018). Researchers. Retrieved from
https://www.callforparticipants.com/
Callaghan, C. K., Rouine, J., & O'Mara, S. M. (2018). Potential roles for opioid receptors
in motivation and major depressive disorder. Progress in Brain Research, 239,
89-119. doi:10.1016/bs.pbr.2018.07.009
Callahan, C. M., Wolinsky, F. D., Stump, T. E., Nienaber, N. A., Hui, S. L., & Tierney, W.
M. (1998). Mortality, symptoms, and functional impairment in late-life depression.
Journal of General Internal Medicine, 13(11), 746-752.

394
Camara, M. L., Corrigan, F., Jaehne, E. J., Jawahar, M. C., Anscomb, H., & Baune, B.
T. (2015). Effects of centrally administered etanercept on behavior, microglia, and
astrocytes in mice following a peripheral immune challenge.
Neuropsychopharmacology, 40(2), 502-512. doi:10.1038/npp.2014.199
Camargo, C. A., Jr., Stampfer, M. J., Glynn, R. J., Grodstein, F., Gaziano, J. M., Manson,
J. E., . . . Hennekens, C. H. (1997). Moderate alcohol consumption and risk for
angina pectoris or myocardial infarction in U.S. male physicians. Ann Intern Med,
126(5), 372-375. doi:10.7326/0003-4819-126-5-199703010-00005
Cao, D., Malmstrom, V., Baecher-Allan, C., Hafler, D., Klareskog, L., & Trollmo, C.
(2003). Isolation and functional characterization of regulatory CD25brightCD4+ T
cells from the target organ of patients with rheumatoid arthritis. European Journal
of Immunology, 33(1), 215-223. doi:10.1002/immu.200390024
Capuron, L., & Dantzer, R. (2003). Cytokines and depression: The need for a new
paradigm. Brain, behavior, and immunity, 17(1 SUPPL.), S119-S124.
doi:10.1016/S0889-1591(02)00078-8
Capuron, L., Fornwalt, F. B., Knight, B. T., Harvey, P. D., Ninan, P. T., & Miller, A. H.
(2009). Does Cytokine-Induced Depression Differ from Idiopathic Major
Depression in Medically Healthy Individuals? Journal of Affective Disorders,
119(1-3), 181-185. doi:10.1016/j.jad.2009.02.017
Capuron, L., Gumnick, J. F., Musselman, D. L., Lawson, D. H., Reemsnyder, A.,
Nemeroff, C. B., & Miller, A. H. (2002a). Neurobehavioral effects of interferon-α
in cancer patients: Phenomenology and paroxetine responsiveness of symptom
dimensions. Neuropsychopharmacology, 26(5), 643-652. doi:10.1016/S0893-
133X(01)00407-9
Capuron, L., Raison, C. L., Musselman, D. L., Lawson, D. H., Nemeroff, C. B., & Miller,
A. H. (2003). Association of exaggerated HPA axis response to the initial injection
of interferon-alpha with development of depression during interferon-alpha
therapy. Am J Psychiatry, 160(7), 1342-1345. doi:10.1176/appi.ajp.160.7.1342

395
Capuron, L., Ravaud, A., Neveu, P. J., Miller, A. H., Maes, M., & Dantzer, R. (2002b).
Association between decreased serum tryptophan concentrations and
depressive symptoms in cancer patients undergoing cytokine therapy. Mol
Psychiatry, 7(5), 468-473. doi:10.1038/sj.mp.4000995
Carlos, S., De La Fuente-Arrillaga, C., Bes-Rastrollo, M., Razquin, C., Rico-Campa, A.,
Martinez-Gonzalez, M. A., & Ruiz-Canela, M. (2018). Mediterranean Diet and
Health Outcomes in the SUN Cohort. Nutrients, 10(4). doi:10.3390/nu10040439
Carney, R. M., Blumenthal, J. A., Freedland, K. E., Stein, P. K., Howells, W. B., Berkman,
L. F., . . . Jaffe, A. S. (2005a). Low heart rate variability and the effect of
depression on post-myocardial infarction mortality. Arch Intern Med, 165(13),
1486-1491. doi:10.1001/archinte.165.13.1486
Carney, R. M., Blumenthal, J. A., Stein, P. K., Watkins, L., Catellier, D., Berkman, L. F.,
. . . Freedland, K. E. (2001). Depression, heart rate variability, and acute
myocardial infarction. Circulation, 104(17), 2024-2028.
Carney, R. M., & Freedland, K. E. (2008). Depression in patients with coronary heart
disease. American Journal of Medicine, 121(11 Suppl 2), S20-27.
doi:http://dx.doi.org/10.1016/j.amjmed.2008.09.010
Carney, R. M., Freedland, K. E., & Veith, R. C. (2005b). Depression, the autonomic
nervous system, and coronary heart disease. Psychosomatic Medicine, 67 Suppl
1, S29-33. doi:10.1097/01.psy.0000162254.61556.d5
Carpenter, L. L., Gawuga, C. E., Tyrka, A. R., Lee, J. K., Anderson, G. M., & Price, L. H.
(2010). Association between plasma IL-6 response to acute stress and early-life
adversity in healthy adults. Neuropsychopharmacology, 35(13), 2617-2623.
doi:10.1038/npp.2010.159
Carpenter, L. L., Ross, N. S., Tyrka, A. R., Anderson, G. M., Kelly, M., & Price, L. H.
(2009a). Dex/CRH test cortisol response in outpatients with major depression
and matched healthy controls. Psychoneuroendocrinology, 34(8), 1208-1213.
doi:10.1016/j.psyneuen.2009.03.009

396
Carpenter, L. L., Shattuck, T. T., Tyrka, A. R., Geracioti, T. D., & Price, L. H. (2011).
Effect of childhood physical abuse on cortisol stress response.
Psychopharmacology (Berl), 214(1), 367-375. doi:10.1007/s00213-010-2007-4
Carpenter, L. L., Tyrka, A. R., Ross, N. S., Khoury, L., Anderson, G. M., & Price, L. H.
(2009b). Effect of childhood emotional abuse and age on cortisol responsivity in
adulthood. Biological Psychiatry, 66(1), 69-75.
Carroll, B. J., Curtis, G. C., & Mendels, J. (1976). Neuroendocrine regulation in
depression. II. Discrimination of depressed from nondepressed patients. Arch
Gen Psychiatry, 33(9), 1051-1058.
Carroll, B. J., Martin, F. I., & Davies, B. (1968). Resistance to suppression by
dexamethasone of plasma 11-O.H.C.S. levels in severe depressive illness.
British Medical Journal, 3(5613), 285-287.
Carter, A. M. (2012). Complement activation: an emerging player in the pathogenesis of
cardiovascular disease. Scientifica (Cairo), 2012, 402783.
doi:10.6064/2012/402783
Carvalho, L. A., Bergink, V., Sumaski, L., Wijkhuijs, J., Hoogendijk, W. J., Birkenhager,
T. K., & Drexhage, H. A. (2014). Inflammatory activation is associated with a
reduced glucocorticoid receptor alpha/beta expression ratio in monocytes of
inpatients with melancholic major depressive disorder. Translational Psychiatry,
4, e344. doi:10.1038/tp.2013.118
Carvalho, L. A., Gorenstein, C., Moreno, R., Pariante, C., & Markus, R. P. (2009). Effect
of antidepressants on melatonin metabolite in depressed patients. 23(3), 315-
321.
Carvalho, L. A., Juruena, M. F., Papadopoulos, A. S., Poon, L., Kerwin, R., Cleare, A. J.,
& Pariante, C. M. (2008). Clomipramine in vitro reduces glucocorticoid receptor
function in healthy subjects but not in patients with major depression.
Neuropsychopharmacology, 33(13), 3182-3189.
doi:http://dx.doi.org/10.1038/npp.2008.44

397
Carvalho, L. A., & Pariante, C. M. (2008). In vitro modulation of the glucocorticoid
receptor by antidepressants. Stress, 11(6), 411-424.
doi:10.1080/10253890701850759
Carvalho, L. A., Torre, J. P., Papadopoulos, A. S., Poon, L., Juruena, M. F.,
Markopoulou, K., . . . Pariante, C. M. (2013). Lack of clinical therapeutic benefit
of antidepressants is associated overall activation of the inflammatory system.
Journal of Affective Disorders, 148(1), 136-140.
doi:http://dx.doi.org/10.1016/j.jad.2012.10.036
Case, R. B., Moss, A. J., Case, N., McDermott, M., & Eberly, S. (1992). Living alone after
myocardial infarction. Impact on prognosis. Jama, 267(4), 515-519.
Caspi, A., Sugden, K., Moffitt, T. E., Taylor, A., Craig, I. W., Harrington, H., . . . Poulton,
R. (2003). Influence of Life Stress on Depression: Moderation by a Polymorphism
in the 5-HTT Gene. Science, 301(5631), 386-389. doi:10.1126/science.1083968
Cattaneo, A., Gennarelli, M., Rudolf, U., Breen, G., Farmer, A., Aitchison, K. J., . . .
Pariante, C. M. (2012). Candidate genes expression profile associated with
antidepressants response: Baseline predictors and longitudinal targets.
European Neuropsychopharmacology, 22, S266-S267.
Celano, C. M., Beale, E. E., Beach, S. R., Belcher, A. M., Suarez, L., Motiwala, S. R., . .
. Huffman, J. C. (2017). Associations Between Psychological Constructs and
Cardiac Biomarkers After Acute Coronary Syndrome. Psychosomatic Medicine,
79(3), 318-326. doi:10.1097/psy.0000000000000404
Cervantes Gracia, K., Llanas-Cornejo, D., & Husi, H. (2017). CVD and Oxidative Stress.
J Clin Med, 6(2). doi:10.3390/jcm6020022
Cesari, M., Penninx, B. W., Newman, A. B., Kritchevsky, S. B., Nicklas, B. J., Sutton-
Tyrrell, K., . . . Pahor, M. (2003). Inflammatory markers and onset of
cardiovascular events: results from the Health ABC study. Circulation, 108(19),
2317-2322. doi:10.1161/01.Cir.0000097109.90783.Fc
Chapman, D. P., Liu, Y., Presley-Cantrell, L. R., Edwards, V. J., Wheaton, A. G., Perry,
G. S., & Croft, J. B. (2013). Adverse childhood experiences and frequent

398
insufficient sleep in 5 US States, 2009: a retrospective cohort study. BMC Public
Health, 13(1), 3.
Chapman, D. P., Wheaton, A. G., Anda, R. F., Croft, J. B., Edwards, V. J., Liu, Y., . . .
Perry, G. S. (2011). Adverse childhood experiences and sleep disturbances in
adults. Sleep Medicine, 12(8), 773-779. doi:10.1016/j.sleep.2011.03.013
Checkley, S. (1996). The neuroendocrinology of depression and chronic stress. British
Medical Bulletin, 52(3), 597-617.
Chekroud, A. M., Gueorguieva, R., Krumholz, H. M., Trivedi, M. H., Krystal, J. H., &
McCarthy, G. (2017). Reevaluating the Efficacy and Predictability of
Antidepressant Treatments: A Symptom Clustering Approach. JAMA Psychiatry,
74(4), 370-378. doi:10.1001/jamapsychiatry.2017.0025
Chekroud, A. M., Zotti, R. J., Shehzad, Z., Gueorguieva, R., Johnson, M. K., Trivedi, M.
H., . . . Corlett, P. R. (2016). Cross-trial prediction of treatment outcome in
depression: a machine learning approach. Lancet Psychiatry, 3(3), 243-250.
doi:10.1016/s2215-0366(15)00471-x
Chen, J., Wang, Z.-z., Zhang, S., Zuo, W., & Chen, N.-h. (2016). Does mineralocorticoid
receptor play a vital role in the development of depressive disorder? Life
Sciences, 152, 76-81. doi:https://doi.org/10.1016/j.lfs.2016.03.022
Chen, L., Smith, G. D., Harbord, R. M., & Lewis, S. J. (2008). Alcohol intake and blood
pressure: a systematic review implementing a Mendelian randomization
approach. PLoS Medicine / Public Library of Science, 5(3), e52.
doi:10.1371/journal.pmed.0050052
Chen, X., Baumel, M., Mannel, D. N., Howard, O. M., & Oppenheim, J. J. (2007).
Interaction of TNF with TNF receptor type 2 promotes expansion and function of
mouse CD4+CD25+ T regulatory cells. J Immunol, 179(1), 154-161.
Chen, X., & Oppenheim, J. J. (2010). TNF-alpha: an activator of CD4+FoxP3+TNFR2+
regulatory T cells. Curr Dir Autoimmun, 11, 119-134. doi:10.1159/000289201

399
Chen, X., & Oppenheim, J. J. (2011). Resolving the identity myth: key markers of
functional CD4+FoxP3+ regulatory T cells. International Immunopharmacology,
11(10), 1489-1496. doi:10.1016/j.intimp.2011.05.018
Chen, X., Subleski, J. J., Kopf, H., Howard, O. M., Mannel, D. N., & Oppenheim, J. J.
(2008). Cutting edge: expression of TNFR2 defines a maximally suppressive
subset of mouse CD4+CD25+FoxP3+ T regulatory cells: applicability to tumor-
infiltrating T regulatory cells. J Immunol, 180(10), 6467-6471.
Chen, X., Subleski, J. J., Hamano, R., Howard, O. M., Wiltrout, R. H., & Oppenheim, J.
J. (2010). Co-expression of TNFR2 and CD25 identifies more of the functional
CD4+FOXP3+ regulatory T cells in human peripheral blood. European Journal of
Immunology, 40(4), 1099-1106. doi:10.1002/eji.200940022
Chen, Y., Bender, R. A., Brunson, K. L., Pomper, J. K., Grigoriadis, D. E., Wurst, W., &
Baram, T. Z. (2004). Modulation of dendritic differentiation by corticotropin-
releasing factor in the developing hippocampus. Proc Natl Acad Sci U S A,
101(44), 15782-15787. doi:10.1073/pnas.0403975101
Chen, Y., Jiang, T., Chen, P., Ouyang, J., Xu, G., Zeng, Z., & Sun, Y. (2011). Emerging
tendency towards autoimmune process in major depressive patients: a novel
insight from Th17 cells. Psychiatry Res, 188(2), 224-230.
doi:10.1016/j.psychres.2010.10.029
Chen, Y., Ouyang, J., Liu, S., Zhang, S., Chen, P., & Jiang, T. (2017). The Role of
Cytokines in the Peripheral Blood of Major Depressive Patients. Clin Lab, 63(7),
1207-1212. doi:10.7754/Clin.Lab.2017.170117
Chida, Y., Hamer, M., Wardle, J., & Steptoe, A. (2008). Do stress-related psychosocial
factors contribute to cancer incidence and survival? Nature Clinical Practice
Oncology, 5(8), 466-475. doi:10.1038/ncponc1134
Chida, Y., & Steptoe, A. (2009). Cortisol awakening response and psychosocial factors:
a systematic review and meta-analysis. Biological Psychology, 80(3), 265-278.
doi:10.1016/j.biopsycho.2008.10.004

400
Cho, Y., Shin, S. Y., Won, S., Relton, C. L., Davey Smith, G., & Shin, M. J. (2015).
Alcohol intake and cardiovascular risk factors: A Mendelian randomisation study.
Sci Rep, 5, 18422. doi:10.1038/srep18422
Choi, N. G., & DiNitto, D. M. (2011). Heavy/binge drinking and depressive symptoms in
older adults: gender differences. International Journal of Geriatric Psychiatry,
26(8), 860-868.
Chou, K. L., Liang, K., & Sareen, J. (2011). The association between social isolation and
DSM-IV mood, anxiety, and substance use disorders: wave 2 of the National
Epidemiologic Survey on Alcohol and Related Conditions. The Journal of Clinical
Psychiatry, 72(11), 1468-1476. doi:10.4088/JCP.10m06019gry
Chourbaji, S., Urani, A., Inta, I., Sanchis-Segura, C., Brandwein, C., Zink, M., . . . Gass,
P. (2006). IL-6 knockout mice exhibit resistance to stress-induced development
of depression-like behaviors. Neurobiology of Disease, 23(3), 587-594.
Chrysohoou, C., Liontou, C., Aggelopoulos, P., Kastorini, C. M., Panagiotakos, D.,
Aggelis, A., . . . Stefanadis, C. (2011). Mediterranean diet mediates the adverse
effect of depressive symptomatology on short-term outcome in elderly survivors
from an acute coronary event. Cardiology Research & Practice, 2011, 429487.
doi:10.4061/2011/429487
Chu, A. L., Stochl, J., Lewis, G., Zammit, S., Jones, P. B., & Khandaker, G. M. (2018).
Longitudinal Association between Inflammatory Markers and Specific Symptoms
of Depression in a Prospective Birth Cohort. Brain, Behavior, & Immunity.
doi:10.1016/j.bbi.2018.11.007
Chu, A. L., Stochl, J., Lewis, G., Zammit, S., Jones, P. B., & Khandaker, G. M. (2019).
Longitudinal association between inflammatory markers and specific symptoms
of depression in a prospective birth cohort. Brain, Behavior, & Immunity, 76, 74-
81. doi:10.1016/j.bbi.2018.11.007
Coelho, R., Viola, T. W., Walss-Bass, C., Brietzke, E., & Grassi-Oliveira, R. (2014).
Childhood maltreatment and inflammatory markers: a systematic review. Acta
Psychiatr Scand, 129(3), 180-192. doi:10.1111/acps.12217

401
Cohen, B. E., Edmondson, D., & Kronish, I. M. (2015). State of the Art Review:
Depression, Stress, Anxiety, and Cardiovascular Disease. American Journal of
Hypertension, 28(11), 1295-1302. doi:10.1093/ajh/hpv047
Cohen, S., Janicki-Deverts, D., & Miller, G. E. (2007). Psychological stress and disease.
Jama, 298(14), 1685-1687. doi:10.1001/jama.298.14.1685
Cohen, S., Kamarck, T., & Mermelstein, R. (1983). A global measure of perceived stress.
J Health Soc Behav, 24(4), 385-396.
Cook, I. A., Leuchter, A. F., Morgan, M., Witte, E., Stubbeman, W. F., Abrams, M., . . .
Uijtdehaage, S. H. (2002). Early changes in prefrontal activity characterize clinical
responders to antidepressants. Neuropsychopharmacology, 27(1), 120-131.
doi:10.1016/s0893-133x(02)00294-4
Cooney, J. M., & Dinan, T. G. (2000). Hypothalamic-pituitary-adrenal axis early-feedback
responses are preserved in melancholic depression: a study of sertraline
treatment. Hum Psychopharmacol, 15(5), 351-356. doi:10.1002/1099-
1077(200007)15:5<351::aid-hup193>3.0.co;2-2
Cooper, D. C., Tomfohr, L. M., Milic, M. S., Natarajan, L., Bardwell, W. A., Ziegler, M. G.,
& Dimsdale, J. E. (2011). Depressed mood and flow-mediated dilation: a
systematic review and meta-analysis. Psychosomatic Medicine, 73(5), 360-369.
doi:10.1097/PSY.0b013e31821db79a
Cooper, J., Borland, R., McKee, S. A., Yong, H. H., & Dugue, P. A. (2016). Depression
motivates quit attempts but predicts relapse: differential findings for gender from
the International Tobacco Control Study. Addiction, 111(8), 1438-1447.
doi:10.1111/add.13290
Cope, A. P., Liblau, R. S., Yang, X. D., Congia, M., Laudanna, C., Schreiber, R. D., . . .
McDevitt, H. O. (1997). Chronic tumor necrosis factor alters T cell responses by
attenuating T cell receptor signaling. Journal of Experimental Medicine, 185(9),
1573-1584.
Cope, A. P., Londei, M., Chu, N. R., Cohen, S. B., Elliott, M. J., Brennan, F. M., . . .
Feldmann, M. (1994). Chronic exposure to tumor necrosis factor (TNF) in vitro

402
impairs the activation of T cells through the T cell receptor/CD3 complex; reversal
in vivo by anti-TNF antibodies in patients with rheumatoid arthritis. J Clin Invest,
94(2), 749-760. doi:10.1172/jci117394
Copeland, W. E., Shanahan, L., Worthman, C., Angold, A., & Costello, E. J. (2012).
Cumulative depression episodes predict later C-reactive protein levels: a
prospective analysis. Biological Psychiatry, 71(1), 15-21.
doi:10.1016/j.biopsych.2011.09.023
Corominas-Roso, M., Armario, A., Palomar, G., Corrales, M., Carrasco, J., Richarte, V.,
. . . Ramos-Quiroga, J. A. (2017). IL-6 and TNF-alpha in unmedicated adults with
ADHD: Relationship to cortisol awakening response. Psychoneuroendocrinology,
79, 67-73. doi:10.1016/j.psyneuen.2017.02.017
Correll, C. U., Solmi, M., Veronese, N., Bortolato, B., Rosson, S., Santonastaso, P., . . .
Stubbs, B. (2017). Prevalence, incidence and mortality from cardiovascular
disease in patients with pooled and specific severe mental illness: a large-scale
meta-analysis of 3,211,768 patients and 113,383,368 controls. World Psychiatry,
16(2), 163-180. doi:10.1002/wps.20420
Corthay, A. (2009). How do Regulatory T Cells Work? Scandinavian Journal of
Immunology, 70(4), 326-336. doi:10.1111/j.1365-3083.2009.02308.x
Costantino, C. M., Baecher-Allan, C. M., & Hafler, D. A. (2008). Human regulatory T cells
and autoimmunity. European Journal of Immunology, 38(4), 921-924.
doi:10.1002/eji.200738104
Cropley, M., Rydstedt, L. W., Devereux, J. J., & Middleton, B. (2015). The relationship
between work-related rumination and evening and morning salivary cortisol
secretion. Stress & Health, 31(2), 150-157. doi:10.1002/smi.2538
Cubala, W. J., & Landowski, J. (2014). C-reactive protein and cortisol in drug-naive
patients with short-illness-duration first episode major depressive disorder:
possible role of cortisol immunomodulatory action at early stage of the disease.
Journal of Affective Disorders, 152-154, 534-537. doi:10.1016/j.jad.2013.10.004

403
Cuijpers, P. (2001). Mortality and depressive symptoms in inhabitants of residential
homes. International Journal of Geriatric Psychiatry, 16(2), 131-138.
Cuijpers, P., & Smit, F. (2002). Excess mortality in depression: a meta-analysis of
community studies. Journal of Affective Disorders, 72(3), 227-236.
Cuijpers, P., Vogelzangs, N., Twisk, J., Kleiboer, A., Li, J., & Penninx, B. W. (2013).
Differential mortality rates in major and subthreshold depression: meta-analysis
of studies that measured both. British Journal of Psychiatry, 202(1), 22-27.
doi:10.1192/bjp.bp.112.112169
Cuijpers, P., Vogelzangs, N., Twisk, J., Kleiboer, A., Li, J., & Penninx, B. W. (2014).
Comprehensive meta-analysis of excess mortality in depression in the general
community versus patients with specific illnesses. Am J Psychiatry, 171(4), 453-
462. doi:10.1176/appi.ajp.2013.13030325
Curtis, B. M., & O'Keefe, J. H., Jr. (2002). Autonomic tone as a cardiovascular risk factor:
the dangers of chronic fight or flight. Mayo Clinic Proceedings, 77(1), 45-54.
doi:10.4065/77.1.45
Cushman, M., Arnold, A. M., Psaty, B. M., Manolio, T. A., Kuller, L. H., Burke, G. L., . . .
Tracy, R. P. (2005). C-reactive protein and the 10-year incidence of coronary
heart disease in older men and women: the cardiovascular health study.
Circulation, 112(1), 25-31. doi:10.1161/circulationaha.104.504159
Dai, X., Wiernek, S., Evans, J. P., & Runge, M. S. (2016). Genetics of coronary artery
disease and myocardial infarction. World J Cardiol, 8(1), 1-23.
doi:10.4330/wjc.v8.i1.1
Danese, A., Moffitt, T. E., Pariante, C. M., Ambler, A., Poulton, R., & Caspi, A. (2008).
Elevated inflammation levels in depressed adults with a history of childhood
maltreatment. Arch Gen Psychiatry, 65(4), 409-415.
doi:10.1001/archpsyc.65.4.409
Danese, A., Pariante, C. M., Caspi, A., Taylor, A., & Poulton, R. (2007). Childhood
maltreatment predicts adult inflammation in a life-course study. Proc Natl Acad
Sci U S A, 104(4), 1319-1324. doi:10.1073/pnas.0610362104
404
Danesh, J., Kaptoge, S., Mann, A. G., Sarwar, N., Wood, A., Angleman, S. B., . . .
Gudnason, V. (2008). Long-term interleukin-6 levels and subsequent risk of
coronary heart disease: two new prospective studies and a systematic review.
PLoS Medicine / Public Library of Science, 5(4), e78.
doi:10.1371/journal.pmed.0050078
Dannlowski, U., Ohrmann, P., Bauer, J., Kugel, H., Arolt, V., Heindel, W., & Suslow, T.
(2007). Amygdala reactivity predicts automatic negative evaluations for facial
emotions. Psychiatry Res, 154(1), 13-20.
doi:10.1016/j.pscychresns.2006.05.005
Dantzer, R. (2001). Cytokine-induced sickness behavior: where do we stand? Brain,
Behavior, & Immunity, 15(1), 7-24. doi:10.1006/brbi.2000.0613
Dantzer, R., Gheusi, G., Johnson, R. W., & Kelley, K. W. (1999a). Central administration
of insulin-like growth factor-1 inhibits lipopolysaccharide-induced sickness
behavior in mice. Neuroreport, 10(2), 289-292.
Dantzer, R., & Kelley, K. W. (2007). Twenty years of research on cytokine-induced
sickness behavior. Brain, behavior, and immunity, 21(2), 153-160.
Dantzer, R., Kelley, K. W., & O'Connor, J. C. (2010). Inflammation-associated
depression: A role for indoleamine 2,3 dioxygenase-dependent kynurenine
metabolites. Neuropsychopharmacology, 35, S60.
Dantzer, R., O'Connor, J. C., Freund, G. G., Johnson, R. W., & Kelley, K. W. (2008).
From inflammation to sickness and depression: when the immune system
subjugates the brain. Nat Rev Neurosci, 9(1), 46-56. doi:10.1038/nrn2297
Dantzer, R., Wollman, E., Vitkovic, L., & Yirmiya, R. (1999b). Cytokines and depression:
fortuitous or causative association? Molecular Psychiatry, 4(4), 328-332.
David, D. J., Samuels, B. A., Rainer, Q., Wang, J. W., Marsteller, D., Mendez, I., . . .
Hen, R. (2009). Neurogenesis-dependent and -independent effects of fluoxetine
in an animal model of anxiety/depression. Neuron, 62(4), 479-493.
doi:10.1016/j.neuron.2009.04.017

405
Davidson, K. W., Schwartz, J. E., Kirkland, S. A., Mostofsky, E., Fink, D., Guernsey, D.,
& Shimbo, D. (2009). Relation of inflammation to depression and incident
coronary heart disease (from the Canadian Nova Scotia Health Survey [NSHS95]
Prospective Population Study). The American Journal of Cardiology, 103(6), 755-
761. doi:10.1016/j.amjcard.2008.11.035
Davidson, R. J., Irwin, W., Anderle, M. J., & Kalin, N. H. (2003). The neural substrates of
affective processing in depressed patients treated with venlafaxine. Am J
Psychiatry, 160(1), 64-75. doi:10.1176/appi.ajp.160.1.64
Davis, L., Uezato, A., Newell, J. M., & Frazier, E. (2008). Major depression and comorbid
substance use disorders. Curr Opin Psychiatry, 21(1), 14-18.
doi:10.1097/YCO.0b013e3282f32408
De Bosscher, K., & Haegeman, G. (2009). Minireview: Latest Perspectives on
Antiinflammatory Actions of Glucocorticoids. Molecular Endocrinology, 23(3),
281-291. doi:10.1210/me.2008-0283
de Jonge, P., Mangano, D., & Whooley, M. A. (2007). Differential association of cognitive
and somatic depressive symptoms with heart rate variability in patients with
stable coronary heart disease: findings from the Heart and Soul Study.
Psychosomatic Medicine, 69(8), 735-739. doi:10.1097/PSY.0b013e31815743ca
de Kloet, C., Vermetten, E., Geuze, E., Kavelaars, A., Heijnen, C., & Westenberg, H.
(2006). Assessment of HPA-axis function in posttraumatic stress disorder:
pharmacological and non-pharmacological challenge tests, a review. J Psychiatr
Res, 40(6), 550-567.
de Kloet, E. R. (2014). From receptor balance to rational glucocorticoid therapy.
Endocrinology, 155(8), 2754-2769. doi:10.1210/en.2014-1048
de Kloet, E. R., Derijk, R. H., & Meijer, O. C. (2007a). Therapy Insight: is there an
imbalanced response of mineralocorticoid and glucocorticoid receptors in
depression? Nat Clin Pract Endocrinol Metab, 3(2), 168-179.
doi:10.1038/ncpendmet0403

406
de Kloet, E. R., DeRijk, R. H., & Meijer, O. C. (2007b). Therapy Insight: is there an
imbalanced response of mineralocorticoid and glucocorticoid receptors in
depression? Nature Clinical Practice Endocrinology &Amp; Metabolism, 3, 168.
doi:10.1038/ncpendmet0403
de Kloet, E. R., Joels, M., & Holsboer, F. (2005). Stress and the brain: from adaptation
to disease. Nat Rev Neurosci, 6(6), 463-475. doi:10.1038/nrn1683
de Kloet, E. R., Otte, C., Kumsta, R., Kok, L., Hillegers, M. H., Hasselmann, H., . . . Joels,
M. (2016). Stress and Depression: a Crucial Role of the Mineralocorticoid
Receptor. Journal of Neuroendocrinology, 28(8). doi:10.1111/jne.12379
De Kloet, E. R., Vreugdenhil, E., Oitzl, M. S., & Joels, M. (1998). Brain corticosteroid
receptor balance in health and disease. Endocrine Reviews, 19(3), 269-301.
doi:10.1210/edrv.19.3.0331
Dedovic, K., Engert, V., Duchesne, A., Lue, S. D., Andrews, J., Efanov, S. I., . . .
Pruessner, J. C. (2010). Cortisol awakening response and hippocampal volume:
vulnerability for major depressive disorder? Biological Psychiatry, 68(9), 847-853.
doi:10.1016/j.biopsych.2010.07.025
Dedovic, K., & Ngiam, J. (2015). The cortisol awakening response and major depression:
examining the evidence. Neuropsychiatr Dis Treat, 11, 1181-1189.
doi:10.2147/ndt.s62289
Dekker, J. M., Crow, R. S., Folsom, A. R., Hannan, P. J., Liao, D., Swenne, C. A., &
Schouten, E. G. (2000). Low heart rate variability in a 2-minute rhythm strip
predicts risk of coronary heart disease and mortality from several causes: the
ARIC Study. Atherosclerosis Risk In Communities. Circulation, 102(11), 1239-
1244.
Dekker, M. J., Koper, J. W., van Aken, M. O., Pols, H. A., Hofman, A., de Jong, F. H., . .
. Tiemeier, H. (2008). Salivary cortisol is related to atherosclerosis of carotid
arteries. Journal of Clinical Endocrinology & Metabolism, 93(10), 3741-3747.
doi:10.1210/jc.2008-0496

407
Delgado, P. L. (2000). Depression: the case for a monoamine deficiency. The Journal of
Clinical Psychiatry, 61 Suppl 6, 7-11.
Demakakos, P., Cooper, R., Hamer, M., de Oliveira, C., Hardy, R., & Breeze, E. (2013).
The bidirectional association between depressive symptoms and gait speed:
evidence from the English Longitudinal Study of Ageing (ELSA). PLoS One, 8(7),
e68632.
Dendoncker, K., & Libert, C. (2017). Glucocorticoid resistance as a major drive in sepsis
pathology. Cytokine & Growth Factor Reviews, 35, 85-96.
doi:10.1016/j.cytogfr.2017.04.002
Denicoff, K. D., Rubinow, D. R., Papa, M. Z., Simpson, C., Seipp, C. A., Lotze, M. T., . .
. Rosenberg, S. A. (1987). The neuropsychiatric effects of treatment with
interleukin-2 and lymphokine-activated killer cells. Ann Intern Med, 107(3), 293-
300.
DeRijk, R. H., de Kloet, E. R., Zitman, F. G., & van Leeuwen, N. (2011). Mineralocorticoid
receptor gene variants as determinants of HPA axis regulation and behavior.
Endocr Dev, 20, 137-148. doi:10.1159/000321235
DeRijk, R. H., Wust, S., Meijer, O. C., Zennaro, M. C., Federenko, I. S., Hellhammer, D.
H., . . . de Kloet, E. R. (2006). A common polymorphism in the mineralocorticoid
receptor modulates stress responsiveness. Journal of Clinical Endocrinology &
Metabolism, 91(12), 5083-5089. doi:10.1210/jc.2006-0915
DeSantis, A. S., DiezRoux, A. V., Hajat, A., Aiello, A. E., Golden, S. H., Jenny, N. S., . .
. Shea, S. (2012). Associations of salivary cortisol levels with inflammatory
markers: the Multi-Ethnic Study of Atherosclerosis. Psychoneuroendocrinology,
37(7), 1009-1018. doi:10.1016/j.psyneuen.2011.11.009
Deuschle, M., Hamann, B., Meichel, C., Krumm, B., Lederbogen, F., Kniest, A., . . .
Heuser, I. (2003). Antidepressive treatment with amitriptyline and paroxetine:
effects on saliva cortisol concentrations. J Clin Psychopharmacol, 23(2), 201-
205.

408
Deuschle, M., Schweiger, U., Standhardt, H., Weber, B., & Heuser, I. (1996).
Corticosteroid-binding globulin is not decreased in depressed patients.
Psychoneuroendocrinology, 21(8), 645-649.
Deverts, D. J., Cohen, S., DiLillo, V. G., Lewis, C. E., Kiefe, C., Whooley, M., & Matthews,
K. A. (2010). Depressive symptoms, race, and circulating C-reactive protein: the
Coronary Artery Risk Development in Young Adults (CARDIA) study.
Psychosomatic Medicine, 72(8), 734-741. doi:10.1097/PSY.0b013e3181ec4b98
Dhabhar, F. S., Burke, H. M., Epel, E. S., Mellon, S. H., Rosser, R., Reus, V. I., &
Wolkowitz, O. M. (2009). Low serum IL-10 concentrations and loss of regulatory
association between IL-6 and IL-10 in adults with major depression. J Psychiatr
Res, 43(11), 962-969. doi:10.1016/j.jpsychires.2009.05.010
Dhar, A. K., & Barton, D. A. (2016). Depression and the Link with Cardiovascular
Disease. Front Psychiatry, 7, 33. doi:10.3389/fpsyt.2016.00033
Diamond, M., Kelly, J. P., & Connor, T. J. (2006). Antidepressants suppress production
of the Th1 cytokine interferon-gamma, independent of monoamine transporter
blockade. European Neuropsychopharmacology, 16(7), 481-490.
Dienes, K. A., Hazel, N. A., & Hammen, C. L. (2013). Cortisol secretion in depressed,
and at-risk adults. Psychoneuroendocrinology, 38(6), 927-940.
doi:10.1016/j.psyneuen.2012.09.019
Diez Roux, A. V., Ranjit, N., Powell, L., Jackson, S., Lewis, T. T., Shea, S., & Wu, C.
(2006). Psychosocial factors and coronary calcium in adults without clinical
cardiovascular disease. Ann Intern Med, 144(11), 822-831.
Diniz, B. S., Reynolds, C. F., 3rd, Butters, M. A., Dew, M. A., Firmo, J. O., Lima-Costa,
M. F., & Castro-Costa, E. (2014). The effect of gender, age, and symptom
severity in late-life depression on the risk of all-cause mortality: the Bambui
Cohort Study of Aging. Depress Anxiety, 31(9), 787-795. doi:10.1002/da.22226
Doane, L. D., & Adam, E. K. J. P. (2010). Loneliness and cortisol: Momentary, day-to-
day, and trait associations. 35(3), 430-441.

409
Doane, L. D., Mineka, S., Zinbarg, R. E., Craske, M., Griffith, J. W., & Adam, E. K. (2013).
Are flatter diurnal cortisol rhythms associated with major depression and anxiety
disorders in late adolescence? The role of life stress and daily negative emotion.
Development and Psychopathology, 25(3), 629-642.
doi:10.1017/S0954579413000060
Dobrosielski, D. A., Papandreou, C., Patil, S. P., & Salas-Salvado, J. (2017). Diet and
exercise in the management of obstructive sleep apnoea and cardiovascular
disease risk. Eur Respir Rev, 26(144). doi:10.1183/16000617.0110-2016
Dockray, S., Bhattacharyya, M. R., Molloy, G. J., & Steptoe, A. (2008). The cortisol
awakening response in relation to objective and subjective measures of waking
in the morning. Psychoneuroendocrinology, 33(1), 77-82.
doi:10.1016/j.psyneuen.2007.10.001
Doolin, K., Farrell, C., Tozzi, L., Harkin, A., Frodl, T., & O'Keane, V. (2017). Diurnal
Hypothalamic-Pituitary-Adrenal Axis Measures and Inflammatory Marker
Correlates in Major Depressive Disorder. Int J Mol Sci, 18(10).
doi:10.3390/ijms18102226
Dowlati, Y., Herrmann, N., Swardfager, W., Liu, H., Sham, L., Reim, E. K., & Lanctot, K.
L. (2010). A meta-analysis of cytokines in major depression. Biological
Psychiatry, 67(5), 446-457. doi:10.1016/j.biopsych.2009.09.033
Dranoff, G. (2004). Cytokines in cancer pathogenesis and cancer therapy. Nature
Reviews: Cancer, 4(1), 11-22. doi:10.1038/nrc1252
Drevets, W. C. (2001). Neuroimaging and neuropathological studies of depression:
implications for the cognitive-emotional features of mood disorders. Current
Opinion in Neurobiology, 11(2), 240-249.
Duivis, H. E., de Jonge, P., Penninx, B. W., Na, B. Y., Cohen, B. E., & Whooley, M. A.
(2011). Depressive symptoms, health behaviors, and subsequent inflammation
in patients with coronary heart disease: prospective findings from the heart and
soul study. Am J Psychiatry, 168(9), 913-920.
doi:10.1176/appi.ajp.2011.10081163

410
Duivis, H. E., Vogelzangs, N., Kupper, N., de Jonge, P., & Penninx, B. W. (2013).
Differential association of somatic and cognitive symptoms of depression and
anxiety with inflammation: findings from the Netherlands Study of Depression and
Anxiety (NESDA). Psychoneuroendocrinology, 38(9), 1573-1585.
doi:http://dx.doi.org/10.1016/j.psyneuen.2013.01.002
Dumser, T., Barocka, A., & Schubert, E. (1998). Weight of adrenal glands may be
increased in persons who commit suicide. American Journal of Forensic Medicine
& Pathology, 19(1), 72-76.
Dunjic-Kostic, B., Ivkovic, M., Radonjic, N. V., Petronijevic, N. D., Pantovic, M.,
Damjanovic, A., . . . Jasovic-Gasic, M. (2013). Melancholic and atypical major
depression--connection between cytokines, psychopathology and treatment.
Progress in Neuro-Psychopharmacology & Biological Psychiatry, 43, 1-6.
doi:http://dx.doi.org/10.1016/j.pnpbp.2012.11.009
Dunn, A. J., Swiergiel, A. H., & de Beaurepaire, R. (2005). Cytokines as mediators of
depression: what can we learn from animal studies? Neuroscience &
Biobehavioral Reviews, 29(4-5), 891-909.
DuPage, M., & Bluestone, J. A. (2016). Harnessing the plasticity of CD4(+) T cells to
treat immune-mediated disease. Nature Reviews: Immunology, 16(3), 149-163.
doi:10.1038/nri.2015.18
Dworkin, R. H., Turk, D. C., Wyrwich, K. W., Beaton, D., Cleeland, C. S., Farrar, J. T., .
. . Ader, D. N. J. T. j. o. p. (2008). Interpreting the clinical importance of treatment
outcomes in chronic pain clinical trials: IMMPACT recommendations. 9(2), 105-
121.
Dziurkowska, E., Wesolowski, M., & Dziurkowski, M. (2013). Salivary cortisol in women
with major depressive disorder under selective serotonin reuptake inhibitors
therapy. Arch Womens Ment Health, 16(2), 139-147. doi:10.1007/s00737-013-
0329-z

411
Eilat, E., Mendlovic, S., Doron, A., Zakuth, V., & Spirer, Z. (1999). Increased apoptosis
in patients with major depression: A preliminary study. J Immunol, 163(1), 533-
534.
Eley, T. C., Sugden, K., Corsico, A., Gregory, A. M., Sham, P., McGuffin, P., . . . Craig,
I. W. (2004). Gene-environment interaction analysis of serotonin system markers
with adolescent depression. Mol Psychiatry, 9(10), 908-915.
doi:10.1038/sj.mp.4001546
Eller, N. H., Netterstrom, B., & Allerup, P. (2005). Progression in intima media thickness-
-the significance of hormonal biomarkers of chronic stress.
Psychoneuroendocrinology, 30(8), 715-723.
doi:10.1016/j.psyneuen.2005.01.005
Empana, J. P., Sykes, D. H., Luc, G., Juhan-Vague, I., Arveiler, D., Ferrieres, J., . . .
Ducimetiere, P. (2005). Contributions of depressive mood and circulating
inflammatory markers to coronary heart disease in healthy European men: the
Prospective Epidemiological Study of Myocardial Infarction (PRIME). Circulation,
111(18), 2299-2305. doi:10.1161/01.cir.0000164203.54111.ae
Emptoz-Bonneton, A., Crave, J. C., LeJeune, H., Brebant, C., & Pugeat, M. (1997).
Corticosteroid-binding globulin synthesis regulation by cytokines and
glucocorticoids in human hepatoblastoma-derived (HepG2) cells. Journal of
Clinical Endocrinology & Metabolism, 82(11), 3758-3762.
doi:10.1210/jcem.82.11.4362
Enache, D., Pariante, C. M., & Mondelli, V. (2019). Markers of central inflammation in
major depressive disorder: A systematic review and meta-analysis of studies
examining cerebrospinal fluid, positron emission tomography and post-mortem
brain tissue. Brain, Behavior, & Immunity, 81, 24-40.
doi:10.1016/j.bbi.2019.06.015
Engler, H., Bailey, M. T., Engler, A., Stiner-Jones, L. M., Quan, N., & Sheridan, J. F.
(2008). Interleukin-1 receptor type 1-deficient mice fail to develop social stress-

412
associated glucocorticoid resistance in the spleen. Psychoneuroendocrinology,
33(1), 108-117. doi:10.1016/j.psyneuen.2007.10.007
Epstein, J., Pan, H., Kocsis, J. H., Yang, Y., Butler, T., Chusid, J., . . . Silbersweig, D. A.
(2006). Lack of ventral striatal response to positive stimuli in depressed versus
normal subjects. Am J Psychiatry, 163(10), 1784-1790.
doi:10.1176/ajp.2006.163.10.1784
Eurelings, L. S., van Dalen, J. W., Ter Riet, G., Moll van Charante, E. P., Richard, E., &
van Gool, W. A. (2018). Apathy and depressive symptoms in older people and
incident myocardial infarction, stroke, and mortality: a systematic review and
meta-analysis of individual participant data. Clin Epidemiol, 10, 363-379.
doi:10.2147/clep.S150915
Ezzati, M., Hoorn, S. V., Rodgers, A., Lopez, A. D., Mathers, C. D., & Murray, C. J.
(2003). Estimates of global and regional potential health gains from reducing
multiple major risk factors. Lancet, 362(9380), 271-280.
Fairweather, D. (2014). Sex differences in inflammation during atherosclerosis. Clinical
Medicine Insights. Cardiology, 8(Suppl 3), 49-59. doi:10.4137/cmc.s17068
Fales, C. L., Barch, D. M., Rundle, M. M., Mintun, M. A., Snyder, A. Z., Cohen, J. D., . .
. Sheline, Y. I. (2008). Altered emotional interference processing in affective and
cognitive-control brain circuitry in major depression. Biological Psychiatry, 63(4),
377-384. doi:10.1016/j.biopsych.2007.06.012
Fan, H., Yu, W., Zhang, Q., Cao, H., Li, J., Wang, J., . . . Hu, X. (2014). Depression after
heart failure and risk of cardiovascular and all-cause mortality: a meta-analysis.
Preventive Medicine, 63, 36-42. doi:10.1016/j.ypmed.2014.03.007
Fang, V. S., Tricou, B. J., Robertson, A., & Meltzer, H. Y. (1981). Plasma ACTH and
cortisol levels in depressed patients: relation to dexamethasone suppression test.
Life Sciences, 29(9), 931-938.
Faustman, D. L., Wang, L., Okubo, Y., Burger, D., Ban, L., Man, G., . . . Nathan, D. M.
(2012). Proof-of-Concept, Randomized, Controlled Clinical Trial of Bacillus-

413
Calmette-Guerin for Treatment of Long-Term Type 1 Diabetes. PLoS One, 7(8),
e41756. doi:10.1371/journal.pone.0041756
Faustman, D. L., & Davis, M. (2013). TNF Receptor 2 and Disease: Autoimmunity and
Regenerative Medicine. Front Immunol, 4, 478. doi:10.3389/fimmu.2013.00478
Feger, U., Luther, C., Poeschel, S., Melms, A., Tolosa, E., & Wiendl, H. (2007). Increased
frequency of CD4+ CD25+ regulatory T cells in the cerebrospinal fluid but not in
the blood of multiple sclerosis patients. Clin Exp Immunol, 147(3), 412-418.
doi:10.1111/j.1365-2249.2006.03271.x
Felger, J. C., Alagbe, O., Hu, F., Mook, D., Freeman, A. A., Sanchez, M. M., . . . Miller,
A. H. (2007). Effects of interferon-alpha on rhesus monkeys: a nonhuman primate
model of cytokine-induced depression. Biological Psychiatry, 62(11), 1324-1333.
Felger, J. C., & Lotrich, F. E. (2013). Inflammatory cytokines in depression:
neurobiological mechanisms and therapeutic implications. Neuroscience, 246,
199-229. doi:http://dx.doi.org/10.1016/j.neuroscience.2013.04.060
Ferrari, F., & Villa, R. F. (2017). The Neurobiology of Depression: an Integrated Overview
from Biological Theories to Clinical Evidence. Molecular Neurobiology, 54(7),
4847-4865. doi:10.1007/s12035-016-0032-y
Field, A. (2017). Discovering statistics using IBM SPSS statistics, 5th edition. London:
SAGE Publications.
Fillmore, K. M., Kerr, W. C., Stockwell, T., Chikritzhs, T., & Bostrom, A. (2006). Moderate
alcohol use and reduced mortality risk: Systematic error in prospective studies.
Addiction Research & Theory, 14(2), 101-132.
Fischer, B. A. (2012). A review of American psychiatry through its diagnoses: the history
and development of the Diagnostic and Statistical Manual of Mental Disorders.
Journal of Nervous & Mental Disease, 200(12), 1022-1030.
doi:10.1097/NMD.0b013e318275cf19
Fischer, S., Macare, C., & Cleare, A. J. (2017a). Hypothalamic-pituitary-adrenal (HPA)
axis functioning as predictor of antidepressant response-Meta-analysis. Neurosci
Biobehav Rev, 83, 200-211. doi:10.1016/j.neubiorev.2017.10.012

414
Fischer, S., Strawbridge, R., Vives, A. H., & Cleare, A. J. (2017b). Cortisol as a predictor
of psychological therapy response in depressive disorders: systematic review
and meta-analysis. British Journal of Psychiatry, 210(2), 105-109.
doi:10.1192/bjp.bp.115.180653
Fitzgerald, P., O'Brien, S. M., Scully, P., Rijkers, K., Scott, L. V., & Dinan, T. G. (2006).
Cutaneous glucocorticoid receptor sensitivity and pro-inflammatory cytokine
levels in antidepressant-resistant depression. Psychological Medicine, 36(1), 37-
43.
Fontenot, J. D., Gavin, M. A., & Rudensky, A. Y. (2003). Foxp3 programs the
development and function of CD4+CD25+ regulatory T cells. Nat Immunol, 4(4),
330-336. doi:10.1038/ni904
Fox, K. R. (1999). The influence of physical activity on mental well-being. Public Health
Nutr, 2(3a), 411-418.
Frank, M. G., Miguel, Z. D., Watkins, L. R., & Maier, S. F. (2010). Prior exposure to
glucocorticoids sensitizes the neuroinflammatory and peripheral inflammatory
responses to E. coli lipopolysaccharide. Brain, Behavior, & Immunity, 24(1), 19-
30. doi:10.1016/j.bbi.2009.07.008
Frank, M. G., Thompson, B. M., Watkins, L. R., & Maier, S. F. (2012). Glucocorticoids
mediate stress-induced priming of microglial pro-inflammatory responses. Brain,
Behavior, & Immunity, 26(2), 337-345. doi:10.1016/j.bbi.2011.10.005
Frasure-Smith, N., Lesperance, F., Irwin, M. R., Sauve, C., Lesperance, J., & Theroux,
P. (2007). Depression, C-reactive protein and two-year major adverse cardiac
events in men after acute coronary syndromes. Biological Psychiatry, 62(4), 302-
308. doi:10.1016/j.biopsych.2006.09.029
Frasure-Smith, N., Lesperance, F., Irwin, M. R., Talajic, M., & Pollock, B. G. (2009). The
relationships among heart rate variability, inflammatory markers and depression
in coronary heart disease patients. Brain, behavior, and immunity, 23(8), 1140-
1147.

415
Frazier, L., Vaughn, W. K., Willerson, J. T., Ballantyne, C. M., & Boerwinkle, E. (2009).
Inflammatory protein levels and depression screening after coronary stenting
predict major adverse coronary events. Biol Res Nurs, 11(2), 163-173.
doi:10.1177/1099800409332801
Freedland, K. E., Carney, R. M., & Rich, M. W. (2011). Effect of depression on prognosis
in heart failure. Heart Failure Clinics, 7(1), 11-21.
Freedland, K. E., Rich, M. W., Skala, J. A., Carney, R. M., Davila-Roman, V. G., & Jaffe,
A. S. (2003). Prevalence of depression in hospitalized patients with congestive
heart failure. Psychosomatic Medicine, 65(1), 119-128.
Freier, E., Weber, C. S., Nowottne, U., Horn, C., Bartels, K., Meyer, S., . . . Atanackovic,
D. (2010). Decrease of CD4(+)FOXP3(+) T regulatory cells in the peripheral
blood of human subjects undergoing a mental stressor.
Psychoneuroendocrinology, 35(5), 663-673.
doi:10.1016/j.psyneuen.2009.10.005
Fried, E. I. (2015). Problematic assumptions have slowed down depression research:
why symptoms, not syndromes are the way forward. Front Psychol, 6, 309.
Fried, E. I. (2017). The 52 symptoms of major depression: Lack of content overlap among
seven common depression scales. Journal of Affective Disorders, 208, 191-197.
doi:10.1016/j.jad.2016.10.019
Fried, E. I., & Nesse, R. M. (2014). The impact of individual depressive symptoms on
impairment of psychosocial functioning. PLoS One, 9(2), e90311.
doi:10.1371/journal.pone.0090311
Fried, E. I., & Nesse, R. M. (2015a). Depression is not a consistent syndrome: An
investigation of unique symptom patterns in the STAR*D study. Journal of
Affective Disorders, 172, 96-102. doi:10.1016/j.jad.2014.10.010
Fried, E. I., & Nesse, R. M. (2015b). Depression sum-scores don't add up: Why analyzing
specific depression symptoms is essential. BMC medicine, 13(1).
doi:10.1186/s12916-015-0325-4

416
Fries, E., Dettenborn, L., & Kirschbaum, C. (2009). The cortisol awakening response
(CAR): facts and future directions. Int J Psychophysiol, 72(1), 67-73.
doi:10.1016/j.ijpsycho.2008.03.014
Friess, E., Schmid, D., Modell, S., Brunner, H., Lauer, C. J., Holsboer, F., & Ising, M.
(2008). Dex/CRH-test response and sleep in depressed patients and healthy
controls with and without vulnerability for affective disorders. J Psychiatr Res,
42(14), 1154-1162. doi:10.1016/j.jpsychires.2008.01.005
Fu, C. H., Mourao-Miranda, J., Costafreda, S. G., Khanna, A., Marquand, A. F., Williams,
S. C., & Brammer, M. J. (2008). Pattern classification of sad facial processing:
toward the development of neurobiological markers in depression. Biological
Psychiatry, 63(7), 656-662. doi:10.1016/j.biopsych.2007.08.020
Fuller-Thomson, E., Battiston, M., Gadalla, T. M., & Brennenstuhl, S. (2014). Bouncing
back: remission from depression in a 12-year panel study of a representative
Canadian community sample. Soc Psychiatry Psychiatr Epidemiol, 49(6), 903-
910. doi:10.1007/s00127-013-0814-8
Gal, G., Levav, I., & Gross, R. (2011). Psychopathology among adults abused during
childhood or adolescence: results from the Israel-based World Mental Health
Survey. Journal of Nervous & Mental Disease, 199(4), 222-229.
doi:10.1097/NMD.0b013e31820c7543
Gale, C. R., Batty, G. D., Osborn, D. P., Tynelius, P., & Rasmussen, F. (2014). Mental
disorders across the adult life course and future coronary heart disease: evidence
for general susceptibility. Circulation, 129(2), 186-193.
doi:10.1161/circulationaha.113.002065
Gan, Y., Gong, Y., Tong, X., Sun, H., Cong, Y., Dong, X., . . . Lu, Z. (2014). Depression
and the risk of coronary heart disease: a meta-analysis of prospective cohort
studies. BMC Psychiatry, 14, 371. doi:10.1186/s12888-014-0371-z
Garcia-Esquinas, E., Ortola, R., Galan, I., Soler-Vila, H., Laclaustra, M., & Rodriguez-
Artalejo, F. (2018). Moderate alcohol drinking is not associated with risk of

417
depression in older adults. Sci Rep, 8(1), 11512. doi:10.1038/s41598-018-29985-
4
Gardner, M., Bann, D., Wiley, L., Cooper, R., Hardy, R., Nitsch, D., . . . Ben-Shlomo, Y.
(2014). Gender and telomere length: systematic review and meta-analysis.
Experimental Gerontology, 51, 15-27. doi:10.1016/j.exger.2013.12.004
Gavin, M. A., Rasmussen, J. P., Fontenot, J. D., Vasta, V., Manganiello, V. C., Beavo,
J. A., & Rudensky, A. Y. (2007). Foxp3-dependent programme of regulatory T-
cell differentiation. Nature, 445(7129), 771.
Gazal, M., Souza, L. D., Fucolo, B. A., Wiener, C. D., Silva, R. A., Pinheiro, R. T., . . .
Kaster, M. P. (2013). The impact of cognitive behavioral therapy on IL-6 levels in
unmedicated women experiencing the first episode of depression: a pilot study.
Psychiatry Res, 209(3), 742-745. doi:10.1016/j.psychres.2013.03.002
Gaziano, J. M., Buring, J. E., Breslow, J. L., Goldhaber, S. Z., Rosner, B., VanDenburgh,
M., . . . Hennekens, C. H. (1993). Moderate alcohol intake, increased levels of
high-density lipoprotein and its subfractions, and decreased risk of myocardial
infarction. N Engl J Med, 329(25), 1829-1834.
doi:10.1056/nejm199312163292501
Ge, L., Yap, C. W., Ong, R., & Heng, B. H. (2017). Social isolation, loneliness and their
relationships with depressive symptoms: A population-based study. PLoS One,
12(8), e0182145. doi:10.1371/journal.pone.0182145
Gea, A., Beunza, J. J., Estruch, R., Sánchez-Villegas, A., Salas-Salvadó, J., Buil-
Cosiales, P., . . . Fiol, M. (2013). Alcohol intake, wine consumption and the
development of depression: the PREDIMED study. BMC medicine, 11(1), 192.
Gea, A., Martinez-Gonzalez, M. A., Toledo, E., Sanchez-Villegas, A., Bes-Rastrollo, M.,
Nuñez-Cordoba, J. M., . . . Beunza, J. J. (2012). A longitudinal assessment of
alcohol intake and incident depression: the SUN project. BMC Public Health,
12(1), 954.

418
Geerlings, S. W., Beekman, A. T., Deeg, D. J., Twisk, J. W., & Van Tilburg, W. (2002).
Duration and severity of depression predict mortality in older adults in the
community. Psychological Medicine, 32(4), 609-618.
Gehi, A., Haas, D., Pipkin, S., & Whooley, M. A. (2005). Depression and medication
adherence in outpatients with coronary heart disease: findings from the Heart
and Soul Study. Arch Intern Med, 165(21), 2508-2513.
doi:10.1001/archinte.165.21.2508
Gerli, R., Nocentini, G., Alunno, A., Bocci, E. B., Bianchini, R., Bistoni, O., & Riccardi, C.
(2009). Identification of regulatory T cells in systemic lupus erythematosus.
Autoimmunity Reviews, 8(5), 426-430. doi:10.1016/j.autrev.2009.01.004
Geschwind, D. H., & Flint, J. (2015). Genetics and genomics of psychiatric disease.
Science, 349(6255), 1489-1494. doi:10.1126/science.aaa8954
Gillespie, N. A., Whitfield, J. B., Williams, B., Heath, A. C., & Martin, N. G. (2005). The
relationship between stressful life events, the serotonin transporter (5-HTTLPR)
genotype and major depression. Psychological Medicine, 35(1), 101-111.
Gilman, S. E., Trinh, N. H., Smoller, J. W., Fava, M., Murphy, J. M., & Breslau, J. (2013).
Psychosocial stressors and the prognosis of major depression: a test of Axis IV.
Psychological Medicine, 43(2), 303-316. doi:10.1017/s0033291712001080
Gimeno, D., Kivimaki, M., Brunner, E. J., Elovainio, M., De Vogli, R., Steptoe, A., . . .
Ferrie, J. E. (2009). Associations of C-reactive protein and interleukin-6 with
cognitive symptoms of depression: 12-year follow-up of the Whitehall II study.
Psychological Medicine, 39(3), 413-423. doi:10.1017/s0033291708003723
Girod, J. P., & Brotman, D. J. (2004). Does altered glucocorticoid homeostasis increase
cardiovascular risk? Cardiovasc Res, 64(2), 217-226.
doi:10.1016/j.cardiores.2004.07.006
Gisslinger, H., Svoboda, T., Clodi, M., Gilly, B., Ludwig, H., Havelec, L., & Luger, A.
(1993). Interferon-alpha stimulates the hypothalamic-pituitary-adrenal axis in vivo
and in vitro. Neuroendocrinology, 57(3), 489-495. doi:10.1159/000126396

419
Glaus, J., Vandeleur, C. L., von Kanel, R., Lasserre, A. M., Strippoli, M. P. F., Gholam-
Rezaee, M., . . . Preisig, M. (2014). Associations between mood, anxiety or
substance use disorders and inflammatory markers after adjustment for multiple
covariates in a population-based study. J Psychiatr Res, 58, 36-45.
Glaus, J., von Kanel, R., Lasserre, A. M., Strippoli, M. F., Vandeleur, C. L., Castelao, E.,
. . . Merikangas, K. R. (2018). Mood disorders and circulating levels of
inflammatory markers in a longitudinal population-based study. Psychological
Medicine, 48(6), 961-973. doi:10.1017/s0033291717002744
Goldberg, D. (2011). The heterogeneity of "major depression". World Psychiatry, 10(3),
226-228.
Goldsmith, D. R., Haroon, E., Woolwine, B. J., Jung, M. Y., Wommack, E., Harvey, P.
D., . . . Miller, A. H. (2016a). Inflammatory markers are associated with decreased
psychomotor speed in patients with major depressive disorder. Biological
Psychiatry, 1), 53S.
Goldsmith, D. R., Rapaport, M. H., & Miller, B. J. (2016b). A meta-analysis of blood
cytokine network alterations in psychiatric patients: comparisons between
schizophrenia, bipolar disorder and depression. Mol Psychiatry, 21(12), 1696-
1709. doi:10.1038/mp.2016.3
Goldstein, C. M., Gathright, E. C., & Garcia, S. (2017). Relationship between depression
and medication adherence in cardiovascular disease: the perfect challenge for
the integrated care team. Patient Prefer Adherence, 11, 547-559.
doi:10.2147/ppa.s127277
Goleva, E., Kisich, K. O., & Leung, D. Y. (2002). A role for STAT5 in the pathogenesis of
IL-2-induced glucocorticoid resistance. J Immunol, 169(10), 5934-5940.
Golia, E., Limongelli, G., Natale, F., Fimiani, F., Maddaloni, V., Pariggiano, I., . . .
Calabro, P. (2014). Inflammation and cardiovascular disease: from pathogenesis
to therapeutic target. Current Atherosclerosis Reports, 16(9), 435.
doi:10.1007/s11883-014-0435-z

420
Gonul, A. S., Cetinkalp, S., Tunay, S., Polat, I., Simsek, F., Aksoy, B., . . . Coburn, K. L.
(2017). Cortisol response patterns in depressed women and their healthy
daughters at risk: Comparison with healthy women and their daughters. J
Psychiatr Res, 85, 66-74. doi:10.1016/j.jpsychires.2016.11.001
Goodkind, M., Eickhoff, S. B., Oathes, D. J., Jiang, Y., Chang, A., Jones-Hagata, L. B.,
. . . Etkin, A. (2015). Identification of a common neurobiological substrate for
mental illness. JAMA Psychiatry, 72(4), 305-315.
doi:10.1001/jamapsychiatry.2014.2206
Gormley, G. J., Lowy, M. T., Reder, A. T., Hospelhorn, V. D., Antel, J. P., & Meltzer, H.
Y. (1985). Glucocorticoid receptors in depression: relationship to the
dexamethasone suppression test. Am J Psychiatry, 142(11), 1278-1284.
doi:10.1176/ajp.142.11.1278
Gould, E., Cameron, H. A., Daniels, D. C., Woolley, C. S., & McEwen, B. S. (1992).
Adrenal hormones suppress cell division in the adult rat dentate gyrus. Journal
of Neuroscience, 12(9), 3642-3650.
Grainger, D. The inflammatory component of atherosclerosis: a signpost to new
therapeutic options? . Retrieved from
http://www.athero.org/commentaries/comm293.asp
Grant, C. R., Liberal, R., Mieli-Vergani, G., Vergani, D., & Longhi, M. S. (2015).
Regulatory T-cells in autoimmune diseases: challenges, controversies and--yet-
-unanswered questions. Autoimmunity Reviews, 14(2), 105-116.
doi:10.1016/j.autrev.2014.10.012
Greden, J. F., Gardner, R., King, D., Grunhaus, L., Carroll, B. J., & Kronfol, Z. (1983).
Dexamethasone suppression tests in antidepressant treatment of melancholia.
The process of normalization and test-retest reproducibility. Arch Gen Psychiatry,
40(5), 493-500.
Greenwood, J., & Mason, J. C. (2007). Statins and the vascular endothelial inflammatory
response. Trends in Immunology, 28(2), 88-98. doi:10.1016/j.it.2006.12.003
421
Grenard, J. L., Munjas, B. A., Adams, J. L., Suttorp, M., Maglione, M., McGlynn, E. A., &
Gellad, W. F. (2011). Depression and medication adherence in the treatment of
chronic diseases in the United States: a meta-analysis. Journal of General
Internal Medicine, 26(10), 1175-1182. doi:10.1007/s11606-011-1704-y
Grosse, L., Ambree, O., Jorgens, S., Jawahar, M. C., Singhal, G., Stacey, D., . . . Baune,
B. T. (2016a). Cytokine levels in major depression are related to childhood
trauma but not to recent stressors. Psychoneuroendocrinology, 73, 24-31.
doi:10.1016/j.psyneuen.2016.07.205
Grosse, L., Carvalho, L., Birkenhager, T., Hoogendijk, W., Drexhage, H., & Bergink, V.
(2015). Circulating cytotoxic T cells and natural killer cells as potential predictors
for antidepressant response in melancholic depression. European
Neuropsychopharmacology, 25, S435-S436.
Grosse, L., Hoogenboezem, T., Ambree, O., Bellingrath, S., Jorgens, S., de Wit, H. J., .
. . Drexhage, H. A. (2016b). Deficiencies of the T and natural killer cell system in
major depressive disorder: T regulatory cell defects are associated with
inflammatory monocyte activation. Brain, Behavior, & Immunity, 54, 38-44.
doi:10.1016/j.bbi.2015.12.003
Grossi, G., Perski, A., Evengård, B., Blomkvist, V., & Orth-Gomér, K. (2003).
Physiological correlates of burnout among women. J Psychosom Res, 55(4),
309-316.
Gunnar, M., & Quevedo, K. (2007). The neurobiology of stress and development. Annu
Rev Psychol, 58, 145-173. doi:10.1146/annurev.psych.58.110405.085605
Gurbel, P. A., Becker, R. C., Mann, K. G., Steinhubl, S. R., & Michelson, A. D. (2007).
Platelet function monitoring in patients with coronary artery disease. J Am Coll
Cardiol, 50(19), 1822-1834. doi:10.1016/j.jacc.2007.07.051
Haapakoski, R., Mathieu, J., Ebmeier, K. P., Alenius, H., & Kivimaki, M. (2015).
Cumulative meta-analysis of interleukins 6 and 1beta, tumour necrosis factor
alpha and C-reactive protein in patients with major depressive disorder. Brain,
Behavior, & Immunity, 49, 206-215. doi:10.1016/j.bbi.2015.06.001

422
Haarman, E. G., Kaspers, G. J., & Veerman, A. J. (2003). Glucocorticoid resistance in
childhood leukaemia: mechanisms and modulation. British Journal of
Haematology, 120(6), 919-929. doi:10.1046/j.1365-2141.2003.04189.x
Haas, J., Hug, A., Viehover, A., Fritzsching, B., Falk, C. S., Filser, A., . . . Wildemann, B.
(2005). Reduced suppressive effect of CD4+CD25high regulatory T cells on the
T cell immune response against myelin oligodendrocyte glycoprotein in patients
with multiple sclerosis. European Journal of Immunology, 35(11), 3343-3352.
doi:10.1002/eji.200526065
Hackett, M. L., & Pickles, K. (2014). Part I: frequency of depression after stroke: an
updated systematic review and meta-analysis of observational studies. Int J
Stroke, 9(8), 1017-1025. doi:10.1111/ijs.12357
Hadi, H. A., Carr, C. S., & Al Suwaidi, J. (2005). Endothelial dysfunction: cardiovascular
risk factors, therapy, and outcome. Vasc Health Risk Manag, 1(3), 183-198.
Hagendorf, A., Koper, J. W., de Jong, F. H., Brinkmann, A. O., Lamberts, S. W., &
Feelders, R. A. (2005). Expression of the human glucocorticoid receptor splice
variants alpha, beta, and P in peripheral blood mononuclear leukocytes in healthy
controls and in patients with hyper- and hypocortisolism. Journal of Clinical
Endocrinology & Metabolism, 90(11), 6237-6243. doi:10.1210/jc.2005-1042
Hajat, A., Diez-Roux, A. V., Sanchez, B. N., Holvoet, P., Lima, J. A., Merkin, S. S., . . .
Wu, M. (2013). Examining the association between salivary cortisol levels and
subclinical measures of atherosclerosis: the Multi-Ethnic Study of
Atherosclerosis. Psychoneuroendocrinology, 38(7), 1036-1046.
doi:10.1016/j.psyneuen.2012.10.007
Halaris, A. (2009). Comorbidity between depression and cardiovascular disease.
International Angiology, 28(2), 92-99.
Halaris, A. (2013a). Co-morbidity between cardiovascular pathology and depression:
Role of inflammation. In Inflammation in Psychiatry (pp. 144-161).
Allschwilerstrasse 10, P.O. Box, Basel CH-4009, Switzerland: S. Karger AG.

423
Halaris, A. (2013b). Co-morbidity between cardiovascular pathology and depression:
role of inflammation. Modern Trends in Pharmacopsychiatry, 28, 144-161.
doi:http://dx.doi.org/10.1159/000343981
Halaris, A. (2013c). Inflammation, heart disease, and depression. Curr Psychiatry Rep,
15(10), 400. doi:10.1007/s11920-013-0400-5
Halbreich, U., Asnis, G. M., Shindledecker, R., Zumoff, B., & Nathan, R. S. (1985).
Cortisol secretion in endogenous depression. I. Basal plasma levels. Arch Gen
Psychiatry, 42(9), 904-908.
Hamer, M. (2012). Psychosocial stress and cardiovascular disease risk: the role of
physical activity. Psychosomatic Medicine, 74(9), 896-903.
doi:http://dx.doi.org/10.1097/PSY.0b013e31827457f4
Hamer, M., Bates, C. J., & Mishra, G. D. (2011). Depression, physical function, and risk
of mortality: National Diet and Nutrition Survey in adults older than 65 years.
American Journal of Geriatric Psychiatry, 19(1), 72-78.
doi:http://dx.doi.org/10.1097/JGP.0b013e3181df465e
Hamer, M., Batty, G. D., & Kivimaki, M. (2012). Risk of future depression in people who
are obese but metabolically healthy: The English Longitudinal Study of Ageing.
Molecular Psychiatry, 17(9), 940-945. doi:10.1038/mp.2012.30
Hamer, M., Kivimaki, M., Lahiri, A., Marmot, M. G., & Steptoe, A. (2010). Persistent
cognitive depressive symptoms are associated with coronary artery calcification.
210(1), 209-213.
Hamer, M., Molloy, G. J., & Stamatakis, E. (2008a). Psychological distress as a risk factor
for cardiovascular events: pathophysiological and behavioral mechanisms.
Journal of the American College of Cardiology, 52(25), 2156-2162.
doi:http://dx.doi.org/10.1016/j.jacc.2008.08.057
Hamer, M., Stamatakis, E., & Steptoe, A. (2008b). Psychiatric hospital admissions,
behavioral risk factors, and all-cause mortality: the Scottish health survey. Arch
Intern Med, 168(22), 2474-2479. doi:10.1001/archinte.168.22.2474

424
Hamilton, M. (1960). A rating scale for depression. J Neurol Neurosurg Psychiatry, 23,
56-62.
Hammen, C. (2005). Stress and depression. Annu. Rev. Clin. Psychol., 1, 293-319.
Han, G. M., O'Neil-Andersen, N. J., Zurier, R. B., & Lawrence, D. A. (2008).
CD4+CD25high T cell numbers are enriched in the peripheral blood of patients
with rheumatoid arthritis. Cell Immunol, 253(1-2), 92-101.
doi:10.1016/j.cellimm.2008.05.007
Hannestad, J., DellaGioia, N., & Bloch, M. (2011). The effect of antidepressant
medication treatment on serum levels of inflammatory cytokines: a meta-
analysis. Neuropsychopharmacology, 36(12), 2452-2459.
doi:10.1038/npp.2011.132
Hansel, A., Hong, S., Camara, R. J., & von Kanel, R. (2010). Inflammation as a
psychophysiological biomarker in chronic psychosocial stress. Neurosci
Biobehav Rev, 35(1), 115-121. doi:10.1016/j.neubiorev.2009.12.012
Hansson, G. K. (2005). Inflammation, atherosclerosis, and coronary artery disease. N
Engl J Med, 352(16), 1685-1695. doi:10.1056/NEJMra043430
Hansson, G. K., & Hermansson, A. (2011). The immune system in atherosclerosis. Nat
Immunol, 12(3), 204-212. doi:10.1038/ni.2001
Hansson, G. K., & Libby, P. (2006). The immune response in atherosclerosis: a double-
edged sword. Nature Reviews: Immunology, 6(7), 508-519. doi:10.1038/nri1882
Harald, B., & Gordon, P. (2012). Meta-review of depressive subtyping models. Journal
of Affective Disorders, 139(2), 126-140.
doi:https://doi.org/10.1016/j.jad.2011.07.015
Hardeveld, F., Spijker, J., Vreeburg, S. A., Graaf, R. D., Hendriks, S. M., Licht, C. M., . .
. Beekman, A. T. (2014). Increased cortisol awakening response was associated
with time to recurrence of major depressive disorder. Psychoneuroendocrinology,
50, 62-71. doi:10.1016/j.psyneuen.2014.07.027
425
Harkness, K. L., Bagby, R. M., & Kennedy, S. H. (2012). Childhood maltreatment and
differential treatment response and recurrence in adult major depressive
disorder. J Consult Clin Psychol, 80(3), 342-353. doi:10.1037/a0027665
Harmer, C. J., Bhagwagar, Z., Shelley, N., & Cowen, P. J. (2003). Contrasting effects of
citalopram and reboxetine on waking salivary cortisol. Psychopharmacology
(Berl), 167(1), 112-114. doi:10.1007/s00213-003-1417-y
Haroon, E., Raison, C. L., & Miller, A. H. (2012). Psychoneuroimmunology meets
neuropsychopharmacology: Translational implications of the impact of
inflammation on behavior. Neuropsychopharmacology, 37(1), 137-162.
Harvey, S. B., Hotopf, M., Overland, S., & Mykletun, A. (2010). Physical activity and
common mental disorders. British Journal of Psychiatry, 197(5), 357-364.
doi:10.1192/bjp.bp.109.075176
Haskell, W. L., Lee, I. M., Pate, R. R., Powell, K. E., Blair, S. N., Franklin, B. A., . . .
Bauman, A. (2007). Physical activity and public health: updated recommendation
for adults from the American College of Sports Medicine and the American Heart
Association. Medicine & Science in Sports & Exercise, 39(8), 1423-1434.
doi:10.1249/mss.0b013e3180616b27
Hasselmann, H., Gamradt, S., Taenzer, A., Nowacki, J., Zain, R., Patas, K., . . . Otte, C.
(2018). Pro-inflammatory Monocyte Phenotype and Cell-Specific Steroid
Signaling Alterations in Unmedicated Patients With Major Depressive Disorder.
Front Immunol, 9, 2693. doi:10.3389/fimmu.2018.02693
Hatzinger, M., Hemmeter, U. M., Baumann, K., Brand, S., & Holsboer-Trachsler, E.
(2002). The combined DEX-CRH test in treatment course and long-term outcome
of major depression. J Psychiatr Res, 36(5), 287-297.
Haycock, P. C., Heydon, E. E., Kaptoge, S., Butterworth, A. S., Thompson, A., & Willeit,
P. (2014). Leucocyte telomere length and risk of cardiovascular disease:
systematic review and meta-analysis. British Medical Journal (Clinical Research
Edition), 349, g4227. doi:10.1136/bmj.g4227

426
Haynes, J. C., Farrell, M., Singleton, N., Meltzer, H., Araya, R., Lewis, G., & Wiles, N. J.
(2005). Alcohol consumption as a risk factor for anxiety and depression: results
from the longitudinal follow-up of the National Psychiatric Morbidity Survey. The
British Journal of Psychiatry, 187(6), 544-551.
Head, J., Stansfeld, S., Ebmeier, K., Geddes, J., Allan, C., Lewis, G., & Kivimäki, M.
(2013). Use of self-administered instruments to assess psychiatric disorders in
older people: validity of the General Health Questionnaire, the Center for
Epidemiologic Studies Depression Scale and the self-completion version of the
revised Clinical Interview Schedule. Psychological Medicine, 43(12), 2649-2656.
Heeschen, C., Hamm, C. W., Bruemmer, J., & Simoons, M. L. (2000). Predictive value
of C-reactive protein and troponin T in patients with unstable angina: a
comparative analysis. CAPTURE Investigators. Chimeric c7E3 AntiPlatelet
Therapy in Unstable angina REfractory to standard treatment trial. J Am Coll
Cardiol, 35(6), 1535-1542.
Heikkinen, R. L., & Kauppinen, M. (2004). Depressive symptoms in late life: a 10-year
follow-up. Arch Gerontol Geriatr, 38(3), 239-250.
doi:10.1016/j.archger.2003.10.004
Heils, A., Teufel, A., Petri, S., Seemann, M., Bengel, D., Balling, U., . . . Lesch, K. P.
(1995). Functional promoter and polyadenylation site mapping of the human
serotonin (5-HT) transporter gene. J Neural Transm Gen Sect, 102(3), 247-254.
Heils, A., Teufel, A., Petri, S., Stober, G., Riederer, P., Bengel, D., & Lesch, K. P. (1996).
Allelic variation of human serotonin transporter gene expression. Journal of
Neurochemistry, 66(6), 2621-2624.
Heim, C., Ehlert, U., & Hellhammer, D. H. (2000a). The potential role of hypocortisolism
in the pathophysiology of stress-related bodily disorders.
Psychoneuroendocrinology, 25(1), 1-35.
Heim, C., Mletzko, T., Purselle, D., Musselman, D. L., & Nemeroff, C. B. (2008a). The
dexamethasone/corticotropin-releasing factor test in men with major depression:
role of childhood trauma. Biological Psychiatry, 63(4), 398-405.

427
Heim, C., Mletzko, T., Purselle, D., Musselman, D. L., & Nemeroff, C. B. (2008b). The
dexamethasone/corticotropin-releasing factor test in men with major depression:
role of childhood trauma. Biological Psychiatry, 63(4), 398-405.
doi:10.1016/j.biopsych.2007.07.002
Heim, C., Newport, D. J., Heit, S., Graham, Y. P., Wilcox, M., Bonsall, R., . . . Nemeroff,
C. B. (2000b). Pituitary-adrenal and autonomic responses to stress in women
after sexual and physical abuse in childhood. Jama, 284(5), 592-597.
Heim, C., Newport, D. J., Wagner, D., Wilcox, M. M., Miller, A. H., & Nemeroff, C. B.
(2002). The role of early adverse experience and adulthood stress in the
prediction of neuroendocrine stress reactivity in women: a multiple regression
analysis. Depress Anxiety, 15(3), 117-125. doi:10.1002/da.10015
Hek, K., Demirkan, A., Lahti, J., Terracciano, A., Teumer, A., Cornelis, M. C., . . .
Murabito, J. (2013). A genome-wide association study of depressive symptoms.
Biological Psychiatry, 73(7), 667-678. doi:10.1016/j.biopsych.2012.09.033
Hellhammer, D. H., Wüst, S., & Kudielka, B. M. (2009). Salivary cortisol as a biomarker
in stress research. Psychoneuroendocrinology, 34(2), 163-171.
Hellhammer, J., Fries, E., Schweisthal, O., Schlotz, W., Stone, A., & Hagemann, D. J. P.
(2007). Several daily measurements are necessary to reliably assess the cortisol
rise after awakening: state-and trait components. 32(1), 80-86.
Hemingway, H., Philipson, P., Chen, R., Fitzpatrick, N. K., Damant, J., Shipley, M., . . .
Hingorani, A. D. (2010). Evaluating the quality of research into a single prognostic
biomarker: a systematic review and meta-analysis of 83 studies of C-reactive
protein in stable coronary artery disease. PLoS Medicine / Public Library of
Science, 7(6), e1000286. doi:10.1371/journal.pmed.1000286
Hennings, J. M., Owashi, T., Binder, E. B., Horstmann, S., Menke, A., Kloiber, S., . . .
Messer, T. (2009). Clinical characteristics and treatment outcome in a
representative sample of depressed inpatients–findings from the Munich
Antidepressant Response Signature (MARS) project. J Psychiatr Res, 43(3),
215-229.

428
Hepgul, N., Cattaneo, A., Agarwal, K., Baraldi, S., Borsini, A., Bufalino, C., . . . Pariante,
C. M. (2016). Transcriptomics in Interferon-alpha-Treated Patients Identifies
Inflammation-, Neuroplasticity- and Oxidative Stress-Related Signatures as
Predictors and Correlates of Depression. Neuropsychopharmacology, 41(10),
2502-2511.
Herbert, J., Goodyer, I. M., Grossman, A. B., Hastings, M. H., de Kloet, E. R., Lightman,
S. L., . . . Seckl, J. R. (2006). Do corticosteroids damage the brain? Journal of
Neuroendocrinology, 18(6), 393-411. doi:10.1111/j.1365-2826.2006.01429.x
Herbert, T. B., & Cohen, S. (1993). Depression and immunity: a meta-analytic review.
Psychol Bull, 113(3), 472-486.
Herkenham, M., & Kigar, S. L. (2017). Contributions of the adaptive immune system to
mood regulation: Mechanisms and pathways of neuroimmune interactions.
Progress in Neuro-Psychopharmacology & Biological Psychiatry, 79(Pt A), 49-
57. doi:10.1016/j.pnpbp.2016.09.003
Hernandez, M. E., Mendieta, D., Perez-Tapia, M., Bojalil, R., Estrada-Garcia, I., Estrada-
Parra, S., & Pavon, L. (2013). Effect of selective serotonin reuptake inhibitors and
immunomodulator on cytokines levels: an alternative therapy for patients with
major depressive disorder. Clinical & Developmental Immunology, 2013, 267871.
doi:http://dx.doi.org/10.1155/2013/267871
Hertle, E., Stehouwer, C. D., & van Greevenbroek, M. M. (2014). The complement
system in human cardiometabolic disease. Molecular Immunology, 61(2), 135-
148. doi:10.1016/j.molimm.2014.06.031
Hestad, K. A., Engedal, K., Whist, J. E., & Farup, P. G. (2017). The Relationships among
Tryptophan, Kynurenine, Indoleamine 2,3-Dioxygenase, Depression, and
Neuropsychological Performance. Front Psychol, 8, 1561.
doi:10.3389/fpsyg.2017.01561
Heuser, I., Schweiger, U., Gotthardt, U., Schmider, J., Lammers, C. H., Dettling, M., . . .
Holsboer, F. (1996). Pituitary-adrenal-system regulation and psychopathology

429
during amitriptyline treatment in elderly depressed patients and normal
comparison subjects. Am J Psychiatry, 153(1), 93-99. doi:10.1176/ajp.153.1.93
Heuser, I., Yassouridis, A., & Holsboer, F. (1994). The combined dexamethasone/CRH
test: a refined laboratory test for psychiatric disorders. J Psychiatr Res, 28(4),
341-356.
Hewitt, P. L., Flett, G. L., & Mosher, S. W. (1992). The Perceived Stress Scale: Factor
structure and relation to depression symptoms in a psychiatric sample. Journal
of Psychopathology and Behavioral Assessment, 14(3), 247-257.
Hickie, I., Hickie, C., Lloyd, A., Silove, D., & Wakefield, D. (1993). Impaired in vivo
immune responses in patients with melancholia. British Journal of Psychiatry,
162, 651-657.
Hiles, S. A., Baker, A. L., de Malmanche, T., & Attia, J. (2012a). Interleukin-6, C-reactive
protein and interleukin-10 after antidepressant treatment in people with
depression: a meta-analysis. Psychological Medicine, 42(10), 2015-2026.
doi:http://dx.doi.org/10.1017/S0033291712000128
Hiles, S. A., Baker, A. L., de Malmanche, T., & Attia, J. (2012b). A meta-analysis of
differences in IL-6 and IL-10 between people with and without depression:
exploring the causes of heterogeneity. Brain, Behavior, & Immunity, 26(7), 1180-
1188. doi:10.1016/j.bbi.2012.06.001
Hiles, S. A., Baker, A. L., de Malmanche, T., McEvoy, M., Boyle, M., & Attia, J. (2015).
The role of inflammatory markers in explaining the association between
depression and cardiovascular hospitalisations. Journal of Behavioral Medicine,
38(4), 609-619. doi:10.1007/s10865-015-9637-2
Hill, E. M., Billington, R., & Krägeloh, C. (2013). The cortisol awakening response and
the big five personality dimensions. Personality and Individual Differences, 55(5),
600-605.
Himmerich, H., Binder, E. B., Kunzel, H. E., Schuld, A., Lucae, S., Uhr, M., . . . Ising, M.
(2006). Successful antidepressant therapy restores the disturbed interplay
between TNF-alpha system and HPA axis. Biological Psychiatry, 60(8), 882-888.

430
Himmerich, H., Milenovic, S., Fulda, S., Plumakers, B., Sheldrick, A. J., Michel, T. M., . .
. Rink, L. (2010). Regulatory T cells increased while IL-1beta decreased during
antidepressant therapy. J Psychiatr Res, 44(15), 1052-1057.
doi:10.1016/j.jpsychires.2010.03.005
Hinkelmann, K., Hellmann-Regen, J., Wingenfeld, K., Kuehl, L. K., Mews, M., Fleischer,
J., . . . Otte, C. (2016). Mineralocorticoid receptor function in depressed patients
and healthy individuals. Progress in Neuro-Psychopharmacology and Biological
Psychiatry, 71, 183-188. doi:https://doi.org/10.1016/j.pnpbp.2016.08.003
Hinkelmann, K., Moritz, S., Botzenhardt, J., Muhtz, C., Wiedemann, K., Kellner, M., &
Otte, C. (2012). Changes in cortisol secretion during antidepressive treatment
and cognitive improvement in patients with major depression: a longitudinal
study. Psychoneuroendocrinology, 37(5), 685-692.
doi:10.1016/j.psyneuen.2011.08.012
Hinkelmann, K., Muhtz, C., Dettenborn, L., Agorastos, A., Wingenfeld, K., Spitzer, C., . .
. Otte, C. (2013). Association between childhood trauma and low hair cortisol in
depressed patients and healthy control subjects. Biological Psychiatry, 74(9),
e15-17. doi:10.1016/j.biopsych.2013.04.021
Hiroe, T., Kojima, M., Yamamoto, I., Nojima, S., Kinoshita, Y., Hashimoto, N., . . .
Furukawa, T. A. J. P. r. (2005). Gradations of clinical severity and sensitivity to
change assessed with the Beck Depression Inventory-II in Japanese patients
with depression. 135(3), 229-235.
Hodes, G. E., Pfau, M. L., Leboeuf, M., Golden, S. A., Christoffel, D. J., Bregman, D., . .
. Russo, S. J. (2014). Individual differences in the peripheral immune system
promote resilience versus susceptibility to social stress. Proc Natl Acad Sci U S
A, 111(45), 16136-16141. doi:http://dx.doi.org/10.1073/pnas.1415191111
Hoglund, C. O., Axen, J., Kemi, C., Jernelov, S., Grunewald, J., Muller-Suur, C., . . .
Lekander, M. (2006). Changes in immune regulation in response to examination
stress in atopic and healthy individuals. Clinical & Experimental Allergy, 36(8),
982-992. doi:10.1111/j.1365-2222.2006.02529.x

431
Holmes, M. V., Asselbergs, F. W., Palmer, T. M., Drenos, F., Lanktree, M. B., Nelson, C.
P., . . . Casas, J. P. (2015). Mendelian randomization of blood lipids for coronary
heart disease. European Heart Journal, 36(9), 539-550.
doi:10.1093/eurheartj/eht571
Holsboer-Trachsler, E., Stohler, R., & Hatzinger, M. (1991). Repeated administration of
the combined dexamethasone-human corticotropin releasing hormone
stimulation test during treatment of depression. Psychiatry Res, 38(2), 163-171.
Holsboer, F. (2000). The corticosteroid receptor hypothesis of depression.
Neuropsychopharmacology, 23(5), 477-501. doi:10.1016/s0893-133x(00)00159-
7
Holsboer, F., Liebl, R., & Hofschuster, E. (1982). Repeated dexamethasone suppression
test during depressive illness. Normalisation of test result compared with clinical
improvement. Journal of Affective Disorders, 4(2), 93-101.
Holsboer, F., von Bardeleben, U., Wiedemann, K., Muller, O. A., & Stalla, G. K. (1987).
Serial assessment of corticotropin-releasing hormone response after
dexamethasone in depression. Implications for pathophysiology of DST
nonsuppression. Biological Psychiatry, 22(2), 228-234.
Hong, M., Zheng, J., Ding, Z. Y., Chen, J. H., Yu, L., Niu, Y., . . . Wang, L. L. (2013).
Imbalance between Th17 and Treg cells may play an important role in the
development of chronic unpredictable mild stress-induced depression in mice.
Neuroimmunomodulation, 20(1), 39-50. doi:http://dx.doi.org/10.1159/000343100
Horowitz, M. A., Zunszain, P. A., Anacker, C., Musaelyan, K., & Pariante, C. M. (2013).
Glucocorticoids and inflammation: a double-headed sword in depression? How
do neuroendocrine and inflammatory pathways interact during stress to
contribute to the pathogenesis of depression? Mod Trends Pharmacopsychiatry,
28, 127-143. doi:10.1159/000343980
Horst, S., Chao, A., Rosen, M., Nohl, A., Duley, C., Wagnon, J. H., . . . Schwartz, D. A.
(2014). Treatment with Immunosuppressive Therapy May Improve Depressive

432
Symptoms in Patients with Inflammatory Bowel Disease. Digestive Diseases and
Sciences, 60(2), 465-470.
Horsten, M., Mittleman, M. A., Wamala, S. P., Schenck-Gustafsson, K., & Orth-Gomer,
K. (2000). Depressive symptoms and lack of social integration in relation to
prognosis of CHD in middle-aged women. The Stockholm Female Coronary Risk
Study. European Heart Journal, 21(13), 1072-1080. doi:10.1053/euhj.1999.2012
Howard, D. M., Adams, M. J., Shirali, M., Clarke, T. K., Marioni, R. E., Davies, G., . . .
McIntosh, A. M. (2018). Genome-wide association study of depression
phenotypes in UK Biobank identifies variants in excitatory synaptic pathways. Nat
Commun, 9(1), 1470. doi:10.1038/s41467-018-03819-3
Howren, M. B., Lamkin, D. M., & Suls, J. (2009). Associations of depression with C-
reactive protein, IL-1, and IL-6: a meta-analysis. Psychosomatic Medicine, 71(2),
171-186. doi:10.1097/PSY.0b013e3181907c1b
Hsiao, F. H., Yang, T. T., Ho, R. T., Jow, G. M., Ng, S. M., Chan, C. L., . . . Wang, K. C.
(2010). The self-perceived symptom distress and health-related conditions
associated with morning to evening diurnal cortisol patterns in outpatients with
major depressive disorder. Psychoneuroendocrinology, 35(4), 503-515.
doi:10.1016/j.psyneuen.2009.08.019
Hu, F., Pace, T. W., & Miller, A. H. (2009). Interferon-alpha inhibits glucocorticoid
receptor-mediated gene transcription via STAT5 activation in mouse HT22 cells.
Brain, Behavior, & Immunity, 23(4), 455-463. doi:10.1016/j.bbi.2009.01.001
Huang, M., Su, S., Goldberg, J., Miller, A. H., Levantsevych, O. M., Shallenberger, L., .
. . Vaccarino, V. (2019). Longitudinal association of inflammation with depressive
symptoms: A 7-year cross-lagged twin difference study. Brain, Behavior, &
Immunity, 75, 200-207. doi:10.1016/j.bbi.2018.10.007
Huber, T. J., Issa, K., Schik, G., & Wolf, O. T. (2006). The cortisol awakening response
is blunted in psychotherapy inpatients suffering from depression.
Psychoneuroendocrinology, 31(7), 900-904.
doi:10.1016/j.psyneuen.2006.03.005

433
Hughes, M. F., Patterson, C. C., Appleton, K. M., Blankenberg, S., Woodside, J. V.,
Donnelly, M., . . . Kee, F. (2016). The Predictive Value of Depressive Symptoms
for All-Cause Mortality: Findings From the PRIME Belfast Study Examining the
Role of Inflammation and Cardiovascular Risk Markers. Psychosomatic
Medicine, 78(4), 401-411. doi:10.1097/psy.0000000000000289
Humphreys, D., Schlesinger, L., Lopez, M., & Araya, A. V. (2006). Interleukin-6
production and deregulation of the hypothalamic-pituitary-adrenal axis in patients
with major depressive disorders. Endocrine, 30(3), 371-376.
Husain, M. I., Chaudhry, I. B., Rahman, R. R., Hamirani, M. M., Qurashi, I., Khoso, A.
B., . . . Young, A. H. (2015). Minocycline as an adjunct for treatment-resistant
depressive symptoms: study protocol for a pilot randomised controlled trial. Trials
[Electronic Resource], 16, 410. doi:http://dx.doi.org/10.1186/s13063-015-0933-5
Husain, M. I., Strawbridge, R., Stokes, P. R., & Young, A. H. (2017). Anti-inflammatory
treatments for mood disorders: Systematic review and meta-analysis. J
Psychopharmacol, 31(9), 1137-1148. doi:10.1177/0269881117725711
Hybels, C. F., Pieper, C. F., & Blazer, D. G. (2002). Sex differences in the relationship
between subthreshold depression and mortality in a community sample of older
adults. The American Journal of Geriatric Psychiatry, 10(3), 283-291.
Iba, T., & Levy, J. H. (2018). Inflammation and thrombosis: roles of neutrophils, platelets
and endothelial cells and their interactions in thrombus formation during sepsis.
Journal of Thrombosis & Haemostasis, 16(2), 231-241. doi:10.1111/jth.13911
Ickovics, J. R., Hamburger, M. E., Vlahov, D., Schoenbaum, E. E., Schuman, P., Boland,
R. J., & Moore, J. (2001). Mortality, CD4 cell count decline, and depressive
symptoms among HIV-seropositive women: longitudinal analysis from the HIV
Epidemiology Research Study. Jama, 285(11), 1466-1474.
Ida, T., Hara, M., Nakamura, Y., Kozaki, S., Tsunoda, S., & Ihara, H. (2008). Cytokine-
induced enhancement of calcium-dependent glutamate release from astrocytes
mediated by nitric oxide. Neuroscience Letters, 432(3), 232-236.
doi:10.1016/j.neulet.2007.12.047

434
Infurna, M. R., Reichl, C., Parzer, P., Schimmenti, A., Bifulco, A., & Kaess, M. (2016).
Associations between depression and specific childhood experiences of abuse
and neglect: A meta-analysis. Journal of Affective Disorders, 190, 47-55.
doi:10.1016/j.jad.2015.09.006
Iob, E., Kirschbaum, C., & Steptoe, A. (2019). Persistent depressive symptoms, HPA-
axis hyperactivity, and inflammation: the role of cognitive-affective and somatic
symptoms. Mol Psychiatry. doi:10.1038/s41380-019-0501-6
Irwin, M. R., & Miller, A. H. (2007). Depressive disorders and immunity: 20 years of
progress and discovery. Brain, Behavior, & Immunity, 21(4), 374-383.
doi:10.1016/j.bbi.2007.01.010
Ising, M., Horstmann, S., Kloiber, S., Lucae, S., Binder, E. B., Kern, N., . . . Holsboer, F.
(2007). Combined dexamethasone/corticotropin releasing hormone test predicts
treatment response in major depression–a potential biomarker? Biological
Psychiatry, 62(1), 47-54.
Ising, M., Lauer, C. J., Holsboer, F., & Modell, S. (2005). The Munich vulnerability study
on affective disorders: premorbid neuroendocrine profile of affected high-risk
probands. J Psychiatr Res, 39(1), 21-28. doi:10.1016/j.jpsychires.2004.04.009
Issazadeh-Navikas, S., Teimer, R., & Bockermann, R. (2012). Influence of dietary
components on regulatory T cells. Molecular Medicine, 18, 95-110.
doi:10.2119/molmed.2011.00311
Ivanova, S. A., Semke, V. Y., Vetlugina, T. P., Rakitina, N. M., Kudyakova, T. A., &
Simutkin, G. G. (2007). Signs of apoptosis of immunocompetent cells in patients
with depression. Neuroscience and Behavioral Physiology, 37(5), 527-530.
doi:10.1007/s11055-007-0047-y
Iyengar, R. L., Gandhi, S., Aneja, A., Thorpe, K., Razzouk, L., Greenberg, J., . . .
Farkouh, M. E. (2013). NSAIDs are associated with lower depression scores in
patients with osteoarthritis. American Journal of Medicine, 126(11), 1017.e1011-
1018. doi:http://dx.doi.org/10.1016/j.amjmed.2013.02.037

435
Jacobs, N., Kenis, G., Peeters, F., Derom, C., Vlietinck, R., & van Os, J. (2006). Stress-
related negative affectivity and genetically altered serotonin transporter function:
evidence of synergism in shaping risk of depression. Arch Gen Psychiatry, 63(9),
989-996. doi:10.1001/archpsyc.63.9.989
Janszky, I., Lekander, M., Blom, M., Georgiades, A., & Ahnve, S. (2005). Self-rated
health and vital exhaustion, but not depression, is related to inflammation in
women with coronary heart disease. Brain, Behavior, & Immunity, 19(6), 555-
563. doi:10.1016/j.bbi.2005.01.001
Jarcho, M. R., Slavich, G. M., Tylova-Stein, H., Wolkowitz, O. M., & Burke, H. M. (2013).
Dysregulated diurnal cortisol pattern is associated with glucocorticoid resistance
in women with major depressive disorder. Biological Psychology, 93(1), 150-158.
doi:10.1016/j.biopsycho.2013.01.018
Jazayeri, S., Keshavarz, S. A., Tehrani-Doost, M., Djalali, M., Hosseini, M., Amini, H., . .
. Djazayery, A. (2010). Effects of eicosapentaenoic acid and fluoxetine on plasma
cortisol, serum interleukin-1beta and interleukin-6 concentrations in patients with
major depressive disorder. Psychiatry Res, 178(1), 112-115. Retrieved from
http://onlinelibrary.wiley.com/o/cochrane/clcentral/articles/842/CN-
00764842/frame.html
http://ac.els-cdn.com/S0165178109001681/1-s2.0-S0165178109001681-
main.pdf?_tid=a0f5b342-7a70-11e6-b623-
00000aab0f6b&acdnat=1473853663_5ecc748c554a8ba06ea79b5aa729bde5
doi:10.1016/j.psychres.2009.04.013
Jeong, H. G., Lee, J. J., Lee, S. B., Park, J. H., Huh, Y., Han, J. W., . . . Kim, K. W.
(2013). Role of severity and gender in the association between late-life
depression and all-cause mortality. International Psychogeriatrics, 25(4), 677-
684. doi:http://dx.doi.org/10.1017/S1041610212002190

436
Jergović, M., Bendelja, K., Vidović, A., Savić, A., Vojvoda, V., Aberle, N., . . . Sabioncello,
A. (2014). Patients with posttraumatic stress disorder exhibit an altered
phenotype of regulatory T cells. Allergy, Asthma & Clinical Immunology, 10(1), 1.
Jha, M. K., Minhajuddin, A., Gadad, B. S., Greer, T., Grannemann, B., Soyombo, A., . .
. Trivedi, M. H. (2017). Can C-reactive protein inform antidepressant medication
selection in depressed outpatients? Findings from the CO-MED trial.
Psychoneuroendocrinology, 78, 105-113. doi:10.1016/j.psyneuen.2017.01.023
Jiang, W., Alexander, J., Christopher, E., Kuchibhatla, M., Gaulden, L. H., Cuffe, M. S.,
. . . O'Connor, C. M. (2001). Relationship of depression to increased risk of
mortality and rehospitalization in patients with congestive heart failure. Arch
Intern Med, 161(15), 1849-1856.
Joëls, M., & Baram, T. Z. J. N. r. n. (2009). The neuro-symphony of stress. 10(6), 459.
Johnson, T. V., Abbasi, A., & Master, V. A. (2013). Systematic review of the evidence of
a relationship between chronic psychosocial stress and C-reactive protein.
Molecular Diagnosis & Therapy, 17(3), 147-164. doi:10.1007/s40291-013-0026-
7
Jokela, M., Virtanen, M., Batty, G. D., & Kivimaki, M. (2016). Inflammation and Specific
Symptoms of Depression. JAMA Psychiatry, 73(1), 87-88.
doi:10.1001/jamapsychiatry.2015.1977
Jokinen, J., & Nordstrom, P. (2009). HPA axis hyperactivity and cardiovascular mortality
in mood disorder inpatients. Journal of Affective Disorders, 116(1-2), 88-92.
doi:10.1016/j.jad.2008.10.025
Joynt, K. E., Whellan, D. J., & O'Connor, C. M. (2003). Depression and cardiovascular
disease: Mechanisms of interaction. Biological Psychiatry, 54(3), 248-261.
Juruena, M. F., Bocharova, M., Agustini, B., & Young, A. H. (2018). Atypical depression
and non-atypical depression: Is HPA axis function a biomarker? A systematic
review. Journal of Affective Disorders, 233, 45-67. doi:10.1016/j.jad.2017.09.052
Juruena, M. F., Cleare, A. J., Papadopoulos, A. S., Poon, L., Lightman, S., & Pariante,
C. M. (2006). Different responses to dexamethasone and prednisolone in the

437
same depressed patients. Psychopharmacology (Berl), 189(2), 225-235.
doi:10.1007/s00213-006-0555-4
Juruena, M. F., Cleare, A. J., Papadopoulos, A. S., Poon, L., Lightman, S., & Pariante,
C. M. (2010). The prednisolone suppression test in depression: dose-response
and changes with antidepressant treatment. Psychoneuroendocrinology, 35(10),
1486-1491. doi:10.1016/j.psyneuen.2010.04.016
Juruena, M. F., Cleare, A. J., & Pariante, C. M. (2004). [The hypothalamic pituitary
adrenal axis, glucocorticoid receptor function and relevance to depression]. Rev
Bras Psiquiatr, 26(3), 189-201. doi:/S1516-44462004000300009
Juruena, M. F., Pariante, C. M., Papadopoulos, A. S., Poon, L., Lightman, S., & Cleare,
A. J. (2009). Prednisolone suppression test in depression: prospective study of
the role of HPA axis dysfunction in treatment resistance. British Journal of
Psychiatry, 194(4), 342-349. doi:10.1192/bjp.bp.108.050278
Juruena, M. F., Pariante, C. M., Papadopoulos, A. S., Poon, L., Lightman, S., & Cleare,
A. J. (2013). The role of mineralocorticoid receptor function in treatment-resistant
depression. Journal of Psychopharmacology, 27(12), 1169-1179.
doi:10.1177/0269881113499205
Kahl, K. G., Herrmann, J., Stubbs, B., Kruger, T. H., Cordes, J., Deuschle, M., . . .
Hartung, D. (2017). Pericardial adipose tissue and the metabolic syndrome is
increased in patients with chronic major depressive disorder compared to acute
depression and controls. Progress in Neuro-Psychopharmacology & Biological
Psychiatry, 72, 30-35. doi:10.1016/j.pnpbp.2016.08.005
Kahl, K. G., Schweiger, U., Pars, K., Kunikowska, A., Deuschle, M., Gutberlet, M., . . .
Hartung, D. (2015). Adrenal gland volume, intra-abdominal and pericardial
adipose tissue in major depressive disorder. Psychoneuroendocrinology, 58, 1-
8.
Kappelmann, N., Lewis, G., Dantzer, R., Jones, P. B., & Khandaker, G. M. (2018).
Antidepressant activity of anti-cytokine treatment: a systematic review and meta-

438
analysis of clinical trials of chronic inflammatory conditions. Mol Psychiatry, 23(2),
335-343. doi:10.1038/mp.2016.167
Kaptoge, S., Di Angelantonio, E., Lowe, G., Pepys, M. B., Thompson, S. G., Collins, R.,
& Danesh, J. (2010). C-reactive protein concentration and risk of coronary heart
disease, stroke, and mortality: an individual participant meta-analysis. Lancet,
375(9709), 132-140. doi:10.1016/s0140-6736(09)61717-7
Kaptoge, S., Di Angelantonio, E., Pennells, L., Wood, A. M., White, I. R., Gao, P., . . .
Danesh, J. (2012). C-reactive protein, fibrinogen, and cardiovascular disease
prediction. The New England journal of medicine, 367(14), 1310-1320.
doi:10.1056/NEJMoa1107477
Karege, F., Vaudan, G., Schwald, M., Perroud, N., & La Harpe, R. (2005). Neurotrophin
levels in postmortem brains of suicide victims and the effects of antemortem
diagnosis and psychotropic drugs. Brain Res Mol Brain Res, 136(1-2), 29-37.
doi:10.1016/j.molbrainres.2004.12.020
Karlović, D., Serretti, A., Vrkić, N., Martinac, M., & Marčinko, D. (2012). Serum
concentrations of CRP, IL-6, TNF-α and cortisol in major depressive disorder with
melancholic or atypical features. Psychiatry Res, 198(1), 74-80.
Kauffman, R. P., Castracane, V. D., White, D. L., Baldock, S. D., & Owens, R. (2005).
Impact of the selective serotonin reuptake inhibitor citalopram on insulin
sensitivity, leptin and basal cortisol secretion in depressed and non-depressed
euglycemic women of reproductive age. Gynecological Endocrinology, 21(3),
129-137.
Kaufman, J., Birmaher, B., Perel, J., Dahl, R. E., Moreci, P., Nelson, B., . . . Ryan, N. D.
(1997). The corticotropin-releasing hormone challenge in depressed abused,
depressed nonabused, and normal control children. Biological Psychiatry, 42(8),
669-679.
Kawachi, I., & Berkman, L. F. (2001). Social ties and mental health. Journal of Urban
Health, 78(3), 458-467. doi:10.1093/jurban/78.3.458

439
Keedwell, P. A., Andrew, C., Williams, S. C., Brammer, M. J., & Phillips, M. L. (2005). A
double dissociation of ventromedial prefrontal cortical responses to sad and
happy stimuli in depressed and healthy individuals. Biological Psychiatry, 58(6),
495-503. doi:10.1016/j.biopsych.2005.04.035
Kelly, D. L., Li, X., Kilday, C., Feldman, S., Clark, S., Liu, F., . . . Tonelli, L. H. (2018).
Increased circulating regulatory T cells in medicated people with schizophrenia.
Psychiatry Res, 269, 517-523. doi:10.1016/j.psychres.2018.09.006
Kelly, W. F., Kelly, M. J., & Faragher, B. (1996). A prospective study of psychiatric and
psychological aspects of Cushing's syndrome. Clinical Endocrinology, 45(6),
715-720.
Kemp, A. H., Brunoni, A. R., Nunes, M. A., Mill, J. G., Ribeiro, A. L., Pereira, A. C., . . .
Lotufo, P. A. (2013). Adverse cardiovascular effects of the mood and anxiety
disorders and their treatments on heart rate variability. The brazilian longitudinal
study of adult health (Elsa-Brasil): A cross-sectional analysis of baseline
characteristics. Circulation. Conference: American Heart Association, 128(22
SUPPL. 1).
Kemp, A. H., Quintana, D. S., Gray, M. A., Felmingham, K. L., Brown, K., & Gatt, J. M.
(2010). Impact of depression and antidepressant treatment on heart rate
variability: a review and meta-analysis. Biological Psychiatry, 67(11), 1067-1074.
doi:10.1016/j.biopsych.2009.12.012
Kempton, M. J., Salvador, Z., Munafo, M. R., Geddes, J. R., Simmons, A., Frangou, S.,
& Williams, S. C. (2011). Structural neuroimaging studies in major depressive
disorder. Meta-analysis and comparison with bipolar disorder. Arch Gen
Psychiatry, 68(7), 675-690. doi:10.1001/archgenpsychiatry.2011.60
Kendler, K. S., & Gardner, C. O. (2016). Depressive vulnerability, stressful life events
and episode onset of major depression: a longitudinal model. Psychological
Medicine, 46(9), 1865-1874. doi:10.1017/S0033291716000349
Kendler, K. S., Gardner, C. O., Fiske, A., & Gatz, M. (2009). Major depression and
coronary artery disease in the Swedish twin registry: phenotypic, genetic, and

440
environmental sources of comorbidity. Arch Gen Psychiatry, 66(8), 857-863.
doi:10.1001/archgenpsychiatry.2009.94
Kendler, K. S., Karkowski, L. M., & Prescott, C. A. (1999). Causal Relationship Between
Stressful Life Events and the Onset of Major Depression. American Journal of
Psychiatry, 156(6), 837-841. doi:10.1176/ajp.156.6.837
Kendler, K. S., Kuhn, J. W., & Prescott, C. A. (2004). Childhood sexual abuse, stressful
life events and risk for major depression in women. Psychological Medicine,
34(8), 1475-1482.
Kendler, K. S., Kuhn, J. W., Vittum, J., Prescott, C. A., & Riley, B. (2005). The interaction
of stressful life events and a serotonin transporter polymorphism in the prediction
of episodes of major depression: a replication. Arch Gen Psychiatry, 62(5), 529-
535. doi:10.1001/archpsyc.62.5.529
Kennedy, S. H., & Brown, G. M. (1992). Effect of chronic antidepressant treatment with
adinazolam and desipramine on melatonin output. Psychiatry Res, 43(2), 177-
185.
Kessler, R. C. (1997). The effects of stressful life events on depression. Annu Rev
Psychol, 48, 191-214. doi:10.1146/annurev.psych.48.1.191
Kessler, R. C., Berglund, P., Demler, O., Jin, R., Koretz, D., Merikangas, K. R., . . . Wang,
P. S. (2003). The epidemiology of major depressive disorder: results from the
National Comorbidity Survey Replication (NCS-R). Jama, 289(23), 3095-3105.
doi:10.1001/jama.289.23.3095
Kessler, R. C., & Bromet, E. J. (2013). The epidemiology of depression across cultures.
Annual Review of Public Health, 34, 119-138. doi:10.1146/annurev-publhealth-
031912-114409
Khandaker, G. M., Pearson, R. M., Zammit, S., Lewis, G., & Jones, P. B. (2014).
Association of serum interleukin 6 and c-reactive protein in childhood with
depression and psychosis in young adult life: A population-based longitudinal
study. JAMA Psychiatry, 71(10), 1121-1128.
doi:10.1001/jamapsychiatry.2014.1332

441
Kiecolt-Glaser, J. K., McGuire, L., Robles, T. F., & Glaser, R. (2002).
Psychoneuroimmunology: psychological influences on immune function and
health. J Consult Clin Psychol, 70(3), 537-547.
Kiecolt-Glaser, J. K., Preacher, K. J., MacCallum, R. C., Atkinson, C., Malarkey, W. B.,
& Glaser, R. (2003). Chronic stress and age-related increases in the
proinflammatory cytokine IL-6. Proc Natl Acad Sci U S A, 100(15), 9090-9095.
doi:10.1073/pnas.1531903100
Kim, S.-J., Lee, H., Lee, G., Oh, S.-J., Shin, M.-K., Shim, I., & Bae, H. (2012).
CD4(+)CD25(+) Regulatory T Cell Depletion Modulates Anxiety and Depression-
Like Behaviors in Mice. PLoS One, 7(7), e42054.
doi:10.1371/journal.pone.0042054
Kim, S. W., Kang, H. J., Bae, K. Y., Shin, I. S., Hong, Y. J., Ahn, Y. K., . . . Kim, J. M.
(2018). Interactions between pro-inflammatory cytokines and statins on
depression in patients with acute coronary syndrome. Progress in Neuro-
Psychopharmacology & Biological Psychiatry, 80(Pt C), 250-254.
doi:10.1016/j.pnpbp.2017.07.003
Kirsch, I., Deacon, B. J., Huedo-Medina, T. B., Scoboria, A., Moore, T. J., & Johnson, B.
T. (2008). Initial severity and antidepressant benefits: a meta-analysis of data
submitted to the Food and Drug Administration. PLoS Medicine / Public Library
of Science, 5(2), e45. doi:10.1371/journal.pmed.0050045
Kirschbaum, C., & Hellhammer, D. H. (1989). Salivary Cortisol in Psychobiological
Research: An Overview. Neuropsychobiology, 22(3), 150-169.
Kirschbaum, C., & Hellhammer, D. H. (2000). Salivary cortisol. Encyclopedia of stress,
3(379-383).
Kivimaki, M., Shipley, M. J., Batty, G. D., Hamer, M., Akbaraly, T. N., Kumari, M., . . .
Singh-Manoux, A. (2014). Long-term inflammation increases risk of common
mental disorder: a cohort study. Mol Psychiatry, 19(2), 149-150.
doi:10.1038/mp.2013.35

442
Klatzmann, D., & Abbas, A. K. (2015). The promise of low-dose interleukin-2 therapy for
autoimmune and inflammatory diseases. Nature Reviews: Immunology, 15(5),
283-294. doi:10.1038/nri3823
Klegeris, A., Schulzer, M., Harper, D. G., & McGeer, P. L. (2007). Increase in core body
temperature of Alzheimer's disease patients as a possible indicator of chronic
neuroinflammation: a meta-analysis. Gerontology, 53(1), 7-11.
doi:10.1159/000095386
Klengel, T., Mehta, D., Anacker, C., Rex-Haffner, M., Pruessner, J. C., Pariante, C. M., .
. . Binder, E. B. (2013). Allele-specific FKBP5 DNA demethylation mediates gene-
childhood trauma interactions. Nature Neuroscience, 16(1), 33-41.
doi:10.1038/nn.3275
Klimes-Dougan, B., Westlund Schreiner, M., Thai, M., Gunlicks-Stoessel, M., Reigstad,
K., & Cullen, K. R. (2018). Neural and neuroendocrine predictors of
pharmacological treatment response in adolescents with depression: A
preliminary study. Progress in Neuro-Psychopharmacology & Biological
Psychiatry, 81, 194-202. doi:10.1016/j.pnpbp.2017.10.015
Klok, M. D., Alt, S. R., Irurzun Lafitte, A. J., Turner, J. D., Lakke, E. A., Huitinga, I., . . .
Derijk, R. H. (2011a). Decreased expression of mineralocorticoid receptor mRNA
and its splice variants in postmortem brain regions of patients with major
depressive disorder. J Psychiatr Res, 45(7), 871-878.
doi:10.1016/j.jpsychires.2010.12.002
Klok, M. D., Giltay, E. J., Van der Does, A. J., Geleijnse, J. M., Antypa, N., Penninx, B.
W., . . . DeRijk, R. H. (2011b). A common and functional mineralocorticoid
receptor haplotype enhances optimism and protects against depression in
females. Translational Psychiatry, 1, e62. doi:10.1038/tp.2011.59
Knorr, U., Vinberg, M., Gether, U., Winkel, P., Gluud, C., Wetterslev, J., & Kessing, L. V.
(2012). The effect of escitalopram versus placebo on perceived stress and
salivary cortisol in healthy first-degree relatives of patients with depression-A

443
randomised trial. Psychiatry Res, 200(2-3), 354-360.
doi:10.1016/j.psychres.2012.05.015
Knorr, U., Vinberg, M., Kessing, L. V., & Wetterslev, J. (2010). Salivary cortisol in
depressed patients versus control persons: a systematic review and meta-
analysis. Psychoneuroendocrinology, 35(9), 1275-1286.
Koehler, O., Benros, M., Nordentoft, M., Mors, O., & Krogh, J. (2014). Effect of anti-
inflammatory treatment on depression and side effects: A systematic review and
meta-analysis of randomized clinical trials. Pharmacoepidemiology and Drug
Safety, 23, 252-253.
Kohler, C. A., Freitas, T. H., Maes, M., de Andrade, N. Q., Liu, C. S., Fernandes, B. S.,
. . . Carvalho, A. F. (2017). Peripheral cytokine and chemokine alterations in
depression: a meta-analysis of 82 studies. Acta Psychiatr Scand, 135(5), 373-
387. doi:10.1111/acps.12698
Kohler, C. A., Freitas, T. H., Stubbs, B., Maes, M., Solmi, M., Veronese, N., . . . Carvalho,
A. F. (2018). Peripheral Alterations in Cytokine and Chemokine Levels After
Antidepressant Drug Treatment for Major Depressive Disorder: Systematic
Review and Meta-Analysis. Molecular Neurobiology, 55(5), 4195-4206.
doi:10.1007/s12035-017-0632-1
Konakchieva, R., Mitev, Y., Almeida, O. F., & Patchev, V. K. (1997). Chronic melatonin
treatment and the hypothalamo-pituitary-adrenal axis in the rat: attenuation of the
secretory response to stress and effects on hypothalamic neuropeptide content
and release. Biology of the Cell, 89(9), 587-596.
Konakchieva, R., Mitev, Y., Almeida, O. F., & Patchev, V. K. (1998). Chronic melatonin
treatment counteracts glucocorticoid-induced dysregulation of the hypothalamic-
pituitary-adrenal axis in the rat. Neuroendocrinology, 67(3), 171-180.
doi:10.1159/000054312
Kop, W. J., & Gottdiener, J. S. (2005). The role of immune system parameters in the
relationship between depression and coronary artery disease. Psychosomatic
Medicine, 67 Suppl 1, S37-41. doi:10.1097/01.psy.0000162256.18710.4a
444
Kop, W. J., Gottdiener, J. S., Tangen, C. M., Fried, L. P., McBurnie, M. A., Walston, J., .
. . Tracy, R. P. (2002). Inflammation and coagulation factors in persons > 65 years
of age with symptoms of depression but without evidence of myocardial ischemia.
American Journal of Cardiology, 89(4), 419-424.
Kop, W. J., Stein, P. K., Tracy, R. P., Barzilay, J. I., Schulz, R., & Gottdiener, J. S. (2010).
Autonomic nervous system dysfunction and inflammation contribute to the
increased cardiovascular mortality risk associated with depression.
Psychosomatic Medicine, 72(7), 626-635. doi:10.1097/PSY.0b013e3181eadd2b
Kop, W. J., Synowski, S. J., & Gottlieb, S. S. (2011). Depression in heart failure:
biobehavioral mechanisms. Heart Failure Clinics, 7(1), 23-38.
doi:http://dx.doi.org/10.1016/j.hfc.2010.08.011
Korgaonkar, M. S., Williams, L. M., Song, Y. J., Usherwood, T., & Grieve, S. M. (2014).
Diffusion tensor imaging predictors of treatment outcomes in major depressive
disorder. British Journal of Psychiatry, 205(4), 321-328.
doi:10.1192/bjp.bp.113.140376
Kossintseva, I., Wong, S., Johnstone, E., Guilbert, L., Olson, D. M., & Mitchell, B. F.
(2006). Proinflammatory cytokines inhibit human placental 11beta-
hydroxysteroid dehydrogenase type 2 activity through Ca2+ and cAMP
pathways. Am J Physiol Endocrinol Metab, 290(2), E282-288.
doi:10.1152/ajpendo.00328.2005
Kramer, A. C., Neubauer, A. B., Stoffel, M., Voss, A., & Ditzen, B. (2019). Tomorrow's
gonna suck: Today's stress anticipation predicts tomorrow's post-awakening
cortisol increase. Psychoneuroendocrinology, 106, 38-46.
doi:10.1016/j.psyneuen.2019.03.024
Krause, D., Jobst, A., Kirchberg, F., Kieper, S., Hartl, K., Kastner, R., . . . Schwarz, M. J.
(2014). Prenatal immunologic predictors of postpartum depressive symptoms: a
prospective study for potential diagnostic markers. Eur Arch Psychiatry Clin
Neurosci, 264(7), 615-624. doi:10.1007/s00406-014-0494-8
445
Krishnamurthy, P., Romagni, P., Torvik, S., Gold, P. W., Charney, D. S., Detera-
Wadleigh, S., & Cizza, G. (2008). Glucocorticoid receptor gene polymorphisms
in premenopausal women with major depression. Hormone & Metabolic
Research, 40(3), 194-198. doi:10.1055/s-2007-1004541
Krishnan, V., & Nestler, E. J. (2008). The molecular neurobiology of depression. Nature,
455(7215), 894-902. doi:10.1038/nature07455
Krishnan, V., & Nestler, E. J. (2011). Animal models of depression: Molecular
perspectives. In Molecular and Functional Models in NeuropsychiatrY (pp. 121-
147). Tiergartenstrasse 17, Heidelberg D-69121, Germany: Springer Verlag.
Kronfol, Z., House, J. D., Silva, J., Jr., Greden, J., & Carroll, B. J. (1986). Depression,
urinary free cortisol excretion and lymphocyte function. British Journal of
Psychiatry, 148, 70-73.
Kronfol, Z., Silva, J., Jr., Greden, J., Dembinski, S., Gardner, R., & Carroll, B. (1983).
Impaired lymphocyte function in depressive illness. Life Sciences, 33(3), 241-
247.
Krügel, U., Fischer, J., Radicke, S., Sack, U., & Himmerich, H. (2013). Antidepressant
effects of TNF-α blockade in an animal model of depression. J Psychiatr Res,
47(5), 611-616. doi:10.1016/j.jpsychires.2013.01.007
Kudielka, B. M., Broderick, J. E., & Kirschbaum, C. (2003). Compliance with saliva
sampling protocols: electronic monitoring reveals invalid cortisol daytime profiles
in noncompliant subjects. Psychosomatic Medicine, 65(2), 313-319.
Kuehner, C., Holzhauer, S., & Huffziger, S. (2007). Decreased cortisol response to
awakening is associated with cognitive vulnerability to depression in a nonclinical
sample of young adults. Psychoneuroendocrinology, 32(2), 199-209.
doi:10.1016/j.psyneuen.2006.12.007
Kuijpers, P. M. J. C., Hamulyak, K., Strik, J. J. M. H., Wellens, H. J. J., & Honig, A. (2002).
Beta-thromboglobulin and platelet factor 4 levels in post-myocardial infarction
patients with major depression. Psychiatry Res, 109(2), 207-210.
doi:http://dx.doi.org/10.1016/S0165-1781(02)00017-3

446
Kumar, M., Putzki, N., Limmroth, V., Remus, R., Lindemann, M., Knop, D., . . . Grosse-
Wilde, H. (2006). CD4+CD25+FoxP3+ T lymphocytes fail to suppress myelin
basic protein-induced proliferation in patients with multiple sclerosis. J
Neuroimmunol, 180(1-2), 178-184. doi:10.1016/j.jneuroim.2006.08.003
Kumari, M., Head, J., Bartley, M., Stansfeld, S., & Kivimaki, M. (2013). Maternal
separation in childhood and diurnal cortisol patterns in mid-life: findings from the
Whitehall II study. Psychological Medicine, 43(3), 633-643.
doi:10.1017/s0033291712001353
Kumari, M., Shipley, M., Stafford, M., & Kivimaki, M. (2011). Association of diurnal
patterns in salivary cortisol with all-cause and cardiovascular mortality: findings
from the Whitehall II study. Journal of Clinical Endocrinology & Metabolism, 96(5),
1478-1485. doi:10.1210/jc.2010-2137
Kumsta, R., Entringer, S., Hellhammer, D. H., & Wust, S. (2007). Cortisol and ACTH
responses to psychosocial stress are modulated by corticosteroid binding
globulin levels. Psychoneuroendocrinology, 32(8-10), 1153-1157.
doi:10.1016/j.psyneuen.2007.08.007
Kuningas, M., de Rijk, R. H., Westendorp, R. G., Jolles, J., Slagboom, P. E., & van
Heemst, D. (2007). Mental performance in old age dependent on cortisol and
genetic variance in the mineralocorticoid and glucocorticoid receptors.
Neuropsychopharmacology, 32(6), 1295-1301. doi:10.1038/sj.npp.1301260
Kunugi, H., Ida, I., Owashi, T., Kimura, M., Inoue, Y., Nakagawa, S., . . . Mikuni, M.
(2006). Assessment of the dexamethasone/CRH test as a state-dependent
marker for hypothalamic-pituitary-adrenal (HPA) axis abnormalities in major
depressive episode: a Multicenter Study. Neuropsychopharmacology, 31(1),
212-220. doi:10.1038/sj.npp.1300868
Kunz-Ebrecht, S. R., Kirschbaum, C., Marmot, M., & Steptoe, A. (2004). Differences in
cortisol awakening response on work days and weekends in women and men
from the Whitehall II cohort. Psychoneuroendocrinology, 29(4), 516-528.

447
Kupfer, D. J., Frank, E., & Phillips, M. L. (2012). Major depressive disorder: New clinical,
neurobiological, and treatment perspectives. The Lancet, 379(9820), 1045-1055.
La Cava, A. (2008). Tregs are regulated by cytokines: implications for autoimmunity.
Autoimmunity Reviews, 8(1), 83-87. doi:10.1016/j.autrev.2008.08.002
Ladwig, K. H., Marten-Mittag, B., Lowel, H., Doring, A., & Koenig, W. (2005). C-reactive
protein, depressed mood, and the prediction of coronary heart disease in initially
healthy men: results from the MONICA-KORA Augsburg Cohort Study 1984-
1998. European Heart Journal, 26(23), 2537-2542. doi:10.1093/eurheartj/ehi456
Lamers, F., Milaneschi, Y., & Penninx, B. W. (2018). Depression Subtypes and
Inflammation: Atypical Rather Than Melancholic Depression Is Linked With
Immunometabolic Dysregulations. In Inflammation and Immunity in Depression
(pp. 455-471): Elsevier.
Lamers, F., Vogelzangs, N., Merikangas, K. R., de Jonge, P., Beekman, A. T., &
Penninx, B. W. (2013). Evidence for a differential role of HPA-axis function,
inflammation and metabolic syndrome in melancholic versus atypical depression.
Mol Psychiatry, 18(6), 692-699. doi:10.1038/mp.2012.144
Landmann, R., Schaub, B., Link, S., & Wacker, H. R. (1997). Unaltered monocyte
function in patients with major depression before and after three months of
antidepressive therapy. Biological Psychiatry, 41(6), 675-681.
Lane, D., Carroll, D., Ring, C., Beevers, D. G., & Lip, G. Y. (2002). The prevalence and
persistence of depression and anxiety following myocardial infarction. British
Journal of Health Psychology, 7(Pt 1), 11-21. doi:10.1348/135910702169321
Lanfumey, L., Mongeau, R., Cohen-Salmon, C., Hamon, M. J. N., & reviews, b. (2008).
Corticosteroid–serotonin interactions in the neurobiological mechanisms of
stress-related disorders. 32(6), 1174-1184.
Lassale, C., Batty, G. D., Baghdadli, A., Jacka, F., Sanchez-Villegas, A., Kivimaki, M., &
Akbaraly, T. (2018). Healthy dietary indices and risk of depressive outcomes: a
systematic review and meta-analysis of observational studies. Mol Psychiatry.
doi:10.1038/s41380-018-0237-8

448
Lasserre, A. M., Marti-Soler, H., Strippoli, M. P., Vaucher, J., Glaus, J., Vandeleur, C. L.,
. . . Preisig, M. (2016). Clinical and course characteristics of depression and all-
cause mortality: A prospective population-based study. Journal of Affective
Disorders, 189, 17-24. doi:10.1016/j.jad.2015.09.010
Latkin, C. A., Edwards, C., Davey-Rothwell, M. A., & Tobin, K. E. (2017). The relationship
between social desirability bias and self-reports of health, substance use, and
social network factors among urban substance users in Baltimore, Maryland.
Addictive Behaviors, 73, 133-136. doi:10.1016/j.addbeh.2017.05.005
Laursen, T. M., Munk-Olsen, T., Nordentoft, M., & Mortensen, P. B. (2007). Increased
mortality among patients admitted with major psychiatric disorders: a register-
based study comparing mortality in unipolar depressive disorder, bipolar affective
disorder, schizoaffective disorder, and schizophrenia. The Journal of Clinical
Psychiatry, 68(6), 899-907.
Lauzon, C., Beck, C. A., Huynh, T., Dion, D., Racine, N., Carignan, S., . . . Pilote, L.
(2003). Depression and prognosis following hospital admission because of acute
myocardial infarction. CMAJ Canadian Medical Association Journal, 168(5), 547-
552.
Law, R., Hucklebridge, F., Thorn, L., Evans, P., & Clow, A. J. S. (2013). State variation
in the cortisol awakening response. 16(5), 483-492.
Lawes, S., Demakakos, P., Steptoe, A., Lewis, G., & Carvalho, L. A. (2018). Combined
influence of depressive symptoms and systemic inflammation on all-cause and
cardiovascular mortality: evidence for differential effects by gender in the English
Longitudinal Study of Ageing. Psychological Medicine, 1-11.
doi:10.1017/s003329171800209x
Lawson, C., Brown, A., Bejarano, V., Douglas, S., Burgoyne, C., Greenstein, A., . . .
Isaacs, J. (2006). Early rheumatoid arthritis is associated with a deficit in the
CD4+ CD25 high regulatory T cell population in peripheral blood. Rheumatology,
45(10), 1210-1217.
Lazarus, R., & Folkman, S. (1984). Stress, appraisal and coping. In: New York: Springer.

449
Leake, A., Griffiths, H. W., Pascual, J. A., & Ferrier, I. N. (1989). Corticosteroid-binding
globulin in depression. Clin Endocrinol (Oxf), 30(1), 39-45.
Lee, H. Y., Kang, R. H., Han, S. W., Paik, J. W., Chang, H. S., Jeong, Y. J., & Lee, M. S.
(2009). Association of glucocorticoid receptor polymorphisms with the
susceptibility to major depressive disorder and treatment responses in Korean
depressive patients. Acta Neuropsychiatrica, 21(1), 11-17. doi:10.1111/j.1601-
5215.2008.00342.x
Lee, L. F., Lih, C. J., Huang, C. J., Cao, T., Cohen, S. N., & McDevitt, H. O. (2008).
Genomic expression profiling of TNF-alpha-treated BDC2.5 diabetogenic CD4+
T cells. Proc Natl Acad Sci U S A, 105(29), 10107-10112.
doi:10.1073/pnas.0803336105
Leistedt, S. J., & Linkowski, P. (2013). Brain, networks, depression, and more. Eur
Neuropsychopharmacol, 23(1), 55-62. doi:10.1016/j.euroneuro.2012.10.011
Leistner, C., & Menke, A. (2018). How to measure glucocorticoid receptor's sensitivity in
patients with stress-related psychiatric disorders. Psychoneuroendocrinology,
91, 235-260. doi:10.1016/j.psyneuen.2018.01.023
Lembke, A., Gomez, R., Tenakoon, L., Keller, J., Cohen, G., Williams, G. H., . . .
Schatzberg, A. F. (2013). The mineralocorticoid receptor agonist, fludrocortisone,
differentially inhibits pituitary-adrenal activity in humans with psychotic major
depression. Psychoneuroendocrinology, 38(1), 115-121.
doi:10.1016/j.psyneuen.2012.05.006
Lesch, K. P., Bengel, D., Heils, A., Sabol, S. Z., Greenberg, B. D., Petri, S., . . . Murphy,
D. L. (1996). Association of anxiety-related traits with a polymorphism in the
serotonin transporter gene regulatory region. Science, 274(5292), 1527-1531.
Leserman, J. (2008). Role of depression, stress, and trauma in HIV disease progression.
Psychosomatic Medicine, 70(5), 539-545. doi:10.1097/PSY.0b013e3181777a5f
Lesperance, F., Frasure-Smith, N., Talajic, M., & Bourassa, M. G. (2002). Five-year risk
of cardiac mortality in relation to initial severity and one-year changes in
depression symptoms after myocardial infarction. Circulation, 105(9), 1049-1053.

450
Lesperance, F., Frasure-Smith, N., Theroux, P., & Irwin, M. (2004). The association
between major depression and levels of soluble intercellular adhesion molecule
1, interleukin-6, and C-reactive protein in patients with recent acute coronary
syndromes. Am J Psychiatry, 161(2), 271-277. doi:10.1176/appi.ajp.161.2.271
Lett, H., Ali, S., & Whooley, M. (2008). Depression and cardiac function in patients with
stable coronary heart disease: findings from the Heart and Soul Study.
Psychosomatic Medicine, 70(4), 444-449. doi:10.1097/PSY.0b013e31816c3c5c
Lewis, G., Pelosi, A. J., Araya, R., & Dunn, G. (1992). Measuring psychiatric disorder in
the community: a standardized assessment for use by lay interviewers.
Psychological Medicine, 22(2), 465-486.
Li, J., Zhao, R., Li, X., Sun, W., Qu, M., Tang, Q., . . . Zhang, S. (2016a). Shen-Qi-Jie-
Yu-Fang exerts effects on a rat model of postpartum depression by regulating
inflammatory cytokines and CD4+CD25+ regulatory T cells. Neuropsychiatric
Disease and Treatment Vol 12 Apr 2016, ArtID 883-896, 12.
Li, M., D'Arcy, C., & Meng, X. (2016b). Maltreatment in childhood substantially increases
the risk of adult depression and anxiety in prospective cohort studies: systematic
review, meta-analysis, and proportional attributable fractions. Psychological
Medicine, 46(4), 717-730. doi:10.1017/s0033291715002743
Li, Y., Xiao, B., Qiu, W., Yang, L., Hu, B., Tian, X., & Yang, H. (2010). Altered expression
of CD4(+)CD25(+) regulatory T cells and its 5-HT(1a) receptor in patients with
major depression disorder. Journal of Affective Disorders, 124(1-2), 68-75.
doi:10.1016/j.jad.2009.10.018
Liao, Y., Huang, X., Wu, Q., Yang, C., Kuang, W., Du, M., . . . Gong, Q. (2013). Is
depression a disconnection syndrome? Meta-analysis of diffusion tensor imaging
studies in patients with MDD. Journal of Psychiatry & Neuroscience, 38(1), 49-
56. doi:10.1503/jpn.110180
Liao, Y., Xie, B., Zhang, H., He, Q., Guo, L., Subramaniapillai, M., . . . McLntyer, R. S.
(2019). Efficacy of omega-3 PUFAs in depression: A meta-analysis. Translational
Psychiatry, 9(1), 190. doi:10.1038/s41398-019-0515-5

451
Libby, P., Ridker, P. M., & Hansson, G. K. (2011). Progress and challenges in translating
the biology of atherosclerosis. Nature, 473(7347), 317-325.
doi:10.1038/nature10146
Licht, C. M., de Geus, E. J., & Penninx, B. W. (2013). Dysregulation of the autonomic
nervous system predicts the development of the metabolic syndrome. Journal of
Clinical Endocrinology & Metabolism, 98(6), 2484-2493. doi:10.1210/jc.2012-
3104
Licht, C. M., de Geus, E. J., Zitman, F. G., Hoogendijk, W. J., van Dyck, R., & Penninx,
B. W. (2008). Association between major depressive disorder and heart rate
variability in the Netherlands Study of Depression and Anxiety (NESDA). Arch
Gen Psychiatry, 65(12), 1358-1367. doi:10.1001/archpsyc.65.12.1358
Licht, C. M., Naarding, P., Penninx, B. W., van der Mast, R. C., de Geus, E. J., & Comijs,
H. (2015). The association between depressive disorder and cardiac autonomic
control in adults 60 years and older. Psychosomatic Medicine, 77(3), 279-291.
doi:10.1097/psy.0000000000000165
Lichtenstein, G. R., Bala, M., Han, C., DeWoody, K., & Schaible, T. (2002). Infliximab
improves quality of life in patients with Crohn's disease. Inflammatory Bowel
Diseases, 8(4), 237-243.
Lichtman, J. H., Froelicher, E. S., Blumenthal, J. A., Carney, R. M., Doering, L. V.,
Frasure-Smith, N., . . . Wulsin, L. (2014). Depression as a risk factor for poor
prognosis among patients with acute coronary syndrome: systematic review and
recommendations: a scientific statement from the American Heart Association.
Circulation, 129(12), 1350-1369. doi:10.1161/cir.0000000000000019
Lin, E. H., Heckbert, S. R., Rutter, C. M., Katon, W. J., Ciechanowski, P., Ludman, E. J.,
. . . Von Korff, M. (2009). Depression and increased mortality in diabetes:
unexpected causes of death. Ann Fam Med, 7(5), 414-421. doi:10.1370/afm.998
Lindley, S., Dayan, C. M., Bishop, A., Roep, B. O., Peakman, M., & Tree, T. I. (2005).
Defective suppressor function in CD4(+)CD25(+) T-cells from patients with type
1 diabetes. Diabetes, 54(1), 92-99. doi:10.2337/diabetes.54.1.92

452
Linkowski, P., Mendlewicz, J., Kerkhofs, M., Leclercq, R., Golstein, J., Brasseur, M., . . .
Van Cauter, E. (1987). 24-hour profiles of adrenocorticotropin, cortisol, and
growth hormone in major depressive illness: effect of antidepressant treatment.
Journal of Clinical Endocrinology & Metabolism, 65(1), 141-152.
doi:10.1210/jcem-65-1-141
Lippi, G., Montagnana, M., Favaloro, E. J., & Franchini, M. (2009). Mental depression
and cardiovascular disease: a multifaceted, bidirectional association. Semin
Thromb Hemost, 35(3), 325-336. doi:10.1055/s-0029-1222611
Lisi, L., Camardese, G., Treglia, M., Tringali, G., Carrozza, C., Janiri, L., . . . Navarra, P.
(2013). Monocytes from depressed patients display an altered pattern of
response to endotoxin challenge. PLoS ONE [Electronic Resource], 8(1),
e52585. doi:http://dx.doi.org/10.1371/journal.pone.0052585
Liu, R. T. (2017). Childhood Adversities and Depression in Adulthood: Current Findings
and Future Directions. Clin Psychol (New York), 24(2), 140-153.
doi:10.1111/cpsp.12190
Liu, Y., Ho, R. C., & Mak, A. (2012). Interleukin (IL)-6, tumour necrosis factor alpha (TNF-
alpha) and soluble interleukin-2 receptors (sIL-2R) are elevated in patients with
major depressive disorder: a meta-analysis and meta-regression. Journal of
Affective Disorders, 139(3), 230-239. doi:10.1016/j.jad.2011.08.003
Lombardo, G., Enache, D., Gianotti, L., Schatzberg, A. F., Young, A. H., Pariante, C. M.,
& Mondelli, V. (2019). Baseline cortisol and the efficacy of antiglucocorticoid
treatment in mood disorders: A meta-analysis. Psychoneuroendocrinology, 110,
104420. doi:10.1016/j.psyneuen.2019.104420
Lopes, R. P., Grassi-Oliveira, R., de Almeida, L. R., Stein, L. M., Luz, C., Teixeira, A. L.,
& Bauer, M. E. (2012). Neuroimmunoendocrine interactions in patients with
recurrent major depression, increased early life stress and long-standing
posttraumatic stress disorder symptoms. Neuroimmunomodulation, 19(1), 33-42.
doi:10.1159/000327352

453
Lopez, J. F., Chalmers, D. T., Little, K. Y., & Watson, S. J. (1998). A.E. Bennett Research
Award. Regulation of serotonin1A, glucocorticoid, and mineralocorticoid receptor
in rat and human hippocampus: implications for the neurobiology of depression.
Biological Psychiatry, 43(8), 547-573.
Lopresti, A. L. (2017). Cognitive behaviour therapy and inflammation: A systematic
review of its relationship and the potential implications for the treatment of
depression. Aust N Z J Psychiatry, 51(6), 565-582.
doi:10.1177/0004867417701996
Lowy, M. T. (1989). Quantification of type I and II adrenal steroid receptors in neuronal,
lymphoid and pituitary tissues. Brain Research, 503(2), 191-197.
Lowy, M. T., Reder, A. T., Antel, J. P., & Meltzer, H. Y. (1984). Glucocorticoid resistance
in depression: the dexamethasone suppression test and lymphocyte sensitivity
to dexamethasone. Am J Psychiatry, 141(11), 1365-1370.
doi:10.1176/ajp.141.11.1365
Lowy, M. T., Reder, A. T., Gormley, G. J., & Meltzer, H. Y. (1988). Comparison of in vivo
and in vitro glucocorticoid sensitivity in depression: relationship to the
dexamethasone suppression test. Biological Psychiatry, 24(6), 619-630.
Lu, S., Gao, W., Huang, M., Li, L., & Xu, Y. (2016). In search of the HPA axis activity in
unipolar depression patients with childhood trauma: Combined cortisol
awakening response and dexamethasone suppression test. J Psychiatr Res, 78,
24-30. doi:10.1016/j.jpsychires.2016.03.009
Luger, T. M., Suls, J., & Vander Weg, M. W. (2014). How robust is the association
between smoking and depression in adults? A meta-analysis using linear mixed-
effects models. Addictive Behaviors, 39(10), 1418-1429.
doi:10.1016/j.addbeh.2014.05.011
Lupien, S. J., Wilkinson, C. W., Brière, S., Ménard, C., Kin, N. N. Y., & Nair, N. (2002).
The modulatory effects of corticosteroids on cognition: studies in young human
populations. Psychoneuroendocrinology, 27(3), 401-416.

454
Lyness, J. M., Moynihan, J. A., Williford, D. J., Cox, C., & Caine, E. D. (2001).
Depression, medical illness, and interleukin-1beta in older cardiac patients.
International Journal of Psychiatry in Medicine, 31(3), 305-310. doi:10.2190/0jj0-
4bhw-fm8k-d5rh
Ma, K., Zhang, H., & Baloch, Z. (2016). Pathogenetic and therapeutic applications of
tumor necrosis factor-alpha (TNF-alpha) in major depressive disorder: A
systematic review. International Journal of Molecular Sciences, 17 (5) (no
pagination)(733).
Maas, D., Westendorp, R. G., Willems, J. M., de Craen, A. J., & van der Mast, R. C.
(2010). TNF-alpha antagonist infliximab in the treatment of depression in older
adults: Results of a prematurely ended, randomized, placebo-controlled trial. J
Clin Psychopharmacol, 30(3), 343-345.
doi:http://dx.doi.org/10.1097/JCP.0b013e3181dcf0de
Madrigal, J. L., Hurtado, O., Moro, M. A., Lizasoain, I., Lorenzo, P., Castrillo, A., . . .
Leza, J. C. (2002). The increase in TNF-alpha levels is implicated in NF-kappaB
activation and inducible nitric oxide synthase expression in brain cortex after
immobilization stress. Neuropsychopharmacology, 26(2), 155-163.
doi:10.1016/s0893-133x(01)00292-5
Madsen, K. S., Jernigan, T. L., Iversen, P., Frokjaer, V. G., Mortensen, E. L., Knudsen,
G. M., & Baare, W. F. (2012). Cortisol awakening response and negative
emotionality linked to asymmetry in major limbic fibre bundle architecture.
Psychiatry Res, 201(1), 63-72. doi:10.1016/j.pscychresns.2011.07.015
Maes, M. (1995). Evidence for an immune response in major depression: a review and
hypothesis. Progress in Neuro-Psychopharmacology & Biological Psychiatry,
19(1), 11-38.
Maes, M., Bosmans, E., & Meltzer, H. Y. (1995). Immunoendocrine aspects of major
depression. Eur Arch Psychiatry Clin Neurosci, 245(3), 172-178.

455
Maes, M., Bosmans, E., Meltzer, H. Y., Scharpe, S., & Suy, E. (1993a). Interleukin-1
beta: a putative mediator of HPA axis hyperactivity in major depression? Am J
Psychiatry, 150(8), 1189-1193. doi:10.1176/ajp.150.8.1189
Maes, M., Scharpe, S., Meltzer, H. Y., Bosmans, E., Suy, E., Calabrese, J., & Cosyns,
P. (1993b). Relationships between interleukin-6 activity, acute phase proteins,
and function of the hypothalamic-pituitary-adrenal axis in severe depression.
Psychiatry Res, 49(1), 11-27.
Maes, M., Song, C., Lin, A., De Jongh, R., Van Gastel, A., Kenis, G., . . . Smith, R. S.
(1998). The effects of psychological stress on humans: increased production of
pro-inflammatory cytokines and a Th1-like response in stress-induced anxiety.
Cytokine, 10(4), 313-318.
Maguire, T. M., Thakore, J., Dinan, T. G., Hopwood, S., & Breen, K. C. (1997). Plasma
sialyltransferase levels in psychiatric disorders as a possible indicator of HPA
axis function. Biological Psychiatry, 41(11), 1131-1136. doi:10.1016/s0006-
3223(96)00223-5
Malgaroli, M., Galatzer-Levy, I. R., & Bonanno, G. A. (2017). Heterogeneity in
Trajectories of Depression in Response to Divorce Is Associated With Differential
Risk for Mortality. Clinical Psychological Science, 2167702617705951.
Mandelli, L., Petrelli, C., & Serretti, A. (2015). The role of specific early trauma in adult
depression: A meta-analysis of published literature. Childhood trauma and adult
depression. European Psychiatry: the Journal of the Association of European
Psychiatrists, 30(6), 665-680. doi:10.1016/j.eurpsy.2015.04.007
Mangold, D., Marino, E., & Javors, M. (2011). The cortisol awakening response predicts
subclinical depressive symptomatology in Mexican American adults. J Psychiatr
Res, 45(7), 902-909. doi:10.1016/j.jpsychires.2011.01.001
Mangold, D., Mintz, J., Javors, M., & Marino, E. (2012). Neuroticism, acculturation and
the cortisol awakening response in Mexican American adults. Hormones &
Behavior, 61(1), 23-30. doi:10.1016/j.yhbeh.2011.09.009

456
Mannie, Z. N., Harmer, C. J., & Cowen, P. J. (2007). Increased waking salivary cortisol
levels in young people at familial risk of depression. Am J Psychiatry, 164(4),
617-621. doi:10.1176/ajp.2007.164.4.617
Manthey, L., Leeds, C., Giltay, E. J., van Veen, T., Vreeburg, S. A., Penninx, B. W., &
Zitman, F. G. (2011). Antidepressant use and salivary cortisol in depressive and
anxiety disorders. Eur Neuropsychopharmacol, 21(9), 691-699.
doi:10.1016/j.euroneuro.2011.03.002
Marchand, A., Durand, P., Juster, R. P., & Lupien, S. J. (2014). Workers' psychological
distress, depression, and burnout symptoms: associations with diurnal cortisol
profiles. Scandinavian Journal of Work, Environment & Health, 40(3), 305-314.
doi:10.5271/sjweh.3417
Marmot, M., Allen, J., Bell, R., Bloomer, E., & Goldblatt, P. (2012). WHO European
review of social determinants of health and the health divide. Lancet, 380(9846),
1011-1029. doi:10.1016/s0140-6736(12)61228-8
Marques-Deak, A. H., Neto, F. L., Dominguez, W. V., Solis, A. C., Kurcgant, D., Sato, F.,
. . . Prado, E. B. (2007). Cytokine profiles in women with different subtypes of
major depressive disorder. J Psychiatr Res, 41(1-2), 152-159.
Marshall, G. D., Jr., Agarwal, S. K., Lloyd, C., Cohen, L., Henninger, E. M., & Morris, G.
J. (1998). Cytokine dysregulation associated with exam stress in healthy medical
students. Brain, Behavior, & Immunity, 12(4), 297-307.
doi:10.1006/brbi.1998.0537
Marsland, A. L., Walsh, C., Lockwood, K., & John-Henderson, N. A. (2017). The effects
of acute psychological stress on circulating and stimulated inflammatory markers:
A systematic review and meta-analysis. Brain, Behavior, & Immunity, 64, 208-
219. doi:10.1016/j.bbi.2017.01.011
Martinac, M., Babic, D., Bevanda, M., Vasilj, I., Glibo, D. B., Karlovic, D., & Jakovljevic,
M. (2017). Activity of the hypothalamic-pituitary-adrenal axis and inflammatory
mediators in major depressive disorder with or without metabolic syndrome.
Psychiatr Danub, 29(1), 39-50.

457
Marwaha, A. K., Crome, S. Q., Panagiotopoulos, C., Berg, K. B., Qin, H., Ouyang, Q., .
. . Tan, R. (2010). Cutting edge: Increased IL-17-secreting T cells in children with
new-onset type 1 diabetes. J Immunol, 185(7), 3814-3818.
doi:10.4049/jimmunol.1001860
Masson, S. C., & Tejani, A. M. (2013). Minimum clinically important differences identified
for commonly used depression rating scales. Journal of Clinical Epidemiology,
66(7), 805-807. doi:10.1016/j.jclinepi.2013.01.010
Mathew, A. R., Hogarth, L., Leventhal, A. M., Cook, J. W., & Hitsman, B. (2017).
Cigarette smoking and depression comorbidity: systematic review and proposed
theoretical model. Addiction, 112(3), 401-412. doi:10.1111/add.13604
Mathews, D. C., Henter, I. D., & Zarate, C. A. (2012). Targeting the glutamatergic system
to treat major depressive disorder: rationale and progress to date. Drugs, 72(10),
1313-1333. doi:http://dx.doi.org/10.2165/11633130-000000000-00000
Matsubara, T., Funato, H., Kobayashi, A., Nobumoto, M., & Watanabe, Y. (2006).
Reduced Glucocorticoid Receptor alpha Expression in Mood Disorder Patients
and First-Degree Relatives. Biological Psychiatry, 59(8), 689-695.
doi:10.1016/j.biopsych.2005.09.026
Matthews, K., Schwartz, J., Cohen, S., & Seeman, T. (2006). Diurnal cortisol decline is
related to coronary calcification: CARDIA study. Psychosomatic Medicine, 68(5),
657-661. doi:10.1097/01.psy.0000244071.42939.0e
Mayberg, H. S., Brannan, S. K., Mahurin, R. K., Jerabek, P. A., Brickman, J. S., Tekell,
J. L., . . . Fox, P. T. (1997). Cingulate function in depression: a potential predictor
of treatment response. Neuroreport, 8(4), 1057-1061.
Mayberg, H. S., Lozano, A. M., Voon, V., McNeely, H. E., Seminowicz, D., Hamani, C., .
. . Kennedy, S. H. (2005). Deep brain stimulation for treatment-resistant
depression. Neuron, 45(5), 651-660. doi:10.1016/j.neuron.2005.02.014
McCrory, E., De Brito, S. A., & Viding, E. (2010). Research review: the neurobiology and
genetics of maltreatment and adversity. J Child Psychol Psychiatry, 51(10), 1079-
1095. doi:10.1111/j.1469-7610.2010.02271.x

458
McCusker, J., Cole, M., Ciampi, A., Latimer, E., Windholz, S., & Belzile, E. (2006). Does
depression in older medical inpatients predict mortality? Journals of Gerontology
Series A-Biological Sciences & Medical Sciences, 61(9), 975-981.
McEwen, B. S. (1998). Stress, adaptation, and disease. Allostasis and allostatic load.
Ann N Y Acad Sci, 840, 33-44.
McEwen, B. S. (2007). Physiology and neurobiology of stress and adaptation: central
role of the brain. Physiological Reviews, 87(3), 873-904.
doi:10.1152/physrev.00041.2006
McEwen, B. S., Biron, C. A., Brunson, K. W., Bulloch, K., Chambers, W. H., Dhabhar, F.
S., . . . Weiss, J. M. (1997). The role of adrenocorticoids as modulators of immune
function in health and disease: neural, endocrine and immune interactions. Brain
Research - Brain Research Reviews, 23(1-2), 79-133.
McGeachy, M. J., Bak-Jensen, K. S., Chen, Y., Tato, C. M., Blumenschein, W.,
McClanahan, T., & Cua, D. J. (2007). TGF-beta and IL-6 drive the production of
IL-17 and IL-10 by T cells and restrain T(H)-17 cell-mediated pathology. Nat
Immunol, 8(12), 1390-1397. doi:10.1038/ni1539
McGowan, P. O., Sasaki, A., D'Alessio, A. C., Dymov, S., Labonte, B., Szyf, M., . . .
Meaney, M. J. (2009). Epigenetic regulation of the glucocorticoid receptor in
human brain associates with childhood abuse. Nature Neuroscience, 12(3), 342-
348. doi:10.1038/nn.2270
McIntyre, R. S., Filteau, M. J., Martin, L., Patry, S., Carvalho, A., Cha, D. S., . . . Miguelez,
M. (2014). Treatment-resistant depression: definitions, review of the evidence,
and algorithmic approach. Journal of Affective Disorders, 156, 1-7.
doi:10.1016/j.jad.2013.10.043
McIntyre, R. S., Soczynska, J. K., Konarski, J. Z., Woldeyohannes, H. O., Law, C. W.,
Miranda, A., . . . Kennedy, S. H. (2007). Should Depressive Syndromes Be
Reclassified as "Metabolic Syndrome Type II"? Annals of Clinical Psychiatry,
19(4), 257-264. doi:10.1080/10401230701653377

459
McKay, M. S., & Zakzanis, K. K. (2010). The impact of treatment on HPA axis activity in
unipolar major depression. J Psychiatr Res, 44(3), 183-192.
doi:https://doi.org/10.1016/j.jpsychires.2009.07.012
McLaughlin, K. A. (2016). Future Directions in Childhood Adversity and Youth
Psychopathology. J Clin Child Adolesc Psychol, 45(3), 361-382.
doi:10.1080/15374416.2015.1110823
McManus, S., Bebbington, P., Jenkins, R., & Brugha, T. (2016). Mental health and
wellbeing in England: Adult Psychiatric Morbidity Survey 2014. Retrieved from
https://assets.publishing.service.gov.uk/government/uploads/system/uploads/att
achment_data/file/556596/apms-2014-full-rpt.pdf
Meaney, M. J. (2001). Maternal care, gene expression, and the transmission of individual
differences in stress reactivity across generations. Annual Review of
Neuroscience, 24, 1161-1192. doi:10.1146/annurev.neuro.24.1.1161
Mechawar, N., & Savitz, J. (2016). Neuropathology of mood disorders: do we see the
stigmata of inflammation? Translational Psychiatry, 6(11), e946.
doi:10.1038/tp.2016.212
Medina, A., Seasholtz, A. F., Sharma, V., Burke, S., Bunney, W., Jr., Myers, R. M., . . .
Watson, S. J. (2013). Glucocorticoid and mineralocorticoid receptor expression
in the human hippocampus in major depressive disorder. J Psychiatr Res, 47(3),
307-314. doi:10.1016/j.jpsychires.2012.11.002
Mehta, D., Raison, C. L., Woolwine, B. J., Haroon, E., Binder, E. B., Miller, A. H., &
Felger, J. C. (2013). Transcriptional signatures related to glucose and lipid
metabolism predict treatment response to the tumor necrosis factor antagonist
infliximab in patients with treatment-resistant depression. Brain, behavior, and
immunity, 31, 205-215. Retrieved from
http://onlinelibrary.wiley.com/o/cochrane/clcentral/articles/129/CN-
00964129/frame.html

460
http://ac.els-cdn.com/S088915911300144X/1-s2.0-S088915911300144X-
main.pdf?_tid=5dd19ec8-7a70-11e6-9299-
00000aab0f01&acdnat=1473853551_46cc2e940e8a4ae1c6b016763ff04eca
doi:10.1016/j.bbi.2013.04.004
Meijer, A., Conradi, H. J., Bos, E. H., Anselmino, M., Carney, R. M., Denollet, J., . . . de
Jonge, P. (2013). Adjusted prognostic association of depression following
myocardial infarction with mortality and cardiovascular events: individual patient
data meta-analysis. British Journal of Psychiatry, 203(2), 90-102.
doi:10.1192/bjp.bp.112.111195
Meijer, A., Conradi, H. J., Bos, E. H., Thombs, B. D., van Melle, J. P., & de Jonge, P.
(2011). Prognostic association of depression following myocardial infarction with
mortality and cardiovascular events: a meta-analysis of 25 years of research.
General Hospital Psychiatry, 33(3), 203-216.
doi:10.1016/j.genhosppsych.2011.02.007
Mellor, A. L., Munn, D., Chandler, P., Keskin, D., Johnson, T., Marshall, B., . . . Baban,
B. (2003). Tryptophan catabolism and T cell responses. Advances in
Experimental Medicine & Biology, 527, 27-35.
Menke, A., Arloth, J., Gerber, M., Rex-Haffner, M., Uhr, M., Holsboer, F., . . . Beck, J.
(2014). Dexamethasone stimulated gene expression in peripheral blood indicates
glucocorticoid-receptor hypersensitivity in job-related exhaustion.
Psychoneuroendocrinology, 44, 35-46. doi:10.1016/j.psyneuen.2014.02.013
Menke, A., Arloth, J., Putz, B., Weber, P., Klengel, T., Mehta, D., . . . Binder, E. B.
(2012a). Dexamethasone stimulated gene expression in peripheral blood is a
sensitive marker for glucocorticoid receptor resistance in depressed patients.
Neuropsychopharmacology, 37(6), 1455-1464. doi:10.1038/npp.2011.331
Menke, A., Klengel, T., & Binder, E. B. (2012b). Epigenetics, depression and
antidepressant treatment. Current Pharmaceutical Design, 18(36), 5879-5889.
Menke, A., Klengel, T., Rubel, J., Bruckl, T., Pfister, H., Lucae, S., . . . Binder, E. B.
(2013). Genetic variation in FKBP5 associated with the extent of stress hormone

461
dysregulation in major depression. Genes, Brain, & Behavior, 12(3), 289-296.
doi:10.1111/gbb.12026
Merali, Z., Du, L., Hrdina, P., Palkovits, M., Faludi, G., Poulter, M. O., & Anisman, H.
(2004). Dysregulation in the suicide brain: mRNA expression of corticotropin-
releasing hormone receptors and GABA(A) receptor subunits in frontal cortical
brain region. Journal of Neuroscience, 24(6), 1478-1485.
doi:10.1523/jneurosci.4734-03.2004
Merswolken, M., Deter, H. C., Siebenhuener, S., Orth-Gomer, K., & Weber, C. S. (2013).
Anxiety as predictor of the cortisol awakening response in patients with coronary
heart disease. International Journal of Behavioral Medicine, 20(3), 461-467.
doi:10.1007/s12529-012-9233-6
Mhaoláin, A. M. N., Fan, C. W., Romero-Ortuno, R., Cogan, L., Cunningham, C., Kenny,
R.-A., & Lawlor, B. (2012). Frailty, depression, and anxiety in later life.
International Psychogeriatrics, 24(8), 1265-1274.
Mikkelsen, J. D., Hay-Schmidt, A., & Kiss, A. (2004). Serotonergic stimulation of the rat
hypothalamo-pituitary-adrenal axis: interaction between 5-HT1A and 5-HT2A
receptors. Ann N Y Acad Sci, 1018, 65-70. doi:10.1196/annals.1296.007
Miller, A. H. (2010). Depression and immunity: a role for T cells? Brain, behavior, and
immunity, 24(1), 1-8.
Miller, A. H., Asnis, G. M., Lackner, C., & Norin, A. J. (1987). The in vitro effect of cortisol
on natural killer cell activity in patients with major depressive disorder.
Psychopharmacol Bull, 23(3), 502-504.
Miller, A. H., Maletic, V., & Raison, C. L. (2009). Inflammation and Its Discontents: The
Role of Cytokines in the Pathophysiology of Major Depression. Biological
Psychiatry, 65(9), 732-741.
Miller, A. H., & Raison, C. L. (2016). The role of inflammation in depression: from
evolutionary imperative to modern treatment target. Nature reviews. Immunology,
16(1), 22-34. doi:http://dx.doi.org/10.1038/nri.2015.5

462
Miller, A. H., Spencer, R. L., Pearce, B. D., Pisell, T. L., Azrieli, Y., Tanapat, P., . . .
McEwen, B. S. (1998). Glucocorticoid receptors are differentially expressed in
the cells and tissues of the immune system. Cell Immunol, 186(1), 45-54.
doi:10.1006/cimm.1998.1293
Miller, A. H., Vogt, G. J., & Pearce, B. D. (2002a). The phosphodiesterase type 4 inhibitor,
rolipram, enhances glucocorticoid receptor function. Neuropsychopharmacology,
27(6), 939-948. doi:10.1016/S0893-133X(02)00381-0
Miller, G. E., & Chen, E. (2010). Harsh family climate in early life presages the
emergence of a proinflammatory phenotype in adolescence. Psychological
Science, 21(6), 848-856.
Miller, G. E., Chen, E., & Parker, K. J. (2011). Psychological stress in childhood and
susceptibility to the chronic diseases of aging: moving toward a model of
behavioral and biological mechanisms. Psychol Bull, 137(6), 959.
Miller, G. E., Chen, E., Sze, J., Marin, T., Arevalo, J. M., Doll, R., . . . Cole, S. W. (2008).
A functional genomic fingerprint of chronic stress in humans: blunted
glucocorticoid and increased NF-kappaB signaling. Biological Psychiatry, 64(4),
266-272. doi:10.1016/j.biopsych.2008.03.017
Miller, G. E., Freedland, K. E., Duntley, S., & Carney, R. M. (2005a). Relation of
depressive symptoms to C-reactive protein and pathogen burden
(cytomegalovirus, herpes simplex virus, Epstein-Barr virus) in patients with
earlier acute coronary syndromes. The American Journal of Cardiology, 95(3),
317-321. doi:10.1016/j.amjcard.2004.09.026
Miller, G. E., Murphy, M. L., Cashman, R., Ma, R., Ma, J., Arevalo, J. M., . . . Cole, S. W.
(2014). Greater inflammatory activity and blunted glucocorticoid signaling in
monocytes of chronically stressed caregivers. Brain, Behavior, & Immunity, 41,
191-199. doi:10.1016/j.bbi.2014.05.016
Miller, G. E., Rohleder, N., Stetler, C., & Kirschbaum, C. (2005b). Clinical depression
and regulation of the inflammatory response during acute stress. Psychosomatic
Medicine, 67(5), 679-687. doi:10.1097/01.psy.0000174172.82428.ce

463
Miller, G. E., Stetler, C. A., Carney, R. M., Freedland, K. E., & Banks, W. A. (2002b).
Clinical depression and inflammatory risk markers for coronary heart disease.
The American Journal of Cardiology, 90(12), 1279-1283.
Miller, H. L., Delgado, P. L., Salomon, R. M., Berman, R., Krystal, J. H., Heninger, G. R.,
& Charney, D. S. (1996). Clinical and biochemical effects of catecholamine
depletion on antidepressant-induced remission of depression. Arch Gen
Psychiatry, 53(2), 117-128.
Minelli, A., Magri, C., Barbon, A., Bonvicini, C., Segala, M., Congiu, C., . . . Gennarelli,
M. (2015). Proteasome system dysregulation and treatment resistance
mechanisms in major depressive disorder. Translational Psychiatry, 5, e687.
doi:10.1038/tp.2015.180
Missinne, S., Vandeviver, C., Van de Velde, S., & Bracke, P. (2014). Measurement
equivalence of the CES-D 8 depression-scale among the ageing population in
eleven European countries. Social Science Research, 46, 38-47.
doi:http://dx.doi.org/10.1016/j.ssresearch.2014.02.006
Mitchell, A. J., Sheth, B., Gill, J., Yadegarfar, M., Stubbs, B., Yadegarfar, M., & Meader,
N. (2017). Prevalence and predictors of post-stroke mood disorders: A meta-
analysis and meta-regression of depression, anxiety and adjustment disorder.
General Hospital Psychiatry, 47, 48-60.
doi:10.1016/j.genhosppsych.2017.04.001
Miyara, M., Yoshioka, Y., Kitoh, A., Shima, T., Wing, K., Niwa, A., . . . Valeyre, D. (2009).
Functional delineation and differentiation dynamics of human CD4+ T cells
expressing the FoxP3 transcription factor. Immunity, 30(6), 899-911.
Modell, S., Yassouridis, A., Huber, J., & Holsboer, F. (1997). Corticosteroid receptor
function is decreased in depressed patients. Neuroendocrinology, 65(3), 216-
222. doi:10.1159/000127275
Mohd Ashari, N. S., Mohamed Sanusi, S. N. F., Mohd Yasin, M. A., Che Hussin, C. M.,
Wong, K. K., & Shafei, M. N. (2019). Major depressive disorder patients on

464
antidepressant treatments display higher number of regulatory T cells. Malays J
Pathol, 41(2), 169-176.
Mokhtari, M., Arfken, C., & Boutros, N. (2013). The DEX/CRH test for major depression:
a potentially useful diagnostic test. Psychiatry Res, 208(2), 131-139.
doi:10.1016/j.psychres.2012.09.032
Molendijk, M. L., Molero, P., Ortuno Sanchez-Pedreno, F., Van der Does, W., & Angel
Martinez-Gonzalez, M. (2018). Diet quality and depression risk: A systematic
review and dose-response meta-analysis of prospective studies. Journal of
Affective Disorders, 226, 346-354. doi:10.1016/j.jad.2017.09.022
Molendijk, M. L., Spinhoven, P., Polak, M., Bus, B. A., Penninx, B. W., & Elzinga, B. M.
(2014). Serum BDNF concentrations as peripheral manifestations of depression:
evidence from a systematic review and meta-analyses on 179 associations
(N=9484). Mol Psychiatry, 19(7), 791-800. doi:10.1038/mp.2013.105
Molinaro, R., Pecli, C., Guilherme, R. F., Alves-Filho, J. C., Cunha, F. Q., Canetti, C., . .
. Benjamim, C. F. (2015). CCR4 Controls the Suppressive Effects of Regulatory
T Cells on Early and Late Events during Severe Sepsis. PLoS One, 10(7),
e0133227. doi:10.1371/journal.pone.0133227
Mondelli, V., Vernon, A. C., Turkheimer, F., Dazzan, P., & Pariante, C. M. (2017). Brain
microglia in psychiatric disorders. Lancet Psychiatry, 4(7), 563-572.
doi:10.1016/s2215-0366(17)30101-3
Montgomery, S. (2016). Are the ICD-10 or DSM-5 diagnostic systems able to define
those who will benefit from treatment for depression? Cns Spectrums, 21(4), 283-
288. doi:10.1017/s1092852916000389
Moore, P., Landolt, H. P., Seifritz, E., Clark, C., Bhatti, T., Kelsoe, J., . . . Gillin, J. C.
(2000). Clinical and physiological consequences of rapid tryptophan depletion.
Neuropsychopharmacology, 23(6), 601-622. doi:10.1016/s0893-133x(00)00161-
5
Moorman, A. J., Mozaffarian, D., Wilkinson, C. W., Lawler, R. L., McDonald, G. B., Crane,
B. A., . . . Levy, W. C. (2007). In Patients With Heart Failure Elevated Soluble

465
TNF-Receptor 1 Is Associated With Higher Risk of Depression. Journal of
Cardiac Failure, 13(9), 738-743.
Moreira, F. P., Cardoso Tde, A., Mondin, T. C., Souza, L. D., Silva, R., Jansen, K., . . .
Wiener, C. D. (2015). The effect of proinflammatory cytokines in Cognitive
Behavioral Therapy. J Neuroimmunol, 285, 143-146.
doi:10.1016/j.jneuroim.2015.06.004
Morikawa, O., Sakai, N., Obara, H., & Saito, N. (1998). Effects of interferon-alpha,
interferon-gamma and cAMP on the transcriptional regulation of the serotonin
transporter. European Journal of Pharmacology, 349(2-3), 317-324.
Motivala, S. J., Sarfatti, A., Olmos, L., & Irwin, M. R. (2005). Inflammatory markers and
sleep disturbance in major depression. Psychosomatic Medicine, 67(2), 187-194.
doi:10.1097/01.psy.0000149259.72488.09
Mottonen, M., Heikkinen, J., Mustonen, L., Isomaki, P., Luukkainen, R., & Lassila, O.
(2005). CD4+ CD25+ T cells with the phenotypic and functional characteristics of
regulatory T cells are enriched in the synovial fluid of patients with rheumatoid
arthritis. Clin Exp Immunol, 140(2), 360-367. doi:10.1111/j.1365-
2249.2005.02754.x
Moulton, C. D., Pickup, J. C., & Ismail, K. (2015). The link between depression and
diabetes: The search for shared mechanisms. The Lancet Diabetes and
Endocrinology, 3(6), 461-471. doi:10.1016/S2213-8587(15)00134-5
Moussavi, S., Chatterji, S., Verdes, E., Tandon, A., Patel, V., & Ustun, B. (2007).
Depression, chronic diseases, and decrements in health: results from the World
Health Surveys. Lancet, 370(9590), 851-858. doi:10.1016/s0140-
6736(07)61415-9
Mrazek, D. A., Hornberger, J. C., Altar, C. A., & Degtiar, I. (2014). A review of the clinical,
economic, and societal burden of treatment-resistant depression: 1996-2013.
Psychiatr Serv, 65(8), 977-987. doi:10.1176/appi.ps.201300059
Muck-Seler, D., Pivac, N., Sagud, M., Jakovljevic, M., & Mihaljevic-Peles, A. (2002). The
effects of paroxetine and tianeptine on peripheral biochemical markers in major

466
depression. Progress in Neuro-Psychopharmacology & Biological Psychiatry,
26(7-8), 1235-1243.
Mukamal, K. J., Conigrave, K. M., Mittleman, M. A., Camargo, C. A., Jr., Stampfer, M.
J., Willett, W. C., & Rimm, E. B. (2003). Roles of drinking pattern and type of
alcohol consumed in coronary heart disease in men. N Engl J Med, 348(2), 109-
118. doi:10.1056/NEJMoa022095
Mukherjee, D., Nissen, S. E., & Topol, E. J. (2001). Risk of cardiovascular events
associated with selective COX-2 inhibitors. Jama, 286(8), 954-959.
Mulert, C., Juckel, G., Brunnmeier, M., Karch, S., Leicht, G., Mergl, R., . . . Pogarell, O.
(2007). Prediction of treatment response in major depression: integration of
concepts. Journal of Affective Disorders, 98(3), 215-225.
doi:10.1016/j.jad.2006.07.021
Muller, N., Schwarz, M. J., Dehning, S., Douhe, A., Cerovecki, A., Goldstein-Muller, B., .
. . Riedel, M. (2006). The cyclooxygenase-2 inhibitor celecoxib has therapeutic
effects in major depression: results of a double-blind, randomized, placebo
controlled, add-on pilot study to reboxetine. Molecular Psychiatry, 11(7), 680-
684.
Murphy, M. J., & Peterson, M. J. (2015). Sleep Disturbances in Depression. Sleep Med
Clin, 10(1), 17-23. doi:10.1016/j.jsmc.2014.11.009
Murphy, M. L., & Frodl, T. (2011). Meta-analysis of diffusion tensor imaging studies
shows altered fractional anisotropy occurring in distinct brain areas in association
with depression. Biol Mood Anxiety Disord, 1(1), 3. doi:10.1186/2045-5380-1-3
Musil, R., Schwarz, M., Riedel, M., Dehning, S., Cerovecki, A., Spellmann, I., . . . Müller,
N. (2011). Elevated macrophage migration inhibitory factor and decreased
transforming growth factor-beta levels in major depression—no influence of
celecoxib treatment. Journal of Affective Disorders, 134(1-3), 217-225.
Musselman, D. L., Lawson, D. H., Gumnick, J. F., Manatunga, A. K., Penna, S., Goodkin,
R. S., . . . Miller, A. H. (2001). Paroxetine for the prevention of depression induced
by high-dose interferon alfa. The New England journal of medicine, 344(13), 961-

467
966. Retrieved from
http://onlinelibrary.wiley.com/o/cochrane/clcentral/articles/103/CN-
00328103/frame.html
http://www.nejm.org/doi/pdf/10.1056/NEJM200103293441303
doi:10.1056/NEJM200103293441303
Musunuru, K., & Kathiresan, S. (2019). Genetics of Common, Complex Coronary Artery
Disease. Cell, 177(1), 132-145. doi:10.1016/j.cell.2019.02.015
Na, K. S., Lee, K. J., Lee, J. S., Cho, Y. S., & Jung, H. Y. (2014). Efficacy of adjunctive
celecoxib treatment for patients with major depressive disorder: a meta-analysis.
Progress in Neuro-Psychopharmacology & Biological Psychiatry, 48, 79-85.
doi:10.1016/j.pnpbp.2013.09.006
Nabi, H., Singh-Manoux, A., Shipley, M., Gimeno, D., Marmot, M. G., & Kivimaki, M.
(2008). Do psychological factors affect inflammation and incident coronary heart
disease: the Whitehall II Study. Arteriosclerosis, Thrombosis, and Vascular
Biology, 28(7), 1398-1406. doi:10.1161/atvbaha.108.167239
Nadeau, S., & Rivest, S. (2003). Glucocorticoids play a fundamental role in protecting
the brain during innate immune response. Journal of Neuroscience, 23(13),
5536-5544.
Nalepa, I., & Vetulani, J. (1991). Involvement of protein kinase C in the mechanism of in
vitro effects of imipramine on generation of second messengers by noradrenaline
in cerebral cortical slices of the rat. Neuroscience, 44(3), 585-590.
doi:10.1016/0306-4522(91)90079-4
Nanni, V., Uher, R., & Danese, A. (2012). Childhood maltreatment predicts unfavorable
course of illness and treatment outcome in depression: a meta-analysis. Am J
Psychiatry, 169(2), 141-151. doi:10.1176/appi.ajp.2011.11020335
National Institute for Health Research. (2018). CRN North West London. Retrieved from
https://www.nihr.ac.uk/nihr-in-your-area/north-west-london/

468
Nelson, J. C., & Davis, J. M. (1997). DST studies in psychotic depression: a meta-
analysis. American Journal of Psychiatry, 154(11), 1497-1503.
Nemeroff, C. B., & Vale, W. W. (2005). The neurobiology of depression: inroads to
treatment and new drug discovery. The Journal of Clinical Psychiatry, 66 Suppl
7, 5-13.
Newport, D. J., Heim, C., Bonsall, R., Miller, A. H., & Nemeroff, C. B. (2004). Pituitary-
adrenal responses to standard and low-dose dexamethasone suppression tests
in adult survivors of child abuse. Biological Psychiatry, 55(1), 10-20.
Ng, W. F., Duggan, P. J., Ponchel, F., Matarese, G., Lombardi, G., Edwards, A. D., . . .
Lechler, R. I. (2001). Human CD4(+)CD25(+) cells: a naturally occurring
population of regulatory T cells. Blood, 98(9), 2736-2744.
doi:10.1182/blood.v98.9.2736
Nicholson, A., Kuper, H., & Hemingway, H. (2006). Depression as an aetiologic and
prognostic factor in coronary heart disease: a meta-analysis of 6362 events
among 146 538 participants in 54 observational studies. European Heart Journal,
27(23), 2763-2774.
Nickel, T., Sonntag, A., Schill, J., Zobel, A. W., Ackl, N., Brunnauer, A., . . . Steiger, A.
(2003). Clinical and neurobiological effects of tianeptine and paroxetine in major
depression. J Clin Psychopharmacol, 23(2), 155-168.
Nicolaides, N. C., Pavlaki, A. N., Maria Alexandra, M. A., & Chrousos, G. P. (2000).
Glucocorticoid Therapy and Adrenal Suppression. In L. J. De Groot, G. Chrousos,
K. Dungan, K. R. Feingold, A. Grossman, J. M. Hershman, C. Koch, M. Korbonits,
R. McLachlan, M. New, J. Purnell, R. Rebar, F. Singer, & A. Vinik (Eds.),
Endotext. South Dartmouth (MA): MDText.com, Inc.
Nijm, J., Kristenson, M., Olsson, A. G., & Jonasson, L. (2007). Impaired cortisol response
to acute stressors in patients with coronary disease. Implications for inflammatory
activity. Journal of Internal Medicine, 262(3), 375-384. doi:10.1111/j.1365-
2796.2007.01817.x

469
Nikisch, G., Mathé, A. A., Czernik, A., Thiele, J., Bohner, J., Eap, C. B., . . . Baumann,
P. (2005). Long-term citalopram administration reduces responsiveness of HPA
axis in patients with major depression: relationship with S-citalopram
concentrations in plasma and cerebrospinal fluid (CSF) and clinical response.
Psychopharmacology, 181(4), 751-760.
Nikkheslat, N., Zunszain, P. A., Horowitz, M. A., Barbosa, I. G., Parker, J. A., Myint, A.
M., . . . Pariante, C. M. (2015). Insufficient glucocorticoid signaling and elevated
inflammation in coronary heart disease patients with comorbid depression. Brain,
Behavior, & Immunity, 48, 8-18. doi:10.1016/j.bbi.2015.02.002
Niles, A. N., Smirnova, M., Lin, J., & O'Donovan, A. (2018). Gender differences in
longitudinal relationships between depression and anxiety symptoms and
inflammation in the health and retirement study. Psychoneuroendocrinology, 95,
149-157. doi:10.1016/j.psyneuen.2018.05.035
Noll, J. G., Trickett, P. K., Susman, E. J., & Putnam, F. W. (2006). Sleep disturbances
and childhood sexual abuse. J Pediatr Psychol, 31(5), 469-480.
doi:10.1093/jpepsy/jsj040
Notara, V., Panagiotakos, D. B., Tsompanaki, E., Kouvari, M., Kogias, Y., Papanagnou,
G., . . . Pitsavos, C. (2016). Depressive symptomatology in relation to 10-year
(2004-2014) acute coronary syndrome incidence; the moderating role of diet and
financial status. Preventive Medicine, 86, 6-11.
doi:10.1016/j.ypmed.2016.01.009
O'Brien, J. T., Lloyd, A., McKeith, I., Gholkar, A., & Ferrier, N. (2004). A longitudinal study
of hippocampal volume, cortisol levels, and cognition in older depressed subjects.
Am J Psychiatry, 161(11), 2081-2090. doi:10.1176/appi.ajp.161.11.2081
O'Connor, J. C., Lawson, M. A., Andre, C., Moreau, M., Lestage, J., Castanon, N., . . .
Dantzer, R. (2009). Lipopolysaccharide-induced depressive-like behavior is
mediated by indoleamine 2,3-dioxygenase activation in mice. Mol Psychiatry,
14(5), 511-522. doi:10.1038/sj.mp.4002148

470
O'Connor, K. A., Johnson, J. D., Hansen, M. K., Wieseler Frank, J. L., Maksimova, E.,
Watkins, L. R., & Maier, S. F. (2003). Peripheral and central proinflammatory
cytokine response to a severe acute stressor. Brain Research, 991(1-2), 123-
132.
O'Flaherty, M., Buchan, I., & Capewell, S. (2013). Contributions of treatment and lifestyle
to declining CVD mortality: why have CVD mortality rates declined so much since
the 1960s? Heart, 99(3), 159-162. doi:10.1136/heartjnl-2012-302300
O'Neil, A., Fisher, A. J., Kibbey, K. J., Jacka, F. N., Kotowicz, M. A., Williams, L. J., . . .
Pasco, J. A. (2016). Depression is a risk factor for incident coronary heart disease
in women: An 18-year longitudinal study. Journal of Affective Disorders, 196, 117-
124. doi:10.1016/j.jad.2016.02.029
O'Neill, D., Britton, A., Hannah, M. K., Goldberg, M., Kuh, D., Khaw, K. T., & Bell, S.
(2018). Association of longitudinal alcohol consumption trajectories with coronary
heart disease: a meta-analysis of six cohort studies using individual participant
data. BMC Med, 16(1), 124. doi:10.1186/s12916-018-1123-6
Oakley, R. H., & Cidlowski, J. A. (2013). The biology of the glucocorticoid receptor: new
signaling mechanisms in health and disease. Journal of Allergy and Clinical
Immunology, 132(5), 1033-1044. doi:10.1016/j.jaci.2013.09.007
Ockenfels, M. C., Porter, L., Smyth, J., Kirschbaum, C., Hellhammer, D. H., & Stone, A.
A. (1995). Effect of chronic stress associated with unemployment on salivary
cortisol: overall cortisol levels, diurnal rhythm, and acute stress reactivity.
Psychosomatic Medicine, 57(5), 460-467.
Onda, K., Nagashima, M., Kawakubo, Y., Inoue, S., Hirano, T., & Oka, K. (2006).
Mitogen-activated protein kinase kinase 1/extracellular signal-regulated kinase
(MEK-1/ERK) inhibitors sensitize reduced glucocorticoid response mediated by
TNFalpha in human epidermal keratinocytes (HaCaT). Biochem Biophys Res
Commun, 351(1), 266-272. doi:10.1016/j.bbrc.2006.10.032
Otte, C. (2008). Incomplete remission in depression: role of psychiatric and somatic
comorbidity. Dialogues Clin Neurosci, 10(4), 453-460.

471
Otte, C., Gold, S. M., Penninx, B. W., Pariante, C. M., Etkin, A., Fava, M., . . . Schatzberg,
A. F. (2016). Major depressive disorder. Nat Rev Dis Primers, 2, 16065.
doi:10.1038/nrdp.2016.65
Otte, C., Hinkelmann, K., Moritz, S., Yassouridis, A., Jahn, H., Wiedemann, K., & Kellner,
M. (2010). Modulation of the mineralocorticoid receptor as add-on treatment in
depression: A randomized, double-blind, placebo-controlled proof-of-concept
study. J Psychiatr Res, 44(6), 339-346. doi:10.1016/j.jpsychires.2009.10.006
Otte, C., McCaffery, J., Ali, S., & Whooley, M. A. (2007). Association of a serotonin
transporter polymorphism (5-HTTLPR) with depression, perceived stress, and
norepinephrine in patients with coronary disease: the Heart and Soul Study. Am
J Psychiatry, 164(9), 1379-1384. doi:10.1176/appi.ajp.2007.06101617
Pace, T. W., Hu, F., & Miller, A. H. (2007a). Cytokine-effects on glucocorticoid receptor
function: relevance to glucocorticoid resistance and the pathophysiology and
treatment of major depression. Brain, Behavior, & Immunity, 21(1), 9-19.
Pace, T. W. , Hu, F., & Miller, A. H. (2007b). Cytokine-effects on glucocorticoid receptor
function: Relevance to glucocorticoid resistance and the pathophysiology and
treatment of major depression. Brain, behavior, and immunity, 21(1), 9-19.
Pace, T. W., Hu, F., & Miller, A. H. (2011). Activation of cAMP-protein kinase A abrogates
STAT5-mediated inhibition of glucocorticoid receptor signaling by interferon-
alpha. Brain, Behavior, & Immunity, 25(8), 1716-1724.
doi:10.1016/j.bbi.2011.07.227
Pace, T. W., & Miller, A. H. (2009a). Cytokines and glucocorticoid receptor signaling:
Relevance to major depression. In Glucocorticoids and Mood Clinical
Manifestations, Risk Factors, and Molecular Mechanisms (pp. 86-105). 350 Main
Street, Malden MA 02148, United States: Blackwell Publishing Inc.
Pace, T. W., & Miller, A. H. (2009b). Cytokines and glucocorticoid receptor signaling:
Relevance to major depression. Glucocorticoids and Mood Clinical
Manifestations, Risk Factors, and Molecular Mechanisms, Annals of the New
York Academy of Sciences. 1179, 86-105.

472
Palazidou, E., Papadopoulos, A., Ratcliff, H., Dawling, S., & Checkley, S. A. (1992).
Noradrenaline uptake inhibition increases melatonin secretion, a measure of
noradrenergic neurotransmission, in depressed patients. Psychological
Medicine, 22(2), 309-315.
Paljärvi, T., Koskenvuo, M., Poikolainen, K., Kauhanen, J., Sillanmäki, L., & Mäkelä, P.
(2009). Binge drinking and depressive symptoms: a 5‐year population‐based
cohort study. Addiction, 104(7), 1168-1178.
Palmer, S. C., Vecchio, M., Craig, J. C., Tonelli, M., Johnson, D. W., Nicolucci, A., . . .
Strippoli, G. F. (2013). Association between depression and death in people with
CKD: a meta-analysis of cohort studies. American Journal of Kidney Diseases,
62(3), 493-505. doi:10.1053/j.ajkd.2013.02.369
Pant, S., Deshmukh, A., Gurumurthy, G. S., Pothineni, N. V., Watts, T. E., Romeo, F., &
Mehta, J. L. (2014). Inflammation and atherosclerosis--revisited. J Cardiovasc
Pharmacol Ther, 19(2), 170-178. doi:10.1177/1074248413504994
Papakostas, G. I., & Ionescu, D. F. (2015). Towards new mechanisms: an update on
therapeutics for treatment-resistant major depressive disorder. Mol Psychiatry,
20(10), 1142-1150. doi:10.1038/mp.2015.92
Paparrigopoulos, T. (2002). Melatonin response to atenolol administration in depression:
indication of beta-adrenoceptor dysfunction in a subtype of depression. Acta
Psychiatr Scand, 106(6), 440-445.
Pariante, C. M. (2004). Glucocorticoid receptor function in vitro in patients with major
depression. Stress, 7(4), 209-219. doi:10.1080/10253890500069650
Pariante, C. M. (2006). The glucocorticoid receptor: part of the solution or part of the
problem? J Psychopharmacol, 20(4 Suppl), 79-84.
doi:10.1177/1359786806066063
Pariante, C. M., Hye, A., Williamson, R., Makoff, A., Lovestone, S., & Kerwin, R. W.
(2003). The antidepressant clomipramine regulates cortisol intracellular
concentrations and glucocorticoid receptor expression in fibroblasts and rat

473
primary neurones. Neuropsychopharmacology, 28(9), 1553-1561.
doi:10.1038/sj.npp.1300195
Pariante, C. M., & Lightman, S. L. (2008). The HPA axis in major depression: classical
theories and new developments. Trends in Neurosciences, 31(9), 464-468.
doi:10.1016/j.tins.2008.06.006
Pariante, C. M., & Miller, A. H. (2001). Glucocorticoid receptors in major depression:
relevance to pathophysiology and treatment. Biological Psychiatry, 49(5), 391-
404.
Pariante, C. M., Papadopoulos, A. S., Poon, L., Checkley, S. A., English, J., Kerwin, R.
W., & Lightman, S. (2002). A novel prednisolone suppression test for the
hypothalamic-pituitary-adrenal axis. Biological Psychiatry, 51(11), 922-930.
Pariante, C. M., Papadopoulos, A. S., Poon, L., Cleare, A. J., Checkley, S. A., English,
J., . . . Lightman, S. (2004). Four days of citalopram increase suppression of
cortisol secretion by prednisolone in healthy volunteers. Psychopharmacology,
177(1), 200-206. doi:10.1007/s00213-004-1925-4
Park, E. J., Lee, J. H., Jeong, D. C., Han, S. I., & Jeon, Y. W. (2015). Natural killer cell
activity in patients with major depressive disorder treated with escitalopram.
International Immunopharmacology, 28(1), 409-413.
doi:10.1016/j.intimp.2015.06.031
Parker, G., & Manicavasagar, V. (2005). Modelling and managing the depressive
disorders: a clinical guide: Cambridge University Press.
Paslakis, G., Krumm, B., Gilles, M., Schweiger, U., Heuser, I., Richter, I., & Deuschle,
M. (2011). Discrimination between patients with melancholic depression and
healthy controls: comparison between 24-h cortisol profiles, the DST and the
Dex/CRH test. Psychoneuroendocrinology, 36(5), 691-698.
doi:10.1016/j.psyneuen.2010.10.002
Patas, K., Willing, A., Demiralay, C., Engler, J. B., Lupu, A., Ramien, C., . . . Gold, S. M.
(2018). T Cell Phenotype and T Cell Receptor Repertoire in Patients with Major
Depressive Disorder. Front Immunol, 9, 291. doi:10.3389/fimmu.2018.00291

474
Pavon, L., Sandoval-Lopez, G., Eugenia Hernandez, M., Loria, F., Estrada, I., Perez, M.,
. . . Heinze, G. (2006). Th2 cytokine response in Major Depressive Disorder
patients before treatment. J Neuroimmunol, 172(1-2), 156-165.
doi:10.1016/j.jneuroim.2005.08.014
Pearson, T. A., Mensah, G. A., Alexander, R. W., Anderson, J. L., Cannon, R. O., Criqui,
M., . . . Myers, G. L. (2003). Markers of inflammation and cardiovascular disease
application to clinical and public health practice: a statement for healthcare
professionals from the centers for disease control and prevention and the
American Heart Association. Circulation, 107(3), 499-511.
Peeters, B., Van Der Heijden, R., Gubbels, D., & Vanderheyden, P. (1994). Effects of
Chronic Antidepressant Treatment on the Hypothalamic‐Pituitary‐Adrenal Axis of
Wistar Rats. Annals of the New York Academy of Sciences, 746(1), 449-452.
Penninx, B. W. (2016). Depression and cardiovascular disease: Epidemiological
evidence on their linking mechanisms. Neuroscience & Biobehavioral Reviews,
25, 25. doi:http://dx.doi.org/10.1016/j.neubiorev.2016.07.003
Penninx, B. W. (2017). Depression and cardiovascular disease: Epidemiological
evidence on their linking mechanisms. Neurosci Biobehav Rev, 74(Pt B), 277-
286. doi:10.1016/j.neubiorev.2016.07.003
Penninx, B. W., Guralnik, J. M., Mendes de Leon, C. F., Pahor, M., Visser, M., Corti, M.
C., & Wallace, R. B. (1998). Cardiovascular events and mortality in newly and
chronically depressed persons > 70 years of age. The American Journal of
Cardiology, 81(8), 988-994.
Penninx, B. W. J. H., Milaneschi, Y., Lamers, F., & Vogelzangs, N. (2013).
Understanding the somatic consequences of depression: Biological mechanisms
and the role of depression symptom profile. BMC medicine, 11 (1) (no
pagination)(129).
Perlman, W. R., Webster, M. J., Kleinman, J. E., & Weickert, C. S. (2004). Reduced
glucocorticoid and estrogen receptor alpha messenger ribonucleic acid levels in

475
the amygdala of patients with major mental illness. Biological Psychiatry, 56(11),
844-852.
Perrin, A. J., Horowitz, M. A., Roelofs, J., Zunszain, P. A., & Pariante, C. M. (2019).
Glucocorticoid Resistance: Is It a Requisite for Increased Cytokine Production in
Depression? A Systematic Review and Meta-Analysis. Front Psychiatry, 10, 423.
doi:10.3389/fpsyt.2019.00423
Perroud, N., Paoloni-Giacobino, A., Prada, P., Olie, E., Salzmann, A., Nicastro, R., . . .
Malafosse, A. (2011). Increased methylation of glucocorticoid receptor gene
(NR3C1) in adults with a history of childhood maltreatment: a link with the severity
and type of trauma. Translational Psychiatry, 1, e59. doi:10.1038/tp.2011.60
Persoons, P., Vermeire, S., Demyttenaere, K., Fischler, B., Vandenberghe, J., Van
Oudenhove, L., . . . Rutgeerts, P. (2005). The impact of major depressive disorder
on the short- and long-term outcome of Crohn's disease treatment with infliximab.
Alimentary Pharmacology & Therapeutics, 22(2), 101-110. doi:10.1111/j.1365-
2036.2005.02535.x
Pitchot, W., Wauthy, J., Hansenne, M., Pinto, E., Fuchs, S., Reggers, J., . . . Ansseau,
M. J. P. (2002). Hormonal and temperature responses to the 5-HT 1A receptor
agonist flesinoxan in normal volunteers. 164(1), 27-32.
Pizzagalli, D. (2011). Frontocingulate dysfunction in depression: toward biomarkers of
treatment response. Neuropsychopharmacology, 36(1), 183-206.
doi:10.1038/npp.2010.166
Pizzagalli, D., Pascual-Marqui, R. D., Nitschke, J. B., Oakes, T. R., Larson, C. L.,
Abercrombie, H. C., . . . Davidson, R. J. (2001). Anterior cingulate activity as a
predictor of degree of treatment response in major depression: evidence from
brain electrical tomography analysis. Am J Psychiatry, 158(3), 405-415.
doi:10.1176/appi.ajp.158.3.405
Pletcher, M. J., & Moran, A. E. (2017). Cardiovascular Risk Assessment. Medical Clinics
of North America, 101(4), 673-688. doi:10.1016/j.mcna.2017.03.002

476
Plitas, G., & Rudensky, A. Y. (2016). Regulatory T Cells: Differentiation and Function.
Cancer Immunol Res, 4(9), 721-725. doi:10.1158/2326-6066.cir-16-0193
Polk, D. E., Cohen, S., Doyle, W. J., Skoner, D. P., & Kirschbaum, C. (2005). State and
trait affect as predictors of salivary cortisol in healthy adults.
Psychoneuroendocrinology, 30(3), 261-272.
doi:10.1016/j.psyneuen.2004.08.004
Polsky, D., Doshi, J. A., Marcus, S., Oslin, D., Rothbard, A., Thomas, N., & Thompson,
C. L. (2005). Long-term risk for depressive symptoms after a medical diagnosis.
Arch Intern Med, 165(11), 1260-1266. doi:10.1001/archinte.165.11.1260
Poole, L., Kidd, T., Ronaldson, A., Leigh, E., Jahangiri, M., & Steptoe, A. (2016).
Depression 12-months after coronary artery bypass graft is predicted by cortisol
slope over the day. Psychoneuroendocrinology, 71, 155-158.
doi:10.1016/j.psyneuen.2016.05.025
Porcelli, S., Fabbri, C., & Serretti, A. (2012). Meta-analysis of serotonin transporter gene
promoter polymorphism (5-HTTLPR) association with antidepressant efficacy.
Eur Neuropsychopharmacol, 22(4), 239-258.
doi:10.1016/j.euroneuro.2011.10.003
Portella, M. J., Harmer, C. J., Flint, J., Cowen, P., & Goodwin, G. M. (2005). Enhanced
early morning salivary cortisol in neuroticism. Am J Psychiatry, 162(4), 807-809.
doi:10.1176/appi.ajp.162.4.807
Porter, R. J., Gallagher, P., Watson, S., & Young, A. H. (2004). Corticosteroid-serotonin
interactions in depression: a review of the human evidence.
Psychopharmacology (Berl), 173(1-2), 1-17. doi:10.1007/s00213-004-1774-1
Potier, F., Degryse, J. M., & de Saint-Hubert, M. (2018). Impact of caregiving for older
people and pro-inflammatory biomarkers among caregivers: a systematic review.
Aging-Clinical & Experimental Research, 30(2), 119-132. doi:10.1007/s40520-
017-0765-0

477
Power, C., Thomas, C., Li, L., & Hertzman, C. (2012). Childhood psychosocial adversity
and adult cortisol patterns. British Journal of Psychiatry, 201(3), 199-206.
doi:10.1192/bjp.bp.111.096032
Pratt, L. A., Druss, B. G., Manderscheid, R. W., & Walker, E. R. (2016). Excess mortality
due to depression and anxiety in the United States: results from a nationally
representative survey. General Hospital Psychiatry, 39, 39-45.
doi:10.1016/j.genhosppsych.2015.12.003
Pratt, W. B. (1993). The role of heat shock proteins in regulating the function, folding,
and trafficking of the glucocorticoid receptor. Journal of Biological Chemistry,
268(29), 21455-21458.
Presman, D. M., Hoijman, E., Ceballos, N. R., Galigniana, M. D., & Pecci, A. (2006).
Melatonin inhibits glucocorticoid receptor nuclear translocation in mouse
thymocytes. Endocrinology, 147(11), 5452-5459. doi:10.1210/en.2006-0252
Price, L. H., Malison, R. T., McDougle, C. J., & Pelton, G. H. (1996). Antiglucocorticoids
as Treatments for Depression : Rationale for Use and Therapeutic Potential. CNS
Drugs, 5(5), 311-320. doi:10.2165/00023210-199605050-00001
Pruessner, J. C., Baldwin, M. W., Dedovic, K., Renwick, R., Mahani, N. K., Lord, C., . . .
Lupien, S. (2005). Self-esteem, locus of control, hippocampal volume, and
cortisol regulation in young and old adulthood. NeuroImage, 28(4), 815-826.
doi:10.1016/j.neuroimage.2005.06.014
Pruessner, J. C., Kirschbaum, C., Meinlschmid, G., & Hellhammer, D. H. (2003a). Two
formulas for computation of the area under the curve represent measures of total
hormone concentration versus time-dependent change.
Psychoneuroendocrinology, 28(7), 916-931.
Pruessner, M., Hellhammer, D. H., Pruessner, J. C., & Lupien, S. J. (2003b). Self-
reported depressive symptoms and stress levels in healthy young men:
associations with the cortisol response to awakening. Psychosomatic Medicine,
65(1), 92-99.

478
Pruessner, M., Pruessner, J. C., Hellhammer, D. H., Bruce Pike, G., & Lupien, S. J.
(2007). The associations among hippocampal volume, cortisol reactivity, and
memory performance in healthy young men. Psychiatry Res, 155(1), 1-10.
doi:10.1016/j.pscychresns.2006.12.007
Pryce, C. R., & Fontana, A. (2016). Depression in autoimmune diseases. In
Inflammation-Associated Depression: Evidence, Mechanisms and Implications
(pp. 139-154): Springer.
Pugh, C. R., Nguyen, K. T., Gonyea, J. L., Fleshner, M., Wakins, L. R., Maier, S. F., &
Rudy, J. W. (1999). Role of interleukin-1 beta in impairment of contextual fear
conditioning caused by social isolation. Behavioural Brain Research, 106(1-2),
109-118.
Qi, X. R., Kamphuis, W., Wang, S., Wang, Q., Lucassen, P. J., Zhou, J. N., & Swaab, D.
F. (2013). Aberrant stress hormone receptor balance in the human prefrontal
cortex and hypothalamic paraventricular nucleus of depressed patients.
Psychoneuroendocrinology, 38(6), 863-870.
doi:10.1016/j.psyneuen.2012.09.014
Quan, N., Avitsur, R., Stark, J. L., He, L., Lai, W., Dhabhar, F., & Sheridan, J. F. (2003).
Molecular mechanisms of glucocorticoid resistance in splenocytes of socially
stressed male mice. J Neuroimmunol, 137(1-2), 51-58.
Quax, R. A., Manenschijn, L., Koper, J. W., Hazes, J. M., Lamberts, S. W., van Rossum,
E. F., & Feelders, R. A. (2013). Glucocorticoid sensitivity in health and disease.
Nat Rev Endocrinol, 9(11), 670-686. doi:10.1038/nrendo.2013.183
Quevedo, K., Doty, J., Roos, L., & Anker, J. J. (2017). The cortisol awakening response
and anterior cingulate cortex function in maltreated depressed versus non-
maltreated depressed youth. Psychoneuroendocrinology, 86, 87-95.
doi:10.1016/j.psyneuen.2017.09.001
Radloff, L. S. (1977). The CES-D scale a self-report depression scale for research in the
general population. Applied Psychological Measurement, 1(3), 385-401.

479
Raison, C. L., Borisov, A. S., Woolwine, B. J., Massung, B., Vogt, G., & Miller, A. H.
(2010). Interferon-alpha effects on diurnal hypothalamic-pituitary-adrenal axis
activity: relationship with proinflammatory cytokines and behavior. Mol
Psychiatry, 15(5), 535-547. doi:10.1038/mp.2008.58
Raison, C. L., Capuron, L., & Miller, A. H. (2006). Cytokines sing the blues: inflammation
and the pathogenesis of depression. Trends in Immunology, 27(1), 24-31.
doi:10.1016/j.it.2005.11.006
Raison, C. L., & Miller, A. H. (2003). When not enough is too much: The role of insufficient
glucocorticoid signaling in the pathophysiology of stress-related disorders.
American Journal of Psychiatry, 160(9), 1554-1565.
Raison, C. L., Rutherford, R. E., Woolwine, B. J., Shuo, C., Schettler, P., Drake, D. F., .
. . Miller, A. H. (2013a). A randomized controlled trial of the tumor necrosis factor
antagonist infliximab for treatment-resistant depression: the role of baseline
inflammatory biomarkers. JAMA Psychiatry, 70(1), 31-41. Retrieved from
http://onlinelibrary.wiley.com/o/cochrane/clcentral/articles/094/CN-
00853094/frame.html
http://archpsyc.jamanetwork.com/data/Journals/PSYCH/926165/yoa120056_31_41.pdf
doi:10.1001/2013.jamapsychiatry.4
Raison, C. L., Rutherford, R. E., Woolwine, B. J., Shuo, C., Schettler, P., Drake, D. F., .
. . Miller, A. H. (2013b). A randomized controlled trial of the tumor necrosis factor
antagonist infliximab for treatment-resistant depression: the role of baseline
inflammatory biomarkers. JAMA Psychiatry, 70(1), 31-41.
doi:http://dx.doi.org/10.1001/2013.jamapsychiatry.4
Rajkowska, G., & Stockmeier, C. A. (2013). Astrocyte pathology in major depressive
disorder: Insights from human postmortem brain tissue. Current Drug Targets,
14(11), 1225-1236.
Ramamoorthy, S., Ramamoorthy, J. D., Prasad, P. D., Bhat, G. K., Mahesh, V. B.,
Leibach, F. H., & Ganapathy, V. (1995). Regulation of the human serotonin

480
transporter by interleukin-beta. Biochemical and Biophysical Research
Communications, 216(2), 560-567.
Rangarajan, P. N., Umesono, K., & Evans, R. M. (1992). Modulation of glucocorticoid
receptor function by protein kinase A. Molecular Endocrinology, 6(9), 1451-1457.
doi:10.1210/mend.6.9.1435789
Rao, U., Chen, L. A., Bidesi, A. S., Shad, M. U., Thomas, M. A., & Hammen, C. L. (2010).
Hippocampal changes associated with early-life adversity and vulnerability to
depression. Biological Psychiatry, 67(4), 357-364.
doi:10.1016/j.biopsych.2009.10.017
Rao, U., Ott, G. E., Lin, K., Gertsik, L., & Poland, R. E. (2005). Effect of bupropion on
nocturnal urinary free cortisol and its association with antidepressant response.
J Psychiatr Res, 39(2), 183-190.
Rasmussen, J. N., Chong, A., & Alter, D. A. (2007). Relationship between adherence to
evidence-based pharmacotherapy and long-term mortality after acute myocardial
infarction. Jama, 297(2), 177-186. doi:10.1001/jama.297.2.177
Read, J. R., Sharpe, L., Modini, M., & Dear, B. F. (2017). Multimorbidity and depression:
A systematic review and meta-analysis. Journal of Affective Disorders, 221, 36-
46. doi:10.1016/j.jad.2017.06.009
Rehm, J., Irving, H., Ye, Y., Kerr, W. C., Bond, J., & Greenfield, T. K. (2008). Are lifetime
abstainers the best control group in alcohol epidemiology? On the stability and
validity of reported lifetime abstention. American Journal of Epidemiology, 168(8),
866-871. doi:10.1093/aje/kwn093
Repetti, R. L., Taylor, S. E., & Seeman, T. E. (2002). Risky families: family social
environments and the mental and physical health of offspring. Psychol Bull,
128(2), 330-366.
Ressler, K. J., & Mayberg, H. S. (2007). Targeting abnormal neural circuits in mood and
anxiety disorders: from the laboratory to the clinic. Nature Neuroscience, 10(9),
1116.
481
Rhebergen, D., Korten, N. C., Penninx, B. W., Stek, M. L., van der Mast, R. C., Oude
Voshaar, R., & Comijs, H. C. (2015). Hypothalamic-pituitary-adrenal axis activity
in older persons with and without a depressive disorder.
Psychoneuroendocrinology, 51, 341-350. doi:10.1016/j.psyneuen.2014.10.005
Rhebergen, D., Lamers, F., Spijker, J., de Graaf, R., Beekman, A. T., & Penninx, B. W.
(2012). Course trajectories of unipolar depressive disorders identified by latent
class growth analysis. Psychological Medicine, 42(7), 1383-1396.
doi:10.1017/s0033291711002509
Ribeiro, S. C., Tandon, R., Grunhaus, L., & Greden, J. F. (1993). The DST as a predictor
of outcome in depression: a meta-analysis. Am J Psychiatry, 150(11), 1618-1629.
doi:10.1176/ajp.150.11.1618
Richter, P., Werner, J., Heerlein, A., Kraus, A., & Sauer, H. (1998). On the Validity of the
Beck Depression Inventory. Psychopathology, 31(3), 160-168.
Ridker, P. M., Buring, J. E., Shih, J., Matias, M., & Hennekens, C. H. (1998). Prospective
study of C-reactive protein and the risk of future cardiovascular events among
apparently healthy women. Circulation, 98(8), 731-733.
doi:10.1161/01.cir.98.8.731
Rieckmann, N., Gerin, W., Kronish, I. M., Burg, M. M., Chaplin, W. F., Kong, G., . . .
Davidson, K. W. (2006). Course of depressive symptoms and medication
adherence after acute coronary syndromes: an electronic medication monitoring
study. J Am Coll Cardiol, 48(11), 2218-2222. doi:10.1016/j.jacc.2006.07.063
Rimm, E. B., Giovannucci, E. L., Willett, W. C., Colditz, G. A., Ascherio, A., Rosner, B.,
& Stampfer, M. J. (1991). Prospective study of alcohol consumption and risk of
coronary disease in men. Lancet, 338(8765), 464-468. doi:10.1016/0140-
6736(91)90542-w
Ripke, S., Wray, N. R., Lewis, C. M., Hamilton, S. P., Weissman, M. M., Breen, G., . . .
Sullivan, P. F. (2013). A mega-analysis of genome-wide association studies for
major depressive disorder. Mol Psychiatry, 18(4), 497-511.
doi:10.1038/mp.2012.21

482
Rissanen, A. M. (1979). Familial aggregation of coronary heart disease in a high
incidence area (North Karelia, Finland). Br Heart J, 42(3), 294-303.
Rius-Ottenheim, N., Kromhout, D., Sijtsma, F. P. C., Geleijnse, J. M., & Giltay, E. J.
(2017). Dietary patterns and mental health after myocardial infarction. PLoS One,
12(10), e0186368. doi:10.1371/journal.pone.0186368
Roberti, J. W., Harrington, L. N., & Storch, E. A. (2006). Further psychometric support
for the 10‐item version of the perceived stress scale. Journal of College
Counseling, 9(2), 135-147.
Roca, M., Vives, M., Lopez-Navarro, E., Garcia-Campayo, J., & Gili, M. (2015). Cognitive
impairments and depression: a critical review. Actas Esp Psiquiatr, 43(5), 187-
193.
Roerecke, M., Kaczorowski, J., Tobe, S. W., Gmel, G., Hasan, O. S. M., & Rehm, J.
(2017). The effect of a reduction in alcohol consumption on blood pressure: a
systematic review and meta-analysis. Lancet Public Health, 2(2), e108-e120.
doi:10.1016/s2468-2667(17)30003-8
Rohleder, N. (2014). Stimulation of systemic low-grade inflammation by psychosocial
stress. Psychosomatic Medicine, 76(3), 181-189.
doi:10.1097/psy.0000000000000049
Rohleder, N., Joksimovic, L., Wolf, J. M., & Kirschbaum, C. (2004). Hypocortisolism and
increased glucocorticoid sensitivity of pro-Inflammatory cytokine production in
Bosnian war refugees with posttraumatic stress disorder. Biological Psychiatry,
55(7), 745-751. doi:10.1016/j.biopsych.2003.11.018
Roiser, J. P., Elliott, R., & Sahakian, B. J. (2012). Cognitive mechanisms of treatment in
depression. Neuropsychopharmacology, 37(1), 117-136.
doi:10.1038/npp.2011.183
Romagnani, S. (1999). Th1/Th2 cells. Inflammatory Bowel Diseases, 5(4), 285-294.
Ronaldson, A., Carvalho, L. A., Kostich, K., Lazzarino, A. I., Urbanova, L., & Steptoe, A.
(2018). The effects of six-day SSRI administration on diurnal cortisol secretion in

483
healthy volunteers. Psychopharmacology (Berl), 235(12), 3415-3422.
doi:10.1007/s00213-018-5050-1
Ronaldson, A., Gazali, A. M., Zalli, A., Kaiser, F., Thompson, S. J., Henderson, B., . . .
Carvalho, L. (2015). Increased percentages of regulatory T cells are associated
with inflammatory and neuroendocrine responses to acute psychological stress
and poorer health status in older men and women. Psychopharmacology (Berl).
doi:10.1007/s00213-015-3876-3
Ros, E., Martinez-Gonzalez, M. A., Estruch, R., Salas-Salvado, J., Fito, M., Martinez, J.
A., & Corella, D. (2014). Mediterranean diet and cardiovascular health: Teachings
of the PREDIMED study. Adv Nutr, 5(3), 330s-336s. doi:10.3945/an.113.005389
Rose, G. (1964). FAMILIAL PATTERNS IN ISCHAEMIC HEART DISEASE. Br J Prev
Soc Med, 18, 75-80.
Rosmalen, J. G., Bos, E. H., & de Jonge, P. (2012). Validation of the Long-term
Difficulties Inventory (LDI) and the List of Threatening Experiences (LTE) as
measures of stress in epidemiological population-based cohort studies.
Psychological Medicine, 42(12), 2599-2608. doi:10.1017/s0033291712000608
Ross , R. (1999). Atherosclerosis — An Inflammatory Disease. New England Journal of
Medicine, 340(2), 115-126. doi:doi:10.1056/NEJM199901143400207
Rota, E., Broda, R., Cangemi, L., Migliaretti, G., Paccotti, P., Rosso, C., . . . Portaleone,
P. (2005). Neuroendocrine (HPA axis) and clinical correlates during fluvoxamine
and amitriptyline treatment. Psychiatry Res, 133(2-3), 281-284.
Rothermundt, M., Arolt, V., Fenker, J., Gutbrodt, H., Peters, M., & Kirchner, H. (2001).
Different immune patterns in melancholic and non-melancholic major depression.
Eur Arch Psychiatry Clin Neurosci, 251(2), 90-97.
Royal College of Psychiatrists. (2011). Depression: key facts. Retrieved from
http://www.rcpsych.ac.uk/healthadvice/problemsdisorders/depressionkeyfacts.a
spx

484
Ruberman, W., Weinblatt, E., Goldberg, J. D., & Chaudhary, B. S. (1984). Psychosocial
influences on mortality after myocardial infarction. N Engl J Med, 311(9), 552-
559. doi:10.1056/nejm198408303110902
Rudolf, S., Greggersen, W., Kahl, K. G., Hüppe, M., & Schweiger, U. (2014). Elevated
IL-6 levels in patients with atypical depression but not in patients with typical
depression. Psychiatry Res, 217(1-2), 34-38.
Rudzki, L., Pawlak, D., Pawlak, K., Waszkiewicz, N., Malus, A., Konarzewska, B., . . .
Szulc, A. (2017). Immune suppression of IgG response against dairy proteins in
major depression. BMC Psychiatry, 17(1), 268. doi:10.1186/s12888-017-1431-y
Rugulies, R. (2002). Depression as a predictor for coronary heart disease: a review and
meta-analysis1 1The full text of this article is available via AJPM Online at www.
ajpm-online. net. American Journal of Preventive Medicine, 23(1), 51-61.
Ruhe, H. G., Khoenkhoen, S. J., Ottenhof, K. W., Koeter, M. W., Mocking, R. J., &
Schene, A. H. (2015). Longitudinal effects of the SSRI paroxetine on salivary
cortisol in Major Depressive Disorder. Psychoneuroendocrinology, 52, 261-271.
doi:10.1016/j.psyneuen.2014.10.024
Ruhé, H. G., Mason, N. S., & Schene, A. H. (2007). Mood is indirectly related to
serotonin, norepinephrine and dopamine levels in humans: a meta-analysis of
monoamine depletion studies. Molecular Psychiatry, 12(4), 331.
Ruo, B., Rumsfeld, J. S., Hlatky, M. A., Liu, H., Browner, W. S., & Whooley, M. A. (2003).
Depressive symptoms and health-related quality of life: the Heart and Soul Study.
Jama, 290(2), 215-221. doi:10.1001/jama.290.2.215
Rupprecht, R., Kornhuber, J., Wodarz, N., Lugauer, J., Gobel, C., Haack, D., . . .
Beckmann, H. (1991a). Disturbed glucocorticoid receptor autoregulation and
corticotropin response to dexamethasone in depressives pretreated with
metyrapone. Biological Psychiatry, 29(11), 1099-1109.
Rupprecht, R., Kornhuber, J., Wodarz, N., Lugauer, J., Gobel, C., Riederer, P., &
Beckmann, H. (1991b). Lymphocyte glucocorticoid receptor binding during

485
depression and after clinical recovery. Journal of Affective Disorders, 22(1-2), 31-
35.
Rupprecht, R., Wodarz, N., Kornhuber, J., Wild, K., Schmitz, B., Braner, H. U., . . .
Beckmann, H. (1991c). In vivo and in vitro effects of glucocorticoids on
lymphocyte proliferation in depression. Eur Arch Psychiatry Clin Neurosci,
241(1), 35-40.
Rush, A. J., & Weissenburger, J. E. (1994). Melancholic symptom features and DSM-IV.
Am J Psychiatry, 151(4), 489-498. doi:10.1176/ajp.151.4.489
Russ, T. C., Stamatakis, E., Hamer, M., Starr, J. M., Kivimaki, M., & Batty, G. D. (2012).
Association between psychological distress and mortality: individual participant
pooled analysis of 10 prospective cohort studies. British Medical Journal (Clinical
Research Edition), 345, e4933. doi:10.1136/bmj.e4933
Rutledge, T., Reis, V. A., Linke, S. E., Greenberg, B. H., & Mills, P. J. (2006). Depression
in heart failure: a meta-analytic review of prevalence, intervention effects, and
associations with clinical outcomes. Journal of the American College of
Cardiology, 48(8), 1527-1537.
Ryan, J., Carriere, I., Ritchie, K., Stewart, R., Toulemonde, G., Dartigues, J. F., . . .
Ancelin, M. L. (2008). Late-life depression and mortality: influence of gender and
antidepressant use. British Journal of Psychiatry, 192(1), 12-18.
doi:http://dx.doi.org/10.1192/bjp.bp.107.039164
Rybakowski, J. K., & Twardowska, K. (1999). The dexamethasone/corticotropin-
releasing hormone test in depression in bipolar and unipolar affective illness. J
Psychiatr Res, 33(5), 363-370.
Rybakowski, J. K., Wykretowicz, A., Heymann-Szlachcinska, A., & Wysocki, H. (2006).
Impairment of endothelial function in unipolar and bipolar depression. Biological
Psychiatry, 60(8), 889-891. doi:10.1016/j.biopsych.2006.03.025
Saban, K. L., Mathews, H. L., Bryant, F. B., O'Brien, T. E., & Janusek, L. W. (2012).
Depressive symptoms and diurnal salivary cortisol patterns among female

486
caregivers of stroke survivors. Biol Res Nurs, 14(4), 396-404.
doi:10.1177/1099800412439458
Sagud, M., Pivac, N., Muck-Seler, D., Jakovljevic, M., Mihaljevic-Peles, A., & Korsic, M.
(2002). Effects of sertraline treatment on plasma cortisol, prolactin and thyroid
hormones in female depressed patients. Neuropsychobiology, 45(3), 139-143.
doi:10.1159/000054954
Sahay, A., & Hen, R. (2007). Adult hippocampal neurogenesis in depression. Nature
Neuroscience, 10(9), 1110.
Sakami, S., Nakata, A., Yamamura, T., & Kawamura, N. (2002). Psychological Stress
Increases Human T Cell Apoptosis in vitro. Neuroimmunomodulation, 10(4), 224-
231.
Sallee, F. R., Nesbitt, L., Dougherty, D., Hilal, R., Nandagopal, V. S., & Sethuraman, G.
(1995). Lymphocyte glucocorticoid receptor: predictor of sertraline response in
adolescent major depressive disorder (MDD). Psychopharmacol Bull, 31(2), 339-
345.
Santilli, F., Guagnano, M. T., Vazzana, N., La Barba, S., & Davi, G. (2015). Oxidative
stress drivers and modulators in obesity and cardiovascular disease: from
biomarkers to therapeutic approach. Current Medicinal Chemistry, 22(5), 582-
595.
Santor, D., & Gregus, M. (2006). Eight Decades of Measurement in Depression.
Measurement, 4.
Sapolsky, R. M., Krey, L. C., & McEwen, B. S. (1986). The neuroendocrinology of stress
and aging: the glucocorticoid cascade hypothesis. Endocrine Reviews, 7(3), 284-
301.
Sarubin, N., Nothdurfter, C., Schmotz, C., Wimmer, A. M., Trummer, J., Lieb, M., . . .
Schule, C. (2014). Impact on cortisol and antidepressant efficacy of quetiapine
and escitalopram in depression. Psychoneuroendocrinology, 39, 141-151.
doi:10.1016/j.psyneuen.2013.10.008

487
Sasayama, D., Hori, H., Iijima, Y., Teraishi, T., Hattori, K., Ota, M., . . . Kunugi, H. (2011).
Modulation of cortisol responses to the DEX/CRH test by polymorphisms of the
interleukin-1beta gene in healthy adults. Behavioral & Brain Functions [Electronic
Resource]: BBF, 7, 23. doi:http://dx.doi.org/10.1186/1744-9081-7-23
Saxena, S., Brody, A. L., Ho, M. L., Zohrabi, N., Maidment, K. M., & Baxter, L. R., Jr.
(2003). Differential brain metabolic predictors of response to paroxetine in
obsessive-compulsive disorder versus major depression. Am J Psychiatry,
160(3), 522-532. doi:10.1176/appi.ajp.160.3.522
Schaefer, M., Capuron, L., Friebe, A., Diez-Quevedo, C., Robaeys, G., Neri, S., . . .
Pariante, C. M. (2012). Hepatitis C infection, antiviral treatment and mental
health: A European expert consensus statement. Journal of Hepatology, 57(6),
1379-1390.
Schafer, V., & Bader, K. (2013). Relationship between early-life stress load and sleep in
psychiatric outpatients: a sleep diary and actigraphy study. Stress & Health,
29(3), 177-189. doi:10.1002/smi.2438
Schatzberg, A. F. J. T. W. J. o. B. P. (2015). Anna-Monika Award Lecture, DGPPN
Kongress, 2013: the role of the hypothalamic–pituitary–adrenal (HPA) axis in the
pathogenesis of psychotic major depression. 16(1), 2-11.
Scherrer, J. F., Xian, H., Bucholz, K. K., Eisen, S. A., Lyons, M. J., Goldberg, J., . . .
True, W. R. (2003). A twin study of depression symptoms, hypertension, and
heart disease in middle-aged men. Psychosomatic Medicine, 65(4), 548-557.
Schins, A., Tulner, D., Lousberg, R., Kenis, G., Delanghe, J., Crijns, H. J., . . . Honig, A.
(2005). Inflammatory markers in depressed post-myocardial infarction patients. J
Psychiatr Res, 39(2), 137-144. doi:10.1016/j.jpsychires.2004.05.009
Schipper, H. S., Nuboer, R., Prop, S., van den Ham, H. J., de Boer, F. K., Kesmir, Ç., . .
. Kalkhoven, E. (2012). Systemic inflammation in childhood obesity: circulating
inflammatory mediators and activated CD14++ monocytes. Diabetologia, 55(10),
2800-2810. doi:10.1007/s00125-012-2641-y

488
Schlaepfer, T. E., Cohen, M. X., Frick, C., Kosel, M., Brodesser, D., Axmacher, N., . . .
Sturm, V. (2008). Deep brain stimulation to reward circuitry alleviates anhedonia
in refractory major depression. Neuropsychopharmacology, 33(2), 368-377.
doi:10.1038/sj.npp.1301408
Schlechte, J. A., & Sherman, B. (1985). Lymphocyte glucocorticoid receptor binding in
depressed patients with hypercortisolemia. Psychoneuroendocrinology, 10(4),
469-474.
Schleifer, S. J., Keller, S. E., Meyerson, A. T., Raskin, M. J., Davis, K. L., & Stein, M.
(1984). Lymphocyte function in major depressive disorder. Arch Gen Psychiatry,
41(5), 484-486.
Schlotz, W., Hellhammer, J., Schulz, P., & Stone, A. A. (2004). Perceived work overload
and chronic worrying predict weekend-weekday differences in the cortisol
awakening response. Psychosomatic Medicine, 66(2), 207-214.
Schmaal, L., Veltman, D. J., van Erp, T. G., Samann, P. G., Frodl, T., Jahanshad, N., . .
. Hibar, D. P. (2016). Subcortical brain alterations in major depressive disorder:
findings from the ENIGMA Major Depressive Disorder working group. Mol
Psychiatry, 21(6), 806-812. doi:10.1038/mp.2015.69
Schmid, D. A., Wichniak, A., Uhr, M., Ising, M., Brunner, H., Held, K., . . . Steiger, A.
(2006). Changes of sleep architecture, spectral composition of sleep EEG, the
nocturnal secretion of cortisol, ACTH, GH, prolactin, melatonin, ghrelin, and
leptin, and the DEX-CRH test in depressed patients during treatment with
mirtazapine. Neuropsychopharmacology, 31(4), 832.
Schoevers, R. A., Geerlings, M. I., Deeg, D. J., Holwerda, T. J., Jonker, C., & Beekman,
A. T. (2009). Depression and excess mortality: evidence for a dose response
relation in community living elderly. International Journal of Geriatric Psychiatry,
24(2), 169-176. doi:10.1002/gps.2088
Schuch, F., Vancampfort, D., Firth, J., Rosenbaum, S., Ward, P., Reichert, T., . . . Stubbs,
B. (2017). Physical activity and sedentary behavior in people with major

489
depressive disorder: A systematic review and meta-analysis. Journal of Affective
Disorders, 210, 139-150. doi:10.1016/j.jad.2016.10.050
Schuld, A., Mullington, J., Friess, E., Hermann, D. M., Galanos, C., Holsboer, F., &
Pollmacher, T. (2000). Changes in dehydroepiandrosterone (DHEA) and DHEA-
sulfate plasma levels during experimental endotoxinemia in healthy volunteers.
Journal of Clinical Endocrinology & Metabolism, 85(12), 4624-4629.
doi:10.1210/jcem.85.12.7055
Schuld, A., Schmid, D. A., Haack, M., Holsboer, F., Friess, E., & Pollmacher, T. (2003).
Hypothalamo-pituitary-adrenal function in patients with depressive disorders is
correlated with baseline cytokine levels, but not with cytokine responses to
hydrocortisone. J Psychiatr Res, 37(6), 463-470.
Schule, C., Baghai, T., Zwanzger, P., Ella, R., Eser, D., Padberg, F., . . . Rupprecht, R.
(2003). Attenuation of hypothalamic-pituitary-adrenocortical hyperactivity in
depressed patients by mirtazapine. Psychopharmacology (Berl), 166(3), 271-
275. doi:10.1007/s00213-002-1356-z
Schüle, C., Baghai, T. C., Eser, D., Schwarz, M., Bondy, B., & Rupprecht, R. (2009).
Effects of mirtazapine on dehydroepiandrosterone-sulfate and cortisol plasma
concentrations in depressed patients. J Psychiatr Res, 43(5), 538-545.
Schule, C., Baghai, T. C., Eser, D., Zwanzger, P., Jordan, M., Buechs, R., & Rupprecht,
R. (2006). Time course of hypothalamic-pituitary-adrenocortical axis activity
during treatment with reboxetine and mirtazapine in depressed patients.
Psychopharmacology (Berl), 186(4), 601-611. doi:10.1007/s00213-006-0382-7
Schulz, R., Drayer, R. A., & Rollman, B. L. (2002). Depression as a risk factor for non-
suicide mortality in the elderly. Biological Psychiatry, 52(3), 205-225.
doi:http://dx.doi.org/10.1016/S0006-3223(02)01423-3
Seddiki, N., Santner-Nanan, B., Martinson, J., Zaunders, J., Sasson, S., Landay, A., . . .
Nanan, R. (2006). Expression of interleukin (IL)-2 and IL-7 receptors
discriminates between human regulatory and activated T cells. Journal of
Experimental Medicine, 203(7), 1693-1700.

490
Seldenrijk, A., van Hout, H. P., van Marwijk, H. W., de Groot, E., Gort, J., Rustemeijer,
C., . . . Penninx, B. W. J. B. p. (2011). Depression, anxiety, and arterial stiffness.
69(8), 795-803.
Seldenrijk, A., Vogelzangs, N., van Hout, H. P., van Marwijk, H. W., Diamant, M., &
Penninx, B. W. J. J. o. p. r. (2010). Depressive and anxiety disorders and risk of
subclinical atherosclerosis: findings from the Netherlands Study of Depression
and Anxiety (NESDA). 69(2), 203-210.
Selye, H. (1998). A syndrome produced by diverse nocuous agents. 1936. Journal of
Neuropsychiatry & Clinical Neurosciences, 10(2), 230-231.
doi:10.1176/jnp.10.2.230a
Sephton, S. E., Dhabhar, F. S., Keuroghlian, A. S., Giese-Davis, J., McEwen, B. S.,
Ionan, A. C., & Spiegel, D. (2009). Depression, cortisol, and suppressed cell-
mediated immunity in metastatic breast cancer. Brain, behavior, and immunity,
23(8), 1148-1155. doi:http://dx.doi.org/10.1016/j.bbi.2009.07.007
Serebruany, V. L., Glassman, A. H., Malinin, A. I., Sane, D. C., Finkel, M. S., Krishnan,
R. R., . . . O'Connor, C. M. (2003). Enhanced platelet/endothelial activation in
depressed patients with acute coronary syndromes: evidence from recent clinical
trials. Blood Coagul Fibrinolysis, 14(6), 563-567.
doi:10.1097/01.mbc.0000061336.06975.52
Serretti, A., Calati, R., Mandelli, L., & De Ronchi, D. (2006). Serotonin transporter gene
variants and behavior: a comprehensive review. Current Drug Targets, 7(12),
1659-1669.
Serretti, A., Kato, M., De Ronchi, D., & Kinoshita, T. (2007). Meta-analysis of serotonin
transporter gene promoter polymorphism (5-HTTLPR) association with selective
serotonin reuptake inhibitor efficacy in depressed patients. Mol Psychiatry, 12(3),
247-257. doi:10.1038/sj.mp.4001926
Shadrina, M., Bondarenko, E. A., & Slominsky, P. A. (2018). Genetics Factors in Major
Depression Disease. Front Psychiatry, 9, 334. doi:10.3389/fpsyt.2018.00334

491
Shamseddeen, W., Asarnow, J. R., Clarke, G., Vitiello, B., Wagner, K. D., Birmaher, B.,
. . . Brent, D. A. (2011). Impact of physical and sexual abuse on treatment
response in the Treatment of Resistant Depression in Adolescent Study
(TORDIA). Journal of the American Academy of Child & Adolescent Psychiatry,
50(3), 293-301. doi:10.1016/j.jaac.2010.11.019
Shang, Y. X., Ding, W. Q., Qiu, H. Y., Zhu, F. P., Yan, S. Z., & Wang, X. L. (2014).
Association of depression with inflammation in hospitalized patients of
myocardial infarction. Pak J Med Sci, 30(4), 692-697.
Shaw, L. J., Bugiardini, R., & Merz, C. N. (2009). Women and ischemic heart disease:
evolving knowledge. J Am Coll Cardiol, 54(17), 1561-1575.
doi:10.1016/j.jacc.2009.04.098
Shen, X., Reus, L. M., Cox, S. R., Adams, M. J., Liewald, D. C., Bastin, M. E., . . .
McIntosh, A. M. (2017). Subcortical volume and white matter integrity
abnormalities in major depressive disorder: findings from UK Biobank imaging
data. Sci Rep, 7(1), 5547. doi:10.1038/s41598-017-05507-6
Sher, L., Oquendo, M. A., Burke, A. K., Cooper, T. B., & Mann, J. J. (2013). Combined
dexamethasone suppression-corticotrophin-releasing hormone stimulation test
in medication-free major depression and healthy volunteers. Journal of Affective
Disorders, 151(3), 1108-1112. doi:10.1016/j.jad.2013.06.049
Shi, Y., Devadas, S., Greeneltch, K. M., Yin, D., Allan Mufson, R., & Zhou, J.-n. (2003).
Stressed to death: Implication of lymphocyte apoptosis for
psychoneuroimmunology. Brain, behavior, and immunity, 17(1), 18-26.
doi:http://dx.doi.org/10.1016/S0889-1591(02)00062-4
Shimbo, D., Chaplin, W. F., Crossman, D., Haas, D., & Davidson, K. W. (2005). Role of
Depression and Inflammation in Incident Coronary Heart Disease Events. The
American Journal of Cardiology, 96(7), 1016-1021.
doi:http://dx.doi.org/10.1016/j.amjcard.2005.05.064
Shimbo, D., Child, J., Davidson, K., Geer, E., Osende, J. I., Reddy, S., . . . Badimon, J.
J. (2002). Exaggerated serotonin-mediated platelet reactivity as a possible link in

492
depression and acute coronary syndromes. The American Journal of Cardiology,
89(3), 331-333.
Shimbo, D., Rieckmann, N., & Paulino, R. (2006). Relation between C reactive protein
and depression remission status in patients presenting with acute coronary
syndrome. Heart, 92(9), 1316-1318. doi:10.1136/hrt.2005.075861
Sibille, E., & French, B. (2013). Biological substrates underpinning diagnosis of major
depression. Int J Neuropsychopharmacol, 16(8), 1893-1909.
doi:10.1017/s1461145713000436
Sies, H. (2015). Oxidative stress: a concept in redox biology and medicine. Redox Biol,
4, 180-183. doi:10.1016/j.redox.2015.01.002
Silverman, M. N., & Sternberg, E. M. (2012). Glucocorticoid regulation of inflammation
and its functional correlates: from HPA axis to glucocorticoid receptor
dysfunction. Ann N Y Acad Sci, 1261, 55-63. doi:10.1111/j.1749-
6632.2012.06633.x
Simmons, N. E., Do, H. M., Lipper, M. H., & Laws Jr, E. R. (2000). Cerebral atrophy in
Cushing’s disease. Surgical Neurology, 53(1), 72-76.
Simmons, W. K., Burrows, K., Avery, J. A., Kerr, K. L., Taylor, A., Bodurka, J., . . .
Drevets, W. C. (2018). Appetite changes reveal depression subgroups with
distinct endocrine, metabolic, and immune states. Mol Psychiatry.
doi:10.1038/s41380-018-0093-6
Sjogren, E., Leanderson, P., & Kristenson, M. (2006). Diurnal saliva cortisol levels and
relations to psychosocial factors in a population sample of middle-aged Swedish
men and women. International Journal of Behavioral Medicine, 13(3), 193-200.
doi:10.1207/s15327558ijbm1303_2
Slavich, G. M., & Irwin, M. R. (2014). From stress to inflammation and major depressive
disorder: a social signal transduction theory of depression. Psychol Bull, 140(3),
774-815. doi:10.1037/a0035302
Smarr, K. L., & Keefer, A. L. (2011). Measures of depression and depressive symptoms:
Beck Depression Inventory‐II (BDI‐II), Center for Epidemiologic Studies

493
Depression Scale (CES‐D), Geriatric Depression Scale (GDS), Hospital Anxiety
and Depression Scale (HADS), and Patient Health Questionnaire‐9 (PHQ‐9).
Arthritis care & research, 63(S11), S454-S466.
Smith, N., Lam, D., Bifulco, A., & Checkley, S. (2002). Childhood Experience of Care
and Abuse Questionnaire (CECA.Q). Validation of a screening instrument for
childhood adversity in clinical populations. Soc Psychiatry Psychiatr Epidemiol,
37(12), 572-579. doi:10.1007/s00127-002-0589-9
Smith, S. M., & Vale, W. W. (2006). The role of the hypothalamic-pituitary-adrenal axis
in neuroendocrine responses to stress. Dialogues Clin Neurosci, 8(4), 383-395.
Smoak, K. A., & Cidlowski, J. A. (2004). Mechanisms of glucocorticoid receptor signaling
during inflammation. Mech Ageing Dev, 125(10-11), 697-706.
doi:10.1016/j.mad.2004.06.010
Smolen, J. S., Weinblatt, M. E., Sheng, S., Zhuang, Y., & Hsu, B. (2014). Sirukumab, a
human anti-interleukin-6 monoclonal antibody: a randomised, 2-part (proof-of-
concept and dose-finding), phase II study in patients with active rheumatoid
arthritis despite methotrexate therapy. Ann Rheum Dis, 73(9), 1616-1625.
doi:10.1136/annrheumdis-2013-205137
Smyth, G. P., Stapleton, P. P., Freeman, T. A., Concannon, E. M., Mestre, J. R., Duff,
M., . . . Daly, J. M. (2004). Glucocorticoid pretreatment induces cytokine
overexpression and nuclear factor-κB activation in macrophages. Journal of
Surgical Research, 116(2), 253-261.
Snijders, G., Schiweck, C., Mesman, E., Grosse, L., De Wit, H., Nolen, W. A., . . .
Hillegers, M. H. J. (2016). A dynamic course of T cell defects in individuals at risk
for mood disorders. Brain, Behavior, & Immunity, 58, 11-17.
doi:10.1016/j.bbi.2016.05.007
Sobhani, K., Nieves Castro, D. K., Fu, Q., Gottlieb, R. A., Van Eyk, J. E., & Noel Bairey
Merz, C. (2018). Sex differences in ischemic heart disease and heart failure
biomarkers. Biol Sex Differ, 9(1), 43. doi:10.1186/s13293-018-0201-y

494
Sofi, F., Macchi, C., Abbate, R., Gensini, G. F., & Casini, A. (2014). Mediterranean diet
and health status: an updated meta-analysis and a proposal for a literature-based
adherence score. Public Health Nutr, 17(12), 2769-2782.
doi:10.1017/s1368980013003169
Sommershof, A., Aichinger, H., Engler, H., Adenauer, H., Catani, C., Boneberg, E. M., .
. . Kolassa, I. T. (2009). Substantial reduction of naive and regulatory T cells
following traumatic stress. Brain, Behavior, & Immunity, 23(8), 1117-1124.
doi:10.1016/j.bbi.2009.07.003
Spath-Schwalbe, E., Hansen, K., Schmidt, F., Schrezenmeier, H., Marshall, L., Burger,
K., . . . Born, J. (1998). Acute effects of recombinant human interleukin-6 on
endocrine and central nervous sleep functions in healthy men. Journal of Clinical
Endocrinology & Metabolism, 83(5), 1573-1579. doi:10.1210/jcem.83.5.4795
Spencer, R. L., Kim, P. J., Kalman, B. A., & Cole, M. A. (1998). Evidence for
mineralocorticoid receptor facilitation of glucocorticoid receptor-dependent
regulation of hypothalamic-pituitary-adrenal axis activity. Endocrinology, 139(6),
2718-2726. doi:10.1210/endo.139.6.6029
Spiga, F., Walker, J. J., Terry, J. R., & Lightman, S. L. (2014). HPA axis-rhythms. Compr
Physiol, 4(3), 1273-1298. doi:10.1002/cphy.c140003
Spijker, A. T., & Van Rossum, E. F. C. (2012). Glucocorticoid sensitivity in mood
disorders. Neuroendocrinology, 95(3), 179-186.
Spijker, S., Van Zanten, J. S., De Jong, S., Penninx, B. W., van Dyck, R., Zitman, F. G.,
. . . Hoogendijk, W. J. (2010). Stimulated gene expression profiles as a blood
marker of major depressive disorder. Biological Psychiatry, 68(2), 179-186.
doi:10.1016/j.biopsych.2010.03.017
Spitzer, C., Otte, C., Kuehl, L. K., May, A., Schultebraucks, K., Hellmann-Regen, J., &
Wingenfeld, K. (2018). The dexamethasone corticotropin releasing hormone test
in healthy and depressed women with and without childhood adversity.
Psychoneuroendocrinology, 87, 147-151. doi:10.1016/j.psyneuen.2017.10.016

495
Stalder, T., Kirschbaum, C., Kudielka, B. M., Adam, E. K., Pruessner, J. C., Wust, S., . .
. Clow, A. (2016). Assessment of the cortisol awakening response: Expert
consensus guidelines. Psychoneuroendocrinology, 63, 414-432.
doi:10.1016/j.psyneuen.2015.10.010
Starr, L. R., Dienes, K., Li, Y. I., & Shaw, Z. A. (2019). Chronic stress exposure, diurnal
cortisol slope, and implications for mood and fatigue: Moderation by multilocus
HPA-Axis genetic variation. Psychoneuroendocrinology, 100, 156-163.
doi:10.1016/j.psyneuen.2018.10.003
Stavrakakis, N., de Jonge, P., Ormel, J., & Oldehinkel, A. J. (2012). Bidirectional
prospective associations between physical activity and depressive symptoms.
The TRAILS Study. Journal of Adolescent Health, 50(5), 503-508.
doi:10.1016/j.jadohealth.2011.09.004
Steffick, D. E. (2000). Documentation of affective functioning measures in the Health and
Retirement Study. Retrieved from
http://hrsonline.isr.umich.edu/sitedocs/userg/dr-005.pdf
Stepanichev, M., Dygalo, N. N., Grigoryan, G., Shishkina, G. T., & Gulyaeva, N. (2014).
Rodent Models of Depression: Neurotrophic and Neuroinflammatory Biomarkers.
Biomed Res Int, 2014, 20. doi:10.1155/2014/932757
Steptoe, A. (2007). Depression and Physical Illness (A. Steptoe Ed.). Cambridge:
Cambridge University Press.
Steptoe, A., Breeze, E., Banks, J., & Nazroo, J. (2013). Cohort profile: the English
longitudinal study of ageing. International Journal of Epidemiology, 42(6), 1640-
1648. doi:10.1093/ije/dys168
Steptoe, A., Cropley, M., Griffith, J. W., & Kirschbaum, C. (2000). Job strain and anger
expression predict early morning elevations in salivary cortisol. Psychosomatic
Medicine, 62(2), 286-292.
Steptoe, A., & Kivimaki, M. (2013). Stress and cardiovascular disease: an update on
current knowledge. Annual Review of Public Health, 34, 337-354.
doi:10.1146/annurev-publhealth-031912-114452

496
Stetler, C., & Miller, G. E. (2011). Depression and hypothalamic-pituitary-adrenal
activation: a quantitative summary of four decades of research. Psychosomatic
Medicine, 73(2), 114-126.
Stetler, C., & Miller, G. E. (2005). Blunted cortisol response to awakening in mild to
moderate depression: regulatory influences of sleep patterns and social contacts.
J Abnorm Psychol, 114(4), 697-705. doi:10.1037/0021-843x.114.4.697
Stewart, J. C., Rand, K. L., Muldoon, M. F., & Kamarck, T. W. (2009). A prospective
evaluation of the directionality of the depression-inflammation relationship. Brain,
Behavior, & Immunity, 23(7), 936-944. doi:10.1016/j.bbi.2009.04.011
Steyers, C. M., 3rd, & Miller, F. J., Jr. (2014). Endothelial dysfunction in chronic
inflammatory diseases. Int J Mol Sci, 15(7), 11324-11349.
doi:10.3390/ijms150711324
Strawbridge, R., Arnone, D., Danese, A., Papadopoulos, A., Herane Vives, A., & Cleare,
A. (2015). Inflammation and clinical response to treatment in depression: A meta-
analysis. European Neuropsychopharmacology, 25(10), 1532-1543.
doi:http://dx.doi.org/10.1016/j.euroneuro.2015.06.007
Suarez, E. C., Lewis, J. G., Krishnan, R. R., & Young, K. H. (2004). Enhanced expression
of cytokines and chemokines by blood monocytes to in vitro lipopolysaccharide
stimulation are associated with hostility and severity of depressive symptoms in
healthy women. Psychoneuroendocrinology, 29(9), 1119-1128.
doi:10.1016/j.psyneuen.2004.01.002
Subramaniam, A., LoPilato, A., & Walker, E. F. (2019). Psychotropic medication effects
on cortisol: Implications for research and mechanisms of drug action.
Schizophrenia Research. doi:10.1016/j.schres.2019.06.023
Sukoff Rizzo, S. J., Neal, S. J., Hughes, Z. A., Beyna, M., Rosenzweig-Lipson, S., Moss,
S. J., & Brandon, N. J. (2012). Evidence for sustained elevation of IL-6 in the
CNS as a key contributor of depressive-like phenotypes. Transl Psychiatry
Psychiatry, 2, e199. doi:http://dx.doi.org/10.1038/tp.2012.120

497
Suliga, E., Kozieł, D., Ciesla, E., Rebak, D., Głuszek-Osuch, M., Naszydłowska, E., &
Głuszek, S. (2019). The Consumption of Alcoholic Beverages and the Prevalence
of Cardiovascular Diseases in Men and Women: A Cross-Sectional Study.
Nutrients, 11(6), 1318. doi:10.3390/nu11061318
Surguladze, S., Brammer, M. J., Keedwell, P., Giampietro, V., Young, A. W., Travis, M.
J., . . . Phillips, M. L. (2005). A differential pattern of neural response toward sad
versus happy facial expressions in major depressive disorder. Biological
Psychiatry, 57(3), 201-209. doi:10.1016/j.biopsych.2004.10.028
Surtees, P. G., Wainwright, N. W., Boekholdt, S. M., Luben, R. N., Wareham, N. J., &
Khaw, K. T. (2008a). Major depression, C-reactive protein, and incident ischemic
heart disease in healthy men and women. Psychosomatic Medicine, 70(8), 850-
855. doi:10.1097/PSY.0b013e318183acd5
Surtees, P. G., Wainwright, N. W., Luben, R. N., Wareham, N. J., Bingham, S. A., &
Khaw, K. T. (2008b). Depression and ischemic heart disease mortality: evidence
from the EPIC-Norfolk United Kingdom prospective cohort study. Am J
Psychiatry, 165(4), 515-523. doi:10.1176/appi.ajp.2007.07061018
Surtees, P. G., Wainwright, N. W., Willis-Owen, S. A., Luben, R., Day, N. E., & Flint, J.
(2006). Social adversity, the serotonin transporter (5-HTTLPR) polymorphism
and major depressive disorder. Biological Psychiatry, 59(3), 224-229.
doi:10.1016/j.biopsych.2005.07.014
Sutcigil, L., Oktenli, C., Musabak, U., Bozkurt, A., Cansever, A., Uzun, O., . . . Ozsahin,
A. (2008). Pro-and anti-inflammatory cytokine balance in major depression: effect
of sertraline therapy. Clinical and Developmental Immunology, 2007.
Sutcigil, L., Oktenli, C., Musabak, U., Bozkurt, A., Cansever, A., Uzun, O., . . . Sengul,
A. (2007). Pro- and anti-inflammatory cytokine balance in major depression:
effect of sertraline therapy. Clinical & Developmental Immunology, 2007, 76396.
doi:http://dx.doi.org/10.1155/2007/76396
Suzuki, A., Poon, L., Papadopoulos, A. S., Kumari, V., & Cleare, A. J. (2014). Long term
effects of childhood trauma on cortisol stress reactivity in adulthood and

498
relationship to the occurrence of depression. Psychoneuroendocrinology, 50,
289-299. doi:10.1016/j.psyneuen.2014.09.007
Suzuki, H., Savitz, J., Kent Teague, T., Gandhapudi, S. K., Tan, C., Misaki, M., . . .
Bodurka, J. (2017). Altered populations of natural killer cells, cytotoxic T
lymphocytes, and regulatory T cells in major depressive disorder: Association
with sleep disturbance. Brain, Behavior, & Immunity, 66, 193-200.
doi:10.1016/j.bbi.2017.06.011
Szepietowski, J. C., Nilganuwong, S., Wozniacka, A., Kuhn, A., Nyberg, F., van
Vollenhoven, R. F., . . . van Hartingsveldt, B. (2013). Phase I, randomized,
double‐blind, placebo‐controlled, multiple intravenous, dose‐ascending study of
sirukumab in cutaneous or systemic lupus erythematosus. Arthritis &
Rheumatism, 65(10), 2661-2671.
Szuster-Ciesielska, A., Słotwińska, M., Stachura, A., Marmurowska-Michałowska, H.,
Dubas-Ślemp, H., Bojarska-Junak, A., & Kandefer-Szerszeń, M. (2008).
Accelerated apoptosis of blood leukocytes and oxidative stress in blood of
patients with major depression. Progress in Neuro-Psychopharmacology and
Biological Psychiatry, 32(3), 686-694.
doi:http://dx.doi.org/10.1016/j.pnpbp.2007.11.012
Szuster-Ciesielska, A., Tustanowska-Stachura, A., Slotwinska, M., Marmurowska-
Michalowska, H., & Kandefer-Szerszen, M. (2003). In vitro immunoregulatory
effects of antidepressants in healthy volunteers. Polish Journal of Pharmacology,
55(3), 353-362.
Tabara, Y., Ueshima, H., Takashima, N., Hisamatsu, T., Fujiyoshi, A., Zaid, M., . . . Miura,
K. (2016). Mendelian randomization analysis in three Japanese populations
supports a causal role of alcohol consumption in lowering low-density lipid
cholesterol levels and particle numbers. Atherosclerosis, 254, 242-248.
doi:10.1016/j.atherosclerosis.2016.08.021
Tamblyn, R., Bates, D. W., Buckeridge, D. L., Dixon, W., Forster, A. J., Girard, N., . . .
Sheppard, T. (2019). Multinational comparison of new antidepressant use in older

499
adults: a cohort study. BMJ Open, 9(5), e027663. doi:10.1136/bmjopen-2018-
027663
Tanke, M. A., Bosker, F. J., Gladkevich, A. V., Medema, H. M., den Boer, J. A., & Korf,
J. (2008). Lymphocyte glucocorticoid receptor resistance and depressive
symptoms severity: a preliminary report. Progress in Neuro-
Psychopharmacology & Biological Psychiatry, 32(5), 1298-1301.
doi:10.1016/j.pnpbp.2008.04.006
Teng, P. R., Yeh, C. J., Lee, M. C., Lin, H. S., & Lai, T. J. (2013). Change in depressive
status and mortality in elderly persons: results of a national longitudinal study.
Archives of Gerontology & Geriatrics, 56(1), 244-249.
doi:http://dx.doi.org/10.1016/j.archger.2012.08.006
Tesmer, L. A., Lundy, S. K., Sarkar, S., & Fox, D. A. (2008). Th17 cells in human disease.
Immunological Reviews, 223, 87-113. doi:10.1111/j.1600-065X.2008.00628.x
Thabrew, H., de Sylva, S., & Romans, S. E. (2012). Evaluating childhood adversity. Adv
Psychosom Med, 32, 35-57. doi:10.1159/000330002
The British Heart Foundation. (2018). UK Factsheet. Retrieved from
https://www.bhf.org.uk/what-we-do/our-research/heart-statistics
The British Heart Foundation. (2019). Quit smoking. Retrieved from
https://www.bhf.org.uk/informationsupport/risk-factors/smoking
Thombs, B. D., Bass, E. B., Ford, D. E., Stewart, K. J., Tsilidis, K. K., Patel, U., . . .
Ziegelstein, R. C. (2006). Prevalence of depression in survivors of acute
myocardial infarction. Journal of General Internal Medicine, 21(1), 30-38.
doi:10.1111/j.1525-1497.2005.00269.x
Thompson, C., Mezey, G., Corn, T., Franey, C., English, J., Arendt, J., & Checkley, S.
A. (1985). The effect of desipramine upon melatonin and cortisol secretion in
depressed and normal subjects. British Journal of Psychiatry, 147, 389-393.
doi:10.1192/bjp.147.4.389

500
Tilleux, S., & Hermans, E. (2007). Neuroinflammation and regulation of glial glutamate
uptake in neurological disorders. Journal of Neuroscience Research, 85(10),
2059-2070. doi:10.1002/jnr.21325
Toben, C., & Baune, B. T. (2015). An Act of Balance Between Adaptive and Maladaptive
Immunity in Depression: a Role for T Lymphocytes. Journal of Neuroimmune
Pharmacology, 10(4), 595-609. doi:10.1007/s11481-015-9620-2
Toma, A., Pare, G., & Leong, D. P. (2017). Alcohol and Cardiovascular Disease: How
Much is Too Much? Curr Atheroscler Rep, 19(3), 13. doi:10.1007/s11883-017-
0647-0
Tosevski, D. L., & Milovancevic, M. P. (2006). Stressful life events and physical health.
Curr Opin Psychiatry, 19(2), 184-189. doi:10.1097/01.yco.0000214346.44625.57
Trotta, A., Iyegbe, C., Di Forti, M., Sham, P. C., Campbell, D. D., Cherny, S. S., . . .
Fisher, H. L. (2016). Interplay between Schizophrenia Polygenic Risk Score and
Childhood Adversity in First-Presentation Psychotic Disorder: A Pilot Study.
PLoS One, 11(9), e0163319. doi:10.1371/journal.pone.0163319
Trzonkowski, P., Mysliwska, J., Godlewska, B., Szmit, E., Lukaszuk, K., Wieckiewicz, J.,
. . . Mysliwski, A. (2004). Immune consequences of the spontaneous pro-
inflammatory status in depressed elderly patients. Brain, Behavior, & Immunity,
18(2), 135-148. doi:10.1016/s0889-1591(03)00111-9
Tung, J. W., Heydari, K., Tirouvanziam, R., Sahaf, B., Parks, D. R., Herzenberg, L. A., &
Herzenberg, L. A. (2007). Modern flow cytometry: a practical approach. Clin Lab
Med, 27(3), 453-468, v. doi:10.1016/j.cll.2007.05.001
Tyring, S., Gottlieb, A., Papp, K., Gordon, K., Leonardi, C., Wang, A., . . . Krishnan, R.
(2006). Etanercept and clinical outcomes, fatigue, and depression in psoriasis:
double-blind placebo-controlled randomised phase III trial. Lancet, 367(9504),
29-35. doi:10.1016/s0140-6736(05)67763-x
Tyrka, A. R., Price, L. H., Marsit, C., Walters, O. C., & Carpenter, L. L. (2012). Childhood
adversity and epigenetic modulation of the leukocyte glucocorticoid receptor:

501
preliminary findings in healthy adults. PLoS One, 7(1), e30148.
doi:10.1371/journal.pone.0030148
Tyrka, A. R., Wier, L., Price, L. H., Ross, N., Anderson, G. M., Wilkinson, C. W., &
Carpenter, L. L. (2008a). Childhood parental loss and adult hypothalamic-
pituitary-adrenal function. Biological Psychiatry, 63(12), 1147-1154.
doi:10.1016/j.biopsych.2008.01.011
Tyrka, A. R., Wier, L. M., Price, L. H., Rikhye, K., Ross, N. S., Anderson, G. M., . . .
Carpenter, L. L. (2008b). Cortisol and ACTH responses to the Dex/CRH test:
influence of temperament. Hormones & Behavior, 53(4), 518-525.
doi:10.1016/j.yhbeh.2007.12.004
U.S. National Library of Medicine. (2018). ClinicalTrials.gov. Retrieved from
https://clinicaltrials.gov/ct2/show/NCT02657798?term=resist+study&cond=Depr
ession&cntry=GB&rank=1
UCL. (2015). PANDA. Retrieved from https://www.ucl.ac.uk/psychiatry/research/panda
Uguz, F., Akman, C., Kucuksarac, S., & Tufekci, O. (2009). Anti-tumor necrosis factor-
alpha therapy is associated with less frequent mood and anxiety disorders in
patients with rheumatoid arthritis. Psychiatry & Clinical Neurosciences, 63(1), 50-
55. doi:10.1111/j.1440-1819.2008.01905.x
Uher, R. (2013). Inflammatory biomarkers predict differential outcome of depression
treatment with escitalorpam and nortriptyline in the gendep project.
Neuropsychopharmacology, 38, S7. Retrieved from
http://onlinelibrary.wiley.com/o/cochrane/clcentral/articles/272/CN-
01064272/frame.html
http://www.nature.com/npp/journal/v38/n2s/pdf/npp2013278a.pdf
doi:10.1038/npp.2013.278
Ulrike, S., Reinhold, L., & Dirk, H. (2013). Major depression in young girls is related to
altered cortisol awakening response. Eur Child Adolesc Psychiatry, 22(6), 379-
384. doi:10.1007/s00787-012-0371-9

502
Vaccarino, V., Johnson, B. D., Sheps, D. S., Reis, S. E., Kelsey, S. F., Bittner, V., . . .
Bairey Merz, C. N. (2007). Depression, inflammation, and incident cardiovascular
disease in women with suspected coronary ischemia: the National Heart, Lung,
and Blood Institute-sponsored WISE study. Journal of the American College of
Cardiology, 50(21), 2044-2050. doi:10.1016/j.jacc.2007.07.069
Valencia, X., Stephens, G., Goldbach-Mansky, R., Wilson, M., Shevach, E. M., & Lipsky,
P. E. (2006). TNF downmodulates the function of human CD4+CD25hi T-
regulatory cells. Blood, 108(1), 253-261. doi:10.1182/blood-2005-11-4567
Valentino, R., & Commons, K. J. N. (2005). Peptides that fine-tune the serotonin system.
39(1), 1-8.
Valentino, R., & Van Bockstaele, E.J. E.(2008). Convergent regulation of locus coeruleus
activity as an adaptive response to stress. 583(2-3), 194-203.
Valkanova, V., Ebmeier, K. P., & Allan, C. L. (2013). CRP, IL-6 and depression: a
systematic review and meta-analysis of longitudinal studies. Journal of Affective
Disorders, 150(3), 736-744. doi:10.1016/j.jad.2013.06.004
van Amelsfort, J. M., Jacobs, K. M., Bijlsma, J. W., Lafeber, F. P., & Taams, L. S. (2004).
CD4(+)CD25(+) regulatory T cells in rheumatoid arthritis: differences in the
presence, phenotype, and function between peripheral blood and synovial fluid.
Arthritis & Rheumatism, 50(9), 2775-2785. doi:10.1002/art.20499
van Dam, A. M., Brouns, M., Louisse, S., & Berkenbosch, F. (1992). Appearance of
interleukin-1 in macrophages and in ramified microglia in the brain of endotoxin-
treated rats: a pathway for the induction of non-specific symptoms of sickness?
Brain Research, 588(2), 291-296. doi:10.1016/0006-8993(92)91588-6
Van de Velde, S., Levecque, K., & Bracke, P. (2009). Measurement equivalence of the
CES-D 8 in the general population in Belgium: a gender perspective. Archives of
Public Health, 67(1), 15.
van den Broek, K. C., Tekle, F. B., Habibović, M., Alings, M., van der Voort, P. H., &
Denollet, J. (2013). Emotional distress, positive affect, and mortality in patients
with an implantable cardioverter defibrillator. Int J Cardiol, 165(2), 327-332.

503
Van der Kooy, K., van Hout, H., Marwijk, H., Marten, H., Stehouwer, C., & Beekman, A.
(2007). Depression and the risk for cardiovascular diseases: systematic review
and meta analysis. International Journal of Geriatric Psychiatry, 22(7), 613-626.
van der Vegt, E. J., van der Ende, J., Huizink, A. C., Verhulst, F. C., & Tiemeier, H.
(2010). Childhood adversity modifies the relationship between anxiety disorders
and cortisol secretion. Biological Psychiatry, 68(11), 1048-1054.
doi:10.1016/j.biopsych.2010.07.027
van der Vegt, E. J., van der Ende, J., Kirschbaum, C., Verhulst, F. C., & Tiemeier, H.
(2009). Early neglect and abuse predict diurnal cortisol patterns in adults A study
of international adoptees. Psychoneuroendocrinology, 34(5), 660-669.
doi:10.1016/j.psyneuen.2008.11.004
van Dooren, F. E., Schram, M. T., Schalkwijk, C. G., Stehouwer, C. D., Henry, R. M.,
Dagnelie, P. C., . . . Pouwer, F. (2016). Associations of low grade inflammation
and endothelial dysfunction with depression - The Maastricht Study. Brain,
Behavior, & Immunity, 9, 9. doi:http://dx.doi.org/10.1016/j.bbi.2016.03.004
van Leeuwen, N., Bellingrath, S., de Kloet, E. R., Zitman, F. G., DeRijk, R. H., Kudielka,
B. M., & Wust, S. (2011). Human mineralocorticoid receptor (MR) gene
haplotypes modulate MR expression and transactivation: implication for the
stress response. Psychoneuroendocrinology, 36(5), 699-709.
doi:10.1016/j.psyneuen.2010.10.003
van Leeuwen, N., Kumsta, R., Entringer, S., de Kloet, E. R., Zitman, F. G., DeRijk, R. H.,
& Wust, S. (2010). Functional mineralocorticoid receptor (MR) gene variation
influences the cortisol awakening response after dexamethasone.
Psychoneuroendocrinology, 35(3), 339-349.
doi:10.1016/j.psyneuen.2009.07.006
van Melle, J. P., de Jonge, P., Ormel, J., Crijns, H. J., van Veldhuisen, D. J., Honig, A.,
. . . van den Berg, M. P. (2005). Relationship between left ventricular dysfunction
and depression following myocardial infarction: data from the MIND-IT. European
Heart Journal, 26(24), 2650-2656. doi:10.1093/eurheartj/ehi480

504
van Melle, J. P., de Jonge, P., Spijkerman, T. A., Tijssen, J. G., Ormel, J., van
Veldhuisen, D. J., . . . van den Berg, M. P. (2004). Prognostic association of
depression following myocardial infarction with mortality and cardiovascular
events: a meta-analysis. Psychosomatic Medicine, 66(6), 814-822.
doi:10.1097/01.psy.0000146294.82810.9c
van Rossum, E. F., Binder, E. B., Majer, M., Koper, J. W., Ising, M., Modell, S., . . .
Holsboer, F. (2006). Polymorphisms of the glucocorticoid receptor gene and
major depression. Biological Psychiatry, 59(8), 681-688.
doi:10.1016/j.biopsych.2006.02.007
van Santen, A., Vreeburg, S. A., Van der Does, A. J., Spinhoven, P., Zitman, F. G., &
Penninx, B. W. (2011). Psychological traits and the cortisol awakening response:
results from the Netherlands Study of Depression and Anxiety.
Psychoneuroendocrinology, 36(2), 240-248.
doi:10.1016/j.psyneuen.2010.07.014
van West, D., Van Den Eede, F., Del-Favero, J., Souery, D., Norrback, K. F., Van Duijn,
C., . . . Claes, S. (2006). Glucocorticoid receptor gene-based SNP analysis in
patients with recurrent major depression. Neuropsychopharmacology, 31(3),
620-627. doi:10.1038/sj.npp.1300898
Vane, J. R., & Botting, R. M. (2003). The mechanism of action of aspirin. Thromb Res,
110(5-6), 255-258. doi:10.1016/s0049-3848(03)00379-7
Varghese, R., Rajappa, M., Chandrashekar, L., Kattimani, S., Archana, M., Munisamy,
M., . . . Thappa, D. M. (2016). Association among stress, hypocortisolism,
systemic inflammation, and disease severity in chronic urticaria. Ann Allergy
Asthma Immunol, 116(4), 344-348.e341. doi:10.1016/j.anai.2016.01.016
Veen, G., van Vliet, I. M., DeRijk, R. H., Giltay, E. J., van Pelt, J., & Zitman, F. G. (2011).
Basal cortisol levels in relation to dimensions and DSM-IV categories of
depression and anxiety. Psychiatry Res, 185(1-2), 121-128.
doi:10.1016/j.psychres.2009.07.013

505
Venken, K., Hellings, N., Broekmans, T., Hensen, K., Rummens, J. L., & Stinissen, P.
(2008). Natural naive CD4+CD25+CD127low regulatory T cell (Treg)
development and function are disturbed in multiple sclerosis patients: recovery
of memory Treg homeostasis during disease progression. J Immunol, 180(9),
6411-6420.
Ventura-Junca, R., Symon, A., Lopez, P., Fiedler, J. L., Rojas, G., Heskia, C., . . .
Herrera, L. (2014). Relationship of cortisol levels and genetic polymorphisms to
antidepressant response to placebo and fluoxetine in patients with major
depressive disorder: a prospective study. BMC Psychiatry, 14, 220.
doi:10.1186/s12888-014-0220-0
Verduijn, J., Milaneschi, Y., Schoevers, R. A., van Hemert, A. M., Beekman, A. T., &
Penninx, B. W. (2015). Pathophysiology of major depressive disorder:
mechanisms involved in etiology are not associated with clinical progression.
Translational Psychiatry, 5, e649. doi:10.1038/tp.2015.137
Vinkers, C. H., Joels, M., Milaneschi, Y., Gerritsen, L., Kahn, R. S., Penninx, B. W., &
Boks, M. P. (2015). Mineralocorticoid receptor haplotypes sex-dependently
moderate depression susceptibility following childhood maltreatment.
Psychoneuroendocrinology, 54, 90-102. doi:10.1016/j.psyneuen.2015.01.018
Vinkers, D. J., Stek, M. L., Gussekloo, J., Van Der Mast, R. C., & Westendorp, R. G.
(2004). Does depression in old age increase only cardiovascular mortality? The
Leiden 85-plus Study. International Journal of Geriatric Psychiatry, 19(9), 852-
857. doi:10.1002/gps.1169
Virtanen, M., Shipley, M. J., Batty, G. D., Hamer, M., Allan, C. L., Lowe, G. D., . . .
Kivimaki, M. (2015). Interleukin-6 as a predictor of symptom resolution in
psychological distress: a cohort study. Psychological Medicine, 45(10), 2137-
2144. doi:10.1017/s0033291715000070
Voellmin, A., Winzeler, K., Hug, E., Wilhelm, F. H., Schaefer, V., Gaab, J., . . . Bader, K.
(2015). Blunted endocrine and cardiovascular reactivity in young healthy women
reporting a history of childhood adversity. Psychoneuroendocrinology, 51, 58-67.

506
von Bardeleben, U., & Holsboer, F. (1991). Effect of age on the cortisol response to
human corticotropin-releasing hormone in depressed patients pretreated with
dexamethasone. Biological Psychiatry, 29(10), 1042-1050.
von Kanel, R. (2004). Platelet hyperactivity in clinical depression and the beneficial effect
of antidepressant drug treatment: how strong is the evidence? Acta Psychiatr
Scand, 110(3), 163-177. doi:10.1111/j.1600-0447.2004.00308.x
von Känel, R., Bellingrath, S., & Kudielka, B. M. (2008). Association between burnout
and circulating levels of pro-and anti-inflammatory cytokines in schoolteachers. J
Psychosom Res, 65(1), 51-59.
Von Werne Baes, C., de Carvalho Tofoli, S. M., Martins, C. M., & Juruena, M. F. (2012).
Assessment of the hypothalamic-pituitary-adrenal axis activity: glucocorticoid
receptor and mineralocorticoid receptor function in depression with early life
stress - a systematic review. Acta Neuropsychiatrica, 24(1), 4-15.
doi:10.1111/j.1601-5215.2011.00610.x
Vreeburg, S. A., Hartman, C. A., Hoogendijk, W. J., van Dyck, R., Zitman, F. G., Ormel,
J., & Penninx, B. W. (2010). Parental history of depression or anxiety and the
cortisol awakening response. British Journal of Psychiatry, 197(3), 180-185.
doi:10.1192/bjp.bp.109.076869
Vreeburg, S. A., Hoogendijk, W. J., van Pelt, J., Derijk, R. H., Verhagen, J. C., van Dyck,
R., . . . Penninx, B. W. (2009a). Major depressive disorder and hypothalamic-
pituitary-adrenal axis activity: results from a large cohort study. Arch Gen
Psychiatry, 66(6), 617-626. doi:10.1001/archgenpsychiatry.2009.50
Vreeburg, S. A., Kruijtzer, B. P., van Pelt, J., van Dyck, R., DeRijk, R. H., Hoogendijk,
W. J., . . . Penninx, B. W. (2009b). Associations between sociodemographic,
sampling and health factors and various salivary cortisol indicators in a large
sample without psychopathology. Psychoneuroendocrinology, 34(8), 1109-1120.
doi:10.1016/j.psyneuen.2009.04.024
Vrshek-Schallhorn, S., Doane, L., Mineka, S., Zinbarg, R. E., Craske, M., & Adam, E. K.
(2013). The cortisol awakening response predicts major depression: predictive

507
stability over a 4-year follow-up and effect of depression history. Psychological
Medicine, 43(3), 483-493.
Vythilingam, M., Heim, C., Newport, J., Miller, A. H., Anderson, E., Bronen, R., . . .
Bremner, J. D. (2002). Childhood trauma associated with smaller hippocampal
volume in women with major depression. Am J Psychiatry, 159(12), 2072-2080.
doi:10.1176/appi.ajp.159.12.2072
Wakefield, J. C. (1997). Diagnosing DSM-IV--Part I: DSM-IV and the concept of disorder.
Behaviour Research and Therapy, 35(7), 633-649.
Walker, B. R. (2007). Glucocorticoids and cardiovascular disease. European Journal of
Endocrinology. Oslo, 157(5), 545-559. doi:10.1530/eje-07-0455
Walker, E. R., McGee, R. E., & Druss, B. G. (2015). Mortality in mental disorders and
global disease burden implications: a systematic review and meta-analysis.
JAMA Psychiatry, 72(4), 334-341. doi:10.1001/jamapsychiatry.2014.2502
Walsh, C. P., Ewing, L. J., Cleary, J. L., Vaisleib, A. D., Farrell, C. H., Wright, A. G. C., .
. . Marsland, A. L. (2018). Development of glucocorticoid resistance over one
year among mothers of children newly diagnosed with cancer. Brain, Behavior,
& Immunity, 69, 364-373. doi:10.1016/j.bbi.2017.12.011
Wan, S., Xia, C., & Morel, L. (2007). IL-6 produced by dendritic cells from lupus-prone
mice inhibits CD4+CD25+ T cell regulatory functions. J Immunol, 178(1), 271-
279. doi:10.4049/jimmunol.178.1.271
Wang, D., Lin, W., Pan, Y., Kuang, X., Qi, X., & Sun, H. (2011). Chronic blockade of
glucocorticoid receptors by RU486 enhances lipopolysaccharide-induced
depressive-like behaviour and cytokine production in rats. Brain, Behavior, &
Immunity, 25(4), 706-714. doi:10.1016/j.bbi.2011.01.011
Wang, J., & Patten, S. B. (2002). Prospective study of frequent heavy alcohol use and
the risk of major depression in the Canadian general population. Depression and
Anxiety, 15(1), 42-45.
Wang, J., Wu, X., Lai, W., Long, E., Zhang, X., Li, W., . . . Lin, H. (2017). Prevalence of
depression and depressive symptoms among outpatients: a systematic review

508
and meta-analysis. BMJ Open, 7(8), e017173. doi:10.1136/bmjopen-2017-
017173
Wang, M., Wei, J., Yang, X., Ni, P., Wang, Y., Zhao, L., . . . Ma, X. (2019). The level of
IL-6 was associated with sleep disturbances in patients with major depressive
disorder. Neuropsychiatr Dis Treat, 15, 1695-1700. doi:10.2147/ndt.S202329
Wang, X., Wu, H., & Miller, A. H. (2004). Interleukin 1alpha (IL-1alpha) induced activation
of p38 mitogen-activated protein kinase inhibits glucocorticoid receptor function.
Mol Psychiatry, 9(1), 65-75. doi:10.1038/sj.mp.4001339
Wang, Y.-P., & Gorenstein, C. (2013). Psychometric properties of the Beck Depression
Inventory-II: a comprehensive review. Revista Brasileira de Psiquiatria, 35(4),
416-431.
Warburton, D. E. R., & Bredin, S. S. D. (2017). Health benefits of physical activity: a
systematic review of current systematic reviews. Curr Opin Cardiol, 32(5), 541-
556. doi:10.1097/hco.0000000000000437
Wardenaar, K. J., Vreeburg, S. A., van Veen, T., Giltay, E. J., Veen, G., Penninx, B. W.,
& Zitman, F. G. (2011). Dimensions of depression and anxiety and the
hypothalamo-pituitary-adrenal axis. Biological Psychiatry, 69(4), 366-373.
doi:10.1016/j.biopsych.2010.09.005
Warren, M. K., & Vogel, S. N. (1985). Opposing effects of glucocorticoids on interferon-
gamma-induced murine macrophage Fc receptor and Ia antigen expression. J
Immunol, 134(4), 2462-2469.
Wassef, A., Smith, E. M., Rose, R. M., Gardner, R., Nguyen, H., & Meyer, W. J. (1990).
Mononuclear leukocyte glucocorticoid receptor binding characteristics and down-
regulation in major depression. Psychoneuroendocrinology, 15(1), 59-68.
Wassef, A. A., O'Boyle, M., Gardner, R., Rose, R. M., Brown, A., Harris, A., . . . Meyer,
W. J., 3rd. (1992). Glucocorticoid receptor binding in three different cell types in
major depressive disorder: lack of evidence of receptor binding defect. Progress
in Neuro-Psychopharmacology & Biological Psychiatry, 16(1), 65-78.

509
Watson, S., Owen, B. M., Gallagher, P., Hearn, A. J., Young, A. H., & Ferrier, I. N. (2007).
Family history, early adversity and the hypothalamic-pituitary-adrenal (HPA) axis:
Mediation of the vulnerability to mood disorders. Neuropsychiatr Dis Treat, 3(5),
647-653.
Webster, J. C., Oakley, R. H., Jewell, C. M., & Cidlowski, J. A. (2001). Proinflammatory
cytokines regulate human glucocorticoid receptor gene expression and lead to
the accumulation of the dominant negative beta isoform: a mechanism for the
generation of glucocorticoid resistance. Proc Natl Acad Sci U S A, 98(12), 6865-
6870. doi:10.1073/pnas.121455098
Webster, M., Knable, M., O'grady, J., Orthmann, J., & Weickert, C. S. (2002). Regional
specificity of brain glucocorticoid receptor mRNA alterations in subjects with
schizophrenia and mood disorders. Molecular Psychiatry, 7(9), 985.
Weidenfeld, J., & Yirmiya, R. (1996). Effects of bacterial endotoxin on the glucocorticoid
feedback regulation of adrenocortical response to stress.
Neuroimmunomodulation, 3(6), 352-357.
Weischer, M., Bojesen, S. E., Cawthon, R. M., Freiberg, J. J., Tybjaerg-Hansen, A., &
Nordestgaard, B. G. (2012). Short telomere length, myocardial infarction,
ischemic heart disease, and early death. Arteriosclerosis, Thrombosis, and
Vascular Biology, 32(3), 822-829. doi:10.1161/atvbaha.111.237271
Wellenius, G. A., Mukamal, K. J., Kulshreshtha, A., Asonganyi, S., & Mittleman, M. A.
(2008). Depressive symptoms and the risk of atherosclerotic progression among
patients with coronary artery bypass grafts. Circulation, 117(18), 2313-2319.
Whalley, L. J., Borthwick, N., Copolov, D., Dick, H., Christie, J. E., & Fink, G. (1986).
Glucocorticoid receptors and depression. Br Med J (Clin Res Ed), 292(6524),
859-861.
Whincup, P. H., Gilg, J. A., Emberson, J. R., Jarvis, M. J., Feyerabend, C., Bryant, A., .
. . Cook, D. G. (2004). Passive smoking and risk of coronary heart disease and
stroke: prospective study with cotinine measurement. Bmj, 329(7459), 200-205.
doi:10.1136/bmj.38146.427188.55

510
White, J., Zaninotto, P., Walters, K., Kivimaki, M., Demakakos, P., Biddulph, J., . . . Batty,
G. D. (2016). Duration of depressive symptoms and mortality risk: the English
Longitudinal Study of Ageing (ELSA). British Journal of Psychiatry, 208(4), 337-
342. doi:10.1192/bjp.bp.114.155333
White, J., Zaninotto, P., Walters, K., Kivimaki, M., Demakakos, P., Shankar, A., . . . Batty,
G. D. (2015). Severity of depressive symptoms as a predictor of mortality: the
English longitudinal study of ageing. Psychological Medicine, 45(13), 2771-2779.
doi:10.1017/s0033291715000732
Whooley, M. A., de Jonge, P., Vittinghoff, E., Otte, C., Moos, R., Carney, R. M., . . .
Browner, W. S. (2008). Depressive symptoms, health behaviors, and risk of
cardiovascular events in patients with coronary heart disease. Jama, 300(20),
2379-2388. doi:10.1001/jama.2008.711
Whooley, M. A., & Wong, J. M. (2013) Depression and cardiovascular disorders. In: Vol.
9. Annual Review of Clinical Psychology (pp. 327-354).
Whorwood, C. B., Donovan, S. J., Wood, P. J., & Phillips, D. I. (2001). Regulation of
glucocorticoid receptor alpha and beta isoforms and type I 11beta-hydroxysteroid
dehydrogenase expression in human skeletal muscle cells: a key role in the
pathogenesis of insulin resistance? Journal of Clinical Endocrinology &
Metabolism, 86(5), 2296-2308. doi:10.1210/jcem.86.5.7503
Wiedlocha, M., Marcinowicz, P., Krupa, R., Janoska-Jazdzik, M., Janus, M., Debowska,
W., . . . Szulc, A. (2018). Effect of antidepressant treatment on peripheral
inflammation markers - A meta-analysis. Progress in Neuro-
Psychopharmacology & Biological Psychiatry, 80(Pt C), 217-226.
doi:10.1016/j.pnpbp.2017.04.026
Wielaard, I., Schaakxs, R., Comijs, H. C., Stek, M. L., & Rhebergen, D. (2018). The
influence of childhood abuse on cortisol levels and the cortisol awakening
response in depressed and nondepressed older adults. World Journal of
Biological Psychiatry, 19(6), 440-449. doi:10.1080/15622975.2016.1274829

511
Wildin, R. S., Smyk-Pearson, S., & Filipovich, A. H. (2002). Clinical and molecular
features of the immunodysregulation, polyendocrinopathy, enteropathy, X linked
(IPEX) syndrome. Journal of Medical Genetics, 39(8), 537-545.
Wiles, N. J., Haase, A. M., Gallacher, J., Lawlor, D. A., & Lewis, G. (2007). Physical
activity and common mental disorder: results from the Caerphilly study. American
Journal of Epidemiology, 165(8), 946-954. doi:10.1093/aje/kwk070
Wilhelm, K., Mitchell, P. B., Niven, H., Finch, A., Wedgwood, L., Scimone, A., . . .
Schofield, P. R. (2006). Life events, first depression onset and the serotonin
transporter gene. British Journal of Psychiatry, 188, 210-215.
doi:10.1192/bjp.bp.105.009522
Williams, L. M., & Rudensky, A. Y. (2007). Maintenance of the Foxp3-dependent
developmental program in mature regulatory T cells requires continued
expression of Foxp3. Nat Immunol, 8(3), 277-284. doi:10.1038/ni1437
Willner, P., Scheel-Kruger, J., & Belzung, C. (2013). The neurobiology of depression and
antidepressant action. Neurosci Biobehav Rev, 37(10 Pt 1), 2331-2371.
doi:10.1016/j.neubiorev.2012.12.007
Wilson, H. D. (2008). Minimum clinical important differences of health outcomes in a
chronic pain population: are they predictive of poor outcomes?
Win, S., Parakh, K., Eze-Nliam, C. M., Gottdiener, J. S., Kop, W. J., & Ziegelstein, R. C.
(2011). Depressive symptoms, physical inactivity and risk of cardiovascular
mortality in older adults: the Cardiovascular Health Study. Heart, 97(6), 500-505.
doi:10.1136/hrt.2010.209767
Wirtz, P. H., von Kanel, R., Emini, L., Ruedisueli, K., Groessbauer, S., Maercker, A., &
Ehlert, U. (2007). Evidence for altered hypothalamus-pituitary-adrenal axis
functioning in systemic hypertension: blunted cortisol response to awakening and
lower negative feedback sensitivity. Psychoneuroendocrinology, 32(5), 430-436.
doi:10.1016/j.psyneuen.2007.02.006
Wirtz, P. H., von Kanel, R., Schnorpfeil, P., Ehlert, U., Frey, K., & Fischer, J. E. (2003).
Reduced glucocorticoid sensitivity of monocyte interleukin-6 production in male

512
industrial employees who are vitally exhausted. Psychosomatic Medicine, 65(4),
672-678.
Wium-Andersen, M. K., Orsted, D. D., Nielsen, S. F., & Nordestgaard, B. G. (2013).
Elevated C-reactive protein levels, psychological distress, and depression in 73,
131 individuals. JAMA Psychiatry, 70(2), 176-184.
doi:10.1001/2013.jamapsychiatry.102
Wodarz, N., Rupprecht, R., Kornhuber, J., Schmitz, B., Wild, K., Braner, H. U., &
Riederer, P. (1991). Normal lymphocyte responsiveness to lectins but impaired
sensitivity to in vitro glucocorticoids in major depression. Journal of Affective
Disorders, 22(4), 241-248.
Wodarz, N., Rupprecht, R., Kornhuber, J., Schmitz, B., Wild, K., & Riederer, P. (1992).
Cell-mediated immunity and its glucocorticoid-sensitivity after clinical recovery
from severe major depressive disorder. Journal of Affective Disorders, 25(1), 31-
38.
Wong, M., Dong, C., Maestre-Mesa, J., & Licinio, J. (2008). Polymorphisms in
inflammation-related genes are associated with susceptibility to major depression
and antidepressant response. Molecular Psychiatry, 13(8), 800-812.
doi:http://dx.doi.org/10.1038/mp.2008.59
Wong, N. D. (2014). Epidemiological studies of CHD and the evolution of preventive
cardiology. Nature Reviews Cardiology, 11(5), 276-289.
doi:10.1038/nrcardio.2014.26
Wood, A. M., Kaptoge, S., Butterworth, A. S., Willeit, P., Warnakula, S., Bolton, T., . . .
Danesh, J. (2018). Risk thresholds for alcohol consumption: combined analysis
of individual-participant data for 599 912 current drinkers in 83 prospective
studies. Lancet, 391(10129), 1513-1523. doi:10.1016/s0140-6736(18)30134-x
Woodward, M., Rumley, A., Welsh, P., MacMahon, S., & Lowe, G. (2007). A comparison
of the associations between seven hemostatic or inflammatory variables and
coronary heart disease. Journal of Thrombosis & Haemostasis, 5(9), 1795-1800.
doi:10.1111/j.1538-7836.2007.02677.x

513
World Health Organisation. (2017a). Cardiovascular diseases (CVDs). Retrieved from
http://www.who.int/mediacentre/factsheets/fs317/en/
World Health Organisation. (2017b). Depression Fact Sheet. Retrieved from
http://www.who.int/mediacentre/factsheets/fs369/en/
World Health Organization. (1992). The ICD-10 classification of mental and behavioural
disorders: clinical descriptions and diagnostic guidelines (Vol. 1): World Health
Organization.
Wray, N. R., Ripke, S., Mattheisen, M., Trzaskowski, M., Byrne, E. M., Abdellaoui, A., . .
. Sullivan, P. F. (2018). Genome-wide association analyses identify 44 risk
variants and refine the genetic architecture of major depression. Nature Genetics,
50(5), 668-681. doi:10.1038/s41588-018-0090-3
Wu, C. W., Chen, Y. C., Yu, L., Chen, H. I., Jen, C. J., Huang, A. M., . . . Kuo, Y. M.
(2007). Treadmill exercise counteracts the suppressive effects of peripheral
lipopolysaccharide on hippocampal neurogenesis and learning and memory.
Journal of Neurochemistry, 103(6), 2471-2481. doi:10.1111/j.1471-
4159.2007.04987.x
Wu, C. Y., Chang, Y. T., Juan, C. K., Shen, J. L., Lin, Y. P., Shieh, J. J., . . . Chen, Y. J.
(2016). Depression and insomnia in patients with psoriasis and psoriatic arthritis
taking tumor necrosis factor antagonists. Medicine (United States), 95 (22) (no
pagination)(e3816).
Wu, J. R., Lennie, T. A., Dekker, R. L., Biddle, M. J., & Moser, D. K. (2013). Medication
adherence, depressive symptoms, and cardiac event-free survival in patients
with heart failure. Journal of Cardiac Failure, 19(5), 317-324.
doi:10.1016/j.cardfail.2013.03.010
Wu, Q., & Kling, J. M. (2016). Depression and the Risk of Myocardial Infarction and
Coronary Death: A Meta-Analysis of Prospective Cohort Studies. Medicine,
95(6), e2815. doi:10.1097/md.0000000000002815
Wulsin, L. R., Evans, J. C., Vasan, R. S., Murabito, J. M., Kelly-Hayes, M., & Benjamin,
E. J. (2005). Depressive symptoms, coronary heart disease, and overall mortality

514
in the Framingham Heart Study. Psychosomatic Medicine, 67(5), 697-702.
doi:10.1097/01.psy.0000181274.56785.28
Wulsin, L. R., & Singal, B. M. (2003). Do depressive symptoms increase the risk for the
onset of coronary disease? A systematic quantitative review. Psychosomatic
Medicine, 65(2), 201-210.
Wulsin, L. R., Vaillant, G. E., & Wells, V. E. (1999). A systematic review of the mortality
of depression. Psychosomatic Medicine, 61(1), 6-17.
Wurtman, R. J., Altschule, M. D., & Holmgren, U. (1959). Effects of pinealectomy and of
a bovine pineal extract in rats. Am J Physiol, 197(1), 108-110.
doi:10.1152/ajplegacy.1959.197.1.108
Xu, Q., Goleva, E., Ou, L. S., Li, L. B., & Leung, D. Y. (2004). CD56+ cells induce steroid
resistance in B cells exposed to IL-15. J Immunol, 172(11), 7110-7115.
Yang, B., Trump, R. P., Shen, Y., McNulty, J. A., Clifton, L. G., Stimpson, S. A., . . .
Pahel, G. L. (2008). RU486 did not exacerbate cytokine release in mice
challenged with LPS nor in db/db mice. BMC Pharmacology, 8, 7-7.
doi:10.1186/1471-2210-8-7
Yang, C., Tiemessen, K. M., Bosker, F. J., Wardenaar, K. J., Lie, J., & Schoevers, R. A.
(2018). Interleukin, tumor necrosis factor-α and C-reactive protein profiles in
melancholic and non-melancholic depression: a systematic review. J Psychosom
Res, 111, 58-68.
Yeager, M. P., Pioli, P. A., & Guyre, P. M. (2011). Cortisol exerts bi-phasic regulation of
inflammation in humans. Dose Response, 9(3), 332-347. doi:10.2203/dose-
response.10-013.Yeager
Yehuda, R., Boisoneau, D., Mason, J. W., & Giller, E. L. (1993). Glucocorticoid receptor
number and cortisol excretion in mood, anxiety, and psychotic disorders.
Biological Psychiatry, 34(1-2), 18-25.
Yehuda, R., Golier, J. A., Yang, R. K., & Tischler, L. (2004). Enhanced sensitivity to
glucocorticoids in peripheral mononuclear leukocytes in posttraumatic stress

515
disorder. Biological Psychiatry, 55(11), 1110-1116.
doi:10.1016/j.biopsych.2004.02.010
Yehuda, R., Yang, R. K., Golier, J. A., Grossman, R. A., Bierer, L. M., & Tischler, L.
(2006). Effect of sertraline on glucocorticoid sensitivity of mononuclear
leukocytes in post-traumatic stress disorder. Neuropsychopharmacology, 31(1),
189-196. doi:10.1038/sj.npp.1300862
Yoshimura, R., Hori, H., Ikenouchi-Sugita, A., Umene-Nakano, W., Ueda, N., &
Nakamura, J. (2009). Higher plasma interleukin-6 (IL-6) level is associated with
SSRI- or SNRI-refractory depression. Progress in Neuro-Psychopharmacology &
Biological Psychiatry, 33(4), 722-726.
doi:http://dx.doi.org/10.1016/j.pnpbp.2009.03.020
Young, E. A., Lopez, J. F., Murphy-Weinberg, V., Watson, S. J., & Akil, H. (2003).
Mineralocorticoid receptor function in major depression. Arch Gen Psychiatry,
60(1), 24-28.
Yudkin, J. S., Kumari, M., Humphries, S. E., & Mohamed-Ali, V. (2000). Inflammation,
obesity, stress and coronary heart disease: is interleukin-6 the link?
Atherosclerosis, 148(2), 209-214.
Yuuki, N., Ida, I., Oshima, A., Kumano, H., Takahashi, K., Fukuda, M., . . . Mikuni, M.
(2005). HPA axis normalization, estimated by DEX/CRH test, but less alteration
on cerebral glucose metabolism in depressed patients receiving ECT after
medication treatment failures. Acta Psychiatr Scand, 112(4), 257-265.
Zalli, A., Jovanova, O., Hoogendijk, W., Tiemeier, H., & Carvalho, L. (2016). Low-grade
inflammation predicts persistence of depressive symptoms.
Psychopharmacology, 233(9), 1669-1678. doi:http://dx.doi.org/10.1007/s00213-
015-3919-9
Zalsman, G., Huang, Y. Y., Oquendo, M. A., Burke, A. K., Hu, X. Z., Brent, D. A., . . .
Mann, J. J. (2006). Association of a triallelic serotonin transporter gene promoter
region (5-HTTLPR) polymorphism with stressful life events and severity of

516
depression. Am J Psychiatry, 163(9), 1588-1593.
doi:10.1176/ajp.2006.163.9.1588
Zeugmann, S., Buehrsch, N., Bajbouj, M., Heuser, I., Anghelescu, I., & Quante, A.
(2013). Childhood maltreatment and adult proinflammatory status in patients with
major depression. Psychiatr Danub, 25(3), 227-235.
Zhai, X., Chen, F., Zhu, C., & Lu, Y. (2015). A simple LC-MS/MS method for the
determination of cortisol, cortisone and tetrahydro-metabolites in human urine:
assay development, validation and application in depression patients. Journal of
Pharmaceutical & Biomedical Analysis, 107, 450-455.
doi:10.1016/j.jpba.2015.01.041
Zhang, T. Y., & Daynes, R. A. (2007). Macrophages from 11beta-hydroxysteroid
dehydrogenase type 1-deficient mice exhibit an increased sensitivity to
lipopolysaccharide stimulation due to TGF-beta-mediated up-regulation of SHIP1
expression. J Immunol, 179(9), 6325-6335.
Zhang, Y. P., Wang, H. Y., Zhang, C., Liu, B. P., Peng, Z. L., Li, Y. Y., . . . Song, C.
(2018). Mifepristone attenuates depression-like changes induced by chronic
central administration of interleukin-1beta in rats. Behavioural Brain Research,
347, 436-445. doi:10.1016/j.bbr.2018.03.033
Zhou, A. J., Lee, Y., Salvadore, G., Hsu, B., Fonseka, T. M., Kennedy, S. H., & McIntyre,
R. S. (2017). Sirukumab: A Potential Treatment for Mood Disorders? Adv Ther,
34(1), 78-90. doi:10.1007/s12325-016-0455-x
Zhou, L., Lopes, J. E., Chong, M. M., Ivanov, II, Min, R., Victora, G. D., . . . Littman, D.
R. (2008). TGF-beta-induced Foxp3 inhibits T(H)17 cell differentiation by
antagonizing RORgammat function. Nature, 453(7192), 236-240.
doi:10.1038/nature06878
Zhu, C. B., Blakely, R. D., & Hewlett, W. A. (2006). The proinflammatory cytokines
interleukin-1beta and tumor necrosis factor-alpha activate serotonin transporters.
Neuropsychopharmacology, 31(10), 2121-2131. doi:10.1038/sj.npp.1301029

517
Ziegelstein, R. C., Fauerbach, J. A., Stevens, S. S., Romanelli, J., Richter, D. P., & Bush,
D. E. (2000). Patients with depression are less likely to follow recommendations
to reduce cardiac risk during recovery from a myocardial infarction. Arch Intern
Med, 160(12), 1818-1823.
Zimmerman, M., Martinez, J. H., Young, D., Chelminski, I., & Dalrymple, K. (2013).
Severity classification on the Hamilton Depression Rating Scale. Journal of
Affective Disorders, 150(2), 384-388. doi:10.1016/j.jad.2013.04.028
Zobel, A. W., Nickel, T., Sonntag, A., Uhr, M., Holsboer, F., & Ising, M. (2001). Cortisol
response in the combined dexamethasone/CRH test as predictor of relapse in
patients with remitted depression. a prospective study. J Psychiatr Res, 35(2),
83-94.
Zorrilla, E. P., Luborsky, L., McKay, J. R., Rosenthal, R., Houldin, A., Tax, A., . . .
Schmidt, K. (2001). The Relationship of Depression and Stressors to
Immunological Assays: A Meta-Analytic Review. Brain, behavior, and immunity,
15(3), 199-226. doi:http://dx.doi.org/10.1006/brbi.2000.0597
Zou, W., Feng, R., & Yang, Y. (2018). Changes in the serum levels of inflammatory
cytokines in antidepressant drug-naive patients with major depression. PLoS
One, 13(6), e0197267. doi:10.1371/journal.pone.0197267
10.1 Patient information sheet for participants with MDD
RESIST: Understanding the role of depression in heart disease
Invitation to participate
You are being invited to take part in a research study, the RESIST study, which is being
conducted as part of a PhD by Miss Samantha Lawes at University College London.
Please take time to read through this information carefully and discuss it with others if
you wish.
The purpose of the study
518
Depression and heart disease are common health problems. People who suffer with
depression are at greater risk of heart problems. It is not yet understood why this
happens. A growing number of scientists believe that depression and heart disease may
be influenced by the immune system. One of the body's natural responses to infection
or injury is called inflammation but if this is chronic it can lead to health problems.
Differences in levels of inflammation between people may lead to differences in
molecules in our blood. In this study, we will compare the blood of people with
depression to people who do not have depression.
Why have I been chosen to be invited?
We are interested in patients who have been diagnosed with depression to help us with
the study. You have been given this information sheet because your GP thinks you may
have depression. However, no information will be passed to the RESIST study team
from by your GP.
Do I have to take part?
No, taking part in this study is voluntary. It is up to you to decide whether or not to take
part. Whether or not you decide to take part will not affect the standard of care you
receive from your general practice. If you are interested in taking part you can contact
the researcher by phone or email to discuss the study in more detail. If you decide to
participate the researcher will arrange to meet with you. This interview can take place
either at your GP surgery, UCL or your home. At this point you will also have the
opportunity to raise any questions about the study. If you agree to take part, the
researcher will ask you to complete a consent form and you will be given a copy. You
are free to withdraw at any time without giving a reason.
What will taking part involve?
Once you provide consent you will undertake study assessments, the most convenient
time will be at the same interview. The assessments can take place either at your GP
surgery, UCL or your home and should take around 45 minutes. The researcher will ask
you to complete some short questionnaires on paper. These questions will be about
events in your life, current symptoms of depression and general well-being. We will
collect from you a 30ml sample of blood. We will also ask you to provide five saliva
samples over a 24-hour period, complete a sampling diary and post them to us. We will
provide you with the necessary equipment, including a saliva sampling kit, sampling diary

519
and a pre-paid envelope. You will need to complete a further assessment 6 weeks later.
This follow-up assessment can take place either at your GP surgery, UCL or your home
and will last about 45 minutes. The researcher will ask you to complete the same
questionnaires as at your first visit. On this occasion we will also ask you to complete an
additional short questionnaire about your childhood. We will also collect from you
another 30mls of blood.
As the researcher may be visiting you in your home, risks to the researcher will be
assessed and UCL’s Lone Worker Policy (2012) will be followed.
What is being tested?
We will use your blood and saliva to look at molecules that increase the risk of developing
cardiovascular disease.
What will happen to my sample and medical information?
Your samples will be taken to a UCL laboratory by the researcher where they will be
stored and later analysed, with access limited to members of the study team. They will
be stored for 5 years by the research group, pending ethical approval for use in future
research. Samples will be processed, stored and disposed of in accordance with all
applicable legal and regulatory requirements, including the Human Tissue Act 2004 and
any amendments thereafter.
Your sample and medical information will be assigned a number. This number, without
your name or any other identifiable details, will be how researchers keep track of samples
and information. All data will be kept separate from personally identifiable information in
a secure system, ensuring that all information remains anonymous.
Will personal information about me be kept confidential?
We will follow ethical and legal practice and all information about you will be handled in
confidence. Your research data will be kept in a secure system at UCL designed for
handling identifiable data which has been certified to the ISO27001 information security
standard and conforms to the NHS Information Governance Toolkit. Your medical
records will not hold any of your results from this research. Your samples can not be
linked back to you as they will be coded with your participant number (not your name).
This data is only accessible to the research team. It is likely that the results of this study
will be published; however your name will not appear on any publications or reports about
this research. At the end of the study, all personal identifiable data will be destroyed.

520
What will happen to the results of the research study?
When the study is completed, the results will be published in a health care journal so
health care professionals can see the results. If published, your identity and personal
details will be kept confidential. No named information about you will be published in any
reports about the study.
Are there any disadvantages in taking part?
Blood will be collected by venepuncture which involves a minimal risk procedure. You
will be asked to provide five saliva samples and complete a diary which will involve a
small amount of time. Some of the questions in the questionnaire about your childhood,
which is given at the follow-up interview, ask about physical and sexual abuse. This may
cause feelings of distress for some people and we will direct you to counselling if needed.
Support is available via www.samaritans.org and www.nhs.uk/conditions/stress-anxiety-
depression. It is important that we ask these questions in order to identify potential risk
factors for depression. Since your care is not being affected in any way, there are no
other disadvantages associated with taking part in the study.
What are the possible benefits of taking part?
Although we cannot promise that this study will be of immediate benefit to you, by taking
part you will help to increase the knowledge of what causes people to be more
susceptible to depression and heart disease. We hope that in the future this knowledge
may lead to the development of better treatments and improved prevention of these
illnesses. You may benefit from this.
Who is funding and organising the research?
The research is being conducted by University College London. It is funded by the British
Heart Foundation.
Who has reviewed the study?
The study has been reviewed by the Health Research Authority and the NHS Research
Ethics Committee.

521
What if there is a problem?
If you wish to complain, or have any concerns about any aspect of the way you have
been approached or treated by members of staff you may have experienced due to your
participation in the research, National Health Service or UCL complaints mechanisms
are available to you. Please ask your research doctor if you would like more information
on this.
In the unlikely event that you are harmed by taking part in this study, compensation may
be available.
If you suspect that the harm is the result of the Sponsor’s (University College London) or
the hospital's negligence then you may be able to claim compensation. After discussing
with your research doctor, please make the claim in writing to Professor Glyn Lewis who
is the Chief Investigator for the research and is based at University College London. The
Chief Investigator will then pass the claim to the Sponsor’s Insurers, via the Sponsor’s
office. You may have to bear the costs of the legal action initially, and you should consult
a solicitor about this.
What do I do now?
Thank you for considering taking part in the research. If you are happy to take part,
please sign the Permission to Contact form and a RESIST researcher will contact you
within the next few days.
If you would like independent advice about participating in this study you can contact the
Patient Advice and Liaison Service (PALS) via your GP surgery, NHS 111 or
www.nhs.uk/Service-Search/Patient-advice-and-liaison-services-
(PALS)/LocationSearch/363.
If you would prefer not to take part, you need not do anything.
If you have any questions about the study please contact:
Student researcher: Chief Investigator:
Samantha Lawes: Professor Glyn Lewis

522
Tel: 020 7679 1682 Tel: 0207 679 9253
Fax 020 7916 8542 Email: [email protected]
Email: [email protected]
UCL Research Department of Epidemiology and Public Health
Psychobiology Group
1 - 19 Torrington Place, London WC1E 6BT
THANK YOU FOR YOUR TIME

10.2 On-line advert recruiting participants with MDD
Invitation to participate in a depression study at UCL
05 May 2017
Over the past 2 weeks, have you been bothered by:
• Little interest or pleasure in doing things?
• Feeling down, depressed, or hopeless?
If you answered ‘yes’ to either question you could be eligible to take part in a UCL study
investigating the relationship between depression and heart disease.
The study would involve TWO sessions where we would ask you to complete some
questionnaires and provide a blood and saliva sample (note: these sessions take place
on Monday –Thursday mornings). You will be reimbursed £10 for each session attended.
Requirements
• Age 18-74
• Men and women
• Currently experiencing low mood
• Otherwise healthy
• NOT to be pregnant or breastfeeding
• Able to attend at 9.00am Monday-Thursday
• Able to attend 2 x assessment sessions
• Able to read, understand and complete
questionnaires
Ethical approval
This study has been approved by the Health Research
Authority Ethics Committee (16/WM/0143)
About the researcher
Psychobiology Group, Department of Behavioural Science and Health, 1-19 Torrington
Place, University College London, WC1E 7HB
Contact researcher https://www.ucl.ac.uk/iehc/research/behavioural-science-
health/research/psychobiology/resist/index

524
10.3 Signposting sheet for on-line participants
If you experience symptoms of depression for most of the day, every day for
more than two weeks, you should seek help from your GP.
Many people wait a long time before seeking help for depression, but it's best not to
delay. The sooner you see a doctor, the sooner you can be on the way to recovery.
It's particularly important to speak to your GP if you:
have symptoms of depression that aren't improving
find your mood affects your work, other interests, and relationships with
your family and friends
have thoughts of suicide or self-harm
Adult Improving Access to Psychological Therapies programme (IAPT)
IAPT is a free NHS talking therapy service for adults, who are worried or have low
mood. They provide a range of treatment programmes including one to one therapy,
counselling and group work.
There are two ways to get help from IAPT.
1. Talk to your GP or another health professional about being referred to your
local IAPT service.
2. Refer yourself by calling IAPT directly. Details of local IAPT services are
available on the NHS Choices website.

Mental health helplines
There are also a number of helplines which offer support for people suffering from
depression or anxiety:
Mind
Promotes the views and needs of people with mental health problems.
Phone: 0300 123 3393 (Mon-Fri, 9am-6pm) Website: www.mind.org.uk
Anxiety UK
Charity providing support if you've been diagnosed with an anxiety condition.
Phone: 08444 775 774 (Mon-Fri, 9.30am-5.30pm) Website: www.anxietyuk.org.uk
Depression Alliance
Charity for sufferers of depression. Has a network of self-help groups.
Website: www.depressionalliance.org

526
10.4 UCL posters for recruiting participants with MDD
If you answered ‘yes’ to either question you could be
eligible to join the RESIST study
• We are investigating the role of inflammation in the relationship
between depression and heart disease
• Participation would involve two sessions, ~ 60 mins
• Participation will involve some questionnaires and a blood and
saliva sample
• You will be reimbursed £10 for your time
For more information or to volunteer for this study, please contact:
Samantha Lawes Tel: 020 7679 1682 Mobile: 07891 432226
Email: [email protected]
Over the past 2 weeks, have you been bothered by:
little interest or pleasure in doing things?
feeling down, depressed, or hopeless?

10.5 Letters of invitation for healthy controls via GP practices
<< Patient name>>
<< Address >>
<Date>
Dear <<Patient name>>
RESIST: Understanding the role of depression in heart disease
I am writing to tell you about a research study taking place at University College London,
which you may be able to help with. This study is investigating why people who suffer
with depression are at greater risk of heart problems.
We are interested in patients who have been diagnosed with depression as well as
healthy volunteers to help us with the study. You have been identified as a potential
healthy volunteer by your GP practice.
The RESIST study is aiming to recruit volunteers for a single interview, including
providing a blood and saliva sample. We hope that you would be interested in taking part
in this worthwhile study but before you decide, it is important for you to understand why
the research is being done and what it will involve.
I have enclosed an information sheet giving more details about the RESIST study and
how it is run. Please take time to read it through and consider whether you are willing to
be contacted by the RESIST research team about this study.
You do not have to take part in the study, but we hope that as many people as possible
will take part. Please let the research team know if you are interested in participating by
contacting them on 020 7679 1682 or at [email protected].
Thank you for your help.
Yours sincerely,
<GP>

528
10.6 Consent form
RESIST: Understanding the role of depression in heart disease
A copy of this consent form will be given to you.
Participant ID number:
1. I confirm that I have read and understand the patient information
sheet v2.0 05/05/2017 for the RESIST study. I have had the
opportunity to consider the information, ask questions and have
these answered satisfactorily.
2. I understand that my participation is voluntary and that I am free
to withdraw, without giving a reason, and without my medical care
or legal rights being affected.
3. I understand that relevant sections of my medical notes and data
collected during the study, may be looked at by individuals from
UCL from regulatory authorities or from the NHS Trust, where it is
relevant to my taking part in this research. I give permission for
these individuals to have access to my records.
4. I agree to take part in the above study
5. I agree to provide blood sample and saliva samples.
6. I agree to my GP being informed about my participation in this
study.
Please initial box

7. I understand that the information collected about me will be used
to support other research in the future, and may be shared
anonymously with other researchers.
8. I agree to my samples being stored for 5 years by the research
group, according to the Human Tissue Act, 2004, pending ethical
approval for use in another project.
9. I agree to my samples being stored in UCL laboratories and
anonymised.
……………………………. ………… ………………………..
Name of participant Date Signature
…………………………….. ………… ………………………..
Name of researcher Date Signature

530
10.7 Example page from cortisol sampling diary
TUBE 1 : AS SOON AS YOU WAKE UP
1. What is the time now? _______a.m. / p.m.
2. What was the exact time you collected the sample?
_______a.m. / p.m.
2a. Was there a delay between waking up and Yes No No
collecting your first sample? Yes No
2b. If yes, how long? ____ hrs & ____ minutes
In the last 30 minutes how much did you feel…..
Not at all Very much
Very much
3. In control 1 2 3 4 5 4
4. Tired 1 2 3 4 5 4
5. Happy 1 2 3 4 5 4
6. Frustrated or angry 1 2 3 4 5 4
7. Sad 1 2 3 4 5
8. Stressed 1 2 3 4 5
9. Pain 1 2 3 4 5 4
10. If you talked with others, how pleasant was the interaction?
Not applicable 1 2 3 4 5
4
In the last 30 minutes, but before you collected your sample did you….
Brush your teeth No Yes
Drink any tea, coffee or other caffeinated drinks
No Yes
Eat a meal? No Yes
Do any exercise? No Yes
Smoke any cigarettes? No Yes

10.8 Beck Depression Inventory II
YOUR FEELINGS
Please read each group of statement carefully, then pick out one statement in each group
which best describes the way you have been feeling during the past two weeks, including
today. Tick the statement you have picked.
If several statements in the group seem to apply equally well, simply tick the statement
which has the largest number. Be sure that you do not tick more than one statement for
item 16 (change in sleeping pattern) and item 18 (change in appetite).
1. Sadness I do not feel sad 0 I feel sad most of the time 1 I am sad all the time 2 I am so sad or unhappy that I can’t stand it 3
2. Pessimism I am not discouraged about my future 0 I feel more discouraged about my future than I used to be 1 I do not expect things to work out for me 2 I feel my future is hopeless and will only get worse 3
3. Past Failure I do not feel like a failure 0 I have failed more than I should have 1 As I look back, I see a lot of failures 2 I feel I am a total failure as a person 3
4. Loss of Pleasure I get as much pleasure as I ever did from the things I enjoy 0 I don’t enjoy things as much as I used to 1 I get very little pleasure from the things I used to enjoy 2 I can’t get any pleasure from the things I used to enjoy 3 5. Guilty
Feelings
I don’t feel particularly guilty 0 I feel guilty over many things I have done or should have done 1 I feel guilty most of the time 2 I feel guilty all of the time 3 6. Punishment Feelings I don’t feel I am being punished 0 I feel I may be punished 1 I expect to be punished 2 I feel I am being punished 3 7. Self-Dislike I feel the same about myself as ever 0 I have lost confidence in myself 1 I am disappointed in myself 2 I dislike myself 3

532
8. Self-Criticism I don’t criticise or blame myself more than usual 0 I am more critical of myself than I used to be 1 I criticise myself for all of my faults 2 I blame myself for everything bad that happens 3
9. Suicidal Thoughts or Wishes I don’t have any thoughts of killing myself 0 I have thoughts of killing myself, but I would not carry them out 1 I would like to kill myself 2 I would kill myself if I had the chance 3
10. Crying I don’t cry any more that I used to 0 I cry more than I used to 1 I cry over every little thing 2 I feel like crying, but I can’t 3
11. Agitation I am no more restless or wound up than usual 0 I feel more restless or wound up than usual 1 I am so restless or agitated that it’s hard to stay still 2 I am so restless or agitated that I have to keep moving or doing something 3
12. Loss of Interest I have not lost interest in other people or activities 0 I am less interested in other people or things than before 1 I have lost most of my interest in other people or things 2 It’s hard to get interested in anything 3
13. Indecisiveness I make decisions about as well as ever 0 I find it more difficult to make decisions than usual 1 I have much greater difficulty in making decisions than I used to 2 I have trouble making any decisions 3
14. Worthlessness I do not feel I am worthless 0 I don’t consider myself as worthwhile or useful as I used to 1 I feel more worthless as compared to other people 2 I feel utterly worthless 3
15. Loss of Energy I have as much energy as ever 0 I have less energy than I used to have 1 I don’t have enough energy to do very much 2 I don’t have enough energy to do anything 3

16. Change in Sleeping Pattern I have not experienced any change in my sleeping pattern 0 I sleep somewhat more than usual 1a I sleep somewhat less than usual 1b I sleep a lot more than usual 2a I sleep a lot less than usual 2b I sleep most of the day 3a I wake up 1-2 hours early and I can’t get back to sleep 3b
17. Irritability I am no more irritable than usual 0 I am more irritable than usual 1 I am much more irritable than usual 2 I am irritable all the time 3
18. Change in Appetite
I have not experienced any change in my appetite 0 My appetite is somewhat less than usual 1a My appetite is somewhat greater than usual 1b My appetite is much less than before 2a My appetite is greater than usual 2b I have no appetite at all 3a I crave food all the time 3b
19. Concentration Difficulty
I can concentrate as well as ever 0 I can’t concentrate as well as usual 1 It’s hard to keep my mind on anything for very long 2 I find I can’t concentrate on anything 3
20. Tiredness or Fatigue
I am no more tired or fatigued than usual 0 I get more tired or fatigued more easily than usual 1 I am too tired or fatigued to do a lot of things I used to do 2 I am too tired or fatigued to do most of the things I used to do 3
21. Loss of Interest in Sex I have not noticed any recent change in my interest in sex 0 I am less interested in sex than I used to be 1 I am much less interested in sex now 2 I have lost interest in sex completely 3

534
10.9 List of Threatening Events
EVENTS IN YOUR LIFE
In the next section 12 unpleasant events are listed. Please indicate if you have
experienced these events in the past 12 months.
1. You yourself suffered a serious illness, injury
or an assault
Yes
No
2. A serious illness, injury or assault happened
to a close
relative
Yes
No
3. Your parent, child or spouse died
Yes
No
4. A close family friend or another relative (aunt,
cousin, grandparent) died
Yes
No
5. You had a separation due to marital
difficulties
Yes
No
6. You broke off a steady relationship
Yes
No

7. You had a serious problem with a close friend, neighbour or relative
Yes No
8. You became unemployed or you were seeking work unsuccessfully for more than 1 month
Yes No
9. You were sacked from your job
Yes No
10. You had a major financial crisis
Yes No
11. You had problems with the police and a court appearance
Yes No
12. Something you valued was lost or stolen
Yes No

536
1.1 Perceived Stress Scale
YOUR FEELINGS AND THOUGHTS
Please read each group of statements carefully, then pick out one statement in each group which best describes how often you felt or thought a certain way. Tick the statement you have picked.
1. In the last month, how often have you been upset because of something that happened unexpectedly?
never
almost never
sometimes
fairly often
very often
0
1
2
3
4
2. In the last month, how often have you felt that you were unable to control the important things in your life?
never
almost never
sometimes
fairly often
very often
0
1
2
3
4
3. In the last month, how often have you felt nervous and "stressed"?
never
almost never
sometimes
fairly often
very often
0
1
2
3
4
4. In the last month, how often have you felt confident about your ability to handle your personal problems?
never
almost never
sometimes
fairly often
very often
0
1
2
3
4
5. In the last month, how often have you felt that things were going your way?
never
almost never
sometimes
fairly often
very often
0
1
2
3
4
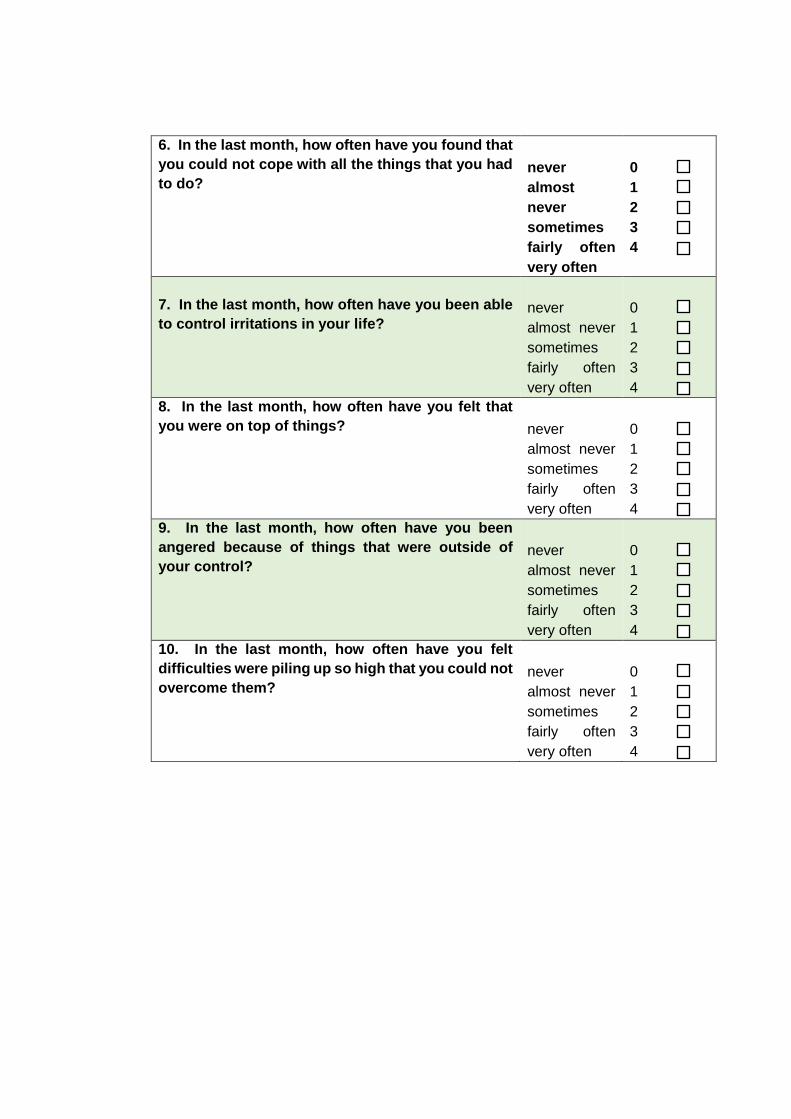
6. In the last month, how often have you found that
you could not cope with all the things that you had
to do?
never
almost
never
sometimes
fairly often
very often
0
1
2
3
4
7. In the last month, how often have you been able
to control irritations in your life?
never
almost never
sometimes
fairly often
very often
0
1
2
3
4
8. In the last month, how often have you felt that
you were on top of things?
never
almost never
sometimes
fairly often
very often
0
1
2
3
4
9. In the last month, how often have you been
angered because of things that were outside of
your control?
never
almost never
sometimes
fairly often
very often
0
1
2
3
4
10. In the last month, how often have you felt
difficulties were piling up so high that you could not
overcome them?
never
almost never
sometimes
fairly often
very often
0
1
2
3
4

538
1.2 Childhood Experience of Care and Abuse Questionnaire
YOUR CHILDHOOD EXPERIENCE
The following section is are about how you remember your mother and father in your first
17 years.
Please read each statement carefully. Each statement is rated on a 5-point scale from ‘yes definitely’ to ‘no, not at all’. Please pick out the number which best describes how you felt and circle it.
As you remember your mother figure in your first 17 years:
Yes definitely Unsure No, not at all
1. She was very difficult to
please…. 5 4 3 2 1
2. She was concerned about my
worries…. 5 4 3 2 1
3. She was interested in how I did at school….
5 4 3 2 1
4. She made me feel
unwanted…. 5 4 3 2 1
5. She tried to make me feel
better
when I was upset….
5 4 3 2 1

Yes definitely Unsure No, not at all
6. She was very critical of me…. 5 4 3 2 1
7. She would leave me
unsupervised before I was 10
years old….
5 4 3 2 1
8. She would usually have time
to talk to me…. 5 4 3 2 1
9. At times she made me feel like I was a nuisance….
5 4 3 2 1
10. She often picked on me
unfairly…. 5 4 3 2 1
11. She was there if I needed
her…. 5 4 3 2 1
12. She was interested in who my friends were….
5 4 3 2 1
13. She was concerned about my
whereabouts…. 5 4 3 2 1
14. She cared for me when I was
ill…. 5 4 3 2 1

540
Yes definitely Unsure No, not at all
As you remember your father figure in your first 17 years:
Yes definitely Unsure No, not at all
15. She neglected my basic
needs (e.g. food and clothes)…. 5 4 3 2 1
16. She did not like me as much
as my brothers and sisters….
(leave blank if no siblings)
5 4 3 2 1
1. He was very difficult to please….
5 4 3 2 1
2. He was concerned about my worries….
5 4 3 2 1
3. He was interested in how I did at school….
5 4 3 2 1
4. He made me feel unwanted…. 5 4 3 2 1
5. He tried to make me feel better when I was upset….
5 4 3 2 1

Yes definitely Unsure No, not at all
6. He was very critical of me…. 5 4 3 2 1
7. He would leave me unsupervised before I was 10 years old….
5 4 3 2 1
8. He would usually have time to talk to me….
5 4 3 2 1
9. At times he made me feel like I was a nuisance….
5 4 3 2 1
10. He often picked on me unfairly….
5 4 3 2 1
11. He was there if I needed him….
5 4 3 2 1
12. He was interested in who my friends were….
5 4 3 2 1
13. He was concerned about my whereabouts….
5 4 3 2 1

542
Yes definitely Unsure No, not at all
14. He cared for me when I was ill….
5 4 3 2 1
15. He neglected my basic needs (e.g. food and clothes)….
5 4 3 2 1
16. He did not like me as much as my brothers and sisters…. (leave blank if no siblings)
5 4 3 2 1

The following section is about physical punishment by a parent figure or other household
member.
17a. When you were a child or a teenager
were you ever hit repeatedly with an
implement (such as belt or stick), or
punched, kicked or burnt by someone in the
household?’
Yes No
If you answered ‘yes’ to question 17a, please continue to question 17b. If you answered
‘no’ to question 17a please continue to question 18.
Mother figure Father figure
The following section is about unwanted sexual experiences before age 17.
17b. How old were you when it began?
Age……..…
Age….......
17c. Did the hitting happen on more than one occasion?
Yes No
Yes No
17d. How were you hit? Please circle as appropriate
Belt or stick Punched/kicked Hit with hand Other
Belt or stick Punched/kicked Hit with hand Other
17e. Were you ever injured e.g. bruises, black eyes, broken limbs?
Yes No
Yes No
17f. Was this person so angry they seemed out of control?
Yes No
Yes No

544
If you answered ‘yes’ or ‘unsure’ to any of the three questions above, please continue to
question 63. If you answered ‘no’ to all the three questions above, you have finished the
questionnaire.
18. When you were a child or teenager did
you ever have any unwanted sexual
experiences?
Yes No Unsure
19. Did anyone force you or persuade you to
have sexual intercourse against your wishes
before age 17?
Yes No Unsure
20. Can you think of any upsetting sexual
experiences before age 17 with a related adult
or someone in authority (e.g. teacher)?
Yes No Unsure
First
experience
Other
experience
21a. How old were you when it began?
Age……..…
Age….......
21b. Was the other person someone you knew? Yes No
Yes No
First
experience
Other
experience
21c. Was the other person a relative? Yes No
Yes No
21d. Did the other person live in your
household?
Yes No
Yes No

THANK YOU FOR YOUR TIME
21e. Did this person do it to you on more than
one occasion?
Yes No
Yes No
21f. Did it involve touching private parts of your
body?
Yes No
Yes No
21g. Did it involve touching private parts of the
other person’s body?
Yes No
Yes No
21h. Did it involve sexual intercourse? Yes No
Yes No

546
1.3 Center for Epidemiologic Studies Depression Scale
Study participants were asked about the occurrence (yes/no) of eight depressive
symptoms:
“Now think about the past week and the feelings you have experienced. Please tell me
if each of the following was true for you much of the time during the past week”:
a) Much of the time during the past week, you felt depressed?
1 Yes
2 No
b) Much of the time during the past week, you felt that everything you did was an
effort?
1 Yes
2 No
c) Much of the time during the past week), your sleep was restless?
1 Yes
2 No
d) Much of the time during the past week, you were happy?
1 Yes
2 No
e) Much of the time during the past week, you felt lonely?
1 Yes
2 No
f) Much of the time during the past week, you enjoyed life?
1 Yes
2 No
g) Much of the time during the past week, you felt sad?
1 Yes
2 No

1.4 Kaplan-Meier Survival curves
(A) (B)
(C) (D)
Curves provided for all-cause and CVD mortality, stratified by sex.
Abbreviations: CRP = C-reactive protein; depr = depressive symptoms; CVD =
cardiovascular disease. (A) = all-cause mortality in men; (B) = all-cause mortality in
women; (C) = CVD mortality in men; (D) = CVD mortality in women.