
Creating Web Services in Lotus Domino and Consuming them ...

Models for Domino Effect Analysis in Chemical Process Industries Faisal I. Khan and S. A. Abbasi
Computer Aided Environmental Management Unit, Centre for Pollution Control and Energy Technology, Pondicherry University, Kalapet, Pondicherry-605 014, India
I n the risk assessment parlance, especially with refer- ence to chemical process industries, the term “domino effect” is used to denote “chain of accidents, ” or situa- tions when a fire/explosion/missile/toxic load gener- ated by an accident in one unit in an industry causes secondary and higher order accidents in other units. 7be multi-accident catastrophe which occurred in a re- finery at Vishakhapatnam, India, on September 14, 1997, claiming 60 lives and causing damages to prop erty worth over Rs 600 million, is the most recent exam- ple of the damage potential of domino effect.
But, even as the domino effect has been documented since 1947, very little attention has been paid towards modeling this phenomena. In this paper we have p r e vided a conceptual framework based on sets of appre priate models to forecast domino effects, and assess their likely magnitudes and adverse impacts, while conduct- ing risk assessment in a chemicalprocess industry. 72e utilizability of the framework has been illustrated with a case study.
INTRODUCTION
The biggest industrial accident of the 1990s-the “HPCL Disaster” (also known as “The Vishakhapatnam Disaster”) which occurred on September 14, 1997 at the HPCL (Hindustan Petroleum Corporation Limited) refinery near the city of Vishakhapatnam, India, has brought into sharp focus the destructive potential of domino effect vis a vis in- dustrial accidents. It was this effect (also variously called “cascading effect” or “chain of accidents”) which was re- sponsible for a single failure in the HPCL refinery with lim- ited damage potential to escalate into a series of major ac- cidents, eventually claiming over 60 lives, causing damage to property worth over Rs 600 million ($20 million), aod terrorizing a sprawling city of over 2 million inhabitants
On September 14, 1997 one of the eight Korton spheres, filled with LPG/crude/kerosene and situated near the main gate of the HPCL refinery, caught fire at 6:40 a.m. It then exploded (Figure 1) rocking the entire city and making people think they have experienced an earthquake. The second sphere exploded 15 minutes later and before noon the others also caught fire. The tanks were all full, with crude imports unloaded at the HPCL berth just a few days previously. Fire spread all over the place. People, particu-
k21.
larly those living in the vicinity of the refinery, ran for their lives. As the refinery is located in a densely populated in- dustrial belt with several other major industries nearby, a large number of people were directly effected by the hap- penings at HPCL. Huge tongues of flames and thick black smoke billowed into the sky and joined the hovering mon- soon clouds. A sharp shower brought the soot down on the people who saw their white shirts turn black. The rain wa- ter flooding the roads was also black and murky.
With both the entrances to the refinery blocked by burn- ing tanks, neither the fire tenders nor the officials could en- ter the premises for several hours. Only when the contents in the tanks were burnt out could they venture in.
It rained again later in the evening preceded by strong winds when the flames lingered low and closer to the ground. This again created panic among the public but soon more rain poured down to provide some relief.
The death toll which eventually crossed 60 would have been higher had the fire started half-an-hour later than it did, when the first shift staff would have come in to relieve the night shift. And Sunday being a holiday, the adminis- trative personnel, who number over 200, were saved as they were not on duty [ 2 2 ] .
The deep scars on the collective psyche of the Vishakhapatnam residents as a result of the accidents can be gauged from what happened 9 days after the catastro- phe. A loud sound created by some innocent activity near a naphtha tank’fn the HPCL confines on September 23,1997 generated such panic that workers on duty nearby fled from
- _ _ _ 4
FIGURE 1
1 Adverse impact8
A- H@ l a d
H a l o d md ehooh w w
Most probable sequence of events leading to the HPCL’s Vishakhapatnam disaster. Thick- ness of the lines represents the intensity of the heat load impact.
Process Safety Progress (Vol. 17, No. 2) Summer 1998 107

the scene asking safety personnel of HPCL to raise an alarm which they promptly did. This helped to spread more panic all over the refinery campus and soon the entire Vishakha- patnam city was gripped with fear. People residing near the refinery complex ran helter-skelter, schools abruptly closed down, shops downed shutters and the entire region was plunged into a war-like situation.
Eevne though the HPCL‘s Vishakhapatnam disaster is one of the biggest industrial disasters involving domino effect, it is neither the first instance of its type nor the worst. Well-documented instances of chain of accidents in chemi- cal process industries have been occurring since 1940s; the worst such accident-in terms of death toll-had occurred jn Mexico City on November 19, 1984. The accident, which also involved petrochemicals, claimed 650 lives (Pietersen [29]). Table 1 presents an illustrative list of some of the ma- jor domino accidents that have occurred during the last 30 years.
MODELING OF DOMINO EFFECTS
In spite of the destructive capability of domino acci- dents, and the potential risk which many industries face worldwide, this phenomena has received much less atten- tion than other aspects of risk assessment.
A thorough scan of primary literature based on CD-ROM, INSPECT, and INDEX searches, as well as a direct search of books and journals, reveals that the available reports on domino effect are by-and-large confined to qualitative de- scription and interpretations of the events that took place during some of the multiple accidents occurring in the past. For example Kletz [19, 201, Pietersen [29, 303, Mallikaraju- nan et al. [23], Pritchard b2], Bagster and Pitblado [ I ] , Prugh b4], and Lees [22] have described such past multi- ple accident events and have discussed the various possi- ble ways in which one accident had led to another. The paucity of quantitative studies on this subject can be gauged from the fact that the 3500-page magnum opus by Lees [22l on risk assessment in process industries contains barely two-page worth of material on domino effect.
A rare quantitative study on domino effect has been re- ported recently by Latha et al. [ZI] . They have focused on a chain of accidents initiated by fire and have conceptual- ized various ways in which a fire can initiate domino ef- fect. They have also tried to quantify the heat loads gener- ated by various types of fires, the “strengths” of the pri- mary accidents caused, and the mechanisms by which heat load would disperse and cause vessel failures. But, useful as this work is, it is confined to only a few aspects of fire- related domino effects. Our careful study of past accidents has indicated that other accident events besides fire can trigger a chain of accidents. Indeed some of the explosions are so powerful that they can simultaneously cause more than one chain of accidents.
In this paper we have a) catalogued various types of events which can initiate domino effect, b) presented mod- els for analyzing and assessing these events, and c) devel- oped a framework for conducting domino effect analysis in chemical process industries. The applicability of the frame- work has been demonstrated with an illustrative case study.
EVENTS THAT CAN INITIATE DOMINO EFFECT
The following events can trigger domino effect:
a) fire, b) explosions,
i) blast waves, ii) missiles,
c) toxic release d) simultaneous and interactive impacts of fire and
explosion.
To assess the likelihood of occurrence of these events, their damage potential, and to forecast whether domino ef- fects would occur and in what sequence, deterministic models must be used in conjunction with probabilistic analysis. The former type of models are useful in quantify- ing physical and chemical processes such as the size of a leak, chemical release mode and rate, dispersion (includ- ing cloud formation), type of explosion and its intensity,
~~~~ ~~~
TABLE 1. List of the Important Accidents Involving Domino Effect (22,25)
Location Chemical Date Deaths Injury
Texas City, USA Nigata, Japan Feyzin, France Texas City, USA Crescent City, USA Beek, The Netherlands Westwego, USA Galveston, USA Texas City, Texas Borger, USA Livingston, US Mexico City, Mexico Antwerp, Belgium Antwerp, Belgium Pasadena, USA Nagothane, India Bradford, UK Vishakhapatnam, India
Ammonium nitrate Natural gas Propane Butadiene Liquefied petroleum gas (LPG) Pressurized Naptha Grain Grain Liquefied petroleum gas (LPG) Light hydrocarbons Petrochemicals LPG Ethylene oxide Ethylene oxide Isobutane Ethane and propane Azodiisobutyronitrile (AZDN) LPG
April, 1947 June, 1964 January, 1966 October, 1969 June, 1970 November, 1975 December, 1977 December, 1977 November, 1978 January, 1980 September, 1982 November, 1984 July, 1987 March, 1989 October, 1989 November,l990 July, 1992 September, 1997
552 3000
18 81 13 5 0 66
14 104 36 10 15 5 7 10 0 41 No details
650 6400 No details 2 5
23 103 31 63
60
3
No details
108 Summer 1998 Process Safety Progress (Vol. 17, No. 2)
heat/missile/shock wave loads generated, etc. The latter type, which are based on careful recapitulation and analy- sis of past accidents, are needed to work out the probabili- ties of equipment failure, direction of missiles, direction of fire ball/toxic cloud movement, etc.
While choosing the models and conducting analysis based on them one has to be conscious of the following:
a) the computed magnitudes of incident heat and shock- wave effects would have a measure of uncertainty;
b) the stress/strain patterns in vessels effected by fire or fire-explosion combinations would be complex and dif- ficult to quantify with precision;
c) external and transient factors such as wind direction can play a major role;
d) simultaneous occurrence of heat and mass transfer, made complex by transient and rapidly changing nature and magnitudes of the initiating events such as fire due to leakage in a storage vessel, can contribute to the un- certainty.
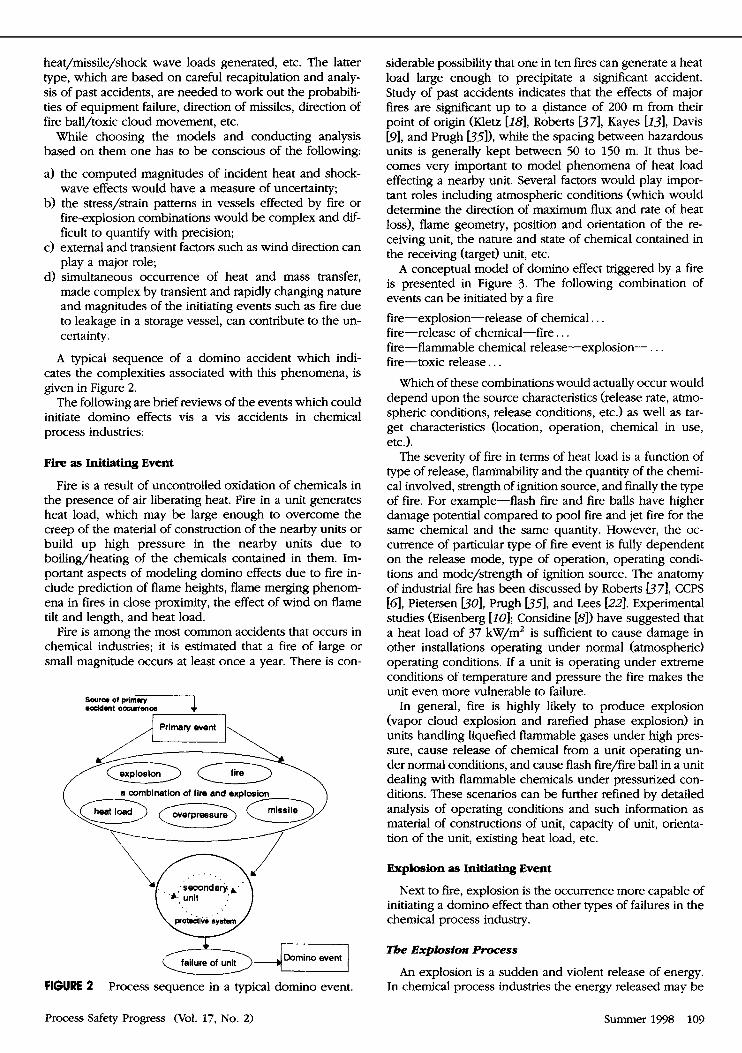
A typical sequence of a domino accident which indi- cates the complexities associated with this phenomena, is given in Figure 2.
The following are brief reviews of the events which could initiate domino effects vis a vis accidents in chemical process industries:
Fjre as Initiating Event
Fire is a result of uncontrolled oxidation of chemicals in the presence of air liberating heat. Fire in a unit generates heat load, which may be large enough to overcome the creep of the material of construction of the nearby units or build up high pressure in the nearby units due to boiling/heating of the chemicals contained in them. Im- portant aspects of modeling domino effects due to fire in- clude prediction of flame heights, flame merging phenom- ena in fires in close proximity, the effect of wind on flame tilt and length, and heat load.
Fire is among the most common accidents that occurs in chemical industries; it is estimated that a fire of large or small magnitude occurs at least once a year. There is con-
a combination of fire and explosion
FIGURE 2 Process sequence in a typical domino event.
siderable possibility that one in ten fires can generate a heat load large enough to precipitate a significant accident. Study of past accidents indicates that the effects of major fires are significant up to a distance of 200 m from their point of origin (Kletz [181, Roberts 1371, Kayes [I.?], Davis w], and Prugh 135]), while the spacing between hazardous units is generally kept between 50 to 150 m. It thus be- comes very important to model phenomena of heat load effecting a nearby unit. Several factors would play impor- tant roles including atmospheric conditions (which would determine the direction of maximum flux and rate of heat loss), flame geometry, position and orientation of the re- ceiving unit, the nature and state of chemical contained in the receiving (target) unit, etc.
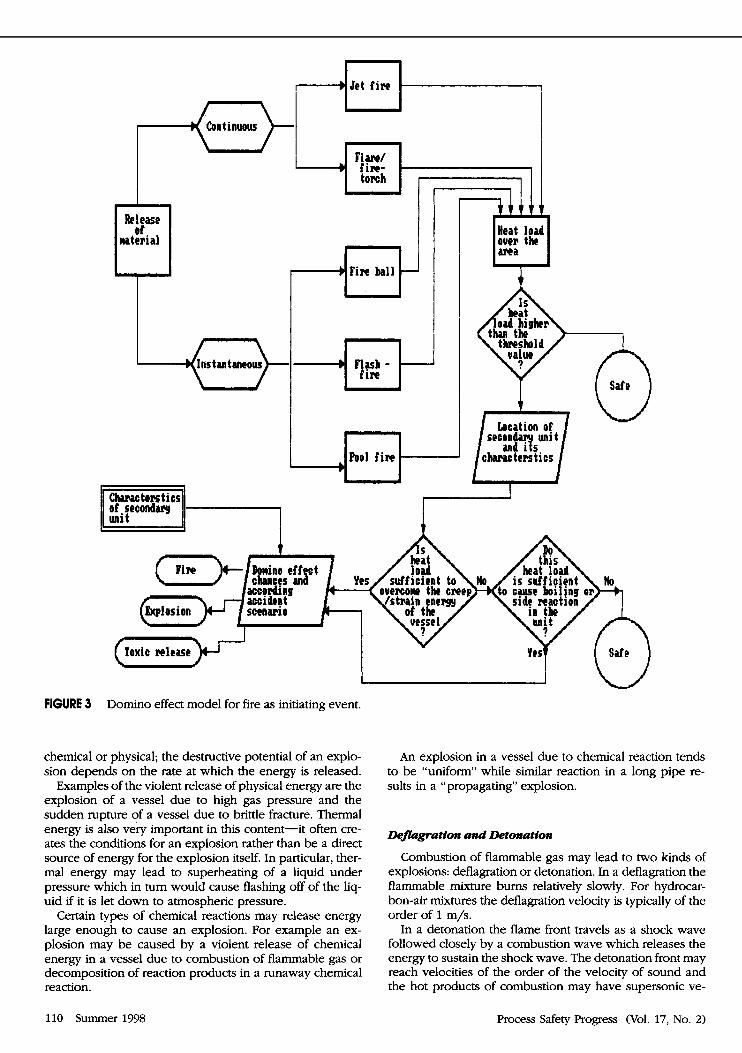
A conceptual model of domino effect triggered by a fire is presented in Figure 3. The following combination of events can be initiated by a fire fire-explosion-release of chemical. . . fire-release of chemical-fire . . . fire-flammable chemical release-explosion- . . . fire-toxic release. . .
Which of these combinations would actually occur would depend upon the source characteristics (release rate, atmo- spheric conditions, release conditions, etc.) as well as tar- get characteristics (location, operation, chemical in use, etc.).
The severity of fire in terms of heat load is a function of type of release, flanimability and the quantity of the chemi- cal involved, strength of ignition source, and finally the type of fire. For example-flash fire and fire balls have higher damage potential compared to pool fire and jet fire for the same chemical and the same quantity. However, the oc- currence of particular type of fire event is fully dependent on the release mode, type of operation, operating condi- tions and mode/strength of ignition source. The anatomy of industrial fire has been discussed by Roberts b71, CCPS [a, Pietersen 1301, Prugh 13-51, and Lees [22]. Experimental studies (Eisenberg [IO]; Considine [8]) have suggested that a heat load of 37 kW/m2 is sufficient to cause damage in other installations operating under normal (atmospheric) operating conditions. If a unit is operating under extreme conditions of temperature and pressure the fire makes the unit even more vulnerable to failure.
In general, fire is highly likely to produce explosion (vapor cloud explosion and rarefied phase explosion) in units handling liquefied flammable gases under high pres- sure, cause release of chemical from a unit operating un- der normal conditions, and cause flash fire/fire ball in a unit dealing with flammable chemicals under pressurized con- ditions. These scenarios can be further refined by detailed analysis of operating conditions and such information as material of constructions of unit, capacity of unit, orienta- tion of the unit, existing heat load, etc.
Explosion as Initiating Event
Next to fire, explosion is the occurrence more capable of initiating a domino effect than other types of failures in the chemical process industry.
The Explosfon Process
An explosion is a sudden and violent release of energy. In chemical process industries the energy released may be
Process Safety Progress Wol. 17, No. 2) Summer 1998 109
chemical or physical; the destructive potential of an explo- sion depends on the rate at which the energy is released.
Examples of the violent release of physical energy are the explosion of a vessel due to high gas pressure and the sudden rupture of a vessel due to brittle fracture. Thermal energy is also very important in this content-it often cre- ates the conditions for an explosion rather than be a direct source of energy for the explosion itself. In particular, ther- mal energy may lead to superheating of a liquid under pressure which in turn would cause flashing off of the liq- uid if it is let down to atmospheric pressure.
Certain types of chemical reactions may release energy large enough to cause an explosion. For example an ex- plosion may be caused by a violent release of chemical energy in a vessel due to combustion of flammable gas or decomposition of reaction products in a runaway chemical reaction.
An explosion in a vessel due to chemical reaction tends to be “uniform” while similar reaction in a long pipe re- sults in a “propagating” explosion.
Deflagrrarfon and Detorpatim
Combustion of flammable gas may lead to two kinds of explosions: deflagration or detonation. In a deflagration the flammable mixture burns relatively slowly. For hydrocar- bon-air mixtures the deflagration velocity is typically of the order of 1 m/s.
In a detonation the flame front travels as a shock wave followed closely by a combustion wave which releases the energy to sustain the shock wave. The detonation front may reach velocities of the order of the velocity of sound and the hot products of combustion may have supersonic ve-
110 Summer 1938 Process Safety Progress (Vol. 17, No. 2)
locities. For hydrocarbon-air mixtures the detonation veloc- ity is typically of the order of 2000-3000 m/s.
A detonation generates greater pressures and is more destructive than a deflagration. However, a deflagration may turn into a detonation, particularly when traveling down a long pipe. Where a transition from deflagration to detonation is occurring, the deflagration velocity naturally exceeds that quoted above.
S b o c k m t Waves
The damaging impact of explosions besides missiles is caused by a shock wave, or blast wave. Blast wave gener- ates overpressure which may injure people and damage equipment and buildings. The anatomy of blast waves and their damaging effects have been discussed by Mauer [Zd , Baker et al. [Z], Mantinsen et al. [24], Medard [27], Prugh 1331, Greenbook [ I l l , Venerate et al. [411, Van den Berg and Lennoy [401, and Davies D].
An explosion in air is accompanied by a very rapid rise in pressure leading to the formation of a shock wave. Such wave always travels outwards (from the epicenter of the explosion) with the higher pressure parts moving at higher velocities. After it has traveled some distance the shock wave reaches a constant limiting velocity which is greater than the velocity of sound in the air, or in the unburned gas in the case of a vapor cloud. The shock wave has a profile in which the pressure rises sharply to a peak value and then gradually tails off. As the shock wave travels out- wards the peak pressure at the shock front falls.
At some distance from the explosion center the region of positive pressure, or overpressure, in the shock wave is followed by a region of negative pressure, or under pres- sure. The underpressure is quite weak and does not ex- ceed about 4 psi.
The peak overpressure po, given by the Friedlander equation (Davies, 19931, is related to overpressure at dif- ferent instants after explosion:
p = po( 1 - t/td)exp( - cx t/td) (1)
Where p is overpressure, Po is the peak overpressure, t is the time, td is the duration time and OL is the decay param- eter.
A study of past accidents (Clancey [i’]; Eisenberg et al. [lo]; Pietersen [29]; Prugh b5]; Davies D]; Khan and Ab- basi [Id) suggests that an overpressure of 0.7 atm is nec- essary to cause damage and fatality. In industrial explo- sions this order of overpressure is observed over a distance of several hundred meters.
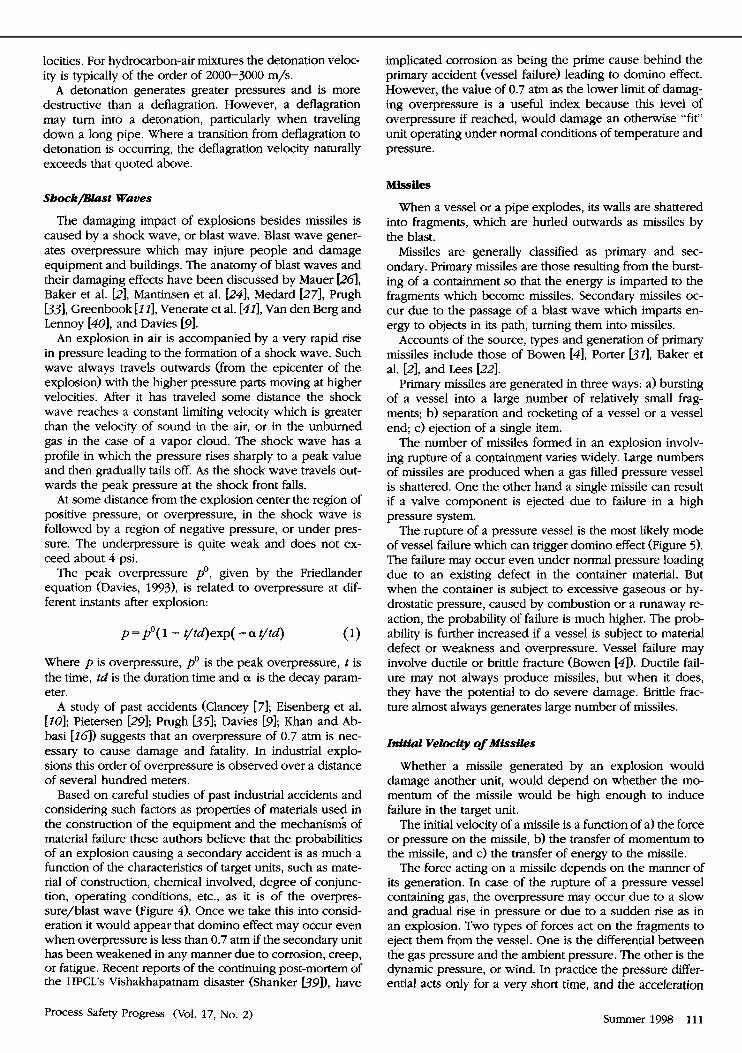
Based on careful studies of past industrial accidents and considering such factors as properties of materials used in the construction of the equipment and the mechanisms of material failure these authors believe that the probabilities of an explosion causing a secondary accident is as much a function of the characteristics of target units, such as mate- rial of construction, chemical involved, degree of conjunc- tion, operating conditions, etc., as it is of the overpres- sure/blast wave (Figure 4). Once we take this into consid- eration it would appear that domino effect may occur even when overpressure is less than 0.7 atm if the secondary unit has been weakened in any manner due to corrosion, creep, or fatigue. Recent reports of the continuing post-mortem of the HPCL’s Vishakhapatnam disaster (Shanker b9]), have
implicated corrosion as being the prime cause behind the primary accident (vessel failure) leading to domino effect. However, the value of 0.7 atm as the lower limit of damag- ing overpressure is a useful index because this level of overpressure if reached, would damage an otherwise “fit” unit operating under normal conditions of temperature and pressure.
Missiles
When a vessel or a pipe explodes, its walls are shattered into fragments, which are hurled outwards as missiles by the blast.
Missiles are generally classified as primary and sec- ondary. Primary missiles are those resulting from the burst- ing of a containment so that the energy is imparted to the fragments which become missiles. Secondary missiles oc- cur due to the passage of a blast wave which imparts en- ergy to objects in its path, turning them into missiles.
Accounts of the source, types and generation of primary missiles include those of Bowen [4], Porter bl], Baker et al. [ZI, and Lees [ZZI.
Primary missiles are generated in three ways: a) bursting of a vessel into a large number of relatively small frag- ments; b) separation and rocketing of a vessel or a vessel end; c) ejection of a single item.
The number of missiles formed in an explosion involv- ing rupture of a cootainment varies widely. Large numbers of missiles are produced when a gas filled pressure vessel is shattered. One the other hand a single missile can result if a valve component is ejected due to failure in a high pressure system.
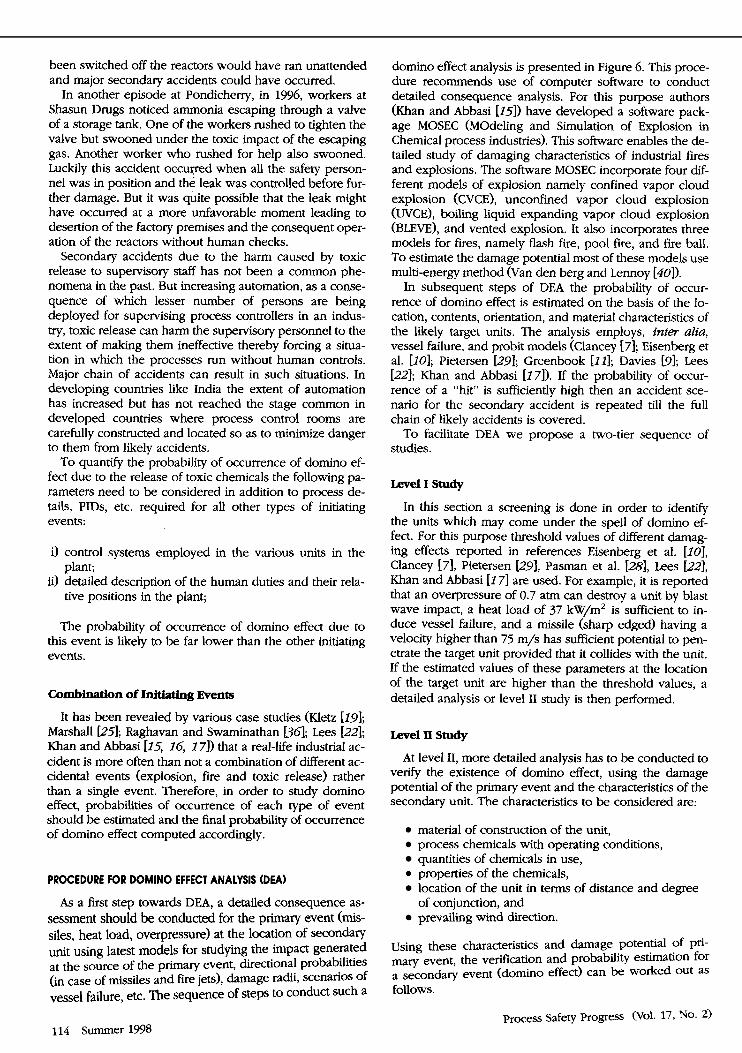
The rupture of a pressure vessel is the most likely mode of vessel failure which can trigger domino effect (Figure 5) . The failure may occur even under normal pressure loading due to an existing defect in the container material. But when the container is subject to excessive gaseous or hy- drostatic pressure, caused by combustion or a runaway re- action, the probability of failure is much higher. The prob- ability is further increased if a vessel is subject to material defect or weakness and overpressure. Vessel failure may involve ductile or brittle fracture (Bowen [4]). Ductile fail- ure may not always produce missiles, but when it does, they have the potential to do severe damage. Brittle frac- ture almost always generates large number of missiles.
Initial Velocity of M i s s i k s
Whether a missile generated by an explosion would damage another unit, would depend on whether the mo- mentum of the missile would be high enough to induce failure in the target unit.
The initial velocity of a missile is a function of a) the force or pressure on the missile, b) the transfer of momentum to the missile, and c) the transfer of energy to the missile.
The force acting on a missile depends on the manner of its generation. In case of the rupture of a pressure vessel containing gas, the overpressure may occur due to a slow and gradual rise in pressure or due to a sudden rise as in an explosion. Two types of forces act on the fragments to eject them from the vessel. One is the differential between the gas pressure and the ambient pressure. The other is the dynamic pressure, or wind. In practice the pressure differ- ential acts only for a very short time, and the acceleration
Process Safety Progress (Vol. 17, No. 2) Summer 1998 111

Zxtemol soome of Nlcm --
Uen ted explosion rl
velocity
wo I
FIGURE 4 Domino effect model for blast wave as initiating event.
c
of the fragments is due essentially to the dynamic pressure (Lees [22k Khan and Abbasi [Id).
In case of the rupture of a partition wall by an explo- sion, the forces acting on the fragments are the pressure differential (between the face of the wall and the ambient pressure) and the dynamic pressure. If the pressure inci-
dent on the wall is that of a rapidly rising blast wave and the wall configuration is such that the pressure differential across it persists until the wall ruptures, the relevant pres- sure is the reflected pressure. If, on the other hand, the pressure on the wall rises relatively slowly, the pressure differential is simply that between that pressure and the
112 Summer 1998 Process Safety Progress (Vol. 17, No. 2)

FIGURE 5
Wl osion
Q
Seconduy unit cJwacteris tics
no
t Toxic release nino effect
according rcmiwia
Domino effect model for missile effect as initiating event.
ambient pressure. In either case, the pressure differential usually acts only for very short time and the acceleration of the fragments is due mainly to the dynamic pressure.
The momentum of the missiles generated from the-burst- ing of a gas filled vessel can also be estimated as the frac- tion of the available energy which is converted into the ki- netic energy of the fragments.
To estimate the force of ejection of an item, such as valve spindle, by a high pressure jet of fluid, an approach based on conservation of momentum may be used.
The impact of a missile in causing domino effect is pri- marily related to release of chemical (Pasman et al. [28]; Khan and Abbasi [ZG, 171) from the target vessel (Figure 5). However, in conjunction with other effects like blast wave or heat load it may load to explosion, or fire as well. An explosion may simultaneously cause blast wave, heat lead, and missiles. Hence the probability of domino effect
being caused by an explosion can be quite high even though the frequency of Occurrence of explosion is lower than that of fire.
Toxic Release as an Initiating Event
In 1995 a runaway plume of acrid gases exiting from a rubber processing factory at Pillaiyarkuppam, Pondicherry, India, plunged into a nearby unit engaged in making per- fumes. The impact of the acrid plume made the workers in the factory cough and sneeze uncontrollably and when they began to choke, they ran out of the factory premises leav- ing the giant distillation units unattended.
Fortunately someone had the presence of mind to switch off the power supply before deserting the factory. It took several hours before the air in the factory was cleared and the work could be resumed. Had the power supply not
Process Safety Progress (Vol. 17, No. 2) Summer 1998 113
been switched off the reactors would have ran unattended and major secondary accidents could have occurred.
In another episode at Pondicherry, in 1996, workers at Shasun Drugs noticed ammonia escaping through a valve of a storage tank. One of the workers rushed to tighten the valve but swooned under the toxic impact of the escaping gas. Another worker who rushed for help also swooned. Luckily this accident occurred when all the safety person- nel was in position and the leak was controlled before fur- ther damage. But it was quite possible that the leak might have occurred at a more unfavorable moment leading to desertion of the factory premises and the consequent oper- ation of the reactors without human checks.
Secondary accidents due to the harm caused by toxic release to supervisory staff has not been a common phe- nomena in the past. But increasing automation, as a conse- quence of which lesser number of persons are being deployed for supervising process controllers in an indus- try, toxic release can harm the supervisory personnel to the extent of making them ineffective thereby forcing a situa- tion in which the processes run without human controls. Major chain of accidents can result in such situations. In developing countries like India the extent of automation has increased but has not reached the stage common in developed countries where process control rooms are carefully constructed and located so as to minimize danger to them from likely accidents.
To quantify the probability of occurrence of domino ef- fect due to the release of toxic chemicals the following pa- rameters need to be considered in addition to process de- tails, PIDs, etc. required for all other types of initiating events:
i) control systems employed in the various units in the
ii) detailed description of the human duties and their rela- plant;
tive positions in the plant;
The probability of occurrence of domino effect due to this event is likely to be far lower than the other initiating events.
Combination of Initiating Events
It has been revealed by various case studies (Kletz [19]; Marshall [251; Raghavan and Swaminathan DGl; Lees [ZZ]; Khan and Abbasi 115, ZG, 171) that a real-life industrial ac- cident is more often than not a combination of different ac- cidental events (explosion, fire and toxic release) rather than a single event. Therefore, in order to study domino effect, probabilities of Occurrence of each type of event should be estimated and the final probability of occurrence of domino effect computed accordingly.
PROCEDURE FOR DOMINO EFFECT ANALYSIS (DEA)
a first step towards DFA, a detailed consequence as- sessment should be conducted for the primary event (mis- siles, heat load, overpressure) at the location of secondary unit using latest models for studying the impact generated at the source of the primary event, directional probabilities (in case of missiles and fire jets), damage radii, scenarios of vessel failure, etc. The sequence of steps to conduct such a
domino effect analysis is presented in Figure 6. This proce- dure recommends use of computer software to conduct detailed consequence analysis. For this purpose authors (Khan and Abbasi [ IS ] ) have developed a software pack- age MOSEC (Modeling and Simulation of Explosion in Chemical process industries). This software enables the de- tailed study of damaging characteristics of industrial fires and explosions. The software MOSEC incorporate four dif- ferent models of explosion namely confined vapor cloud explosion (CVCE), unconfined vapor cloud explosion (UVCE), boiling liquid expanding vapor cloud explosion (BLEW), and vented explosion. It also incorporates three models for fires, namely flash fire, pool fire, and fire ball. To estimate the damage potential most of these models use multi-energy method (Van den berg and Lennoy [4O1).
In subsequent steps of DEA the probability of occur- rence of domino effect is estimated on the basis of the lo- cation, contents, orientation, and material characteristics of the likely target units. The analysis employs, inter uliu, vessel failure, and probit models (Clancey [71; Eisenberg et al. [lo]; Pietersen [29]; Greenbook LIZ]; Davies @I; Lees [22]; Khan and Abbasi [17]). If the probability of occur- rence of a “hit” is sufficiently high then an accident sce- nario for the secondary accident is repeated till the full chain of likely accidents is covered.
To facilitate DEA we propose a two-tier sequence of studies.
Level I Study
In this section a screening is done in order to identify the units which may come under the spell of domino ef- fect. For this purpose threshold values of different damag- ing effects reported in references Eisenberg et al. [ZO], Clancey 171, Pietersen [29], Pasman et al. 1.281, Lees [22], Khan and Abbasi [I 71 are used. For example, it is reported that an overpressure of 0.7 atm can destroy a unit by blast wave impact, a heat load of 37 kW/m2 is sufficient to in- duce vessel failure, and a missile (sharp edged) having a velocity higher than 75 m/s has sufficient potential to pen- etrate the target unit provided that it collides with the unit. If the estimated values of these parameters at the location of the target unit are higher than the threshold values, a detailed analysis or level I1 study is then performed.
Level II S t u d y
At level 11, more detailed analysis has to be conducted to verify the existence of domino effect, using the damage potential of the primary event and the characteristics of the secondary unit. The characteristics to be considered are:
material of construction of the unit, process chemicals with operating conditions, quantities of chemicals in use,
0 properties of the chemicals, location of the unit in terms of distance and degree
prevailing wind direction. of conjunction, and
Using these characteristics and damage potential of Pfi- mary event, the verification and probability estimation for a secondary event (domino effect) can be worked out as follows.
Process Safety Progress (Vol. 17, No. 2) 114 Summer 1998

Take one unit as p r i m unit and other as secondmy units
I I
i Develop accident scenario fop p r i m unit
t Estimate the damge potential over the study 4- ana
4
Develop accident scenario for secondary unit
t I U A t
I No
Estimate the e€€ec t
+ chances of doaino
FIGURE 6 Procedure for domino effect analysis.
Heat Load
Some 60% of the total heat radiation incident over a ves- sel would be absorbed by the vessel shell and the remain- ing 40% would be absorbed by the chemicals in the vessel to raise the temperature/pressure of the contents (Latha et al. [21]).
i) Vessel failure due to high pressure build-up
sorbed by the chemical: The probability of secondary accident due to heat ab-
0.40* q* Ar= M * Cp* DT (2)
where, Cp represents specific heat of chemical (kJ/rn*/"C), DT is temperature difference, M is mass of chemical (kg), and Ar is area of vessel (m2).
The rise in temperature can be translated in terms of pres- sure rise by using ideal gas law; assuming the content (in case of pressurized gas) as near to ideal gas. For liquefied gases the energy absorbed by the chemical would lead to the formation of vapor.
At temperature T,, the fraction of vapor generated is governed by (Kayes [Ul, Green book [ I l l ) .
f= l -exp(-Cp*(T, - T,) /Hv) (3)
and
where, Hv is heat of evaporation (kJ/kg), V is total vol- ume of chemical (m3), f is fraction of vapor and Kap is volume of vapor generated (m3).
The pressure developed in the vessel:
Process Safety Progress (Vol. 17, No. 2) Summer 1998 115

P2= n* R* T2/V , ,+P , (5)
If P2 is greater than the relief pressure, it may lead to re- lease of the chemical contained in the vessel and if it is greater than the design pressure then the vessel may burst. The degree of excess pressure and the mechanical proper- ties of the material of construction of the vessel would bear upon the severity of the secondary accident. The probabil- ity of an accident due to pressure rise given by:
id Vessel rupture due to material failure
The probability of vessel failure due to loss in the strength of the material of construction of the vessel can be computed using maximum strain theory (Bhattacharya b]). Heat load developed due to fire would raise the tempera- ture of the vessel wall (radiation is the dominant mode of the heat transfer). This rise in the temperature will reduce the maximum allowable stress of the vessel. This phenom- ena is quantified by using the following equations:
T,=[(E*u*~~-q)/(E*U)lV4 (7)
In order to quantify the impact of temperature on the max- imum allowable stress these authors have developed an empirical equation taking into consideration a total of 15 common materials of construction over a wide range (50 to 1200°C) of temperature.
Ey,, = function (temperature)
= 1 * 10' (1.858 - 0.0062* T, + 1.691 E- 0.5* Ti? -1.959E-08* $) (8)
where, Er,, is maximum allowable stress in N/m3 (prop- erty of the material of construction), and T is temperature in "C. The stress developed in the vessel due to rise in the internal pressure of the vessel is quantified using following equation (Bhattacharya L?])
where, y denotes Poisson ratio, K denotes diameter ratio, P2 is pressure in the vessel in N/m2.
Subsequently, the probability of vessel failure due to failure of the material of construction is estimated as:
PmbheatZ = EYmax/EY (10)
Finally, the probability of secondary accident due to heat load is computed using the function:
proheat = Probheatl u Pmbheat2 (11)
(12)
h b h e a t = minimum[1? { (l - m b h e a t 1 ) * (l - Pmbheat2)}]
Bhst-Load (Overpressure)
When a blast wave developed due to an explosion hits an object, it causes a diffraction/drag type of impact. The
damage likely due to such impact is measured by effective overpressure at the wave front.
Pd= Cd* p' (13)
P e = p o + Pd (14)
where, Pd is dynamic pressure, po is peak overpressure, and Cd is drag coefficient (= 0.1 for sphere, 1.2 for cylin- der, 2.0 for square; Lees 1221).
Prbhst = - 23.8 + 2.92 *In Pe (15)
Using equations 15 and 16 (Pasman et al. [28]) the proba- bility of damage due to explosion can be computed:
where f r represents probit function (function that trans- forms probit values to recent chance), and Pe is explosion pressure in Pa.
Miss& Load
The impact of missiles on the secondary units is as- sessed using three parameters:
d penetration strength, A:
Prob, = (penetration strength-thickness of vessel)/
penetration strength (17)
id impact enetgy, B:
As reported by Davies Dl and Lees [22] about 40-50% of total impact energy is utilized in raising the temperature of the contents of the secondary unit. Hence
1/4* mf * qf2 = M * Cp* DT (18)
T,=T,+DT (19)
p2/p1= W G (20)
for gases
for liquefied gas
where, Kap = f * V; f represents fraction of vapor, mf the mass of the fragment, and vf the velocity of the fragment.
Pmbs = ( Pz - Prelief)/Prelief 8 (22)
iii) Probability of collision, C:
The probability of a collision can be computed by divid- ing the volume of vessel by the total volume of the hemi- sphere of radius equal to distance between the units in- cluding diameter of the vessel.
Probe = volume of vessel/volume of hemisphere (23)
116 Summer 1998 Process Safety Progress Cvol. 17, No. 2)

Thus the probability of domino effect due to the impacts of missiles can be computed as:
Pmbhssile = minimum[ 1, { 1 - ( 1 - m b , ) * ( 1 - Pmb,)
* ( I - Pmbc)}l (25)
Finally the probability of occurrence of domino effect will be the sum of the probabilities of each contributing event and can be estimated as:
where Pmbprim, represents probability (/yr) of the pri- mary event occurrence. The applicability of the scheme can be well understood with the help of a case study. Thus, we are presenting a case study of a petrochemical complex in coming section.
APPLICATION OF DEA-An Example
We now illustrate the use of the two-tier DEA procedure with reference to its application to a petrochemical com- plex situated at Ramgarh, India. It is a multiproduct petro- chemical industry engaged in the manufacture of low den- sity polymer (LDP), high density polymer (HDP), caustic soda and other related products. As a prelude to DEA a screening was carried out of all
the units for their hazard potential. This led to the identifi- cation of these five units as highly vulnerable units: gen- eral storage farm, cracker unit, poly propylene (PP) plant, low density poly ethylene (LDPE) plant, and caustic plant. The screening also helped to identify the five most haz- ardous chemicals: butene, liquefied petroleum gas (LPG), propylene, ethylene, and chlorine. The most credible acci- dent scenarios of the primary event were then developed for each unit and a detailed consequence analysis was car- ried out.
The consequences of the primary event were then visu- alized at the secondary unit. The summary of the study is presented below.
Primary Event: General Storage Farm htene)
Butene is highly flammable and as it is stored in a liquid form, the most credible accident scenario visualized for this chemical is BLEVE followed by fire ball. The consequence analysis of this scenario, conducted using the software MOSEC, is presented in Table 2. Similar analysis for other units is also presented in Table 2. The potentiality of dam- age, if an accident occurs in this unit, to other units situ- ated 50 to 100 meters away has been assessed. The result- ing domino effects are described below.
TABLE 2. Summarized Results of Consequence Analysis of Primary Event in Various Units at Various Locations
Damaging Potential at Distance (m) Unit/Scenario
Damaging Effect 50 75 100 125
LDPE plant (ETHYLENE): CVCE followed by flash fire Heat load (kW/m) 50.55 39.35 27.15 18.73 Missile velocity (m/s) 341.52 250.1 185.3 138.75 Penetration strength (mm) 32 24 16 10
Peak over pressure (kpa) 115 95 75 63 Blast wave velocity (m/s) 471 347.3 222.2 162.6
PP Plant (PROPYLENE): CVCE followed by fire ball Heat load (kW/m) 115.32 78.23 51.4 39.71 Missile velocity (m/s) 421.31 348.45 215.3 158.31 Penetrationstrength(mm) 43 35 22 14
Peak over pressure (kpa) 157 129 98 79 Blast wave velocity (m/s) 757 514.2 368.1 247.3
General storage farm (BUTENE): BLEVE followed
Heat load (kW/m) 128.1 85.42 60.3 42.5 Missile velocity (m/s) 399.4 287.5 197.1 121.5 Penetrationstrength(mm) 37 29 17 11
Peak over pressure (kpa) 132 98 78 65 Blast wave velocity (m/s) 648.3 368.1 235.2 188.1
Cracker Unit (LPG): BLEVE followed by fire ball Heat load (kW/m) 155.5 133.1 87.55 73.23
(for 3 kg missile)
(for 3 kg missile)
by fire ball
(for 3 kg missile)
Missile velocity (m/s) - - - - Penetration strength (mm) - - - -
(for 3 kg missile) Peak over pressure (kpa) 145 110 81 68 Blast wave velocity (m/s) 701 455.6 287.6 204.4
Caustic Plant (CHLORINE): Instantaneous release
Heat load (kW/m) Missile velocity (m/s) - - - - Penetration strength (mm) - - - -
followed by dispersion - - - -
(for 3 kg missile) Peakoverpressure(kpa) 95 65 42 35 Blast wave velocity (m/s) 347.3 188.1 76.6 27.4
Domino Effect Triggered by the Prlmary Event
Cblorfne Tank (Caustic S& Unit Situated 70 Meter Away!
Level I study suggests moderate probability of domino effect due to shock wave and thermal effect.
Level I1 study verifies the same. The probability of domino effect occurrence due to blast waves is 7.5% and due to heat load is - 13% (Table 3).
The scenario for the secondary accident has been visual- ized as a sudden release of chlorine. It is because large quantity of chlorine is stored in liquid form under high pressure, hence a leak or build-up of high pressure would cause the chemical to be released instantly. The resulting
Process Safety Progress (Vol. 17, No. 2) Summer 1998 117
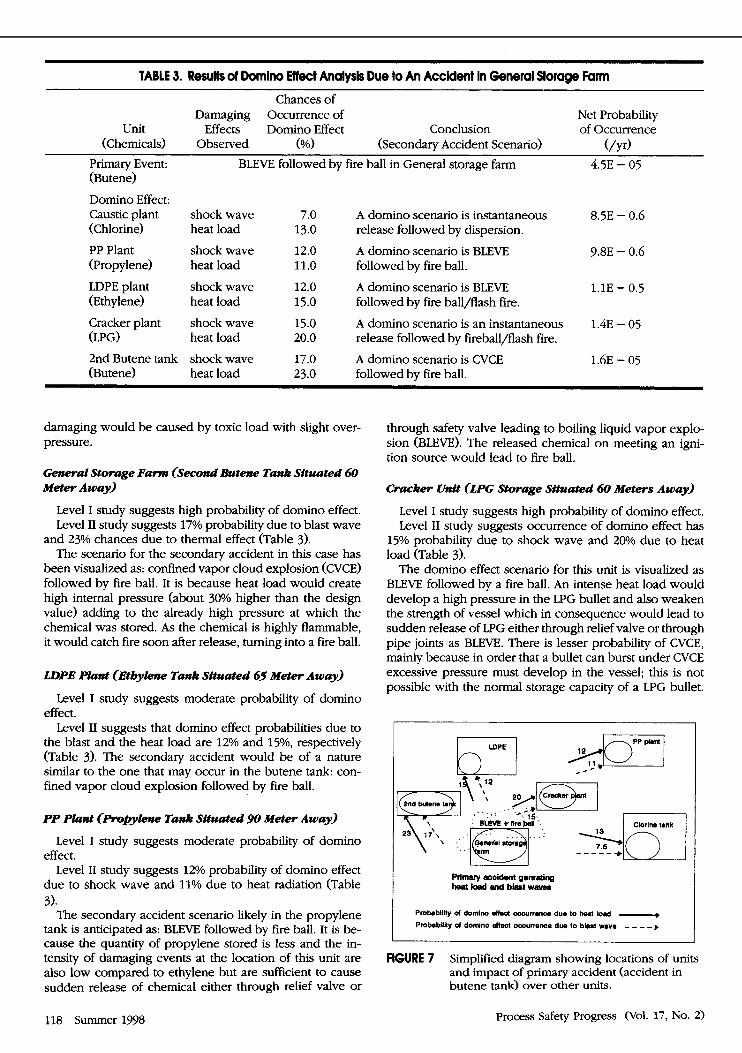
TABLE 3. Results of Domino Effect Analysis Due to An Accident in General Storage Farm
Chances of Damaging Occurrence of Net Probability
unit Effects Domino Effect Conclusion of Occurrence (Chemicals) Observed (%I (Secondary Accident Scenario) (/Yr)
Primary Event: BLEVE followed by fire ball in General storage farm 4.5E - 05 (Butene)
Domino Effect:
(Chlorine) heat load 13.0 release followed by dispersion.
(Propylene) heat load 11.0 followed by fire ball.
(Ethylene) heat load 15.0 followed by fire ball/flash fire.
Cracker plant shock wave 15.0 A domino scenario is an instantaneous 1.4E - 05 (LPG) heat load 20.0 release followed by fireball/flash fire.
(Butene) heat load 23.0 followed by fire ball.
Caustic plant shock wave 7.0 A domino scenario is instantaneous 8.5E - 0.6
PP Plant shock wave 12.0 A domino scenario is BLEVE 9.8E - 0.6
LDPE plant shock wave 12.0 A domino scenario is BLEVE 1.1E - 0.5
2nd Butene tank shock wave 17.0 A domino scenario is CVCE 1.6E - 05
damaging would be caused by toxic load with slight over- pressure.
General Storage F a r m (Second Butene Tank Slhrated 60 Meter A w a y )
Level I study suggests high probability of domino effect. Level I1 study suggests 17% probability due to blast wave
and 23% chances due to thermal effect (Table 3). The scenario for the secondary accident in this case has
been visualized as: confined vapor cloud explosion (CVCE) followed by fire ball. It is because heat load would create high internal pressure (about 30% higher than the design value) adding to the already high pressure at which the chemical was stored. As the chemical is highly flammable, it would catch fire soon after release, turning into a fire ball.
LDPE Plant ( E t b y h Tank Situated 65 Meter A w a y )
Level I study suggests moderate probability of domino effect.
Level I1 suggests that domino effect probabilities due to the blast and the heat load are 12% and 15%, respectively (Table 3). The secondary accident would be of a nature similar to the one that may occur in the butene tank: con- fined vapor cloud explosion followed by fire ball.
PP Plant ( P m p y h Tank Situated 90 Meter A w a y )
Level I study suggests moderate probability of domino effect.
Level 11 study suggests 12% probability of domino effect due to shock wave and 11% due to heat radiation (Table 3).
The secondary accident scenario likely in the propylene tank is anticipated as: BLEVE followed by fire ball. It is be- cause the quantity of propylene stored is less and the in- tensity of damaging events at the location of this unit are also low compared to ethylene but are sufficient to cause sudden release of chemical either through relief valve or
through safety valve leading to boiling liquid vapor explo- sion (BLEW). The released chemical on meeting an igni- tion source would lead to fire ball.
Cracker Unit (LPG Storage Si tuated 60 Meters A w a y )
Level I study suggests high probability of domino effect. Level I1 study suggests Occurrence of domino effect has
15% probability due to shock wave and 20% due to heat load (Table 3).
The domino effect scenario for this unit is visualized as BLEVE followed by a fire ball. An intense heat load would develop a high pressure in the LPG bullet and also weaken the strength of vessel which in consequence would lead to sudden release of LPG either through relief valve or through pipe joints as BLEVE. There is lesser probability of CVCE, mainly because in order that a bullet can burst under CVCE excessive pressure must develop in the vessel; this is not possible with the normal storage capacity of a LPG bullet.
FIGURE 7 Simplified diagram showing locations of units and impact of primary accident (accident in butene tank) over other units.
118 Summer 1998 Process Safety Progress (Vol. 17, No. 2)

TABLE 4. Results of Domino Effect Analysis Due to An Accident in PP Plant
Chances of Damaging Occurrence of Net Probability
Unit Effects Domino Effect Conclusion of Occurrence (Chemicals) Observed (%I (Secondary Accident Scenario) (/Yr)
Primary Event: CVCE followed by flash fire in PP plant 5.OE - 05 (Ethylene)
Domino Effect:
(Chlorine) heat load 13.0 instantaneous release followed Caustic plant shock wave 11.0 A domino scenario is 1.3E - 0.5
missile 5.0 by dispersion.
General storage shock wave 15.0 A domino scenario is 1.7E - 05 (Butene) heat load 14.0 CVCE followed by fire ball.
missile 9.0 LDPE plant shock wave 11.0 A domino scenario is BLEVE 1.4E - 05 (Ethylene) heat load 12.0 followed by fire ball/flash fire.
missile 7.0
Cracker plant shock wave 8.0 A domino scenario is an 1.1E - 05 (LPG) heat load 11.0 instantaneous release followed
missile 5.0 by fire ball/flash fire.
~~
TABLE 5. Results of Domino Effect Analysis Due to An Accident in LDPE Plant
Chances of Damaging Occurrence of Net Probability
Unit Effects Domino Effect Conclusion of Occurrence (Chemicals) Observed (%I (Secondary Accident Scenario) (/Yr)
Primary Event: CVCE followed by fire ball in LDPE plant 3.OE - 06 (Propylene)
Domino Effect:
(Chlorine) heat load 10.0 through relief valve or leakage.
(Butene) heat load 13.0 followed by fire ball/flash fire.
Caustic plant shock wave 9.0 A domino scenario is toxic release 5.4E - 07
General storage shock wave 9.0 A domino scenario can be BLEVE 8.6E - 07
missile 10.0
PP plant shock wave 7.0 A domino scenario can be CVCE 7.4E - 07 (Propylene) heat load 11.0 followed by fire ball/flash fire.
missile 9.0 Cracker plant shock wave 6.0 A domino scenario can be a 5.6E - 07 (LPG) heat load 9.0 instantaneous release followed either
missile 5.0 by UVCE or fire ball.
Of course, the release of LPG on ignition would lead to flash fire or fire ball depending upon the quantity of LPG released.
A simplified block diagram showing the Occurrence of domino effect in various units triggered by a primary acci- dent in the butene tank is presented in Figure 7. It is evi- dent that the second butene tank situated near the primary accident site is highly vulnerable. The chlorine tank is comparatively safe.
Similar studies were conducted to analyze the domino effect due to accidents in one or other of these units PP plant, LDPE plant, cracker unit, and caustic plant. The re- sults are summarized in Tables 4-7.
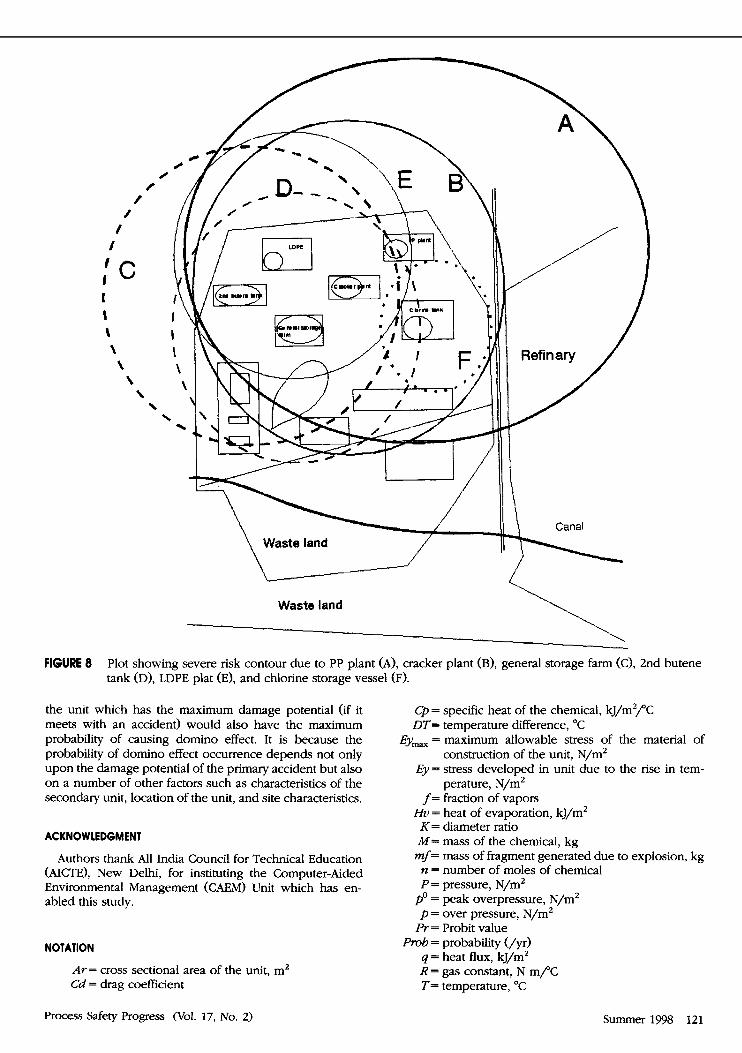
Consequence analysis covering all the hazardous units reveals that, as far as the primary event is concerned, PP plant has the maximum damage potential as it causes lethal overpressure over the largest area. Risk contours, signify- ing an individual risk factor greater than 1 * lO-*/yr due to the cumulative effect of the primary and secondary acci- dents, are plotted over the industry's map in Figure 8. It is evident that an accident in PP plant would endanger an area of more than 300 m radius, while the risk contour for cracker plant would encompass an area of about 200 m ra- dius. An accident in the chlorine storage vessel would bring an area of about 70 m radius under severe risk, the lowest area-of-lethal-impact of the scenarios considered.
Process Safety Progress (Vol. 17, No. 2) Summer 1998 119

TABLE 6. Results of Domino Effect Analysis Due to an Accident in Cracker Unit
Chances of Damaging Occurrence of Net Probability
Unit Effects Domino Effect Conclusion of Occurrence (Chemicals) Observed (%I (Secondary Accident Scenario) (/Yr)
1.OE - 04 Primary Event:
Domino Effect:
(Chlorine) heat load 21.0 followed by dispersion.
General storage shock wave 19.0 A domino scenario is BLEVE 3.9E - 05 (Butene) heat load 25.0 followed by flash fire.
PP plant shock wave 13.0 A domino scenario can be CVCE 2.8E - 05 (Propylene) heat load 17.0 followed by fire ball/flash fire.
(Ethylene) heat load 15.0 followed by fire ball.
BLEVE followed by fire ball in Cracker unit (LPG)
Caustic plant shock wave 17.0 A domino scenario is BLEVE 3.4E - 05
LDPE plant shock wave 10.0 A domino scenario can be CVCE 2.4E - 05
TABLE 7. Results of Domino Effect Analysis Due to an Accident in Caustic Plant
Chances of Damaging Occurrence of Net Probability
Unit Effects Domino Effect Conclusion of Occurrence (Chemicals) Observed (%I (Secondary Accident Scenario) VYr)
Primary Event: (Chlorine)
Domino Effect Cracker plant
General storage (LPG)
PP plant (Pro pylene)
LDPE plant (Ethylene)
Instantaneous release followed by dispersion in caustic soda plant 1.OE - 06
shock wave 3.0 A very low chance of LPG 3.OE - 08
shock wave 1 .o Very low chances of (Butene) butene 1.OE - 08
shock wave 7.0 A domino scenario may be propylene 7.OE - 08
release followed by flash fire.
release followed by flash fire.
release followed by flash fire.
release followed by flash fire. shock wave 0.00 A domino scenario may be ethylene -
In summary, the cracker plant has the potential of caus- ing the most damaging primary accident and also has the maximum probability to lead to domino effect. The intensi- ties of blast wave, missiles, and heat load would be lethal over an area of 200 meters radius if an accident occurs in this plant. The plant has several vulnerable units close to it which would facilitate a long chain of accidents. On the other hand an accident in caustic plant has the least dam- age potential and also the least probability of causing sec- ondary accidents.
SUMMARY AND CONCLUSIONS
Study of the probability of occurrence of domino effect and forecasting the impacts of such chain of accident oc- curs, should be an integral part of any risk assessment study. This is borne out by the history of several past acci- dents including the most recent one-and one of the
biggest ever-which occurred at the HPCL's refinery at Vishakhapatnam, India on September 14, 1997.
Domino effect can be initiated by five types of primary events-fire, overpressure/shock waves, missiles, toxic load, and a combination of one or more of these.
In this paper we have presented details of the mecha- nisms by which domino effect is initiated by the five types of primary accidents mentioned above. We have then pre- sented models for determining the probabilities of occur- rence of these events, developing secondary (and higher order) accident scenarios, forecasting their consequences, and developing disaster prevention/management strate- gies based on these studies.
A two-tier procedure for conducting a typical domino ef- fect study has been presented. The applicability of the pro- cedure has been demonstrated with the help of a case study.
One of the interesting and revealing observations that emerges from the case study is that it is not necessary that
120 Summer 1938 Process Safety Progress (Vol. 17, No. 2)
\ 1
Waste land
\ \
FIGURE 8 Plot showing severe risk contour due to PP plant (A), cracker plant (B), general storage farm (C), 2nd butene tank (D), LDPE plat (E), and chlorine storage vessel (F).
the unit which has the maximum damage potential (if it meets with an accident) would also have the maximum probability of causing domino effect. It is because the probability of domino effect Occurrence depends not only upon the damage potential of the primary accident but also on a number of other factors such as characteristics of the secondary unit, location of the unit, and site characteristics.
ACKNOWLEDGMENT
Authors thank All India Council for Technical Education (AICTE), New Delhi, for instituting the Computer-Aided Environmental Management (CAEM) Unit which has en- abled this study.
NOTATION
Ar= cross sectional area of the unit, m2 Cd = drag coefficient
Cp = specific heat of the chemical, kJ/m2/'C DT= temperature difference, "C
EY,, - - maximum allowable stress of the material of
Ey= stress developed in unit due to the rise in tem- construction of the unit, N/mz
perature, N/m2 f = fraction of vapors Hv = heat of evaporation, kJ/mz K = diameter ratio M = mass of the chemical, kg mf = mass of fragment generated due to explosion, kg n = number of moles of chemical P = pressure, N/m2
p = over pressure, N/m2 Po = peak overpressure, N/m2
Pr = Probit value Pmb = probability (/yr)
q = heat flux, kJ/m2 R = gas constant, N mf'C T= temperature, "C
Process Safety Progress (Vol. 17, No. 2) Summer 1W8 121

t = time, s td = decay time, s V = volume of the unit, m3 vf = velocity of fragment generated due to explosion,
12. Hindu, “Major Fire in Vizag Refinery,” The Hindu Publication, September 15, p. 1 (1997).
13. a y e s , P. J., Manual of Industrial Hazard Assessment Technique, Technica Ltd., London (1986).
14. Khan, F. I., and S. A. Abbasi, “An Anatomy of Indus- trial Accidents,” Risk Assessment in Chemical Process Industries: Advanced Techniques, Dicovery Publishing
m/s KaP = volume of chemical transformed to vapor, m3
Greek letters
E = emissivity of the atmosphere u = Stefen-Boltzman constant y = Poisson ratio ci = decay parameter
subscripts
1 = initial condition 2 = final condition
blast = shock wave load d = dynamic e = explosion
heat = heat load missile = missile load
fire = average fire temperature, K
relief = pressure relief condition
LITERATURE CITED
1.
2.
3.
4.
5.
6.
7.
8.
9.
10.
11.
Bagster, D. F., and R. M. Htblado, “The Estimation of Domino Incident Frequencies-An Approach,” Pro- cess Safety Environ., 69B, pp. 196-210 (1991). Baker, W. E., P. A. Cox, P. S. Westin, J. J. Kulesz, and R A. Streldow, Explosion Hazards and Evalua- tions, Elsevier Science Ltd., Amsterdam (1983). BhaUacharya, B. C., Chemical Equipment Design, CBC Publication, Delhi, pp. 214-216 (1986). Bowen, J. H., “Missile Problems in the Chemical and Nuclear Power Industries,” Nuclear Engineering, 19, p. 149 (1980). Cates, A. T., and B. Samuels, “A Simple Assessment Methodology for Vented Explosions,” J. Loss Preven- tion in the Process Industries, 4 , pp. 287-296 (1993). Center for Chemical Process Safety (CCPS), “Guidelines for Chemical Process Quantitative Risk Analysis,” CCPS Publication G-8, pp. 8, 87, 108, 114, 116, and 123-133 (1989). Clancey, V. J., “Diagnostic Features for Explosion Damage,” Proc. Sixth International Meeting of Foren- sic Science, Edinburgh (1972). Considhe, M., “Thermal Radiation Hazards Ranges from Large Hydrocarbon Pool Fires,” SRD Report Num- ber RZ97, U.K. Atomic Energy Authority (1984). Davies, P. A, “A Guide to the Evaluation of Con- densed Phase Explosions,” J. of Hazardous Materials, 33, pp. 1-18 (1993). Eisenberg, N. A, C. J. Lynch, and R J. Breeding, “Vulnerability Model-A Simulation System for As- sessing Damage Resulting from Marine Spills,” Report G-D-136-75, Washington, DC (1975). Green book, “Methods for Determining of Possible Damage to People and Objects Resulting from Release of Hazardous Materials,” Rep. CPR 16E, Voorburg, Warrington (1992).
House, New Delhi, in press (1998). 15. Khan, F. I., and S. A. Abbasi, “MOSEC-Modeling
and Simulation of Explosion in Chemical Industries,” Process Safety Progwss, accepted, in press (1998).
16. Khan, F. I., and S. A. Abbasi, “Accident Simulation in Chemical Process Industries using Software MAX- CRED,” Indian J of Chemical Technology, 3, pp. 338-344 (1996b).
17. Khan, F. I., and S. A. Abbasi, “Risk Analysis of a Cloralkali Industry Situated in Densely Populated Area,” Process Safety Progress, 16(3), pp. 172-185 (1 997).
18. Kleb, T. A., “After the Investigation of Fire,” Fire Pre vention, 162, pp. 16-22 (1983).
19. Kleb, T. A, m a t Went Wrong, Gulf Publication Company, England (1985).
20. Kleb, T. A., “Process Safety: An Achievement,” Jr. of Institution of Mechanical Engineem, 11, 34 (1991).
21. Latha, P., G. Gautam, and K. V. Raghavan, “Strate- gies for Quantification of Thermally Initiated Cascade Effects,” J. of Loss Prevention Process Industries, 5(1) (1992).
22. Lees, F. P., Loss Prevention in Process Industries, 2nd ed., Butterworths, 1-3, London (1996).
23. MaUikarajunan, M. M., K. V. Raghavan, and C. M. Pietersen, “An Approach to Maximum Credible Acci- dent Analysis of a Cluster of Chemical Industries,” En- ViroTec International Conference, September 21 -24, Bombay (1988).
24. Mantinsen, W. E., et d, “BLEVEs: Their Causes, Ef- fects and Prevention,” Hydrocarbon Processing, 65, p. 11 (1986).
25. Marshall, V. C., Major Chemical Hazards, John Wi- ley & Sons, New York (1987).
26. Ma-, B., et d, “Modeling of Vapor Cloud Disper- sion and Deflagration After Bursting of Tanks Filled with Liquefied Gas,” 2nd International Symposium on Loss Prevention in Process Industries, Heidelberg, pp.
27. Medard, L A, Accidental Explosions, Ellis Horwood, England (1989).
28. Pasman, H. J., H. A. Duxbury, and P. Bjordal, “Major Hazards in the Process Industries: Achieve- ments and Challenges in Loss Prevention,” J. of Haz- ardous Materials, 33, pp. 1-33 (1992).
29. Pietersen, C. M., “Analysis of the LPG Disaster in Mexico City,” Loss Prevention and Safety Promotion, 5 , p. 21 (1986).
30. Pietersen, C. M., “Consequence of Accidental Release of Hazardous Materials,” J. of Loss Prevention Process Industries, 3, pp. 136-141 (1990).
31. Porter, W. H. L, “Generation of Missiles and Destruc- tive Shock Fronts and Their Consequences,” Nuclear Engineering, 19, pp. 171-178 (1980).
32. Prltchard, D. K., “A Review of Methods for Predicting Blast Damage from Vapor Cloud Explosions,” J. of Loss
VI-305 (1977).
122 Summer 1998 Process Safety Progress (Vol. 17, No. 2)

Prevention Process Industries, 2(4), pp. 193-199 (1 989).
33. Prugh, R W., “Quantitative Evaluation of BLEVE Haz- ards,” Chemical Enginem’ng Progress, 87(2), pp. 60-71 (1991).
34. Prugh, R W., “Modeling and Mitigation of the Conse- quence of Accidental Release of Hazardous Materials,” Plant Operation Progress, 11(1), pp. 19-25 (1992).
35. Prugh, R. W., “Quantitative Evaluation of Fire Ball Hazards,” Process Safety Progress, 13(2), pp. 83-89 (1994).
36. Raghavan, K. V., and G. Swaminathan, Hazard As- sessment and Disaster Mitigation in petrochemical In- dustries, Oxford Publishing Company, Chennai (1996).
37. Roberts, A. F., “Thermal Radiation Hazards from
Pressurized Storage,” Fire Safety, 4 , pp. 197-212 (1982).
38. Scielly, N. F., and W. G. High, “The Blast Effects of Explosion,” Proceedings of International Symposium on Loss Prevention and Safety Promotion, Cannes (1986).
39. Shankar, R, “Corrosion,” Science Express: Indian Ex- press Publication, pp. 1-3 (September 30, 1997).
40. Van den berg, A. C., and A. Lennoy, “Methods for Vapor Cloud Explosion Blast Modeling,” J. of Haz- ardous Materials, 34, pp. 171-179 (1993).
41. Venerate, J. E. S., G. A. Rutledge, K. Sumathipala, and K. Sollows, “To BLEVE or Not to BLEVE: Anatomy of Boiling Liquid Expanding Vapor Explo- sion,’’ Process Safety Progress, 12(2), pp. 67-70 (1993).
Process Safety Progress (Vol. 17, No. 2) Summer 1998 123
Copyright © 2022 FDOKUMEN