
Modelling wave energy resources for UK's southwest coast
8
Modelling Wave Energy Resources for UK’s Southwest Coast A. Rute Bento #1 , Paulo Martinho #2 , C. Guedes Soares #3 # Centre for Marine Technology and Engineering (CENTEC), Technical University of Lisbon, Instituto Superior Técnico, 1049-001 Lisboa, Portugal 1 [email protected] 2 [email protected] 3 [email protected] Abstract - In the present study, a wave prediction system based on two state-of-the-art spectral models, WAVEWATCH III ™ and SWAN, was implemented in order to evaluate UK’s wave conditions and to assess potential wave energy extraction. The WWIII is used for wave generation and coupled with SWAN, which is used for wave transformation in coastal areas. Wind fields for model input were taken from NCEP’s Reanalysis 2, with time steps of 6 hours. Wave parameters are obtained for sites close to the coast and in particular for two tests sites: the site off Cornwall (Wave Hub test site) and the site off the Pembrokeshire Coast. Validation tests are carried out with buoy data from the British Oceanographic Data Centre so that the model's performance can be evaluated. The time period considered is April and May, 1977. Regarding the energetic assessment, a case study is considered and an analysis is done for the energy transport per unit of wave front and its theoretical values of wave power. This work is developed in the framework of a European project with intend to provide resource information to the marine renewable energy sector. Keywords— Renewable Energy, Wave Power, Spectral Models, UK Nearshore, Wave Hub, Pembrokshire I. INTRODUCTION The wave energy is the most eye-catching form of ocean energy, possibly because of its destructive effect. Wave energy results from the winds as they blow across the oceans and transfer energy to its surface. Once created, waves can travel long distances with little energy loss. The power in a wave is proportional to the square of the amplitude and to the period of motion, so waves with periods around 7-10s and amplitudes of 2m have energy fluxes commonly averaging between 40 and 70 kW per m width of oncoming wave. Nearer the coastline the average energy decreases due to interaction with the bottom, but this can be compensated by natural phenomena such as refraction or reflection, leading to energy concentrating areas known as “hot spots”. The long term annual wave power level increases from about 25 kW/m off the southernmost part of Europe’s Atlantic coastline (Canary Islands) up to 75 kW/m off Ireland and Scotland. When moving further north it decreases to 30 kW/m off the northern part of the Norwegian coast (e.g. Fig. 1). Total wave energy resource for Europe is estimated to be around 320 GW. Fig.1 European Wave Energy Atlas, Average Theoretical Wave Power (kW) Persistent efforts in R&D and the experience accumulated during the past years have constantly improved the performance of wave power techniques and have led today to bringing wave energy closer to commercial exploitation than ever before [1]. In the last years, most of the R&D activity in wave energy has been taking place in Europe, largely due to the financial support and coordination provided by the European Commission and positive attitude adopted by some European national governments. In general, the development from concept to commercial stage has been found to be difficult and slow. The wave energy absorption is a theoretically difficult hydrodynamic process, in which relatively complex diffraction and radiation wave phenomena take place. This explains why a large part of the work on wave energy published in the second half of the 1970s was on theoretical hydrodynamics. The possibility of converting wave energy into usable energy has also inspired numerous inventors, more than on thousand patents has been registered by 1980 and the number has been increasing since then [2]. 978-1-61284-4577-0088-0/11/$26.00 ©2011 IEEE
Transcript of Modelling wave energy resources for UK's southwest coast
Modelling Wave Energy Resources for UK’s
Southwest Coast A. Rute Bento
#1, Paulo Martinho
#2, C. Guedes Soares
#3
# Centre for Marine Technology and Engineering
(CENTEC), Technical University of Lisbon,
Instituto Superior Técnico, 1049-001 Lisboa,
Portugal 1 [email protected]
Abstract - In the present study, a wave prediction system
based on two state-of-the-art spectral models, WAVEWATCH
III ™ and SWAN, was implemented in order to evaluate UK’s
wave conditions and to assess potential wave energy extraction.
The WWIII is used for wave generation and coupled with SWAN,
which is used for wave transformation in coastal areas. Wind
fields for model input were taken from NCEP’s Reanalysis 2,
with time steps of 6 hours. Wave parameters are obtained for
sites close to the coast and in particular for two tests sites: the
site off Cornwall (Wave Hub test site) and the site off the
Pembrokeshire Coast. Validation tests are carried out with buoy
data from the British Oceanographic Data Centre so that the
model's performance can be evaluated. The time period
considered is April and May, 1977.
Regarding the energetic assessment, a case study is
considered and an analysis is done for the energy transport per
unit of wave front and its theoretical values of wave power.
This work is developed in the framework of a European
project with intend to provide resource information to the
marine renewable energy sector.
Keywords— Renewable Energy, Wave Power, Spectral Models,
UK Nearshore, Wave Hub, Pembrokshire
I. INTRODUCTION
The wave energy is the most eye-catching form of ocean
energy, possibly because of its destructive effect. Wave energy
results from the winds as they blow across the oceans and
transfer energy to its surface. Once created, waves can travel
long distances with little energy loss. The power in a wave is
proportional to the square of the amplitude and to the period
of motion, so waves with periods around 7-10s and amplitudes
of 2m have energy fluxes commonly averaging between 40
and 70 kW per m width of oncoming wave. Nearer the
coastline the average energy decreases due to interaction with
the bottom, but this can be compensated by natural
phenomena such as refraction or reflection, leading to energy
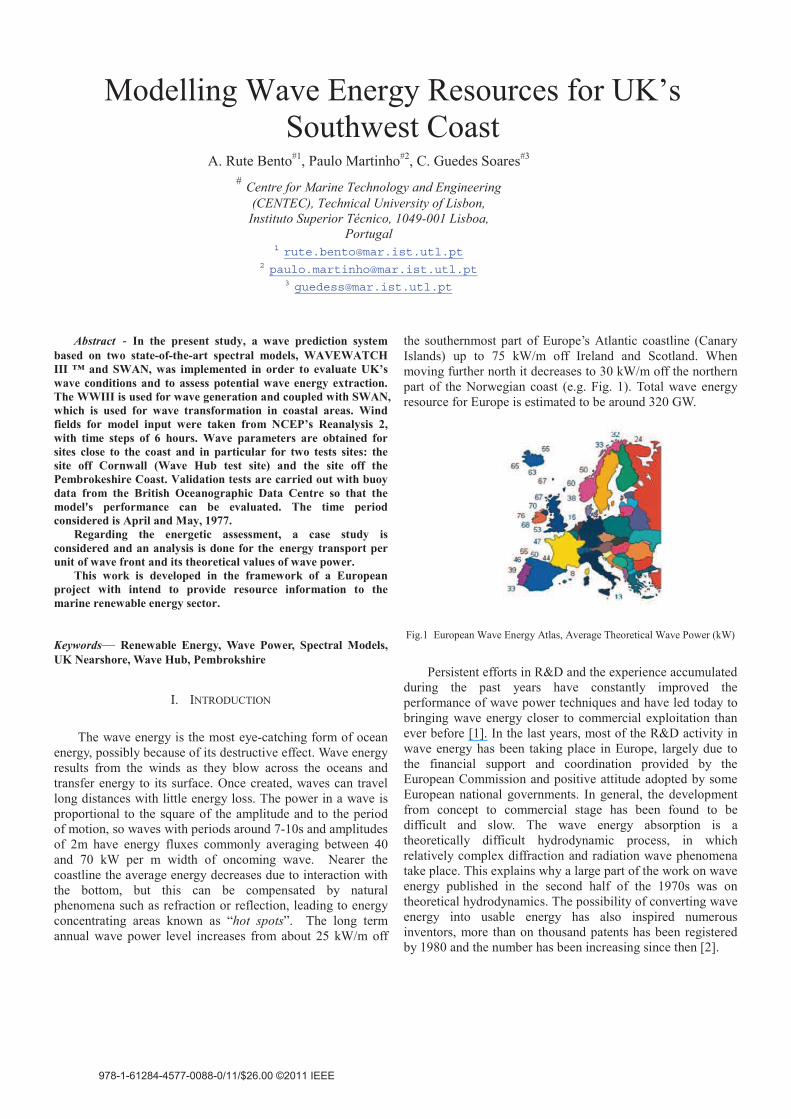
concentrating areas known as “hot spots”. The long term
annual wave power level increases from about 25 kW/m off
the southernmost part of Europe’s Atlantic coastline (Canary
Islands) up to 75 kW/m off Ireland and Scotland. When
moving further north it decreases to 30 kW/m off the northern
part of the Norwegian coast (e.g. Fig. 1). Total wave energy
resource for Europe is estimated to be around 320 GW.
Fig.1 European Wave Energy Atlas, Average Theoretical Wave Power (kW)
Persistent efforts in R&D and the experience accumulated
during the past years have constantly improved the
performance of wave power techniques and have led today to
bringing wave energy closer to commercial exploitation than
ever before [1]. In the last years, most of the R&D activity in
wave energy has been taking place in Europe, largely due to
the financial support and coordination provided by the
European Commission and positive attitude adopted by some
European national governments. In general, the development
from concept to commercial stage has been found to be
difficult and slow. The wave energy absorption is a
theoretically difficult hydrodynamic process, in which
relatively complex diffraction and radiation wave phenomena
take place. This explains why a large part of the work on wave
energy published in the second half of the 1970s was on
theoretical hydrodynamics. The possibility of converting wave
energy into usable energy has also inspired numerous
inventors, more than on thousand patents has been registered
by 1980 and the number has been increasing since then [2].
978-1-61284-4577-0088-0/11/$26.00 ©2011 IEEE
Places where full-scale or intermediate sized wave energy
converters can be tested in real conditions at sea have been
specially developed during the past years. They consist of sea
areas exposed to waves and other processes, fitted with an
electrical connection to the grid, various environmental
sensors and other logistics such as sea bottom mooring and
supply vessels. These full-scale experimental facilities allow
for better understanding of the wave energy device’s response
and energy conversion and production. Among the dedicated
places are EMEC in Scotland, the “Wave Hub” off north
western coast of Cornwall and wave dragon test site off
Pembrokeshire, the SEM-REV under development in South
Brittany in France [3] and the Portuguese Pilot Zone in the
west coast of Portugal [4].
Wave energy is abundant and the amount of energy varies
from site-to-site and from day-to-day, depending on the
location and weather conditions. A general idea about the
existing wave energy conditions offshore or nearshore can be
given using real data, but there are some restrictions due to the
fact that the time period of measurements may be limited, so
the interest is to use numerical models which are able to
predict the wave characteristics in various locations for
whatever period of time. Therefore, characterization of the
wave climate is a basic prerequisite for the strategic planning
of wave energy utilization and for the design of wave energy
devices. This evaluation has been done before for other
purposes, namely navigation, and harbor, coastal and offshore
engineering. A 44-year wave hindcast for the North East
Atlantic European coast has been performed by Pilar et al. [5],
within the HIPOCAS project [6]. The hindcast wave model
used was WAM modified for two-way nesting. The output
parameters were significant wave height, wave direction,
mean and peak period, wind speed and direction, Hs for wind
sea, direction of wind sea, Tm for wind sea, Hs for swell,
direction for swell and Tm for swell. In order to complement
this study, another developed by Rusu et al. [7] was
preformed, which couples WAM for deep water conditions
and SWAN [8] for nearshore results. A regional
meteorological model was also used in the coastal area and it
was found that the skill of the model was improved with the
finer grid wind fields [9]. Afterwards, a study has been carried
out regarding wave energy assessment in relation with wave
conditions. This system coupling WAM and SWAN was used
and validated by Rusu and Guedes Soares [10], with the aim
of demonstrating the effectiveness of using a wave prediction
system for assessing the spatial distribution patterns of the
wave energy in the Portuguese nearshore.
In comparison with the referred studies, in this work the
WAVEWATCH III [11] model has been coupled with the
SWAN model, as an alternative for WAM. The goal is to do a
similar study as the one done for the HIPOCAS project [6] but
also with nearshore wave energy data as output.
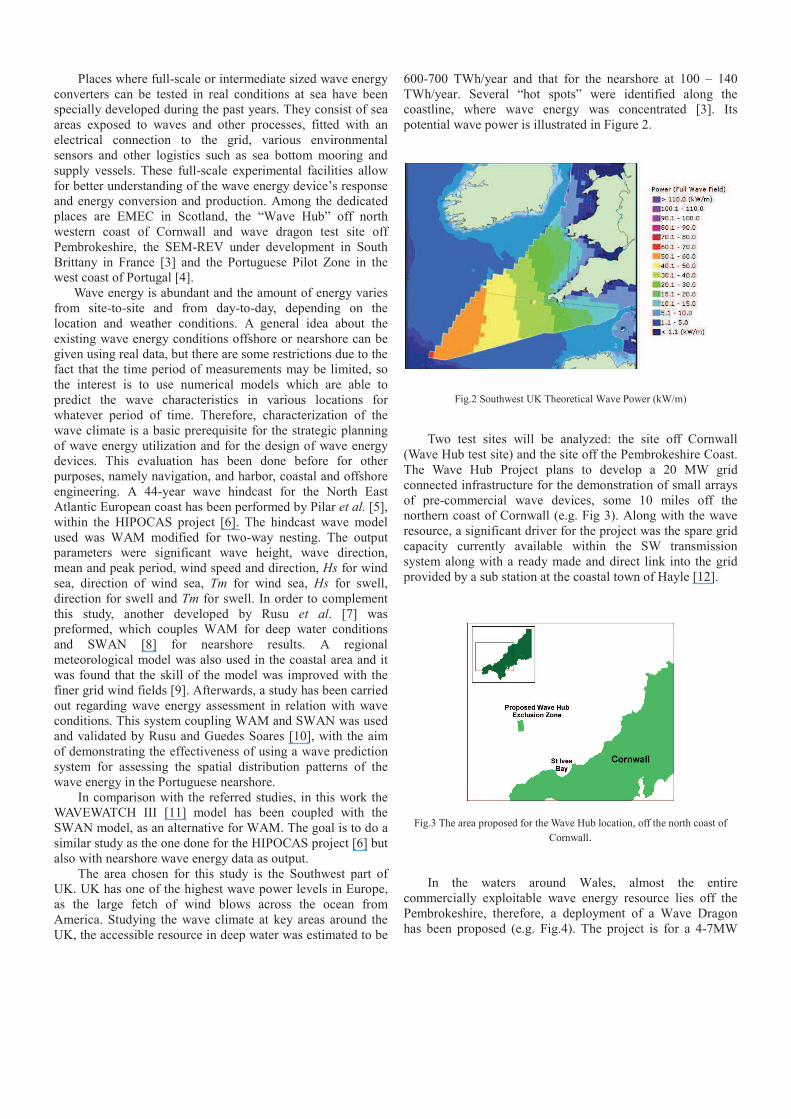
The area chosen for this study is the Southwest part of
UK. UK has one of the highest wave power levels in Europe,
as the large fetch of wind blows across the ocean from
America. Studying the wave climate at key areas around the
UK, the accessible resource in deep water was estimated to be
600-700 TWh/year and that for the nearshore at 100 – 140
TWh/year. Several “hot spots” were identified along the
coastline, where wave energy was concentrated [3]. Its
potential wave power is illustrated in Figure 2.
Fig.2 Southwest UK Theoretical Wave Power (kW/m)
Two test sites will be analyzed: the site off Cornwall
(Wave Hub test site) and the site off the Pembrokeshire Coast.
The Wave Hub Project plans to develop a 20 MW grid
connected infrastructure for the demonstration of small arrays
of pre-commercial wave devices, some 10 miles off the
northern coast of Cornwall (e.g. Fig 3). Along with the wave
resource, a significant driver for the project was the spare grid
capacity currently available within the SW transmission
system along with a ready made and direct link into the grid
provided by a sub station at the coastal town of Hayle [12].
Fig.3 The area proposed for the Wave Hub location, off the north coast of
Cornwall.
In the waters around Wales, almost the entire
commercially exploitable wave energy resource lies off the
Pembrokeshire, therefore, a deployment of a Wave Dragon
has been proposed (e.g. Fig.4). The project is for a 4-7MW
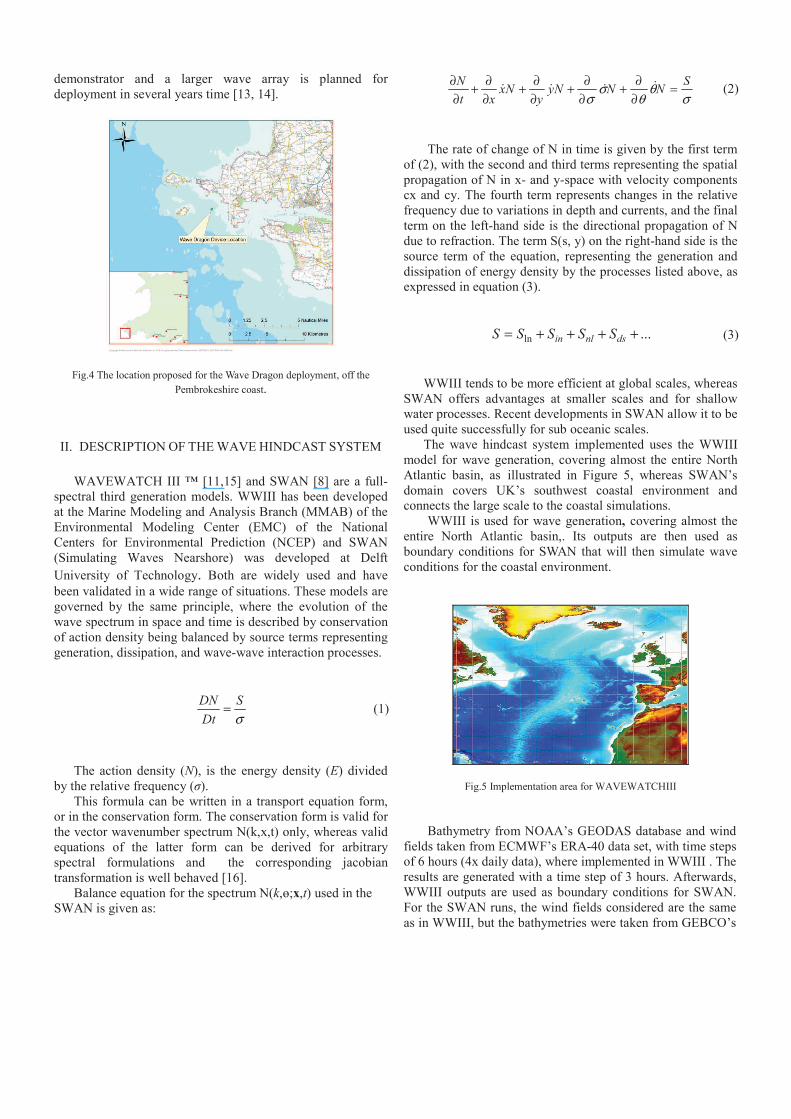
demonstrator and a larger wave array is planned for
deployment in several years time [13, 14].
Fig.4 The location proposed for the Wave Dragon deployment, off the
Pembrokeshire coast.
II. DESCRIPTION OF THE WAVE HINDCAST SYSTEM
WAVEWATCH III ™ [11,15] and SWAN [8] are a full-
spectral third generation models. WWIII has been developed
at the Marine Modeling and Analysis Branch (MMAB) of the
Environmental Modeling Center (EMC) of the National
Centers for Environmental Prediction (NCEP) and SWAN
(Simulating Waves Nearshore) was developed at Delft
University of Technology. Both are widely used and have
been validated in a wide range of situations. These models are
governed by the same principle, where the evolution of the
wave spectrum in space and time is described by conservation
of action density being balanced by source terms representing
generation, dissipation, and wave-wave interaction processes.
σ
S
Dt
DN= (1)
The action density (N), is the energy density (E) divided
by the relative frequency ( ).
This formula can be written in a transport equation form,
or in the conservation form. The conservation form is valid for
the vector wavenumber spectrum N(k,x,t) only, whereas valid
equations of the latter form can be derived for arbitrary
spectral formulations and the corresponding jacobian
transformation is well behaved [16].
Balance equation for the spectrum N(k, ;x,t) used in the
SWAN is given as:
σ
θθ
σσ
SNNNy
yNx
xt
N=
∂
∂+
∂
∂+
∂
∂+
∂
∂+
∂
∂ (2)
The rate of change of N in time is given by the first term
of (2), with the second and third terms representing the spatial
propagation of N in x- and y-space with velocity components
cx and cy. The fourth term represents changes in the relative
frequency due to variations in depth and currents, and the final
term on the left-hand side is the directional propagation of N
due to refraction. The term S(s, y) on the right-hand side is the
source term of the equation, representing the generation and
dissipation of energy density by the processes listed above, as
expressed in equation (3).
...ln ++++= dsnlin SSSSS (3)
WWIII tends to be more efficient at global scales, whereas
SWAN offers advantages at smaller scales and for shallow
water processes. Recent developments in SWAN allow it to be
used quite successfully for sub oceanic scales.
The wave hindcast system implemented uses the WWIII
model for wave generation, covering almost the entire North
Atlantic basin, as illustrated in Figure 5, whereas SWAN’s
domain covers UK’s southwest coastal environment and
connects the large scale to the coastal simulations.
WWIII is used for wave generation, covering almost the
entire North Atlantic basin,. Its outputs are then used as
boundary conditions for SWAN that will then simulate wave
conditions for the coastal environment.
Fig.5 Implementation area for WAVEWATCHIII
Bathymetry from NOAA’s GEODAS database and wind
fields taken from ECMWF’s ERA-40 data set, with time steps
of 6 hours (4x daily data), where implemented in WWIII . The
results are generated with a time step of 3 hours. Afterwards,
WWIII outputs are used as boundary conditions for SWAN.
For the SWAN runs, the wind fields considered are the same
as in WWIII, but the bathymetries were taken from GEBCO’s
database. The characteristic for the computational grids, for
both WWIII and SWAN domains, are displayed in Table I.
TABLE I
COMPUTATIONAL GRIDS FOR THE WAVE HINDCAST SYSTEM
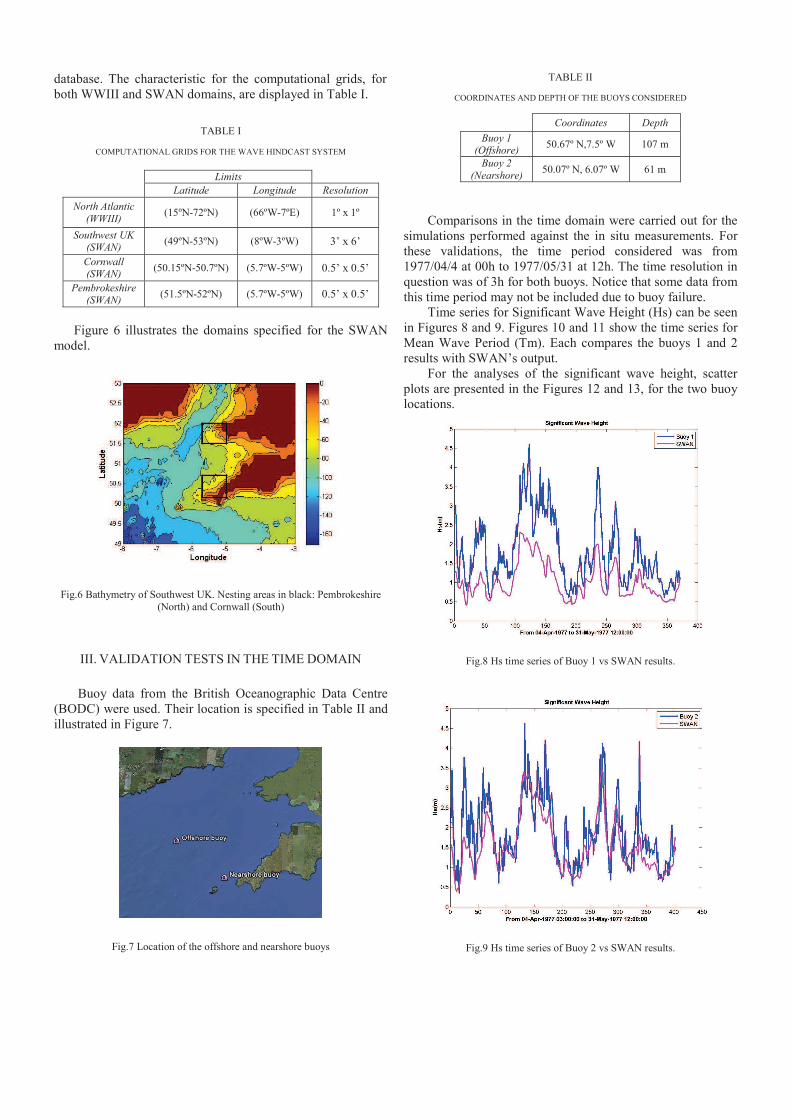
Figure 6 illustrates the domains specified for the SWAN
model.
Fig.6 Bathymetry of Southwest UK. Nesting areas in black: Pembrokeshire
(North) and Cornwall (South)
III. VALIDATION TESTS IN THE TIME DOMAIN
Buoy data from the British Oceanographic Data Centre
(BODC) were used. Their location is specified in Table II and
illustrated in Figure 7.
Fig.7 Location of the offshore and nearshore buoys
TABLE II
COORDINATES AND DEPTH OF THE BUOYS CONSIDERED
Coordinates Depth
Buoy 1 (Offshore)
50.67º N,7.5º W 107 m
Buoy 2
(Nearshore) 50.07º N, 6.07º W 61 m
Comparisons in the time domain were carried out for the
simulations performed against the in situ measurements. For
these validations, the time period considered was from
1977/04/4 at 00h to 1977/05/31 at 12h. The time resolution in
question was of 3h for both buoys. Notice that some data from
this time period may not be included due to buoy failure.
Time series for Significant Wave Height (Hs) can be seen
in Figures 8 and 9. Figures 10 and 11 show the time series for
Mean Wave Period (Tm). Each compares the buoys 1 and 2
results with SWAN’s output.
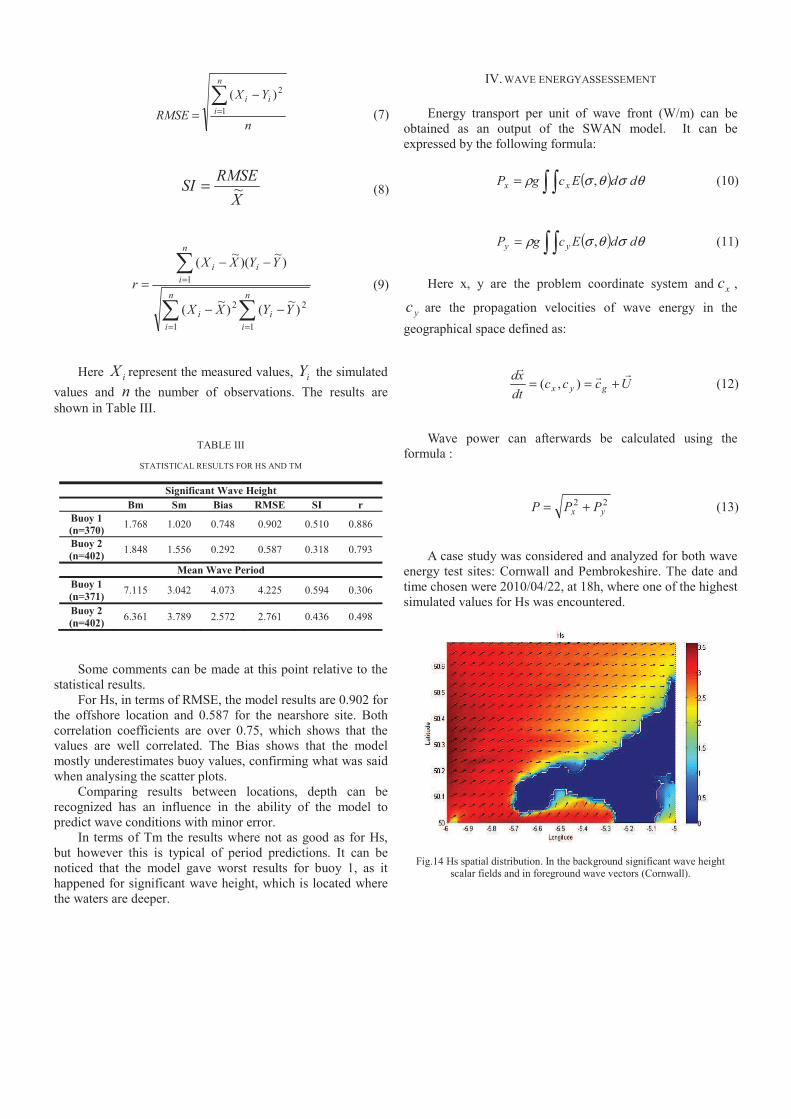
For the analyses of the significant wave height, scatter
plots are presented in the Figures 12 and 13, for the two buoy
locations.
Fig.8 Hs time series of Buoy 1 vs SWAN results.
Fig.9 Hs time series of Buoy 2 vs SWAN results.
Limits
Latitude Longitude Resolution
North Atlantic
(WWIII) (15ºN-72ºN) (66ºW-7ºE) 1º x 1º
Southwest UK (SWAN)
(49ºN-53ºN) (8ºW-3ºW) 3’ x 6’
Cornwall (SWAN)
(50.15ºN-50.7ºN) (5.7ºW-5ºW) 0.5’ x 0.5’
Pembrokeshire (SWAN)
(51.5ºN-52ºN) (5.7ºW-5ºW) 0.5’ x 0.5’
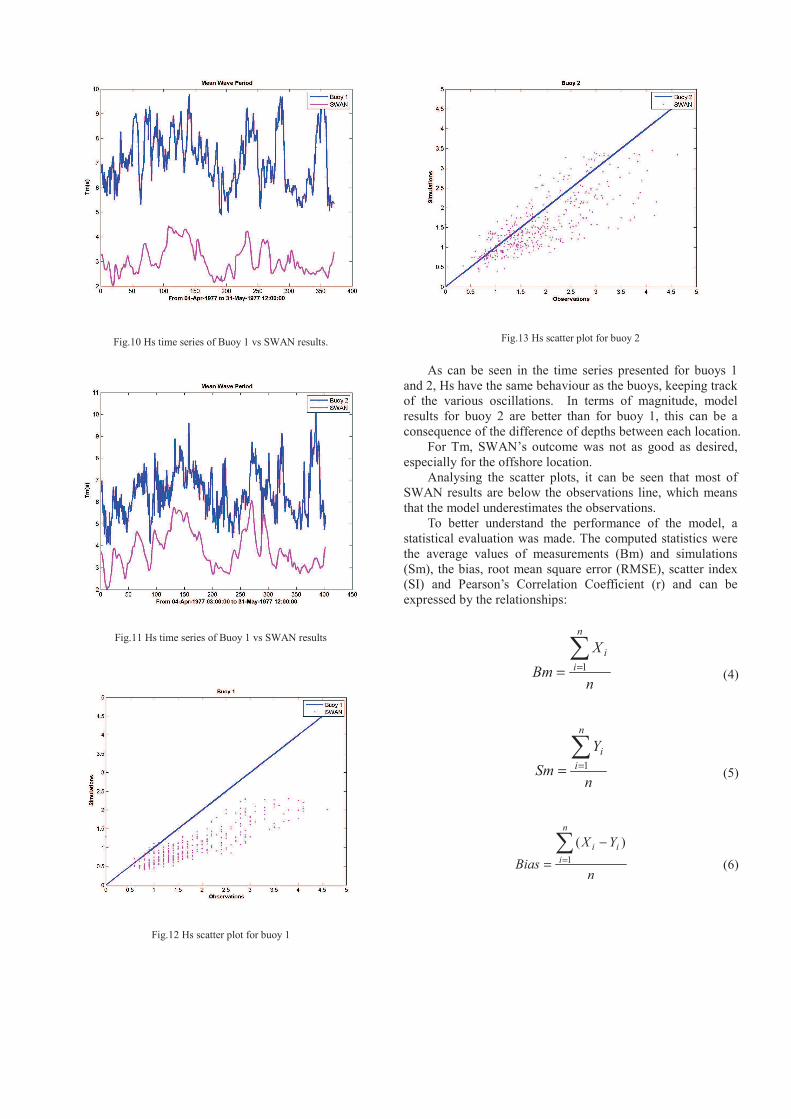
Fig.10 Hs time series of Buoy 1 vs SWAN results.
Fig.11 Hs time series of Buoy 1 vs SWAN results
Fig.12 Hs scatter plot for buoy 1
Fig.13 Hs scatter plot for buoy 2
As can be seen in the time series presented for buoys 1
and 2, Hs have the same behaviour as the buoys, keeping track
of the various oscillations. In terms of magnitude, model
results for buoy 2 are better than for buoy 1, this can be a
consequence of the difference of depths between each location.
For Tm, SWAN’s outcome was not as good as desired,
especially for the offshore location.
Analysing the scatter plots, it can be seen that most of
SWAN results are below the observations line, which means
that the model underestimates the observations.
To better understand the performance of the model, a
statistical evaluation was made. The computed statistics were
the average values of measurements (Bm) and simulations
(Sm), the bias, root mean square error (RMSE), scatter index
(SI) and Pearson’s Correlation Coefficient (r) and can be
expressed by the relationships:
n
X
Bm
n
i
i
== 1 (4)
n
Y
Sm
n
i
i
== 1 (5)
n
YX
Bias
n
i
ii
=
−
= 1
)(
(6)
n
YX
RMSE
n
i
ii
=
−
= 1
2)(
(7)
X
RMSESI ~= (8)
= =
=
−−
−−
=n
i
n
i
ii
n
i
ii
YYXX
YYXX
r
1 1
22
1
)~
()~
(
)~
)(~
(
(9)
Here iX represent the measured values, iY the simulated
values and n the number of observations. The results are
shown in Table III.
TABLE III
STATISTICAL RESULTS FOR HS AND TM
Significant Wave Height
Bm Sm Bias RMSE SI r
Buoy 1
(n=370) 1.768 1.020 0.748 0.902 0.510 0.886
Buoy 2
(n=402) 1.848 1.556 0.292 0.587 0.318 0.793
Mean Wave Period
Buoy 1
(n=371) 7.115 3.042 4.073 4.225 0.594 0.306
Buoy 2
(n=402) 6.361 3.789 2.572 2.761 0.436 0.498
Some comments can be made at this point relative to the
statistical results.
For Hs, in terms of RMSE, the model results are 0.902 for
the offshore location and 0.587 for the nearshore site. Both
correlation coefficients are over 0.75, which shows that the values are well correlated. The Bias shows that the model
mostly underestimates buoy values, confirming what was said
when analysing the scatter plots.
Comparing results between locations, depth can be
recognized has an influence in the ability of the model to
predict wave conditions with minor error. In terms of Tm the results where not as good as for Hs,
but however this is typical of period predictions. It can be
noticed that the model gave worst results for buoy 1, as it
happened for significant wave height, which is located where
the waters are deeper.
IV. WAVE ENERGYASSESSEMENT
Energy transport per unit of wave front (W/m) can be
obtained as an output of the SWAN model. It can be
expressed by the following formula:
( )= θσθσρ ddEcgP xx , (10)
( )= θσθσρ ddEcgP yy , (11)
Here x, y are the problem coordinate system and xc ,
yc are the propagation velocities of wave energy in the
geographical space defined as:
Ucccdt
xdgyx +== ),( (12)
Wave power can afterwards be calculated using the
formula :
22yx PPP += (13)
A case study was considered and analyzed for both wave
energy test sites: Cornwall and Pembrokeshire. The date and
time chosen were 2010/04/22, at 18h, where one of the highest
simulated values for Hs was encountered.
Fig.14 Hs spatial distribution. In the background significant wave height scalar fields and in foreground wave vectors (Cornwall).
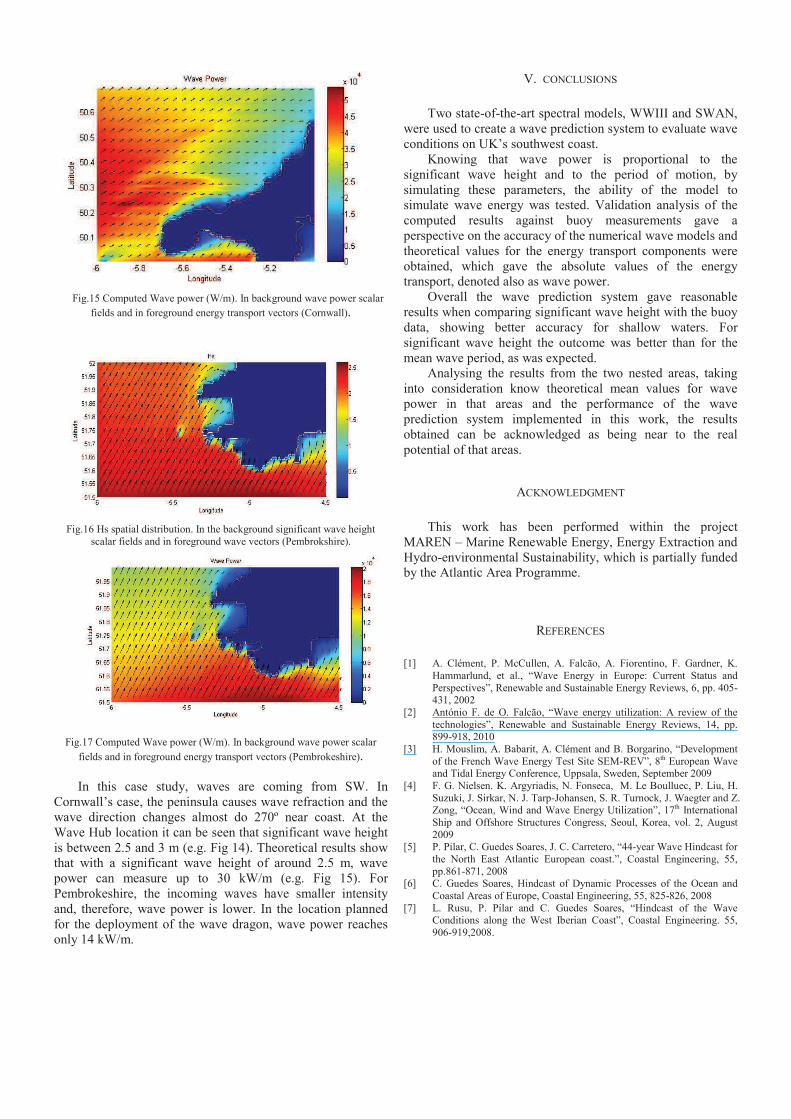
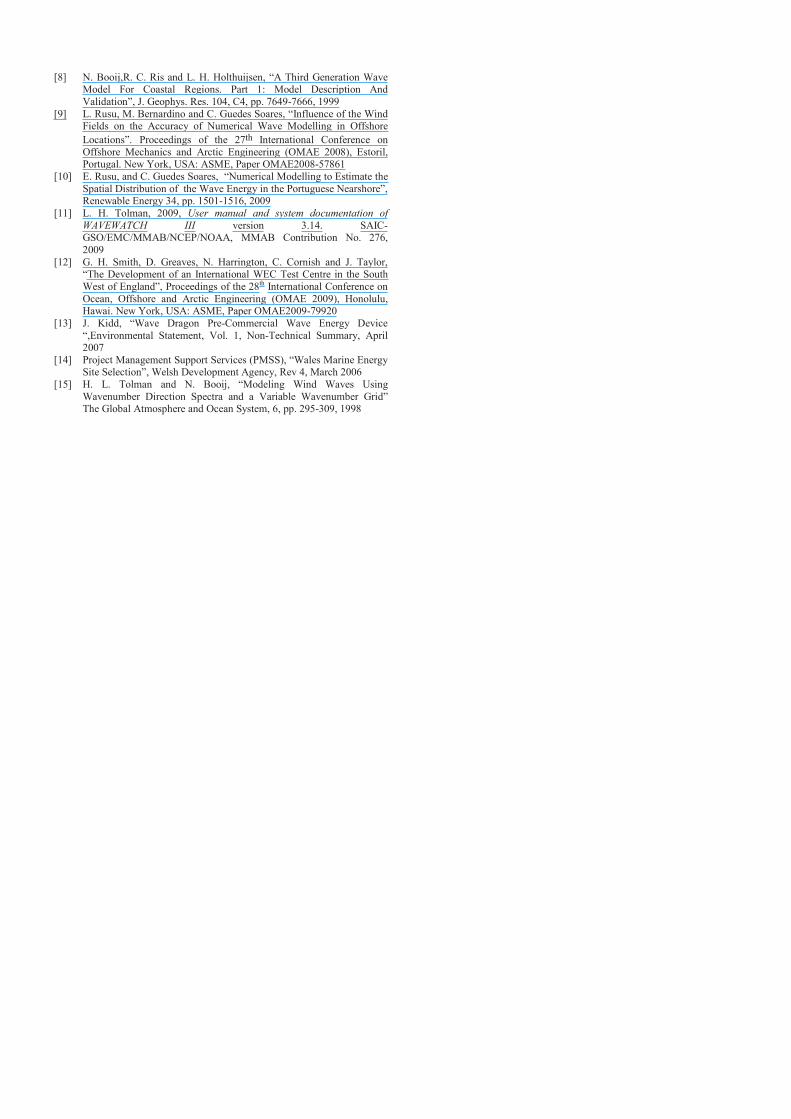
Fig.15 Computed Wave power (W/m). In background wave power scalar
fields and in foreground energy transport vectors (Cornwall).
Fig.16 Hs spatial distribution. In the background significant wave height
scalar fields and in foreground wave vectors (Pembrokshire).
Fig.17 Computed Wave power (W/m). In background wave power scalar
fields and in foreground energy transport vectors (Pembrokeshire).
In this case study, waves are coming from SW. In
Cornwall’s case, the peninsula causes wave refraction and the
wave direction changes almost do 270º near coast. At the
Wave Hub location it can be seen that significant wave height
is between 2.5 and 3 m (e.g. Fig 14). Theoretical results show
that with a significant wave height of around 2.5 m, wave
power can measure up to 30 kW/m (e.g. Fig 15). For
Pembrokeshire, the incoming waves have smaller intensity
and, therefore, wave power is lower. In the location planned
for the deployment of the wave dragon, wave power reaches
only 14 kW/m.
V. CONCLUSIONS
Two state-of-the-art spectral models, WWIII and SWAN,
were used to create a wave prediction system to evaluate wave
conditions on UK’s southwest coast.
Knowing that wave power is proportional to the
significant wave height and to the period of motion, by
simulating these parameters, the ability of the model to
simulate wave energy was tested. Validation analysis of the
computed results against buoy measurements gave a
perspective on the accuracy of the numerical wave models and
theoretical values for the energy transport components were
obtained, which gave the absolute values of the energy
transport, denoted also as wave power.
Overall the wave prediction system gave reasonable
results when comparing significant wave height with the buoy
data, showing better accuracy for shallow waters. For
significant wave height the outcome was better than for the
mean wave period, as was expected.
Analysing the results from the two nested areas, taking
into consideration know theoretical mean values for wave
power in that areas and the performance of the wave
prediction system implemented in this work, the results
obtained can be acknowledged as being near to the real
potential of that areas.
ACKNOWLEDGMENT
This work has been performed within the project
MAREN – Marine Renewable Energy, Energy Extraction and
Hydro-environmental Sustainability, which is partially funded
by the Atlantic Area Programme.
REFERENCES
[1] A. Clément, P. McCullen, A. Falcão, A. Fiorentino, F. Gardner, K.
Hammarlund, et al., “Wave Energy in Europe: Current Status and
Perspectives”, Renewable and Sustainable Energy Reviews, 6, pp. 405-431, 2002
[2] António F. de O. Falcão, “Wave energy utilization: A review of the
technologies”, Renewable and Sustainable Energy Reviews, 14, pp. 899-918, 2010
[3] H. Mouslim, A. Babarit, A. Clément and B. Borgarino, “Development
of the French Wave Energy Test Site SEM-REV”, 8th European Wave and Tidal Energy Conference, Uppsala, Sweden, September 2009
[4] F. G. Nielsen. K. Argyriadis, N. Fonseca, M. Le Boulluec, P. Liu, H.
Suzuki, J. Sirkar, N. J. Tarp-Johansen, S. R. Turnock, J. Waegter and Z. Zong, “Ocean, Wind and Wave Energy Utilization”, 17th International
Ship and Offshore Structures Congress, Seoul, Korea, vol. 2, August
2009 [5] P. Pilar, C. Guedes Soares, J. C. Carretero, “44-year Wave Hindcast for
the North East Atlantic European coast.”, Coastal Engineering, 55,
pp.861-871, 2008 [6] C. Guedes Soares, Hindcast of Dynamic Processes of the Ocean and
Coastal Areas of Europe, Coastal Engineering, 55, 825-826, 2008
[7] L. Rusu, P. Pilar and C. Guedes Soares, “Hindcast of the Wave Conditions along the West Iberian Coast”, Coastal Engineering. 55,
906-919,2008.
[8] N. Booij,R. C. Ris and L. H. Holthuijsen, “A Third Generation Wave Model For Coastal Regions. Part 1: Model Description And
Validation”, J. Geophys. Res. 104, C4, pp. 7649-7666, 1999
[9] L. Rusu, M. Bernardino and C. Guedes Soares, “Influence of the Wind Fields on the Accuracy of Numerical Wave Modelling in Offshore
Locations”. Proceedings of the 27th International Conference on
Offshore Mechanics and Arctic Engineering (OMAE 2008), Estoril, Portugal. New York, USA: ASME, Paper OMAE2008-57861
[10] E. Rusu, and C. Guedes Soares, “Numerical Modelling to Estimate the
Spatial Distribution of the Wave Energy in the Portuguese Nearshore”, Renewable Energy 34, pp. 1501-1516, 2009
[11] L. H. Tolman, 2009, User manual and system documentation of
WAVEWATCH III version 3.14. SAIC-GSO/EMC/MMAB/NCEP/NOAA, MMAB Contribution No. 276,
2009
[12] G. H. Smith, D. Greaves, N. Harrington, C. Cornish and J. Taylor, “The Development of an International WEC Test Centre in the South
West of England”, Proceedings of the 28th International Conference on
Ocean, Offshore and Arctic Engineering (OMAE 2009), Honolulu, Hawai. New York, USA: ASME, Paper OMAE2009-79920
[13] J. Kidd, “Wave Dragon Pre-Commercial Wave Energy Device
“,Environmental Statement, Vol. 1, Non-Technical Summary, April 2007
[14] Project Management Support Services (PMSS), “Wales Marine Energy Site Selection”, Welsh Development Agency, Rev 4, March 2006
[15] H. L. Tolman and N. Booij, “Modeling Wind Waves Using
Wavenumber Direction Spectra and a Variable Wavenumber Grid” The Global Atmosphere and Ocean System, 6, pp. 295-309, 1998