
1 Preface to position paper In our position paper we have tried to ...
Upload
independentCategory
view
0download
0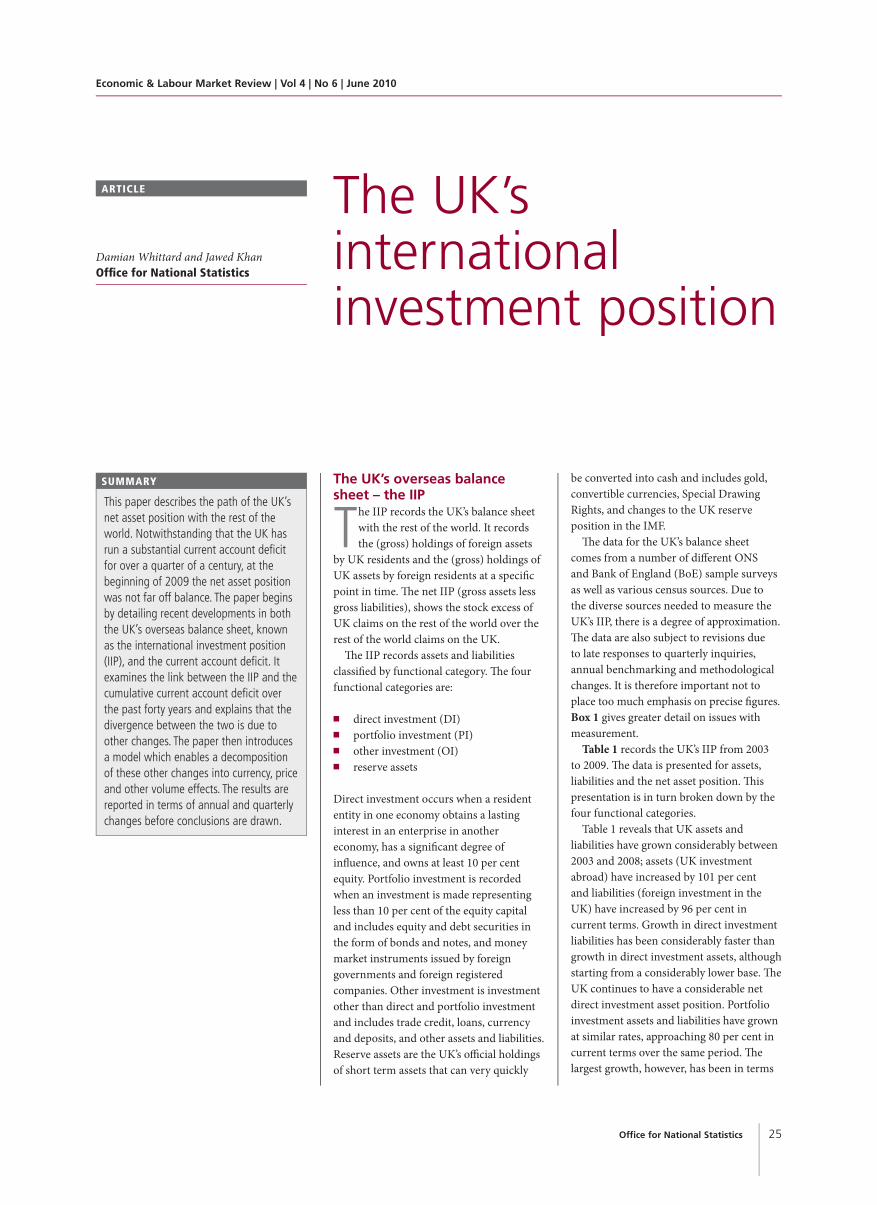
Economic & Labour Market Review | Vol 4 | No 6 | June 2010
25Office for National Statistics
The UK’s international investment position
This paper describes the path of the UK’s net asset position with the rest of the world. Notwithstanding that the UK has run a substantial current account deficit for over a quarter of a century, at the beginning of 2009 the net asset position was not far off balance. The paper begins by detailing recent developments in both the UK’s overseas balance sheet, known as the international investment position (IIP), and the current account deficit. It examines the link between the IIP and the cumulative current account deficit over the past forty years and explains that the divergence between the two is due to other changes. The paper then introduces a model which enables a decomposition of these other changes into currency, price and other volume effects. The results are reported in terms of annual and quarterly changes before conclusions are drawn.
SUMMARY
ARTICLE
Damian Whittard and Jawed KhanOffice for National Statistics
The UK’s overseas balance sheet – the IIP
The IIP records the UK’s balance sheet with the rest of the world. It records the (gross) holdings of foreign assets
by UK residents and the (gross) holdings of UK assets by foreign residents at a specifi c point in time. The net IIP (gross assets less gross liabilities), shows the stock excess of UK claims on the rest of the world over the rest of the world claims on the UK.
The IIP records assets and liabilities classified by functional category. Th e four functional categories are:
■ direct investment (DI)■ portfolio investment (PI)■ other investment (OI)■ reserve assets
Direct investment occurs when a resident entity in one economy obtains a lasting interest in an enterprise in another economy, has a significant degree ofinfluence, and owns at least 10 per cent equity. Portfolio investment is recorded when an investment is made representing less than 10 per cent of the equity capital and includes equity and debt securities in the form of bonds and notes, and money market instruments issued by foreign governments and foreign registered companies. Other investment is investment other than direct and portfolio investment and includes trade credit, loans, currency and deposits, and other assets and liabilities. Reserve assets are the UK’s offi cial holdings of short term assets that can very quickly
be converted into cash and includes gold, convertible currencies, Special Drawing Rights, and changes to the UK reserve position in the IMF.
The data for the UK’s balance sheet comes from a number of diff erent ONS and Bank of England (BoE) sample surveys as well as various census sources. Due to the diverse sources needed to measure the UK’s IIP, there is a degree of approximation. The data are also subject to revisions due to late responses to quarterly inquiries, annual benchmarking and methodological changes. It is therefore important not to place too much emphasis on precise fi gures. Box 1 gives greater detail on issues with measurement.
Table 1 records the UK’s IIP from 2003 to 2009. The data is presented for assets, liabilities and the net asset position. Th is presentation is in turn broken down by the four functional categories.
Table 1 reveals that UK assets and liabilities have grown considerably between 2003 and 2008; assets (UK investment abroad) have increased by 101 per cent and liabilities (foreign investment in the UK) have increased by 96 per cent in current terms. Growth in direct investment liabilities has been considerably faster than growth in direct investment assets, although starting from a considerably lower base. Th e UK continues to have a considerable net direct investment asset position. Portfolio investment assets and liabilities have grown at similar rates, approaching 80 per cent in current terms over the same period. Th e largest growth, however, has been in terms
Office for National Statistics26
The UK’s international investment position Economic & Labour Market Review | Vol 4 | No 6 | June 2010
Box 1Issues with measurement
Due to the diverse data sources, the revisions process and thesize of the fi gures involved, it is important not to put too muchfocus on exact numbers. The latest quarterly data, in particular,should be treated as provisional as it is subject to regularrevisions up to the inclusion of annual benchmark data. TheUK’s assets and liabilities are over £6 trillion and therefore a 1.0per cent measurement error in UK assets or liabilities equatesto a measurement error of over £60 billion. The risks are evengreater when netting two large gross fi gures to calculate a‘relatively’ small net position. Depending on the direction of themeasurement error, a 1.0 per cent measurement error in bothassets and liabilities could compound the net error to £120billion.
Wherever possible the UK’s Balance of Payments is valued atmarket prices, however, for direct investment, when the sharesare not openly traded, it is diffi cult to know exactly what themarket price is. In line with international guidance and in orderto ensure comparability across international accounts, a proxy forthe market value is estimated using own funds at book value1. Due to data limitations, in the case of some investments, historiccosts are used. The expectation is that by using book value andhistoric cost there will be a consistent bias to under record themarket value of these estimates.
The United States Bureau of Economic Analysis (BEA) presentsdifferent values of direct investment in the IIP, including, historiccost, current-cost and market costs (Landefeld and Lawson1991). In 1989, the BEA’s revaluation of direct investment assetsfrom historical costs to market costs increased by $431.1 billion,to $804.5 billion.
An analysis of the UK’s Balance of Payments suggested thatpositive net investment income, which indirectly feeds throughto the IIP via the fi nancial account, was driven by UK stocks offoreign assets generating higher rates of return than stock of UKassets held by foreign residents (Whitaker 2006 and Chamberlin2009). The authors suggested that this was because the rate ofreturn of direct investment income may be exaggerated
by underestimating the value (book value rather than marketvalue) of direct investment assets. The same argument appliesequally for liabilities, but there are two reasons why the effect isexpected to be larger for assets rather than liabilities. Firstly theUK has a larger stock of foreign direct investment assets to berevalued than foreign-owned UK direct investment liabilities. Andsecondly, the older the stock of direct investment the greater thepotential revaluation, particularly if the assets are recorded athistoric cost. As the UK’s fl ows of direct investment abroad haveexceeded foreign direct investment in the UK in all but eightyears from 1963 (when ONS records began) to 2009, it is likelythat the UK’s ownership of foreign stock, on average, will beolder than the stock of foreign direct investment in the UK - thusmaking UK’s direct investment liabilities closer to market valuethan its assets.
The analysis gives weight to the expectation that, as with theUSA experience, if direct investment assets and liabilities wererevalued to refl ect market price, this would lead to an upwardrevaluation of the UK’s IIP. This is supported by research fromPratten (1994) who estimated market price of direct investmentassets to be approximately double. Senior et al (2001) updatedthe work and estimated that assets and liabilities could be ashigh as three times book value. The analysis concluded that theoverall effect was likely to underestimate the UK’s net externalassets.
A further issue is that the UK’s coverage of the IIP is incompleteas fi nancial derivatives are currently excluded. Financialderivatives data are incorporated into the UK’s fi nancial accountbut published as an annex to the IIP - they are not includedwithin the main aggregates as the data are developmental. In theJune 2010 issue of the Balance of Payments Statistical Bulletinand the 2010 edition of the Balance of Payments Pink Book,ONS, for the fi rst time, intend to introduce data on fi nancialderivatives business of the UK banks into the main aggregatesof the IIP. Data for securities dealers and insurance and pensionfunds will continue to be excluded from the UK’s IIP whilst thedata continues to be validated and estimates improved.
of other investment, mainly due to increases in loans and deposits. This is unsurprising due to the global nature of the banking sector. Capital can be deposited and loaned at a moment’s notice, freely moving across borders.
In the latest period, 2008 to 2009, the total value of assets and liabilities decreased as the global recession took hold which led to a write down/off of assets and a repatriation of investment funds. During this period, however, portfolio investment assets and liabilities increased considerably as investors attempted to minimise risk.
Between 2003 and 2008, whilst we have seen growth in both gross assets and liabilities, Table 1 reveals the UK’s net liability position has reduced considerably. In 2006 Q4, the net liability position peaked Source: Pink Book and Balance of Payments statistical bulletin
Table 1UK’s Annual IIP, 2003 to 2009
£ billions
Dec–03 Dec–04 Dec–05 Dec–06 Dec–07 Dec–08 Dec–09
Total assets 3464.5 3911.4 4806.3 5212.3 6384.6 6967.5 6514.5Of which: DI assets 691.1 678.1 705.9 741.7 913.9 1050.3 1019.9
PI assets 935.8 1092.1 1360.9 1531.1 1693.8 1664.3 1878.1OI assets 1813.7 2118.0 2714.8 2916.6 3750.2 4216.6 3576.3
Reserve assets 23.8 23.3 24.7 22.9 26.7 36.3 40.1
Total Liabilities 3581.6 4132.1 5058.9 5564.8 6667.2 7026.7 6697.1Of which: DI liabilities 355.5 383.3 494.2 578.3 630.2 672.3 694.7
PI liabilities 1082.9 1227.9 1461.7 1702.6 1917.6 1945.4 2328.5OI liabilities 2143.2 2520.8 3103.0 3284.0 4119.4 4409.1 3673.8
Net IIP –117.2 –220.7 –252.6 –352.6 –282.5 –59.2 –182.6Of which: DI 335.6 294.7 211.7 163.4 283.8 378.1 325.2
PI –147.0 –135.8 –100.8 –171.5 –223.8 –281.1 –450.4OI –329.5 –402.9 –388.2 –367.3 –369.2 –192.5 –97.5
Reserve Assets 23.8 23.3 24.7 22.9 26.7 36.3 40.1
Economic & Labour Market Review | Vol 4 | No 6 | June 2010 The UK’s international investment position
27Office for National Statistics
at £352.6 billion, before dropping to £59.2 billion in 2008 Q4. In 2009 the net liability position widened once again to £182.6 billion. This paper explores what drives these movements. In order to do this, the following sections discuss the UK’s current account, its relationship to the IIP and how it, and other changes, have impacted on the IIP over time.
The UK’s current accountThe current account records international flows in trade in goods and services, international income flows and current transfers (Chamberlin 2009). Th e trade balance of goods and services is calculated by subtracting imports (debits) from exports (credits). The current account balance should not be confused with the trade balance as the current account balance also includes the balance of international income flows and current transfers. Income flows consist of compensation of employees and investment income. Compensation of employees is paid to non residents involved in the production process. International investment income is the return for providing financial assets and rent for natural resources. Current transfers record a set of miscellaneous payments where there is no corresponding exchange. Most of these transfers are government payments to and from the EU but also includes remittances. Remittances are payments from households resident in one economy to households resident in another. Table 2 presents the UK’s current account from 2003 to 2009.
Table 2 shows the UK has had a sustained current account deficit throughout the period; in fact the UK has consistently ran
a current account deficit in every year since 1983. The UK’s current account defi cit represents net new acquisition of foreign claims on the UK. From 2006 to 2008, however, whilst the UK has continually recorded a current account defi cit, Table 1 shows the UK actually decreased its net liability position. This indicates that apart from flows there are other factors that impact upon the stocks of UK assets. The following section explores this issue by detailing the link between stocks (IIP), flows (current account) and other changes.
Relationship between the net stock position, net new fl ow of assets and other changes The IIP measures the stock of assets andliabilities whereas, as noted above, thecurrent account measures flows. If a countryruns a current account deficit this means thatthe residents are consuming more than theyare producing. To pay for the diff erence theyneed to run down their assets or increasetheir liabilities. Either way, the effect will be to reduce the county’s net IIP.
The current account is equal to the financial account plus the capital account. As the capital account is relatively small in comparison, the current account and financial account can be said to be counterparts. In practice as data for the current account and financial account come from different data sources, in balance of payments statistics, a balancing item is used. This item is called net errors and omissions and is used to ensure the balance across the current, capital and fi nancial account.
The external balance sheet, formally known as the IIP, is directly linked to the BoP via the financial account, and as
such indirectly to the current account. The current account therefore can be said to be a measure of the flow of assets and liabilities, whilst the IIP records the total value of the stock of assets and liabilities at a specific point in time. The change in IIP is calculated as detailed in Equation 1.
Equation 1: IIP reconciliationΔIIP F C P O
FC
t t t t t= + + +==
FlowsChange in net asset values due too
asset/liability currency changesChange in net asseP = tt values due to
asset/liability price changes Other volume changesO =time periodt =
Equation 1 shows that the IIP at the endof a period reflects not only the fl ows,but other changes, including revaluationchanges and other volume adjustments,which occur during the reference period.Revaluation effects have no change in theasset and liability themselves but recorda change in valuation. Revaluation is splitbetween exchange rate changes (C) andother price changes (P).
Exchange rate effects occur as assets andliabilities can be denominated in a foreigncurrency, but are recorded in domesticcurrency in a country’s IIP. Th erefore,when movements between the foreign anddomestic currency occur, this has the eff ect of revaluing foreign-denominated assets. Anexample of this would be the UK holding$1000 of US assets purchased at an exchangerate of £1:$2. This is recorded as £500 of UKowned foreign assets in the UK’s IIP. At theend of the period, if the exchange rate haddepreciated to £1:$1, the UK still owns $1000of foreign assets, but they are now worth£1000 because of exchange rate movements.The result is an increase of £500 to the UK’sIIP although the quality of the asset has notchanged. In this example, there would be noeffect on US liabilities; they are still recordedas $1000 in the US IIP.
Price changes are most clearly demonstrated by movements in prices of equity and debt traded on the world stock markets. Examples of other changes in volume (O) include; debt cancellation and write-off s, reclassifi cations, entities changing residence and changes in actuarial assumptions.
How the UK’s IIP has evolved over time From 1966 to 1977 the UK only produced IIP data on an annual basis. Annual data Source: ONS, Pink Book and Balance of Payments Statistical Bulletin
Table 2UK’s Current account, 2003 to 2009
£ billions
2003 2004 2005 2006 2007 2008 2009
Total Credits 425.9 455.9 534.9 634.0 676.9 699.8 581.4Of which: export of goods 188.3 190.9 211.6 243.6 220.9 251.6 227.7
export of services 102.4 112.9 119.2 134.2 150.6 170.8 161.2income 123.2 138.3 186.7 237.6 291.3 261.1 175.6
current transfers 12.0 13.8 17.4 18.5 14.0 16.3 17.0
Total Debits 444.2 480.8 567.8 677.8 714.6 721.8 599.8Of which: import of goods 236.9 251.8 280.2 319.9 310.6 345.0 309.5
import of services 79.7 84.5 93.4 99.5 105.8 115.6 111.9income 105.7 120.5 164.9 228.0 270.5 230.8 146.9
current transfers 21.9 24.0 29.2 30.4 27.6 30.4 31.6
Current Balance –18.3 –24.9 –32.8 –43.8 –37.7 –22.0 –18.4Of which: trade in goods –48.6 –60.9 –68.6 –76.3 –89.8 –93.4 –81.8
trade in services 22.6 28.4 25.7 34.8 44.8 55.1 49.3net income 17.5 17.8 21.9 9.6 20.8 30.3 28.7
net current transfers –9.8 –10.3 –11.8 –11.9 –13.5 –14.0 –14.6
Office for National Statistics28
The UK’s international investment position Economic & Labour Market Review | Vol 4 | No 6 | June 2010
records the net IIP at the end of each year. From 1978 onwards the UK have published IIP data quarterly. Figure 1 records the UK’s IIP from 1996 to 2009; quarterly data has been presented when available.
Figure 1 shows that there have been four main phases in the UK’s IIP since records began:
■ between 1966 Q4 and 1995 Q2 the UK recorded a net asset position in all but six periods – the net assets position peaked in 1986 Q3 at £88.8 billion, 23 per cent of the annualised GDP
■ between 1995 Q3 and 2006 Q4 the UK continually recorded a net liability position, due in part to the current account which was in deficit for all but four quarters over this period. Th e current account deficit was fi nancedby an increase in inward foreign investment, directly increasing the UK’s net liability position. The UK’s net liability position peaked in 2006 Q4 at £352.6 billion, equating to 27 per cent of annualised GDP
■ driven by depreciation in sterling, in 2007 and 2008, the UK’s net liability
position reduced considerably and reached a recent low of £36.8 billion in 2009 Q1
■ from 2009 Q2, the UK’s net liability position once again began to widen as world stockmarkets recovered and sterling appreciated against the other major currencies. In the latest quarter, 2009 Q4, the UK’s net liability position was £182.6 billion
The net IIP is a relatively small number compared to the size of gross assets and liabilities - in 2009, the £182.6 billion net liability position was the diff erence between over £6.5 trillion of assets and £6.7 trillion of liabilities. Both assets and liabilities have grown substantially in the last couple of decades, partly due to the City of London’s position and the globalisation of fi nance. The UK’s assets and liabilities are now nearly five times as large as annual GDP.This means that, potentially, 10 percent depreciation in sterling could result in an increase in foreign assets of nearly half of the UK’s annual GDP. As the UK’s liabilities are predominantly sterling denominated, the effect is smaller for liabilities than assets.
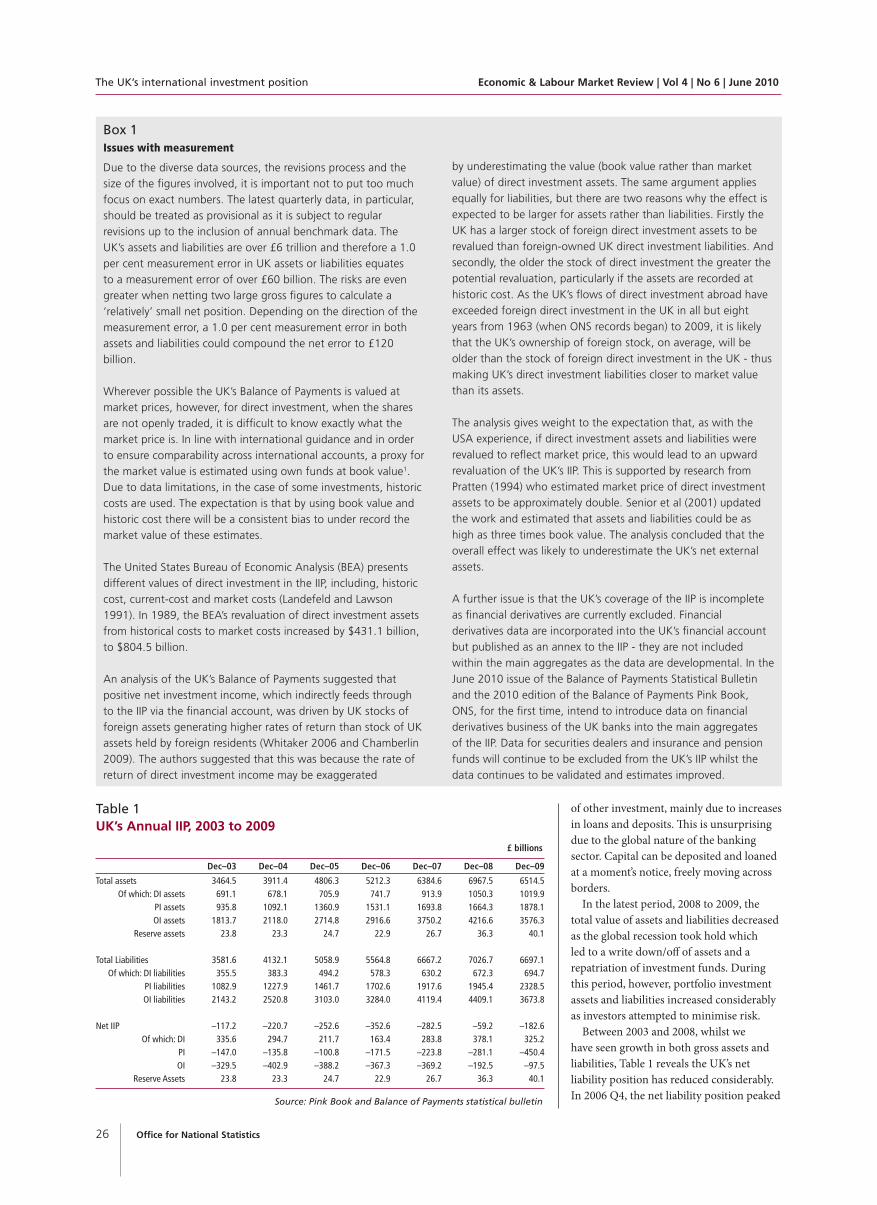
Drivers of the movements in the IIP In order to understand the link between the current account flows, other changes and the IIP, Figure 2 charts the movement in the cumulative current account and the IIP as a percentage of quarterly GDP. Th e chart reveals a strong link between the current account and the IIP, which generally move in the same direction. There are signifi cantdivergences, however. This divergence is necessarily the result from currency, price or other volume changes.
Figure 2 shows that, in the main, the cumulative current account balance as a percentage of quarterly GDP grew steadily from 1977 Q4 to 1984 Q1 and from then on has generally deteriorated, peaking at a low in 2009 Q3. The performance of the IIP as a percentage of quarterly GDP during these periods was much more volatile. In 1982 Q3, 1990 Q4, 1999 Q4 and 2007 Q1 the IIP ratio began to diverge from the path of cumulative current account ratio.This divergence was driven in part by exchange rate fluctuations, movements in the underlying asset price and other volume changes.
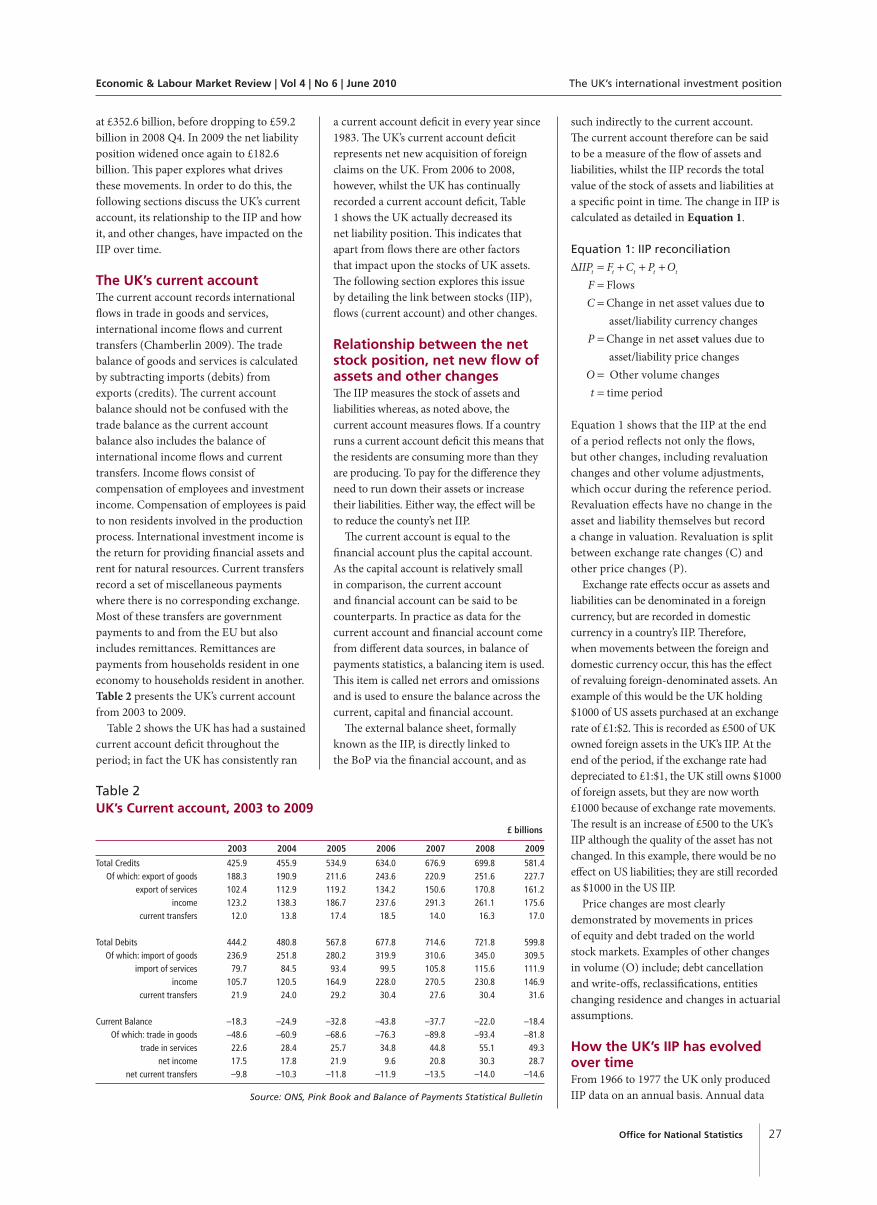
Exchange rate movements Figure 3 records the quarterly exchange rate movements from 1975 Q1 to 2009 Q4.
Although each currency has its own individual movements and timings, in general, they can be classified into four distinct phases. In the first phase (70s, 80s and early part of the 90s) there was a depreciation of sterling against the major currencies. This was followed by a period of recovery in the mid 90s and 2000s. In 2007 and 2008 there was a substantial depreciation of sterling against all the major currencies. From 2009 Q1, sterling appreciated against the major currencies, recovering some of the previous losses.
Sterling depreciated by 33 per cent againstthe dollar over the whole period (1975 Q1to 2009 Q4). In the first phase, 1975 Q1 to1984 Q4, sterling depreciated by 52 per cent.Between 1984 Q4 and 2008 Q2, the poundthen rallied against the dollar and appreciatedby 72 per cent. In the period 2008 Q2 to2009 Q1 the pound noticeably depreciatedby 28 per cent. Sterling has rallied in thelatest quarters and appreciated by 13 per centbetween 2008 Q4 and 2009 Q4.
The euro to sterling exchange rate depreciated by 36 per cent over the full period (1975 Q1 and 2009 Q4). Between 1975 Q1 and 1995 Q4 sterling depreciated by 35 per cent. Between 1995 Q4 and 2001 Q2 the pound rallied against the euro,
Figure 1The UK’The UK’s net IIPs net IIP, annually fr, annually from 1966 to 1977 and quarterly from 1966 to 1977 and quarterly from om 1978 Q1 to 2009 Q41978 Q1 to 2009 Q4
£ billions
Source: ONS, Pink Book and Balance of Payments Statistical Bulletin
–400–350–300–250–200–150–100
–500
50100150
1966 1977 1980Q3
1983Q2
1986Q1
1988Q4
1991Q3
1994Q2
1997Q1
1999Q4
2002Q3
2005Q2
2008Q1
Figure 2Cumulative currCumulative current account (CCA) and interent account (CCA) and international investment national investment position as a perposition as a percentage of quarterly GDPcentage of quarterly GDP, 1977 Q4 to 2009 Q4, 1977 Q4 to 2009 Q4
Per cent
Source: ONS, Pink Book and Balance of Payments Statistical Bulletin
–150
–100
–50
0
50
100
150
1977Q4
1980Q4
1983Q4
1986Q4
1989Q4
1992Q4
1995Q4
1998Q4
2001Q4
2004Q4
2007Q4
IIP:GDP CCA:GDP

Economic & Labour Market Review | Vol 4 | No 6 | June 2010 The UK’s international investment position
29Office for National Statistics
Figure 3Sterling exchange rate against US DollarSterling exchange rate against US Dollar, eur, euro/ECU and yen, o/ECU and yen, 1975 Q1 to 2009 Q41975 Q1 to 2009 Q4
$ and euro exchange rate yen exchange rate
Source: Bank of England
0.0
0.5
1.0
1.5
2.0
2.5
3.0
1975Q1
1978Q1
1981Q1
1984Q1
1987Q1
1990Q1
1993Q1
1996Q1
1999Q1
2002Q1
2005Q1
2008Q1
0
100
200
300
400
500
600
700
800$ : £ euro : £ yen : £
Figure 4SharShare price indices, 1999 Q1 to 2009 Q4e price indices, 1999 Q1 to 2009 Q4
Indices
Source: ONS Financial Statistics and Yahoo Finance
0
5000
10000
15000
20000
25000
1999 2000 2001 2002 2003 2004 2005 2006 2007 2008 2009
US Dj Nikkei Eurostoxx FTSE
Mar Mar Mar Mar Mar Mar Mar Mar Mar Mar Mar
appreciating by 43 per cent. From 2001 Q2 to 2008 Q4 any gains were more than off set as the pound once again depreciated against the euro by 38 per cent. Recent movements have seen the pound rebound somewhatagainst the euro, appreciating by 9 per cent between 2008 Q4 and 2009 Q4.
Over the whole period sterlingdepreciated by 79 per cent against the yen.In the first phase alone, 1975 Q1 to 1995Q2, the pound depreciated by 81 per centagainst the yen. From then on until 2007Q2 sterling recovered, appreciating by83 per cent. From 2007 Q2 to 2008 Q4,sterling again depreciated against the yen,this time by 47 per cent. As with the dollarand the euro, sterling rallied against theyen in the latest quarters, 15 per cent upbetween 2008 Q4 and 2009 Q4.
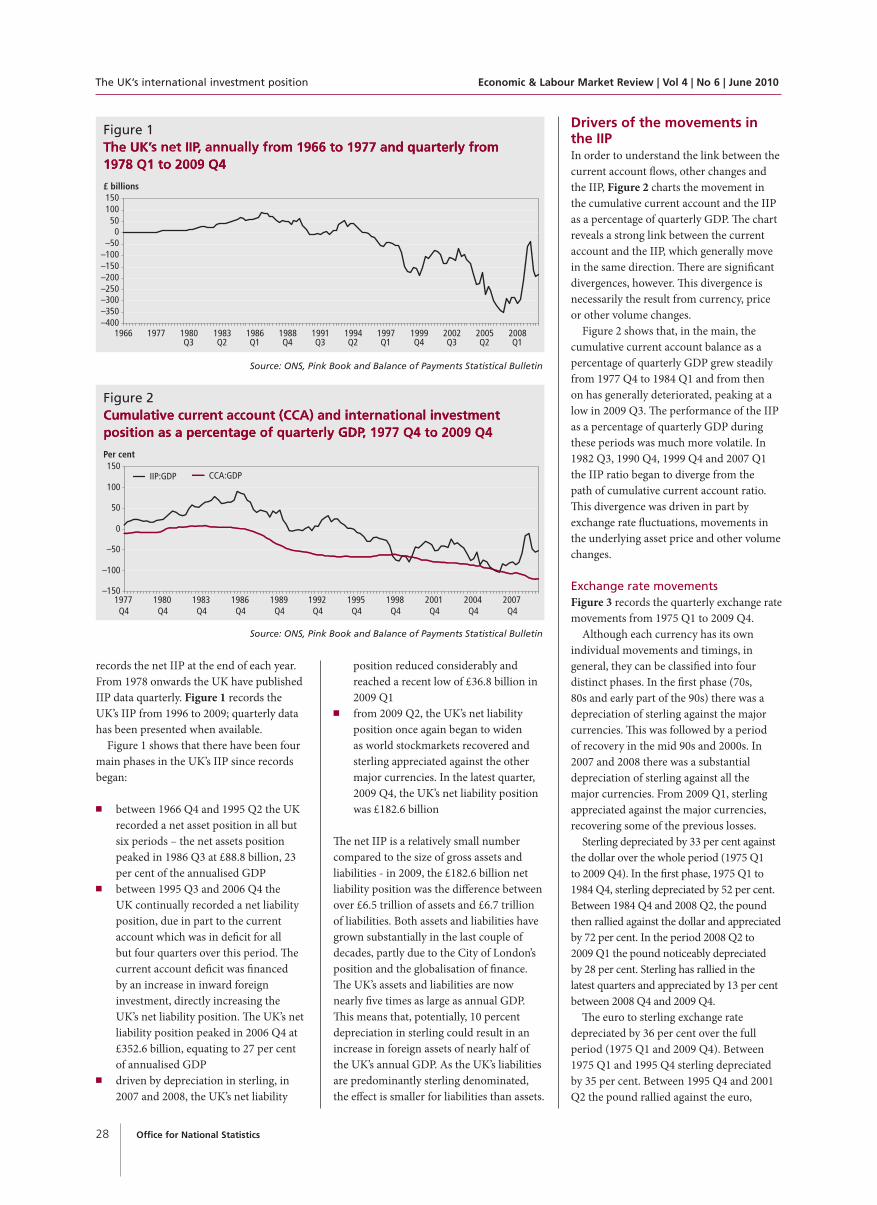
Price effects Figure 4 details the performance of USA, European, Japanese and the UK stock markets between 1999 Q1 and 2009 Q4.
Figure 4, shows that generally the FTSE,Euro Stoxx and Dow Jones tend to trackeach other fairly closely and therefore priceeffects overall have had less of an impacton changes to the IIP than exchange ratemovements. The Nikkei was the most
volatile of the indices, as measured by thepercentage change in the peak to trough andtrough to peak movements, and has leadto considerable price movements in UK-owned Japanese stocks. At an aggregate level,however, the impact is limited as the size ofUK-owned Japanese stock is considerablysmaller than UK owned US and Euro stocks.In the first peak to trough movement inFigure 4, 2000 Q1 and 2003 Q1, the Nikkeicontracted by 61 per cent compared to 45per cent on the FTSE. The trough to peakmovement, from 2003 Q1 to 2007 Q2, sawthe Nikkei grow by 128 per cent whereasthe FTSE grew by 83 per cent. In the secondpeak to trough movement (2007 Q2 to 2009Q1), however, the Nikkei contracting by 55per cent whereas the FTSE contracted byjust 41 per cent. In the latest period, 2009 Q1to 2009 Q4, the FTSE grew by 38 per cent,which was stronger than the Dow Jones andconsiderably stronger than the Nikkei.
Model to decompose IIP changes In order to estimate how much of the change in the IIP was down to fi nancial account flows, price, currency or other volume changes, a decomposition of the data is required. Reserve assets were
excluded from the original model due to the relatively small size of both stocks and flows, whilst financial derivatives are excluded from the balance sheet as the data are developmental and currently not published in the main aggregates of the UK’s IIP. Th e Annex to this article provides a description of the data sources, methodology and assumptions used to create the model to estimate this decomposition (Luciano 2005).
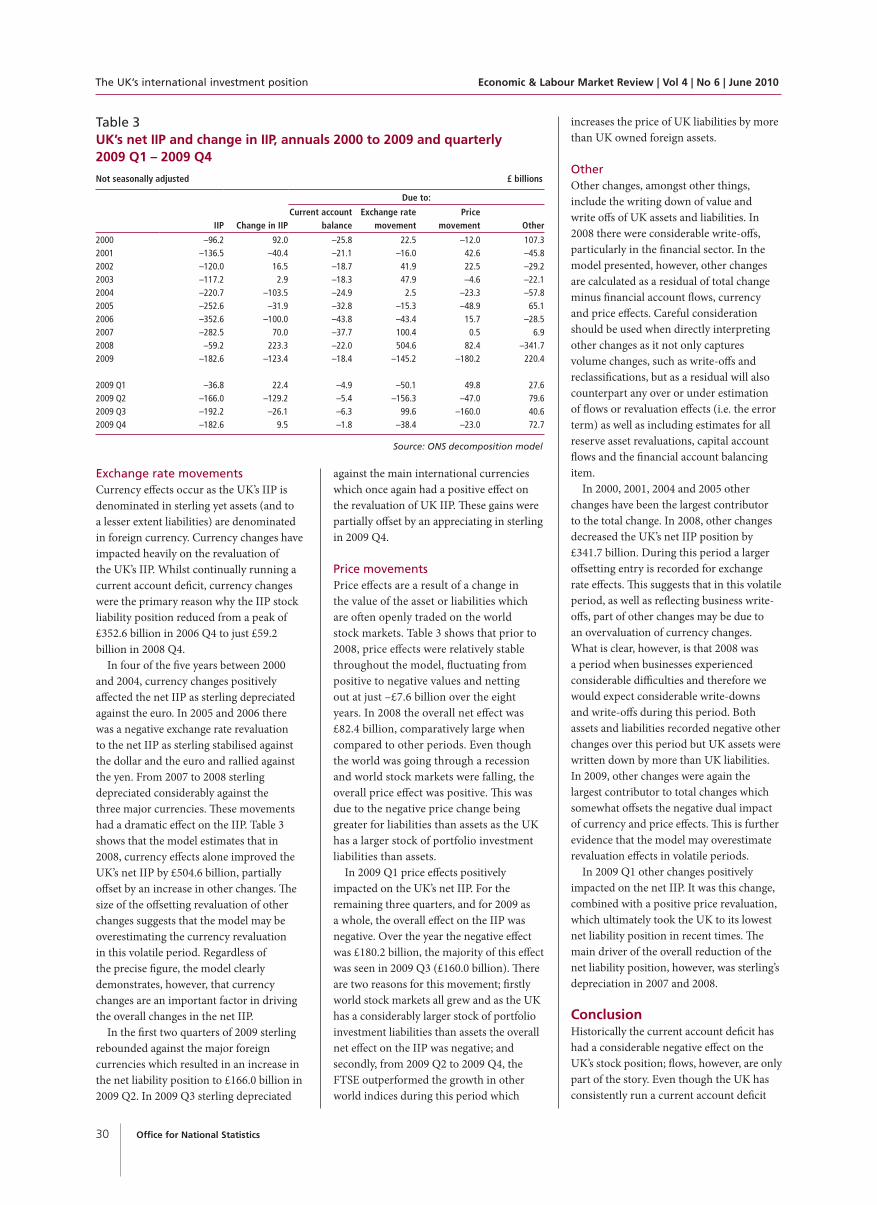
The net IIP is calculated by subtractingliabilities from assets. The ONS model calculates a decomposition of the changes in IIP, in terms of financial account fl ows, exchange rate, price and other volume changes for direct, portfolio and other investment. These estimates are produced at the level of gross assets and gross liabilities before the net flows and net other changes are calculated. In the following section, the model decomposition is reported for the net IIP for the annual period of 2000 to 2009 and quarterly data is also provided for the most recent year. Extreme caution should be taken when interpreting the results of the ‘other’ category as this estimate is calculated as a residual and not only represents the other volume changes for direct, portfolio and other investment (directly calculated within the decompositionmodel) but also includes all reserve asset revaluations, capital account flows and the financial account balancing item (errorsand omissions). These additions to the decomposition model are included in order to reconcile the financial account fl ow dataused in the model to the current account flow data presented in Table 3.
Net IIP Table 3 shows that the UK has consistentlyran a net liability position over all yearsand all quarters and that the fl ows (currentaccount balance) have consistently hada negative effect on the overall net IIP.The net liability position peaked in 2006,before reducing substantially in 2007 and2008 and finally reaching a recent recordlow in 2009 Q1. In 2007, 2008 and 2009Q1 the UK’s net IIP improved by £70.0billion, £223.3 billion and £22.4 billionrespectively; a total reduction of £315.7billion to the UK’s net liability position.The UK’s net liability position improveddespite the fact that it ran a currentaccount defi cit (flows) which increases theUK’s liabilities with the rest of the world.The reason it was able to reduce its netliability position was due to currency andprice effects and other volume changes.
Office for National Statistics30
The UK’s international investment position Economic & Labour Market Review | Vol 4 | No 6 | June 2010
Source: ONS decomposition model
Table 3UK’s net IIP and change in IIP, annuals 2000 to 2009 and quarterly 2009 Q1 – 2009 Q4
Not seasonally adjusted £ billions
IIP Change in IIP
Due to:
Current account balance
Exchange rate movement
Price movement Other
2000 –96.2 92.0 –25.8 22.5 –12.0 107.32001 –136.5 –40.4 –21.1 –16.0 42.6 –45.82002 –120.0 16.5 –18.7 41.9 22.5 –29.22003 –117.2 2.9 –18.3 47.9 –4.6 –22.12004 –220.7 –103.5 –24.9 2.5 –23.3 –57.82005 –252.6 –31.9 –32.8 –15.3 –48.9 65.12006 –352.6 –100.0 –43.8 –43.4 15.7 –28.52007 –282.5 70.0 –37.7 100.4 0.5 6.92008 –59.2 223.3 –22.0 504.6 82.4 –341.72009 –182.6 –123.4 –18.4 –145.2 –180.2 220.4
2009 Q1 –36.8 22.4 –4.9 –50.1 49.8 27.62009 Q2 –166.0 –129.2 –5.4 –156.3 –47.0 79.62009 Q3 –192.2 –26.1 –6.3 99.6 –160.0 40.62009 Q4 –182.6 9.5 –1.8 –38.4 –23.0 72.7
Exchange rate movements Currency effects occur as the UK’s IIP is denominated in sterling yet assets (and to a lesser extent liabilities) are denominated in foreign currency. Currency changes have impacted heavily on the revaluation of the UK’s IIP. Whilst continually running a current account deficit, currency changes were the primary reason why the IIP stock liability position reduced from a peak of £352.6 billion in 2006 Q4 to just £59.2 billion in 2008 Q4.
In four of the five years between 2000 and 2004, currency changes positively affected the net IIP as sterling depreciated against the euro. In 2005 and 2006 there was a negative exchange rate revaluation to the net IIP as sterling stabilised against the dollar and the euro and rallied against the yen. From 2007 to 2008 sterling depreciated considerably against the three major currencies. Th ese movements had a dramatic effect on the IIP. Table 3 shows that the model estimates that in 2008, currency effects alone improved the UK’s net IIP by £504.6 billion, partially offset by an increase in other changes. Th e size of the offsetting revaluation of other changes suggests that the model may beoverestimating the currency revaluation in this volatile period. Regardless of the precise figure, the model clearly demonstrates, however, that currency changes are an important factor in driving the overall changes in the net IIP.
In the first two quarters of 2009 sterling rebounded against the major foreign currencies which resulted in an increase in the net liability position to £166.0 billion in 2009 Q2. In 2009 Q3 sterling depreciated
against the main international currencies which once again had a positive eff ect onthe revaluation of UK IIP. These gains were partially offset by an appreciating in sterling in 2009 Q4.
Price movements Price effects are a result of a change inthe value of the asset or liabilities whichare often openly traded on the worldstock markets. Table 3 shows that prior to2008, price effects were relatively stablethroughout the model, fl uctuating frompositive to negative values and nettingout at just –£7.6 billion over the eightyears. In 2008 the overall net eff ect was£82.4 billion, comparatively large whencompared to other periods. Even thoughthe world was going through a recessionand world stock markets were falling, theoverall price effect was positive. Th is wasdue to the negative price change beinggreater for liabilities than assets as the UKhas a larger stock of portfolio investmentliabilities than assets.
In 2009 Q1 price eff ects positivelyimpacted on the UK’s net IIP. For the remaining three quarters, and for 2009 as a whole, the overall effect on the IIP was negative. Over the year the negative eff ect was £180.2 billion, the majority of this eff ect was seen in 2009 Q3 (£160.0 billion). Th ere are two reasons for this movement; fi rstlyworld stock markets all grew and as the UK has a considerably larger stock of portfolio investment liabilities than assets the overall net effect on the IIP was negative; and secondly, from 2009 Q2 to 2009 Q4, the FTSE outperformed the growth in other world indices during this period which
increases the price of UK liabilities by more than UK owned foreign assets.
Other Other changes, amongst other things, include the writing down of value and write offs of UK assets and liabilities. In 2008 there were considerable write-off s, particularly in the financial sector. In the model presented, however, other changes are calculated as a residual of total change minus financial account fl ows, currency and price effects. Careful consideration should be used when directly interpreting other changes as it not only captures volume changes, such as write-off s and reclassifications, but as a residual will also counterpart any over or under estimation of flows or revaluation effects (i.e. the error term) as well as including estimates for all reserve asset revaluations, capital account flows and the financial account balancing item.
In 2000, 2001, 2004 and 2005 other changes have been the largest contributor to the total change. In 2008, other changes decreased the UK’s net IIP position by £341.7 billion. During this period a larger offsetting entry is recorded for exchange rate eff ects. This suggests that in this volatile period, as well as reflecting business write-offs, part of other changes may be due to an overvaluation of currency changes. What is clear, however, is that 2008 was a period when businesses experienced considerable difficulties and therefore we would expect considerable write-downs and write-offs during this period. Bothassets and liabilities recorded negative other changes over this period but UK assets were written down by more than UK liabilities. In 2009, other changes were again the largest contributor to total changes which somewhat offsets the negative dual impact of currency and price eff ects. This is further evidence that the model may overestimate revaluation effects in volatile periods.
In 2009 Q1 other changes positively impacted on the net IIP. It was this change, combined with a positive price revaluation, which ultimately took the UK to its lowest net liability position in recent times. Th e main driver of the overall reduction of the net liability position, however, was sterling’s depreciation in 2007 and 2008.
Conclusion Historically the current account defi cit has had a considerable negative effect on the UK’s stock position; flows, however, are only part of the story. Even though the UK has consistently run a current account defi cit

Economic & Labour Market Review | Vol 4 | No 6 | June 2010 The UK’s international investment position
31Office for National Statistics
for the past 25 years, other changes have resulted in the UK dramatically improving its net IIP. The model developed by ONS decomposes the changes and clearly shows that the depreciation of sterling was the principal reason why the UK’s net liability position reduced considerably in 2007 and 2008. This was the precursor to the recent low net liability position recorded in 2009 Q1. Further evidence also suggests that if the UK valued direct investment assets and liabilities at market price that this would further positively impact on the UK net asset position.
Taking this into account, however, the fundamental situation underpinning the historic growth of the net IIP liability position has not changed. Th e UK continues to run a current account defi cit driven by a deficit in trade in goods and therefore will require an inward fl ow offinance, or a reduction in reserves, to pay for this defi cit. The challenge to the policy makers in the longer term, is to address the continued current account defi cit otherwise the UK, sometime in the future, may face a similar sudden market correction as that experienced in 2008.
Note1 Own funds at book value is the
estimated value of the asset/liability
provided by the direct investment enterprise (DIE) from its accounting records, as opposed to the direct investor (DI). Estimates from DIE are believed to be closer to market value than estimates provided by the DI.
CONTACT
ACKNOWLEDGEMENTS
The authors would like to thank Graeme
Walker, Simon Humphries, Graeme
Chamberlin and Joe Grice for their helpful
comments. Any errors are the authors’
responsibility.
REFERENCES
Chamberlin G (2009) ‘Methods explained:
The balance of payments’, Economic and
Labour Market Review (September)
Landefeld J S and Lawson A M (1991)
‘Valuation of the US net international
investment position’, Bureau of Economic
Analysis
Luciano M (2005) ‘Estimation of a quarterly
breakdown of changes in IIP due to changes
in prices, exchange rates and other changes’,
Unpublished
Nguyen E L (2009) ‘The international
investment position of the United States at
yearend 2008’, Bureau of Economic Analysis
(July)
Offi ce for National Statistics (2005)
‘International investment position
reconciliation analysis: Estimation of currency
and prices changes’, Unpublished
Offi ce for National Statistics (2009) ‘The Pink
Book’, Palgrave Macmillan
Offi ce for National Statistics (2009) ‘United
Kingdom Economic Accounts’, Palgrave
Macmillan (2009 Q3)
Pratten C (1994) ‘The valuation of outward
and inward direct investment: a report for
the CSO’, Department of Applied Economics,
University of Cambridge
Senior S and Westwood R (2001) ‘The
external balance sheet of the United
Kingdom: implications for fi nancial stability?’,
Bank of England Quarterly Bulletin (Winter
2001)
Whitaker S (2006) ‘The UK international
investment position’, Bank of England
Quarterly Bulletin (2006 Q3)
Office for National Statistics32
The UK’s international investment position Economic & Labour Market Review | Vol 4 | No 6 | June 2010
ANNEX
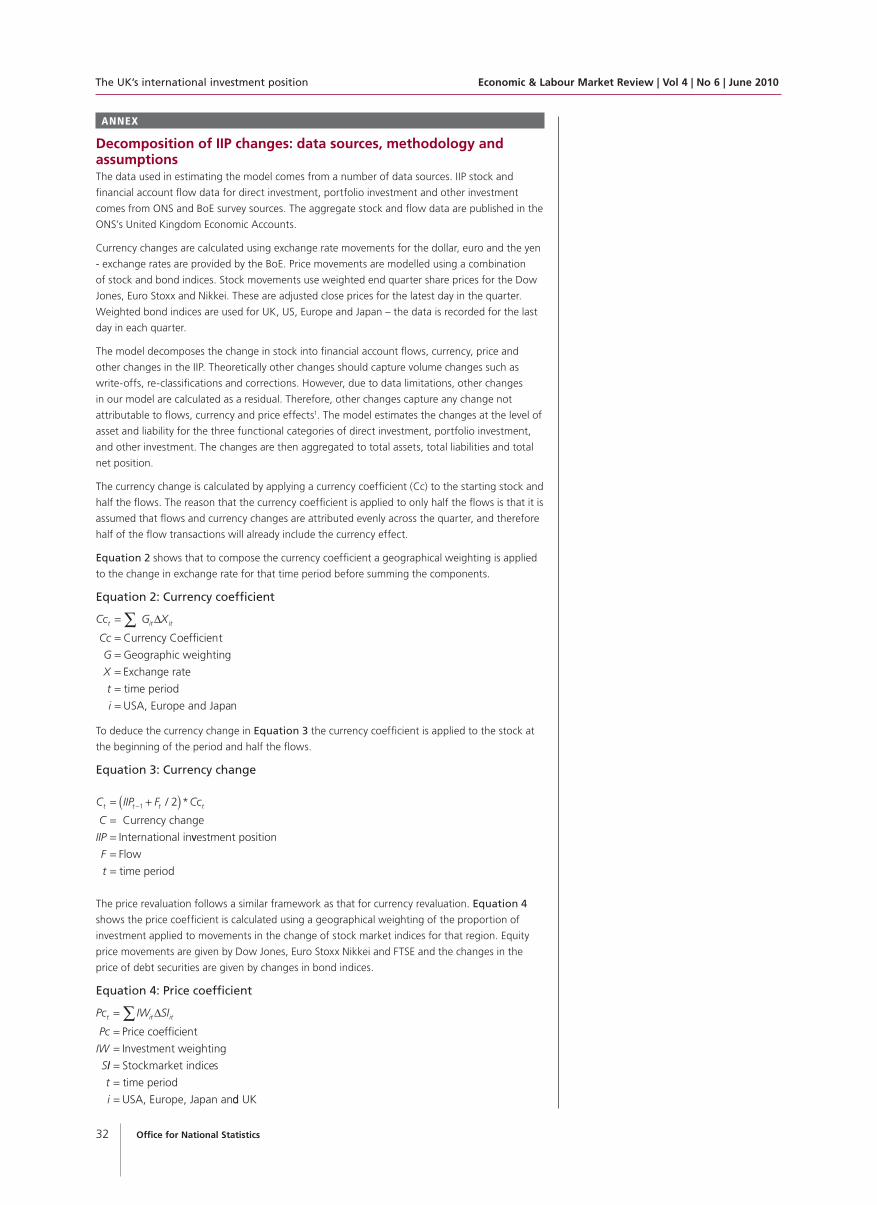
Decomposition of IIP changes: data sources, methodology and assumptions The data used in estimating the model comes from a number of data sources. IIP stock and
fi nancial account flow data for direct investment, portfolio investment and other investment
comes from ONS and BoE survey sources. The aggregate stock and flow data are published in the
ONS’s United Kingdom Economic Accounts.
Currency changes are calculated using exchange rate movements for the dollar, euro and the yen
- exchange rates are provided by the BoE. Price movements are modelled using a combination
of stock and bond indices. Stock movements use weighted end quarter share prices for the Dow
Jones, Euro Stoxx and Nikkei. These are adjusted close prices for the latest day in the quarter.
Weighted bond indices are used for UK, US, Europe and Japan – the data is recorded for the last
day in each quarter.
The model decomposes the change in stock into fi nancial account flows, currency, price and
other changes in the IIP. Theoretically other changes should capture volume changes such as
write-offs, re-classifi cations and corrections. However, due to data limitations, other changes
in our model are calculated as a residual. Therefore, other changes capture any change not
attributable to flows, currency and price effects1. The model estimates the changes at the level of
asset and liability for the three functional categories of direct investment, portfolio investment,
and other investment. The changes are then aggregated to total assets, total liabilities and total
net position.
The currency change is calculated by applying a currency coeffi cient (Cc) to the starting stock and
half the flows. The reason that the currency coeffi cient is applied to only half the flows is that it is
assumed that flows and currency changes are attributed evenly across the quarter, and therefore
half of the flow transactions will already include the currency effect.
Equation 2 shows that to compose the currency coeffi cient a geographical weighting is applied
to the change in exchange rate for that time period before summing the components.
Equation 2: Currency coeffi cient
Cc G X
Cc
G
X
t it it=
==
∑ Δ
Currency Coefficient
Geographic weighting
===
Exchange rate
time period
USA, Europe and Japan
t
i
To deduce the currency change in Equation 3 the currency coeffi cient is applied to the stock at
the beginning of the period and half the fl ows.
Equation 3: Currency change
C IIP F Cc
C
IIP
t t t t= +( )==
−1 2/ *
Currency change
International invvestment position
Flow
time period
F
t
==
The price revaluation follows a similar framework as that for currency revaluation. Equation 4
shows the price coeffi cient is calculated using a geographical weighting of the proportion of
investment applied to movements in the change of stock market indices for that region. Equity
price movements are given by Dow Jones, Euro Stoxx Nikkei and FTSE and the changes in the
price of debt securities are given by changes in bond indices.
Equation 4: Price coeffi cient
Pc IW SI
Pc
IW
S
t it it=
==
∑ Δ
Price coefficient
Investment weighting
II
t
i
===
Stockmarket indices
time period
USA, Europe, Japan andd UK
Economic & Labour Market Review | Vol 4 | No 6 | June 2010 The UK’s international investment position
33Office for National Statistics
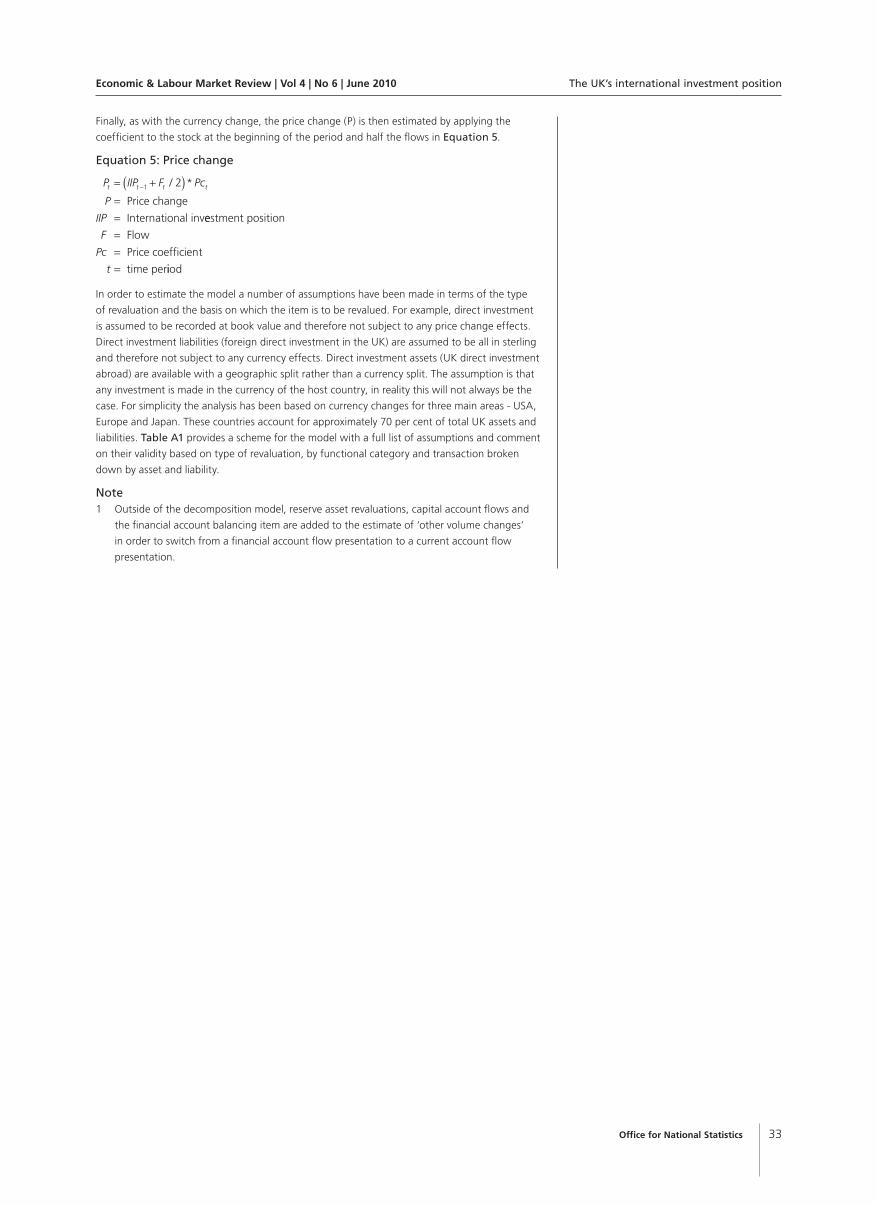
Finally, as with the currency change, the price change (P) is then estimated by applying the
coeffi cient to the stock at the beginning of the period and half the fl ows in Equation 5.
Equation 5: Price change
P IIP F Pc
P
IIP
t t t t= +( )==
−1 2/ *
Price change
International inveestment position
Flow
Price coefficient
time per
F
Pc
t
=== iiod
In order to estimate the model a number of assumptions have been made in terms of the type
of revaluation and the basis on which the item is to be revalued. For example, direct investment
is assumed to be recorded at book value and therefore not subject to any price change effects.
Direct investment liabilities (foreign direct investment in the UK) are assumed to be all in sterling
and therefore not subject to any currency effects. Direct investment assets (UK direct investment
abroad) are available with a geographic split rather than a currency split. The assumption is that
any investment is made in the currency of the host country, in reality this will not always be the
case. For simplicity the analysis has been based on currency changes for three main areas - USA,
Europe and Japan. These countries account for approximately 70 per cent of total UK assets and
liabilities. Table A1 provides a scheme for the model with a full list of assumptions and comment
on their validity based on type of revaluation, by functional category and transaction broken
down by asset and liability.
Note1 Outside of the decomposition model, reserve asset revaluations, capital account fl ows and
the fi nancial account balancing item are added to the estimate of ‘other volume changes’
in order to switch from a fi nancial account flow presentation to a current account fl ow
presentation.
Office for National Statistics34
The UK’s international investment position Economic & Labour Market Review | Vol 4 | No 6 | June 2010
Source: ONS (2005)
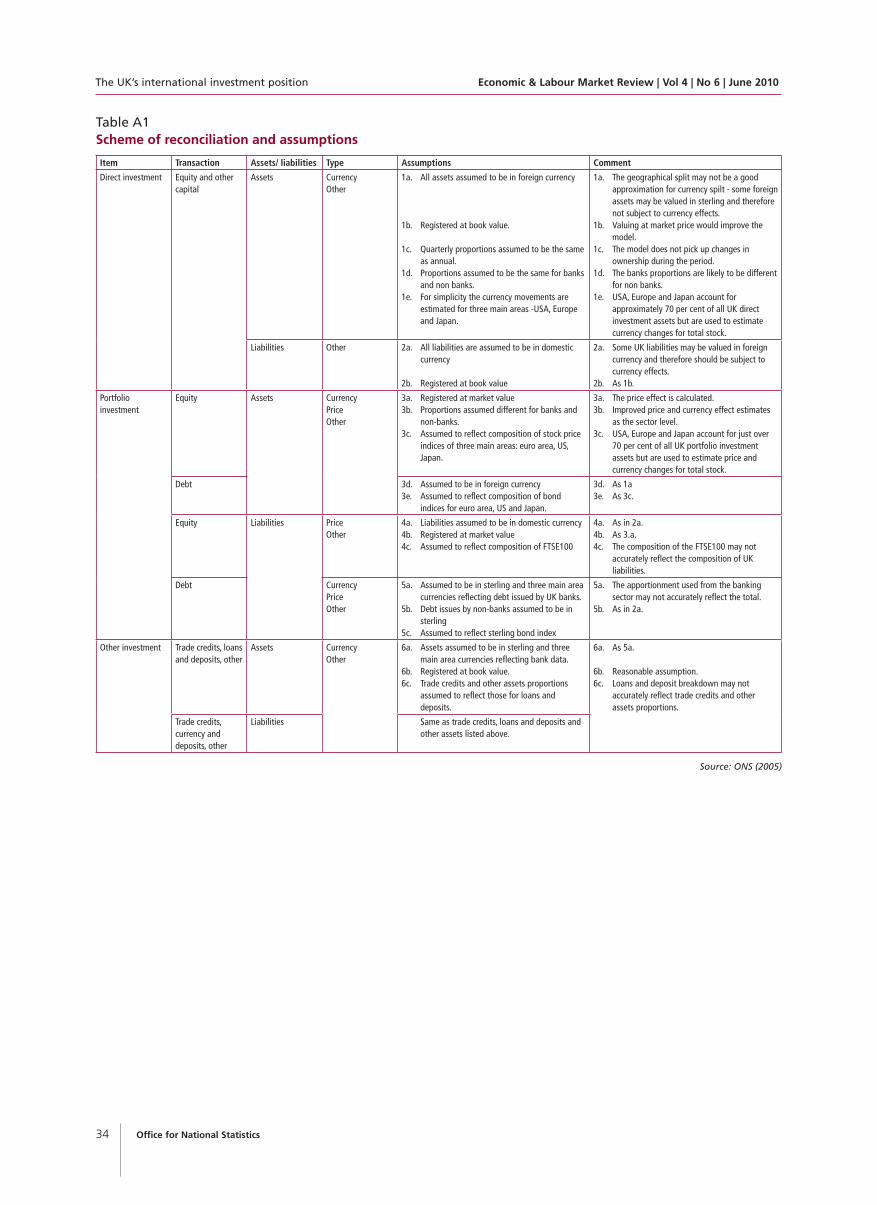
Table A1Scheme of reconciliation and assumptions
Item Transaction Assets/ liabilities Type Assumptions Comment
Direct investment Equity and other capital
Assets CurrencyOther
1a. All assets assumed to be in foreign currency
1b. Registered at book value.
1c. Quarterly proportions assumed to be the same as annual.
1d. Proportions assumed to be the same for banks and non banks.
1e. For simplicity the currency movements are estimated for three main areas -USA, Europe and Japan.
1a. The geographical split may not be a good approximation for currency spilt - some foreign assets may be valued in sterling and therefore not subject to currency effects.
1b. Valuing at market price would improve the model.
1c. The model does not pick up changes in ownership during the period.
1d. The banks proportions are likely to be different for non banks.
1e. USA, Europe and Japan account for approximately 70 per cent of all UK direct investment assets but are used to estimate currency changes for total stock.
Liabilities Other 2a. All liabilities are assumed to be in domestic currency
2b. Registered at book value
2a. Some UK liabilities may be valued in foreign currency and therefore should be subject to currency effects.
2b. As 1b.
Portfolio investment
Equity Assets CurrencyPriceOther
3a. Registered at market value3b. Proportions assumed different for banks and
non-banks.3c. Assumed to reflect composition of stock price
indices of three main areas: euro area, US,Japan.
3a. The price effect is calculated.3b. Improved price and currency effect estimates
as the sector level.3c. USA, Europe and Japan account for just over
70 per cent of all UK portfolio investment assets but are used to estimate price and currency changes for total stock.
Debt 3d. Assumed to be in foreign currency 3e. Assumed to reflect composition of bond
indices for euro area, US and Japan.
3d. As 1a 3e. As 3c.
Equity Liabilities Price Other
4a. Liabilities assumed to be in domestic currency 4b. Registered at market value4c. Assumed to reflect composition of FTSE100
4a. As in 2a.4b. As 3.a.4c. The composition of the FTSE100 may not
accurately reflect the composition of UK liabilities.
Debt CurrencyPriceOther
5a. Assumed to be in sterling and three main area currencies reflecting debt issued by UK banks.
5b. Debt issues by non-banks assumed to be in sterling
5c. Assumed to reflect sterling bond index
5a. The apportionment used from the banking sector may not accurately reflect the total.
5b. As in 2a.
Other investment Trade credits, loans and deposits, other
Assets CurrencyOther
6a. Assets assumed to be in sterling and three main area currencies reflecting bank data.
6b. Registered at book value.6c. Trade credits and other assets proportions
assumed to reflect those for loans and deposits.
6a. As 5a.
6b. Reasonable assumption.6c. Loans and deposit breakdown may not
accurately reflect trade credits and other assets proportions.
Trade credits,currency and deposits, other
Liabilities Same as trade credits, loans and deposits and other assets listed above.
Copyright © 2022 FDOKUMEN