East versus West? Over-qualification and Earnings among the UK's European Migrants
24
This article was downloaded by: [University of Bristol] On: 04 August 2014, At: 04:39 Publisher: Routledge Informa Ltd Registered in England and Wales Registered Number: 1072954 Registered office: Mortimer House, 37-41 Mortimer Street, London W1T 3JH, UK Journal of Ethnic and Migration Studies Publication details, including instructions for authors and subscription information: http://www.tandfonline.com/loi/cjms20 East versus West? Over-qualification and Earnings among the UK's European Migrants Ron Johnston, Nabil Khattab & David Manley Published online: 21 Jul 2014. To cite this article: Ron Johnston, Nabil Khattab & David Manley (2014): East versus West? Over- qualification and Earnings among the UK's European Migrants, Journal of Ethnic and Migration Studies, DOI: 10.1080/1369183X.2014.935308 To link to this article: http://dx.doi.org/10.1080/1369183X.2014.935308 PLEASE SCROLL DOWN FOR ARTICLE Taylor & Francis makes every effort to ensure the accuracy of all the information (the “Content”) contained in the publications on our platform. However, Taylor & Francis, our agents, and our licensors make no representations or warranties whatsoever as to the accuracy, completeness, or suitability for any purpose of the Content. Any opinions and views expressed in this publication are the opinions and views of the authors, and are not the views of or endorsed by Taylor & Francis. The accuracy of the Content should not be relied upon and should be independently verified with primary sources of information. Taylor and Francis shall not be liable for any losses, actions, claims, proceedings, demands, costs, expenses, damages, and other liabilities whatsoever or howsoever caused arising directly or indirectly in connection with, in relation to or arising out of the use of the Content. This article may be used for research, teaching, and private study purposes. Any substantial or systematic reproduction, redistribution, reselling, loan, sub-licensing, systematic supply, or distribution in any form to anyone is expressly forbidden. Terms & Conditions of access and use can be found at http://www.tandfonline.com/page/terms- and-conditions
Transcript of East versus West? Over-qualification and Earnings among the UK's European Migrants
This article was downloaded by: [University of Bristol]On: 04 August 2014, At: 04:39Publisher: RoutledgeInforma Ltd Registered in England and Wales Registered Number: 1072954 Registeredoffice: Mortimer House, 37-41 Mortimer Street, London W1T 3JH, UK
Journal of Ethnic and Migration StudiesPublication details, including instructions for authors andsubscription information:http://www.tandfonline.com/loi/cjms20
East versus West? Over-qualificationand Earnings among the UK's EuropeanMigrantsRon Johnston, Nabil Khattab & David ManleyPublished online: 21 Jul 2014.
To cite this article: Ron Johnston, Nabil Khattab & David Manley (2014): East versus West? Over-qualification and Earnings among the UK's European Migrants, Journal of Ethnic and MigrationStudies, DOI: 10.1080/1369183X.2014.935308
To link to this article: http://dx.doi.org/10.1080/1369183X.2014.935308
PLEASE SCROLL DOWN FOR ARTICLE
Taylor & Francis makes every effort to ensure the accuracy of all the information (the“Content”) contained in the publications on our platform. However, Taylor & Francis,our agents, and our licensors make no representations or warranties whatsoever as tothe accuracy, completeness, or suitability for any purpose of the Content. Any opinionsand views expressed in this publication are the opinions and views of the authors,and are not the views of or endorsed by Taylor & Francis. The accuracy of the Contentshould not be relied upon and should be independently verified with primary sourcesof information. Taylor and Francis shall not be liable for any losses, actions, claims,proceedings, demands, costs, expenses, damages, and other liabilities whatsoever orhowsoever caused arising directly or indirectly in connection with, in relation to or arisingout of the use of the Content.
This article may be used for research, teaching, and private study purposes. Anysubstantial or systematic reproduction, redistribution, reselling, loan, sub-licensing,systematic supply, or distribution in any form to anyone is expressly forbidden. Terms &Conditions of access and use can be found at http://www.tandfonline.com/page/terms-and-conditions
East versus West? Over-qualification andEarnings among the UK’s EuropeanMigrantsRon Johnston, Nabil Khattab and David Manley
West and East Europeans have been important components of the migration flows intothe UK in the last decade, but they remain largely under-studied. This paper utilises12 quarters of the Labour Force Survey for the years 2002–2013 to examine patterns ofover-qualification and their impact on those migrants’ earnings. The findings show aclear and greater penalty for East Europeans. They were more likely than the majorityWhite-British and West European migrants to be substantially over-qualified and haveearned the lowest pay premium on their excess education. The East European migrants’double penalty is explained by their over-concentration in the secondary labour marketwhere discrimination by employers, exploitation and lower rewards are commonpractices. Contrary to this, West European migrants enjoy a much better labour marketposition as they are able to successfully negotiate access to its primary sector.
Keywords: Over-qualification; Earnings; European Migrants; UK
Most research on migrant labour market participation and performance in the UKhas focused on non-whites, especially those self-identified as members of one of theofficially defined ethnic minorities. Members of those minorities have experienced arange of labour market penalties (Algan et al. 2010; Clark and Drinkwater 2008;Heath and McMahon 2005; Heath, Rothon, and Kilpi 2008; Modood et al. 1997; Platt2011; Zimmermann et al. 2007), which it has been suggested reflect their visibilitywithin British society, especially their skin colour (Khattab 2009). Little attention hasbeen paid to other major migrant streams to the UK, most of whose members haveentered the country under the European Union’s (EU) freedom of movement oflabour principle. These ‘new white migrants’ can be divided into two main groups:West Europeans, who have been moving to the UK since its accession to the, then,
Ron Johnston andDavidManley are at the School of Geographical Sciences, University of Bristol, Bristol, UK; NabilKhattab, School of Sociology, Politics and International Studies, University of Bristol, Bristol, UK and Departmentof Sociology and Anthropology, Hebrew University of Jerusalem, Jerusalem, Israel. Correspondence to: RonJohnston, School of Geographical Sciences, University of Bristol, Bristol, UK. E-mail: [email protected]
Journal of Ethnic and Migration Studies, 2014http://dx.doi.org/10.1080/1369183X.2014.935308
© 2014 Taylor & Francis
Dow
nloa
ded
by [
Uni
vers
ity o
f B
rist
ol]
at 0
4:39
04
Aug
ust 2
014
European Community in 1973 (with a wider range of countries as membership wasenlarged); and East Europeans, mostly from countries of the former Warsaw Pactbloc which joined the Union in 2004 and 2007.1
Have members of those two groups experienced labour market penaltiescomparable to those of the ethnic minorities, and have there been differencesbetween the two? To address that question, this paper explores two forms of labourmarket penalty—over-qualification (sometimes termed over-education) and itsimpact on incomes. We anticipate, following Favell (2008a, 2008b), that of the twogroups only East Europeans will experience significant labour market penaltiesbecause of employers’ practices, but that their West European counterparts will havemore readily been integrated into all segments of the labour market, with noimplications for their incomes—a situation that characterised the pre-2004 periodwhen European migrants from non-EU countries (i.e. mainly the former Soviet blocstates) were disadvantaged relative to those from (Western European) EU countries(Dustmann and Fabbri 2005).
Explaining Over-qualification
Over-qualification is generally interpreted as a situation where a group’s membershave a labour market status associated with underutilisation of their skills (hence useof the alternative term over-education applying to individuals whose qualificationsexceed those required for the job they have obtained), lower earnings and lower jobsatisfaction (Smith 1986; Hartog 2000; Jong and Madamba 2001; Slack and Jensen2007). Over-qualification is matched by under-qualification, when individuals getemployment in jobs for which the normal qualification exceeds their highest (henceunder-qualification). Over-qualification is generally interpreted as a disadvantage(Battu and Sloane 2004; Nielsen 2011), whereas under-qualification is perceived asadvantageous, perhaps even reflecting ‘positive discrimination’ (Alpin et al. 1998).
Most theoretical and empirical work has been concerned with over-qualificationbecause of its negative connotations regarding disadvantage and unfulfilled potential.Because of employers’ unwillingness to appoint them to posts for which they arequalified, individuals have to take ‘inferior’, and probably lower-paid, positions. Manyargue that over-qualification will be a temporary phase in an individual’s working lifecycle, when the supply and demand for labour are not in equilibrium (Tsang andLevin 1985). Education is an investment, so if people perceive that there is insufficientdemand for certain skills they will be discouraged from obtaining the relevantqualifications (Freeman 1967).
Alongside these macro-level arguments, micro-level economic theories offerdifferent explanations for over-qualification being a temporary characteristic, withmany skilled employees finding it necessary to take jobs that require lower skill levelsthan theirs. Two main reasons are suggested. The first is that because of a lack ofadequate information amongst both employers and job applicants, employers seekcandidates offering the highest productivity levels whilst candidates seek to maximise
2 R. Johnston et al.
Dow
nloa
ded
by [
Uni
vers
ity o
f B
rist
ol]
at 0
4:39
04
Aug
ust 2
014
returns on their skills (Frei and Sousa-Poza 2012). Employers may use qualificationsas a proxy measure of future productivity (Spence 1973) and so offer their jobs to thebest-qualified applicants. But if those appointed feel their skills are being under-utilised and/or under-rewarded, they will try to move—either to another employer inthe same occupation, or to another occupation. Until that potential move is realised,they will be over-qualified.
The second micro-economic argument links over-qualification to an initial skillsdeficit that is not linked directly to their educational qualifications (Sicherman 1991).Some individuals may have the relevant qualifications for a job but lack other neededskills which can only be gained through experience—such as facility with thelanguage of the country they have moved to (Dustmann and Fabbri 2003) andappreciation of its working practices (this is known to some as the skillscompensation theory). When competing with more experienced, but similarly-qualified, candidates they may fail to be appointed, and have to take a lower-statusjob until they have acquired the relevant experience—which should be a temporarytrade-off only (Frei and Sousa-Poza 2012).
This creates a sequence characterised by Parutis (2010) as ‘any job; better job;dream job’. To gain economic security when they arrive in a country many migrantswill take an available job that will cover their living and subsistence costs; once theyhave established a firm foothold in the labour market, they will start seeking a betterjob, more fitting to their qualifications and aspirations (e.g. income and social status).With further experience, they may then seek new challenges—their dream jobs—although many migrants who do not intend to remain in the country for long maynot reach that stage before deciding to return home, in which case they may neverreach a position in the labour market commensurate with their skills (see alsoDustmann 2000). In a study of Polish migrants to the UK, Eade, Drinkwater, andGarapich (2007) suggested a typology of migrants that has wide application: storks arecircular migrants who mainly take low-skill, low-paid jobs to obtain income duringtheir short-term stays; hamsters stay longer, but only for sufficient time—and againusually in low-paid, low-income occupations—to raise sufficient capital for theirlonger-term career trajectories in their home countries; searchers keep their optionsopen while seeking to climb the occupational ladder in the UK; and stayers intend toremain permanently. The latter two groups are the least likely to suffer substantialemployment penalties.
These various theories—with the possible exception of the skills compensationtheory—are helpful in accounting for over-qualification in general terms, and for itschanging extent as labour market conditions vary (Dustmann, Glitz, and Vogel 2010),but not in accounting for an over-qualification situation applied to members ofmigrant groups and other minorities (Battu and Sloane 2004). Battu and Sloane(2002) argue that lack of familiarity with the English language and other factors suchas employer discrimination, differences in occupational structures between immigrantand native populations, and residential patterns should be taken into account. Manymigrants and members of ethnic minority groups live in residential enclaves within
Journal of Ethnic and Migration Studies 3
Dow
nloa
ded
by [
Uni
vers
ity o
f B
rist
ol]
at 0
4:39
04
Aug
ust 2
014
cities, for example, which may be some distance from employment opportunitiescommensurate with their skills—about which they may have little information. As aconsequence, they take jobs in the local enclave economy, for many of which theymay be over-qualified. On the other hand, reflecting the supply:demand ratio there,they may be appointed to posts for which they are under-educated, because of theabsence of formally qualified applicants. In addition, Nielsen (2011) argues that aprocess of decredentialisation may operate whereby employers devalue qualificationsgained in other countries, about which they are relatively uninformed, especially ifthey know little about the awarding institutions; again, the impacts of this should betemporary until the migrants gain work and other experience and can realise the fullpotential of their skills. During that period, however, employers may find appointingover-qualified migrants advantageous because they are ‘good workers’, willing to takelow-skill, low-wage jobs for which they easily pick up the needed skills and at whichthey work hard, to gain experience (and possibly references) for when they move onfrom ‘any job’ to a ‘better job’ (Anderson et al. 2006).
Discrimination
Unfair practices by employers and institutions against migrants and other minoritiesis an established finding in many countries, though it varies in its extent and strengthbetween groups according to the situation regarding anti-racist legislation, thestruggle of minorities themselves and the activity of national and internationalhuman rights organisations. Racism on the grounds of colour is identified as one ofthe main sources of discrimination in Britain and the USA (Modood 2005; Edwards2008), but this does not apply in the context discussed here as the East and WestEuropean groups investigated have the same colour—white—as the majority hostsociety. However, some groups may be seen as ‘less white’ than others (includingmembers of the native population) on the basis of other characteristics such as adifferent perceived culture, which may be the subject of political debate and mediadiscourse.
Some employers may prefer candidates from their own ethnic-racial or nationalgroup on the grounds of ‘taste discrimination’ (Becker 1957); others may exercisestatistical discrimination (Phelps 1972), denying employment opportunities tomembers of certain groups because of believed lower productivity levels comparedto the employers’ own co-ethnics—practices that are most likely if the candidatescome from groups that are placed low in the ethno-class system, as are most non-white groups in Britain. In most cases, these candidates are perceived negatively (lessworthy, less relevant and less important). Such perceptions have coloured recentdebates in the UK over EU enlargement and consequent migration flows from EastEurope: many of the those migrants are portrayed as coming from low-wageeconomies who are prepared to take jobs for which they are over-qualified (and thus,in some of the rhetoric, denying them to members of the host society), at pay levelsthat are nevertheless substantially larger than those for higher-status jobs in theirhome countries—enabling them to make remittances to relatives at home and save
4 R. Johnston et al.
Dow
nloa
ded
by [
Uni
vers
ity o
f B
rist
ol]
at 0
4:39
04
Aug
ust 2
014
money to be invested in properties and businesses when they return, as many do notintend to settle permanently in the UK.
East and West European Migrants in a Segmented Labour Market
In ethnically or racially divided societies, a large proportion of the members of mostminority groups are concentrated into the blue-collar, semi-skilled and unskilledoccupations, reflecting a segmented labour market (Piore 1978). According to theDual Labour Market theory, such societies comprise two distinct labour marketsegments—a primary sector offering well-paid, secure positions and a secondarysector dominated by poorly paid, insecure jobs, with the two thus offering differentemployment conditions, including opportunities for promotion and career progress(Piore 1978, 1979; Dickens and Lang 1985).
Many minority group members tend to be over-concentrated in the secondarysector, making them more vulnerable to both over-qualification and low incomes dueto the lack of job security, which in their case might be associated with labour marketdiscrimination (Haughton et al. 1993). Employment conditions in that sector—including the greater risk of unemployment and employers’ discriminatory practices—are likely to result in many group members accepting jobs requiring lower qualificationsthan their own, a situation exacerbated if their credentials are not generally recognisedby employers (as illustrated in Csedö’s [2008] work on Hungarian and Romanianprofessional migrants negotiating recognition of their qualifications in London). In suchsituations, accepting decredentialisation of their qualifications and jobs for which they areover-qualified may be available short-term situation for migrants—especially those whodo not intend to settle permanently in the country and are content to take, for them,relatively well-paid positions. As a consequence, minority group members are morelikely to be over-qualified compared to members of the society’s majority ethnic group,relatively more of whom find work in the primary sector.
Among European migrants to the UK, however, available evidence indicatesconsiderable differences in the labour market experiences of West and EastEuropeans. The former do not appear to face significant penalties and are likely tobe incorporated within the primary sector, notably as professional and semi-professional workers, reflecting their human capital (Salt and Millar 2006; Cheungand Heath 2007; Clark and Drinkwater 2008). Contrary to that situation, however,East European migrants appear to be penalised in the UK labour market relative totheir human capital (Drinkwater, Eade, and Garapich 2009; Demireva 2011). Theytend to be concentrated at the lower levels of the labour market, often over-qualifiedand paid less than others with similar qualifications (Clark and Drinkwater 2008);Favell (2008a, 710–711) suggests that most of them (who are far from uneducated;many have degrees, as illustrated below) are being channelled into undervalued, low-paid and insecure positions in the secondary labour market (in, e.g, the agricultural,construction, catering and domestic industries)—a situation that he associates withdifferential power relations that facilitate their exploitation and exclusion from someoccupations for which they may be qualified.
Journal of Ethnic and Migration Studies 5
Dow
nloa
ded
by [
Uni
vers
ity o
f B
rist
ol]
at 0
4:39
04
Aug
ust 2
014
Migration and Over-qualification: a Short-term Penalty?
There is general agreement that migrants, especially of the first-generation, are likelyto pay a price for moving to a new country. In many cases, this will reflect issuesrelating to assimilation into the local culture, most obviously the lack of languageskills (Stier and Levanon 2003), insufficient knowledge about and familiarity withlocal labour market practices (Chiswick 1999), plus devaluing of the skills andqualifications obtained in their home countries (Lerner and Menahem 2003; Nielsen2011). Most employers and institutions lack information and knowledge regardingthe nature and quality of migrants’ qualifications and as a consequence may deemthem less worthy than those of job applicants from the majority population(Bauder 2003).
Because migrants are aware of both their individual lack of such relevant skills andthe wider problem of qualification decredentialisation, they are initially willing to takejobs for which they are over-qualified. Their skills deficit should decline over timewith experience, however, and enable them to obtain positions commensurate withtheir qualifications. Thus, migrants with several years of employment experienceshould be less over-qualified than later arrivals, even if they cannot yet getemployment which matches their qualifications. If that is the case, then over-qualification, especially substantial over-qualification, should be a temporary experi-ence. Has that been the case in the UK during the last decade, for both West and EastEuropean migrants—or have the former group, because their skills and experience aremore likely to be recognised earlier in their stay, suffered fewer (if any) penalties?
Over-qualification and Earnings
Studies of the link between over-qualification and earnings have found that over-qualified individuals are paid more than those in a similar position whosequalifications match those required for the job (Brynin and Longhi 2009).Nevertheless, the former individuals also tend to suffer penalties because they earnless than their contemporaries with the same qualifications and a job to match. Over-qualification results in a premium relative to the job but a penalty relative toeducation (Tsang and Levin 1985; Sloane, Battu, and Seaman 1999; Hartog 2000;Büchel and Mertens 2004). That may not apply to all minority groups withinethnically and racially divided (or super-diverse: Vertovec 2007) societies, however;for them the returns to their human capital and the impact of their over-qualificationon wages may be different. The analyses reported here explore whether that is thecase in the UK by exploring the extent of over-qualification among members of twobroadly defined minority groups, and the relationship between this and earnings: wehypothesise that East Europeans will suffer a double penalty—more likely to be over-qualified for the jobs that they obtain and also less well-paid in those jobs than theirWest European counterparts in the same labour market situations, and who havebeen in the UK for the same period of time.
6 R. Johnston et al.
Dow
nloa
ded
by [
Uni
vers
ity o
f B
rist
ol]
at 0
4:39
04
Aug
ust 2
014
Methods and Data
The analyses reported here use data from 12 pooled April–June quarters of the UKLabour Force Survey (LFS) 2002–2013. This source provides information on not onlylabour market performance and outcomes for a large sample of the population butalso a wide range of individual personal characteristics such as education, age, sex,family status, household composition, ethnicity, religion, nationality and country ofbirth. The labour market information includes economic activity status, earnings,employment types, occupation, number of jobs held and training. We analyse themismatch between educational qualifications and occupation, and its links toearnings, among three groups derived using the available data on ethnicity,nationality and country of birth: White-British Natives (those who reported theirethnicity as White-British, English, Scottish or Welsh); West European migrants(from the 15 members of the EU—excluding the UK—as it existed in 2004) and EastEuropean migrants [from the 10 countries of the former Warsaw Pact which joinedthe EU in the 2004 (Poland, Hungary, Czech Republic, Slovakia, Slovenia, Estonia,Latvia, Lithuania) and 2007 (Romania and Bulgaria)]. This provided a sample of448,584 individuals aged 16–65: 7064 and 9273 of those were East and WestEuropeans, respectively, and 432,247 were British Natives.2
Over- and under-qualification was derived using the following equation (Grootand Brink 2000; Mendes de Oliveira, Santos, and Kiker 2000; Chevalier 2003):
EOMi ¼ Eij � �Ej;
where EOMi is the educational–occupational mismatch (over- and under-qualifica-tion) for individual i; Eij is respondent i in occupation j’s highest educationalqualification [using the International Labour Organization (ILO) two-digit standardclassification of occupations]; and �Ej is the modal qualification level for all individualsin occupation j within the LFS data-set.
The qualification level Eij was measured using the question on the highestqualification obtained by individual i which included six different levels: a degree orequivalent, other higher qualification, A-Level, General Certificate of SecondaryEducation (GCSE) A–C, other qualification and no qualification—other qualificationshave been coded as Level 2, following the Office of National Statistics (ONS; 2013)classification.
The resulting EOMi scale comprises 11 values ranging from −5 (the highest valueof over-qualification) to +5 (the highest value of under-qualification) with 0indicating a complete match between the actual qualification and the modalqualification for that occupation. The values of EOMi have been recoded into fivecategories, two comprising those either mildly (−2 and −1) or substantially over-qualified (−3, −4 and −5), one in which the respondents’ qualifications matched themode for their occupation, and two of mildly (1 and 2) and substantially under-qualified (3, 4 and 5).
Journal of Ethnic and Migration Studies 7
Dow
nloa
ded
by [
Uni
vers
ity o
f B
rist
ol]
at 0
4:39
04
Aug
ust 2
014
The earnings variable uses the information on ‘gross hourly pay’ provided byrespondents.3 For the regression models, a natural logarithmic transformation wasapplied to fit the normal distribution requirement.
To predict incidences of occupational mismatch, we employ the followingequation:
gij ¼ b0 þ b1ðX1Þi þ . . . bkðXkÞi;
where ηij is the log-odds that respondent i falls into a specific category j of theoccupational mismatch scale compared to the match category (a 0 on the 5-pointscale); X1 to Xk are the predictor variables; and β1 to βk are the coefficients thatmeasure the change in the respective log-odds given one-unit change in thepredictors, holding all other variables constant.
n gross hourly pay is predicted using the equations in a multi-level model:
Yij ¼ b0j þ b1jðXijÞ þ eij ðLevel� 1Þ
b0j ¼ b0 þ u0j ðLevel� 2Þ
where Yij is the n gross hourly pay for respondent i in occupation j; the β1j(Xij) arethe predictors and their impact; eij is an error term and β0j is the intercept, which theLevel-2 equation allows to vary across occupations.
The model assumes that slopes are fixed and provides information about intraclasscorrelations (Level-2 variance).
The independent variables used in the modelling, to take individual respondentcharacteristics into account, are the following:
National origin: the information on country of birth was used to define West andEast Europeans and the question on ethnicity to define White-British natives as thecomparator group;
Age: grouped into five-year bands, with 16–19 the comparator group;
Sex: a dummy variable with males as the comparator;
Marital status: recoded into three categories with those either married or divorced/separated contrasted with those who were single;
Region: reflecting the geography of the UK labour market, Inner and Outer Londonwere contrasted with the Rest of the UK;4
Length of employment: a continuous variable used as a proxy for experience of the UKlabour market, which was multiplied by 100 for ease of interpretation of theregression coefficients (as this variable is highly correlated with length of stay in theUK, that is therefore not also included);
8 R. Johnston et al.
Dow
nloa
ded
by [
Uni
vers
ity o
f B
rist
ol]
at 0
4:39
04
Aug
ust 2
014
Occupational class: using the top five levels of the National Statistics-Socio-EconomicClassification (NS-SEC) classification (higher/lower managerial and professional, orsalariat; intermediate white-collar occupations; small employers and own-accountworkers; lower supervisory and technical workers; and those in routine manualoccupations—the last category is used as the comparator); and
Year of survey: included to take into account any period effects in both theimmigrants’ characteristics and experience, plus changes in the labour market (suchas wage inflation). The 12 years were grouped into two periods—pre-recession (2002–2008) and recession (2009–2013); our expectation was that as the labour marketbecame tighter and unemployment increased all workers, especially migrants fromEast Europe, would be further disadvantaged—with more having to take jobs forwhich they were over-qualified and with average incomes declining relatively (Rogers,Anderson, and Clark 2009).
Findings: Descriptive Patterns
The East and West European migrant groups differ not only from the British nativepopulation in both their human capital and their position within the labour marketbut also substantially from each other (Table 1). For example, there are many moremale and female West European migrants with degree or equivalent qualificationsnot only than East Europeans but also than the British comparator population; EastEuropean female migrants were also much more likely to have degrees than theirmale counterparts. Complementing that situation, both migrant groups had manyfewer with school-level qualifications equivalent to the British GCSEs and A-levels—which might make for difficulties in getting their qualifications recognised.5
These differences in qualifications are reflected in the occupational structure of thethree groups (Table 2). West European males, for example, are some five times morelikely to be in managerial or professional jobs than their East European counterparts,and also substantially more likely than British males to have jobs in the salariat. Onthe other hand, East European men are concentrated in the skilled trades, in routineindustrial roles, and in what are termed elementary occupations. The two migrantgroups therefore occupy very different niches in the UK labour market. The same istrue among females, with many more West than East Europeans in white-collaroccupations (the first four rows of the table); indeed, only the administrative andsecretarial category has relatively more British than West European women. In starkcontrast to this, over half of all East European females were in either the personalservice or elementary occupations—more than twice the percentages for both WestEuropeans and British.
Do the differences between the three groups in their occupational structures shownin Table 2 reflect their educational qualifications, or are there mismatches betweenthe sorts of jobs for which individuals are qualified and those in which they havefound work? Table 3 clearly suggests that mismatches are much more the case withthe migrants from East than from West Europe. Less than one-in-five West European
Journal of Ethnic and Migration Studies 9
Dow
nloa
ded
by [
Uni
vers
ity o
f B
rist
ol]
at 0
4:39
04
Aug
ust 2
014
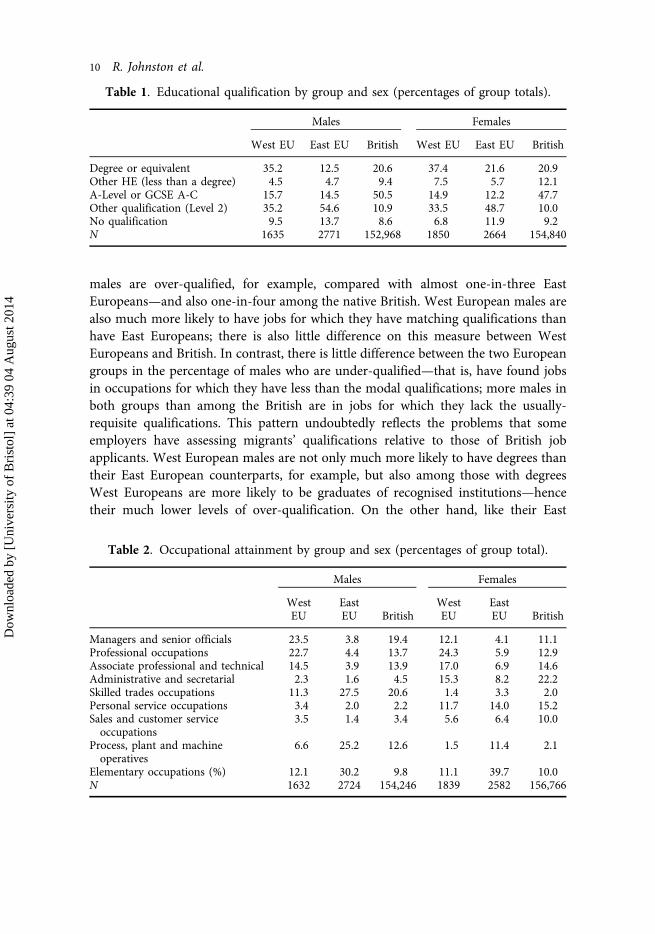
males are over-qualified, for example, compared with almost one-in-three EastEuropeans—and also one-in-four among the native British. West European males arealso much more likely to have jobs for which they have matching qualifications thanhave East Europeans; there is also little difference on this measure between WestEuropeans and British. In contrast, there is little difference between the two Europeangroups in the percentage of males who are under-qualified—that is, have found jobsin occupations for which they have less than the modal qualifications; more males inboth groups than among the British are in jobs for which they lack the usually-requisite qualifications. This pattern undoubtedly reflects the problems that someemployers have assessing migrants’ qualifications relative to those of British jobapplicants. West European males are not only much more likely to have degrees thantheir East European counterparts, for example, but also among those with degreesWest Europeans are more likely to be graduates of recognised institutions—hencetheir much lower levels of over-qualification. On the other hand, like their East
Table 1. Educational qualification by group and sex (percentages of group totals).
Males Females
West EU East EU British West EU East EU British
Degree or equivalent 35.2 12.5 20.6 37.4 21.6 20.9Other HE (less than a degree) 4.5 4.7 9.4 7.5 5.7 12.1A-Level or GCSE A-C 15.7 14.5 50.5 14.9 12.2 47.7Other qualification (Level 2) 35.2 54.6 10.9 33.5 48.7 10.0No qualification 9.5 13.7 8.6 6.8 11.9 9.2N 1635 2771 152,968 1850 2664 154,840
Table 2. Occupational attainment by group and sex (percentages of group total).
Males Females
WestEU
EastEU British
WestEU
EastEU British
Managers and senior officials 23.5 3.8 19.4 12.1 4.1 11.1Professional occupations 22.7 4.4 13.7 24.3 5.9 12.9Associate professional and technical 14.5 3.9 13.9 17.0 6.9 14.6Administrative and secretarial 2.3 1.6 4.5 15.3 8.2 22.2Skilled trades occupations 11.3 27.5 20.6 1.4 3.3 2.0Personal service occupations 3.4 2.0 2.2 11.7 14.0 15.2Sales and customer serviceoccupations
3.5 1.4 3.4 5.6 6.4 10.0
Process, plant and machineoperatives
6.6 25.2 12.6 1.5 11.4 2.1
Elementary occupations (%) 12.1 30.2 9.8 11.1 39.7 10.0N 1632 2724 154,246 1839 2582 156,766
10 R. Johnston et al.
Dow
nloa
ded
by [
Uni
vers
ity o
f B
rist
ol]
at 0
4:39
04
Aug
ust 2
014
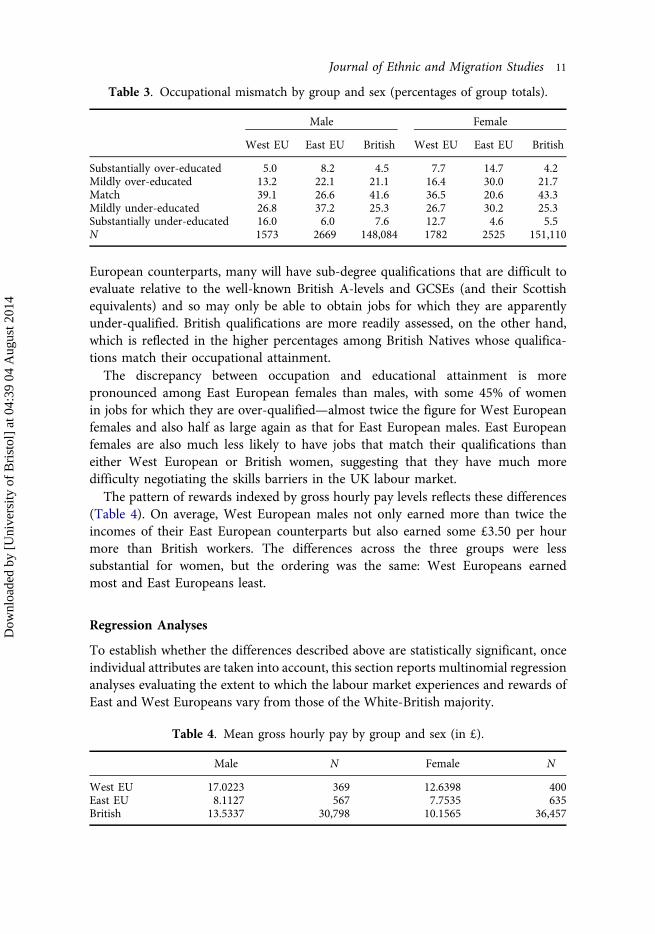
European counterparts, many will have sub-degree qualifications that are difficult toevaluate relative to the well-known British A-levels and GCSEs (and their Scottishequivalents) and so may only be able to obtain jobs for which they are apparentlyunder-qualified. British qualifications are more readily assessed, on the other hand,which is reflected in the higher percentages among British Natives whose qualifica-tions match their occupational attainment.
The discrepancy between occupation and educational attainment is morepronounced among East European females than males, with some 45% of womenin jobs for which they are over-qualified—almost twice the figure for West Europeanfemales and also half as large again as that for East European males. East Europeanfemales are also much less likely to have jobs that match their qualifications thaneither West European or British women, suggesting that they have much moredifficulty negotiating the skills barriers in the UK labour market.
The pattern of rewards indexed by gross hourly pay levels reflects these differences(Table 4). On average, West European males not only earned more than twice theincomes of their East European counterparts but also earned some £3.50 per hourmore than British workers. The differences across the three groups were lesssubstantial for women, but the ordering was the same: West Europeans earnedmost and East Europeans least.
Regression Analyses
To establish whether the differences described above are statistically significant, onceindividual attributes are taken into account, this section reports multinomial regressionanalyses evaluating the extent to which the labour market experiences and rewards ofEast and West Europeans vary from those of the White-British majority.
Table 3. Occupational mismatch by group and sex (percentages of group totals).
Male Female
West EU East EU British West EU East EU British
Substantially over-educated 5.0 8.2 4.5 7.7 14.7 4.2Mildly over-educated 13.2 22.1 21.1 16.4 30.0 21.7Match 39.1 26.6 41.6 36.5 20.6 43.3Mildly under-educated 26.8 37.2 25.3 26.7 30.2 25.3Substantially under-educated 16.0 6.0 7.6 12.7 4.6 5.5N 1573 2669 148,084 1782 2525 151,110
Table 4. Mean gross hourly pay by group and sex (in £).
Male N Female N
West EU 17.0223 369 12.6398 400East EU 8.1127 567 7.7535 635British 13.5337 30,798 10.1565 36,457
Journal of Ethnic and Migration Studies 11
Dow
nloa
ded
by [
Uni
vers
ity o
f B
rist
ol]
at 0
4:39
04
Aug
ust 2
014
Matching Qualifications to Jobs
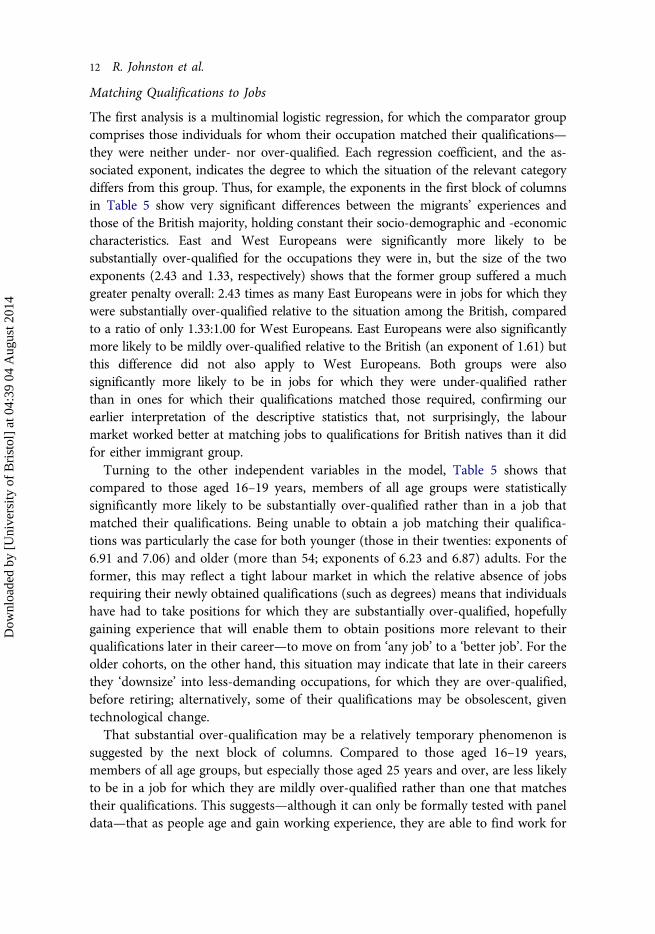
The first analysis is a multinomial logistic regression, for which the comparator groupcomprises those individuals for whom their occupation matched their qualifications—they were neither under- nor over-qualified. Each regression coefficient, and the as‐sociated exponent, indicates the degree to which the situation of the relevant categorydiffers from this group. Thus, for example, the exponents in the first block of columnsin Table 5 show very significant differences between the migrants’ experiences andthose of the British majority, holding constant their socio-demographic and -economiccharacteristics. East and West Europeans were significantly more likely to besubstantially over-qualified for the occupations they were in, but the size of the twoexponents (2.43 and 1.33, respectively) shows that the former group suffered a muchgreater penalty overall: 2.43 times as many East Europeans were in jobs for which theywere substantially over-qualified relative to the situation among the British, comparedto a ratio of only 1.33:1.00 for West Europeans. East Europeans were also significantlymore likely to be mildly over-qualified relative to the British (an exponent of 1.61) butthis difference did not also apply to West Europeans. Both groups were alsosignificantly more likely to be in jobs for which they were under-qualified ratherthan in ones for which their qualifications matched those required, confirming ourearlier interpretation of the descriptive statistics that, not surprisingly, the labourmarket worked better at matching jobs to qualifications for British natives than it didfor either immigrant group.
Turning to the other independent variables in the model, Table 5 shows thatcompared to those aged 16–19 years, members of all age groups were statisticallysignificantly more likely to be substantially over-qualified rather than in a job thatmatched their qualifications. Being unable to obtain a job matching their qualifica-tions was particularly the case for both younger (those in their twenties: exponents of6.91 and 7.06) and older (more than 54; exponents of 6.23 and 6.87) adults. For theformer, this may reflect a tight labour market in which the relative absence of jobsrequiring their newly obtained qualifications (such as degrees) means that individualshave had to take positions for which they are substantially over-qualified, hopefullygaining experience that will enable them to obtain positions more relevant to theirqualifications later in their career—to move on from ‘any job’ to a ‘better job’. For theolder cohorts, on the other hand, this situation may indicate that late in their careersthey ‘downsize’ into less-demanding occupations, for which they are over-qualified,before retiring; alternatively, some of their qualifications may be obsolescent, giventechnological change.
That substantial over-qualification may be a relatively temporary phenomenon issuggested by the next block of columns. Compared to those aged 16–19 years,members of all age groups, but especially those aged 25 years and over, are less likelyto be in a job for which they are mildly over-qualified rather than one that matchestheir qualifications. This suggests—although it can only be formally tested with paneldata—that as people age and gain working experience, they are able to find work for
12 R. Johnston et al.
Dow
nloa
ded
by [
Uni
vers
ity o
f B
rist
ol]
at 0
4:39
04
Aug
ust 2
014
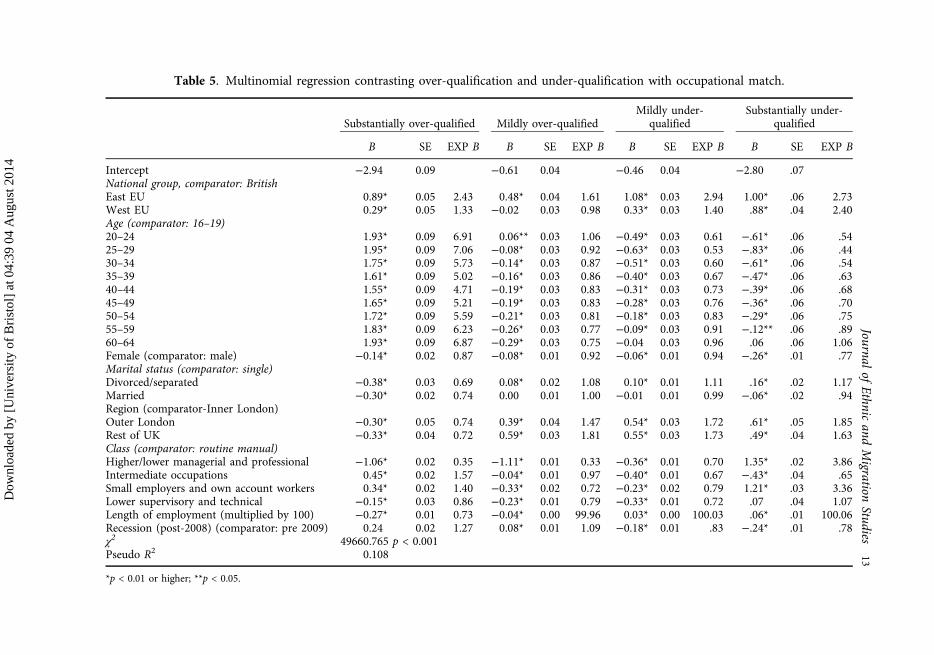
Table 5. Multinomial regression contrasting over-qualification and under-qualification with occupational match.
Substantially over-qualified Mildly over-qualifiedMildly under-
qualifiedSubstantially under-
qualified
B SE EXP B B SE EXP B B SE EXP B B SE EXP B
Intercept −2.94 0.09 −0.61 0.04 −0.46 0.04 −2.80 .07National group, comparator: BritishEast EU 0.89* 0.05 2.43 0.48* 0.04 1.61 1.08* 0.03 2.94 1.00* .06 2.73West EU 0.29* 0.05 1.33 −0.02 0.03 0.98 0.33* 0.03 1.40 .88* .04 2.40Age (comparator: 16–19)20–24 1.93* 0.09 6.91 0.06** 0.03 1.06 −0.49* 0.03 0.61 −.61* .06 .5425–29 1.95* 0.09 7.06 −0.08* 0.03 0.92 −0.63* 0.03 0.53 −.83* .06 .4430–34 1.75* 0.09 5.73 −0.14* 0.03 0.87 −0.51* 0.03 0.60 −.61* .06 .5435–39 1.61* 0.09 5.02 −0.16* 0.03 0.86 −0.40* 0.03 0.67 −.47* .06 .6340–44 1.55* 0.09 4.71 −0.19* 0.03 0.83 −0.31* 0.03 0.73 −.39* .06 .6845–49 1.65* 0.09 5.21 −0.19* 0.03 0.83 −0.28* 0.03 0.76 −.36* .06 .7050–54 1.72* 0.09 5.59 −0.21* 0.03 0.81 −0.18* 0.03 0.83 −.29* .06 .7555–59 1.83* 0.09 6.23 −0.26* 0.03 0.77 −0.09* 0.03 0.91 −.12** .06 .8960–64 1.93* 0.09 6.87 −0.29* 0.03 0.75 −0.04 0.03 0.96 .06 .06 1.06Female (comparator: male) −0.14* 0.02 0.87 −0.08* 0.01 0.92 −0.06* 0.01 0.94 −.26* .01 .77Marital status (comparator: single)Divorced/separated −0.38* 0.03 0.69 0.08* 0.02 1.08 0.10* 0.01 1.11 .16* .02 1.17Married −0.30* 0.02 0.74 0.00 0.01 1.00 −0.01 0.01 0.99 −.06* .02 .94Region (comparator-Inner London)Outer London −0.30* 0.05 0.74 0.39* 0.04 1.47 0.54* 0.03 1.72 .61* .05 1.85Rest of UK −0.33* 0.04 0.72 0.59* 0.03 1.81 0.55* 0.03 1.73 .49* .04 1.63Class (comparator: routine manual)Higher/lower managerial and professional −1.06* 0.02 0.35 −1.11* 0.01 0.33 −0.36* 0.01 0.70 1.35* .02 3.86Intermediate occupations 0.45* 0.02 1.57 −0.04* 0.01 0.97 −0.40* 0.01 0.67 −.43* .04 .65Small employers and own account workers 0.34* 0.02 1.40 −0.33* 0.02 0.72 −0.23* 0.02 0.79 1.21* .03 3.36Lower supervisory and technical −0.15* 0.03 0.86 −0.23* 0.01 0.79 −0.33* 0.01 0.72 .07 .04 1.07Length of employment (multiplied by 100) −0.27* 0.01 0.73 −0.04* 0.00 99.96 0.03* 0.00 100.03 .06* .01 100.06Recession (post-2008) (comparator: pre 2009) 0.24 0.02 1.27 0.08* 0.01 1.09 −0.18* 0.01 .83 −.24* .01 .78χ2 49660.765 p < 0.001Pseudo R2 0.108
*p < 0.01 or higher; **p < 0.05.
Journalof
Ethnicand
Migration
Studies13
Dow
nloa
ded
by [
Uni
vers
ity o
f B
rist
ol]
at 0
4:39
04
Aug
ust 2
014
which they have closer to the modal requisite qualifications. Similarly, younger adultsare significantly less likely than the youngest to be in jobs for which they are mildlyunder-qualified, but the main finding in this block of columns, and also the next, isthat with age people are more likely to be in jobs for which they are under-qualified.As people pass through the career cycle, they gain experience that enables them toobtain positions for which their formal qualifications (perhaps obtained some decadespreviously) are not appropriate.
Among the other variables, the four significant negative coefficients show thatfemales were more likely than males to be in jobs that matched their qualifications,and less likely to be in posts for which they were either under- or over-qualified (apattern entirely consistent with that in Table 3 for the British, who form the greatmajority of the sample). Married people were also more likely than single individualsto be in jobs that matched their qualifications; those who were divorced/separatedwere less likely than single individuals to be substantially over-qualified but morelikely to have jobs for which they were under-qualified. This latter point might beassociated with the often-observed tendency of divorced men and women toparticipate more fully in the labour market and to take more demanding jobs,especially in occupational niches or industries with a shortage of labour(Becker 1985).
There were also regional variations. Compared to Inner London, residents of bothOuter London and the Rest of the UK were significantly less likely to be substantiallyover-qualified, and more likely to be either mildly over-qualified or under-qualifiedrather than in jobs that match their qualifications, suggesting much greaterequilibrium in matching jobs to skills in Inner London than elsewhere. There weresignificant differences in the likelihood of over- or under-qualification across thedifferent occupational classes. Compared to the routine and manual class, people inthe salariat were significantly less likely to be either substantially or mildly over-qualified or significantly less likely to be mildly under-qualified; they were, however,more likely to be substantially under-qualified, perhaps reflecting long employmentexperience among older age cohorts. People in intermediate occupations and smallemployers/own-account workers show a similar pattern in relation to the first threecategories, but diverge in relation to the fourth. As anticipated, members of the lattergroup were significantly much more likely to be substantially under-qualified,whereas people in intermediate occupations were significantly less likely to besubstantially under-qualified. Workers in lower supervisory and technical jobs weresignificantly less likely to be over-qualified or mildly under-qualified than in thematch category. The result for the substantially under-qualified was statisticallyinsignificant.
The impact of the length of employment experience operates in the expecteddirection; the greater the experience of the UK labour market, the smaller thelikelihood of being over-qualified and the greater the likelihood of being under-qualified. This suggests that holding all other factors constant, workers are able to
14 R. Johnston et al.
Dow
nloa
ded
by [
Uni
vers
ity o
f B
rist
ol]
at 0
4:39
04
Aug
ust 2
014
enhance their labour market position by increasing their employment experience,especially its non-measurable components, relative to their qualifications.
The last independent variable in the table shows important differences between thetwo periods—post-2008 compared to pre-2009. When the national economy was hitby recession, more people apparently moved to jobs for which they were over-qualified and fewer were able to obtain jobs for which they were under-qualified.
These findings indicate that East Europeans were clearly more disadvantaged thanboth West Europeans and British natives, facing a greater risk of having to take jobsfor which they were over-qualified. Furthermore, they (like West Europeans) werealso more likely to be under-qualified, which may reflect an advantaged position(Alpin et al. 1998). But are these different occupational match/mismatch situationsdifferentially rewarded, and are the rewards allocated equally between the twomigrant groups?
Incomes
Table 6 reports four separate multi-level linear regression models. Workers are placedat Level-1 and are nested within the two-digit occupational classification as Level-2(the classification is in Table 2). These explore differences across the various groupsanalysed in Table 5 in their gross hourly pay. The first model contains the sameindependent variables as the previous analysis. Model 2 adds whether the individualswere in jobs for which they were either under- or over-qualified (compared to thosefor whom their qualifications matched those of their chosen occupation), but withoutincluding the two migrant groups; Model 3 reinstates those groups, to see whetherthey suffered payment penalties once their employment situation had been taken intoaccount. Finally, Model 4 adds a series of dummy interaction variables to assesswhether East and West Europeans suffered additional penalties relative to Britishworkers in each of those under-/over-qualification categories.
The significant regression coefficients for the separate age groups show the well-established trend: incomes tend to increase from the youngest members of the labourforce (those aged 15–19 years) up to the age of 40: they then stabilise before fallingback across the older groups, but not to below the average levels experienced by thosein their twenties. Women also earn less than men on average and single individualsearn less than those either married or divorced/separated. Incomes were significantlygreater on average in Inner London than in the rest of the UK. People working in thesalariat, intermediate occupations or lower supervisory and technical jobs earnedsignificantly more on average than people in routine and manual jobs; the differencebetween the former group and small employers was negative but statisticallyinsignificant. The longer people had been employed the more they earned, and theregression coefficient of 0.05 indicates that incomes increased in the post-2008recession period. (Incomes have not been standardised for inflation so that we cancompare the nominal income change across the three groups.)
Introducing the additional variables in Model 2 shows that, compared to those injobs that matched their qualifications, those who were over-qualified earned more on
Journal of Ethnic and Migration Studies 15
Dow
nloa
ded
by [
Uni
vers
ity o
f B
rist
ol]
at 0
4:39
04
Aug
ust 2
014
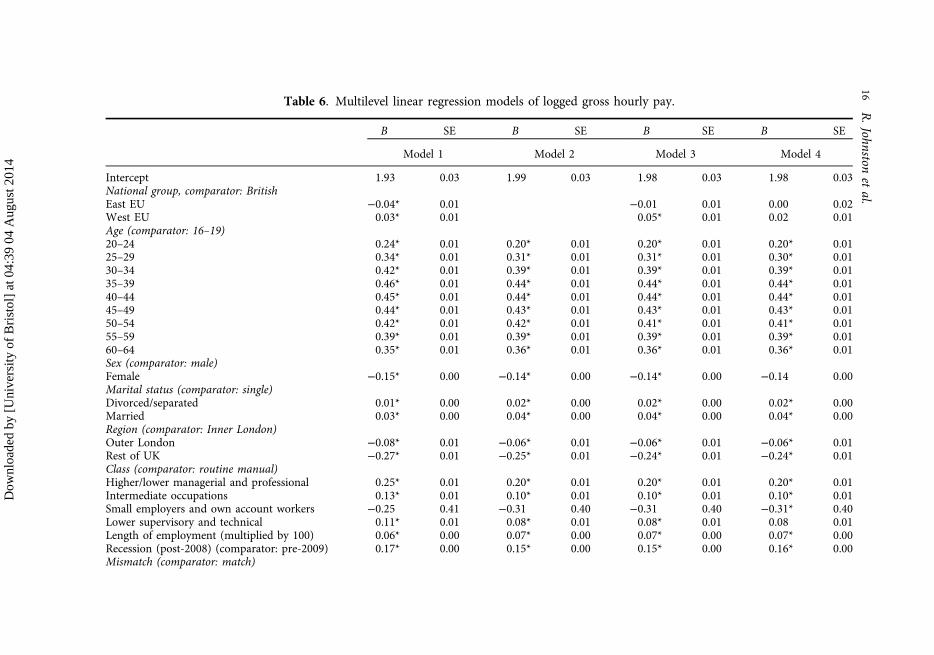
Table 6. Multilevel linear regression models of logged gross hourly pay.
B SE B SE B SE B SE
Model 1 Model 2 Model 3 Model 4
Intercept 1.93 0.03 1.99 0.03 1.98 0.03 1.98 0.03National group, comparator: BritishEast EU −0.04* 0.01 −0.01 0.01 0.00 0.02West EU 0.03* 0.01 0.05* 0.01 0.02 0.01Age (comparator: 16–19)20–24 0.24* 0.01 0.20* 0.01 0.20* 0.01 0.20* 0.0125–29 0.34* 0.01 0.31* 0.01 0.31* 0.01 0.30* 0.0130–34 0.42* 0.01 0.39* 0.01 0.39* 0.01 0.39* 0.0135–39 0.46* 0.01 0.44* 0.01 0.44* 0.01 0.44* 0.0140–44 0.45* 0.01 0.44* 0.01 0.44* 0.01 0.44* 0.0145–49 0.44* 0.01 0.43* 0.01 0.43* 0.01 0.43* 0.0150–54 0.42* 0.01 0.42* 0.01 0.41* 0.01 0.41* 0.0155–59 0.39* 0.01 0.39* 0.01 0.39* 0.01 0.39* 0.0160–64 0.35* 0.01 0.36* 0.01 0.36* 0.01 0.36* 0.01Sex (comparator: male)Female −0.15* 0.00 −0.14* 0.00 −0.14* 0.00 −0.14 0.00Marital status (comparator: single)Divorced/separated 0.01* 0.00 0.02* 0.00 0.02* 0.00 0.02* 0.00Married 0.03* 0.00 0.04* 0.00 0.04* 0.00 0.04* 0.00Region (comparator: Inner London)Outer London −0.08* 0.01 −0.06* 0.01 −0.06* 0.01 −0.06* 0.01Rest of UK −0.27* 0.01 −0.25* 0.01 −0.24* 0.01 −0.24* 0.01Class (comparator: routine manual)Higher/lower managerial and professional 0.25* 0.01 0.20* 0.01 0.20* 0.01 0.20* 0.01Intermediate occupations 0.13* 0.01 0.10* 0.01 0.10* 0.01 0.10* 0.01Small employers and own account workers −0.25 0.41 −0.31 0.40 −0.31 0.40 −0.31* 0.40Lower supervisory and technical 0.11* 0.01 0.08* 0.01 0.08* 0.01 0.08 0.01Length of employment (multiplied by 100) 0.06* 0.00 0.07* 0.00 0.07* 0.00 0.07* 0.00Recession (post-2008) (comparator: pre-2009) 0.17* 0.00 0.15* 0.00 0.15* 0.00 0.16* 0.00Mismatch (comparator: match)
16R.Johnston
etal.
Dow
nloa
ded
by [
Uni
vers
ity o
f B
rist
ol]
at 0
4:39
04
Aug
ust 2
014
Table 6 (Continued)
B SE B SE B SE B SE
Model 1 Model 2 Model 3 Model 4
Substantially over-qualified (SOQ) 0.15* 0.01 0.15* 0.01 0.16* 0.01Mildly over-qualified (MOQ) 0.06* 0.00 0.06* 0.00 0.06* 0.00Mildly under-qualified (MUQ) −0.13* 0.00 −0.13* 0.00 −0.14* 0.00Substantially under-qualified (SUQ) −0.26* 0.01 −0.26* 0.01 −0.26* 0.01Interaction effectsEast EU X SOQ −0.14* 0.04East EU X MOQ −0.01 0.03East EU X MUQ 0.04 0.03East EU X SUQ −0.01 0.05West EU X SOQ −0.05 0.04West EU X MOQ 0.02 0.03West EU X MUQ 0.04 0.02West EU X SUQ 0.13* 0.03Residual 0.17 0.16 0.16 0.16Level-2 variance 0.057 0.075 0.075 0.075BIC 101962.88 95384.15 95381.59 95424.93
*p < 0.05 or higher.
Journalof
Ethnicand
Migration
Studies17
Dow
nloa
ded
by [
Uni
vers
ity o
f B
rist
ol]
at 0
4:39
04
Aug
ust 2
014
average whereas those who were under-qualified earned less; those who obtained ajob for which they lacked the educational qualifications of the majority working insuch occupations were under-paid relative to those who had the requisite qualifica-tions. Those who were only able to obtain jobs for which they were over-qualified, onthe other hand, gained additional rewards to those who had the usually-neededqualifications.
Turning to the two migrant groups, the Model 1 findings show that, on average,West Europeans were paid significantly more than British workers, whereas EastEuropeans were paid significantly less. The latter difference disappeared in the Model3 regression, however: East Europeans’ financial rewards reflected those of the Britishmajority with similar characteristics, including whether they were under- or over-qualified—but the significant positive pay differential for West Europeans not onlyremained but was substantially larger than that shown in Model 1. Finally, there areonly two significant interaction coefficients in Model 4. West Europeans who weresignificantly under-qualified were paid more than average, and the absence of asignificant coefficient for West Europeans overall in this model suggests that amongthat group only those who were significantly under-qualified benefited substantiallyin their incomes. Secondly, among East Europeans only those substantially over-qualified were significantly underpaid compared to their British counterparts; EastEuropeans not only faced a penalty in terms of over-qualification (Table 5) but alsothe pay premium on their over-qualification was significantly lower than for theirBritish counterparts. This double penalty for East Europeans involves many of themnot only being over-qualified but also receiving a low income premium as aconsequence.
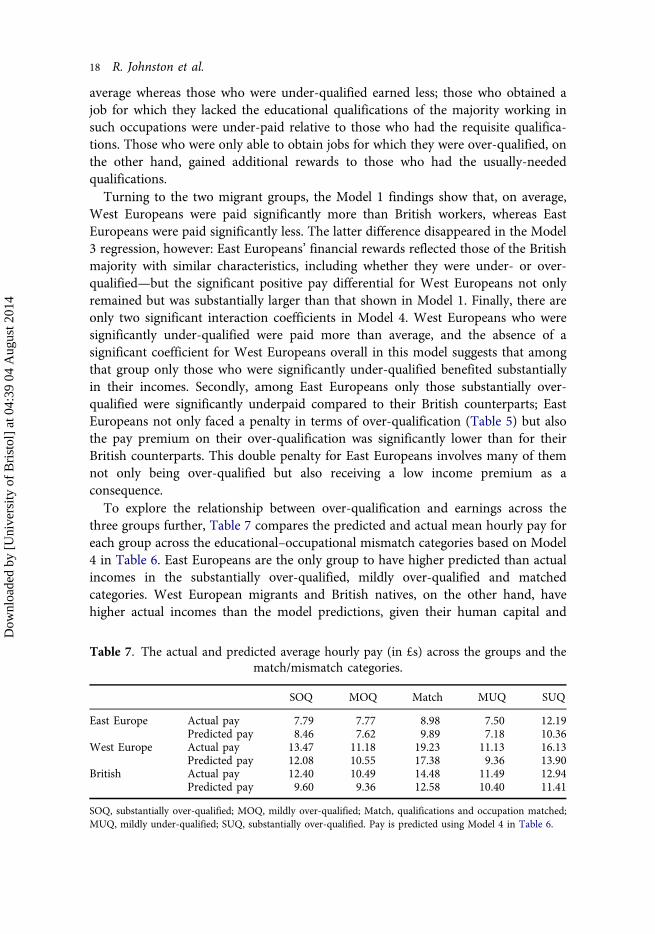
To explore the relationship between over-qualification and earnings across thethree groups further, Table 7 compares the predicted and actual mean hourly pay foreach group across the educational–occupational mismatch categories based on Model4 in Table 6. East Europeans are the only group to have higher predicted than actualincomes in the substantially over-qualified, mildly over-qualified and matchedcategories. West European migrants and British natives, on the other hand, havehigher actual incomes than the model predictions, given their human capital and
Table 7. The actual and predicted average hourly pay (in £s) across the groups and thematch/mismatch categories.
SOQ MOQ Match MUQ SUQ
East Europe Actual pay 7.79 7.77 8.98 7.50 12.19Predicted pay 8.46 7.62 9.89 7.18 10.36
West Europe Actual pay 13.47 11.18 19.23 11.13 16.13Predicted pay 12.08 10.55 17.38 9.36 13.90
British Actual pay 12.40 10.49 14.48 11.49 12.94Predicted pay 9.60 9.36 12.58 10.40 11.41
SOQ, substantially over-qualified; MOQ, mildly over-qualified; Match, qualifications and occupation matched;MUQ, mildly under-qualified; SUQ, substantially over-qualified. Pay is predicted using Model 4 in Table 6.
18 R. Johnston et al.
Dow
nloa
ded
by [
Uni
vers
ity o
f B
rist
ol]
at 0
4:39
04
Aug
ust 2
014
personal characteristics. This is a further evidence of the penalties East Europeanmigrants face in the UK labour market. Moreover, at each level of the educational–occupational mismatch scale, both the actual and predicted mean hourly pay of EastEuropean migrants are significantly lower than the comparable figures for both WestEuropeans and the majority British.
Conclusions
Migrants from other countries of the EU form a substantial component of the UK’slabour market. Since enlargement of the Union in 2004, there has been considerablepolitical debate regarding the migrants’ impact on the UK’s labour market andwelfare state, especially since the recession initiated by the credit crunch of 2008.Within that debate, attention has focused on migrants from East Europe, most ofwhom have taken relatively poorly paid jobs in the economy’s blue collar sector.Much less attention has been paid to the situation of migrants from West Europeancountries, most of whom entered the UK with very different educational qualifica-tions from their East European counterparts and were much more likely to occupypositions in the labour market’s primary sector: they were on average both betterqualified and more likely to be in such occupational strata than their native Britishcounterparts.
This paper has explored the labour market experiences of those two migrantstreams, compared both with each other and the native British population, withparticular reference to the matching of jobs with educational qualifications andincomes. Analyses have identified major differences. Holding constant their personalsituations (such as their age, sex and marital status), for example, and also how longthey had been working in the UK, both groups were much more likely to containmembers who were substantially over-qualified for the positions they had obtainedcompared to the situation in the British host society, but East Europeans significantlymore so than their West European counterparts. This suggests a combination of oneor more of a number of factors operating much more against East than WestEuropeans in their search for employment—including possible discrimination byemployers, a lack of recognition for their educational qualifications, inexperience withlabour market operations and lack of facility with the English language and othercultural skills sought by employers. In addition, East Europeans were more likely tobe hamsters and storks (in Eade, Drinkwater, and Garapich’s typology), and so lesslikely to intend staying in the UK for long periods, whereas West Europeans weremore likely to be searchers or stayers, committed to long-term, if not permanent,residence in the UK.6 Those differences are reflected in the migrants’ incomes.Whatever the match or mismatch between qualifications and occupations, forexample, East Europeans were paid less than others in similar jobs and with similarbackgrounds, whereas West Europeans were paid more than predicted. The latterwere also predicted to earn more than native British residents—and did so; EastEuropeans were predicted to earn less—and they did so too.
Journal of Ethnic and Migration Studies 19
Dow
nloa
ded
by [
Uni
vers
ity o
f B
rist
ol]
at 0
4:39
04
Aug
ust 2
014
Economic theories argue that such mismatches between qualifications andoccupations and the consequent income differentials reflect dis-equilibrium in thelabour market, that should be corrected over time—in which case the patternsidentified here would be reduced, if not disappear, with a move towards equilibrium.Others suggest the continued existence of a dual labour market, with substantialdifferences between its primary and secondary sectors in, for example, the nature andsecurity of the work offered, plus its rewards. Further, if a substantial proportion ofthose in the secondary sector are short-term migrants (in the present context, mainlyfrom East rather than West Europe) who are more concerned with immediatefinancial gains rather than career trajectories matching their qualifications to theiroccupations, then disequilibrium will continue to characterise the labour market;what might be interpreted by some analysts as labour market penalties are, to thoseexperiencing such situations, acceptable contexts for short-term financial gainsalongside cross-cultural experiences. If that remains in place, then the situation ofdifferent migrant groups—relative both to each other and the host society—willdepend not only on the degree to which they have the skills, qualifications andexperience, plus the ability to negotiate access to jobs in the primary sector but alsoon the relative balance of storks/hamsters and searchers/stayers within each group.Currently, the evidence presented here indicates significant differences between Westand East European white migrants to the UK in that balance.
Acknowledgements
Nabil Khattab’s contributed to this research during his tenure of a Marie Curie Inter-EuropeanFellowship for Career Development, project number 328423: he thanks the European Commissionfor its support.
Notes
[1] Each of these groups is, of course, heterogeneous, and there are substantial differences withineach—between those from Scandinavia on the one hand and Portugal on the other withinthe West European group, and between Czechs and Bulgarians with in the East European. Itis not possible to explore the finer-grained variations within those groups with the data-setemployed here, however, in particular because the relatively small numbers of respondentsgiving information on their income precludes such detailed examination; nor, as far as weare aware, are other data-sets available that would allow such detailed assessments of within-group variation within the modelling framework adopted.
[2] The sampling procedure used in the LFS has a small panel element, with a percentageinterviewed in one year also interviewed in the following year. To avoid problems of serialautocorrelation, we have removed all of those double entries from the data analysed here.
[3] Although unfortunately a large proportion of the sample failed to provide this information,thus limiting some of the analyses that might otherwise have been undertaken.
[4] Exploration of other regional divisions of the country suggested no substantial variationsother than those identified in the classification deployed here.
[5] In the analyses reported here, ‘other’ qualifications have been handled as Level-2 (belowA-level and GCSE grades A–C) according to the Office of National Statistics classification:see http://www.ons.gov.uk/ons/dcp171776_337841.pdf, p.30.
20 R. Johnston et al.
Dow
nloa
ded
by [
Uni
vers
ity o
f B
rist
ol]
at 0
4:39
04
Aug
ust 2
014
[6] Unfortunately, our data source did not include information on respondents’ facility with theEnglish language.
References
Algan, Y., C. Dustmann, A. Glitz, and A. Manning. 2010. “The Economic Situation of First- andSecond-Generation Immigrants in France, Germany and the United Kingdom.” TheEconomic Journal 120: F4–F30. doi:10.1111/j.1468-0297.2009.02338.x.
Alpin, C., J. R. Shackleton, and S. Walsh. 1998. “Over- and Undereducation in the UK GraduateLabour Market.” Studies in Higher Education 23 (1): 17–34. doi:10.1080/03075079812331380462.
Anderson, B., M. Ruhs, B. Rogaly, and S. Spencer. 2006. Fair Enough? Central and East EuropeanMigrants in Low-Wage Employment in the UK. Oxford: COMPAS, University of Oxford.
Battu, H., and P. J. Sloane. 2002. “To What Extent are Ethnic Minorities in Britain Over-educated?”International Journal of Manpower 23: 192–208. doi:10.1108/01437720210432194.
Battu, H., and P. J. Sloane. 2004. “Over-education and Ethnic Minorities in Britain.” TheManchester School 72: 535–559. doi:10.1111/j.1467-9957.2004.00407.x.
Bauder, H. 2003. ““Brain Abuse”, or the Devaluation of Immigrant Labour in Canada.” Antipode35: 699–717. doi:10.1046/j.1467-8330.2003.00346.x.
Becker, G. S. 1957. The Economics of Discrimination. Chicago, IL: University of Chicago Press.Becker, G. S. 1985. “Human Capital, Effort, and the Sexual Division of Labor.” Journal of Labor
Economics, 31: S33–S58. doi:10.1086/298075.Brynin, M., and S. Longhi. 2009. “Overqualification: Major or Minor Mismatch?” Economics of
Education Review 28: 114–121. doi:10.1016/j.econedurev.2008.01.003.Büchel, F., and A. Mertens. 2004. “ Overeducation, Undereducation, and the Theory of Career
Mobility.” Applied Economics 36: 803–816. doi:10.1080/0003684042000229532.Cheung, S. Y., and A. Heath. 2007. “Nice Work If You Can Get It”. In Unequal Chances: Ethnic
Minorities in Western Labour Markets, edited by A. F. Heath and S. Y. Cheung, 507–550.Oxford: Oxford University Press for the British Academy.
Chevalier, A. 2003 “Measuring Over-Education.” Economica 70: 509–531. doi:10.1111/1468-0335.t01-1-00296.
Chiswick, B. R. 1999. “Are Immigrants Favorably Self-Selected?” American Economic Review 89:181–185. doi:10.1257/aer.89.2.181.
Clark, K., and S. Drinkwater. 2008. “The Labour-market Performance of Recent Migrants.” OxfordReview of Economic Policy 24: 495–516. doi:10.1093/oxrep/grn023.
Csedö, K. 2008. “Negotiating Skills in the Global City: Hungarian and Romanian Professionals andGraduates in London.” Journal of Ethnic and Migration Studies 34: 803–823. doi:10.1080/13691830802106093.
Demireva, N. 2011. “New Migrants in the UK: Employment Patterns and OccupationalAttainment.” Journal of Ethnic and Migration Studies 37: 637–655. doi:10.1080/1369183X.2011.545308.
Dickens, W. T., and K. Lang. 1985. “A Test of Dual Labor Market Theory.” The American EconomicReview 75: 792–805.
Drinkwater, S., J. Eade, and M. Garapich. 2009. “Poles Apart? EU Enlargement and the LabourMarket Outcomes of Immigrants in the United Kingdom.” International Migration 47 (1):161–190. doi:10.1111/j.1468-2435.2008.00500.x.
Dustmann, C. 2000. Temporary Migration and Economic Assimilation. Bonn: Institute for the Studyof Labor (IZA).
Dustmann, C., and F. Fabbri. 2003. “Language Proficiency and Labour Market Performance ofImmigrants in the UK”. The Economic Journal 113: 695–717. doi:10.1111/1468-0297.t01-1-00151.
Journal of Ethnic and Migration Studies 21
Dow
nloa
ded
by [
Uni
vers
ity o
f B
rist
ol]
at 0
4:39
04
Aug
ust 2
014
Dustmann, C., and F. Fabbri. 2005. “Immigrants in the British Labour Market”. Fiscal Studies 26:423–470. doi:10.1111/j.1475-5890.2005.00019.x.
Dustmann, C., A. Glitz, and T. Vogel. 2010. “Employment, Wages, and the Economic Cycle:Differences between Immigrants and Natives”. European Economic Review 54 (1): 1–17.doi:10.1016/j.euroecorev.2009.04.004.
Eade, J., S. Drinkwater, and M. P. Garapich. 2007. Class and Ethnicity – Polish Migrants in London.Guildford: CRONEM, University of Surrey. http://www.esrc.ac.uk/my-esrc/grants/RES-000-22-1294/read [accessed 8 May 2014].
Edwards, K. L. 2008. “Bring Race to the Center: The Importance of Race in Racially DiverseReligious Organizations.” Journal for the Scientific Study of Religion 47 (1): 5–9. doi:10.1111/j.1468-5906.2008.00387.x.
Favell, A. 2008a. “The New Face of East–West Migration in Europe.” Journal of Ethnic andMigration Studies 34: 701–716. doi:10.1080/13691830802105947.
Favell, A. 2008b. Eurostars and Eurocities: Free Movement and Mobility in an Integrating Europe.Oxford: Blackwell.
Freeman, R. 1967. The Overeducated American. New York: Academic Press.Frei, C., and A. Sousa-Poza. 2012. “Overqualification: Permanent or Transitory?” Applied Economics
44: 1837–1847. doi:10.1080/00036846.2011.554380.Groot, W., and H. M. v. d. Brink. 2000. “Overeducation in the Labor Market: A Meta-Analysis.”
Economics of Education Review 19 (2): 149–158. doi:10.1016/S0272-7757(99)00057-6.Hartog, J. 2000. “Overeducation and Earnings: Where Are We, Where Should We Go?” Economics
of Education Review 19 (2): 131–147. doi:10.1016/S0272-7757(99)00050-3.Haughton, G., S. Johnson, L. Murphy, and K. Thomas. 1993. Local Geographies of Unemployment.
Aldershot: Avebury.Heath, A. F., and D. McMahon. 2005. “Social Mobility of Ethnic Minorities”. In Ethnicity, Social
Mobility and Public Policy, edited by G. C. Loury, T. Modood, and S. M. Teles, 393–413.Cambridge: Cambridge University Press.
Heath, A. F., C. Rothin, and E. Kilpi. 2008. “The Second Generation in Western Europe: Education,Unemployment and Occupational Attainment.” Annual Review of Sociology 34 (1): 211–235.doi:10.1146/annurev.soc.34.040507.134728.
Jong, G. F. D., and A. B. Madamba. 2001. “A Double Disadvantage? Minority Group, ImmigrantStatus, and Underemployment in the United States.” Social Science Quarterly 82 (1): 117–130.doi:10.1111/0038-4941.00011.
Khattab, N. 2009. “Ethno-Religious Background as a Determinant of Educational and OccupationalAttainment in Britian.” Sociology 43: 304–322. doi:10.1177/0730888402239325.
Lerner, M., and G. Menahem. 2003. “Decredentialization and Recredentialization: The Role ofGovernmental Intervention in Enhancing Occupational Status of Russian Immigrants inIsrael in the 1990s.” Work and Occupations 30 (1): 3–29. doi:10.1177/0730888402239325.
Mendes de Oliveira, M., M. C. Santos, and B. F. Kiker. 2000. “The Role of Human Capital andTechnological Change in Overeducation.” Economics of Education Review 19 (2): 199–206.doi:10.1016/S0272-7757(99)00020-5.
Modood, T. 2005. Multicultural Politics: Racism, Ethnicity and Muslims in Britain. Edinburgh:Edinburgh University Press.
Modood, R., R. Berthoud, J. Lakey, J. Nazroo, P. Smith, S. Virdee, and S. Beishon. 1997. EthnicMinorities in Britain: Diversty and Disadvantage. London: Policy Studies Institute.
Nielsen, C. P. 2011. “Immigrant Over-education: Evidence from Denmark.” Journal of PopulationEconomics 24 (2): 499–520. doi:10.1007/s00148-009-0293-0.
ONS, 2013. http://www.ons.gov.uk/ons/dcp171776_337841.pdfParutis, V. 2010. ““Economic Migrants” or “Middling Transnationals”? East European Migrants’
Experiences of Work in the UK.” International Migration 52 (1): 36–55. doi:10.1111/j.1468-2435.2010.00677.x.
22 R. Johnston et al.
Dow
nloa
ded
by [
Uni
vers
ity o
f B
rist
ol]
at 0
4:39
04
Aug
ust 2
014
Piore, M. J. 1978. “Dualism in the Labor Market: A Response to Uncertainty and Flux. The Case ofFrance.” Revue économique [Economic Review] 29 (1): 26–48. doi:10.3406/reco.1978.408371.
Piore, M. J. 1979. Birds of Passage: Migrant Labor and Industrial Societies. Cambridge: CambridgeUniversity Press.
Phelps, E. S. 1972. Inflation Policy and Unemployement Theory. London: Macmillan.Platt, L. 2011. Understanding Inequalities: Stratification and Difference. Cambridge: Polity Press.Rogers, A., B. Anderson, and N. Clark. 2009. Recession, Vulnerable Workers and Immigration.
Oxford: COMPAS, University of Oxford. https://www.compas.ox.ac.uk/research/labourmar-kets/labourmarketproject/ [accessed 8 May 2014].
Salt, J., and J. Millar. 2006. “Foreign Labour in the United Kingdom: Current Patterns and Trends.”Labour Market Trends 114: 335–355.
Sicherman, N. 1991. ““Overeducation” in the Labor Market.” Journal of Labor Economics 9 (2):101–122. doi:10.1086/298261.
Slack, T., and L. Jensen. 2007. “Underemployment across Immigrant Generations.” Social ScienceResearch 36: 1415–1430. doi:10.1016/j.ssresearch.2006.12.003.
Sloane, P., H. Battu, and P. T. Seaman. 1999. “Overeducation, Undereducation and the BritishLabour Market.” Applied Economics 31: 1437–1453. doi:10.1080/000368499323319.
Smith, H. L. 1986. “Overeducation and Underemployment: An Agnostic Review.” Sociology ofEducation 59 (2): 85–99. doi:10.2307/2112434.
Spence, M. 1973. “Job Market Signalling.” Quarterly Journal of Economics 87: 353–374.Stier, H., and V. Levanon. 2003. “Finding an Adequate Job: Employment and Income of Recent
Immigrants to Israel.” International Migration 41 (2): 81–107. doi:10.1111/1468-2435.00236.Tsang, M. C., and H. M. Levin. 1985. “The Economics of Overeducation.” Economics of Education
Review 42: 93–104. doi:10.1016/0272-7757(85)90051-2.Vertovec, S. 2007. “Super-diversity and its Implications”. Ethnic and Racial Studies 30: 1024–1054.
doi:10.1080/01419870701599465.Zimmermann, K. F., M. Kahanec, A. Constant, D. DeVoretz, L. Gataullina, and A. Zaiceva. 2007.
Study on the Social Mobility and Labour Market Integration of Ethnic Minorities. Bonn:Institute for the Study of Labor (IZA).
Journal of Ethnic and Migration Studies 23
Dow
nloa
ded
by [
Uni
vers
ity o
f B
rist
ol]
at 0
4:39
04
Aug
ust 2
014