Modelling the Saving Behavior of Households in Russia
54
Kouzina О. Roshchina Y. MODELLING THE SAVING BEHAVIOR OF HOUSEHOLDS IN RUSSIA EERC Final Report No. 98-041 1. Introduction. The purpose of the study. The saving behavior of households presents a subject matter of our study. It is defined as 1) postponing of current consumption, 2) accumulation of liquid assets in the different forms. The household is the basic unit of the research. Economic situation in 1997 – and the first half of 1998 raised hopes that financial stabilization, slowing down of the permanent fall in production and inflation, and weak downward tendency of incomes' differentiation would produce the basis for the advance of the institutional forms of household financial assets. We hoped it would be possible to stimulate the conversion of household savings into investments. To a considerable extent, this concern about personal saving at that period was caused by the need to estimate the investment potential of households and to encourage savings in institutional forms. While planing the investigation we were going to analyse household portfolio decisions and the impact of different parameters of households on the compositions of their assets. Economic environment had changed after financial and cabinet crisis in August, 1998. In that situation we had to adapt the main task of our research. Sharp drop in exchange rate, jump in consumer prices, depreciation of ruble assets and losses of deposits in commercial banks resulted in a break of public trust in all financial institutions, mass withdrawal of commercial bank deposits and their subsequent cash dollarization. The expert estimations and the data from the post-crisis surveys at the turn of 1998 testified to the removing of financial holdings in a number of forms. The crisis,
Transcript of Modelling the Saving Behavior of Households in Russia
Kouzina О.
Roshchina Y.
MODELLING THE SAVING BEHAVIOR OF HOUSEHOLDS IN RUSSIA
EERC Final Report No. 98-041
1. Introduction. The purpose of the study.
The saving behavior of households presents a subject matter of our study. It is
defined as 1) postponing of current consumption, 2) accumulation of liquid assets in the
different forms. The household is the basic unit of the research.
Economic situation in 1997 – and the first half of 1998 raised hopes that financial
stabilization, slowing down of the permanent fall in production and inflation, and weak
downward tendency of incomes' differentiation would produce the basis for the advance
of the institutional forms of household financial assets. We hoped it would be possible to
stimulate the conversion of household savings into investments. To a considerable extent,
this concern about personal saving at that period was caused by the need to estimate the
investment potential of households and to encourage savings in institutional forms. While
planing the investigation we were going to analyse household portfolio decisions and the
impact of different parameters of households on the compositions of their assets.
Economic environment had changed after financial and cabinet crisis in August,
1998. In that situation we had to adapt the main task of our research. Sharp drop in
exchange rate, jump in consumer prices, depreciation of ruble assets and losses of
deposits in commercial banks resulted in a break of public trust in all financial
institutions, mass withdrawal of commercial bank deposits and their subsequent cash
dollarization. The expert estimations and the data from the post-crisis surveys at the turn
of 1998 testified to the removing of financial holdings in a number of forms. The crisis,
on the one hand, has caused the reduction of the institutionalized forms of assets by way
of removal of money from the deposits and keeping them in cash (dollars and rubles), as
well as purchasing of consumer goods and stores of food. And on the other – it has
resulted in losses and depreciating of ruble assets of households along with the rise of
ruble equivalent of cash dollar's assets. The sharp reduction in personal real incomes has
led to a steady growth of the consumption rate. In that situation people began to use their
financial assets for current needs or to transfer them into reserves of food and staple
commodities. Thus, a reduction of a number of households with any financial assets and
unification of their forms had happened. It had become obvious that there should be a
displacement of accents in the survey that was supposed to be carried out in March 1999.
The analysis of the modification of saving behavior after crisis was considered as its main
purpose.
There were a number of hypotheses about the modification of household saving
behavior: lowering of household real incomes results in decreasing of saving rate, ruble
depreciation, crisis and stagnation on stock market, uneven distribution of cash dollars
assets among households before the crisis contribute to both concentration of financial
assets in a narrow group of households and unification of their forms. On the other hand,
the same factors have an inverse influence as well – minor income shocks and uncertainty
about future incomes result in economizing strategies, lowering of consumption patterns
in the society as a hole and in the reference group (in terms of the relative income theory)
might encourage savings at least of those who managed to maintain their income. There
is also an ambiguous effect of crisis on the portfolio behavior: stimulus for searching for
profitable saving holdings and diversification of households' portfolios which might
decrease the risk of losses may be counteracted by shifting towards low-risk assets.
2. Previous studies of household saving behavior
Economic theory of household saving behavior has not been developed on the eve
of reforms in the early 90th. On one hand, savings were analysed from the point of view
of organising and functioning of saving institutions. On the other hand, the
macroeconomic approach to estimating the amount of compulsory savings predominated.
It is worth mentioning that savings became voluntary only in the late 50th when the
mandatory state loans were abolished. However savings remained partly compulsory
even later as a result of consumer goods' deficits. Households financial assets were
dramatically depreciated during the period of hyperinflation after the price liberalization
in the early 90th. Coupled with sharp drop in the real personal incomes it reduced the
possibilities of households to save, but for the first time agents became really free in their
decisions about incomes' allocation. Simultaneously the problem of mobilization and
subsequent investment usage of household assets emerged.
In the early 90th the stress was laid on the investigations of households saving
behavior at micro level. A number of surveys were conducted in order to estimate the
total assets of households and to model their saving behavior.
One of the first investigations of saving behavior employing all-Russian survey
data (VCIOM) was conducted in the Institute of Economics, Russian Academy of
Science, in 1995. There were two main tasks: to elaborate the procedure of estimation of
the financial potential of households and to work out the policy of converting savings into
investments.
The financial potential was defined as an increase of spare money resources. It
was calculated as money incomes' surplus (total amount of money incomes minus total
amount of money expenditures). The estimations of saving rate on the VCIOM data basis
verified the official Goskomstat data, that in November 1994 households saved 25-26%
of their current incomes. Unusually high level of saving rate for the economy
experiencing economic recession and high inflation was explained by intense
precautionary motives.
Researchers investigate saving abilities of households in different income groups
and came to the conclusion that ability to save increased with the rise of per capita
household income. Households with low level of income had very small amount of spare
financial resources, savings in the families with average incomes were made in order to
postpone their consumption at short date, and only the wealthiest families were able to
invest. But their ability had not been realizing because of the absence of the relevant
financial tools. According to VCIOM data, families with average incomes preferred to
accumulate cash rubles and to deposit in Sberbank, while the wealthiest households kept
accounts with commercial banks. Cash dollars, in spite of their relative depreciation, were
popular in all income groups of households, while bonds, shares and other securities were
regarded to be unattractive among all households as well.
Due to the results of this research, investment potential of households did not
differ considerably all along Russia. Though Moscow, St. Petersburg and a number of big
cities stood out against a background of the rest of Russia for the number of financial
institutions dealing with popular finances, substantial part of financial potential had been
accumulating among inhabitants of small towns and villages where even ordinary
Sberbank was not always accessible.
On the whole, being one of the first economic researches of saving behavior of
households in reforming Russia this paper revealed all the difficulties in this field:
ambiguity in the definition of savings both for the researchers and for the ordinary
people; the puzzle of the unusually high saving rate in the presence of declining living
standards; essential share of savings in cash (dollars and rubles) which amount was
difficult to estimate; objective and subjective obstacles in applying economic theories; the
shortage of empirical data.
At the same time the Institute of the problems of employment Russian Academy
of Science and the Ministry of Labor of Russian Federation conducted the sociological
'Research of the structure of the potential investors in industrial firms and revealing the
encouraging factors in their investment activity' (1994 - 1995). At the end of 1994 and in
spring of 1995 two surveys were carried out. Employees at the industrial firms in five
regions of Russia were questioned within the framework of the research. The structural
analysis of the forms in which people preferred to keep their financial assets and their
motivation were the main tasks of this research. All available forms of holdings were
divided into two groups: investments and non-investments. The later consisted of
deposits in commercial banks, cash dollars and lending money to natural persons at
interest. More than 60 % of employees at the industrial enterprises were concerned about
their savings. Two thirds of them preferred to keep money in Sberbank, one third - to
convert into cash dollars. The main conclusions: investment components of financial
assets of employees of industrial firms declined by 15% during the winter of 1994-1995,
the reduction was more likely for blue-collar workers than for white collar workers. The
main motives, which had influence on the portfolio composition, were profitability of
deposits and confidence in the institutions or persons taking money from households.
During the winter 1994-1995 the importance of confidence raised considerably. The
attractiveness of Sberbank and confidence in commercial banks raised in respondents'
opinions, which was more likely for white-collar workers. Concern about shares of
industrial firms, municipal or regional bonds, investments into financial companies came
to nothing in contrast to cash dollars and informal crediting. The impact of professional
and demographic structures at the enterprises on saving (investment) behavior was found.
The most well-educated blue-collar and white-collar workers were likely to accumulate

cash dollars, to lend money and to invest into shares of profitable enterprises. Uneducated
workers and clerks were interested in the shares of enterprises where they worked.
Deposits in commercial banks seemed to be attractive for the polar groups of employees:
black-coated workers and unskilled workers. As a whole this research showed the
possibilities of structural descriptive analysis of individual saving behavior.
The Institute of social and economic problems of the population RAS conducted
the most large-scale research in the field of household saving behavior in October 1996
which was financed by the Central Bank of Russian Federation. Two types of data were
used to study household saving behavior: all Russian cross-sectional standardized survey
(almost 8000 respondents) data and 70 interviews with the representatives of the
wealthiest group of families in four regions of Russia. Researchers turned their attention
to the puzzle how to explain that in the presence of low incomes, growth of wage,
pension and other social security benefits arrears households managed to save one fifth of
their money incomes (as macro statistics reported). The question of primary concern was
to estimate the total amount of household savings and financial assets and to shed light
upon the main portfolio strategies. The authors came to the conclusion about great
polarization of material well-being of households and concentration of two thirds of
financial assets in 5% of families, that could explain the paradox of combination of low
average incomes with high average saving rate.
Financial assets consisted of deposits in banks, securities and cash, rubles and
dollars. Cash dollars accumulated by small entrepreneurs of 'shuttle trade' for purchases
abroad were excluded. The empirical findings indicated that 21% of all households had
money excess over current expenses and 59% of all households had financial assets. The
typology of savers was constructed using motives and aims of saving. A number of
recommendations were elaborated to convert savings into investments.
In 1997-98 Russian Center of Privatization and the Institute of Europe RAS
realized the project 'Analysis and working out of the guidelines of stimulating of
household savings and encouraging of their converting into investments in the context of
government policy aimed at economic growth'. This research was based on the data of the
fifth (December 1994), sixth (October 1995) and seventh (October 1996) waves of the
Russian Longitude Monitoring Survey (Panel data) to discover the structure of financial
activity of households and to analyze its stability over two years. Because in the database
RLMS there were no information about saving deposits of households, amount and
structure of their financial assets, saving motives, research had to be restricted within the
analysis of saving behavior during the previous 30 days. The notions of positive (saving)
and negative (dissaving) financial behavior were imposed.
Researchers came to the conclusion that during the period of two years the
positive financial behavior had been reduced and the activity within negative type had
been increased. When the households were segregated into groups of active and passive
agents, and among the active part savers, dissavers and combinators were distinguished,
the households which stuck to the same type of financial behavior during all the period of
investigation were not numerous. And the majority of them were in the group of
financially passive households. As a whole financial activity had been reducing. The
researches also estimated correlation between the trends of per capita income in
households and changes in financial behavior, which turned out to be significant.
3. Financial crisis in August 1998 and its influencing on the economy.
One year between two our surveys (February-March 1998, March 1999) because
of the August crisis 1998 has proved to be turning in many respects, and first of all in the
field of household incomes, consumption and savings.
According to the official statistic macro data real household incomes in the first
quarter of 1999 were came to 73 % of their level a year before, and real wage - only to
58.5 %. During the first quarter the average nominal monthly wage exceeded the level of
living standard only by 47.7% (one year before - more than two times), that argued in
favor of the extension of poverty.
The structure of allocation of money incomes had been considerably modified.
According to the data of the official statistics household expenses steadily exceeded 80 %
of the total money incomes of households. The decreasing of the purchasing power of
personal incomes resulted in forced rise of the expenses for food at the expense of
nonfoods and services. These tendencies characterized the behavior of the majority of
households, and it became especially evident in the low-income groups.
The lowering of the purchasing power of household money incomes resulted in
the reduction of the retail trade turnover (by 15.8% in one year). According to the official
data the consumer expenses were reduced by 20 %. However if we take into account the
shift towards cheaper domestic products and the fact that prices for services have been
growing much slowly comparing with consumer lines, real consumption probably had not
changed that much. According to the estimations of experts of the Bureau of Economical
Analysis, the real consumption structure in spring of 1999 did not generally differ from
that one had been formed in 1995: there was a shift from expensive imports to cheaper
domestic products and services which had relatively fallen in price.
Some improving of economic activities during the first quarter of 1999 did not
result in evident changes on the labour market where situation remained tight. At the end
of March 1999 the total number of the unemployed (using the methodology of ILO)
amounted to 10 million people, 13,6 % from the active population, against 8.3 million
people (or 11,4 %) at the end of March 1998. It is 18,7 % increase for one year.
Thus there were several factors of the maintaining consumption at the similar to
pre-crisis level.
First, permanent settlements of the wage, pension, and other arrears compensated
the decline of real wages and incomes of the population.
Secondly, there was a considerable decrease in saving rates. If during a half of a
year before the crisis average saving rate according to official data was equal to 18,5%,
eight months after August 1998, including August - only 8%. For many families it meant
dissaving. The alternate estimation of the share of savings in household incomes (subject
to the net increase of cash dollars on hand) in the post-crisis period was close to zero.
Thirdly, the decreasing of purchasing power of household assets in rubles was
partly compensated by the rising of the ruble valuation of household assets in dollars.
However, only those households which kept their financial assets in cash dollars on the
eve of crisis were able to use this advantage. As a result, resources were redistributed in
favor of pre-crisis cash dollars' holders.
Finally, the informal employment in the market and within the household sectors
created a stream of unregistered money and in-kind incomes.
Let's consider the macroeconomic tendencies during the period of one year
March 1998 - March 1999 and the influence of the crisis on economic activity.
The latter half of 1997 was characterized by high consumer activity of the
population before announced denomination on January 1, 1998. Households were
engaged in the process of active buying of durables, real estate objets, cash dollars trying
to minimize cash rubles, increases of deposits in banks and securities. The favorable
conditions for the rise in institutional forms of savings had been developed after
denomination which had happened to be lossless for all households, in despite of started
slowly reduction in real household incomes. The confidence of the population in the
institution and tools of financial market had increased. The bankers' ruble deposit rate
during the first half of the year 1998 steadily exceeded dynamics of both the exchange
rate and the consumer price index. In the middle of 1998 the retail trade turnover and
purchasing of cash dollars had declined, and increase of depositing in banks and
securities as well as the rise of ruble cash had happened.
However in the middle of 1998 these positive tendencies began to exhaust, on one
hand, because of declining trends of the household real incomes and increasing of wage,
pension and other arrears. On the other hand, in the first half of 1998 the current account
balance and balance of trade were negative and equaled, respectively, -6,0 and -0,3 bln.
dollars. It was the result of unfavorable for Russia world market opportunities and the
increase in payments of interest charges to foreign debtors. Liquid currency reserves were
also reduced. Expectations of the imminent devaluation of ruble were formed during the
summer of 1998 in financial markets.
The crisis in August, 1998 has changed the situation rather sharply. On the 1st of
September, 1998 an official rate of US dollar to Russian ruble was equal to 9,3
rub./dollars, having increased since August, 15 (6,2900 руб./dollars) almost 1,5 times. At
the middle of March 1999 the exchange rate had grown since August 1998 3,5 times.
The index of consumer prices since August 1998 till March 1999 came to 179,2
%. In the first quarter of 1999 the speed of inflation was slackened. So, the index of
consumer prices in January, 1999 came to 108,4 %, in February - 104,1 %, in March -
102,8 %. The annual growth of consumer prices in 1999 appeared to be much less than it
was forecasted in the beginning of the year. In conjunction with stability of exchange rate
it had reduced in some valuation of ruble.
The withdrawing money from bank accounts which started in June, 1998 after
August 17 had become stronger. According to the data of Central Bank in December
1998 the accumulated sum of deposits had decreased by 13 %, the majority of losses fell
on commercial banks (40 % decrease). In Sberbank the reduction of deposits was
significantly smaller. In the early 1999 the lowering of households deposits in banks had
been stopped. The total bank balances grew to increase, but only in Sberbank, the
withdrawing money from bank accounts in commercial banks continued. At the end of
May, 1999 the total sum of money on individual deposits in these banks was no more
than 65 % from the pre-crisis level. In March, 1999 for the first time from the beginning
of the year there was an increase in net cash dollars balance: households bought more
cash dollars than sold. In comparison with previous month's data it was increased in 2,7
times.
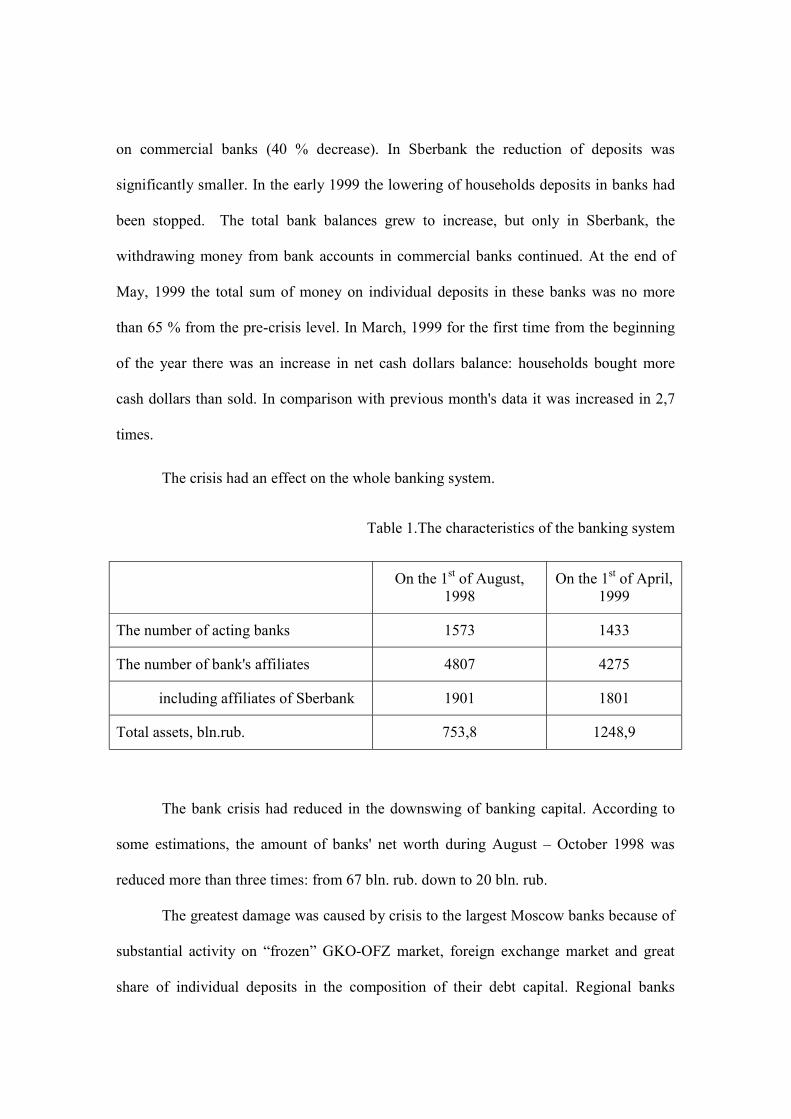
The crisis had an effect on the whole banking system.
Table 1.The characteristics of the banking system
On the 1st of August, 1998
On the 1st of April, 1999
The number of acting banks 1573 1433
The number of bank's affiliates 4807 4275
including affiliates of Sberbank 1901 1801
Total assets, bln.rub. 753,8 1248,9
The bank crisis had reduced in the downswing of banking capital. According to
some estimations, the amount of banks' net worth during August – October 1998 was
reduced more than three times: from 67 bln. rub. down to 20 bln. rub.
The greatest damage was caused by crisis to the largest Moscow banks because of
substantial activity on “frozen” GKO-OFZ market, foreign exchange market and great
share of individual deposits in the composition of their debt capital. Regional banks

experienced similar, but 'benign' problems. Financial crisis had reduced in lowering of
banking capital and rise of the liquidity deficit.
The crisis resulted in the increase of the number of financially unstable banks. The
share of them in the total number of banks had increased from 36 % (1.08.98) up to
42,5% (1.09.98); in the total amount of assets – from 12 % (1.08.98) up to 43,7 %
(1.09.98).
In the early 1999 Russian financial markets stabilized, the lowering of the interest
rates of all financial trading had happened. Profitability of governmental securities
declined from 60- 85 % in July - August 1998 till 16-20 of % in July - August 1999, the
rates of ruble interbank crediting had also declined: from 45-60 of % down to 20 - 12 %.
It is necessary to mark the positive consequences of the crisis in the banking
sphere. The lowering of the share of individual deposits, which will not be possible to
change even if the confidence in banking system would be restored, stimulated the
banking system to credit enterprises, because the assets of enterprises were used by banks
as a security for loans. And the ruble deposits of enterprises began to be restored rather
fast.
That fact that the banking system seemed to be more productive oriented was one
of the consequences of depreciating of the state bonds and revaluation of the currency
credits. The amount of crediting of the economy (basically because of the increase of the
ruble estimation of its currency part, and not because of real activity in this field) was
increased during 1998 from 9.4% up to 11% of GDP. However productive orientation of
banking credit policy increases the credit risk. Taking into account the actual state of the
real sector profitable allocation of financial resources of banks within this sector is still
limited.
The crisis transformed the composition of banking elite and reallocated the
spheres of influence inside it. The differentiation of the owned capitals and profits of
large banks had been increased, as well as the role of Sberbank and influence of regional
authorities.
At present the Russian banking system has no other source of its developing but
the real sector of the economy, which financial position seemed to improve. The
modification of economic environment after August crisis was happening in the presence
of the increase of the demand for domestics in the home market. Reducing of the
inventory materials funds and stocks of finished industrial products accompanied this
process. Displacing barter with money payments interplant was the evidence of the
improving of the financial state of the industrial firms.
According to the official statistics, in 1999 the industrial production leaded all the
economy. In fuel and energy branches the situation had been improved as a result of the
rise in oil world prices. The support to the industry (in tractor and agricultural
engineering) was rendered by the state. The shift of the demand of the population to the
domestics also had positive influence on dynamics of consumer goods industries.
After the crisis there were positive changes in the balance of payments: if in the
first half of 1998 the current transactions in the balance of payments of Russia were
negative — minus 5,6 bln. doll., one year later it became positive - almost 13 bln.doll.
The foreign trade turnover in the first half of 1999 was 52 bln.doll. (the reduction by 28
%). The cost of export had declined by 13 %, import - by 44 %.
Thus, if to characterize the main consequences of the crisis for the economy as a
whole at the end of 1998 - first quarter 1999, it is necessary to mark that in spite of the
fact that the devaluation had happened in the very morbid and trying form, it had rather
positive influence. The improving of the balance of payments, stabilization of ruble,
improving in banking sphere and the recovery of industry in the aggregate created the
necessary prerequisites for economic growth, increasing of households' incomes and
savings.
4. The model specification.
In economic theory, the analysis of saving behavior, and especially its dynamic, is
based on the saving function modeling. We consider the pattern of savings in
contemporary Russia seems to be consistent with Friedman's Permanent income
hypothesis with the assumption that there is uncertainty about future incomes. The PIH
model assumes that consumption (saving) of households is determined by its permanent
income. Friedman assumes that the utility function of household is symmetrical and
homogeneous in all time periods. Permanent income is the discounted expected flow of
income from human and non-human wealth. In that case the households in long-term
period consume the permanent part of their permanent income, keeping their wealth
invariable. In short-run perspective people smooth out fluctuations in income by saving in
the periods of unusually high incomes and dissaving when they are low. The life-cycle
hypothesis in our opinion is less applicable, because in the presence of very low level of
current money incomes households are not able to accumulate resources for the
retirement, all the more in the absence of working financial institutions of that kind.
Well-known Friedman's hypothesis assumes that people base consumption on
what they consider as 'normal' income, which they expect to earn over considerable
period of time. This 'normal' income will normally differ from their current, measured
income. The difference between these two incomes is transitory income. So in the
simplest model of PIH we have
C = k Yp, k = F (i, w, x),
where C – consumption, Yp – household permanent income in the period t, i –
discount rate, w – proportion of nonhuman wealth to other types of wealth, x – other
parameters (age, tastes and the like). Friedman made time-series test of his hypothesis
based on the annual data for the period 1905-1951, excluding war years. He constructed
the variable of permanent income by a weighted average of past values of disposable
income, assuming that the weights assigned to the disposable income are smaller for
more distant incomes than recent incomes.
Unfortunately, we do not have the time-series panel data about incomes and
consumption of households, so we are not able to construct the similar independent
variable, or to include incomes or consumption in the previous periods to obtain
unbiased regression estimations. We do not have data about gross value of liquid wealth
of households (summer house, car), so we will use dummy variables for estimation of
households' wealth.
Estimating equation looks like:
Ci = a0 + a1 Yi + a2 Ai +Σ aj Wij + Σ ak Xik + εi
where for i household: Ci - consumption, а Yi – annual income, Ai – sum of
assets (deposits and cash) in the beginning of the period, Wij – other liquid wealth
variables, Xik – a set of individual and household characteristics (age, a number of
children and the like), εi - random error.
For the analysis of the portfolio behavior we use the model with binary dependent
variable (logit). We test the effect of some household’s characteristics (income, wealth,
family structure) on the presence/absence of any financial assets. Then we use the same
set of variable to test their effect on the each form of assets. The general model takes the
form:

Aij = ΣkakiHHkj + ΣmbmiFAMmj + ΣlcliINCOMEj + ΣndniWEALTHnj +
ΣpfpiEXPENpj + eij
Where Aij is a binary variable equal to 1 if the household j have the asset i and
otherwise equal to zero; HHkj is the set of k personal characteristics of household’s head
as gender, education, marital status, etc., FAMmj is the set of m characteristics of the
household as number of member, children, etc., INCOMEj is the household’s income per
capita, WEALTHnj is the set of n characteristics of the household’s wealth, as owned
apartment, car, etc., EXPENpj is the set of p characteristics of the household’s
consumption, expenditure and finance, as borrowing, buying, etc., eij is a random error.
5. The data sources of the research: 1998, 1999 samples.
Economic family, that is people living together and sharing joint budget of
incomes and expenditures, is the object of our research. The research is focused on the
latter half of the 90s. The using of the data from the other surveys (VCIOM, RLMS) for
the studying of portfolio and saving behavior is limited because of the lack of information
(unavailability of a number of variables and the insufficient questioning period). That is
why our research is founded on the data set of two our own surveys carried out in four
Russian towns which are representing different types of regions in the European part of
Russia. The 1998 survey was financed by Ford foundation within the framework of the
research of survival strategies of Russian households in February - March 1998 in
Moscow, Nizhni Novgorod and Ivanovo. The same three cities (plus Syktyvkar, Republic
of Komi) were surveyed in March 1999. This survey was designed within the framework
of present research. 250 families were surveyed in each city. The sampling and
interviewing was conducted by the Center of sociological researches at Moscow State
University. The routing sample was designed as a random selection of 10-20 routes
(points, streets) uniformly located on a spiral from the center of a city. A house was
randomly selected in each point (taking into account the number of storeys in it), and in a
house each n-numbered apartment was picked up.
We want to emphasise that we do not have a panel, there are two different
samples.
Urban population has been picked out for our research because of its main saving
potential, as well as because of the tight project budget and survey's limits. There was no
aim to realize all-Russian representative sampling, but to present different types of
regions of the European part of Russia and to have comparability with our previous data
(the survey in 1998), that is to have basis for estimating of the process in dynamic.
There is no doubt that Moscow represents unique for Russia region, with the
highest per capita income and income differentiation, the most advanced financial
infrastructure and the greatest saving activity of the population. Nizhniy Novgorod
represents not metropolitan financial center with close to average level of social and
economic parameters. The republic of Komi is a resource-rich region with rather stable
social and economic position, significant share of raw branches and high per capita
income, and Ivanovo is an example of depressed regions with the lowest income and
great share of poor households.
Survey data 1998. In February-March 1998 the survey was carried out in three
cities: Moscow, Ivanovo and Nizhni Novgorod. About 750 families (approximately on
250 in each city) were questioned on random route sampling in total. The data about
more than 2000 persons were obtained taking into account all members of households.
Though a variety of different types of families was represented, our sample was slightly
biased comparing with Goskomstat data. The proportion of able-boded and highly
educated persons was higher in all cities. In Moscow we had the lower share of the
households with children and extended families, and in Nizshni Novgorod – the higher
one. Because the type of the family correlated with the level of incomes and
expenditures, we considered incomes in Moscow and Ivanovo to be overestimated and in
Nizshni Novgorod – to be underestimated. It can also affect on the comparison with
1998.
The questionnaire in 1998 is smaller than in the survey 1999, so not all the
comparisons are possible.
Survey data 1999. The survey was carried out in March 1999 and it was
conducted in four cities: Moscow, Ivanovo, Nizhni Novgorod and Syktyvkar. More than
1060 families (approximately on 250 in each city) were questioned on random route
sampling in total. The data about more than 2846 persons were obtained taking into
account all members of households. We can say that the main demographic
characteristics of the sample were closer to those of general population than in the survey
in 1998. The structure of families practically did not deviate from the real one taking into
account the number of people in the family, but the proportion of families with 3 children
were overstated in Moscow, and understated in Ivanovo and Nizhni Novgorod. It can
caused the underestimation of income in Moscow, and also affect on the comparison with
1998, when we had the reverse bias. As well as in 1998 the proportion of able-bodied and
higher-educated citizens was overstated.
The average values of all main socio-demographic variables of the surveys 1998,
1999 are represented in Appendix 1,2.
6. The empirical results: incomes, consumption, savings, wealth, assets of households.
Incomes and expenditures of households. According to our data, the monthly
average per capita income for in January 1999 - March 1999 in Moscow was 1362 rub.
(in the year 1998 in terms of 1999 with regional deflator - 2535 rub.), in Ivanovo - 581
(1300 rub. in the year 1998), in Nizhni Novgorod - 690 (1250 rub. in the year 1998), in
Syktyvkarе - 950 rub1. If to compare these outcomes to those in the year 1998 we can say
that real incomes in all three regions have been reduced approximately more than 2 times,
and there was a fall even in nominal terms in Ivanovo.
According to data of State Committee of Statistics per capita nominal money
incomes in March 1999 were equal to 4965,1 rub. in Moscow, 721,7 rub. - in Ivanovo
region, 862,4 rub. - in Nizhniy Novgorod region, 1707,3 rub.- in republic of Komi, cost
of living: 1166 rub. – in Moscow, 746 rub. – in Ivanovo, 707 rub. in Nizhni Novgorod,
868 rub. – in Komi. It is obvious that our data differ from the official statistics, though in
Ivanovo and Nizhni Novgorod this lack of correspondence does not exceed the usual
discrepancy between the data of surveys and official statistics (about 20 %). The
differences for Syktyvkar and Moscow are bigger, that can be explained by usual for such
surveys lack of very wealthy households (the wealth differentiation in these regions is
higher), refusals to give answers about income and underestimating of income by
respondents. In Moscow it might be a result of overstating of households with 3 children
and low income, and the higher proportion of those who had refused to give any
information about their income.
A typology of material well being of families had been applied in analyzing of the
variation in their saving behaviour. We divided the sample into 4 conditional groups
using the criterion of income – to – cost of living ratio in every region. In 1998, the level
of incomes equal to one regional minimum of subsistence (RMS) was used to define a
1 1 dollar in March 1999 was equal to 24,18 rubles.
poverty line, the level of incomes of needy families for was defined from 1 up to 2 RMS,
independent families with medium incomes - from 2 up to 4 RMS, rich households -
more than 4 RMS. In 1999, we have to adjust the poverty line 2 times downwards
because of a profound change in income and minimum of subsistence parity in Russia
(see The table 2).
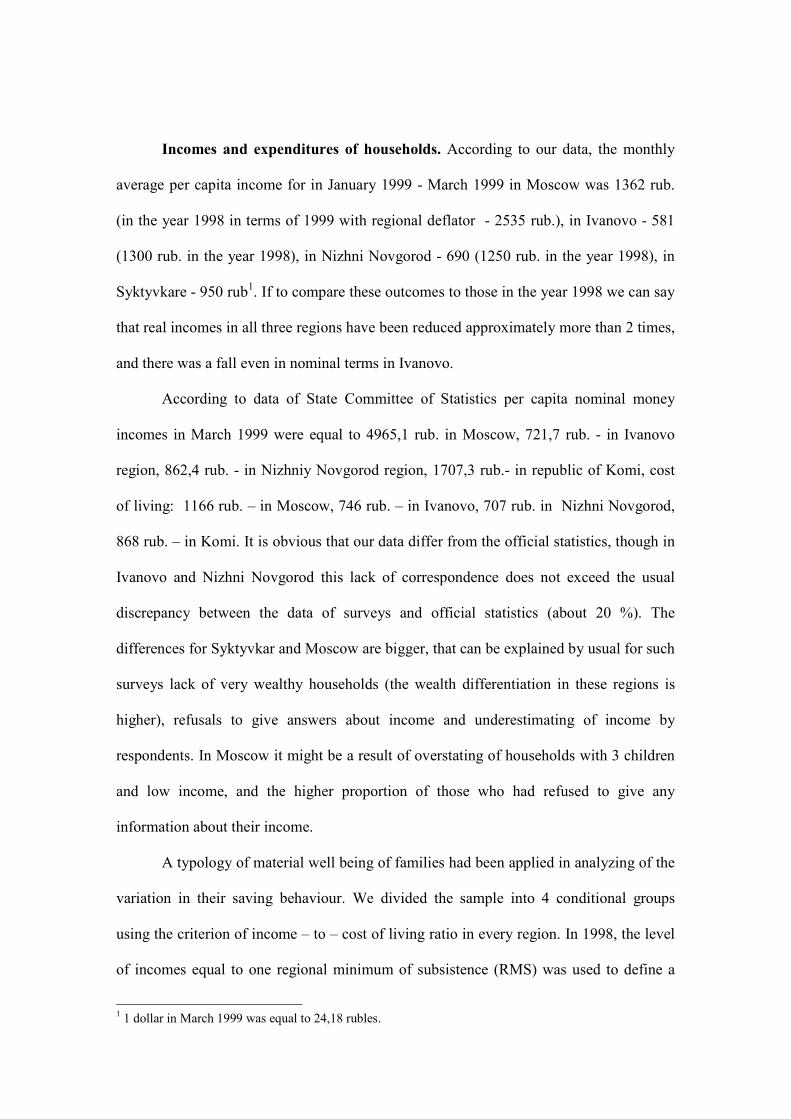
Table 2. Proportion of the families with a ratio of the per capita income to the regional minimum of subsistence in 1998 and 1999 samplings
Moscow
Ivanovo N.Novgorod Syktyvkar Total
March 1998 Less than 1 RMS 24,6% 17,9% 29,3% 24,2% 1-2 RMS 44,5% 47,9% 46,2% 46,2% 2-4 RMS 21,2% 26,1% 18,4% 21,7% More than 4 RMS 9,7% 8,1% 6,0% 7,9%
Surv
ey d
ata
Total 100,0% 100,0% 100,0% 100,0%
RMS, rub. 552 296 312 Per capita income, rub. 2878 522 617
GK
S da
ta
Per capita income/ RMS 5,21 1,76 1,97
March 1999 Less than 1 RMS 71,5% 82,9% 76,7% 62,9% 73,8% 1-2 RMS 16,7% 13,5% 18,9% 25,3% 18,5% 2-4 RMS 8,1% 2,4% 2,4% 10,0% 5,6% More than 4 RMS 3,6% 1,2% 2,0% 1,7% 2,1%
Surv
ey d
ata
Total 100,0% 100,0% 100,0% 100,0% 100,0%
RMS, rub. 1166 746 707 868 Per capita income, rub. 4965 721 862 1707
GK
S da
ta
Per capita income/ RMS 4,25 0,97 1,22 1,97
Changing the criteria means that, for example, the needy families in 1998 had per
capita income within the limits of 1 to 2 RMS, and in 1999 - within 0,5 to 1 RMS. As a
result of this change we have got the similar to 1998 structure of groups of families.
Nevertheless, we see the changes in regions: the growth of income differentiation in
Moscow and "disappearance" of the supplied stratums in Ivanovo and Nizhni Novgorod.
An analysis of demographic structure of these groups of families gave us the main

“risk factors” which raises likelihood of a family to be poor or needy:
• Families with a plenty of children and dependents and families with several
generations.
• Not full families, especially mother lone families.
• Families of pensioners or unemployed.
• Families of people without higher education and at an advanced age.
The structure of sources of incomes has not changed a lot during the last year, but
we see changes within the groups. Though both in 1998, and in 1999 the proportion of
social transfers received by the families declines along with the growth of income
(approximately from 40% up to 5 %) and the share of wages and incomes from
entrepreneurial activities and self-employment grows, but the proportion of the latter
sources has been essentially reduced. The proportion of income from entrepreneurial
activities in the group of the rich households reduced from 18% down to 9% and for self
employment income - from 16% down to 6% at expense of wage share rising. In other
groups the proportion of those incomes (not more than 3-4 %) remained invariable.
Though it may be partly the result of changes in the structure of sampling.
Table 3. Composition of income groups in 1998 and 1999.
Moscow
Ivanovo N.Novgorod
Syktyvkar Total
'The poor' 24,6 17,9 29,3 24,2 'The needy' 44,5 47,9 46,2 46,2 'The independent' 21,2 26,1 18,4 21,7 'The rich' 9,7 8,1 6,0 7,9 19
98
Total 100,0 100,0 100,0 100,0 'The poor' 32,6 28,3 27,3 24,9 28,2 'The needy' 38,9 54,6 49,4 38,0 45,6 'The independent' 16,7 13,5 18,9 25,3 18,5 'The rich' 11,8 3,6 4,4 11,8 7,7 19
99
Total 100,0 100,0 100,0 100,0 100,0
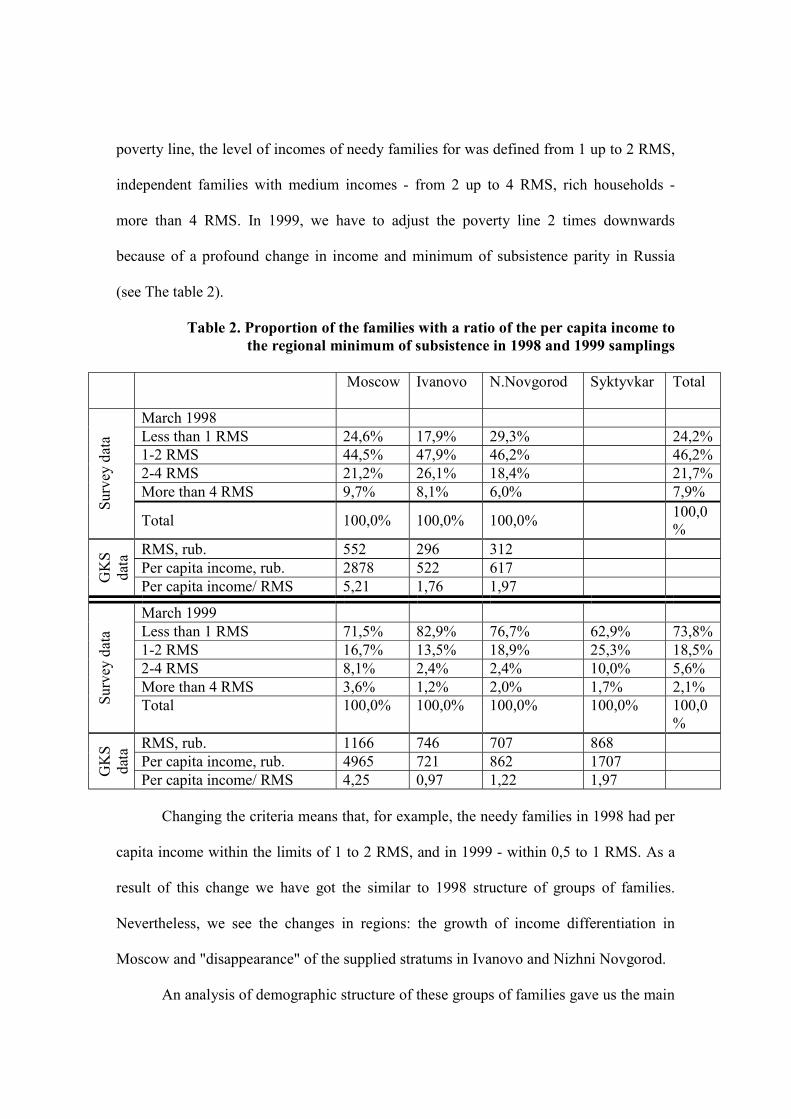
The structure of expenditures has not change much (incomes +/– savings) both on
average and within the groups. The structure of expenditures in poor and rich families
differs essentially. Purchases of food give more than three quarters of total expenditures
in the poor families, including all other current expenses makes 93 %; rich households
spend for purchases of the durables 7-8 % of their income, for real estate – 8-10 %, for
other heavy purchases – 12-13%.
The most essential modification has happened in the particular sphere of
household savings. In 1998, there were more households that had been saving than
dissaving during the previous year in all income groups. For example, more than a half of
rich families had increased their financial assets and only 6% of them – decreased, the
amount of money saved was 12 times greater than the shortfall of savings. In 1999 there
was the reverse tendency.
Table 4. The proportion of households had been saving or dissaving during the year (balance of income and expenditures) within the income
groups. The proportion within the
group
savers dissavers
The ratio of the total amount of money saved to the amount of money dissaved
during the year 'The poor' 13,7 8,0 7,9 'The needy' 19,0 8,0 2,0 'The independent'
28,8 12,8 2,0
'The rich' 55,8 5,8 12,0
1998
Total 23,3 7,1 4,1 'The poor' 7,8 22,4 0,4 'The needy' 18,0 34,8 0,2 'The independent'
27,3 40,4 0,4
'The rich' 39,0 37,3 0,4
1999
Total 18,7 35,2 0,3
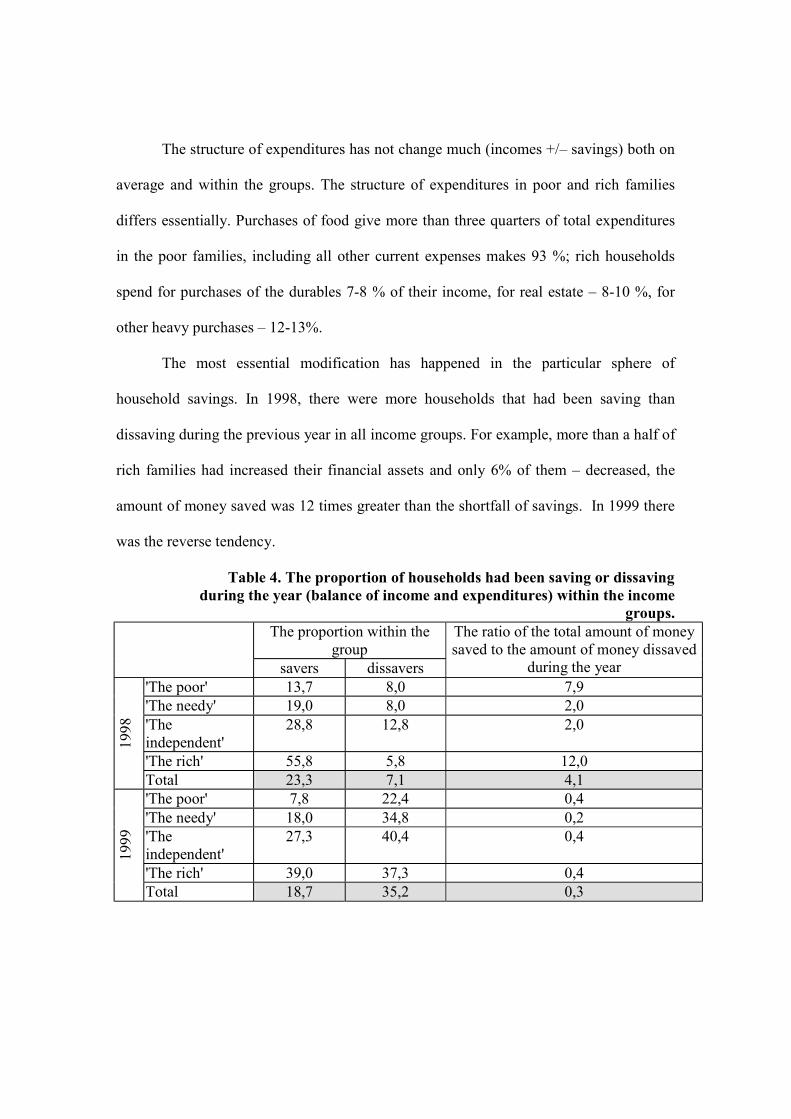
Situation in the beginning of 1998 was really favourable to hope for positive
dynamics in saving behavior. According to the data of our surveys, during 1997 7,4 % of
families regularly put aside money and 21,2 % of them did it occasionally, from the
beginning of 1998 up to August crisis - 14,4 and 33,9 % accordingly. Crisis in August has
reduced these indicators almost 2 times.
Consumption function estimation. According to our data, in the early year 1999
in comparison with a year before households started to smooth out their consumption by
dissaving in the presence of the negative income shock. This behavior is consistent with
the main prediction of the Permanent Income Hypothesis for the short-time period about
the smoothing of the consumption function.
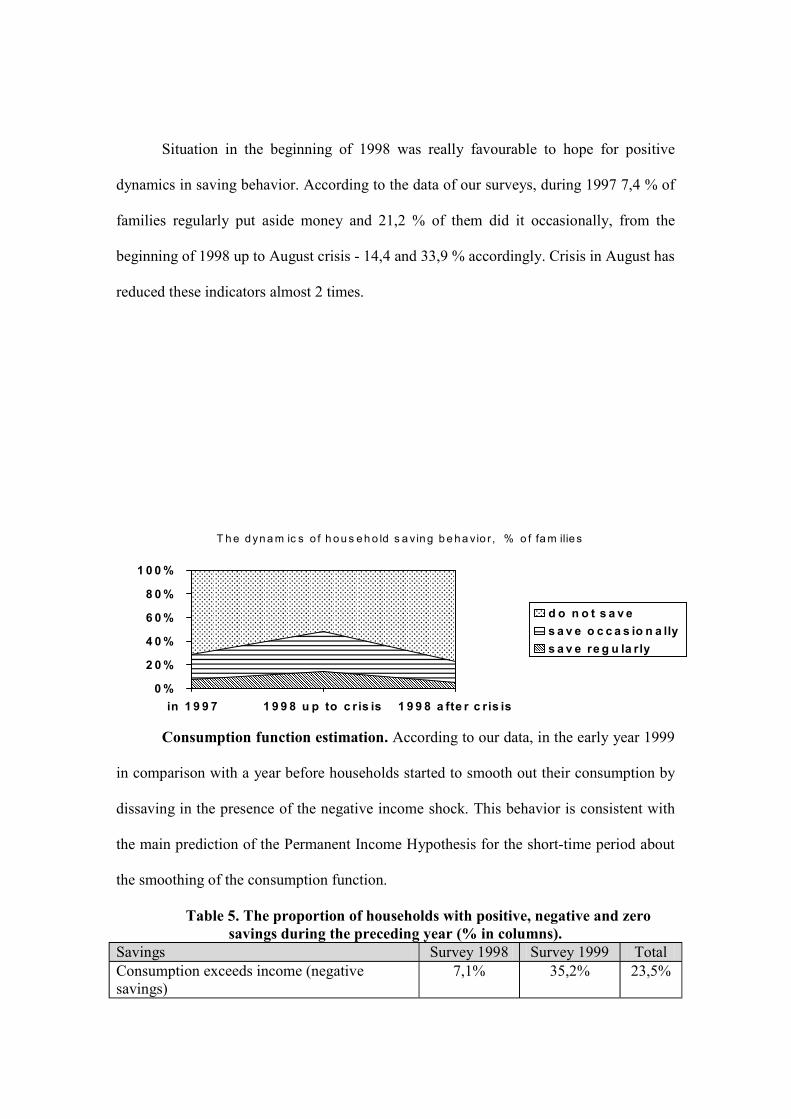
Table 5. The proportion of households with positive, negative and zero savings during the preceding year (% in columns).
Savings Survey 1998 Survey 1999 Total Consumption exceeds income (negative savings)
7,1% 35,2% 23,5%
������������������������������������������������������������������������������������������������������������������������������������������������������������������������������������������������������������������
������������������������������������������������������������������������������������������������������������������������������������������������������������������������������������������������������������������������������������������������������������������������������������������������������������������������������������������������������������������������������������������������������������������������������������
���������������������������������������������������������������������������������������������������������������������������������������������������������������������������������������������������������������������������������������������������������������������������������������������������������������������������������������������������������������������������������������������������������������������������������������������������������������������������������������������������������������������������������������������������������������������������������������������������������������������������������������������������������������������������������������������������������������������������������������������������������������
T h e d yn a m ic s o f h o u s e h o ld s a v in g b e h a vio r , % o f fa m ilie s
0 %
2 0 %
4 0 %
6 0 %
8 0 %
1 0 0 %
in 1 9 9 7 1 9 9 8 u p to c r is is 1 9 9 8 a fte r c ris is
�������� d o n o t s a v e�������� s a v e o c c a s io n a lly����
s a v e re g u la rly
Consumption exceeds income (zero savings)
69,6% 46,1% 55,9%
Income exceeds consumption (positive savings)
23,3% 18,7% 20,6%
As it could be seen from the Table 5, almost 70% in 1998 and 50% in 1999 of
households had been living within their means. Reports about dissaving increased from
7,1% of households in 1998 up to 35,2% - in 1999. Only 18,7% of families had managed
to save in 1999 in contrast to 23,3% - in 1998.
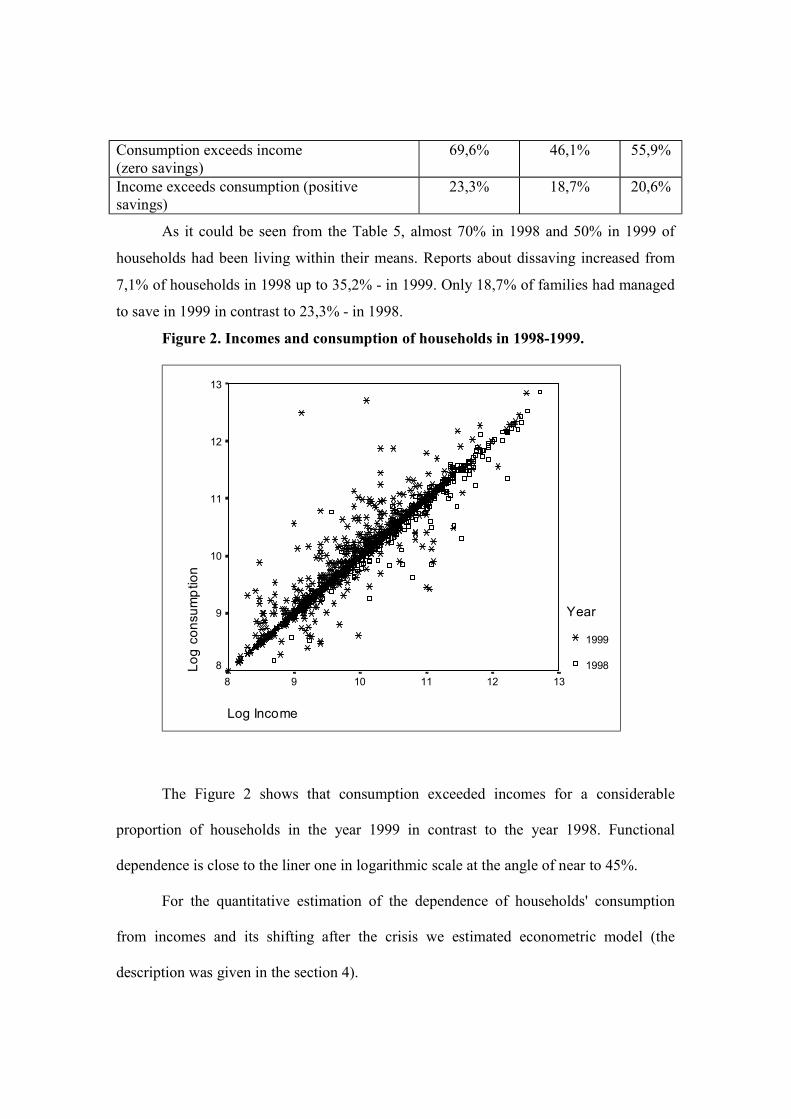
Figure 2. Incomes and consumption of households in 1998-1999.
Log Income
1312111098
Lo
g c
on
sum
ptio
n
13
12
11
10
9
8
Year
1999
1998
The Figure 2 shows that consumption exceeded incomes for a considerable
proportion of households in the year 1999 in contrast to the year 1998. Functional
dependence is close to the liner one in logarithmic scale at the angle of near to 45%.
For the quantitative estimation of the dependence of households' consumption
from incomes and its shifting after the crisis we estimated econometric model (the
description was given in the section 4).
The main variables of the model (the average values are presented in Appendix 3).
Financial variables of incomes and consumption:
• Total sum of family income (log) – the sum of all incomes of all family
members had been obtained from all income sources during the preceding year
in rubles and dollars, dollars were evaluated in rubles at the average rate. For
the year 1998 all the financial variables (incomes, consumption, savings) were
recalculated subject to regional deflators.
• The total sums of financial assets of a family at the first of the preceding year
(log) – the sum of household's money assets in deposits (Sberbank,
commercial banks) and in cash (rubles and dollars). Dollars were evaluated in
rubles at the official rate in March 1999.
• Annual consumption of a family (log) was calculated as a difference between
total sum of annual incomes and total annual savings. Total annual savings
were calculated as a difference between the total sum of assets at the first and
at the end of the preceding year.
Wealth variables:
• Living space of the apartments per person
• If a summer house is available
• If a garden plot is available
• If a car is available
Socio-demographic variables:
• The number of members in a family sharing the common budget
• The number of children under 16 years
• The number of employed members in a family
• The gender of the bread-winner of a family (a person whose income
constitutes the biggest proportion in the total family income)
• The age of the bread-winner /10, age/10 squared
• If the bread-winner has high education.
Consumption function estimation defines the contribution of every factor to the
increase of family consumption; the empirical results of the regression analysis are
presented in the following table.
Table 6. Consumption function estimation. Dependent variable - logarithm of households' annual consumption.
Surveys 1998,1999
Survey 1998 Survey 1999
(Constant) ,583 *** (4,728)
,209 * (1,806)
,874 *** (4,609)
logarithm of household's annual income ,935 *** (77,471)
,977 *** (92,402)
,893 *** (47,487)
logarithm of household's financial assets at the first of the year
,018 *** (11,289)
-,003 ** (-2,223)
,034 *** (13,746)
Living space of the apartments per person
-,001 (-1,393)
,000 (-,504)
-,001 (-,853)
If a summer house is available (yes=1) -,006 (-,403)
-,017 (-1,311)
-,010 (-,405)
If a garden plot is available (yes=1) ,007 (,450)
,002 (,156)
,009 (,387)
If a car is available (yes=1) ,035 ** (2,022)
-,022 (-1,417)
,067 ** (2,507)
The number of members in a family sharing the common budget
,017 * (1,669)
,011 (1,239)
,028 * (1,868)
The number of children under 16 years
-,007 (-,534)
,010 (,795)
-,029 (-1,418)
The number of employed members in a family
-,018 * (-1,711)
,006 (,605)
-,040 ** (-2,555)
The gender of the bread-winner of a family (male =1)
,011 (,810)
,009 (,722)
,030 (1,366)
The age of the bread-winner /10 ,039 (1,483)
-,016 (-,696)
,066 (1,613)
The age of the bread-winner /10 squared -,006 ** (-2,206)
,002 (,796)
-,010 ** (-2,418)
If the bread-winner has high education (yes=1)
-,004 (-,288)
,005 (,384)
-,013 (-,605)
Moscow (yes=1) -,006 -,009 ,040
(-,341) (-,567) (1,328) N.Novgorod (yes=1) -,011
(-,661) ,009
(,663) -,003
(-,096) Syktyvkar (yes=1) -,008
(-,353) - ,013
(,471) Year of 1998 (yes=1) -,024
(-1,401) - -
F 1114,589 *** 1393,68 *** 445,28 *** R2
adj 0,924 0,969 0,891 The number of families 1530 659 856
*** - statistically significant at the 0,001 level, ** - statistically significant at the 0,05 level, * - statistically significant at the 0,1 level.
According to estimation, we see that the consumption function has been changed.
The changes are more vivid when the estimations were made for each year separately,
because the curve has become steeper, but has not been shifted in parallel.
Figure 2 gives a scatter plot of annual households' consumption and income where
we see that the curve became steeper (because of consumption on balance). Empirical
estimation of the consumption function without including of the variable of total sum of
assets at the first of the year confirms the visual observations. Including this variable into
equation shows that in the year 1998 income was practically the only determinant of
consumption, coefficient was close to 1. The contribution of the amount of assets was not
big, and the rest of factors (socio-demographic) had no influence on consumption. At the
same time in the year 1999 the impact of income on consumption had reduced (the
coefficient and the slope of the curve declined). The influence of accumulated assets on
consumption significantly increased, they substituted the reduced income in order to keep
household consumption as invariable as possible, and in addition the family
characteristics started to be influential.
It means that the reduced post-crisis level of incomes was not considered to be
'normal', income losses were seen as negative transitory income which entailed the
process of dissaving.

The main types of assets and wealth of households. In the theory, the
propensity to save is closely connected to accumulated assets, or wealth of the family,
however this relationship is ambiguous. As a rule, the material well being usually is
related to the level of income. It is possible to assume, that rich families having a high
level of income, large apartments, cars, country-houses etc. are more likely to put spare
cash in financial forms of savings; on the other hand, the desire to improve living
conditions might result in accumulation of sizeable assets and vice versa in the case of
recent purchase of an apartment the household might even tick. At the same time, even
bad housing conditions can not stimulate poor families to save, as they do not have
possibility to accumulate for that improving.
In the group of rich families (in 1999) owning of the dwellings was more popular
– only 25% of rich families lived in non-privatized apartments, whereas in the other
groups - about a half. Though the major part of apartments was passed to households via
free of charge privatization (50 %). The sizable portion of the rich families (6,8 %) rented
their apartments. Therewith 17,5 % of independent and rich families (in contrast to 8,5 %
of the needy) had the second dwelling.
Approximately a quarter of families in each group had a plot, from 23% (among
'the poor') up to 40% (among 'the independent') had a country house. During 1993-1999
less than 7% of families had purchased a flat, less than 8 % - summerhouse, 12,4 % - a
car, the majority of these kinds of purchases (from 2/3 to ¾) had been done before 1998.
The differences among the groups were not very big in the case of housing conditions,
they are much bigger if cars had been taken into account. Only 13,6% poor families had a
car, and 0,5 % had bought it during last year, 4,5 % did it in 1992-96 years, and the other
had bought their cars even earlier. In contrast to them 52,1 % of the rich families had a
car, and 42,4 % had bought it after 1992. As to durables, needy and rich families differed
very little in possession of a standard set of household appliances (TV set, refrigerator,
washing machine) and essentially in possession and buying videotape recorders,
microwaves, dishwashers, computers. The crisis resulted in the reduction of buying of
furniture, household appliances, and expenses for redecorating flats and construction. The
proportion of families, which were engaged in those kinds of activities, had reduced half
to the level at the beginning of the year 1998.
In the year 1998, approximately each fifth family (19,6%) had an insurance policy
(among the rich - 34,5 %, and two thirds of them – several policies of different kind). In
1999, 17% of families had an insurance policy (among the rich – 24,7%). In 1999, rich
households had property insurance policies 2,5 times more often than poor (4 times - in
1998), and additional medical insurance – 6 times (11 times – in 1998). For poor families
there was a tendency to insure their lives (the fact that has appeared only in 1999) and
against accidents.
Relatively considerable amount of families had shares and securities (15,4 % in
1998, 16,9% - in 1999), but only half of families considered that those securities could
be sold, and a little less - could estimate their price. The overwhelming majority of
securities' holders had the shares of the enterprises where they worked, especially among
the needy families (69, 4% (81 % - in 1998) among poor households and 50% (38,5 % -
in 1998) among rich families). Rich families had shares of various financial companies
and funds - 30% among all holders of securities. By the share holders' estimations, the
shares of the enterprises were most liquid (about 60 % of their owners considered that
they were able to sell them), but this assurance might be unrealistic, as the significant part
of such families, especially needy, had no experience of operations on a capital market. It
is also confirmed by significant share of those who did not know, whether their assets
were liquid (mostly among the poor and the needy). The highest share of those who
supposed that their securities could be sold (though with some difficulties) was among
the rich families (70%).
In March 1999, 42,5 % of families had financial assets in institutional form
(except for the securities of different kind and debts). Ruble deposits in Sberbank, cash
rubles and cash dollars were the most popular forms of all financial assets. Such forms as
ruble deposits in commercial banks, dollar deposits in Sberbank and in commercial banks
were used considerably less often. It is noteworthy that there was the difference in
estimations of the situation in March 1998 in two surveys, especially about deposits in
Sberbank and cash currency. They might be explained in different ways: statistically
(sampling effect) and psychologically (retrospective effect).
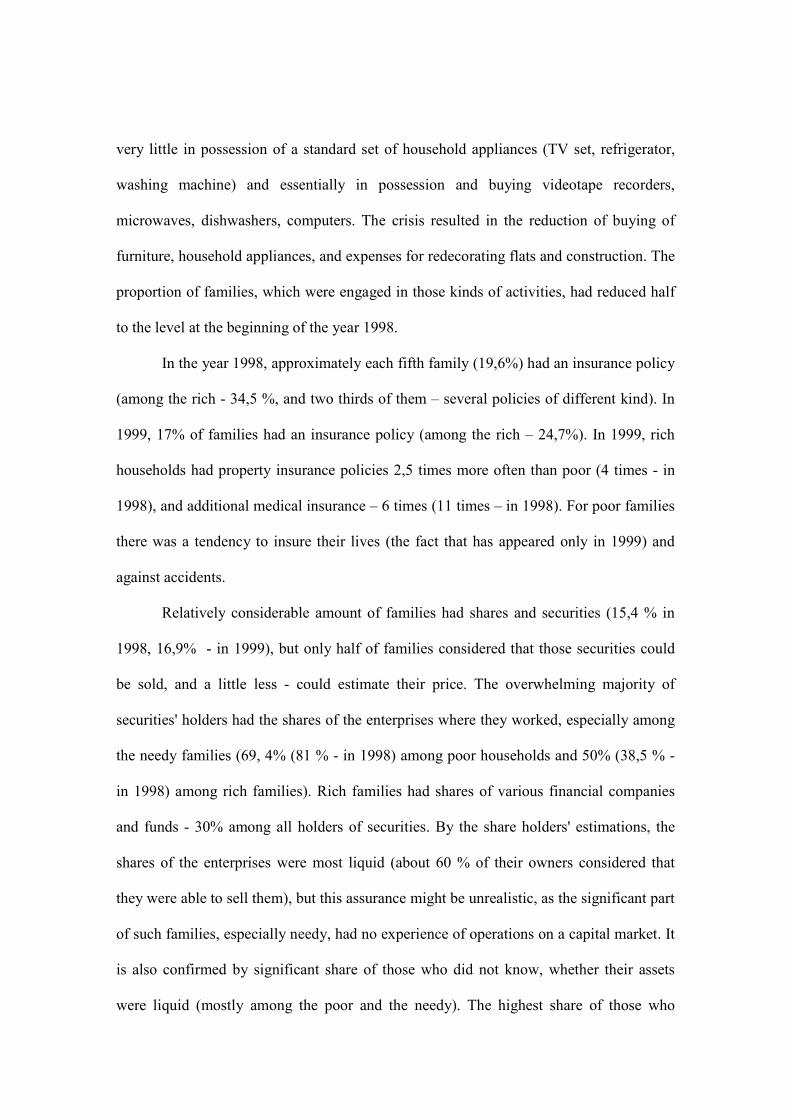
The table 7. The proportion of households with the particular type of assets (%)
1999
1998
Right now Before the crisis in August
A year ago Right now
March 99 August 98 March 98 March 98 1 Cash rubles 40,9 58,4 60,3 41,9
2 Cash dollars 22,4 24,7 24,0 18,9
3 Ruble deposits in Sberbank 44,6 46,0 45,3 72,7
4 Dollar deposits in Sberbank 1,8 1,8 1,2 4,3
5 Ruble deposits in commercial
bank
4,7 7,0 7,1 5,9
6 Dollar deposits in commercial
bank
1,9 2,2 2,1 1,6
7 Securities of different kind 20,9 20,6 20,7 _
8 Rubles lent 26,9 12,9 11,7 _
9 Dollars lent 7,0 3,5 2,2 _
No assets from the list 1-6 57,5 48,9 45,7 56,3
According to the data the total amount of assets has been reduced: cash rubles –
three times less, cash dollars – two times less, deposits in Sberbank – one and a half times
less. We see evident dissaving activity.
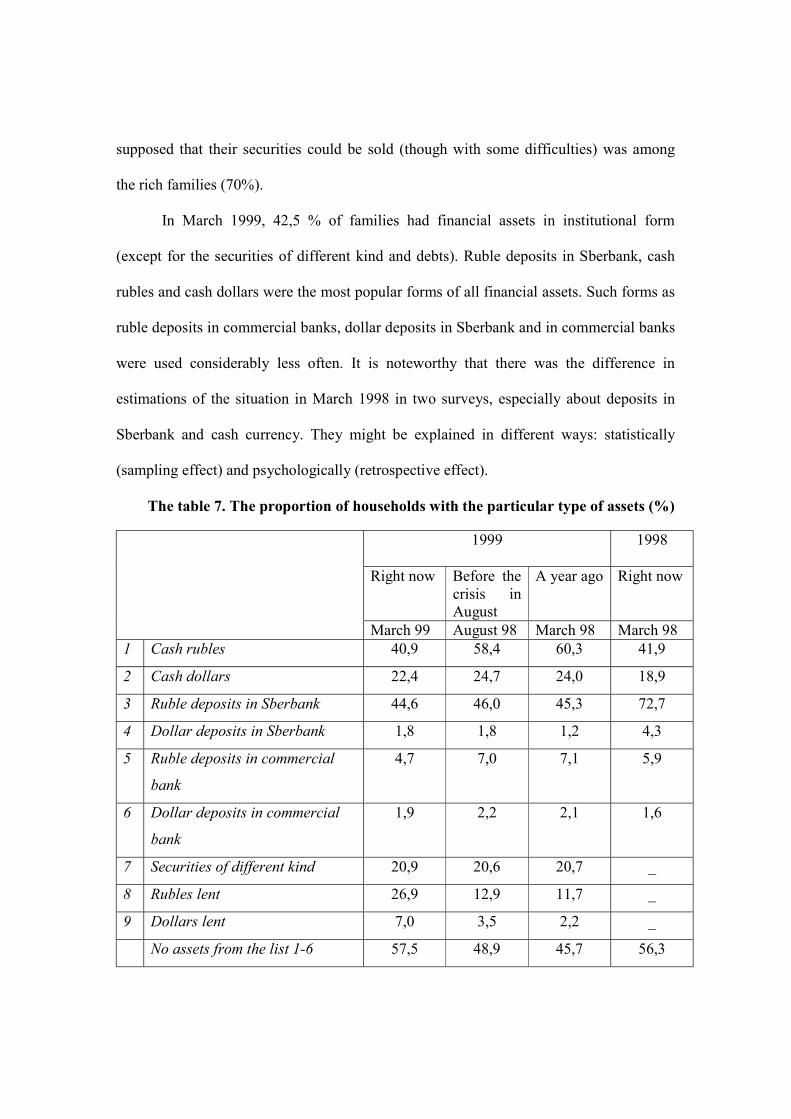
Table 8. The total sum of money in different types of assets, survey data 1999
Survey 1999
Right now Before the crisis in August
A year ago
March 99 August 98 March 98 1 Rubles in cash 571 890 1 079 380 1 577 552
2 Dollars in cash 80 303 185 427 198 117
3 Ruble deposits in Sberbank 648 324 825 611 946 671
4 Dollar deposits in Sberbank 7 050 17 640 6 150
5 Ruble deposits in comm. banks 94 254 142 050 140 102
6 Dollar deposits in comm. banks 7 900 15 500 14 000
7 Securities of different kind 157 037 274 372 361 607
8 Rubles lent 326 425 201 150 108 460
9 Dollars lent 36 435 27 200 29 800
The number of families =950
As far as shares in financial funds and financial credit instruments are concerned,
people frequently were not able to give pecuniary estimation to these assets. They even
did not know whether they could get back any sum of money. The same situation was for
the sums of money that had been landed by a family to someone else. As a result, people
did not consider these assets as their real financial assets. Landing money to physical
bodies had no interest motives, rather the act of good will and help. So sometimes we will
exclude these assets when analyzing household portfolio behavior.
The dynamics of assets composition of the families in different income
groups. The diversification of the household portfolio of financial assets is not a very
popular strategy for households in Russia: 42,5 % of households which had any asset,
including 26,2 % - who invested into one type of asset, 12,6 % - in two, 3,4 % - in three,
0,3 % - in four (out of possible 6 kinds). And the diversity of the forms of assets could be
found only in the group of rich families that mostly lived in Moscow. The asset
composition was changing along with increasing of household's income – the cash rubles
and dollars and deposits in commercial banks were rising and deposits in Sberbank were
reducing.
Table 9. The proportion of households in each income group with the particular type of assets (%)
����������������������������������������������������������������������������������������������������������������
������������������������������������������������������������������������������������������������������������������
������������������������������������������������������������������������������������������������������
���������������������������������������������������������������������������������������������������������
������������������������������������������������������
����������������������������������������������������������������������
���������������������������������������������������������������
������������������������������������������
�����������������������������������������������������������������������������
����������������������������������������������������������������������������������������������������������������
���������������������������������������������������������������������������������������������������������������������������������������������������
������������������������������������������������������������������������������������������������������������������������
������������������������������������������
������������������������������������
������������������������������������������������������������������������
����������������������������������������������������������������������������������������������������������������������������������������������������������
������������
��������������
��������������
������������������
��������������
���������������������
������������������������
������������������������������������������
������������
��������������
����������������������������
������������������������������������������������������������������������������������
�����������������������������������������������������������������������������
����������������������������������������������������������������������
������������������������������������������������������������
���������������������
���������������������
������������������������
��������������������������������������������������������
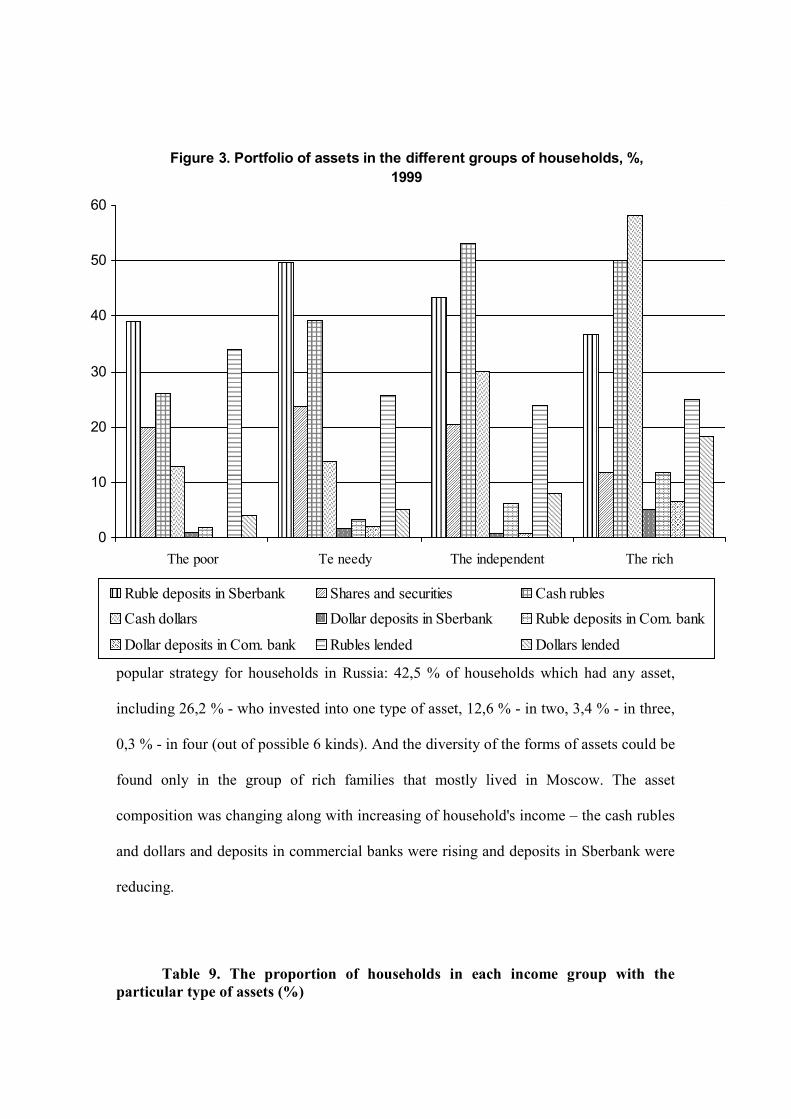
Figure 3. Portfolio of assets in the different groups of households, %, 1999
0
10
20
30
40
50
60
The poor Te needy The independent The rich����
Ruble deposits in Sberbank�����
Shares and securities����
Cash rubles���� Cash dollars ����� Dollar deposits in Sberbank ���� Ruble deposits in Com. bank�������� Dollar deposits in Com. bank
���������� Rubles lended
�������� Dollars lended
In March, 1999
The poor
The needy
The independent
The rich
Total
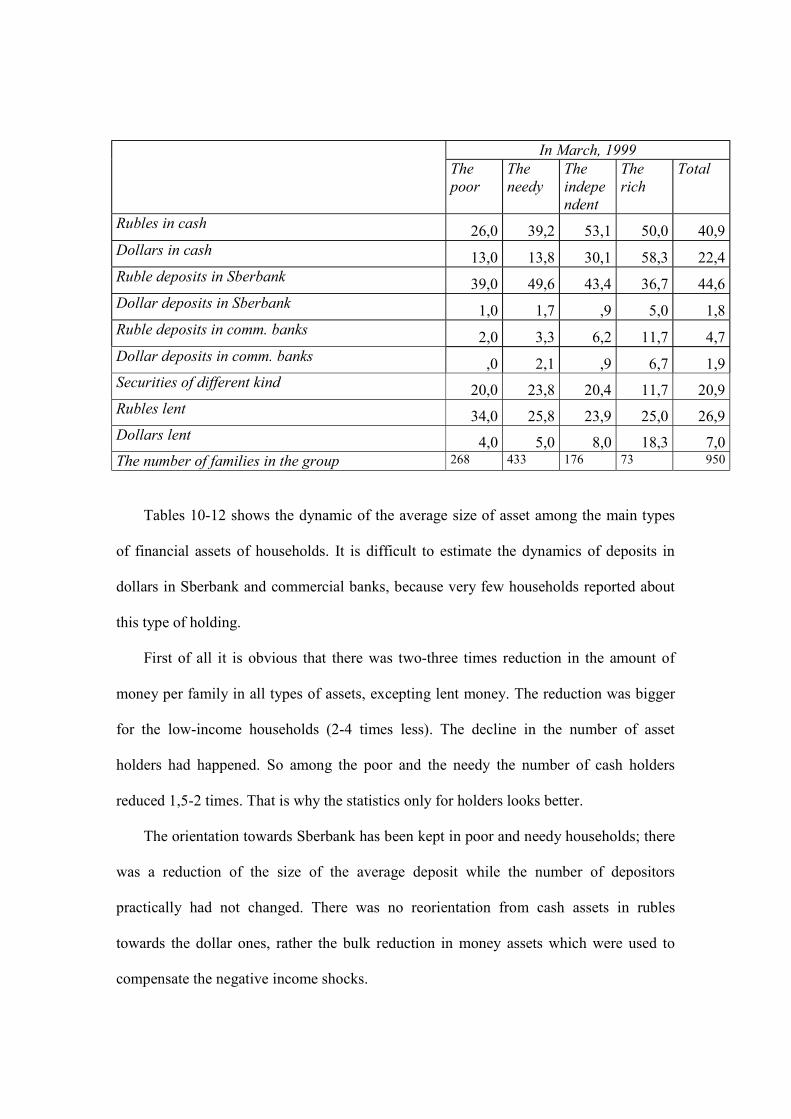
Rubles in cash 26,0 39,2 53,1 50,0 40,9 Dollars in cash 13,0 13,8 30,1 58,3 22,4 Ruble deposits in Sberbank 39,0 49,6 43,4 36,7 44,6 Dollar deposits in Sberbank 1,0 1,7 ,9 5,0 1,8 Ruble deposits in comm. banks 2,0 3,3 6,2 11,7 4,7 Dollar deposits in comm. banks ,0 2,1 ,9 6,7 1,9 Securities of different kind 20,0 23,8 20,4 11,7 20,9 Rubles lent 34,0 25,8 23,9 25,0 26,9 Dollars lent 4,0 5,0 8,0 18,3 7,0 The number of families in the group 268 433 176 73 950
Tables 10-12 shows the dynamic of the average size of asset among the main types
of financial assets of households. It is difficult to estimate the dynamics of deposits in
dollars in Sberbank and commercial banks, because very few households reported about
this type of holding.
First of all it is obvious that there was two-three times reduction in the amount of
money per family in all types of assets, excepting lent money. The reduction was bigger
for the low-income households (2-4 times less). The decline in the number of asset
holders had happened. So among the poor and the needy the number of cash holders
reduced 1,5-2 times. That is why the statistics only for holders looks better.
The orientation towards Sberbank has been kept in poor and needy households; there
was a reduction of the size of the average deposit while the number of depositors
practically had not changed. There was no reorientation from cash assets in rubles
towards the dollar ones, rather the bulk reduction in money assets which were used to
compensate the negative income shocks.
The rich and independent households were more settled. The number of cash holders
had not changed a lot. The rich families chose upon dollars in cash. The number of
dollars' holders even grew among them. The size of average cash stock (both in rubles
and dollars) declined, though the sums on the bank deposits had not changed. They even
grew a bit in Sberbank.
There was the increase in number of the families who operated with private credits
and debts. Borrowed current assets were important financial tool in poor and needy
families, poor families borrowed more often, but less in amount, the needy – quite the
contrary. Loans in rubles predominated. In the independent households loans exceeded
credits, and rubles and dollars were used equally. So we see that mutual crediting was
widespread among the households, that was one of the possible ways of coping with the
consequences of the crisis.
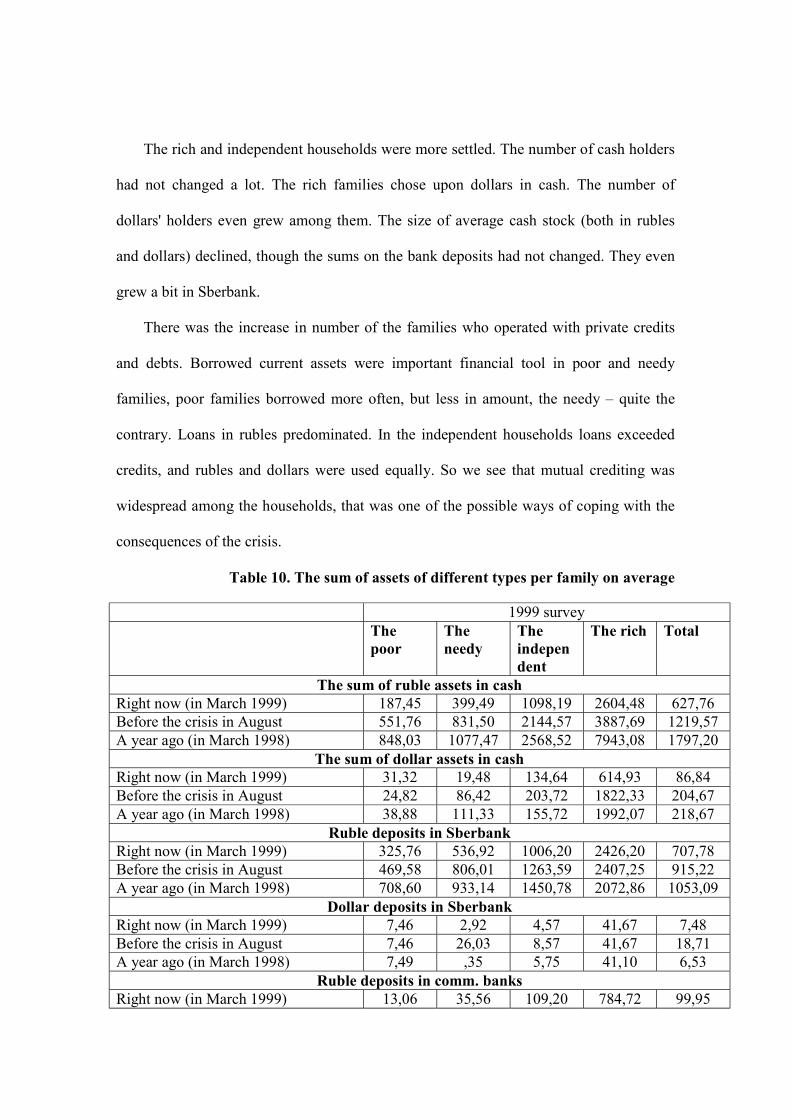
Table 10. The sum of assets of different types per family on average
1999 survey The
poor The needy
The independent
The rich Total
The sum of ruble assets in cash Right now (in March 1999) 187,45 399,49 1098,19 2604,48 627,76 Before the crisis in August 551,76 831,50 2144,57 3887,69 1219,57 A year ago (in March 1998) 848,03 1077,47 2568,52 7943,08 1797,20
The sum of dollar assets in cash Right now (in March 1999) 31,32 19,48 134,64 614,93 86,84 Before the crisis in August 24,82 86,42 203,72 1822,33 204,67 A year ago (in March 1998) 38,88 111,33 155,72 1992,07 218,67
Ruble deposits in Sberbank Right now (in March 1999) 325,76 536,92 1006,20 2426,20 707,78 Before the crisis in August 469,58 806,01 1263,59 2407,25 915,22 A year ago (in March 1998) 708,60 933,14 1450,78 2072,86 1053,09
Dollar deposits in Sberbank Right now (in March 1999) 7,46 2,92 4,57 41,67 7,48 Before the crisis in August 7,46 26,03 8,57 41,67 18,71 A year ago (in March 1998) 7,49 ,35 5,75 41,10 6,53
Ruble deposits in comm. banks Right now (in March 1999) 13,06 35,56 109,20 784,72 99,95
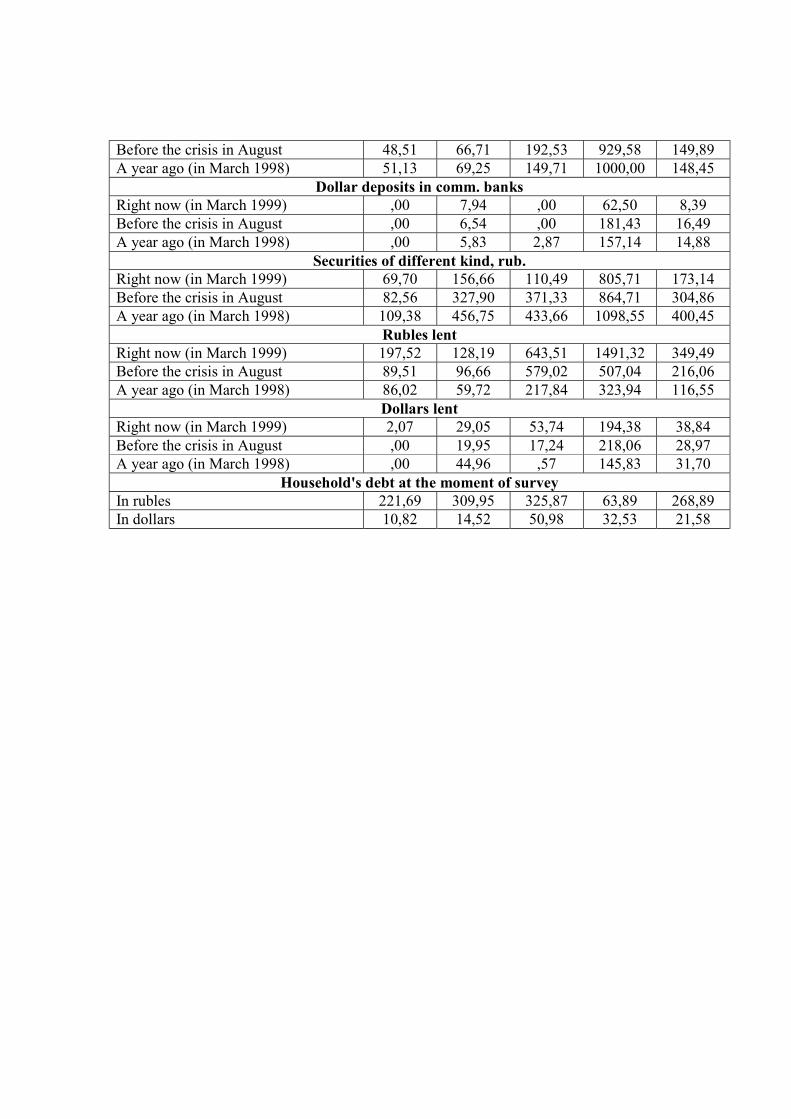
Before the crisis in August 48,51 66,71 192,53 929,58 149,89 A year ago (in March 1998) 51,13 69,25 149,71 1000,00 148,45
Dollar deposits in comm. banks Right now (in March 1999) ,00 7,94 ,00 62,50 8,39 Before the crisis in August ,00 6,54 ,00 181,43 16,49 A year ago (in March 1998) ,00 5,83 2,87 157,14 14,88
Securities of different kind, rub. Right now (in March 1999) 69,70 156,66 110,49 805,71 173,14 Before the crisis in August 82,56 327,90 371,33 864,71 304,86 A year ago (in March 1998) 109,38 456,75 433,66 1098,55 400,45
Rubles lent Right now (in March 1999) 197,52 128,19 643,51 1491,32 349,49 Before the crisis in August 89,51 96,66 579,02 507,04 216,06 A year ago (in March 1998) 86,02 59,72 217,84 323,94 116,55
Dollars lent Right now (in March 1999) 2,07 29,05 53,74 194,38 38,84 Before the crisis in August ,00 19,95 17,24 218,06 28,97 A year ago (in March 1998) ,00 44,96 ,57 145,83 31,70
Household's debt at the moment of survey In rubles 221,69 309,95 325,87 63,89 268,89 In dollars 10,82 14,52 50,98 32,53 21,58

Table 11. The sums of assets of different types per household having that type of asset on average
1999 survey The
poor The needy
The independent
The rich Total
The sum of ruble assets in cash Right now (in March 1999) 2347,62 2072,37 3574,51 6980,00 3231,02 Before the crisis in August 2993,62 2811,61 5861,83 8423,33 4223,06 A year ago (in March 1998) 3900,95 3224,24 6935,00 16654,84 5656,66
The sum of dollar assets in cash Right now (in March 1999) 696,83 316,96 894,00 1420,69 871,23 Before the crisis in August 655,20 1165,32 1193,21 4205,38 1951,86 A year ago (in March 1998) 643,88 1254,73 994,23 5501,90 1981,17
Ruble deposits in Sberbank Right now (in March 1999) 2763,71 2107,17 4175,73 9066,32 3307,78 Before the crisis in August 3685,52 2943,39 5453,39 8742,11 4082,23 A year ago (in March 1998) 4424,44 3302,52 5984,48 8535,29 4439,77
Dollar deposits in Sberbank Right now (in March 1999) 2000,00 416,67 800,00 3000,00 1175,00 Before the crisis in August 2000,00 3713,33 750,00 3000,00 2520,00 A year ago (in March 1998) 2000,00 150,00 1000,00 3000,00 1537,50
Ruble deposits in comm. banks Right now (in March 1999) 1750,00 1906,75 3166,67 9416,67 4284,27 Before the crisis in August 3250,00 2379,17 3350,00 9428,57 4274,24 A year ago (in March 1998) 1957,43 2681,82 3237,50 11666,67 4346,94
Dollar deposits in comm. banks Right now (in March 1999) 850,00 1500,00 1128,57 Before the crisis in August 933,33 3175,00 2214,29 A year ago (in March 1998) 625,00 500,00 3666,67 1750,00
Securities of different kind, rub. Right now (in March 1999) 1309,43 1779,83 1402,38 11280,00 2309,37 Before the crisis in August 1545,14 4315,61 3538,59 14700,00 4157,15 A year ago (in March 1998) 1692,18 4904,05 3927,00 18950,00 4696,19
Rubles lent Right now (in March 1999) 1641,88 1015,85 4478,80 7669,64 2626,81 Before the crisis in August 1593,33 1928,57 6716,67 6000,00 3528,95 A year ago (in March 1998) 1514,00 1482,35 2660,71 4600,00 2120,78
Dollars lent Right now (in March 1999) 275,00 1371,67 1168,75 1290,00 1214,50 Before the crisis in August 2125,00 1000,00 2242,86 1942,86 A year ago (in March 1998) 4800,00 100,00 2625,00 3311,11
Household's debt at the moment of survey In rubles 809,79 2081,11 2075,93 1533,3 1515,55 In dollars 362,5 617,0 882,0 339,33 579,0

Table 12. The number of families in each income group having the particular type of asset (N, %)
1999 survey
The poor The needy The independent
The rich
N % N % N % N % The sum of ruble assets in cash
Right now (in March 1999) 21 8,0 80 19,3 51 30,7 25 37,3 Before the crisis in August 47 18,4 118 29,6 60 36,6 30 46,2 A year ago (in March 1998) 55 21,7 132 33,4 60 37,0 31 47,7
The sum of dollar assets in cash Right now (in March 1999) 12 4,5 26 6,1 25 15,1 29 43,3 Before the crisis in August 10 3,8 31 7,4 28 17,1 26 43,3 A year ago (in March 1998) 16 6,0 37 8,9 26 15,7 21 36,2
Ruble deposits in Sberbank Right now (in March 1999) 31 11,8 106 25,5 40 24,1 19 26,8 Before the crisis in August 33 12,7 112 27,4 38 23,2 19 27,5 A year ago (in March 1998) 41 16,0 115 28,3 40 24,2 17 24,3
Dollar deposits in Sberbank Right now (in March 1999) 1 ,4 3 ,7 1 ,6 1 1,4 Before the crisis in August 1 ,4 3 ,7 2 1,1 1 1,4 A year ago (in March 1998) 1 ,4 1 ,2 1 ,6 1 1,4
Ruble deposits in comm. banks Right now (in March 1999) 2 ,7 8 1,9 6 3,4 6 8,3 Before the crisis in August 4 1,5 12 2,8 10 5,7 7 9,9 A year ago (in March 1998) 7 2,6 11 2,6 8 4,6 6 8,6
Dollar deposits in comm. banks Right now (in March 1999) 4 ,9 3 4,2 Before the crisis in August 3 ,7 4 5,7 A year ago (in March 1998) 4 ,9 1 ,6 3 4,3
Securities of different kind, rub. Right now (in March 1999) 14 5,3 36 8,8 13 7,9 5 7,1 Before the crisis in August 14 5,3 31 7,6 17 10,5 4 5,9 A year ago (in March 1998) 17 6,5 38 9,3 18 11,0 4 5,8
Rubles lent Right now (in March 1999) 32 12,0 53 12,6 25 14,4 14 19,4 Before the crisis in August 15 5,6 21 5,0 15 8,6 6 8,5 A year ago (in March 1998) 15 5,7 17 4,0 14 8,2 5 7,0
Dollars lent Right now (in March 1999) 2 ,8 9 2,1 8 4,6 11 15,1 Before the crisis in August 4 ,9 3 1,7 7 9,7 A year ago (in March 1998) 4 ,9 1 ,6 4 5,6
Household's debt at the moment of survey In rubles 72 27,4 63 14,9 27 15,7 3 4,2 In dollars 8 3,0 10 2,4 10 5,8 7 9,6
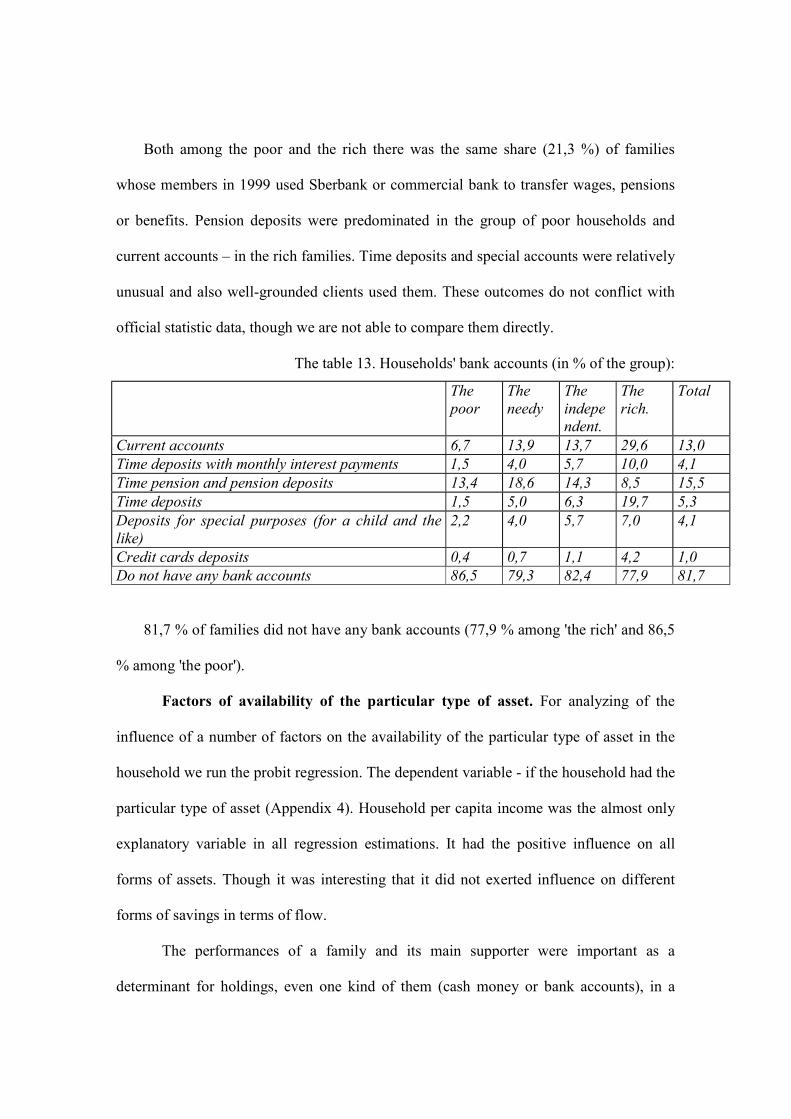
Both among the poor and the rich there was the same share (21,3 %) of families
whose members in 1999 used Sberbank or commercial bank to transfer wages, pensions
or benefits. Pension deposits were predominated in the group of poor households and
current accounts – in the rich families. Time deposits and special accounts were relatively
unusual and also well-grounded clients used them. These outcomes do not conflict with
official statistic data, though we are not able to compare them directly.
The table 13. Households' bank accounts (in % of the group):
The poor
The needy
The independent.
The rich.
Total
Current accounts 6,7 13,9 13,7 29,6 13,0 Time deposits with monthly interest payments 1,5 4,0 5,7 10,0 4,1 Time pension and pension deposits 13,4 18,6 14,3 8,5 15,5 Time deposits 1,5 5,0 6,3 19,7 5,3 Deposits for special purposes (for a child and the like)
2,2 4,0 5,7 7,0 4,1
Credit cards deposits 0,4 0,7 1,1 4,2 1,0 Do not have any bank accounts 86,5 79,3 82,4 77,9 81,7
81,7 % of families did not have any bank accounts (77,9 % among 'the rich' and 86,5
% among 'the poor').
Factors of availability of the particular type of asset. For analyzing of the
influence of a number of factors on the availability of the particular type of asset in the
household we run the probit regression. The dependent variable - if the household had the
particular type of asset (Appendix 4). Household per capita income was the almost only
explanatory variable in all regression estimations. It had the positive influence on all
forms of assets. Though it was interesting that it did not exerted influence on different
forms of savings in terms of flow.
The performances of a family and its main supporter were important as a
determinant for holdings, even one kind of them (cash money or bank accounts), in a
family. If a family was large, its main supporter was a man, and he was young and
married, the family was more probable to have financial assets. There was a great deal of
uncertainty about the impact of households' characteristics on the estimations of risk and
profitability.
Cash assets in rubles were more likely for families with a highly educated man as
a head of it and less likely for families of the professionals. Gender was influencing on
the amount of assets, but age and psychological variables – on savings. Cash dollars were
more likely for families of entrepreneurs, especially in Moscow and in Ivanovo. Cash
dollar holders did not consider the risk of bank deposits in commercial banks as a higher
one. The sky-high expectations of the price rise dynamic had positive impact on the
amount of cash dollar holdings, gender and position of the main supporter of a family –
on cash dollar savings. Wage and pension arrears during the post-crisis period had
influenced on cash dollar holdings.
Deposits in Sberbank were more likely for elderly men, who were at a loss while
estimating risk and profitability of assets, though they thought that the risk of depositing
in Sberbank was rather high. The same variables had positive impact on the size of the
deposit, and only some of them – on the actual increase of the bank balance. Those who
had deposits in commercial bank or dollar deposits in Sberbank were more likely to be
employed and to be experienced with deposit losses in commercial banks. The size of this
kind of assets was dependent on the price rise forecasts and deposit increase – wage
arrears before the crisis. Professionals and businessmen were more likely to invest money
into mutual funds, as well as those who considered durables and gold as risky
investments.
Managers and entrepreneurs were more likely to lend money in both terms
(especially dollars). Debts in rubles were associated with households of elderly people,

with high proportion of under age members: in dollars – those who was paid in dollars.
When the whole sum of savings (in terms of flow) is concerned, there was a set of
explanatory variables: household per capita income, ruble assets, experienced losses of
deposits, and purchases of durables. It means that financial saving and accumulation of
material wealth should not be considered as competing but rather complementary aims of
rich households.
As a whole it is necessary to emphasize that a set of factors that was influential a
year ago in 1999 had appeared to become insignificant: wage arrears, the level of
education of the main supporter of a family, income in dollars. The relationship between
risk and profitability was not empirically found out. Non of psychological variables was
influential.
Consumption and dissaving after crisis. Let's consider what the assets were
spent for during the period from March 1998 to March 1999? First of all we need to pick
up the families whose sum of assets in March 1999 was less than a year before. There
were not financial assets of any kind in 39,7 % of families in March 1998 (58,6% among
the poor and 15,1% among the rich), and 8,9 % of families had not been dissaving during
previous year (4,5 % among the poor and 11 % among the rich). The rest of all families
had been dissaving partly or entirely. The greatest part of families had used their savings
for buying food (79,8 % of all, 61,1 % - among the rich) and other current expenses
(71,8% and 68,5% accordingly). It confirms the hypothesis that savings are used for
smoothing current consumption in face of minor income shocks.
Then, there were expenses for medical treatment - 32,9 % of families had to
dissave for this purpose. The poor did it even more often than the rich did if we look not
at the sums, but at the frequency of expenses of this kind. Among the poor and the needy
there was a great proportion of elderly people and children. Savings were used for
purchases of durables as well (23,7 %). Among the rich families 42,6 % of households
had reported about these type of actions. Many households called for special events (25,5
%) and education fees as the reasons for dissaving. There was also expenditures for rest
(17,1 % of all families, 46,3 % - among the rich) and for real estate investments or
redecorating (15,8 % and 35,2 % accordingly). And only a few 4,5 % (1 % among the
poor, 14,8 % among the rich) had bought a car or had invested into their own business
(3,3 % of all, 7,4 %among the rich).
In the face of sharp reduction in household real income the major part of total
assets was utilized for maintenance of their every day consumption pattern: if the poor
and the needy had used them for food and primary necessities, the independent and the
rich had transferred them partly into material assets (a car, durables) and partly into
'human capital investments' (education, health, rest).
What were the main forms of 'saving the assets'? First of all 36,6% of households
(47,1% among the poor and 19,8 among the rich) there had been no problem because of
no assets at that moment. The rest had transformed their money assets mostly into stock
of food and articles of prime necessity. Though the period when these stocks had been
done was not long - when prices started to rise the demand had reduced. Poor families
(85,2 %) had used this pattern more often than the rich (58,7 %). For the rich families it
had been more likely to buy cars, durables or real estate. Each fourth family among the
rich (11,1 % among poor) reported about making these purchases. Dollars had been also
popular among the rich families (32,6 % against 14,8 % among the poor). Poor families
had used their precautionary assets for smoothing their consumption in the face of minor
income shock in post-crisis period. More wealthy families with greater amount of assets
had transferred the structure of their assets trying to invest money in the moving up
assets.
Stockpiling of food had not become an everyday practice as it had used to be in
1991, however 46,6 % of families reported that they had been doing it occasionally after
crisis (of necessities - 19,3 %, of durables - 5,3%). But it was even less often than in the
1998 survey, when 58,6 % of families did it.
Durables' and real estate purchases had also experienced the influence of two-fold
tendencies: they were attractive as the form of asset holding, but the need to smooth the
consumption because of income reduction had reduced in necessity to have ready assets.
Fall in income also had reduced the possibility to make those consumer purchases.
Comparing the data about these purchases before the crisis and after it (from the 1999
survey) we see that the substantial reduction of durables' purchases had taken place.
Home appliances - from 8,7 % down to 4 % for all families (from 28,8 % down to 15,1 %
for the rich), TV sets, video and tape recorders - from 10,4 % down to 3,5 % for all
households (from 32,2% down to 13,7 % for the rich), winter clothes - from 18,4 % down
to 14,0 % (had even increased for the rich), and furniture - from 3,3 % down to 2,0 %
(from 12,3 % down to 5,5 % for the rich). As to apartments, cars, summerhouses, the
ratio of those who had purchased them before the crisis had not been large (2,1 % - for
cars, 1,7 % - for apartments, 0,4 % - for summerhouses) and it had not decreased as well.
There was also the decrease in the proportion of those who had spent money for
redecoration of their flats or houses and construction - from 10,9 % down to 6% ( from
19,2 % down to 12,5 % - for the rich).
7. Conclusions
One year between two our surveys (February-March 1998, March 1999) because
of the August crisis 1998 has proved to be turning in many respects, and first of all in the
field of household incomes, consumption and savings. The main aims of the research
were to shed light on the changes in household saving and portfolio behavior.
Among the main macro consequences of the crisis in the household sector there
were:
• At the middle of March 1999 the exchange rate had grown since August 1998
3,5 times. The index of consumer prices since August 1998 till March 1999
came to 179,2 %. In the first quarter of 1999 the speed of inflation was
slackened. The annual growth of consumer prices in 1999 appeared to be
much less than it was forecasted in the beginning of the year. In conjunction
with stability of exchange rate it had reduced in some valuation of ruble.
• The withdrawing money from bank accounts, which started in June 1998 and after August 17
had become stronger, stopped. The total bank balances grew to increase, but only in Sberbank,
the withdrawing money from bank accounts in commercial banks continued. In March, 1999
for the first time from the beginning of the year there was an increase in net cash dollars
balance: households bought more cash dollars than sold.
• The greatest damage was caused by crisis to the largest Moscow banks, but it
had positive consequences in the banking sphere. In the early 1999 Russian
financial markets stabilized, the lowering of the interest rates of all financial
trading had happened.
• The banking system became more productive oriented, that was one of the
consequences of depreciating of the state bonds and revaluation of the
currency credits. The lowering of the share of individual deposits stimulated
the banking system to credit enterprises.
• The modification of economic environment after August crisis was happening
in the presence of the increase of the demand for domestics in the home
market. Displacing barter with money interplant payments was the evidence of
the improving of the financial state of industrial firms.
• After the crisis there were positive changes in the balance of payments: if in
the first half of 1998 the current transactions in the balance of payments of
Russia were negative — minus 5,6 bln. doll., one year later it became positive
- almost 13 bln.doll.
The impact on the household incomes (macro tendencies).
• Some improving of economic activities during the first quarter of 1999 did not
result in evident changes on the labour market where situation remained tight.
At the end of March 1999 the total number of the unemployed (using the
methodology of ILO) increased by 18,7 % during a year.
• According to the official statistic macro data real household incomes in the
first quarter of 1999 were came to 73 % of their level a year before. According
to our data, it was 50% reduction. The estimation variance might be explained
by the absence of the richest families in our sample, income understatements
and non-representativeness of our sample for all Russia.
• According to the data of the official statistics household expenses steadily
exceeded 80 % of the total money incomes of households. The decreasing of
the purchasing power of personal incomes resulted in forced rise of the
expenses for food at the expense of nonfoods and services. These tendencies
characterized the behavior of the majority of households, and it became
especially evident in the low-income groups.
Thus there were several factors of the maintaining consumption at the similar to
pre-crisis level.
First, permanent settlements of the wage, pension, and other arrears compensated
the decline of real wages and incomes of the population.
Secondly, there was a considerable decrease in saving rates. If during a half of a
year before the crisis average saving rate according to official data was equal to 18,5%,
eight months after August 1998, including August - only 8%. For many families it meant
dissaving. The alternate estimation of the share of savings in household incomes (subject
to the net increase of cash dollars on hand) in the post-crisis period was close to zero.
According to our data, the average saving rate had become negative. It reduced from
7,4% in March 1998 down to – 3,7%.
Thirdly, the decreasing of purchasing power of household assets in rubles was
partly compensated by the rising of the ruble valuation of household assets in dollars.
However, only those households which kept their financial assets in cash dollars on the
eve of crisis were able to use this advantage. As a result, resources were redistributed in
favor of pre-crisis cash dollars' holders.
Finally, the informal employment in the market and within the household sectors
created a stream of unregistered money and in-kind incomes.
The conclusions from the analysis of our data 1998, 1999:
• The main trends in the dynamics of incomes and savings from our data in the
main consist with macro estimations.
• Econometric estimation of the consumption function resulted in a conclusion
that after the financial crisis there was a shift on the consumption curve and a
change in slope.
• In the year 1998 income was practically the only determinant of consumption,
coefficient was close to 1. The contribution of the amount of assets was not
big, and the rest of factors (socio-demographic) had no influence on
consumption.
• In the year 1999 the impact of income on consumption had reduced (the
coefficient and the slope of the curve declined). The influence of accumulated
assets on consumption significantly increased, they substituted the reduced
income in order to keep household consumption as invariable as possible, and
in addition the family characteristics started to be influential.
• According to our data, in the early year 1999 in comparison with a year before
households started to smooth out their consumption by dissaving in the
presence of the negative income shock. This behavior was consistent with the
main prediction of the Permanent Income Hypothesis for the short-time period
about the smoothing of consumption. The reduction in incomes was
interpreted as the negative transitory income and was followed by negative
savings. We can say that after the crisis PIH for the short-run period fits the
data better.
• The unification of portfolio composition had happened. As a whole it is
necessary to emphasize that a set of factors that was influential a year ago in
1999 had appeared to become insignificant. The per capita family income had
remained to be the most influential factor of portfolio behavior, the impact of
other variables was not well defined and empirically consistent. There still
remains a good deal of uncertainty about the impact of estimations of risk and
profitability on the portfolio behavior. Non of psychological variables was
influential.
As a whole, the sharply reduction of household real incomes had caused the using
of the accumulated financial assets for current needs in order to maintain the usual level
of consumption. The number of households who had any financial assets had reduced and
the unification of the forms of financial savings had happened. The change in economic
situation had resulted in the reduction of determinants that had influenced on the portfolio
composition in comparison with the outcomes of our survey in 1998.
In our opinion, there were two major financial strategies that can be distinguished
among the households with different per capita income level. Active forward-looking
saving and consumption behavior, which had decrease in post-crisis period, was
appropriated to the wealthy families only. This group represents not more than 10% of
households in our sampling. The saving behavior of the medium strata of households is
not forward-looking, they are guarded by precautionary motives mostly, and their
smoothing of the consumption is short-termed. The incomes of the poorest families are
hardly enough for current consumption and so they are not forward-looking and active in
financial behavior, that is guarded by survival motives only.
8. Bibliography
1. Красильникова М. Склонность к сбережениям и потреблению // Экономические
и социальные перемены: Мониторинг общественного мнения. Москва, ВЦИОМ,
1997, N 3.
2. Никифоров, Л.В.; Кузнецова, Т.Е.; Лыкова, Л.Н. Использование финансовых
накоплений населения в инвестиционных целях // Пробл. прогнозирования. - М.,
1996. - Вып 3. - С. 93-103.
3. Николаенко С.А. Личные сбережения населения // Экономический журнал
ВШЭ, том 2, №4.
4. Рябикин, В.И.; Семенов, В.П. Доходность денежных сбережений в
инфляционной экономике // Финансы . - М., 1996. - N 10. - С. 54-57.
5. Сбережения населения Российской Федерации. М., 1997.
6. Урнов М. Существует ли инвестиционный потенциал сбережений населения
России? // Экономические и социальные перемены: Мониторинг общественного
мнения. Москва, ВЦИОМ, 1997, N 3.
7. Финансовый потенциал населения // О-во и экономика. - М., 1996. - N7. - С. 91-
139.
8. Яковлев,А. Отношение частных вкладчиков к различным формам и способам
сбережений. // Вопросы экономики, 1998, в печати
9. Alessie R., Lusardi A. Saving and income smoothing: evidence from panel data. VBS-
Center Saving Project, Progress Report 11, Tilburg University, 1993.
10.Artus P., Bleuze E., Legros F., Nicolai J. Epargne des menages, choix de portefeuille
et fiscalite en France. // Revue economique, 1991, N 4.
11.Behavior models of saving . NBER reporter. - Cambridge(Mass.), 1994 - Fall. - P. 18-
24.
12.Browning, M.; Lusardi, A. Household saving: micro theories and micro facts . J. of
econ. lit., 1996. - Vol. 34, N 4. - P. 1797-1855.
13.Callen T., Thimann C. Empirical determinants of household saving: evidence from
OECD countries (1997), IMF Working paper
14.Deaton A.S. Understanding Consumption. Oxford: Oxford U. Press, 1992.
15.El-Mokadem A.M. Econometric Models of Personal Saving. The United Kingdom,
1948-1966. London, Butterworths, 1973.
16.Flavin M. The adjustement of consumption to changing expectations about future
income. Journal of Political Economy, 1981, 89, p.974-1009.
17. Feldstein M. Personal taxation and portfolio composition: an econometric analysys. //
Econometrica, 1976, N 4 (44).
18.Friedman M. A Theory of the Consumption Function. Princeton: Princeton University
Press, 1957.
19.Gunnarsson J. The heterogeneity of saving and portfolio behavior: segmentation in
financial services markets / Portfolio-based segmentation and consumer behavior,
1999, pp. 26-47.
20.Hall R., Mishkin F. The sensivity of Consumption to Transitory Income: Estimates
from Panel Data on Households. Ecjnjmetrica, 1982, 50, p. 461-181.
21.Hayashi F. Understanding Saving: evidence from the United States and Japan.
Cambridge, 1997.
22.Hochgurtel, S. (1998) Households' Portfolio Choices. Doctorial thesis. Tilburg
University, Tilburg.
23.King, M.A.& Leape, J.I. (1987) Asset Acumulation, Information and the Life Cycle
(NBER Working Paper No. 2392) Cambridge. MA: NBER.
24.Kotlikoff L.J. What Determines Savings? Cambridge (Mass.), MIT Press, 1989.
25.Modigliani F. The Life-Cycle Hypothesis of Saving Twenty Years Later /
Contemporary Issues in Economics /ed. by M.Parkin and A.R.Nobay, Manchester,
Manchester University Press, 1975.
26.Mones, M.A.; Ventura, E. Saving decisions and fiscal incentives: a Spanish panel-
based analysis. Appl. economics. - L., 1996. - Vol. 28, N 9. - P.1105-1117.
27.Owen D. Money, Wealth and Expenditure: Integrated Modeling of Consumption and
Portfolio Behaviour. Cambridge, Cambridge University Press, 1986.
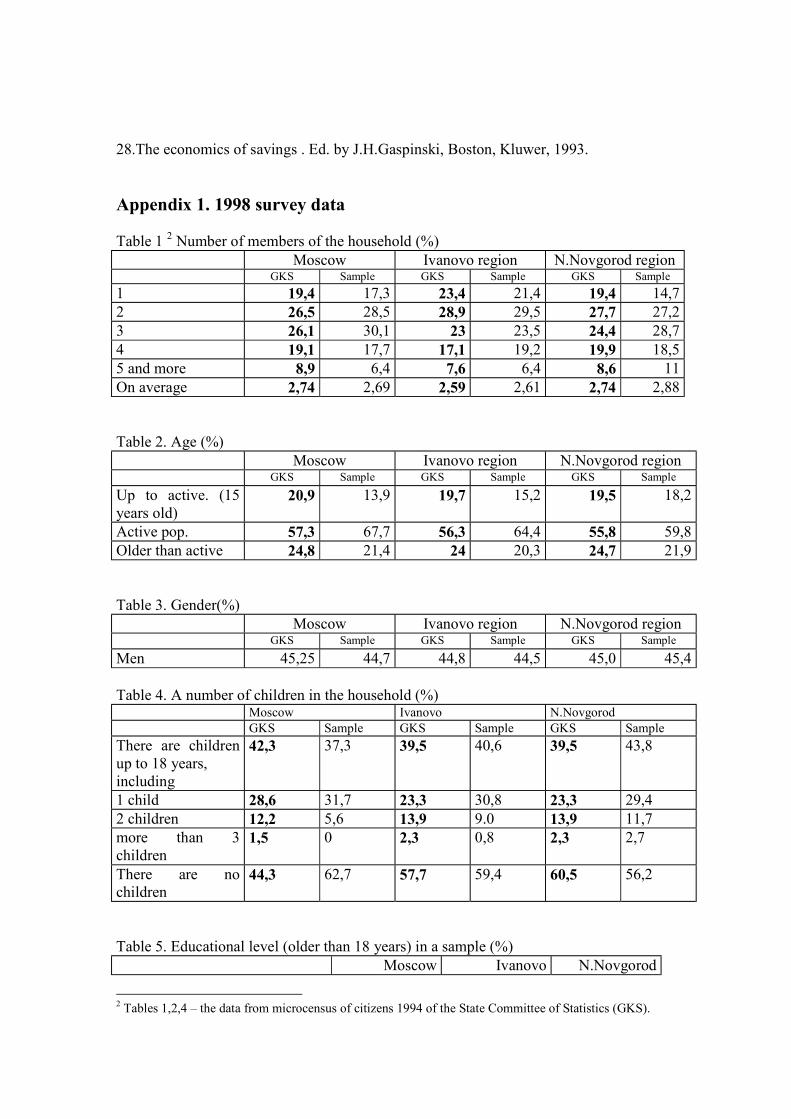
28.The economics of savings . Ed. by J.H.Gaspinski, Boston, Kluwer, 1993.
Appendix 1. 1998 survey data Table 1 2 Number of members of the household (%)
Moscow Ivanovo region N.Novgorod region GKS Sample GKS Sample GKS Sample
1 19,4 17,3 23,4 21,4 19,4 14,7 2 26,5 28,5 28,9 29,5 27,7 27,2 3 26,1 30,1 23 23,5 24,4 28,7 4 19,1 17,7 17,1 19,2 19,9 18,5 5 and more 8,9 6,4 7,6 6,4 8,6 11 On average 2,74 2,69 2,59 2,61 2,74 2,88 Table 2. Age (%)
Moscow Ivanovo region N.Novgorod region GKS Sample GKS Sample GKS Sample
Up to active. (15 years old)
20,9 13,9 19,7 15,2 19,5 18,2
Active pop. 57,3 67,7 56,3 64,4 55,8 59,8 Older than active 24,8 21,4 24 20,3 24,7 21,9 Table 3. Gender(%)
Moscow Ivanovo region N.Novgorod region GKS Sample GKS Sample GKS Sample
Men 45,25 44,7 44,8 44,5 45,0 45,4 Table 4. A number of children in the household (%) Moscow Ivanovo N.Novgorod GKS Sample GKS Sample GKS Sample There are children up to 18 years, including
42,3 37,3 39,5 40,6 39,5 43,8
1 child 28,6 31,7 23,3 30,8 23,3 29,4 2 children 12,2 5,6 13,9 9.0 13,9 11,7 more than 3 children
1,5 0 2,3 0,8 2,3 2,7
There are no children
44,3 62,7 57,7 59,4 60,5 56,2
Table 5. Educational level (older than 18 years) in a sample (%) Moscow Ivanovo N.Novgorod
2 Tables 1,2,4 – the data from microcensus of citizens 1994 of the State Committee of Statistics (GKS).
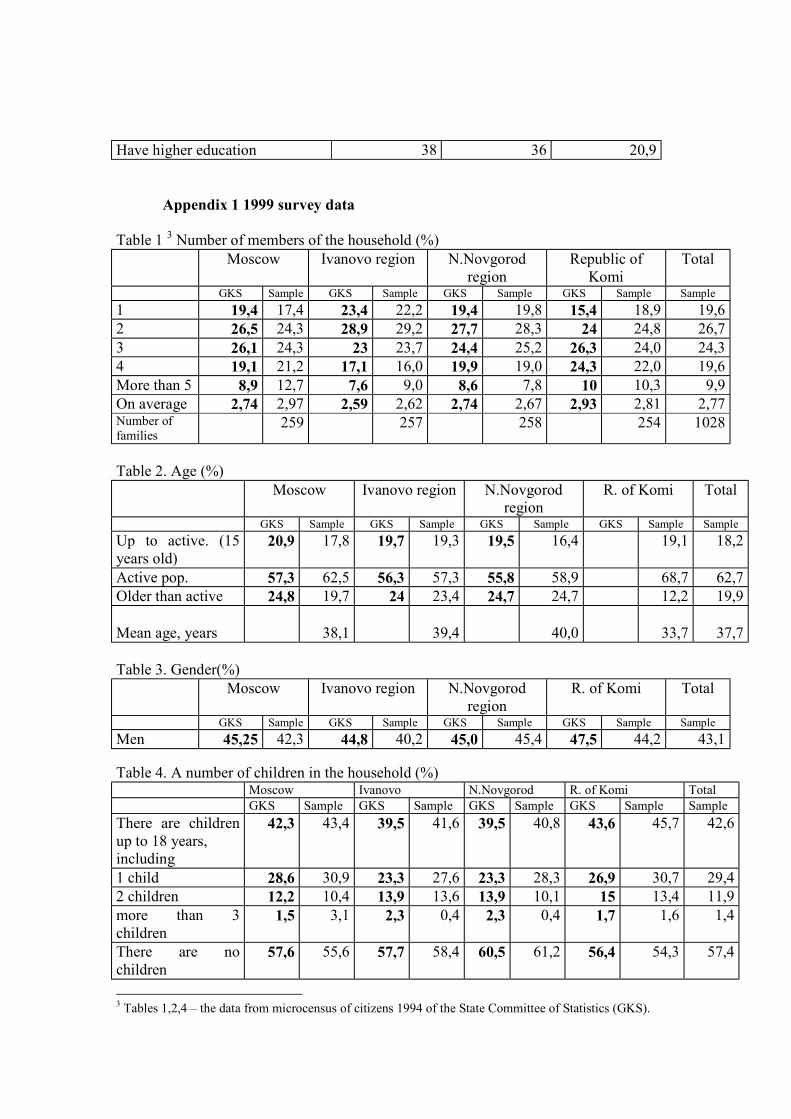
Have higher education 38 36 20,9
Appendix 1 1999 survey data
Table 1 3 Number of members of the household (%) Moscow Ivanovo region N.Novgorod
region Republic of
Komi Total
GKS Sample GKS Sample GKS Sample GKS Sample Sample 1 19,4 17,4 23,4 22,2 19,4 19,8 15,4 18,9 19,6 2 26,5 24,3 28,9 29,2 27,7 28,3 24 24,8 26,7 3 26,1 24,3 23 23,7 24,4 25,2 26,3 24,0 24,3 4 19,1 21,2 17,1 16,0 19,9 19,0 24,3 22,0 19,6 More than 5 8,9 12,7 7,6 9,0 8,6 7,8 10 10,3 9,9 On average 2,74 2,97 2,59 2,62 2,74 2,67 2,93 2,81 2,77 Number of families
259 257 258 254 1028
Table 2. Age (%)
Moscow Ivanovo region N.Novgorod region
R. of Komi Total
GKS Sample GKS Sample GKS Sample GKS Sample Sample Up to active. (15 years old)
20,9 17,8 19,7 19,3 19,5 16,4 19,1 18,2
Active pop. 57,3 62,5 56,3 57,3 55,8 58,9 68,7 62,7 Older than active 24,8 19,7 24 23,4 24,7 24,7 12,2 19,9 Mean age, years
38,1
39,4
40,0
33,7
37,7
Table 3. Gender(%)
Moscow Ivanovo region N.Novgorod region
R. of Komi Total
GKS Sample GKS Sample GKS Sample GKS Sample Sample Men 45,25 42,3 44,8 40,2 45,0 45,4 47,5 44,2 43,1
Table 4. A number of children in the household (%) Moscow Ivanovo N.Novgorod R. of Komi Total GKS Sample GKS Sample GKS Sample GKS Sample Sample There are children up to 18 years, including
42,3 43,4 39,5 41,6 39,5 40,8 43,6 45,7 42,6
1 child 28,6 30,9 23,3 27,6 23,3 28,3 26,9 30,7 29,4 2 children 12,2 10,4 13,9 13,6 13,9 10,1 15 13,4 11,9 more than 3 children
1,5 3,1 2,3 0,4 2,3 0,4 1,7 1,6 1,4
There are no children
57,6 55,6 57,7 58,4 60,5 61,2 56,4 54,3 57,4
3 Tables 1,2,4 – the data from microcensus of citizens 1994 of the State Committee of Statistics (GKS).
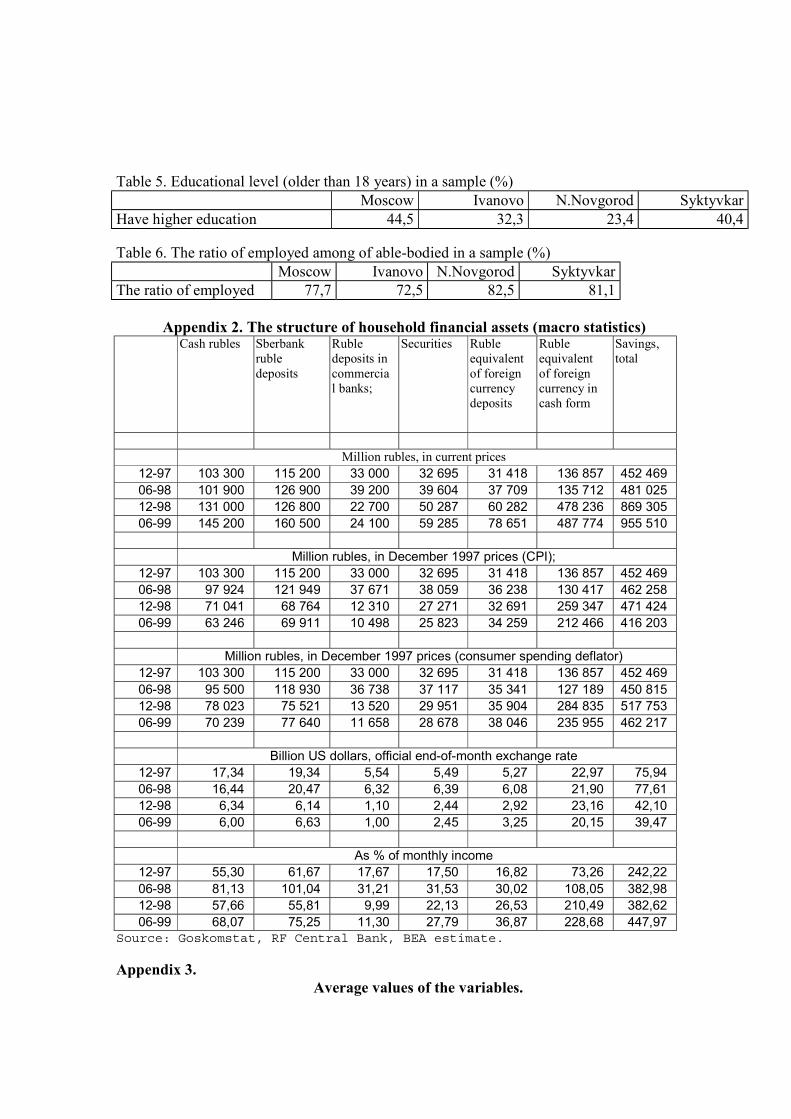
Table 5. Educational level (older than 18 years) in a sample (%) Moscow Ivanovo N.Novgorod Syktyvkar Have higher education 44,5 32,3 23,4 40,4
Table 6. The ratio of employed among of able-bodied in a sample (%) Moscow Ivanovo N.Novgorod Syktyvkar The ratio of employed 77,7 72,5 82,5 81,1
Appendix 2. The structure of household financial assets (macro statistics)
Cash rubles Sberbank ruble deposits
Ruble deposits in commercial banks;
Securities Ruble equivalent of foreign currency deposits
Ruble equivalent of foreign currency in cash form
Savings, total
Million rubles, in current prices
12-97 103 300 115 200 33 000 32 695 31 418 136 857 452 469 06-98 101 900 126 900 39 200 39 604 37 709 135 712 481 025 12-98 131 000 126 800 22 700 50 287 60 282 478 236 869 305 06-99 145 200 160 500 24 100 59 285 78 651 487 774 955 510
Million rubles, in December 1997 prices (CPI);
12-97 103 300 115 200 33 000 32 695 31 418 136 857 452 469 06-98 97 924 121 949 37 671 38 059 36 238 130 417 462 258 12-98 71 041 68 764 12 310 27 271 32 691 259 347 471 424 06-99 63 246 69 911 10 498 25 823 34 259 212 466 416 203
Million rubles, in December 1997 prices (consumer spending deflator)
12-97 103 300 115 200 33 000 32 695 31 418 136 857 452 469 06-98 95 500 118 930 36 738 37 117 35 341 127 189 450 815 12-98 78 023 75 521 13 520 29 951 35 904 284 835 517 753 06-99 70 239 77 640 11 658 28 678 38 046 235 955 462 217
Billion US dollars, official end-of-month exchange rate
12-97 17,34 19,34 5,54 5,49 5,27 22,97 75,94 06-98 16,44 20,47 6,32 6,39 6,08 21,90 77,61 12-98 6,34 6,14 1,10 2,44 2,92 23,16 42,10 06-99 6,00 6,63 1,00 2,45 3,25 20,15 39,47
As % of monthly income
12-97 55,30 61,67 17,67 17,50 16,82 73,26 242,22 06-98 81,13 101,04 31,21 31,53 30,02 108,05 382,98 12-98 57,66 55,81 9,99 22,13 26,53 210,49 382,62 06-99 68,07 75,25 11,30 27,79 36,87 228,68 447,97
Source: Goskomstat, RF Central Bank, BEA estimate.
Appendix 3. Average values of the variables.
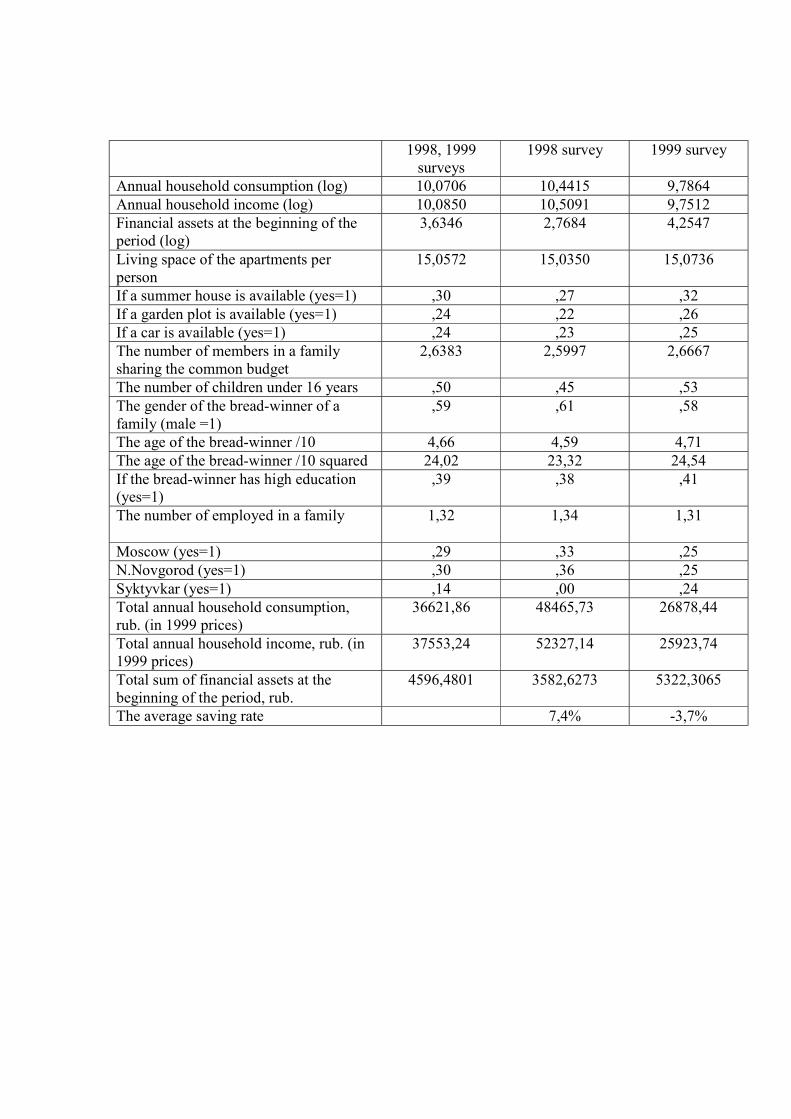
1998, 1999 surveys
1998 survey 1999 survey
Annual household consumption (log) 10,0706 10,4415 9,7864 Annual household income (log) 10,0850 10,5091 9,7512 Financial assets at the beginning of the period (log)
3,6346 2,7684 4,2547
Living space of the apartments per person
15,0572 15,0350 15,0736
If a summer house is available (yes=1) ,30 ,27 ,32 If a garden plot is available (yes=1) ,24 ,22 ,26 If a car is available (yes=1) ,24 ,23 ,25 The number of members in a family sharing the common budget
2,6383 2,5997 2,6667
The number of children under 16 years ,50 ,45 ,53 The gender of the bread-winner of a family (male =1)
,59 ,61 ,58
The age of the bread-winner /10 4,66 4,59 4,71 The age of the bread-winner /10 squared 24,02 23,32 24,54 If the bread-winner has high education (yes=1)
,39 ,38 ,41
The number of employed in a family
1,32 1,34 1,31
Moscow (yes=1) ,29 ,33 ,25 N.Novgorod (yes=1) ,30 ,36 ,25 Syktyvkar (yes=1) ,14 ,00 ,24 Total annual household consumption, rub. (in 1999 prices)
36621,86 48465,73 26878,44
Total annual household income, rub. (in 1999 prices)
37553,24 52327,14 25923,74
Total sum of financial assets at the beginning of the period, rub.
4596,4801 3582,6273 5322,3065
The average saving rate 7,4% -3,7%
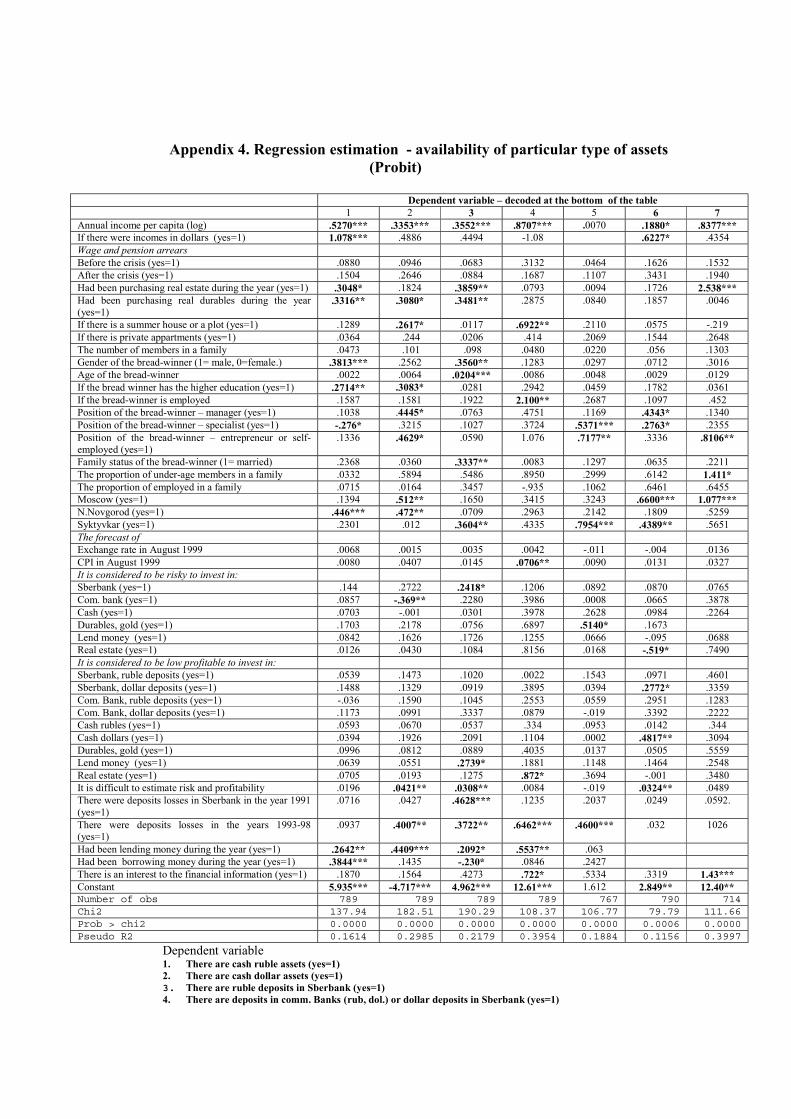
Appendix 4. Regression estimation - availability of particular type of assets (Probit)
Dependent variable – decoded at the bottom of the table 1 2 3 4 5 6 7 Annual income per capita (log) .5270*** .3353*** .3552*** .8707*** .0070 .1880* .8377*** If there were incomes in dollars (yes=1) 1.078*** .4886 .4494 -1.08 .6227* .4354 Wage and pension arrears Before the crisis (yes=1) .0880 .0946 .0683 .3132 .0464 .1626 .1532 After the crisis (yes=1) .1504 .2646 .0884 .1687 .1107 .3431 .1940 Had been purchasing real estate during the year (yes=1) .3048* .1824 .3859** .0793 .0094 .1726 2.538*** Had been purchasing real durables during the year (yes=1)
.3316** .3080* .3481** .2875 .0840 .1857 .0046
If there is a summer house or a plot (yes=1) .1289 .2617* .0117 .6922** .2110 .0575 -.219 If there is private appartments (yes=1) .0364 .244 .0206 .414 .2069 .1544 .2648 The number of members in a family .0473 .101 .098 .0480 .0220 .056 .1303 Gender of the bread-winner (1= male, 0=female.) .3813*** .2562 .3560** .1283 .0297 .0712 .3016 Age of the bread-winner .0022 .0064 .0204*** .0086 .0048 .0029 .0129 If the bread winner has the higher education (yes=1) .2714** .3083* .0281 .2942 .0459 .1782 .0361 If the bread-winner is employed .1587 .1581 .1922 2.100** .2687 .1097 .452 Position of the bread-winner – manager (yes=1) .1038 .4445* .0763 .4751 .1169 .4343* .1340 Position of the bread-winner – specialist (yes=1) -.276* .3215 .1027 .3724 .5371*** .2763* .2355 Position of the bread-winner – entrepreneur or self-employed (yes=1)
.1336 .4629* .0590 1.076 .7177** .3336 .8106**
Family status of the bread-winner (1= married) .2368 .0360 .3337** .0083 .1297 .0635 .2211 The proportion of under-age members in a family .0332 .5894 .5486 .8950 .2999 .6142 1.411* The proportion of employed in a family .0715 .0164 .3457 -.935 .1062 .6461 .6455 Moscow (yes=1) .1394 .512** .1650 .3415 .3243 .6600*** 1.077*** N.Novgorod (yes=1) .446*** .472** .0709 .2963 .2142 .1809 .5259 Syktyvkar (yes=1) .2301 .012 .3604** .4335 .7954*** .4389** .5651 The forecast of Exchange rate in August 1999 .0068 .0015 .0035 .0042 -.011 -.004 .0136 CPI in August 1999 .0080 .0407 .0145 .0706** .0090 .0131 .0327 It is considered to be risky to invest in: Sberbank (yes=1) .144 .2722 .2418* .1206 .0892 .0870 .0765 Com. bank (yes=1) .0857 -.369** .2280 .3986 .0008 .0665 .3878 Cash (yes=1) .0703 -.001 .0301 .3978 .2628 .0984 .2264 Durables, gold (yes=1) .1703 .2178 .0756 .6897 .5140* .1673 Lend money (yes=1) .0842 .1626 .1726 .1255 .0666 -.095 .0688 Real estate (yes=1) .0126 .0430 .1084 .8156 .0168 -.519* .7490 It is considered to be low profitable to invest in: Sberbank, ruble deposits (yes=1) .0539 .1473 .1020 .0022 .1543 .0971 .4601 Sberbank, dollar deposits (yes=1) .1488 .1329 .0919 .3895 .0394 .2772* .3359 Com. Bank, ruble deposits (yes=1) -.036 .1590 .1045 .2553 .0559 .2951 .1283 Com. Bank, dollar deposits (yes=1) .1173 .0991 .3337 .0879 -.019 .3392 .2222 Cash rubles (yes=1) .0593 .0670 .0537 .334 .0953 .0142 .344 Cash dollars (yes=1) .0394 .1926 .2091 .1104 .0002 .4817** .3094 Durables, gold (yes=1) .0996 .0812 .0889 .4035 .0137 .0505 .5559 Lend money (yes=1) .0639 .0551 .2739* .1881 .1148 .1464 .2548 Real estate (yes=1) .0705 .0193 .1275 .872* .3694 -.001 .3480 It is difficult to estimate risk and profitability .0196 .0421** .0308** .0084 -.019 .0324** .0489 There were deposits losses in Sberbank in the year 1991 (yes=1)
.0716 .0427 .4628*** .1235 .2037 .0249 .0592.
There were deposits losses in the years 1993-98 (yes=1)
.0937 .4007** .3722** .6462*** .4600*** .032 1026
Had been lending money during the year (yes=1) .2642** .4409*** .2092* .5537** .063 Had been borrowing money during the year (yes=1) .3844*** .1435 -.230* .0846 .2427 There is an interest to the financial information (yes=1) .1870 .1564 .4273 .722* .5334 .3319 1.43*** Constant 5.935*** -4.717*** 4.962*** 12.61*** 1.612 2.849** 12.40** Number of obs 789 789 789 789 767 790 714 Chi2 137.94 182.51 190.29 108.37 106.77 79.79 111.66 Prob > chi2 0.0000 0.0000 0.0000 0.0000 0.0000 0.0006 0.0000 Pseudo R2 0.1614 0.2985 0.2179 0.3954 0.1884 0.1156 0.3997
Dependent variable 1. There are cash ruble assets (yes=1) 2. There are cash dollar assets (yes=1) 3. There are ruble deposits in Sberbank (yes=1) 4. There are deposits in comm. Banks (rub, dol.) or dollar deposits in Sberbank (yes=1)

5. There are shares in financial companies or pension funds, other securities (дyes=1) 6. There are rubles lent (yes=1) 7. There are dollars lent (yes=1)