Modelling the removal of p-TSA (para-toluenesulfonamide) during rapid sand filtration used for...
9
Modelling the removal of p-TSA (para-toluenesulfonamide) during rapid sand filtration used for drinking water treatment Raffaella Meffe a, *, Claus Kohfahl a , Ekkehard Holzbecher b , Gudrun Massmann a , Doreen Richter c , Uwe Du ¨ nnbier d , Asaf Pekdeger a a Institute of Geological Sciences, Freie Universita ¨t Berlin, Malteserstr. 74-100, 12249 Berlin, Germany b Georg-August-Universita ¨t Go ¨ttingen, GZG, Goldschmidtstr. 3, 37077 Go ¨ttingen, Germany c DVGW-Technologiezentrum Wasser (TZW), Karlsruher Straße 84, 76139 Karlsruhe, Germany d Department of Laboratories, Berliner Wasserbetriebe, 10864 Berlin, Germany article info Article history: Received 26 March 2009 Received in revised form 27 August 2009 Accepted 31 August 2009 Published online xxx Keywords: p-TSA Microbial degradation Reactive transport modelling Rapid sand filtration abstract A finite element model was set-up to determine degradation rate constants for p-TSA during rapid sand filtration (RSF). Data used for the model originated from a column experiment carried out in the filter hall of a drinking water treatment plant in Berlin (Germany). Aerated abstracted groundwater was passed through a 1.6 m long column- shaped experimental sand filter applying infiltration rates from 2 to 6 m h 1 . Model results were fitted to measured profiles and breakthrough curves of p-TSA for different infiltration rates using both first-order reaction kinetics and Michaelis–Menten kinetics. Both approaches showed that degradation rates varied both in space and time. Higher degra- dation rates were observed in the upper part of the column, probably related to higher microbial activity in this zone. Measured and simulated breakthrough curves revealed an adaption phase with lower degradation rates after infiltration rates were changed, followed by an adapted phase with more elevated degradation rates. Irrespective of the mathe- matical approach and the infiltration rate, degradation rates were very high, probably owing to the fact that filter sands have been in operation for decades, receiving high p-TSA concentrations with the raw water. ª 2009 Elsevier Ltd. All rights reserved. 1. Introduction The occurrence, fate and potential harms of organic pollut- ants in the aquatic environment have been an object of growing interest in recent years, as shown by the increasing number of studies in this field (Heberer, 2002a,b; Yu et al., 2006; Kim, 2007; Loss et al., 2007). The presence of organic pollutants in groundwater is of particular concern where the groundwater is used for drinking water production. The principal source of organic micropollutants in the aquatic environment is municipal wastewater, which is generally treated in wastewater treatment plants (WWTPs) before being discharged into surface water (Daughton and Ternes, 1999). In the past, untreated wastewater was often also irrigated on sewage irrigation farms, causing a significant anthropogenic contamination of the surrounding environment (Grunewald, 1994; Heberer and Stan, 1994; Bechmann and Grunewald, 1995a,b; Abdel-Shafy et al., 2008). Various studies showed that residues of some organic pollutants from human and animal use are not fully eliminated during wastewater treatment and * Corresponding author. Freie Universita ¨ t Berlin, Institute of Geological Sciences, Hydrogeology Group, Malteserstr. 74-100, 12249 Berlin, Germany. Tel.: þ49 30 838 70876; fax: þ49 30 838 70742. E-mail address: [email protected] (R. Meffe). Available at www.sciencedirect.com journal homepage: www.elsevier.com/locate/watres ARTICLE IN PRESS 0043-1354/$ – see front matter ª 2009 Elsevier Ltd. All rights reserved. doi:10.1016/j.watres.2009.08.046 water research xxx (2009) 1–9 Please cite this article in press as: Meffe, R. et al., Modelling the removal of p-TSA (para-toluenesulfonamide) during rapid sand filtration used for drinking water treatment, Water Research (2009), doi:10.1016/j.watres.2009.08.046
Transcript of Modelling the removal of p-TSA (para-toluenesulfonamide) during rapid sand filtration used for...
ARTICLE IN PRESSw a t e r r e s e a r c h x x x ( 2 0 0 9 ) 1 – 9
Avai lab le a t www.sc iencedi rec t .com
journa l homepage : www.e lsev ie r . com/ loca te /wat res
Modelling the removal of p-TSA (para-toluenesulfonamide)during rapid sand filtration used for drinking water treatment
Raffaella Meffe a,*, Claus Kohfahl a, Ekkehard Holzbecher b, Gudrun Massmann a,Doreen Richter c, Uwe Dunnbier d, Asaf Pekdeger a
a Institute of Geological Sciences, Freie Universitat Berlin, Malteserstr. 74-100, 12249 Berlin, Germanyb Georg-August-Universitat Gottingen, GZG, Goldschmidtstr. 3, 37077 Gottingen, Germanyc DVGW-Technologiezentrum Wasser (TZW), Karlsruher Straße 84, 76139 Karlsruhe, Germanyd Department of Laboratories, Berliner Wasserbetriebe, 10864 Berlin, Germany
a r t i c l e i n f o
Article history:
Received 26 March 2009
Received in revised form
27 August 2009
Accepted 31 August 2009
Published online xxx
Keywords:
p-TSA
Microbial degradation
Reactive transport modelling
Rapid sand filtration
* Corresponding author. Freie Universitat BerGermany. Tel.: þ49 30 838 70876; fax: þ49 30
E-mail address: [email protected]/$ – see front matter ª 2009 Elsevidoi:10.1016/j.watres.2009.08.046
Please cite this article in press as: Meffe, Rfiltration used for drinking water treatm
a b s t r a c t
A finite element model was set-up to determine degradation rate constants for p-TSA
during rapid sand filtration (RSF). Data used for the model originated from a column
experiment carried out in the filter hall of a drinking water treatment plant in Berlin
(Germany). Aerated abstracted groundwater was passed through a 1.6 m long column-
shaped experimental sand filter applying infiltration rates from 2 to 6 m h�1. Model results
were fitted to measured profiles and breakthrough curves of p-TSA for different infiltration
rates using both first-order reaction kinetics and Michaelis–Menten kinetics. Both
approaches showed that degradation rates varied both in space and time. Higher degra-
dation rates were observed in the upper part of the column, probably related to higher
microbial activity in this zone. Measured and simulated breakthrough curves revealed an
adaption phase with lower degradation rates after infiltration rates were changed, followed
by an adapted phase with more elevated degradation rates. Irrespective of the mathe-
matical approach and the infiltration rate, degradation rates were very high, probably
owing to the fact that filter sands have been in operation for decades, receiving high p-TSA
concentrations with the raw water.
ª 2009 Elsevier Ltd. All rights reserved.
1. Introduction environment is municipal wastewater, which is generally
The occurrence, fate and potential harms of organic pollut-
ants in the aquatic environment have been an object of
growing interest in recent years, as shown by the increasing
number of studies in this field (Heberer, 2002a,b; Yu et al.,
2006; Kim, 2007; Loss et al., 2007). The presence of organic
pollutants in groundwater is of particular concern where the
groundwater is used for drinking water production. The
principal source of organic micropollutants in the aquatic
lin, Institute of Geologica838 70742.
m (R. Meffe).er Ltd. All rights reserved
. et al., Modelling the reent, Water Research (200
treated in wastewater treatment plants (WWTPs) before being
discharged into surface water (Daughton and Ternes, 1999).
In the past, untreated wastewater was often also irrigated on
sewage irrigation farms, causing a significant anthropogenic
contamination of the surrounding environment (Grunewald,
1994; Heberer and Stan, 1994; Bechmann and Grunewald,
1995a,b; Abdel-Shafy et al., 2008). Various studies showed that
residues of some organic pollutants from human and animal
use are not fully eliminated during wastewater treatment and
l Sciences, Hydrogeology Group, Malteserstr. 74-100, 12249 Berlin,
.
moval of p-TSA (para-toluenesulfonamide) during rapid sand9), doi:10.1016/j.watres.2009.08.046

w a t e r r e s e a r c h x x x ( 2 0 0 9 ) 1 – 92
ARTICLE IN PRESS
can be found in the aquatic environment (Heberer, 2002a,b;
Derksen et al., 2004). Wastewater-bound, poorly degradable
compounds may enter the raw water for drinking water
production via bank filtration, or the catchment area of
a drinking water treatment plant (DWTP) may receive
groundwater affected by former sewage irrigation.
The organic pollutant discussed in the following (para-tol-
uenesulfonamide, p-TSA) originates from wastewater. It is
applied as a plasticizer, an intermediate for pesticides and
drugs, and is the primary degradation product of the common
disinfectant Chloramine-T in water. Chloramine-T is used as
an antimicrobial agent in the food industry to disinfect
surfaces, instruments and machinery. This substance is also
used as a therapeutic drug for bacterial gill diseases of fish
species and for bacterial diseases of swine and poultry (Beljaars
et al., 1994; Meinertz et al., 1999; Haneke, 2002; Gaikowski et al.,
2004; Harris et al., 2004; Smail et al., 2004; Richter et al., 2007).
According to the German Federal Environmental Agency (UBA),
the tolerable concentration limit of p-TSA in drinking water is
0.3 mg L�1 (Grummt and Dieter, 2006).
P-TSA was found to be ubiquitous in the aquatic environ-
ment in Berlin, the largest city of Germany (Richter et al.,
2008a). It was detected in Berlin’s untreated and treated
wastewater, surface water, groundwater and raw water used
for drinking water production (Richter et al., 2008a). The
highest concentrations of p-TSA (up to 38 mg L�1) were
encountered within the catchment area of a DWTP
(Friedrichshagen) in the eastern part of the city. This DWTP is
located downgradient of a former sewage irrigation farm,
where untreated wastewater had been irrigated directly onto
the soils until the 1980s, when the farm was closed. Though
the concentrations of p-TSA in the raw water of this plant are
considerably lower due to dilution with bank filtrate from Lake
Muggelsee, an efficient removal during treatment is still
necessary to reach the required limit of 0.3 mg L�1 in the final
drinking water. Treatment at this DWTP involves aeration and
rapid sand filtration (RSF) through open bed filters composed
of biologically active sand (Richter et al., 2008b). Using an
analytical method described in Richter et al. (2007, 2008b)
investigated the behaviour of p-TSA during drinking water
treatment with an experimental sand filter (column experi-
ment), which provided the data used for the present model-
ling approach. Incubation experiments revealed that p-TSA
degradation occurs as a result of microbial processes (Richter
et al., 2008b). In addition, it appears to be largely limited to oxic
conditions, explaining the persistence of p-TSA in the anoxic
groundwater downgradient of the former sewage irrigation
site (Richter et al., 2009). According to a laboratory experiment
carried out by Richter et al. (2008b) sorption and retardation
are negligible and can be excluded as a potential removal
process. Their conclusion is also supported by data from
a recently conducted, unpublished column study, in which
p-TSA and a tracer were injected at the same time. P-TSA
breakthrough occurred simultaneously with the tracer
breakthrough at the outlet. Results of column studies are
normally valid only for the specific experimental conditions,
making comparison with other experiments and upscaling to
field conditions difficult or impossible. Modelling refines and
improves the interpretation of experimental studies by
providing reaction rate constants which can be applied also to
Please cite this article in press as: Meffe, R. et al., Modelling the refiltration used for drinking water treatment, Water Research (20
other sites and experimental condition. This holds true
particularly where experimental conditions, such as influent
concentrations, are highly variable and transient as in the
present case, and it therefore becomes difficult to distinguish
different effects.
In the literature different approaches were used to simulate
microbially mediated reactions in column experiments. The
simplest approach neglects kinetics induced by microbial
activity and assumes instantaneous chemical equilibrium (e.g.
Sabbagh et al., 2007). This method is appropriate if the micro-
bial kinetics are fast compared to the transport timescale.
Another group of models accounts for kinetics using zero or
first-order reaction (Knudsen et al., 2000; Amondham et al.,
2006) or Michaelis–Menten kinetics (Bengtsson and Carlsson,
2001a; Park et al., 2001; Sato et al., 2002). Both approaches are
based on the concept of degradation constants, assuming that
the microbial population does not change. Monod-type
kinetics accounts also for microbial dynamics that describes
growth dynamics (Hohener et al., 2006; Kim and Jaffe, 2008;
Kinzelbach et al., 1991).
The role of microbiology in degradation has been investi-
gated by numerical simulation for several organic compounds,
such as antimicrobials (Rooklidge et al., 2004), hydrocarbons
(Bengtsson and Carlsson, 2001b; Goedeke et al., 2008), chlori-
nated organic compounds (Bosma et al., 1988; Corapcioglu
et al., 1991) and pesticides (Pang et al., 2005; Magga et al., 2008).
However, no quantitative information applicable to other sites
and conditions has been obtained yet for the sulfonamide
p-TSA. Therefore, this paper provides a modelling framework
for the simulation of the column experiment performed by
Richter et al. (2008b), and the aim of this study was to (i) to
determine the reaction rate constants defining microbial
degradation of p-TSA, (ii) to explore and compare two different
kinetic approaches to describe the degradation process and
(iii) to investigate the dependence of microbial reaction rate
constants on infiltration rates.
2. Methods
2.1. Column experiment
The column experiment performed by Richter et al. (2008b)
simulated rapid sand filtration during drinking water treat-
ment in Berlin. The column was installed in the filter hall of
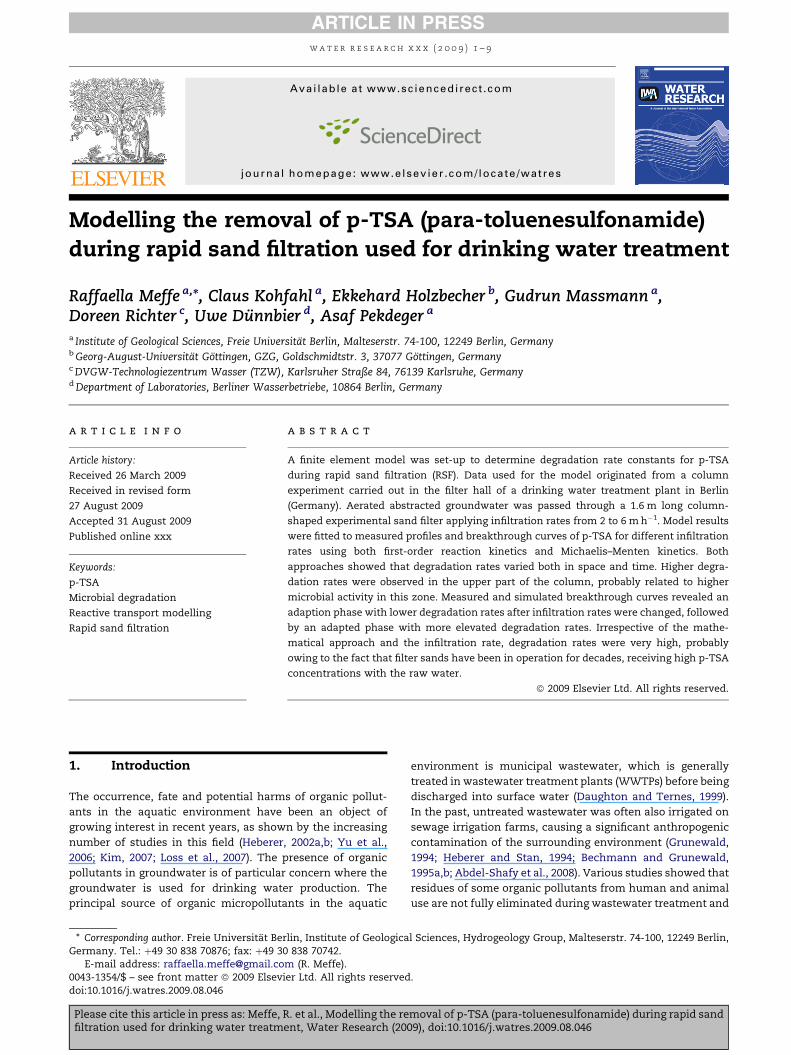
the DWTP Friedrichshagen (Fig. 1) and was operated similarly
to the real large rapid sand filters. It was packed with the same
silica sand that had been used for decades during RSF and had
a length of 1.6 m, corresponding to the real filter length used
during drinking water treatment at the DWTP Friedrich-
shagen. The silica sand had an effective porosity of 0.3,
determined with the saturation method, and a uniformity
coefficient (ratio d60 over d10) of 1.33 (analysis carried out by
the laboratories of Freie Universitat Berlin). Sampling ports
were installed every 0.25 m along the column (Fig. 1). The
aerated raw water used during routine treatment was passed
through the column. The infiltration rate was regulated via
the effluent flow. After an initial regulation phase of about two
weeks using an infiltration rate of 2 m h�1, the functional
capability of the experimental filter was determined by
moval of p-TSA (para-toluenesulfonamide) during rapid sand09), doi:10.1016/j.watres.2009.08.046
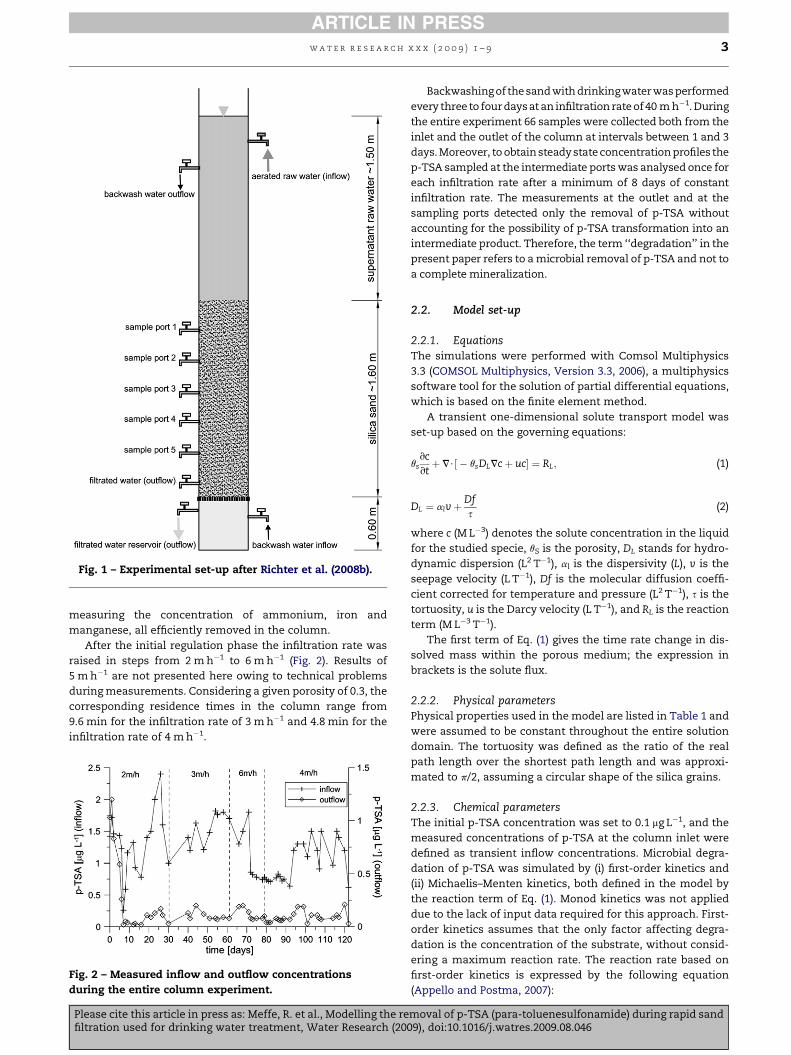
Fig. 1 – Experimental set-up after Richter et al. (2008b).
w a t e r r e s e a r c h x x x ( 2 0 0 9 ) 1 – 9 3
ARTICLE IN PRESS
measuring the concentration of ammonium, iron and
manganese, all efficiently removed in the column.
After the initial regulation phase the infiltration rate was
raised in steps from 2 m h�1 to 6 m h�1 (Fig. 2). Results of
5 m h�1 are not presented here owing to technical problems
during measurements. Considering a given porosity of 0.3, the
corresponding residence times in the column range from
9.6 min for the infiltration rate of 3 m h�1 and 4.8 min for the
infiltration rate of 4 m h�1.
Fig. 2 – Measured inflow and outflow concentrations
during the entire column experiment.
Please cite this article in press as: Meffe, R. et al., Modelling the refiltration used for drinking water treatment, Water Research (200
Backwashing of the sand with drinking water was performed
every three to four days at an infiltration rate of 40 m h�1. During
the entire experiment 66 samples were collected both from the
inlet and the outlet of the column at intervals between 1 and 3
days. Moreover, to obtain steady state concentration profiles the
p-TSA sampled at the intermediate ports was analysed once for
each infiltration rate after a minimum of 8 days of constant
infiltration rate. The measurements at the outlet and at the
sampling ports detected only the removal of p-TSA without
accounting for the possibility of p-TSA transformation into an
intermediate product. Therefore, the term ‘‘degradation’’ in the
present paper refers to a microbial removal of p-TSA and not to
a complete mineralization.
2.2. Model set-up
2.2.1. EquationsThe simulations were performed with Comsol Multiphysics
3.3 (COMSOL Multiphysics, Version 3.3, 2006), a multiphysics
software tool for the solution of partial differential equations,
which is based on the finite element method.
A transient one-dimensional solute transport model was
set-up based on the governing equations:
qsvcvtþ V$½ � qsDLVcþ uc� ¼ RL; (1)
DL ¼ alvþDfs
(2)
where c (M L�3) denotes the solute concentration in the liquid
for the studied specie, qS is the porosity, DL stands for hydro-
dynamic dispersion (L2 T�1), al is the dispersivity (L), v is the
seepage velocity (L T�1), Df is the molecular diffusion coeffi-
cient corrected for temperature and pressure (L2 T�1), s is the
tortuosity, u is the Darcy velocity (L T�1), and RL is the reaction
term (M L�3 T�1).
The first term of Eq. (1) gives the time rate change in dis-
solved mass within the porous medium; the expression in
brackets is the solute flux.
2.2.2. Physical parametersPhysical properties used in the model are listed in Table 1 and
were assumed to be constant throughout the entire solution
domain. The tortuosity was defined as the ratio of the real
path length over the shortest path length and was approxi-
mated to p/2, assuming a circular shape of the silica grains.
2.2.3. Chemical parametersThe initial p-TSA concentration was set to 0.1 mg L�1, and the
measured concentrations of p-TSA at the column inlet were
defined as transient inflow concentrations. Microbial degra-
dation of p-TSA was simulated by (i) first-order kinetics and
(ii) Michaelis–Menten kinetics, both defined in the model by
the reaction term of Eq. (1). Monod kinetics was not applied
due to the lack of input data required for this approach. First-
order kinetics assumes that the only factor affecting degra-
dation is the concentration of the substrate, without consid-
ering a maximum reaction rate. The reaction rate based on
first-order kinetics is expressed by the following equation
(Appello and Postma, 2007):
moval of p-TSA (para-toluenesulfonamide) during rapid sand9), doi:10.1016/j.watres.2009.08.046
Table 1 – Input parameters of model simulations.
Input parameters Value Reference
Porosity 0.3 Experimental data
Dispersivity (m) 0.01 Gelhar et al. (1985)
Tortuosity factor 1.57 p/2
Diffusion coefficient (m2 s�1) 1 e-9 Frederikse and Lide (1997)
Infiltration rate (m h�1) 3. 4. 6 Experimental set-up
Fig. 3 – Measured steady state depth profiles.
w a t e r r e s e a r c h x x x ( 2 0 0 9 ) 1 – 94
ARTICLE IN PRESS
RL ¼ �qslc (3)
where l(T�1) is the degradation rate constant. For the
remaining parameters, refer to Eq. (1).
The Michaelis–Menten approach describes the dependence
of the reaction velocity on the concentration considering
a maximum reaction rate (Michaelis and Menten, 1913):
RL ¼ �qsKmax$c
ks þ c(4)
where Kmax is the maximum reaction rate (M T�1), and ks is the
half-velocity concentration (M L�3), also known as Michaelis–
Menten constant. For the remaining parameters, refer to Eq. (1).
Following the results obtained from the analysis of the
filter sludge samples carried out by Richter et al. (2008b),
sorption and retardation were not taken into account. The
simulations did not take the consumption of oxygen into
account because the column experiment was conducted
under completely oxic conditions. Hence, parameters are
representative for oxic conditions only and are expected to be
much lower during anoxic conditions.
2.2.4. DiscretizationThe column experiment was modeled by a 1.60 m long, one-
dimensional solution domain discretized in 120 quadratic
elements, corresponding to a degree of freedom of 241. Mesh
refinement studies were carried out, and the simulations
showed that the results are mesh-independent.
2.2.5. Calibration procedureForward modelling runs with the described model were per-
formed for parameter estimation. Transport parameters were
derived from the measurements or from the literature (Table
1), and only the degradation parameters were used as fitting
parameters. Inverse modelling was performed manually,
minimizing the difference between numerical and experi-
mental values.
The mean square error was implemented as a measure of
the fit. The difference between simulated and measured
results is expressed by:
R ¼ 1m
ffiffiffiffiffiffiffiffiffiffiffiffiffiffiffiffiffiffiffiffiffiffiffiffiffiffiffiffiffiffiffiffiffiffiffiffiffiffiffiffiffiffiffiffiffiffi Xm
n¼1
ðcmeas � csimÞ2!vuut 5
where R is the least square residual, cmeas denotes the
measured concentrations, csim is the simulated concentration.
The sum in Eq. (5) extends on all values from profiles and
breakthrough curves. m is the number of measurements in the
profiles and in the breakthrough curves. Note that a weighting
factor was not used.
Please cite this article in press as: Meffe, R. et al., Modelling the refiltration used for drinking water treatment, Water Research (20
3. Results
3.1. Column experiment
The depth profiles measured for infiltration rates of 3, 4 and
6 m h�1 showed that p-TSA was almost completely degraded
after passage through the column (Fig. 3). Changes of initial
concentrations during the experiment correspond to the
variability of the inflowing raw water composition. Effluent
concentrations show similar values for all infiltration rates.
The measured steady state profiles revealed a strong decrease
in concentration as far as a depth of 0.5 m, whereas in the
lower part of the column only a minor decrease was observed.
The breakthrough curves resulting from the experiment
showed a total reduction of>89% p-TSA after passage through
the filter for all infiltration rates tested (Richter et al., 2008b).
A further outcome of breakthrough curve measurements is
that variations in the concentration of the inflowing raw water
are more attenuated at the outlet of the column after
a minimum number of days with constant infiltration rates
(Fig. 3). During the first days after a change in the infiltration
rate, the attenuation of the breakthrough curves was weaker,
indicating lower degradation rate constants during this
period. In the following, the term ‘‘adaption phase’’ refers to
the first period with lower degradation rates, and the subse-
quent period is named ‘‘adapted phase’’. The length of the
adaption phase ranged from 3 to 20 days (Table 2). The long
duration of 20 days after the infiltration rate was reduced from
6 to 4 m h�1 may be attributed to strong changes of the inflow
concentration in the same period (Fig. 3).
3.2. Modelling
Measured breakthrough curves and steady state profiles of 3, 4
and 6 m h�1 were fitted by first-order kinetics and Michaelis–
moval of p-TSA (para-toluenesulfonamide) during rapid sand09), doi:10.1016/j.watres.2009.08.046
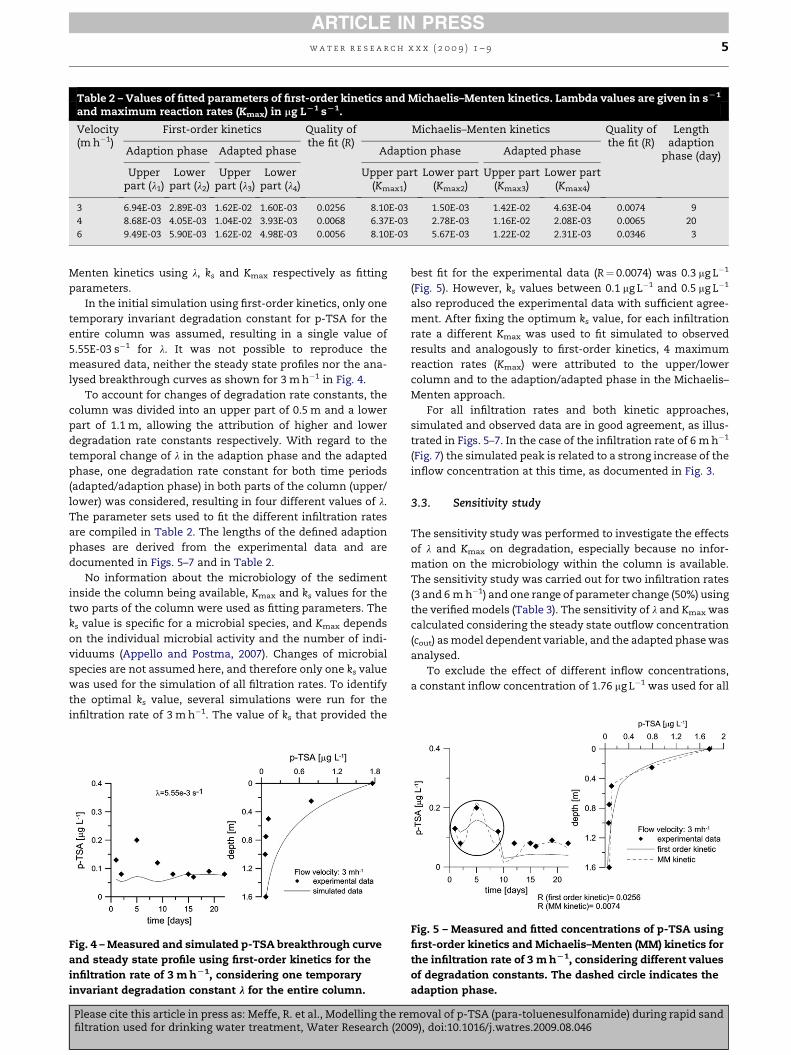
Table 2 – Values of fitted parameters of first-order kinetics and Michaelis–Menten kinetics. Lambda values are given in sL1
and maximum reaction rates (Kmax) in mg LL1 sL1.
Velocity(m h�1)
First-order kinetics Quality ofthe fit (R)
Michaelis–Menten kinetics Quality ofthe fit (R)
Lengthadaption
phase (day)Adaption phase Adapted phase Adaption phase Adapted phase
Upperpart (l1)
Lowerpart (l2)
Upperpart (l3)
Lowerpart (l4)
Upper part(Kmax1)
Lower part(Kmax2)
Upper part(Kmax3)
Lower part(Kmax4)
3 6.94E-03 2.89E-03 1.62E-02 1.60E-03 0.0256 8.10E-03 1.50E-03 1.42E-02 4.63E-04 0.0074 9
4 8.68E-03 4.05E-03 1.04E-02 3.93E-03 0.0068 6.37E-03 2.78E-03 1.16E-02 2.08E-03 0.0065 20
6 9.49E-03 5.90E-03 1.62E-02 4.98E-03 0.0056 8.10E-03 5.67E-03 1.22E-02 2.31E-03 0.0346 3
w a t e r r e s e a r c h x x x ( 2 0 0 9 ) 1 – 9 5
ARTICLE IN PRESS
Menten kinetics using l, ks and Kmax respectively as fitting
parameters.
In the initial simulation using first-order kinetics, only one
temporary invariant degradation constant for p-TSA for the
entire column was assumed, resulting in a single value of
5.55E-03 s�1 for l. It was not possible to reproduce the
measured data, neither the steady state profiles nor the ana-
lysed breakthrough curves as shown for 3 m h�1 in Fig. 4.
To account for changes of degradation rate constants, the
column was divided into an upper part of 0.5 m and a lower
part of 1.1 m, allowing the attribution of higher and lower
degradation rate constants respectively. With regard to the
temporal change of l in the adaption phase and the adapted
phase, one degradation rate constant for both time periods
(adapted/adaption phase) in both parts of the column (upper/
lower) was considered, resulting in four different values of l.
The parameter sets used to fit the different infiltration rates
are compiled in Table 2. The lengths of the defined adaption
phases are derived from the experimental data and are
documented in Figs. 5–7 and in Table 2.
No information about the microbiology of the sediment
inside the column being available, Kmax and ks values for the
two parts of the column were used as fitting parameters. The
ks value is specific for a microbial species, and Kmax depends
on the individual microbial activity and the number of indi-
viduums (Appello and Postma, 2007). Changes of microbial
species are not assumed here, and therefore only one ks value
was used for the simulation of all filtration rates. To identify
the optimal ks value, several simulations were run for the
infiltration rate of 3 m h�1. The value of ks that provided the
Fig. 4 – Measured and simulated p-TSA breakthrough curve
and steady state profile using first-order kinetics for the
infiltration rate of 3 m hL1, considering one temporary
invariant degradation constant l for the entire column.
Please cite this article in press as: Meffe, R. et al., Modelling the refiltration used for drinking water treatment, Water Research (200
best fit for the experimental data (R¼ 0.0074) was 0.3 mg L�1
(Fig. 5). However, ks values between 0.1 mg L�1 and 0.5 mg L�1
also reproduced the experimental data with sufficient agree-
ment. After fixing the optimum ks value, for each infiltration
rate a different Kmax was used to fit simulated to observed
results and analogously to first-order kinetics, 4 maximum
reaction rates (Kmax) were attributed to the upper/lower
column and to the adaption/adapted phase in the Michaelis–
Menten approach.
For all infiltration rates and both kinetic approaches,
simulated and observed data are in good agreement, as illus-
trated in Figs. 5–7. In the case of the infiltration rate of 6 m h�1
(Fig. 7) the simulated peak is related to a strong increase of the
inflow concentration at this time, as documented in Fig. 3.
3.3. Sensitivity study
The sensitivity study was performed to investigate the effects
of l and Kmax on degradation, especially because no infor-
mation on the microbiology within the column is available.
The sensitivity study was carried out for two infiltration rates
(3 and 6 m h�1) and one range of parameter change (50%) using
the verified models (Table 3). The sensitivity of l and Kmax was
calculated considering the steady state outflow concentration
(cout) as model dependent variable, and the adapted phase was
analysed.
To exclude the effect of different inflow concentrations,
a constant inflow concentration of 1.76 mg L�1 was used for all
Fig. 5 – Measured and fitted concentrations of p-TSA using
first-order kinetics and Michaelis–Menten (MM) kinetics for
the infiltration rate of 3 m hL1, considering different values
of degradation constants. The dashed circle indicates the
adaption phase.
moval of p-TSA (para-toluenesulfonamide) during rapid sand9), doi:10.1016/j.watres.2009.08.046

Fig. 6 – Measured and fitted concentrations of p-TSA using
first-order kinetics and Michaelis–Menten (MM) kinetics for
the infiltration rate of 4 m hL1, considering different values
of degradation constants. The dashed circle indicates the
adaption phase.
Fig. 7 – Measured and fitted concentrations of p-TSA using
first-order kinetics and Michaelis–Menten (MM) kinetics for
the infiltration rate of 6 m hL1, considering different values
of degradation constants. The dashed circle indicates the
adaption phase.
w a t e r r e s e a r c h x x x ( 2 0 0 9 ) 1 – 96
ARTICLE IN PRESS
the simulations. Parameter sensitivity was tested for the
upper part of the column because l3 and Kmax3 affect also the
lower part and are supposed to have a major impact on steady
state outflow concentrations.
To enable comparison of sensitivities between different
parameters, sensitivities are normalized according to Bennett
and Zheng (2002):
Xp ¼vcout
vP=P(6)
where Xp is the normalized sensitivity, cout is the steady state
outflow concentration, and P represents the tested parameter
(l3 or Kmax3).
The outcome of the sensitivity study is presented in Table 3.
The analysis showed a greater sensitivity to Kmax than to l for
both infiltration rates, with the sensitivity of Kmax being almost
three times higher than the sensitivity of l for the infiltration
rate of 3 m h�1 and more than two times higher for the infil-
tration rate of 6 m h�1.
As expected, the resulting data show a negative correlation
between infiltration rate and parameter sensitivity,which isdue
to the dependence of parameter sensitivity on residence times.
Table 3 – Sensitivity study. The first-order degradation rate convalues (Kmax) in mg LL1 sL1 and the concentration in mg LL1. Th
Run 1D Parameter Value in thereference model
Vase
3 m h�1 Reference
1 l3 1.62E-02 8
Reference
2 Kmax3 1.42E-02 7
6 m h�1 Reference
3 l3 1.62E-02 8
Reference
4 Kmax3 1.22E-02 6
Please cite this article in press as: Meffe, R. et al., Modelling the refiltration used for drinking water treatment, Water Research (20
4. Discussion
Richter et al. (2008b) already presented a rough estimation of
degradation rate constants for p-TSA during the column
experiment obtained by simple graphical exponential fitting
of the steady state depth profiles without considering
invariant inflow concentrations, changes in infiltration rate,
and breakthrough curves. The approach was only rudimen-
tary, similar to the initial simulation described above, where
only one temporary invariant degradation rate constant for
p-TSA for the entire column was used. The resulting degra-
dation rate constants of Richter et al. (2008b) were around
6.3E-03 s�1, but obtained fits were rather poor. Instead, in the
present paper, the degradation rate constants were derived
through the application of a model that considered both depth
profiles as well as breakthrough curves simultaneously and
accounted for the spatial and temporary variability of the
parameters, thereby obtaining much better agreement
between modeled and measured data and a refined under-
standing of the processes.
Fitted l (and likewise Kmax) values for p-TSA are very high,
ranging from 10�3 (in the lower part of the column) to 10�2 s�1
stant values (l) are given in sL1, the maximum reaction ratee constant inflow concentration is 1.76 mg LL1.
lue in thensitivity
% Change inparameter
cout Value Normalizedsensitivity (Xp)
0.00 0.075
.10E-03 �50.00 0.280 0.410
0.00 0.076
.12E-03 �50.00 0.637 1.125
0.00 0.166
.10E-03 �50.00 0.328 0.324
0.00 0.574
.10E-03 �50.00 0.953 0.758
moval of p-TSA (para-toluenesulfonamide) during rapid sand09), doi:10.1016/j.watres.2009.08.046
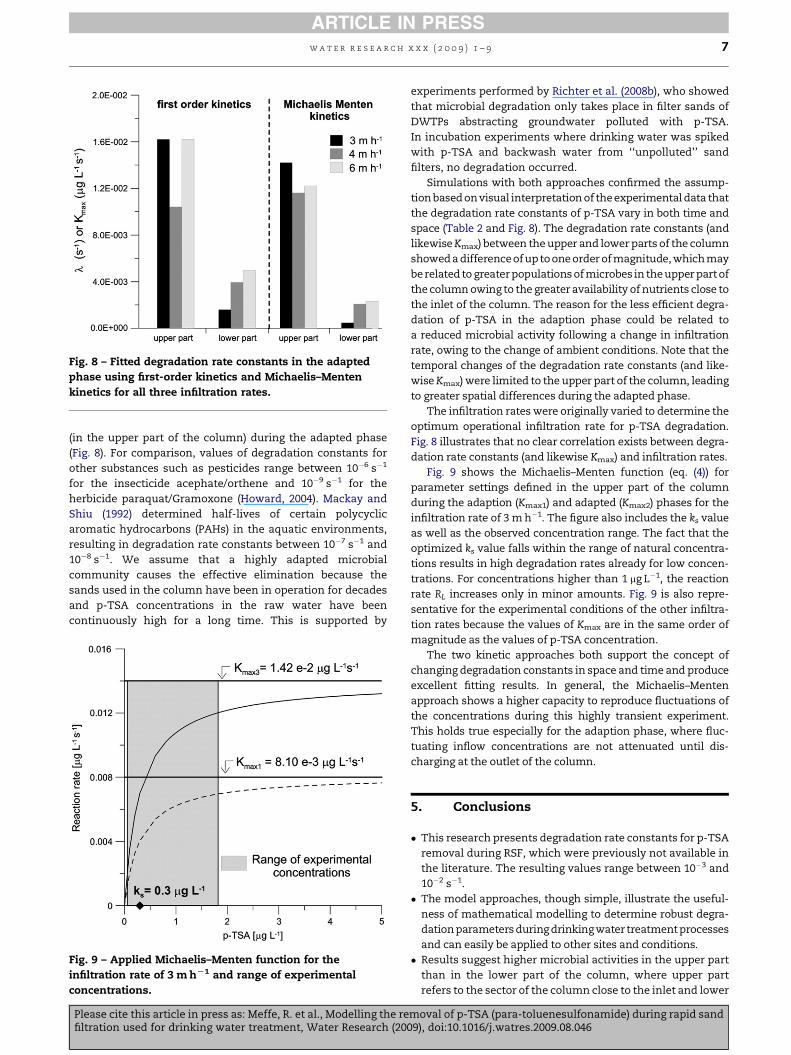
Fig. 8 – Fitted degradation rate constants in the adapted
phase using first-order kinetics and Michaelis–Menten
kinetics for all three infiltration rates.
w a t e r r e s e a r c h x x x ( 2 0 0 9 ) 1 – 9 7
ARTICLE IN PRESS
(in the upper part of the column) during the adapted phase
(Fig. 8). For comparison, values of degradation constants for
other substances such as pesticides range between 10�6 s�1
for the insecticide acephate/orthene and 10�9 s�1 for the
herbicide paraquat/Gramoxone (Howard, 2004). Mackay and
Shiu (1992) determined half-lives of certain polycyclic
aromatic hydrocarbons (PAHs) in the aquatic environments,
resulting in degradation rate constants between 10�7 s�1 and
10�8 s�1. We assume that a highly adapted microbial
community causes the effective elimination because the
sands used in the column have been in operation for decades
and p-TSA concentrations in the raw water have been
continuously high for a long time. This is supported by
Fig. 9 – Applied Michaelis–Menten function for the
infiltration rate of 3 m hL1 and range of experimental
concentrations.
Please cite this article in press as: Meffe, R. et al., Modelling the refiltration used for drinking water treatment, Water Research (200
experiments performed by Richter et al. (2008b), who showed
that microbial degradation only takes place in filter sands of
DWTPs abstracting groundwater polluted with p-TSA.
In incubation experiments where drinking water was spiked
with p-TSA and backwash water from ‘‘unpolluted’’ sand
filters, no degradation occurred.
Simulations with both approaches confirmed the assump-
tion based on visual interpretation of the experimental data that
the degradation rate constants of p-TSA vary in both time and
space (Table 2 and Fig. 8). The degradation rate constants (and
likewise Kmax) between the upper and lower parts of the column
showed a difference of up to one order of magnitude, which may
be related to greater populations of microbes in the upper part of
the column owing to the greater availability of nutrients close to
the inlet of the column. The reason for the less efficient degra-
dation of p-TSA in the adaption phase could be related to
a reduced microbial activity following a change in infiltration
rate, owing to the change of ambient conditions. Note that the
temporal changes of the degradation rate constants (and like-
wise Kmax) were limited to the upper part of the column, leading
to greater spatial differences during the adapted phase.
The infiltration rates were originally varied to determine the
optimum operational infiltration rate for p-TSA degradation.
Fig. 8 illustrates that no clear correlation exists between degra-
dation rate constants (and likewise Kmax) and infiltration rates.
Fig. 9 shows the Michaelis–Menten function (eq. (4)) for
parameter settings defined in the upper part of the column
during the adaption (Kmax1) and adapted (Kmax2) phases for the
infiltration rate of 3 m h�1. The figure also includes the ks value
as well as the observed concentration range. The fact that the
optimized ks value falls within the range of natural concentra-
tions results in high degradation rates already for low concen-
trations. For concentrations higher than 1 mg L�1, the reaction
rate RL increases only in minor amounts. Fig. 9 is also repre-
sentative for the experimental conditions of the other infiltra-
tion rates because the values of Kmax are in the same order of
magnitude as the values of p-TSA concentration.
The two kinetic approaches both support the concept of
changing degradation constants in space and time and produce
excellent fitting results. In general, the Michaelis–Menten
approach shows a higher capacity to reproduce fluctuations of
the concentrations during this highly transient experiment.
This holds true especially for the adaption phase, where fluc-
tuating inflow concentrations are not attenuated until dis-
charging at the outlet of the column.
5. Conclusions
� This research presents degradation rate constants for p-TSA
removal during RSF, which were previously not available in
the literature. The resulting values range between 10�3 and
10�2 s�1.
� The model approaches, though simple, illustrate the useful-
ness of mathematical modelling to determine robust degra-
dation parameters during drinking water treatment processes
and can easily be applied to other sites and conditions.
� Results suggest higher microbial activities in the upper part
than in the lower part of the column, where upper part
refers to the sector of the column close to the inlet and lower
moval of p-TSA (para-toluenesulfonamide) during rapid sand9), doi:10.1016/j.watres.2009.08.046
w a t e r r e s e a r c h x x x ( 2 0 0 9 ) 1 – 98
ARTICLE IN PRESS
part refers to the subsequent column sector. Microbial
activity also appears to be temporally variable depending on
the change of ambient conditions due to the transition
between different infiltration rates.
� The degradation parameters showed only minor variations
for different infiltration rates; therefore an optimal infiltra-
tion rate for the removal process could not be determined.
� Comparison of the two applied kinetic approaches showed
that the Michaelis–Menten approach is clearly more
appropriate for reproducing highly transient experimental
conditions than the more simplistic linear approach.
� Based on this research, some conclusions may be drawn for
the design of treatment plants for p-TSA removal. First,
maintenance of oxic conditions appears to be essential to
guarantee these high degradation rates. Second, the study has
demonstrated that the infiltration rate is not a relevant
parameter to optimize future treatment strategies and to
obtain more favourable degradation rates the infiltration rate
should be maintained constant, avoiding the occurrence of
the adaption phase with lower degradation efficiency. Finally,
results suggested that the vertical thickness of the filter could
be reduced to less than 1 m, because degradation at depths
higher than 0.50 m almost vanishes.
r e f e r e n c e s
Abdel-Shafy, H., Guindi, K.A., Tawfik, N.S., 2008. Groundwatercontamination as affected by long term sewage irrigation inEgypt. Efficient Management of Wastewater, pp. 53–63.
Amondham, W., Parkpian, P., Polprasert, C., Delaune, R.D.,Jugsujinda, A., 2006. Paraquat adsorption, degradation, andremobilization in tropical soils of Thailand. J. Environ. Sci.Health Part B Pest. Food Contam. Agric. Waste 41 (5), 485–507.
Appello, C.A.J., Postma, D., 2007. In: Balkema, A.A. (Ed.),Geochemistry, Groundwater and Pollution Amsterdam, TheNetherlands.
Bechmann,W., Grunewald, K., 1995a. Organic pollutants in soils andsubstrates of the sewage farm area south of Berlin. Zeitschrift furPflanzenernahrung und Bodenkunde 158 (8), 543–548.
Bechmann, W., Grunewald, K., 1995b. PAH profiles in sewagefarm substrates. Chemische Technik. 47 (1), 26–30.
Beljaars, P.R., Vandijk, R., Brands, A., 1994. Determination ofp-toluenesulfonamide in ice-cream by combination ofcontinuous-flow and liquid-chromatography – summaryof collaborative study. J. AOAC. Int. 77 (3), 672–674.
Bengtsson, G., Carlsson, C., 2001a. Contribution of suspended andsorbed groundwater bacteria to degradation of dissolved andsorbed aniline. Appl. Microbiol. Biotechnol. 57 (1–2), 234–241.
Bengtsson, G., Carlsson, C., 2001b. Degradation of dissolved andsorbed 2,4-dichlorophenol in soil columns by suspended andsorbed bacteria. Biodegradation 12 (6), 419–432.
Bennett, G.D., Zheng, C.M., 2002. Applied Contaminant TransportModeling: Theory and Practice. In: Wiley Interscience, vol. 621.John Wiley and Sons, New York.
Bosma, T.N.P., Schnoor, J.L., Schraa, G., Zehnder, A.J.B., 1988.Simulation model for biotransformation of xenobiotics andchemotaxis in soil columns. J. Contam. Hydrol. 2, 225–236.
Comsol Multiphysics, August 2006. Earth Science Module User’sGuide. Version 3.3. ª Copyright 1994-2006 by Comsol Ab.
Corapcioglu, M.Y., Hossain, M.A., Hossain, M.A., 1991.Methanogenic biotransformation of chlorinated hydrocarbonsin ground water. J. Environ. Eng. – ASCE 117 (1), 47–65.
Please cite this article in press as: Meffe, R. et al., Modelling the refiltration used for drinking water treatment, Water Research (20
Daughton, C.G., Ternes, T.A., 1999. Pharmaceuticals and personalcare products in the environment: agents of subtle change?Environ. Health Perspect. 107, 907–938.
Derksen, J.G.M., Rijs, G.B.J., Jongbloed, R.H., 2004. Diffuse pollutionof surface water by pharmaceutical products. Water Sci.Technol. 49 (3), 213–221.
Frederikse, H.P.R., Lide, D.R., 1997. Handbook of Chemistry andPhysics. CRC Press, Boca Raton, FL.
Gaikowski, M.P., Larson, W.J., Steuer, J.J., Gingerich, W.H., 2004.Validation of two dilution models to predict chloramine-Tconcentrations in aquaculture facility effluent. Aquatic. Eng.30 (3–4), 127–140.
Gelhar, L.W., Mantoglou, A., Welty, C., Rehfeldt, K.R., 1985. AReview of Field-Scale Physical Solute Transport Processes inSaturated and Unsaturated Porous Media. Rep. EA-4190.Electro. Power Res. Ins., Palo Alto, CA.
Goedeke, S., Vogt, C., Schirmer, M., 2008. Estimation of kineticmonod parameters for anaerobic degradation of benzene ingroundwater. Environ. Geol. 55 (2), 423–431.
Grummt, T., Dieter, H.H., 2006. Investigation Report on theCompound p-TSA. German Federal Environmental Agency(UBA), Bad-Elster (in German).
Grunewald, K., 1994. Investigations of soils in the large sewagefarm areas south of Berlin. Zeitschrift fur Pflanzenernahrungund Bodenkunde 157 (2), 125–130.
Haneke, K.E., 2002. Toxicological summary for chloramine-T[127-65-1] and p-toluenesulfonamide [70-55-3]. IntegratedLaboratory System. http://ntpserver.niehs.nih.gov/ntp/htdocs/Chem_Background/ExsumPdf/ChloramineT.pdf, pp. 68.
Harris, J.O., Powell, M.D., Attard, M., Green, T.J., 2004. Efficacy ofchloramine-T as a treatment for amoebic gill disease (AGD) inmarine atlantic salmon (Salmo salar L.). Aquac. Res. 35 (15),1448–1456.
Heberer, T., 2002a. Occurrence, fate and removal ofpharmaceutical residues in the aquatic environment: a reviewof recent research data. Toxicol. Lett. 131 (1–2), 5–17.
Heberer, T., 2002b. Tracking persistent pharmaceutical residuesfrom municipal sewage to drinking water. J. Hydrol. 266 (3–4),175–189.
Heberer, T., Stan, H.J., 1994. N-(phenylsulfonyl)-sarcosine a newcontaminant in sewage farm ground-water. Fresen. Environ.Bull. 3 (10), 639–643.
Hohener, P., Dakhel, N., Christophersen, M., Broholm, M.,Kjeldsen, P., 2006. Biodegradation of hydrocarbons vapors:comparison of laboratory studies and field investigations inthe vadose zone at the emplaced fuel source experiment,Airbase Værløse. J. Contam. Hydrol. 88 (3–4), 337–358.
Howard, D., 2004. Pesticide Adsorption and Half-Life. Utah StateUniversity Extension.
Kim, Y., 2007. Aquatic toxicity of acetaminophen,carbamazepine, cimetidine, diltiazem and six majorsulfonamides, and their potential ecological risk in Korea.Environ. Int. 33 (3), 370–375.
Kim, H.S., Jaffe, P.R., 2008. Degradation of toluene by a mixedpopulation of archetypal aerobes, microaerophiles anddenitrifiers: laboratory sand column experiment andmultispecies biofilm model formulation. Biotechnol. Bioeng.99 (2), 290–301.
Kinzelbach, W., Schafer, W., Heryer, J., 1999. Numerical modelingof natural and enhanced denitrification processes in aquifers.Water Resour. Res. 25 (6), 1123–1135.
Knudsen, J.B.S., Aagaard, P., Breedveld, G., 2000. A column studyon reactive transport of dissolved jet-fuel in a sandy aquifer. 1.Biodegradation and mineralization kinetics of the organicsolutes. Groundwater 2000, 175–176.
Loss, R., Wollgast, J., Huber, T., Hanke, G., 2007. Polar herbicides,pharmaceutical products, perfluorooctanesulfate (PFOS),perfluorooctanoate (PFOA), and nonylphenol and its
moval of p-TSA (para-toluenesulfonamide) during rapid sand09), doi:10.1016/j.watres.2009.08.046

w a t e r r e s e a r c h x x x ( 2 0 0 9 ) 1 – 9 9
ARTICLE IN PRESS
carboxylates and ethoxylates in surface and tap watersaround Lake Maggiore in Northern Italy. Anal. Bioanal. Chem.387 (4), 1469–1478.
Mackay, D., Shiu, W.Y., 1992. Polynuclear AromaticHydrocarbons, Polychlorinated Dioxins and Dibenzofurans.In: Illustrated Handbook of Physical–Chemical Properties andEnvironmental Fate of Organic Chemicals, vol. II. LewisPublishers, Boca Raton, FL.
Magga, Z., Tzovolou, D.N., Theodoropoulou, M.A., Dalkarani, T.,Pikios, K., Tsakiroglou, C.D., 2008. Soil column experimentsused as a means to assess transport, sorption andbiodegradation of pesticides in groundwater. J Environ. Sci.Health Part-B Pest. Food Contam. Agric. Waste 43 (8), 732–741.
Meinertz, J.R., Schmidt, L.J., Stehly, G.R., Gingerich, W.H., 1999.Liquid chromatographic determination of para-toluenesulfonamide in edible fillet tissues from three speciesof fish. J. AOAC. Int. 82 (5), 1064–1070.
Michaelis, L., Menten, M.L., 1913. The kinetics of the invertaseactivity. Biochem. Z. 49, 333–369 (in German).
Pang, L.P., Close, M., Flintoft, M., 2005. Degradation and sorptionof atrazine, hexazinone and procymidone in coastal sandaquifer media. Pest. Manag. Sci. 61 (2), 133–143.
Park, J., Chen, M.J., Kukor, J.J., Abriola, L.M., 2001. Influence ofsubstrate exposure history on biodegradation in a porousmedium. J. Contam. Hydrol. 51 (3–4), 233–256.
Richter, D., Duennbier, U., Massmann, G., Pekdeger, A., 2007.Quantitative determination of three sulfonamides inenvironmental water samples using liquid chromatographycoupled to electrospray tandem mass spectrometry. J.Chromatogr. A. 1157 (1–2), 115–121.
Please cite this article in press as: Meffe, R. et al., Modelling the refiltration used for drinking water treatment, Water Research (200
Richter, D., Massmann, G., Dunnbier, U., 2008a. Identification andsignificance of sulphonamides (p-TSA, o-TSA, BSA) in an urbanwater cycle (Berlin, Germany). Water Res. 42 (6–7), 1369–1378.
Richter, D., Massmann, G., Dunnbier, U., 2008b. Behaviour ofsulfonamides (p-TSA, o-TSA, BSA) during drinking watertreatment. Chemosphere 71 (8), 1574–1581.
Richter, D., Massmann, G., Taute, T., Dunnbier, U., 2009.Investigation of the fate of sulfonamides downgradient ofa decommissioned sewage farm near Berlin, Germany. J.Contam. Hydrol. 106, 183–194.
Rooklidge, S.J., Burns, E.R., Bolte, J.P., 2004. Modelingantimicrobial contaminant removal in slow sand filtration.Water Res. 39 (2–3), 331–339.
Sabbagh, G.J., Fox, G.A., Ma, L., 2007. Modeling pesticide fate andnonideal transport from seed treated with a slow-releasepesticide in a laboratory column. Trans. ASABE 50 (2), 523–532.
Sato, T., Kimura, Y., Takamizawa, K., 2002. Modeling transportand biodegradation of PCE in sandy soil. 1st Conference onBrownfields Site: assessment, Rehabilitation andDevelopment. Brownfields Site: Assessment, Rehabilitationand Development, pp. 515–524.
Smail, D.A., Grant, R., Simpson, D., Bain, N., Hastings, T.S., 2004.Disinfectants against cultured Infectious Salmon Anaemia(ISA) virus: the virucidal effect of three iodophors,chloramines-T, chlorine dioxide and peracetic acid/hydrogenperoxide/acetic acid mixture. Aquaculture 240 (1–4), 29–38.
Yu, J.T., Bouwer, E.J., Coelhan, M., 2006. Occurrence andbiodegradability studies of selected pharmaceuticals andpersonal care products in sewage effluent. Agric. WaterManag. 82 (1–2), 72–80.
moval of p-TSA (para-toluenesulfonamide) during rapid sand9), doi:10.1016/j.watres.2009.08.046