Modelling the energy demands of aerobic and anaerobic membrane bioreactors (MBRs) for wastewater...
13
This article was downloaded by: [Cranfield University] On: 13 June 2012, At: 01:29 Publisher: Taylor & Francis Informa Ltd Registered in England and Wales Registered Number: 1072954 Registered office: Mortimer House, 37-41 Mortimer Street, London W1T 3JH, UK Environmental Technology Publication details, including instructions for authors and subscription information: http://www.tandfonline.com/loi/tent20 Modelling the energy demands of aerobic and anaerobic membrane bioreactors for wastewater treatment I. Martin a , M. Pidou b , A. Soares c , S. Judd c & B. Jefferson c a Universidad Politécnica de Valencia, Valencia, Spain b Advanced Water Management Centre, The University of Queensland, Brisbane, Australia c Cranfield Water Science Institute, Cranfield University, Cranfield, UK Available online: 27 May 2011 To cite this article: I. Martin, M. Pidou, A. Soares, S. Judd & B. Jefferson (2011): Modelling the energy demands of aerobic and anaerobic membrane bioreactors for wastewater treatment, Environmental Technology, 32:9, 921-932 To link to this article: http://dx.doi.org/10.1080/09593330.2011.565806 PLEASE SCROLL DOWN FOR ARTICLE Full terms and conditions of use: http://www.tandfonline.com/page/terms-and-conditions This article may be used for research, teaching, and private study purposes. Any substantial or systematic reproduction, redistribution, reselling, loan, sub-licensing, systematic supply, or distribution in any form to anyone is expressly forbidden. The publisher does not give any warranty express or implied or make any representation that the contents will be complete or accurate or up to date. The accuracy of any instructions, formulae, and drug doses should be independently verified with primary sources. The publisher shall not be liable for any loss, actions, claims, proceedings, demand, or costs or damages whatsoever or howsoever caused arising directly or indirectly in connection with or arising out of the use of this material.
Transcript of Modelling the energy demands of aerobic and anaerobic membrane bioreactors (MBRs) for wastewater...

This article was downloaded by: [Cranfield University]On: 13 June 2012, At: 01:29Publisher: Taylor & FrancisInforma Ltd Registered in England and Wales Registered Number: 1072954 Registered office: Mortimer House,37-41 Mortimer Street, London W1T 3JH, UK
Environmental TechnologyPublication details, including instructions for authors and subscription information:http://www.tandfonline.com/loi/tent20
Modelling the energy demands of aerobic andanaerobic membrane bioreactors for wastewatertreatmentI. Martin a , M. Pidou b , A. Soares c , S. Judd c & B. Jefferson ca Universidad Politécnica de Valencia, Valencia, Spainb Advanced Water Management Centre, The University of Queensland, Brisbane, Australiac Cranfield Water Science Institute, Cranfield University, Cranfield, UK
Available online: 27 May 2011
To cite this article: I. Martin, M. Pidou, A. Soares, S. Judd & B. Jefferson (2011): Modelling the energy demands of aerobicand anaerobic membrane bioreactors for wastewater treatment, Environmental Technology, 32:9, 921-932
To link to this article: http://dx.doi.org/10.1080/09593330.2011.565806
PLEASE SCROLL DOWN FOR ARTICLE
Full terms and conditions of use: http://www.tandfonline.com/page/terms-and-conditions
This article may be used for research, teaching, and private study purposes. Any substantial or systematicreproduction, redistribution, reselling, loan, sub-licensing, systematic supply, or distribution in any form toanyone is expressly forbidden.
The publisher does not give any warranty express or implied or make any representation that the contentswill be complete or accurate or up to date. The accuracy of any instructions, formulae, and drug doses shouldbe independently verified with primary sources. The publisher shall not be liable for any loss, actions, claims,proceedings, demand, or costs or damages whatsoever or howsoever caused arising directly or indirectly inconnection with or arising out of the use of this material.

Environmental Technology
Vol. 32, No. 9, July 2011, 921–932
ISSN 0959-3330 print/ISSN 1479-487X online© 2011 Taylor & FrancisDOI: 10.1080/09593330.2011.565806http://www.informaworld.com
REVIEW ARTICLEModelling the energy demands of aerobic and anaerobic membrane bioreactors
for wastewater treatment
I. Martin
a
, M. Pidou
b
, A. Soares
c
*, S. Judd
c
and B. Jefferson
c
a
Universidad Politécnica de Valencia, Valencia, Spain;
b
Advanced Water Management Centre, The University of Queensland, Brisbane, Australia;
c
Cranfield Water Science Institute, Cranfield University, Cranfield, UK
Taylor and Francis
(
Received 21 January 2011; Accepted 21 February 2011
)
10.1080/09593330.2011.565806
A modelling study has been developed in which the energy requirements of aerobic and anaerobic membranebioreactors (MBRs) are assessed in order to compare these two wastewater treatment technologies. The model tookinto consideration the aeration required for biological oxidation in aerobic MBRs (AeMBRs), the energy recoveryfrom methane production in anaerobic MBRs (AnMBRs) and the energy demands of operating submerged andsidestream membrane configurations. Aeration and membrane energy demands were estimated based on previouslydeveloped modelling studies populated with operational data from the literature. Given the difference in sludgeproduction between aerobic and anaerobic systems, the model was benchmarked by assuming high sludge retentiontimes or complete retention of solids in both AeMBRs and AnMBRs. Analysis of biogas production in AnMBRsrevealed that the heat required to achieve mesophilic temperatures (35
°
C) in the reactor was only possible withinfluent wastewater strengths above 4–5 g COD L
−
1
. The general trend of the submerged configuration, which is lessenergy intensive than the sidestream configuration in aerobic systems, was not observed in AnMBRs, mainly due tothe wide variation in gas demand utilized in anaerobic systems. Compared to AeMBRs, for which the energyrequirements were estimated to approach 2 kWh m
−
3
(influent up to 1 g COD L
−
1
), the energy demands associatedwith fouling control in AnMBRs were lower (0.80 kWh m
−
3
for influent of 1.14 g COD L
−
1
), although due to the lowfluxes reported in the literature capital costs associated with membrane material would be three times higher than this.
Keywords:
energy; membrane bioreactors; submerged; sidestream; crossflow
1. Introduction
Aerobic membrane bioreactors represent a specificsubset of bioreactor technology in which the membranereplaces alternative means of solid–liquid separation,such as a gravity sedimentation tank. The inclusion of amembrane results in the complete uncoupling of thehydraulic and sludge retention times, providing greateroperational flexibility and the potential to intensify thebiological process. The advantages and disadvantages ofMBRs are often quoted [1], but perhaps their key advan-tages are improved effluent quality and lower sludgeproduction. Their disadvantage is membrane fouling,with an associated high energy demand. Despite thisdisadvantage, several studies have shown that themembrane bioreactor market is expected to grow inindustrial and municipal applications, both in Europe [2]and in North America [3]. The principal applicationsdriving market growth relate to situations where tighteffluent consents have to be met, a small footprint is
required, robust disinfection is required or the water isto be reused [1].
Anaerobic biological processes are mainly appliedto high strength industrial wastewaters at mesophilictemperatures as an alternative to aerobic treatment.Their use results from the lower energy demand due tothe absence of aeration [4], the possibility of recoveringenergy from the methane in the biogas produced, andreduced biomass production and its associated disposalcosts. However, the main drawbacks of anaerobic treat-ment are the lower quality effluent generated, especiallywhen operating with low strength wastewaters (0.3–0.7g COD L
−
1
) at low temperatures (8–25
°
C), the possibil-ity of generating odours, and the need for downstreamnutrient removal. Traditionally, anaerobic reactors haveutilized granular sludge as a method of biomass reten-tion [5], although in more recent studies the potentialfor using membranes has been discussed [6]. In partic-ular, benefit has been reported from their high solids
*Corresponding author: Email: [email protected]
Dow
nloa
ded
by [
Cra
nfie
ld U
nive
rsity
] at
01:
29 1
3 Ju
ne 2
012

922
I. Martin
et al.
retention, even at low temperatures, and the rejection ofhigh molecular weight organics, which are furtherdegraded and which would otherwise be lost in theeffluent.
Translating the concept to municipal wastewatertreatment, the adoption of anaerobic membrane bioreac-tors (AnMBRs) will result in a reduction both in energyusage and in sludge production. Given the currentdemand to reduce the energy and carbon footprint ofwastewater treatment, consideration of AnMBRs seemstimely. Recent reviews concerned with AnMBRs havelooked at the impact of operational factors on biologicalperformance [7] and the parameters affecting membraneflux [8]. The main conclusion drawn from these reviewsis the need to assess the feasibility of both sidestreamand submerged configurations to arrive at optimumfouling control strategies and minimize the overallenergy demand.
The current study addresses this point by compar-ing energy balances for AnMBRs and aerobicmembrane bioreactors (AeMBRs) for the treatment oflow strength municipal wastewater. The aim of thestudy has been to establish the overall changes inenergy that are to be expected, as well as identifyingthe critical components controlling the overall energybalance, in order to indicate where future improve-ments may be achieved.
2. Model development
The overall assessment compares the energy balanceacross. AeMBRs and AnMBRs. The main componentsof the model have included: biological aeration(AeMBRs), energy recovery from methane production(AnMBRs) and energy demands associated with theoperation of either a sidestream or a submerged system.
The aeration and membrane energy demands ofsubmerged systems have been estimated based onmodel studies previously developed [9,10]. In the caseof sidestream configuration energy demands for sludgepumping, these were estimated based on pressure losscalculations along the membrane modules using a previ-ously validated rheological model [11]. Wherever possi-ble the new models have been populated with publishedoperational data from the literature, and standardassumptions have been made where necessary.
2.1. Biological aeration
Aeration demand for AeMBRs were based on the modelof Verrecht
et al.
[10], adapted to using literature dataas input parameters instead of direct kinetic modellingof the biological reactor. Aeration energy was calcu-lated with respect to the oxygen consumed (MO
2
) byheterotrophic (organic pollutant oxidation) andautotrophic (nitrifying) bacteria, taking into account theoxygen reduction due to denitrification in the anoxiczones of the bioreactor (Equation (1)).
where
Q
represents the influent flow (L d
−
1
) and COD
IN
and COD
EFF
are the influent and effluent COD concen-trations, respectively (mg COD L
−
1
). The remainingterms are related to the oxygen required for nitrificationestimated from the difference between total influent andeffluent nitrogen (TN
IN
and TN
EFF
, respectively), andalso taking into account the amount of oxygen saved bydenitrification calculated on the effluent nitrate concen-tration, NO
3
−
EFF
(mg NO
3
−
–N L
−
1
). Sludge wastage is
M Q
Q Q
O COD COD
TN TN NOIN EFF
IN EFF EFF
2
3
4 33
2 83 1
= − +− −( ) .
( ) . ,, ( )
Table 1. AeMBR case studies and respective operational conditions utilized to calculate energy demand [12–15].
Parameter Units Innocenti
et al.
[12] Laera
et al.
[13] Rosenberger
et al.
[14] Teck
et al.
[15]
Volume
L 1400 6 3500 20
HRT
h 14 8 14 8
SRT
d
∞ ∞ ∞
300
MLSS
g L
−
1
16.6 22.9 16 18
MLVSS
g L
−
1
8.7 17.2 11.2 16
COD
IN
mg L
−
1
300 400 790 1000
COD
EFF
mg L
−
1
19 57 10 5
TN
IN
mg L
−
1
42.2 49.3 65.8 10.0
TN
EFF
mg L
−
1
2 0.8 13 0.3
NO
3
−−−−
EFF
mg L
−
1
11.3 40.6 13 0.3
HRT: hydraulic retention time; SRT: sludge retention time; MLSS: mixed liquid suspended solids; MLVSS: mixed liquid volatile solids; COD
IN
:chemical oxygen demand of the influent; COD
EFF
: chemical oxygen demand of the effluent; TN
IN
: total nitrogen in the influent; TN
EFF
: totalnitrogen in the effluent; NO
3
−
EFF
: total nitrate in the effluent.
Dow
nloa
ded
by [
Cra
nfie
ld U
nive
rsity
] at
01:
29 1
3 Ju
ne 2
012
Environmental Technology
923
not included in the COD balance, since AeMBRs oper-ating at high sludge retention times (SRTs) or withcomplete retention of solids, were principally consid-ered in order to provide a direct benchmark for theanaerobic systems [12–15] (Table 1).
In the case of submerged MBRs, biological aerationdemands, represented by
Q
air,bio
(Equation (2)), wereestimated considering the contribution of membranegas scouring (
M
O
2,MEM
) (Equation (3)) to the overalloxygen requirement (
M
O
2
)
,
taking into account that theair flow required to control fouling (
Q
air,MEM
) wasprovided by coarse bubble diffusers, which are moreeffective in their scouring effect than fine bubblediffusers, but offer lower oxygen transfer efficiency[10].
where
β
and
γ
are oxygen transfer efficiency factors,taken as 0.95 and 0.89, respectively [10]. Oxygen trans-fer efficiencies (OTEs) of 0.02 and 0.05 were assumedfor membrane coarse bubble aeration and biologicalfine bubble diffusers, while the factor,
α
, whichaccounts for the oxygen transfer efficiency, relates tothe mixed liquid suspended solids (MLSS) concentra-tion, according to Equation (4) [16].
The power requirements associated with biological aera-tion (
E
air,bio
) were obtained from the power consumptionof a blower (Equation (5)) delivering the correspondingair flow at the static pressure of the liquid column in themembrane tank (
h
), which was considered to be 2 mwherever it was not reported directly.
In Equation (5),
ξ
represents the blower efficiency(60%),
ρ
is the air density,
g
is the gravity constant and
λ
is the heat capacity ratio, which has a value of 1.4 forair and 1.3 for biogas.
2.2. Methane production
Under anaerobic conditions, biodegradation of organicstakes place without the need for oxygen or nitrate aselectron acceptor. The end-products are mainly meth-ane and carbon dioxide, which can either be recoveredas biogas or are dissolved in the effluent. The energyassociated with methane production in AnMBRs hasbeen calculated from the biogas production datareported in the literature, assuming an energy content of36500 kJ m
−
3
in the biogas produced [17]. The highestmethane yields reported for AnMBRs treating lowstrength wastewater range between 0.29 and 0.33 L CH
4
g
−
1
COD [18,19], and are given in studies in whichsoluble and completely biodegradable substrate wereemployed as influent at mesophilic temperatures (35–37
°
C). Lower methane yields of 0.12 and 0.08–0.09 LCH
4
g
−
1
COD [20,21] have been reported for syntheticwastewaters, but at temperatures ranging between 11–25
°
C and 25–30
°
C, respectively, highlighting theimportance of temperature in the production and recov-ery of biogas. Variable degrees of methanisation inAnMBRs treating actual influents have ranged between0.20–0.23 L CH
4
g
−
1
COD for screened wastewater[22], 0.27 L CH
4
g
−
1
COD for raw wastewater [23] and0.09–0.12 L CH
4
g
−
1
COD for black water [24].
2.3. Membrane energy demands in submerged and sidestream configuration
Energy demands associated with membrane operationin AeMBRs and AnMBRs were divided into compo-nents related to permeate pumping (
E
PER
), and to foul-ing control (
E
FC
). In submerged MBRs, membranes areimmersed in the mixed liquor and gas is spargedbelow the membrane module in the form of air orbiogas, in the case of AeMBRs and AnMBRs, respec-tively. In sidestream pumped crossflow operation themembrane module is located outside the bioreactorand the mixed liquor is pumped through the membranemodule and recycled back to the bioreactor. Thisprovides enough turbulence to enhance the back trans-port of foulants from its surface, thus reducingmembrane fouling. Although sidestream MBRs areusually operated at constant pressure, with the pumpgenerating both the liquid crossflow and the drivingforce for permeation, for direct comparison all systemswere assumed to utilize permeate pumping, irrespec-tive of system configuration. The energy required for
E
PER
was calculated as the product of permeate flow(
Q
p
) and the transmembrane pressure (TMP) (Equation(6)).
QM M
air,bio
O O
OTE=
−⋅ ⋅ ⋅ ⋅ ⋅
2 2
0 21 10002
,
.,
MEM
α β γ( )
MO OTE QMEM MEM air MEM2 0 21 1000 3, ,. ,= ⋅ ⋅ ⋅ ⋅ ⋅ ⋅α β γ ( )
α = −e 0 082 4. MLSS ( )
E
p g hQ
air bio
air bio
,
( )
,
:
( )= ⋅
⋅ −
⋅ ⋅ +
−
⋅ ⋅
−
108 748
1
101325
1013211 5
11
λξ λ
λ( )
E QPER p TMP= ( )6
Dow
nloa
ded
by [
Cra
nfie
ld U
nive
rsity
] at
01:
29 1
3 Ju
ne 2
012

924 I. Martin et al.
The energy required for fouling control (EFC) wasfurther subdivided into pumping (EFC,P) and gas sparg-ing (EFC,G) for pumped crossflow and submergedconfigurations, respectively. The power consumptionrequired for fouling control in submerged configuration(EFC,G) was obtained by replacing the biologicalaeration requirements (Qair,bio) in Equation (5) by themembrane gas demand (QGAS,MEM), calculated accord-ing to Equation (7):
where SGDm denotes the specific gas demand normal-ized against membrane area (m3 m−2 h−1), which isequivalent to the specific aeration demand (SADm)
employed in aerobic systems, and Am representsmembrane filtration area. Although different relation-ships between flux and specific gas demand required(SGDm) have been proposed in AeMBRs [1,10], stan-dard 50% intermittent gas sparging intensities of 0.3and 0.5 m3 m−2 h−1 were employed for fluxes below andabove 15 L m−2 h−1 (LMH), respectively, for the aerobiccase studies shown in Table 1, all of which employedhollow fibre membranes. In the case of AnMBRs, theSGDm reported in the different case studies was used toestimate the energy demands for fouling control in thesubmerged configuration.
In the pumped sidestream configuration the energyassociated with fouling control was calculated as theproduct of the tangential flow (QCFV) (m3 s−1) throughthe membrane, and the pressure loss ∆P (Pa), assuminga pump efficiency (ξ of 60% (Equation (8)).
where QCFV was obtained from the crossflow velocity(CFV, m s−1), and the cross-sectional area (Sm) wascalculated from the geometric characteristics of themembrane modules reported in different case studies.Pressure losses (∆P) were estimated using the Darcy–Weisbach equation (Equation (9)), using the diameter(D) and length (L) of the membrane module, and theFanning friction factor (f) was calculating according toColebrook’s relationship (Equation (10)). Chilton andStainsby [11] introduced a modified Reynolds number(RE) (Equation (11)), in which the effective viscositywas calculated at the wall and which could be applied tothe general Herschel–Bulkley model based on the previ-ously defined generalized Reynolds number [25]. Theparameter X obtained by solving Equation (11) repre-sents the ratio between the yield stresses of the sludge(τB) and the shear stress at the membrane wall (τw).
Comparison of theoretical results based on rheologicalcharacterization of wastewater sludges and kaolin slur-ries were able to predict to within 15% the experimen-tally measured pressure drop for crossflow velocitiesbetween 0.1 m s−1 and 6 m s−1, and therefore appearappropriate for the present case.
The rheological parameters were obtained from thecharacterization of AeMBR and AnMBR sludge givenby Laera et al. [26] and Pevere et al. [27], respectively,in which the Bingham shear stress (τB) (Pa) and viscos-ity (µB) (Pa s) were reported to increase with biomassconcentration according to Equations (13) [26] and (14)[27]. A Bingham plastic rheological model waspreferred to represent the behaviour of MBR sludgebased on constant viscosity presented in different stud-ies at shear rates exceeding 100–500 s−1 [26,27,29].Additionally, adoption of the power law models whichhave been also been proposed [26–29], resulted in adecrease in frictional pressure losses with increasingsolid concentrations due to the more prominent shearthinning behaviour that both aerobic and anaerobicsludges present when fitted to this rheological model.
3. Results and discussion
3.1. Energy balances in aerobic and anaerobic MBRs
Analysis of the energy demands in AeMBRs withcomplete sludge retention shows that, irrespective of theorganic load applied, the total energy demand approaches2 kWh m−3 for wastewater of 0.4 g COD L−1 strength orabove (Figure 1).Figure 1. Membrane (grey bars) and aeration (white bars) energy demands in AeMBRs with complete sludge retention, calculated using published operational data [12,14,15,26] for wastewater strength between 0.30 and 1.00 g COD L −1.The aeration required for biological pollutant oxida-tion represents as much as 88–93% of the total energy
Q AGAS MEM m mSGD, ,= ⋅ ( )7
EQ p S p
CF PCFV mCFV
, ,=⋅
=⋅ ⋅∆ ∆
ξ ξ( )8
∆Pp f
DL=
4
29
2CFVturbulent conditions( ), ( )
f f− = ′ −0 510
0 54 0 4 10. .log ( ) . ,RE ( )
RERE
=−( )
,1
114X
( )
τ µW X X X X= − − − −− −B( ) ( ) .1 1
1
3
1
3
1
3121 2 3 1 ( )
µτ
B
B
MLSS
MLSS
== +
0 02894
0 001 0 233 1 13
.
. ( . ), ( )
µ τBMLSS
BMLSSe e= =0 001 0 067 140 04 0 07. . .. . ( )
Dow
nloa
ded
by [
Cra
nfie
ld U
nive
rsity
] at
01:
29 1
3 Ju
ne 2
012

Environmental Technology 925
demand, except for the lowest influent COD concentra-tion modelled, 0.3 g COD L−1, in which membraneaeration provided 40% of the biological oxygen require-ments and accounted for 60% of the total energy demand(1.2 kWh m−3). Operation of AeMBRs at high sludgeage, or even complete retention of solids, would avoidthe high cost of sludge treatment and disposal, which canrepresent between 40% and 60% of total cost [30], with-out having a negative effect on biological performance[13–15,31]. The high levels of MLSS accumulated in thesystem result in a high energy requirement, due to thereduction in aeration efficiency to below 20% [16,31].As a result, in order to optimize operational costs, aero-bic membrane bioreactors treating municipal wastewaterare usually operated at hydraulic retention times below12 h and variable sludge retention times of between 15and 50 days, which are intended to achieve mixed liquorconcentrations between 8 and 12 g MLSS L−1 [1,10].Different surveys have estimated their energy require-ments to range between 0.6 and 1.2 kWh m−3 [32] distrib-uted between membrane (60–70%) and biologicalaeration (30–40%). Consequently, an additional 0.8–1.4kWh m−3 of energy is required to operate an AeMBR atlow biomass production.
Results from model calculations reveal that theenergy demands in submerged AnMBRs range from0.03 to 5.7 kWh m−3 (Figure 2). Such variability inenergy requirements for fouling control arises as a resultof the wide range of gas demands, reported in submergedconfiguration between effectively no gas sparging[20,22,33] and 3 MLH [18,34]. In sidestream AnMBRs
energy demands range between 0.23 and 16.52 kWh m−3
(Figure 3), the variation being attributed to the impact ofcrossflow velocity and bioreactor MLSS on flux andpressure losses. In contrast to AeMBRs, energy demandsfor submerged and sidestream AnMBR systems arewithin the same range, due to the higher fluxes reportedfor crossflow systems, and also to the uncertainty ofappropriate gas sparging rates that result in sustainablemembrane operation in the submerged configuration,which will be discussed in the following section.Figure 2. Membrane energy demand (grey bars) and energy produced from biogas converted to heat (white bars) in submerged AnMBRs with complete sludge retention, for wastewater strength between 0.27 and 10.00 g COD L −1 [18,20–22,24,35,36]. The horizontal dashed line indicatesthe amount of energy required to heat the reactor to 35 °C from an influent wastewater temperature of 15 °C, taking into account that 50% of the energy could be recovered by heating the influent with the permeate.Figure 3. Membrane energy demand (grey bars) and energy produced from biogas converted to heat (white bars) in sidestream AnMBRs with complete sludge retention, for wastewater strength between 0.27 and 10.00 g COD L −1 [19,23,50]. The horizontal dashed line indicates the amountof energy required to heat the reactor to 35 °C from an influent wastewater temperature of 15 °C, taking into account that 50% of the energy could be recovered by heating the influent with the permeate.However, data given in the literature indicate thatthe available (electrical) energy produced ranges from0.15 to 0.3 kWh m−3 as the wastewater strengthincreases from 0.24 to 1.14 g COD L−1 [22,24], demon-strating that the methane generated (expressed as heat inFigures 2 and 3) is sufficient to recover a significantproportion of the total energy demand for wastewatertreatment, and even offset the energy demand associ-ated to fouling control.
It is important to note that the reported methaneproduction in some studies [18,19,23,24,35] has beenobtained at mesophilic temperatures, and thereforelower biogas production can be expected at ambientwastewater temperatures (8–25°C) in temperateclimates, given that biogas production from lowstrength wastewater is insufficient to provide enoughenergy to allow the reactor to be heated to 35°C. This isillustrated by horizontal lines in Figures 2 and 3, whichindicate the amount of energy required to heat the reac-tor to 35°C from an influent wastewater temperature of15°C, taking into account that 50% of the energy could
Figure 1. Membrane (grey bars) and aeration (white bars) energy demands in AeMBRs with complete sludge retention, calcu-lated using published operational data [12,14,15,26] for wastewater strength between 0.30 and 1.00 g COD L−1.
Dow
nloa
ded
by [
Cra
nfie
ld U
nive
rsity
] at
01:
29 1
3 Ju
ne 2
012

926 I. Martin et al.
be recovered by heating the influent with the permeate.The heat recovered from biogas increases from 0.62 to34.8 kWh m−3 as wastewater strength increases from0.24 g to 10 g COD L−l [20,36]. For domestic wastewa-
ter applications it therefore is energetically preferable tooperate without heating, as the energy required to heatthe reactor is only achieved for influent COD concen-trations above 4–5 g COD L−1.
Figure 2. Membrane energy demand (grey bars) and energy produced from biogas converted to heat (white bars) in submergedAnMBRs with complete sludge retention, for wastewater strength between 0.27 and 10.00 g COD L−1 [18,20–22,24,35,36]. Thehorizontal dashed line indicates the amount of energy required to heat the reactor to 35°C from an influent wastewater temperatureof 15°C, taking into account that 50% of the energy could be recovered by heating the influent with the permeate.
Figure 3. Membrane energy demand (grey bars) and energy produced from biogas converted to heat (white bars) in sidestreamAnMBRs with complete sludge retention, for wastewater strength between 0.27 and 10.00 g COD L−1 [19,23,37]. The horizontaldashed line indicates the amount of energy required to heat the reactor to 35°C from an influent wastewater temperature of 15°C,taking into account that 50% of the energy could be recovered by heating the influent with the permeate.
Dow
nloa
ded
by [
Cra
nfie
ld U
nive
rsity
] at
01:
29 1
3 Ju
ne 2
012
Environmental Technology 927
For high strength wastewaters, methane productionnot only covers the heat balance but can also generate5–20 kWh m−3 of electrical power for export [38].Indeed, commercial applications of AnMBR technology,employing both sidestream and submerged membranes,have been developed for different industrial and agricul-tural wastes. For example, the Biorek process developedin Denmark by BIOSCAN A/S [39] comprises ananaerobic digester, coupled to sidestream crossflowmembrane filtration to remove organic pollutants, andthe effluent is treated by reverse osmosis to recover cleanwater and a nutrient-rich concentrate. More recently,Kubota has commercialized a submerged anaerobicmembrane fermentation unit (KSAMBR) for applicationto distillery wastewaters, solid waste bio-gasificationfacilities and food processing factories, with the advan-tage of reducing the carbon footprint of the digester tobetween one-third and one-fifth that of a conventionaldigester, while reducing the organic load of aerobic post-treatment polishing [40]. A specific case study of thetreatment of high strength Shochu wastewater with anorganic and volatile solids concentrations of 182 g CODKg−1
residue and 34 g VS L−1, respectively, showed that 12GJ d−1 were generated, and that electricity consumptionaccounted for a quarter of this energy.
3.2. Impact of operational parameters on the energy requirements of submerged AeMBRs and AnMBRs
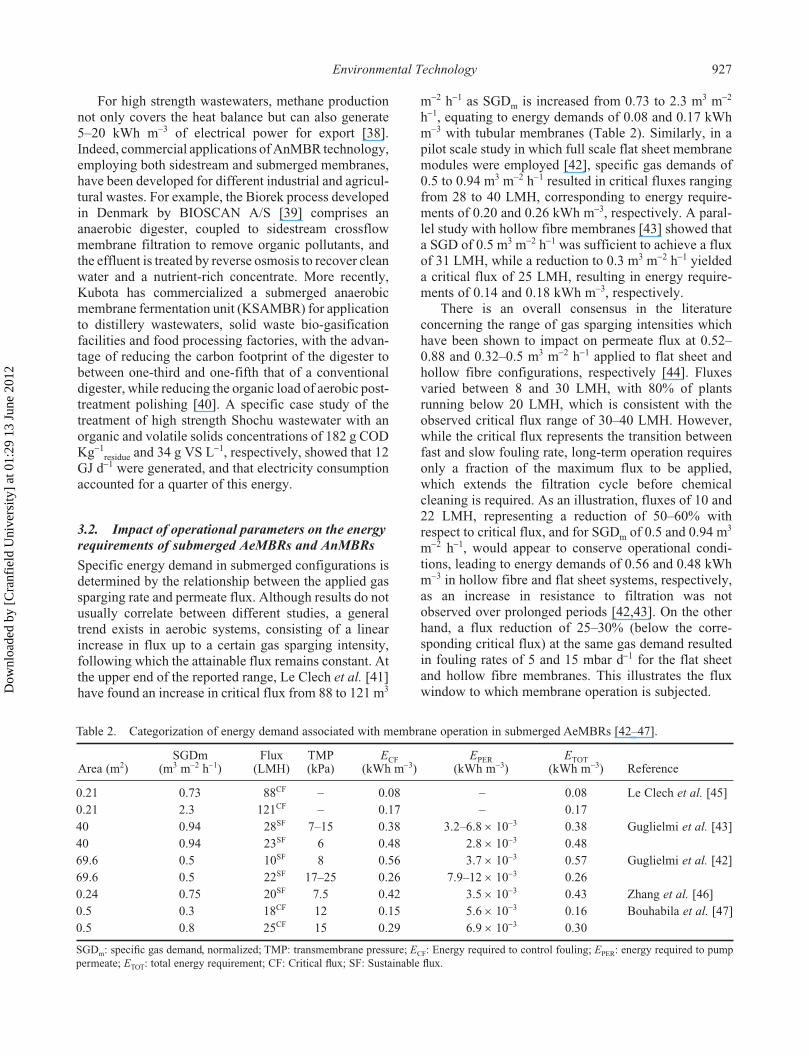
Specific energy demand in submerged configurations isdetermined by the relationship between the applied gassparging rate and permeate flux. Although results do notusually correlate between different studies, a generaltrend exists in aerobic systems, consisting of a linearincrease in flux up to a certain gas sparging intensity,following which the attainable flux remains constant. Atthe upper end of the reported range, Le Clech et al. [41]have found an increase in critical flux from 88 to 121 m3
m−2 h−1 as SGDm is increased from 0.73 to 2.3 m3 m−2
h−1, equating to energy demands of 0.08 and 0.17 kWhm−3 with tubular membranes (Table 2). Similarly, in apilot scale study in which full scale flat sheet membranemodules were employed [42], specific gas demands of0.5 to 0.94 m3 m−2 h−1 resulted in critical fluxes rangingfrom 28 to 40 LMH, corresponding to energy require-ments of 0.20 and 0.26 kWh m−3, respectively. A paral-lel study with hollow fibre membranes [43] showed thata SGD of 0.5 m3 m−2 h−1 was sufficient to achieve a fluxof 31 LMH, while a reduction to 0.3 m3 m−2 h−1 yieldeda critical flux of 25 LMH, resulting in energy require-ments of 0.14 and 0.18 kWh m−3, respectively.
There is an overall consensus in the literatureconcerning the range of gas sparging intensities whichhave been shown to impact on permeate flux at 0.52–0.88 and 0.32–0.5 m3 m−2 h−1 applied to flat sheet andhollow fibre configurations, respectively [44]. Fluxesvaried between 8 and 30 LMH, with 80% of plantsrunning below 20 LMH, which is consistent with theobserved critical flux range of 30–40 LMH. However,while the critical flux represents the transition betweenfast and slow fouling rate, long-term operation requiresonly a fraction of the maximum flux to be applied,which extends the filtration cycle before chemicalcleaning is required. As an illustration, fluxes of 10 and22 LMH, representing a reduction of 50–60% withrespect to critical flux, and for SGDm of 0.5 and 0.94 m3
m−2 h−1, would appear to conserve operational condi-tions, leading to energy demands of 0.56 and 0.48 kWhm−3 in hollow fibre and flat sheet systems, respectively,as an increase in resistance to filtration was notobserved over prolonged periods [42,43]. On the otherhand, a flux reduction of 25–30% (below the corre-sponding critical flux) at the same gas demand resultedin fouling rates of 5 and 15 mbar d−1 for the flat sheetand hollow fibre membranes. This illustrates the fluxwindow to which membrane operation is subjected.
Table 2. Categorization of energy demand associated with membrane operation in submerged AeMBRs [42–47].
Area (m2)SGDm
(m3 m−2 h−1)Flux
(LMH)TMP (kPa)
ECF (kWh m−3)
EPER (kWh m−3)
ETOT(kWh m−3) Reference
0.21 0.73 88CF – 0.08 – 0.08 Le Clech et al. [45]0.21 2.3 121CF – 0.17 – 0.1740 0.94 28SF 7–15 0.38 3.2–6.8 × 10⁻³ 0.38 Guglielmi et al. [43]40 0.94 23SF 6 0.48 2.8 × 10⁻³ 0.4869.6 0.5 10SF 8 0.56 3.7 × 10⁻³ 0.57 Guglielmi et al. [42]69.6 0.5 22SF 17–25 0.26 7.9–12 × 10−3 0.260.24 0.75 20SF 7.5 0.42 3.5 × 10⁻³ 0.43 Zhang et al. [46]0.5 0.3 18CF 12 0.15 5.6 × 10⁻³ 0.16 Bouhabila et al. [47]0.5 0.8 25CF 15 0.29 6.9 × 10⁻³ 0.30
SGDm: specific gas demand, normalized; TMP: transmembrane pressure; ECF: Energy required to control fouling; EPER: energy required to pumppermeate; ETOT: total energy requirement; CF: Critical flux; SF: Sustainable flux.
Dow
nloa
ded
by [
Cra
nfie
ld U
nive
rsity
] at
01:
29 1
3 Ju
ne 2
012

928 I. Martin et al.
Information concerning the operational significanceof sparging rates in submerged AnMBRs is currentlyless clear. Critical flux analysis has revealed that gassparging is less effective for enhancing permeate fluxcompared to AeMBRs, due to the presence of highconcentrations of colloidal matter and fine solids inanaerobic biomass [24,36,49]. Increasing specific gasdemands from 0.78 to 3.76 m3 m−2 h−1 increased thecritical flux from 6 to 10 LMH. This is consistent withthe literature data (Table 3), which show that whilefluxes range only between 5 and 10 LMH, specific gasdemands as high as 3 m3 m−2 h−1 have been quoted[18,34]. Although such high gas sparging intensitylevels have extended membrane operation, they do notresult in an increase in permeability. At the highestSGDm of 3 m3 m−2 h−1, equivalent to an energydemand of 3.43 kWh m3, a stable permeability of 20LMH bar−1 was observed over 90 days’ operation [18],while a higher permeability of 60–70 LMH bar−1 wasreported during 450 h in a mesophilic AnMBR treatingethanol at a specific gas demand of 1.5 m3 m−2 h−1 [36],equating to an energy demand of 1.9 kWh m−3. A foul-ing resistance of 0.5 to 3% in the membrane wasreported after 150 days’ operation by Huang et al. [21]in two AnMBRs at SRT of 30 to 60 days, by applying aSGD of 0.4 m3 m−2 h−1, which equates to an energyconsumption of 0.69 kWh m−3.
The lowest energy demands, of 0.02–0.05 kWh m−3,reported for submerged AnMBRs (Table 3) result frompermeate suction and correspond to studies in whichmembrane filtration has been coupled with high rateanaerobic reactors in which fouling is controlled withoutusing gas sparging, by only applying intermittent filtra-tion [20,22] or by relying on the shear provided byupflow velocity [33]. Results have shown that although
sustainable operation could not be achieved, foulingrates between 10 mbar d−1 [33] and 100 mbar d−1 [20]were observed due to the low solid and colloidal load onthe membrane [24]. These fouling rates are of the sameorder of magnitude as residual fouling rates (15–35mbar d−1) and one to two orders of magnitude lower thanthe 2000–2600 mbar d−1 value reported for cake layerfouling in backwash cycles in aerobic systems [42].Implementation of backwashing, together with low gassparging intensity in high rate anaerobic reactorscoupled to membrane filtration, could therefore result inan efficient fouling control strategy for AnMBRs, assuggested in a previous study involving a low solidanoxic membrane system [50]. Duration of filtrationcycles of 10 min experimentally determined from anal-ysis of the critical mass deposited on the membrane,which leads to irreversible fouling, resulted in fluxes of20 LMH maintained over 20 days, equating to specificenergy demands of 0.05 kWh m−3 for gas sparging.
3.3. Impact of operational parameters on the energy demands of sidestream AeMBRs and AnMBRs
Analysis of the pressure drop per m generated whenpumping both aerobic and anaerobic sludges (Figure 4)reveals that when compared at the same MLSS andcrossflow velocity (CFV) aerobic biomass leads tohigher frictional pressure losses than does anaerobicbiomass, reflecting the higher viscosity of the former.As an illustration of this, the curve corresponding to theAeMBR sludge at the lowest MLSS concentration, 5 gMLSS L−1, overlaps with the maximum concentrationof 20 g MLSS L−1 for the anaerobic sludge. Similarly,the rate of increase of pressure loss with increasingCFV is higher in aerobic systems than in AnMBRs. The
Table 3. Categorization of energy demands associated with membrane operation in submerged anaerobic MBRs [18,20–22,24,35,36,48].
Area (m2)SGDm
(m3 m−2 h−1)Flux (lmh)
TMP (kPa)
ECF (kWh m−3)
EPER (kWh m−3)
ETOT (kWh m−3) Reference
0.10 0 10.4 100 0.00 4.6E–02 0.05 Chu et al. [20]
0.30 0 5.0 60 0.00 2.8E–02 0.03 Wen et al. [22]
0.24 0.40 5.3 0.07 0.69 3.2E–03 0.69 Huang et al. [21]
0.10 3.00 8.0 38 3.41 1.8E–02 3.43 Hu and Stuckey [18]
0.04 0.54 10.0 50 0.49 2.3E–02 0.51 van Voorthuizen et al. [24]
0.04 1.35 8.0 50 1.53 2.3E–02 1.56
0.05 1.80 25.0 30 0.65 1.4E–02 0.67 Wu et al. [48]
0.03 1.50 7.2 10 1.89 4.6E–03 1.90 Lin et al. [36]
0.03 1.50 2.4 27 5.68 1.3E–02 5.70
0.10 3.00 5.0 20 5.46 9.3E–03 5.47 Lee et al.[35]
SGDm: specific gas demand normalized; TMP: transmembrane pressure; ECF: Energy required to control fouling; EPER: energy required to pumppermeate; ETOT: total energy requirements; CF: Critical flux; SF: Sustainable flux.
Dow
nloa
ded
by [
Cra
nfie
ld U
nive
rsity
] at
01:
29 1
3 Ju
ne 2
012

Environmental Technology 929
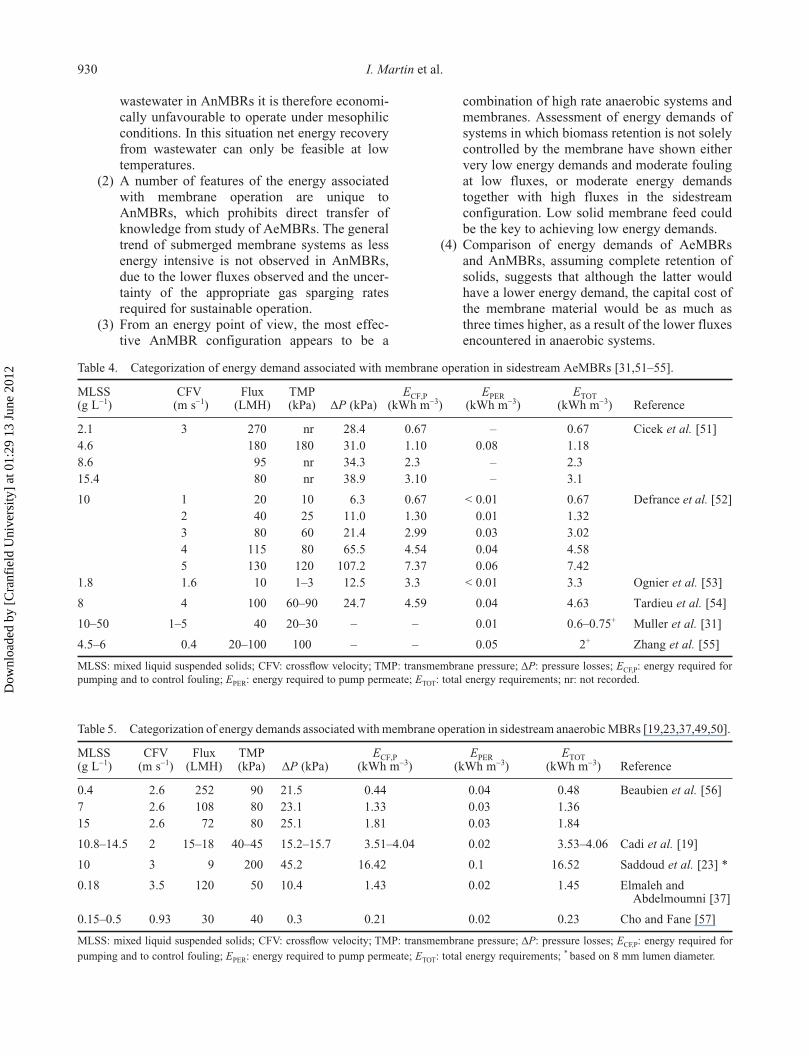
effect of CFV on pressure drop (∆P) is more prominentthan the increase in MLSS over the range considered.Taking a reference point of 10 g MLSS L−1 and 3 m s−1
in the AeMBR, increasing CFV to 4 m s−1 results in aunitary pressure loss of 444 mbar m−1, while theresulting value for a biomass concentration of 15 gMLSS L−1 is 293 mbar m−1. However, the rate ofincrease in pressure loss with solids concentration ismore prominent if MLSS is above 15 g L−1.Figure 4. Influence of mixed liquid suspended solids (MLSS) and crossflow velocity (CFV) on unitary pressure drop ( ∆P) for aerobic and anaerobic MBR sludges, assuming a 6 mm diameter lumen [26,27].Energy demands for fouling control in AeMBRsranged from 0.67 to 7.42 kWh m−3, depending on cross-flow velocity and MLSS concentration (Table 4). Increas-ing crossflow velocity and biomass concentration resultsin higher energy expenditures in sidestream systems dueto a combination of higher volumetric flow and pressurelosses in the first case, and to the lower critical fluxesreported at higher MLSS in the second [51,52]. Forinstance, at a solid concentration of 10 g MLSS L−1 [52],specific power requirements range from 0.67 to 4.25 kWhm−3, with CFV varying from 1 to 4 m s−1, while for a higherMLSS of 15 g MLSS L−1 there is a more pronouncedincrease in energy demand, from 0.38 to 5.14 kWh m−3
[51]. To further illustrate the influence of biomassconcentration, at a crossflow velocity of 3 m s−1 energydemand increases from 0.67 to 3.10 kWh m−3 as MLSSincreases from 2.1 to 15 g MLSS L−1, due to a decreasein critical flux from 270 to 80 LMH [51].
In comparison the energy demands for foulingcontrol in sidestream AnMBRs range between 0.23 and16.50 kWh m−3 showing similar trends to AeMBRswith respect to crossflow velocity and biomass concen-tration (Table 5).
However, despite presenting lower flux than theiraerobic counterpart, lower energy demands arepredicted in AnMBRs at similar biomass concentrationand crossflow velocity due to the lower pressure lossesarising from the lower viscosity. For instance, at a solidconcentration of 15 g MLSS L−1, CFV varying from 1.6to 3.4 m s−1 results in an increase in energy demandfrom 0.88 to 3.01 kWh m−3 in an anaerobic system [56]and from 0.38 to 5.14 kWh m−3 in AeMBRs operatingat the same biomass concentration [51]. The lowestenergy demands in sidestream AnMBRs occur either insuspended growth reactors operating at low solidconcentrations or when crossflow filtration is coupledwith attached growth systems [57], due to a combina-tion of low frictional pressure losses and high flux.Fluxes of 252 and 120 LMH [37,56] at correspondingcrossflow velocities of 2.6 and 3.5 m s−1, are among thehighest reported for AnMBRs and result in energydemands of 0.48 kWh m−3 and 1.45 kWh m−3, respec-tively, although a further reduction to 0.23 kWh m−3 ispredicted for crossflow velocities in of 0.93 m s−1 [57].
3.4. Implications of the anaerobic flow-sheet
Key findings from the modelling assessment of theliterature reporting AnMBR case studies lead to anumber of conclusions:
(1) The energy required to heat the bioreactor tomesophilic conditions can only be compensatedat wastewater strengths above 4–5 g COD L−1.When considering the treatment of municipal
Figure 4. Influence of mixed liquid suspended solids (MLSS) and crossflow velocity (CFV) on unitary pressure drop (∆P) foraerobic and anaerobic MBR sludges, assuming a 6 mm diameter lumen [26,27].
Dow
nloa
ded
by [
Cra
nfie
ld U
nive
rsity
] at
01:
29 1
3 Ju
ne 2
012
930 I. Martin et al.
wastewater in AnMBRs it is therefore economi-cally unfavourable to operate under mesophilicconditions. In this situation net energy recoveryfrom wastewater can only be feasible at lowtemperatures.
(2) A number of features of the energy associatedwith membrane operation are unique toAnMBRs, which prohibits direct transfer ofknowledge from study of AeMBRs. The generaltrend of submerged membrane systems as lessenergy intensive is not observed in AnMBRs,due to the lower fluxes observed and the uncer-tainty of the appropriate gas sparging ratesrequired for sustainable operation.
(3) From an energy point of view, the most effec-tive AnMBR configuration appears to be a
combination of high rate anaerobic systems andmembranes. Assessment of energy demands ofsystems in which biomass retention is not solelycontrolled by the membrane have shown eithervery low energy demands and moderate foulingat low fluxes, or moderate energy demandstogether with high fluxes in the sidestreamconfiguration. Low solid membrane feed couldbe the key to achieving low energy demands.
(4) Comparison of energy demands of AeMBRsand AnMBRs, assuming complete retention ofsolids, suggests that although the latter wouldhave a lower energy demand, the capital cost ofthe membrane material would be as much asthree times higher, as a result of the lower fluxesencountered in anaerobic systems.
Table 5. Categorization of energy demands associated with membrane operation in sidestream anaerobic MBRs [19,23,37,49,50].
MLSS (g L−1)
CFV (m s−1)
Flux (LMH)
TMP (kPa) ∆P (kPa)
ECF,P (kWh m−3)
EPER (kWh m−3)
ETOT (kWh m−3) Reference
0.4 2.6 252 90 21.5 0.44 0.04 0.48 Beaubien et al. [56]7 2.6 108 80 23.1 1.33 0.03 1.3615 2.6 72 80 25.1 1.81 0.03 1.84
10.8–14.5 2 15–18 40–45 15.2–15.7 3.51–4.04 0.02 3.53–4.06 Cadi et al. [19]
10 3 9 200 45.2 16.42 0.1 16.52 Saddoud et al. [23] *
0.18 3.5 120 50 10.4 1.43 0.02 1.45 Elmaleh and Abdelmoumni [37]
0.15–0.5 0.93 30 40 0.3 0.21 0.02 0.23 Cho and Fane [57]
MLSS: mixed liquid suspended solids; CFV: crossflow velocity; TMP: transmembrane pressure; ∆P: pressure losses; ECF,P: energy required forpumping and to control fouling; EPER: energy required to pump permeate; ETOT: total energy requirements; * based on 8 mm lumen diameter.
Table 4. Categorization of energy demand associated with membrane operation in sidestream AeMBRs [31,51–55].
MLSS(g L−1)
CFV (m s−1)
Flux (LMH)
TMP (kPa) ∆P (kPa)
ECF,P (kWh m−3)
EPER (kWh m−3)
ETOT (kWh m−3) Reference
2.1 3 270 nr 28.4 0.67 – 0.67 Cicek et al. [51]4.6 180 180 31.0 1.10 0.08 1.188.6 95 nr 34.3 2.3 – 2.315.4 80 nr 38.9 3.10 – 3.1
10 1 20 10 6.3 0.67 < 0.01 0.67 Defrance et al. [52]2 40 25 11.0 1.30 0.01 1.323 80 60 21.4 2.99 0.03 3.024 115 80 65.5 4.54 0.04 4.585 130 120 107.2 7.37 0.06 7.42
1.8 1.6 10 1–3 12.5 3.3 < 0.01 3.3 Ognier et al. [53]
8 4 100 60–90 24.7 4.59 0.04 4.63 Tardieu et al. [54]
10–50 1–5 40 20–30 – – 0.01 0.6–0.75+ Muller et al. [31]
4.5–6 0.4 20–100 100 – – 0.05 2+ Zhang et al. [55]
MLSS: mixed liquid suspended solids; CFV: crossflow velocity; TMP: transmembrane pressure; ∆P: pressure losses; ECF,P: energy required forpumping and to control fouling; EPER: energy required to pump permeate; ETOT: total energy requirements; nr: not recorded.
Dow
nloa
ded
by [
Cra
nfie
ld U
nive
rsity
] at
01:
29 1
3 Ju
ne 2
012

Environmental Technology 931
4. Conclusions
Potential savings in sludge treatment and disposal costscan be achieved in both AeMBRs and AnMBRs, sinceoperation under complete retention of solids is possible.Assessment of model calculations has shown that inAeMBRs low biomass production is attainable with anenergy input of 2 kWh m−3, due to the low oxygen trans-fer efficiency at high biomass concentrations. InAnMBRs fouling control is the determining factor inthe energy demand of the process, and sludge produc-tion and energy requirements are therefore less directlylinked, although extended SRT is likely to influencebiomass characteristics, and hence membrane perfor-mance. A wide variation in energy demand insubmerged AnMBRs, ranging from 0.03 to 3.57 kWhm−3 has been found, highlighting the need to investigatefurther the gas intensity required to control fouling inorder to ascertain the full potential of such technologyfor mainstream wastewater treatment.
AcknowledgementsThis research project has been supported by a Marie CurieEarly Stage Research Training Fellowship of the EuropeanCommunity’s Sixth Framework Programme, under contractnumber MEST–CT–2005–021050. The authors would alsolike to thank our industrial sponsors, Severn Trent Water andYorkshire Water, for their financial and technical support.
References[1] [1] S. Judd, The MBR Book: Principles and applications of
membrane bioreactors in water and wastewater treat-ment, 2nd ed., Elsevier, London, 2010.
[2] [2] B. Lesjean and E.H. Huisjes, Survey of the EuropeanMBR market: Trends and perspectives, Desalination231 (2008), pp. 71–81.
[3] [3] W. Yang, N. Cicek, and J. Ilg, State-of-the-art ofmembrane bioreactors: Worldwide research andcommercial applications in North America, J. Membr.Sci. 270 (2006), pp. 201–211.
[4] [4] Y. Xiao and D.J. Roberts, A review of anaerobic treat-ment of saline wastewater, Environ. Technol. 31(2010), pp. 1025–1043.
[5] [5] J.N. Lester, A. Soares, D. San Martin, P. Harper, B.Jefferson, J. Brigg, E. Wood, and E. Cartmell, A novelapproach to the anaerobic treatment of municipalwastewater in temperate climates through primarysludge fortification, Environ. Technol. 30 (2009), pp.985–994.
[6] [6] B. Ross and H. Strohwald, Membranes add edge to oldtechnology, Water Qual. Int. 4 (1994), pp. 18–20.
[7] [7] B.Q. Liao, J.T. Kraemer, and D.M. Bagley, Anaerobicmembrane bioreactors: Applications and researchdirections, Crit. Rev. Env. Sci. Tec. 36 (2006), pp.489–530.
[8] [8] P.R. Berube, E.R. Hall, and P.M. Sutton, Parametersgoverning permeate flux in an anaerobic membranebioreactor treating low-strength municipal wastewa-ters: A literature review, Water Environ. Res. 78(2006), pp. 887–896.
[9]
[9] H. Fletcher, T. Mackley, and S. Judd, The cost of apackage plant membrane bioreactor, Water Res. 41(2007), pp. 2627–2635.
[10][10] B. Verrecht, S. Judd, G. Guglielmi, C. Brepols, andJ.W. Mulder, An aeration energy model for animmersed membrane bioreactor, Water Res. 42 (2008),pp. 4761–4770.
[11][11] R.A. Chilton and R. Stainsby, Pressure loss equationsfor laminar and turbulent non-Newtonian pipe flow, J.Hydraul. Eng.–Asce. 124 (1998), pp. 522–529.
[12][12] L. Innocenti, D. Bolzonella, P. Pavan, and F. Cecchi,Effect of sludge age on the performance of a membranebioreactor: Influence on nutrient and metals removal,Desalination 146 (2002), pp. 467–474.
[13][13] G. Laera, A. Pollice, D. Saturno, C. Giordano, andA. Lopez, Zero net growth in a membrane bioreac-tor with complete sludge retention, Water Res. 39(2005), pp. 5241–5249.
[14][14] S. Rosenberger, U. Kruger, R. Witzig, W. Manz, U.Szewzyk, and M. Kraume, Performance of a bioreac-tor with submerged membranes for aerobic treatmentof municipal waste water, Water Res. 36 (2002), pp.413–420.
[15][15] H.C. Teck, K.S. Loong, D.D. Sun, and J.O. Leckie,Influence of a prolonged solid retention time environ-ment on nitrification/denitrification and sludge produc-tion in a submerged membrane bioreactor, Desalination245 (2009), pp. 28–43.
[16][16] B. Gunder and K. Krauth, Replacement of secondaryclarification by membrane separation: Results withplate and hollow fibre modules, Water Sci. Technol. 38(1998), pp. 383–393.
[17][17] G. Tchobanoglous, F.L Burton, and H.D. Stensel,Wastewater engineering: Treatment, disposal and reuse,Metcalf & Eddy, New York, 2003.
[18][18] A.Y. Hu and D.C. Stuckey, Treatment of dilute waste-waters using a novel submerged anaerobic membranebioreactor, J. Environ. Eng. (Reston, VA, U.S.) 132(2006), pp. 190–198.
[19][19] Z. Cadi, H. Huyard, J. Manem, and R. Moletta, Anaero-bic digestion of a synthetic wastewater containingstarch by a membrane reactor, Environ. Technol. 15(1994), pp. 1029–1039.
[20][20] L.B. Chu, F.L. Yang, and X.W. Zhang, Anaerobictreatment of domestic wastewater in a membrane-coupled expended granular sludge bed (EGSB) reactorunder moderate to low temperature, Process Biochem.(Amsterdam, Neth.) 40 (2005), pp. 1063–1070.
[21][21] Z. Huang, S.L. Ong, and H.Y. Ng, Feasibility ofsubmerged anaerobic membrane bioreactor (SAMBR)for treatment of low-strength wastewater, Water Sci.Technol. 58 (2008), pp. 1925–1931.
[22][22] C. Wen, X. Huang, and Y. Qian, Domestic wastewatertreatment using an anaerobic bioreactor coupled withmembrane filtration, Process Biochem. (Amsterdam,Neth.) 35 (1999), pp. 335–340.
[23][23] A. Saddoud, M. Ellouze, A. Dhouib, and S. Sayadi, Acomparative study on the anaerobic membrane bioreac-tor performance during the treatment of domesticwastewaters of various origins, Environ. Technol. 27(2006), pp. 991–999.
[24][24] E. van Voorthuizen, A. Zwijnenburg, W. van der Meer,and H. Temmink, Biological black water treatmentcombined with membrane separation, Water Res. 42(2008), pp. 4334–4340.
[25]
Dow
nloa
ded
by [
Cra
nfie
ld U
nive
rsity
] at
01:
29 1
3 Ju
ne 2
012
932 I. Martin et al.
[25] A.B. Metzner and J.C. Reed, Flow of non-newtonianfluids: Correlation of the laminar, transition and turbu-lent-flow regions, AIChE J. 1 (1955), pp. 434–440.
[26][26] G. Laera, C. Giordano, A. Pollice, D. Saturno, and G.Mininni, Membrane bioreactor sludge rheology atdifferent solid retention times, Water Res. 41 (2007),pp. 4197–4203.
[27][27] A. Pevere, G. Guibaud, E. van Hullebusch, and P.Lens, Identification of rheological parameters describ-ing the physico-chemical properties of anaerobicsulphidogenic sludge suspensions, Enzyme Microb.Technol. 40 (2007), pp. 547–554.
[28][28] A. Pollice, C. Giordano, G. Laera, D. Saturno, and G.Mininni, Rheology of sludge in a complete retentionmembrane bioreactor, Environ. Technol. 27 (2006),pp. 723–732.
[29][29] S. Rosenberger, K. Kubin, and M. Kraume, Rheologyof activated sludge in membrane activation reactors,Chem. Ing. Tech. 74 (2002), pp. 487–494.
[30][30] S. Kennedy and S.J. Churchouse, Progress inmembrane bioreactors: New advances; Water andWastewater Europe Conference, Milan, Italy, 2005.
[31][31] E.B. Muller, A.H. Stouthamer, H.W. Vanverseveld,and D.H. Eikelboom, Aerobic domestic waste-watertreatment in a pilot-plant with complete sludge reten-tion by cross-flow filtration, Water Res. 29 (1995),pp. 1179–1189.
[32][32] F. Fatone, P. Battistoni, P. Pavan, and F. Cecchi,Operation and maintenance of full-scale municipalmembrane biological reactors: A detailed overviewon a case study, Ind. Eng. Chem. Res. 46 (2007),pp. 6688–6695.
[33][33] Y. An, Z. Wang, Z. Wu, D. Yang, and Q. Zhou,Characterization of membrane foulants in an anaero-bic non-woven fabric membrane bioreactor for munici-pal wastewater treatment, Chem. Eng. J. 155 (2009),pp. 709–715.
[34][34] T. Imasaka, H. So, K. Matsushita, T. Furukawa, and N.Kanekuni, Application of gas–liquid 2-phase cross-flowfiltration to pilot-scale methane fermentation, Dry.Technol. 11 (1993), pp. 769–785.
[35][35] D.Y. Lee, Y.Y. Li, T. Noike, and G.C. Cha, Behavior ofextracellular polymers and bio-fouling during hydrogenfermentation with a membrane bioreactor, J. Membr.Sci. 322 (2008), pp. 13–18.
[36][36] H.J. Lin, K. Xie, B. Mahendran, D.M. Bagley, K.T.Leung, S.N. Liss, and B.Q. Liao, Sludge properties andtheir effects on membrane fouling in submerged anaer-obic membrane bioreactors (SAnMBRs), Water Res. 43(2009), pp. 3827–3837.
[50][37] S. Elmaleh and L. Abdelmoumni, Cross-flow filtrationof an anaerobic methanogenic suspension, J. Membr.Sci. 131 (1997), pp. 261–274.
[37][38] W. Fuchs, H. Binder, G. Mavrias, and R. Braun, Anaer-obic treatment of wastewater with high organic contentusing a stirred tank reactor coupled with a membranefiltration unit, Water Res. 37 (2003), pp. 902–908.
[38][39] J. du Preez, B. Norddahl, and K. Christensen, TheBIOREK((R)) concept: A hybrid membrane bioreactorconcept for very strong wastewater, Desalination 183(2005), pp. 407–415.
[39][40] M. Kanai, V. Ferre, S. Wakahara, T. Yamamoto, and M.Moro, A novel combination of methane fermentation andMBR: Kubota Submerged Anaerobic Membrane Biore-actor process, Desalination 250 (2010), pp. 964–967.
[40]
[41] P. Le Clech, B. Jefferson, and S.J. Judd, Impact ofaeration, solids concentration and membrane charac-teristics on the hydraulic performance of a membranebioreactor, J. Membr. Sci. 218 (2003), pp. 117–129.
[41][42] G. Guglielmi, D. Chiarani, S.J. Judd, and G. Andreottola,Flux criticality and sustainability in a hollow fibresubmerged membrane bioreactor for municipal waste-water treatment, J. Membr. Sci. 289 (2007), pp. 241–248.
[42][43] G. Guglielmi, D. Chiarani, D.P. Saroj, and G. Andreot-tola, Impact of chemical cleaning and air-sparging onthe critical and sustainable flux in a flat sheetmembrane bioreactor for municipal wastewater treat-ment, Water Sci. Technol. 57 (2008), pp. 1873–1879.
[43][44] H. Itokawa, C. Thiemig, and J. Pinnekamp, Design andoperating experiences of municipal MBRs in Europe,Water Sci. Technol. 58 (2008), pp. 2319–2327.
[52][45] P. Le Clech, V. Chen, and T.A.G. Fane, Fouling inmembrane bioreactors used in wastewater treatment, J.Membr. Sci. 284 (2006), pp. 17–53.
[53][46] J. Zhang, H.C. Chua, J. Zhou, and A.G. Fane, Factorsaffecting the membrane performance in submergedmembrane bioreactors, J. Membr. Sci. 284 (2006), pp.54–66.
[51][47] E.H. Bouhabila, R.B. Aim, and H. Buisson, Microfiltra-tion of activated sludge using submerged membranewith air bubbling (application to wastewater treat-ment), Desalination 118 (1998), pp. 315–322.
[54][48] B. Wu, Y.Y. An, Y.Z. Li, and F.S. Wong, Effect ofadsorption/coagulation on membrane fouling in micro-filtration process post-treating anaerobic digestioneffluent, Desalination 242 (2009), pp. 183–192.
[44][49] D. Jeison and J.B. van Lier, Thermophilic treatment ofacidified and partially acidified wastewater using ananaerobic submerged MBR: Factors affecting long-termoperational flux, Water Res. 41 (2007), pp. 3868–3879.
[45][50] E.J. McAdam and S.J. Judd, Optimisation of dead-endfiltration conditions for an immersed anoxic membranebioreactor, J. Membr. Sci. 325 (2008), pp. 940–946.
[46][51] N. Cicek, H. Winnen, M.T. Suidan, B.E. Wrenn, V.Urbain, and J. Manem, Effectiveness of the membranebioreactor in the biodegradation of high molecular weightcompounds, Water Res. 32 (1998), pp. 1553–1563.
[47][52] L. Defrance, M.Y. Jaffrin, B. Gupta, P. Paullier, and V.Geaugey, Contribution of various constituents of acti-vated sludge to membrane bioreactor fouling, Biore-sour. Technol. 73 (2000), pp. 105–112.
[55][53] S. Ognier, C. Wisniewski, and A. Grasmick, Membranebioreactor fouling in sub-critical filtration conditions:A local critical flux concept, J. Membr. Sci. 229 (2004),pp. 171–177.
[56][54] E. Tardieu, A. Grasmick, V. Geaugey, and J. Manem,Hydrodynamic control of bioparticle deposition in aMBR applied to wastewater treatment, J. Membr. Sci.147 (1998), pp. 1–12.
[57][55] S.Y. Zhang, R. van Houten, D.H. Eikelboom, H.Doddema, Z.C. Jiang, Y. Fan, and J.S. Wang, Sewagetreatment by a low energy membrane bioreactor, Biore-sour. Technol. 90 (2003), pp. 185–192.
[48][56] A. Beaubien, M. Baty, F. Jeannot, E. Francoeur, and J.Manem, Design and operation of anaerobic membranebioreactors: Development of a filtration testing strat-egy, J. Membr. Sci. 109 (1996), pp. 173–184.
[49][57] B.D. Cho and A.G. Fane, Fouling transients in nomi-nally sub-critical flux operation of a membrane biore-actor, J. Membr. Sci. 209 (2002), pp. 391–403.
Dow
nloa
ded
by [
Cra
nfie
ld U
nive
rsity
] at
01:
29 1
3 Ju
ne 2
012