Trust, trustworthiness and trust-building in international policing missions

www.elsevier.com/locate/foodqual
Food Quality and Preference 18 (2007) 384–395
Modelling risk perception and trust in food safety informationwithin the theory of planned behaviour
A.E. Lobb a,*, M. Mazzocchi b, W.B. Traill a
a Department of Agricultural and Food Economics, The University of Reading, Reading, United Kingdomb Department of Statistics, University of Bologna, Bologna, Italy
Received 12 May 2005; received in revised form 11 January 2006; accepted 9 April 2006Available online 26 April 2006
Abstract
This study suggests a statistical strategy for explaining how food purchasing intentions are influenced by different levels of risk per-ception and trust in food safety information. The modelling process is based on Ajzen’s Theory of Planned Behaviour and includes trustand risk perception as additional explanatory factors. Interaction and endogeneity across these determinants is explored through a sys-tem of simultaneous equations, while the SPARTA equation is estimated through an ordered probit model. Furthermore, parameters areallowed to vary as a function of socio-demographic variables. The application explores chicken purchasing intentions both in a standardsituation and conditional to an hypothetical salmonella scare. Data were collected through a nationally representative UK wide survey of533 UK respondents in face-to-face, in-home interviews. Empirical findings show that interactions exist among the determinants ofplanned behaviour and socio-demographic variables improve the model’s performance. Attitudes emerge as the key determinant of inten-tion to purchase chicken, while trust in food safety information provided by media reduces the likelihood to purchase.� 2006 Elsevier Ltd. All rights reserved.
Keywords: Consumer behaviour; Consumer attitudes; Intention
1. Introduction
Over the last decade consumers have become increas-ingly concerned by the health risks posed by food con-sumption. It has become difficult for the general public toassess risks using traditional methods such as smell, tasteor other physical attributes of food; with the safety of foodnow commonly recognised as a credence attribute, consum-ers have to rely on the trust they have towards producers,retailers and regulators to ensure potential health impactsare minimised. This study suggests a modelling strategy,based on Ajzen’s (1985) Theory of Planned Behaviour,for explaining how purchasing intentions are influencedby different levels of risk perception and trust in food safetyinformation. Furthermore, the relevance of differences in
0950-3293/$ - see front matter � 2006 Elsevier Ltd. All rights reserved.
doi:10.1016/j.foodqual.2006.04.004
* Corresponding author.E-mail address: [email protected] (A.E. Lobb).
consumers’ socio-demographic characteristics is taken intoaccount. The model investigates the role of those addi-tional factors in explaining intention to purchase chickenin the UK.
2. Food choices, risk and food safety information
In recent years the food industry has experienced anincreasing number of food safety crises. Most consumersare subject to masses of information about food hazardsfrom a variety of different sources, such as the media, gov-ernment, retailers and consumer organisations. This study,which is part of a wider EU project, consists of a UK-wideinvestigation of food purchasing behaviours. It responds toa growing policy demand for predictive and explanatorymodels to assist risk communication. The two main aimsof the project are to provide a better understanding of con-sumers’ demands, attitudes, risk perceptions and trust in

1 A search on the ISI Web of Science indicates some 108 studies that useTPB over the last five years across all science, social science andhumanities journals. For an extensive list of applications of the Theoryof Planned Behaviour, see East (1997, p. 140), Conner et al. (2003) orAjzen’s bibliographic file (http://www-unix.oit.umass.edu/~aizen/).
A.E. Lobb et al. / Food Quality and Preference 18 (2007) 384–395 385
the food chain; and to develop better strategies to beable to communicate food risk issues more effectively toconsumers.
The specific objective of this paper is to analyse howfood purchases can be explained and predicted taking intoaccount risk perception and trust in food safety informa-tion. Furthermore, the influence of different householddemographic characteristics is considered. Following theTheory of Planned Behaviour (TPB) framework, consum-ers’ intention to purchase chicken is modelled under ‘‘nor-mal’’ circumstances and following a hypothetical foodscare. While risk perception and trust are already implicitlyaccounted for in the classical TPB framework, isolatingand making them explicit, these factors should facilitateclearer policy advice. The proposed method allows consid-eration of these additional explanatory variables and at thesame time permits strong interaction with the usual TPBglobal variables.
Chicken was chosen as the product to be investigated inthe survey as it is a widely consumed food and it is not usu-ally associated with high risks despite being potentiallysubject to a number of hazards. A further reason is thatchicken consumption is not as sensitive to food safety con-cerns as beef following the BSE crisis, hence it is expectedto be more representative of standard food safety issuesand consumption behaviour.
The conventional economic analysis of food safetyissues, with respect to risk and trust, is a growing and var-ied body of literature. Bocker (2002) notes that there aretwo main areas of economic research. The first concen-trates on the effect of a food scare on demand (e.g.,Liu, Huang, & Brown, 1998), while the second focuseson policy and cost-benefit analysis of voluntary and oblig-atory safety regulations (e.g., Zaibet & Bredahl, 1997).This conventional literature may be somewhat con-strained in its approach: the concepts of risk and trustshould be combined as a result of the increasing inabilityof consumers’ to make their own assessment of the risksrelated to food hazards and their consequent dependenceon those in social and political spheres to provide appro-priate information. It is the complexity of this inter-rela-tionship between risk and trust in the food chain thatfurther supports the need for research to focus on theinteraction between these two variables (for a detailed lit-erature review see Lobb, 2005). Both concepts are inextri-cably linked in relation to consumer behaviour and thisconnection is of paramount importance to policy makers,risk managers, regulators and the food industry ingeneral.
3. Theoretical framework
The strategy behind the model introduced in this paperis framed within the Theory of Planned Behaviour (TPB)(Ajzen, 1985, 1991), which has proved to be a successfulanalysis tool for a range of behaviours, often associatedwith risky or health-related actions such as smoking, risky
driving, physical activities and exercise, or contraception.1
The TPB has also been widely applied to food choices, e.g.,Cook, Kerr, and Moore (2002) investigate consumer atti-tudes to GM foods while Dennison and Shepherd (1995)explore adolescent food choice.
The TPB framework, devised from the Theory of Rea-soned Action (TRA), (Ajzen & Fishbein, 1980), defineshuman action as a combination of three dimensions,behavioural beliefs, normative beliefs, and control beliefs.Behavioural beliefs (i.e., beliefs about the outcome of theaction), produce either a positive or a negative attitudetoward the behaviour; normative beliefs refer to subjectivenorms or perceived social forces; control beliefs lead to per-ceived behavioural control. All these produce intentions tobehave (Ajzen, 2002).
Attitude to behaviour is noted as being principally dif-ferent from the broader concept of attitude towards anobject. For example, one may like chicken (an attitude tochicken), yet choose not to purchase chicken because of aspecific dietary requirement. Subjective norm is a conceptbased on how one ‘‘should’’ act in response to the viewsor thoughts of others. Subjective norm influences mayinclude friends, family members, colleagues, doctors, reli-gious organisations etc. Perceived behavioural controlcan be described as ‘‘the measure of confidence that onecan act’’, for example one may not be able to purchasechicken if it is not available (East, 1997).
3.1. The SPARTA model
Integrating risk perception and trust into the TPBframework and consideration of the influence of differentindividual (or household) characteristics lead to the devel-opment of the SPARTA Model. The acronym SPARTAcomes from the initials of the global variables used toexplain behavioural intentions:
• subjective norm (S),• perceived behavioural control (P),• attitudes (A),• risk perception (R),• trust (T),• alia, other variables, socio-demographics in the present
study, which may lead to shifts in the weight of theabove global variables (AL).
The interaction between these components can beexpressed pictorially in Fig. 1. It is important to note thatthe relationships hypothesised in this model between riskperception and trust can be tested statistically within theSPARTA framework. Three modelling levels are identified:
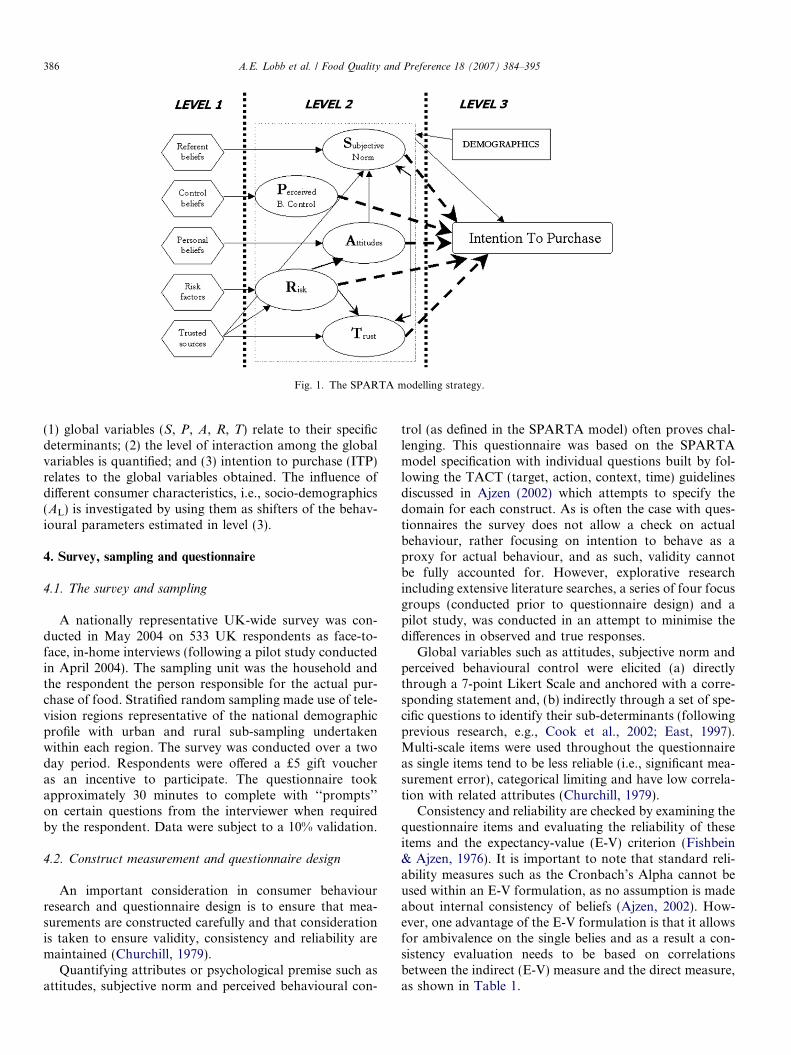
Fig. 1. The SPARTA modelling strategy.
386 A.E. Lobb et al. / Food Quality and Preference 18 (2007) 384–395
(1) global variables (S, P, A, R, T) relate to their specificdeterminants; (2) the level of interaction among the globalvariables is quantified; and (3) intention to purchase (ITP)relates to the global variables obtained. The influence ofdifferent consumer characteristics, i.e., socio-demographics(AL) is investigated by using them as shifters of the behav-ioural parameters estimated in level (3).
4. Survey, sampling and questionnaire
4.1. The survey and sampling
A nationally representative UK-wide survey was con-ducted in May 2004 on 533 UK respondents as face-to-face, in-home interviews (following a pilot study conductedin April 2004). The sampling unit was the household andthe respondent the person responsible for the actual pur-chase of food. Stratified random sampling made use of tele-vision regions representative of the national demographicprofile with urban and rural sub-sampling undertakenwithin each region. The survey was conducted over a twoday period. Respondents were offered a £5 gift voucheras an incentive to participate. The questionnaire tookapproximately 30 minutes to complete with ‘‘prompts’’on certain questions from the interviewer when requiredby the respondent. Data were subject to a 10% validation.
4.2. Construct measurement and questionnaire design
An important consideration in consumer behaviourresearch and questionnaire design is to ensure that mea-surements are constructed carefully and that considerationis taken to ensure validity, consistency and reliability aremaintained (Churchill, 1979).
Quantifying attributes or psychological premise such asattitudes, subjective norm and perceived behavioural con-
trol (as defined in the SPARTA model) often proves chal-lenging. This questionnaire was based on the SPARTAmodel specification with individual questions built by fol-lowing the TACT (target, action, context, time) guidelinesdiscussed in Ajzen (2002) which attempts to specify thedomain for each construct. As is often the case with ques-tionnaires the survey does not allow a check on actualbehaviour, rather focusing on intention to behave as aproxy for actual behaviour, and as such, validity cannotbe fully accounted for. However, explorative researchincluding extensive literature searches, a series of four focusgroups (conducted prior to questionnaire design) and apilot study, was conducted in an attempt to minimise thedifferences in observed and true responses.
Global variables such as attitudes, subjective norm andperceived behavioural control were elicited (a) directlythrough a 7-point Likert Scale and anchored with a corre-sponding statement and, (b) indirectly through a set of spe-cific questions to identify their sub-determinants (followingprevious research, e.g., Cook et al., 2002; East, 1997).Multi-scale items were used throughout the questionnaireas single items tend to be less reliable (i.e., significant mea-surement error), categorical limiting and have low correla-tion with related attributes (Churchill, 1979).
Consistency and reliability are checked by examining thequestionnaire items and evaluating the reliability of theseitems and the expectancy-value (E-V) criterion (Fishbein& Ajzen, 1976). It is important to note that standard reli-ability measures such as the Cronbach’s Alpha cannot beused within an E-V formulation, as no assumption is madeabout internal consistency of beliefs (Ajzen, 2002). How-ever, one advantage of the E-V formulation is that it allowsfor ambivalence on the single belies and as a result a con-sistency evaluation needs to be based on correlationsbetween the indirect (E-V) measure and the direct measure,as shown in Table 1.

Table 1Sample mean values and Pearson correlations between expectancy-value and direct measures of global variables
Variable Mean indirect measure Mean direct measure Correlation (direct–indirect)
S Subjective norm 3.85 (1.44) 3.34 (1.90) 0.743***P Perceived behavioural control 4.08 (1.06) 2.40 (1.60) 0.481***A Attitude – all beliefs 5.64 (0.68) 6.08 (1.42) 0.486***A Attitude – salient beliefs 6.14 (0.94) 6.08 (1.42) 0.557***R Risk perception 1.88 (1.22) 5.26 (1.49) 0.299***T1 Trust – media 0 (1.00)T2 Trust – food chain 0 (1.00)T3 Trust – independent 0 (1.00)T4 Trust – alternative 0 (1.00)T5 Trust – vested interest 0 (1.00)
Notes: S, P, A, R and T are expressed in a 1–7 scale sorted in terms of relevance; the trust component scores are standardised to have 0 mean and unityvariance across the sample.***Significant at the 1% level; **Significant at the 5% level; *Significant at the 10% level. Standard deviations between parantheses.
A.E. Lobb et al. / Food Quality and Preference 18 (2007) 384–395 387
Direct measurement for the subjective norm wasobtained by asking about the importance of other’s opin-ions about buying chicken. In the survey pilot study, theE-V formulation for the subjective norm was structuredinto three reference groups (relatives, friends and col-leagues). However, the pilot study showed that it was oftendifficult for the respondent to single out the opinions ofthese referents regarding the purchase of chicken, so itwas decided to include a single two-pronged question to eli-cit subjective norm indirectly. Referent beliefs were mea-sured a 7-point scale by asking Other people suggest
chicken in the diet is very bad/very good, while a motivationto comply measure was given by the agreement with thesentence I take others’ opinions into account when making
decisions about whether or not to buy chicken, again on a7-point scale.
Perceived Behavioural control posed several measure-ment problems, as there are not many control factors inrelation to buying chicken. After a thorough explorationin the pilot survey, two E-V items were chosen, one on free-zer storage (if chicken is already in the freezer this couldprevent the respondent from buying more) and the otheron the possibility that the overall inclination to buy couldbe offset by an abundant consumption in the survey week.
The direct measurement of the attitude component wasbased on a generic 7-point Likert scale (Personally, I think
that buying chicken for my household is good/bad). Outcomeevaluations were measured on a set of 11 beliefs. The ques-tion was built following the TACT guidelines (Ajzen, 2002)by asking on a 7-point scale how much the respondentagrees on the fact that the decision to buy chicken in theweek following the interview was based on an evaluationof: (a) taste; (b) value for money; (c) ease of preparation;(d) safety; (e) chicken being liked by everyone in the house-hold; (f) potential for variety in cooking; (g) fat content; (h)cholesterol content; (i) local community livelihood; (j) eth-ical food production methods; (k) animal welfare. For thesame items, belief strengths were measured (In general, how
important are each of the following to your household?). Inorder to evaluate the saliency issue (Ajzen & Fishbein,1980), each respondent was asked to select a maximum
of three beliefs which s/he regarded as influential when pur-chasing chicken as it is recognised (East, 1997), that in nor-mal circumstances consumers take into account only asmall number of product characteristics in choosing foodproducts. Two different indirect measures were produced,one based only on the salient beliefs and one on all items.
Table 1 shows the sample means for the direct and indi-rect measurements and their bivariate correlations acrossthe sample.
An acceptable consistency emerges, with similar averagevalues and significant correlations between the expectancy-value measures of the global variables and the direct ones,with the highest correlation for subjective norm (0.743) andthe lowest for risk (0.299). Ajzen (1991) reports severalexamples and finds correlation values between 0.24 and0.70, indicating an acceptable performance for the presentsurvey. The saliency issue for the attitude variable seemsmarginal, with a slight increase in correlation when onlythe most important attributes are considered, althoughthe selection of salient beliefs leads to extremely similarmean values.
In this study we allow for the direct impacts of trust andrisk perception on the intention to purchase as well as theinteraction between risk perception, trust in food safetyinformation and the global variables of TPB. A consumer’srisk perception can be viewed as being dependent on infor-mation from various sources with differing impacts for neg-ative and positive (often deemed ‘‘incomplete’’) views (Liuet al., 1998). Sources can be official or derived from per-sonal experience of the consumer or their friends or family.Questions measuring perceived risk were adaptations ofpreviously used questions (e.g., Slovic, 1992), again posedas 7-point Likert scales.
Risk perception was measured using an E-V formulationwith seven items. An evaluation of risk factors wasrequested for both short-term health consequences(E. coli, salmonella, listeria, allergy from food additives)and long-term risk factors (cholesterol, health problemsfrom pesticides, health problems from antibiotics, healthproblems from growth hormones, chicken flu). Similarlyto the belief strength of the usual TPB components, ‘‘risk

Table 2Principal components loadings for trust in food safety information
Information source T1 T2 T3 T4 T5
Shopkeepers 0.22 0.76 0.15 �0.04 �0.02Supermarkets 0.23 0.70 0.31 �0.04 0.12Organic shop 0.11 0.73 �0.14 0.46 0.12Specialty store 0.08 0.78 �0.05 0.40 0.12Farmers/breeders 0.09 0.68 0.14 0.03 0.29Processors 0.12 0.51 0.62 �0.08 0.05Doctors/health authority 0.17 0.18 0.04 0.09 0.82
University scientists 0.21 0.15 0.05 0.19 0.71
Food Standard Agency 0.10 0.10 0.45 0.24 0.69
Government 0.18 0.00 0.78 0.20 0.24Political groups 0.29 0.20 0.72 0.27 �0.03Environmental organisations 0.14 0.13 0.19 0.78 0.11Animal welfare organisations 0.23 0.10 0.14 0.73 0.04Consumer organisations 0.19 0.09 0.00 0.69 0.25European Food Safety Authority 0.19 �0.06 0.48 0.53 0.19Television documentary 0.75 0.04 �0.02 0.18 0.20Television news/current affairs 0.80 0.05 �0.07 0.09 0.32Television adverts 0.63 0.15 0.41 0.06 0.03Newspapers 0.74 0.18 0.29 0.07 �0.02Internet 0.59 0.11 0.23 0.29 0.04Radio 0.75 0.17 0.08 0.18 0.17Magazines 0.73 0.18 0.24 0.19 0.04Product label 0.46 0.30 0.40 0.03 0.11
Component label Media Food chain Authorities Alternative Independent
Note: Varimax rotation. Values equal or greater than 0.40 are in bold.
388 A.E. Lobb et al. / Food Quality and Preference 18 (2007) 384–395
perception strength’’ was measured by asking respondentsto state their knowledge of the risk factor.
To devise a single measure of trust in food safety infor-mation with respect to the behaviour of interest (purchas-ing chicken), is problematic and probably not desirable.Within the questionnaire, many dimensions of trust havebeen posited representing the type of trust (cognitive, affec-tive) and the target of such trust (media, scientists, family,supplier, retailers, etc.). It is clear that an aggregate mea-sure of trust based on these dimensions would have anambiguous relationship with the behaviour of interestbecause whilst one can assume that trust in, say, suppli-ers/retailers would generally be reassuring and have a posi-tive impact on purchasing behaviour, the same cannot besaid of trust in the media (who generally provide negativeinformation) or family, who might provide both positiveand negative information in relation to the consumptionchoice. While it would be desirable to have a clear distinc-tion between the source and the content (direction) ofinformation, this is not achievable through a survey. Byrelating the trust in different information sources with thebehavioural intentions, it becomes possible to estimate(indirectly) the expected direction of information providedby that source, i.e., negative if consumption probability isreduced, and positive if it contributes to more purchases.
Trust in food safety information was measured across 23sources (see Table 2). While Principal Component Analysiswith Varimax rotation identified five latent trust compo-nents, the Cronbach’s Alpha for these 23 questions was
very high (0.91) indicating that trust in food safety infor-mation as a latent construct was consistently measuredby these multiple items.
5. Methodology
The estimation strategy is based on the three levels iden-tified in the previous section.
5.1. Estimation of global variables
First, the usual components of the Theory of PlannedBehaviour (S, P, A) are derived following an expectancy-value formulation (Fishbein & Ajzen, 1976), where the glo-bal variables are assumed to be proportional to a linearcombination of specific beliefs (respectively normative,control and behavioural beliefs) contributing to the globalvariables with weights that depend on the motivation tocomply to the normative beliefs, the power of controlbeliefs and the outcome evaluation of the behaviouralbeliefs. Formally, this can be written as
S /Xg
j¼1
njmj ð1Þ
P /Xq
k¼1
ckpk ð2Þ
A /Xn
i¼1
biei ð3Þ

A.E. Lobb et al. / Food Quality and Preference 18 (2007) 384–395 389
where ni are the specific normative beliefs, mi are the moti-vations to comply, ci are the control beliefs, pi are the pow-ers of control beliefs, bi are the strength of behaviouralbeliefs and ei are the outcome evaluations of these belief.Measuring these items and applying these formulae pro-vides an indirect measure of the global variables.
Risk perception (R) was computed similarly to theexpectancy-value formulation on u different measures ofspecific risk factors rl, where the weights are given by thestated knowledge of each risk factor (kl):
R /Xu
l¼1
rlkl ð4Þ
Trust in information needs a different specification, as it isexpected to vary across different sources of informationand, as we have argued, the impact of trust in informationfrom dissimilar sources (e.g., media, government, scien-tists, . . .) is likely to have a very different impact on behav-ioural intention. Thus, the identification of the latent trustdeterminants was performed by (a) collecting measures oftrust in information provided by s different sources (mea-sured as 7-point Likert scales based on a set of food safetyinformation sources (based on Frewer, Howard, Hedder-ley, & Shepherd, 1996)), and (b) performing a principalcomponent analysis on such measures. This enables us toidentify a limited number of ‘‘trust components’’ that stillpreserve the required differentiation. Hence,
T z ¼Xs
w¼1
azsts; z ¼ 1; . . . ; Z ð5Þ
where ts are the specific trust determinants, azs are the fac-tor loadings for the zth principal component, Tz is the zthprincipal component score and Z is the identified numberof components, i.e., the number of trust determinants. Asynthetic indicator can be exploited to measure the individ-ual’s overall inclination to trust food safety informationindependently from the source, the most obvious is a sim-ple average of the Z selected components,
T ¼ 1
Z
XZ
z¼1
T z
5.2. Interaction among global variables
The second step involves the estimation of the relation-ships across and between the global variables. As shown inFig. 1, a number of endogenous relationships need to beaccounted for when exploring the interaction across theglobal variables, especially considering that risk perceptionand trust could be intrinsic to the other components.2
Hence, a suitable method for modelling these endogenousrelationships is based on a system of simultaneous equa-tions. The generic system can be defined as follows:
2 For example, risk perception might be also regarded as an evaluationtowards a specific product attribute, hence a behavioural belief.
S ¼ f ðA; T zÞR ¼ f ðT zÞT ¼ f ðSÞA ¼ f ðRÞ
8>>><>>>:
z ¼ 1; . . . ; Z ð6Þ
In system (6), trust and risk perception are endogenouslydetermined, as subjective norm (S) influences the overall le-vel of trust in food safety information (T) and is influencedby the specific trust components and attitudes, while riskperception (R) influences the attitude towards the product(A) and is determined by the allocation of trust across thedifferent sources (Tz).
3 While the overall degree of trust (T)is endogenous, the specific levels of trust towards foodsafety information provided by different sources (Tz) areassumed to be exogenous and represent a potential policyinstrument to be addressed through risk communicationstrategies.
5.3. Modelling behavioural intention and
socio-demographic factors
The study of the links assumed in Fig. 1 is completed bymodelling the behavioural intentions as a linear function ofthe global variables:
IB ¼ b0 þ b1S þ b2P þ b3Aþ b4RþXZ
z¼1
kzT z ð7Þ
Estimation of Eq. (7) can be made conditional on othervariables (AL) by allowing the model parameters to varyaccording to the intensity of a set of characteristics. In thisstudy it is assumed that socio-demographic variables (D)might play a significant role, but other shifters such as life-styles or psychographic variables could be similarly accom-modated within the modelling strategy.
The statistical significance of the coefficients of theparameter shifters allows us to measure to what extent,and in which direction, socio-demographic characteristicsdetermine differences in the weight of the global variablesin relation to behavioural intentions. Formally, if socio-demographic differences are assumed to affect all the com-ponents within the SPARTA model, Eq. (7) is augmentedas follows:
IB ¼ b0 þXd
i¼1
c0iDi
!þ b1 þ
Xd
i¼1
c1iDi
!S
þ b2 þXd
i¼1
c2iDi
!P þ b3 þ
Xd
i¼1
c3iDi
!A
þ b4 þXd
i¼1
c4iDi
!Rþ
XZ
z¼1
kz þXd
i¼1
cgiDi
!T z ð8Þ
where Di is the ith socio-demographic variable.
3 Note that the structure of system (6) is compatible with identificationrequirements for a system of simultaneous equations (Greene, 2003).

390 A.E. Lobb et al. / Food Quality and Preference 18 (2007) 384–395
5.4. Statistical methods
Applied studies based on the Theory of Planned Behav-iour have used a variety of methods for estimating the rela-tionship between behavioural intention and itsdeterminants. Most articles (e.g., Conner et al., 2003;Kalafatis, Pollar, East, & Tsogas, 1999) rely on structuralequation modelling, rather than multiple linear regression(Povey, Conner, Sparks, James, & Shepherd, 2000; Shaw& Shiu, 2002; Tonglet, 2001) or tobit regression (Lynne,Casey, Hodges, & Rahmani, 1995) when the data are cen-sored. Cook et al. (2002) base their estimate of a TPBmodel on an ordered discrete choice model. The orderedprobit model is used for estimating the SPARTA modelas described in Eqs. (7) and (8). Given that we measurebehavioural intentions with a 7-point Likert scale, standardmultiple regression is not applicable. As the dependent var-iable is discrete, nominal, ordered and non-continuous, theordered probit model is appropriate (Liao, 1994). Thismodel belongs to the class of discrete choice probabilitymodels widely used in the analysis of attitudes, behavioursand choices and the likelihood of their occurrence. Theordered probit model is estimated by the BFGS (Broy-den–Fletcher–Goldfarb–Shannon) maximum likelihoodalgorithm in the LimDep package. Two main outputs areproduced: estimates of the coefficient for the ordered probitequation, i.e., the relative weight of each intention determi-nant, and a table of marginal effects. The latter measuresthe change in probability for a given value of the dependentvariable induced by a unit change in one of thedeterminants.4
Two other statistical methods are employed within theoverall SPARTA modelling strategy: simultaneous equa-tion modelling and principal component analysis. A simul-taneous equation model is envisaged in Eq. (6), sinceendogeneity (feedbacks) among the dependent variables isrecognised. A consistent and asymptotically efficient esti-mator for the coefficients in this model is provided bythree-stage least squares (3SLS). The model satisfies theorder and rank conditions that ensure proper identifica-tion. Principal component analysis (see e.g., Duntemann,1989) is needed for obtaining the coefficients in (5).
6. Results
Preliminary investigation5 of the sample shows a largeprevalence of females (88%), reflecting the fact that womenremain the principal household shoppers, a high level ofeducation (only 27% have a level of education below highersecondary school education), a dominance of marriedrespondents (51.6%) and a relatively low percentage(41%) with children under the age of 16.
4 A detailed discussion of the ordered probit model is provided byGreene (2003, pp. 736–740).
5 See Appendix A for further details.
6.1. Estimation of global variables
The standard TPB global variables attitudes (A), subjec-tive norm (S) and perceived behavioural control (P) werecomputed as described by Eqs. (1)–(3) using the expec-tancy-value formulation. The attitude global variable wascomputed in two ways: (a) by applying the expectancy-value Eq. (3) to all 14 beliefs elicited through the question-naire; and (b) by applying the same equation only to the(maximum 3) beliefs identified as salient by each respon-dent. A comparison between the indirect measuresobtained through methods (a) and (b) provides an empiri-cal assessment of the saliency issue. Risk perception (R)was computed as a weighted average of nine items relatedto specific risk factors associated with chicken consump-tion and the respondent’s knowledge of such risks, forthe short-term (food poisoning) and long-term (diet-related).
As discussed in Section 4, trust in food safety infor-mation is aggregated through principal component analy-sis, using a varimax rotation, to account for correlationsacross sources perceived as similar and provides esti-mates (principal component scores) for the latent trustconstructs.
Table 2 reports the latent trust dimensions and the rela-tive component loadings.
As shown in Table 2, the latent constructs emerge asstrongly characterised, with the first component emphasis-ing trust in mass media, the second food chain actors, thethird one authorities (and interestingly food processorsand product labels as well), the fourth was labelled as‘‘alternative sources’’ as it includes specialty and organicstores as well as non-profit organisations (and interestinglythe European Food Safety Authority, EFSA) and the fifthone was termed ‘‘independent’’ as it includes doctors anduniversity scientists, together with the national food safetyauthority (Food Standards Agency).
These results suggest for example that people (dis)trust-ing public and political authorities also tend to (dis)trustthe EFSA and product labels (although not as strongly),while (mis)confidence in information from non-profitorganisations involves a similar attitude towards sourcessuch as specialty/organic retailers and the EFSA. Also,information provided by the Food Standards Agency (aUK public but independent authority in charge of foodsafety) emerges as being correlated with trust towards doc-tors and university scientists.
The estimated global determinants, except the trustcomponents that cannot be measured directly, are relatedwith the direct measures through correlations as shown inTable 3. Mean values, standard deviations and correlationswith behavioural intentions are also reported, with twobehaviours taken into consideration. These relate respec-tively to the intention to purchase fresh or frozen chickennext week (ITP1) and to the same intention conditionalon information about an hypothetical salmonella incident(ITP2).

Table 3Sample values, Pearson correlations between expectancy-value and direct measures of global variables and behavioural intentions
Variable Mean indirect measure Mean direct measure Correlations
Direct–indirect ITP1a ITP2
b
S Subjective norm 3.85 (1.44) 3.34 (1.90) 0.74*** �0.05 �0.01P Perceived behavioural control 4.08 (1.06) 2.40 (1.60) 0.48*** 0.14*** 0.02A Attitude – all beliefs 5.63 (0.68) 6.08 (1.42) 0.49*** 0.26*** 0.14***
A Attitude – salient beliefs 6.14 (0.94) 6.08 (1.42) 0.56*** 0.25*** 0.14***
R Risk 1.88 (1.21) 2.74 (1.49) 0.30*** �0.05 �0.02T1 Trust – media 0.00 (1.00) �0.12** �0.12**
T2 Trust – food chain 0.00 (1.00) 0.06 0.07T3 Trust – authorities 0.00 (1.00) �0.06 �0.05T4 Trust – alternative 0.00 (1.00) �0.04 �0.11**
T5 Trust – independent 0.00 (1.00) 0.05 0.07T Trust – overall 0.00 (0.45)
Notes: S, P, A, R are expressed in a 1–7 scale sorted in terms of relevance; the trust component scores and T are standardised to have 0 mean and unityvariance across the sample.*** Significant at the 1% level; ** Significant at the 5% level; * Significant at the 10% level. Standard deviations between parantheses.a Intention to purchase chicken.b Intention to purchase chicken after a hypothetical salmonella scare.
A.E. Lobb et al. / Food Quality and Preference 18 (2007) 384–395 391
It is worth noting that the average for risk perception isquite low6 and well below the risk neutrality value of 4,suggesting that both short and long term risks fromchicken consumption are usually perceived to be negligible.
The saliency issue for the attitude variable seems mar-ginal, with a slight increase in correlation when only themost important attributes are considered, although theselection of salient beliefs leads to extremely similar meanvalues. Correlations between the global variables andITP1 anticipate a significant effect for attitudes, perceivedbehavioural control and trust in media. When a food scareis hypothesised, P becomes non-significant and trust in‘‘alternative’’ information assumes statistical relevance.Furthermore, risk perception does not emerge as a relevantfactor, neither does the subjective norm. Trust in mediaand alternative sources has a negative correlation with pur-chasing intentions, indicating that information provided bythose sources tends to have a negative impact. On the otherhand, trust in the food chain and independent sourcesshows a positive, albeit non-significant impact.
6.2. Interaction among global variables
The next step involves the investigation of existing rela-tionships across behavioural determinants. System (6)explores the links that have been hypothesised in Fig. 1.Results are summarised in Table 4 and most of theassumed relationships emerge as significant. The relativelylow weighted R-square (0.14) does not represent a source ofconcern, as the endogenous relationships are not intendedto enable prediction of the global variables’ values as inthe first level, nor behaviours as in the third level, but sim-
6 All variables and principal components were processed in a way thatlow values are always associated with negative response from theparticipants and vice versa for high values.
ply to shed light on the interaction among behaviouraldeterminants.
Attitudes towards the product are negatively affected byrisk perception and the subjective norm, i.e., sensitivenessto social influence, appears to be positively related (in bothdirections) to trust in food safety information and to atti-tudes. From a policy perspective, it is interesting to seehow risk perception is linked to trust in different sourcesof food safety information. Trust in information providedby media increases risk perception and so does trust inalternative sources such as consumer or environmentalorganisations, while trust in public authorities reduces it.The other trust components (food chain actors and doctorand scientists) are negligible in determining risk perception.
6.3. The SPARTA model: global variables, intention topurchase and demographics
The SPARTA modelling strategy is completed by esti-mating the relationship between the global variables andthe intentions to purchase chicken, allowing for socio-demographic differences to affect such relationships. Eqs.(7) and (8) are estimated to allow an assessment of the con-tribution of socio-demographic factors to the model per-formance. In order to assess the role of differenthousehold socio-demographic characteristics, four parame-ter shifters were included in estimation of model (8): age ofthe respondent (D1), level of education (D2), presence ofchildren below 16 years of age (D3), income level (D4).7
By allowing the parameters of the ordered probit modelto vary according to these variables, it becomes possibleto assess whether they influence consumer behaviourthrough the model determinants.
7 Classifications and descriptive statistics for the socio-demographicvariables are reported in Appendix A.

Table 4Interaction among global variables
S A R T
Constant �1.04 6.26*** 1.95*** �0.60***
S Subjective norm 0.13***
A Attitude 0.80***
R Risk perception �0.07*
T Trust in foodsafety info
T1 Trust – media 0.29*** 0.21***
T2 Trust –food chain
0.21** 0.00
T3 Trust –authorities
0.00 �0.10
T4 Trust –alternative
0.49*** 0.00
T5 Trust –independent
0.26*** 0.18***
Three-stage least squares estimates of simultaneous equation system (6).The following instruments were employed to estimate the system: thedirect measures of the global variables, a simple average of the risk factorsand the trust components.
* Significant at the 10% level.** Significant at the 5% level.
*** Significant at the 1% level.
392 A.E. Lobb et al. / Food Quality and Preference 18 (2007) 384–395
Estimates shown in Table 5 are the final outcome of astepwise selection process, which maintains only the shift-
Table 5Ordered probit estimates with socio-demographic shifters
Parameter Variable Demo
ConstantConstant * D2 EducaConstant * D4 IncomS Subjective normS * D2 EducaS * D4 IncomP Perceived b.c.A AttitudeA * D1 AgeA * D4 IncomR Risk perceptionT1 Trust – mediaT2 Trust – food chainT3 Trust – authoritiesT3 * D2 EducaT4 Trust – alternativeT4 * D1 AgeT5 Trust – independentT5 * D2 EducaChi-squareLog-likCorrect pred.Correct pred.a
Restricted models (no demographics)
LR testCorrect pred.Correct pred.a
a Correct predictions for ITP < 4 (unlikeli to purchase); ITP = 4 (neither); I* Significant at the 10% level.
** Significant at the 5% level.*** Significant at the 1% level.
ers significant at the 10% level. Inclusion of socio-demo-graphic variables results in more robust models in termsof within-sample prediction performance and Likelihoodratio tests. Considering the seven potential outcomes ofthe Likert-type question on intentions to purchase, themodels predicts fairly well. If one considers exact matchingof predicted and actual ITP, the standard model success-fully predicts 49% of cases, while the food scare modelpredicts 27% of cases. If the intention statements are re-classified in three broad categories (unlikely to purchasefor those with an ITP < 4, neither likely nor unlikely forITP = 4 and likely to purchase for ITP > 4), then the pre-diction rate sharply increases to 90% and 54%, respectively.
Interpretation of coefficients and shifters in Table 5 ismade easier by referring to the sample mean for thesocio-demographic variables. Table 6 summarises theSPARTA model estimates by reporting the mean value ofthe global determinants and the list of significant socio-demographic shifters, together with the directions of theireffect.
Intention to purchase chicken in a standard situation ismainly driven by attitude, but perceived behaviouralcontrol is also a relevant positive determinant. Trust infood safety information provided by media, alternativeand independent sources has a negative impact on the
graphic shifter ITP1 ITP2
0.22 1.15tion �0.40**
e �1.47***
�0.17* �0.23*
tion 0.07*
e 0.08**
0.21*** �0.020.21 0.16**
0.03**
e 0.19**
�0.08 �0.02�0.14* �0.13**
�0.09 0.00�0.06 �0.41**
tion 0.16***
0.14 �0.06�0.22**
�0.75*** �0.10tion 0.20***
83.05*** 30.63***
�301.93 �525.960.49 0.270.90 0.54
216.90*** 29.40***
0.44 0.260.84 0.47
TP > 4 (likely to purchase).

Table 6Parameter estimates at the sample mean and demographic shifters
Parameter Variable ITP1 (shifter) ITP2 (shifter)
Constant �2.40 Income (�) �0.06 Education (�)S Subjective norm �0.02 Income (+) �0.03 Education (+)P Perceived behavioural control 0.21 �0.02A Attitude 0.60 Age (+), Income (+) 0.16
R Risk �0.08 �0.02T1 Trust – media �0.14 �0.13
T2 Trust – food chain �0.09 0.00T3 Trust – authorities �0.06 0.08 Education (+)T4 Trust – alternative �0.16 Age (�) �0.06T5 Trust – independent �0.16 Education (+) �0.10
Notes: Values in bold indicate factors (or shifter) significant at the 10% level. The sign between parantheses indicates the direction of the socio-demographic shifter’s effect on the parameter.
A.E. Lobb et al. / Food Quality and Preference 18 (2007) 384–395 393
likelihood to purchase. Age, income and education are thesignificant socio-demographic factors. Age and income fur-ther amplify the positive weight of the attitude determinantand the negative impact of trust in alternative sources,while education moderates the negative implications (interms of ITP) of trust in independent sources such as doc-tors and scientists. While the subjective norm shows a neg-ative but very small coefficient, this effect is reversed forhigher income classes. However, the average likelihood topurchase decreases when income increases (interceptshift).
In the salmonella outbreak scenario, attitude remains themain determinant, but its relevance sharply decreases (from0.6 to 0.16). The subjective norm and trust in media infor-mation coefficient show only marginal changes, while trustin public authorities becomes a significant determinant witha positive effect in terms of increasing likelihood to purchaseor – conversely – distrust in public authorities furtherdecreases ITP. All other global variables become non-signif-icant. While education is associated with a negative impacton average likelihood to purchase, it moderates the negativesign of the subjective norm and increases the weight of trustin information provided by public authorities.
7. Discussion and conclusion
This paper has used the TPB framework to examine theeffects of risk perception and trust on the intention to pur-chase chicken by UK consumers. The SPARTA model elic-its the expected outcome of trust in the differentcomponents which were identified and which distinguishbetween the information from different sources: media,food chain actors, authorities, alternative sources such asconsumer organisations and independent sources such asdoctors and scientists. The modelling strategy is based ona three level process, which accounts for endogenous rela-tionships across the behavioural determinants and the roleplayed by different socio-demographic characteristicswhich improve the performance of the model. The statisti-cal techniques deployed include principal components
analysis, the ordered probit model and simultaneous equa-tions modelling.
The main findings suggest that trust in food safety infor-mation as provided by media, alternative sources and inde-pendent authorities significantly reduces the likelihood topurchase. This could indicate that these sources are associ-ated with food safety communication which may discour-age consumption. When a food scare occurs, trust ininformation provided by media amplifies the negativeeffects of likelihood to purchase, while trust in publicauthorities (such as the Food Standard Agency) moderatesthe scare impact, especially for consumers with higher edu-cation levels. Education seems to be a key variable in devel-oping a communication strategy after a food scare. Whilehigher education levels are associated with a higher proba-bility of avoiding the product, education acts in the oppo-site direction by enhancing the positive effect of trust ininformation provided by public authorities and reversingthe negative role of subjective norm.
Significant interaction between trust, risk perceptionand attitudes is also seen in the SPARTA modellingapproach. Consistently with the above results, trust ininformation provided by media and independent sourcesincreases risk perception, whilst trust in public authori-ties decreases it. While risk perception does not seem toinfluence behavioural intentions directly, it negativelyaffects attitudes, i.e., the main determinant. Finally, apositive and reciprocal relationship emerges between theoverall level of trust and the subjective norm. The threelevels envisaged in the SPARTA strategy enable a simula-tion approach for the overall effect of a change in thetrust level towards a given source of information. Forexample, an increase in trust in the Food StandardAgency, would also involve a reduction in risk perceptionand consequently a slight increase in attitudes. Thesecombined effects, lead to a higher inclination to pur-chase.
The SPARTA modelling strategy has also shown thatattitudes are the most important determinant of intentionto purchase chicken, but that these lose relevance in the

394 A.E. Lobb et al. / Food Quality and Preference 18 (2007) 384–395
case of a food scare. Similarly, perceived behavioural con-trol is relevant in standard situations but becomes negligi-ble in case of a food scare, while subjective norm emergesas marginal in both situations.
While it is unclear whether the SPARTA results can begeneralised to food products other than chicken, the statis-tical approach suggested in this paper increases the explan-atory and predictive power of models based on the Theoryof Planned Behaviour.
There are some limitations to this research that providescope for future work. First, there needs to be more of atheoretical basis for the integration of risk perception andtrust as possible direct influences on intention to purchase.Although these results indicate that the inter-relationshipbetween risk perception and trust is not fully demonstrativein the case of intention to purchase chicken, it does givehope for further development of such work in the TPBframework. Second, the issue of distinguishing betweensource of information and information content (the posi-tive and negative direction of information) should be fur-ther explored.
Appendix A. Socio-demographic variables
Variable
Categories Validobserved%
Age
18–30 years 136 25.6 31–45 years 161 30.3 46–60 years 139 26.2 More than 60 years 95 17.9Total
531 100.0Education
No formal education 20 3.8 Primary school 5 1.0 Lower Secondary School 115 22.0 Higher Secondary School 245 46.9 Tertiary educationnon-university degree80
15.3University degree
57 10.9Total
522 100.0Children
No children under 16 315 59.1 With children under 16 218 40.9Total
533 100.0Income
Less than €15,000 92 22.3 15,000–29,999 124 30.0 30,000–44,999 69 16.7 45,000–59,999 63 15.3 60,000–89,999 44 10.7 90,000–120,000 14 3.4 More than 120,000 7 1.7Total
413 100.0Appendix B. Marginal effects
Variable Very Neither Very
unlikely likelyIntention to purchase chicken (ITP1)
Constant * D4 0.08 0.02 0.06 0.09 0.23 0.10� 0.57 S 0.01 0.00 0.01 0.01 0.03 0.01� 0.07 S * D4 0.00 0.00 0.00� 0.01� 0.01� 0.01 0.03 P �0.01 0.00� 0.01� 0.01� 0.03� 0.01 0.08 A �0.01 0.00� 0.01� 0.01� 0.03� 0.01 0.08 A * D1 0.00 0.00 0.00 0.00� 0.01 0.00 0.01 A * D4 �0.01 0.00� 0.01� 0.01� 0.03� 0.01 0.08 R 0.00 0.00 0.00 0.01 0.01 0.01� 0.03 T1 0.01 0.00 0.01 0.01 0.02 0.01� 0.05 T2 0.00 0.00 0.00 0.01 0.01 0.01� 0.03 T3 0.00 0.00 0.00 0.00 0.01 0.00� 0.02 T4 �0.01 0.00� 0.01� 0.01� 0.02� 0.01 0.05 T4 * D1 0.01 0.00 0.01 0.01 0.03 0.01� 0.09 T5 0.04 0.01 0.03 0.05 0.12 0.05� 0.30 T5 * D1 �0.01 0.00� 0.01� 0.01� 0.03� 0.01 0.08Intention to purchase chicken (Salmonella scare, ITP2)
Constant * D4
0.13 0.03 0.00� 0.01� 0.03� 0.05� 0.06 S 0.07 0.02 0.00� 0.01� 0.02� 0.03� 0.04 S * D4 �0.02� 0.01 0.00 0.00 0.01 0.01 0.01 P 0.01 0.00 0.00 0.00 0.00 0.00 0.00 A �0.05� 0.01 0.00 0.00 0.01 0.02 0.02 R 0.00 0.00 0.00 0.00 0.00 0.00 0.00 T1 0.04 0.01 0.00 0.00� 0.01� 0.02� 0.02 T2 0.00 0.00 0.00 0.00 0.00 0.00 0.00 T3 0.13 0.03 0.00� 0.01� 0.03� 0.06� 0.06 T3 * D2 �0.05� 0.01 0.00 0.00 0.01 0.02 0.02 T4 0.03 0.01 0.00 0.00� 0.01� 0.01� 0.01 T5 0.02 0.00 0.00 0.00� 0.01� 0.01� 0.01References
Ajzen, I. (1985). From intentions to actions: A theory of plannedbehavior. In J. Kuhl & J. Beckman (Eds.), Action-control: From
cognition to behavior (pp. 11–39). Heidelberg: Springer.Ajzen, I. (1991). The theory of planned behavior. Organizational Behavior
and Human Decision Processes, 50, 179–211.Ajzen, I. (2002). Constructing a TPB Questionnaire: Conceptual and
methodological considerations, mimeo. Available: http://www-unix.oit.umass.edu/~aizen/tpb.html.
Ajzen, I., & Fishbein, M. (1980). Understanding attitudes and predicting
social behaviour. New Jersey: Englewood Prentice Hall.Bocker, A. (2002). Consumer response to a food safety incident: Exploring
the role of supplier differentiation in an experimental study. European
Review of Agricultural Economics, 29(1), 29–50.Churchill, G. A. (1979). A paradigm for developing better measures of
marketing constructs. Journal of Marketing Research, 16(February),64–73.
Conner, M., Povey, R., Sparks, P., & James, R. (2003). Moderating role ofattitudinal ambivalence within the theory of planned behaviour.British Journal of Social Psychology, 42, 75–94.
Cook, A. J., Kerr, G. N., & Moore, K. (2002). Attitudes and intentionstowards purchasing GM food. Journal of Economic Psychology, 23(5),557–572.

A.E. Lobb et al. / Food Quality and Preference 18 (2007) 384–395 395
Dennison, C. M., & Shepherd, R. (1995). Adolescent food choice: Anapplication of the Theory of Planned Behaviour. Journal of Human
Nutrition and Dietetics, 8(1), 9–23.Duntemann, P. (1989). Principal components analysis. California: Sage
Publications.East, R. (1997). Consumer behaviour: Advances and applications in
marketing. London: Prentice Hall.Fishbein, M., & Ajzen, I. (1976). Misconceptions about the Fishbein
model: Reflections on a study by Songer–Nocks. Journal of Experi-
mental Social Psychology, 12, 579–584.Frewer, L. J., Howard, C., Hedderley, D., & Shepherd, R. (1996). What
determines trust in information about food-related risks? Underlyingpsychological constructs. Risk Analysis, 16(4), 473–486.
Greene, W. H. (2003). Econometric analysis (5th ed.). Prentice Hall.Kalafatis, S. P., Pollar, M., East, R., & Tsogas, M. H. (1999). Green
marketing and Ajzen’s Theory of Planned Behaviour: A cross marketexamination. Journal of Consumer Marketing, 16(5), 441–460.
Liao, T. F. (1994). Interpreting probability models: Logit, probit andother generalised linear models. Quantitative applications in the socialsciences series # 101. Sage University Paper, CA.
Liu, S., Huang, J.-C., & Brown, G. L. (1998). Information and riskperception: A dynamic adjustment process. Risk Analysis, 18(6),689–699.
Lobb, A. E. (2005). Consumer trust, risk and food safety: A review. Food
Economics, 2, 3–12.Lynne, G. D., Casey, C. F., Hodges, A., & Rahmani, M. (1995).
Conservation technology adoption decisions and the theory of plannedbehaviour. Journal of Economic Psychology, 16(1995), 581–598.
Povey, R., Conner, M., Sparks, P., James, R., & Shepherd, R. (2000).Application of the Theory of Planned Behaviour to two eatingbehaviours: Roles of perceived control and self-efficacy. British Journal
of Health Psychology, 5, 121–139.Shaw, D., & Shiu, E. (2002). An assessment of ethical obligation and self-
identity in ethical consumer decision-making: A structural equationmodelling approach. International Journal of Consumer Studies, 26(4),286–293.
Slovic, P. (1992). Perceptions of risk: Reflections on the psychometricparadigm. In S. Krimsky & D. Golding (Eds.), Social theories of risk.Westport: Praeger.
Tonglet, M. (2001). Consumer misbehaviour: An exploratory study ofshoplifting. Journal of Consumer Behaviour, 1(4), 336–354.
Zaibet, L., & Bredahl, M. E. (1997). Gains from ISO certification in theUK meat sector. Agribusiness, 13(4), 375–384.
Copyright © 2022 FDOKUMEN