Modelling pesticide volatilization after soil application using the mechanistic model Volt'Air
10
Modelling pesticide volatilization after soil application using the mechanistic model Volt’Air Carole Bedos a, * , Sophie Ge ´ nermont a , Edith Le Cadre b , Lucas Garcia a , Enrique Barriuso a , Pierre Cellier a a INRA/AgroParisTech 1091, Environment and Arable Crops Research Unit, F-78850 Thiverval-Grignon, France b INRA/Sup Agro Montpellier 1222, Soil and Rhizosphere Biogeochemistry Research Unit, F-34060 Montpellier, France article info Article history: Received 13 June 2008 Received in revised form 6 March 2009 Accepted 13 March 2009 Keywords: Emission Atmosphere Pedo-climatic conditions Henry’s law constant Adsorption coefficient abstract Volatilization of pesticides participates in atmospheric contamination and affects environmental ecosystems including human welfare. Modelling at relevant time and spatial scales is needed to better understand the complex processes involved in pesticide volatilization. Volt’Air-Pesticides has been developed following a two-step procedure to study pesticide volatilization at the field scale and at a quarter time step. Firstly, Volt’Air-NH 3 was adapted by extending the initial transfer of solutes to pesticides and by adding specific calculations for physico-chemical equilibriums as well as for the degradation of pesticides in soil. Secondly, the model was evaluated in terms of 3 pesticides applied on bare soil (atrazine, alachlor, and trifluralin) which display a wide range of volatilization rates. A sensitivity analysis confirmed the relevance of tuning to K h . Then, using Volt’Air-Pesticides, environmental condi- tions and emission fluxes of the pesticides were compared to fluxes measured under 2 environmental conditions. The model fairly well described water temporal dynamics, soil surface temperature, and energy budget. Overall, Volt’Air-Pesticides estimates of the order of magnitude of the volatilization flux of all three compounds were in good agreement with the field measurements. The model also satisfactorily simulated the decrease in the volatilization rate of the three pesticides during night-time as well as the decrease in the soil surface residue of trifluralin before and after incorporation. However, the timing of the maximum flux rate during the day was not correctly described, thought to be linked to an increased adsorption under dry soil conditions. Thanks to Volt’Air’s capacity to deal with pedo-climatic conditions, several existing parameterizations describing adsorption as a function of soil water content could be tested. However, this point requires further investigation. Practically speaking, Volt’Air-Pesticides can be a useful tool to make decision about agricultural practices such as incorporation or for the estimation of overall pesticide volatilization rates, and it holds promise for time specific dynamics. Ó 2009 Elsevier Ltd. All rights reserved. 1. Introduction Pesticide volatilization participates in atmospheric pollution and in turn affects environmental ecosystems including human welfare. Experimental studies have shown that pesticide volatili- zation may involve as much as 90% of the application dose under some conditions (Bedos et al., 2002). It may last for several days to a few weeks (or sometimes even longer like decades, (Scholtz and Bidleman, 2007)) and it may also occur after an atmospheric deposition (‘‘the grasshopper’’ effect as simulated by Scholtz and Bidleman (2006)). It exhibits a diurnal cycle correlated with temperature (Wang et al., 1997), solar radiation, and atmospheric stability as well as with soil moisture. Due to interactions with the soil matrix, transport, and transformation processes, volatilization is directly and indirectly controlled by physico-chemical and environmental factors as well as soil management (van den Berg et al., 1999). Modelling at relevant time and spatial scales is needed to better understand the complex processes involved in pesticide volatili- zation. Different approaches have been developed depending on given objectives. One approach is based on empirical correlations between measured volatilization rates and the physico-chemical characteristics of the compounds. They permit a rough classifica- tion of pesticide volatilization potential (Jansma and Linders, 1995; Smit et al., 1998, 1997; Woodrow et al., 1997). More complex models * Corresponding author. Tel.: þ33 (0)1 30 81 55 36; fax: þ33 (0)1 30 81 55 63. E-mail addresses: [email protected] (C. Bedos), sophie.genermont@ grignon.inra.fr (S. Ge ´ nermont), [email protected] (E. Le Cadre), lucas.garcia@ grignon.inra.fr (L. Garcia), [email protected] (E. Barriuso), pierre. [email protected] (P. Cellier). Contents lists available at ScienceDirect Atmospheric Environment journal homepage: www.elsevier.com/locate/atmosenv 1352-2310/$ – see front matter Ó 2009 Elsevier Ltd. All rights reserved. doi:10.1016/j.atmosenv.2009.03.024 Atmospheric Environment 43 (2009) 3630–3639
-
Upload
independent -
Category
Documents
-
view
0 -
download
0
Transcript of Modelling pesticide volatilization after soil application using the mechanistic model Volt'Air
lable at ScienceDirect
Atmospheric Environment 43 (2009) 3630–3639
Contents lists avai
Atmospheric Environment
journal homepage: www.elsevier .com/locate/a tmosenv
Modelling pesticide volatilization after soil application using the mechanisticmodel Volt’Air
Carole Bedos a,*, Sophie Genermont a, Edith Le Cadre b, Lucas Garcia a,Enrique Barriuso a, Pierre Cellier a
a INRA/AgroParisTech 1091, Environment and Arable Crops Research Unit, F-78850 Thiverval-Grignon, Franceb INRA/Sup Agro Montpellier 1222, Soil and Rhizosphere Biogeochemistry Research Unit, F-34060 Montpellier, France
a r t i c l e i n f o
Article history:Received 13 June 2008Received in revised form6 March 2009Accepted 13 March 2009
Keywords:EmissionAtmospherePedo-climatic conditionsHenry’s law constantAdsorption coefficient
* Corresponding author. Tel.: þ33 (0)1 30 81 55 36E-mail addresses: [email protected] (C
grignon.inra.fr (S. Genermont), [email protected] (L. Garcia), enrique.barriuso@[email protected] (P. Cellier).
1352-2310/$ – see front matter � 2009 Elsevier Ltd.doi:10.1016/j.atmosenv.2009.03.024
a b s t r a c t
Volatilization of pesticides participates in atmospheric contamination and affects environmentalecosystems including human welfare. Modelling at relevant time and spatial scales is needed to betterunderstand the complex processes involved in pesticide volatilization. Volt’Air-Pesticides has beendeveloped following a two-step procedure to study pesticide volatilization at the field scale and ata quarter time step. Firstly, Volt’Air-NH3 was adapted by extending the initial transfer of solutes topesticides and by adding specific calculations for physico-chemical equilibriums as well as for thedegradation of pesticides in soil. Secondly, the model was evaluated in terms of 3 pesticides applied onbare soil (atrazine, alachlor, and trifluralin) which display a wide range of volatilization rates. A sensitivityanalysis confirmed the relevance of tuning to Kh. Then, using Volt’Air-Pesticides, environmental condi-tions and emission fluxes of the pesticides were compared to fluxes measured under 2 environmentalconditions. The model fairly well described water temporal dynamics, soil surface temperature, andenergy budget. Overall, Volt’Air-Pesticides estimates of the order of magnitude of the volatilization flux ofall three compounds were in good agreement with the field measurements. The model also satisfactorilysimulated the decrease in the volatilization rate of the three pesticides during night-time as well as thedecrease in the soil surface residue of trifluralin before and after incorporation. However, the timing of themaximum flux rate during the day was not correctly described, thought to be linked to an increasedadsorption under dry soil conditions. Thanks to Volt’Air’s capacity to deal with pedo-climatic conditions,several existing parameterizations describing adsorption as a function of soil water content could betested. However, this point requires further investigation. Practically speaking, Volt’Air-Pesticides can bea useful tool to make decision about agricultural practices such as incorporation or for the estimation ofoverall pesticide volatilization rates, and it holds promise for time specific dynamics.
� 2009 Elsevier Ltd. All rights reserved.
1. Introduction
Pesticide volatilization participates in atmospheric pollutionand in turn affects environmental ecosystems including humanwelfare. Experimental studies have shown that pesticide volatili-zation may involve as much as 90% of the application dose undersome conditions (Bedos et al., 2002). It may last for several days toa few weeks (or sometimes even longer like decades, (Scholtz andBidleman, 2007)) and it may also occur after an atmospheric
; fax: þ33 (0)1 30 81 55 63.. Bedos), sophie.genermont@fr (E. Le Cadre), [email protected] (E. Barriuso), pierre.
All rights reserved.
deposition (‘‘the grasshopper’’ effect as simulated by Scholtz andBidleman (2006)). It exhibits a diurnal cycle correlated withtemperature (Wang et al., 1997), solar radiation, and atmosphericstability as well as with soil moisture. Due to interactions with thesoil matrix, transport, and transformation processes, volatilizationis directly and indirectly controlled by physico-chemical andenvironmental factors as well as soil management (van den Berget al., 1999).
Modelling at relevant time and spatial scales is needed to betterunderstand the complex processes involved in pesticide volatili-zation. Different approaches have been developed depending ongiven objectives. One approach is based on empirical correlationsbetween measured volatilization rates and the physico-chemicalcharacteristics of the compounds. They permit a rough classifica-tion of pesticide volatilization potential (Jansma and Linders, 1995;Smit et al., 1998, 1997; Woodrow et al., 1997). More complex models
List of symbols
a air content (m3 m�3)ai, bi coefficients of the advection modelCS, CL, Cg solute concentrations in solid, aqueous and
gaseous phase (mol m�3)C atmospheric concentration in the air (mg m�3)Dc
W, Dcg diffusion coefficients in liquid and gaseous
phases (m2 s�1)Dc
aq, Dcair diffusion coefficients in water and in air (m2 s�1)
DHn and DHd heat of vaporization and dissolution (J mol�1)DT50 half-life time (day)F soil porosity (m3 m�3)f0C fraction of organic carbon (kg kg�1)Fss increase of soil sorption when soil is air dry
(dimensionless)JW vertical flow water in the soil (m s�1)k Von Karman constant (¼0.4) (dimensionless)
Kd sorption coefficient (m3 kg�1)Kd,eff, Kd,max effective and maximum sorption coefficient
(m3 kg�1)Kh Henry’s law constant (dimensionless)Koc soil sorption coefficient (m3 kg�1)qw volumetric water content (m3 m�3)qpw gravimetric water content (kg kg�1)qplow water content below which sorption coefficient
increases (kg kg�1)qad volume fraction liquid phase when soil is air dry
(m3 m�3)qwp soil water content at the wilting point (m3 m�3)R universal gas constant (¼8.32) (Pa m3 K�1 mol�1)rb bulk density (kg m�3)u* friction velocity (m s�1)x fetch (m)z0 roughness length (m)
C. Bedos et al. / Atmospheric Environment 43 (2009) 3630–3639 3631
(e.g., BAM, Behaviour Assessment Model (Jury et al., 1983))dbasedon an analytical solution of the convective-dispersion equationalong with hypotheses about environmental conditionsdalsopropose a classification of volatilization potential (e.g., the 3 classesbased on Henry’s law constant as derived by BAM). Parameteriza-tions were thereby derived and implemented in environmentalmodels like PRZM (Carsel et al., 1999), PEARL (Leistra et al., 2001;Tiktak et al., 2000) or PELMO (Klein, 1995) to correctly describe theobserved behaviour of pesticides in soil (Jury and Ghodrati, 1989).Different levels of description have been chosen in these models(van den Berg et al., 2003; Vanclooster et al., 2003): empiricalrelations in MACRO, the laminar boundary layer derived from BAMin PRZM or PELMO (Ferrari et al., 2005, 2003; Wolters et al., 2004)and recently, a more complete description with resistance param-eterizations in PEARL (van den Berg and Leistra, 2004; van den Berget al., 2003). However, various difficulties arise when trying 1) todefine a value for the active air layer (i.e., the boundary air layerabove the soil surface) (Ferrari et al., 2005), 2) to take into accountatmospheric stability (van den Berg et al., 2003), or 3) to adapt theinitial time step (usually a daily time step) to lower ones as requiredto study the volatilization process.
Given measured volatilization rates of triallate applied to bare soil,Yates (2006) and Yates et al. (2002) compared different parameteri-zations going from the mathematical formulation of BAM to coupledsoil and micrometeorological conditions. They concluded that themore sophisticated models, like the latter one, are necessary to obtaina more accurate characterization of volatilization over short periodsalthough this approach requires considerably more data in terms ofatmospheric processes. In contrast, this approach gave a less accuratetotal emission, thus improved methods for simulating the early timebehaviour were urged. In the meantime, PEM (Pesticide EmissionModel) was developed and it stands out from other models because itaims to study the volatilization process and its dynamics at the fieldscale over time, and eventually at a given time (Scholtz et al.,2002a,b). PEM testing against experimental data (Pattey et al., 1995)recording trifluralin and triallate volatilization applied on bare soilwas found to be in good agreement in terms of order of magnitudeand duration of the first volatilization peak and in terms of hourlyvolatilization rates, despite some discrepancies for the latent andsensible heat fluxes. However, looking at the comparison of modelledand measured fluxes in the case of triallate, a small temporal delaycan be detected between the modelled maximum value and daytimefield measurements. Difficulties in describing volatilization rate
under dry conditions were noticed by Baker et al. (1996). Generallyspeaking, mechanistic models devoted to study pesticides volatili-zation at an appropriate time step are few and far between and theyusually require much input data.
Volt’Air is a mechanistic model that was first developed byGenermont and Cellier (1997) to describe ammonia volatilizationafter slurry application and subsequently adapted to mineralfertilizers by Le Cadre (2004). It was built so that (i) input data areeasy to obtain, (ii) both air and soil compartments are fullydescribed thereby depicting the pedo-climatic conditions, and (iii)soil management practices are also described. This paper presentsVolt’Air-Pesticides researched and developed to simulate pesticidevolatilization following a two-step procedure. Firstly, the initialtransfer of solutes was extended to pesticides, and specific calcu-lations for physico-chemical equilibriums as well as for the degra-dation of pesticides in soil were added. Secondly, the model wasevaluated in terms of three pesticides applied on bare soil (atrazine,alachlor, and trifluralin) which display a wide range of volatilizationrates. This involved a sensitivity analysis. Then, using Volt’Air-Pesticides, soil surface temperature, soil water content, heat,moisture, and emission fluxes of the pesticides were modelled andcompared to corresponding measurements under 2 environmentalconditions in Rennes and Grignon (France) which are used asreference scenarios. Model performance is discussed in terms ofefficiency factors (EF) in relation to various parameterizationsincluding adsorption as a function of soil water content. Finally,some examples of potential applications of the model are given.
2. Materials and methods
2.1. Model description
We consider applications on bare soil. A detailed presentation ofthe core of the model is available in Genermont and Cellier (1997) andLe Cadre (2004). Briefly, two environmental compartments areconsidered in a 1D approach: soil and atmosphere. The soil isdescribed as homogeneous horizontal layers down to 1 or 1.5 m, withlayer thickness in quasi geometrical progression. Within this soilprofile, horizontal gradients of water content, temperature, and soluteconcentrations are assumed to be negligible compared to verticalones. Pesticides are assumed to be homogeneously distributed in thefirst layer of the soil (which thickness is fixed by the user, usuallybetween 0.003and 0.02 m) for surface application and in several layers
C. Bedos et al. / Atmospheric Environment 43 (2009) 3630–36393632
down to incorporation depth (given by the agricultural practicescarried out, usually several cm) when incorporation is carried out.
The water vertical transfer is based on Darcy’s law (generalizedto the unsaturated zone) with transfer coefficients derived from soiltexture (11 soil types) using pedo-transfer functions (Clapp andHornberger, 1978). Heat transfer is based on Fourier’s law. Theenergy budget gives by iteration the soil surface temperature(which is a key factor governing exchanges at the soil/atmosphereinterface) together with each term of the energy budget i.e.,sensible and latent heat transfers, soil heat flux, and net radiation(Cellier et al., 1996; Guilioni et al., 2000; Noilhan and Planton,1989).
The time scale is set typically to 15 min, but it can be changed byusers in input files. Some calculations are performed at shorter timescales, due to the mechanism described and convergence require-ments (e.g., 10 s for soil transfer, imposed in the model). Simulatedvolatilization episodes may range from several days to severalweeks. The numerical resolution follows an explicit scheme.
2.1.1. Physico-chemical equilibriums for pesticidesWe assume instantaneous equilibriums occurring in an ideal
aqueous solution in equilibrium with solid and gas phases. Thus,ionic strength is not taken into account. Following Jury et al. (1983),the total solute concentration in the soil, CT, is given by:
CT ¼ rbCsþ qwCL þ aCG (1)
(Symbols are presented in the list of symbols).Partitioning between gas and liquid as well as solid and liquid
phases is assumed to be given by linear relationships:
CG ¼ KhðTÞCL and Cs ¼ KdCL (2)
Temperature effect on Henry’s law constant is taken into accountaccording to Asman et al. (2003):
KhðTÞ ¼ Khref �Tref
T� e
ðDHv � DHdÞ �
1Tref� 1
T
R
!(3)
The following default values can be used: 95,000 J mol�1 for DHv
(resulting from the average over 15 pesticides – from 58,000 to146,000 J mol�1 (Smit et al., 1997)) and 27,000 J mol�1 for DHd
(resulting from the average over 18 pesticides – from 17,380 to156,260 J mol�1, (Smit et al., 1997)). For trifluralin, the value of120,000 J mol�1 is used for DHv (Smit et al.,1997). Tref is set to 25�C inthe model. According to Equation (3), an increase of 10�C intemperature may lead to a doubling of Henry’s law constant at least.
Equation (2) shows that the Volt’Air parameterization foradsorption is a linear relationship, with Kd equal to the product offoc by Koc. However, this cannot reflect observations that show thatvolatilization decreases under dry conditions. Taylor and Spencer(1990) consider that adsorption may increase below the limit ofa monomolecular layer of water on adsorption sites, which corre-sponds roughly to a water content of 0.03 kg kg�1, depending onsoil types. Thus, two simple approaches describing Kd as a functionof soil water content have been proposed (Vanclooster et al., 2003).They were implemented in Volt’Air for the dry soil conditions inorder to compare them to the current one. The former approach hasbeen implemented in PEARL (van den Berg et al., 2003):
Kd;eff ¼ Kd;maxe�aqpW for qpw < qplow (4)
a is a coefficient calculated by substituting qplow for qpw and Kd forKd,eff in the previous equation; qplow is set equal to the water contentat the wilting point. The later approach has been implemented inPELMO (Ferrari et al., 2005):
Kd;eff ¼ KdFss when qw < qad and Kd;eff
¼ Kd10m when qad < qw < qwp (5)
The exponent m (dimensionless) is given by a relation between Fss,qad, qw and qwp. This approach is used only for the thin surface layer,which is 1 mm thick in PELMO. In the present state, PELMO auto-matically estimates qad as 10% of qwp.
2.1.2. Degradation of pesticidesVolt’Air considers a first order kinetic reaction given by the half
life time (DT50) as in Jury’s model (Jury et al., 1983). Differentialdegradation depending on the considered phase is not distin-guished. The metabolite behaviour is not considered.
2.1.3. Transfer of pesticides in soilAqueous and gaseous solute transfers through the soil are
described by Fick’s law and occur by diffusion and convection:
vClqW
vt¼ �vJW ðqW ÞCl
vzþ
vDWC
vClqWvz
vzand
vCgðf� qW Þvt
¼vDg
CvCgðf�qW Þ
vz
vz(6)
These diffusion coefficients take into account a tortuosity factor(Jury et al., 1983):
DWC ¼ Daq
cqW
f2
10=3
DgC ¼ Dair
cðf� qW Þ
f2
10=3
(7)
The diffusion coefficients are set equal for all pesticides, to4.97� 10�10 et 4.96� 10�6 m2 s�1 in water and in air respectively asassumed by Jury et al. (1983).
2.1.4. Volatilization parameterizationThe volatilization flux is calculated following the model of local
advection of Itier et al. (1994) and Itier and Perrier (1976):
Volatilization flux ¼ ku*aiC�
0:3xz0
�bi
(8)
This parameterization assumes that there are no significantchanges in roughness length between the treated field and upwindconditions. Upwind volatilization fluxes and concentrations can begiven as input when they are known.
2.1.5. Agricultural practicesFour types of management scenarios can be run with Volt’Air-
Pesticides: (i) no treatment (ii) fertilizers only (iii) pesticides onlyand (iv) fertilizers and pesticides. Incorporation may be simulatedat any time according to the formalism of Genermont and Cellier(1997). The pesticide is mixed homogenously throughout the depthof incorporation. Irrigation, its timing and intensity, may also betaken into account.
2.2. Description of the field experiments
The model was tested with two different datasets obtained atthe field scale under different environmental conditions detailed inCellier et al. (2004) and Bedos et al. (2006). Briefly, volatilizationfluxes were calculated with the aerodynamic profile method. Thefirst dataset (Cellier et al., 2004) involves atrazine and alachlorvolatilization after application over a 10-ha field with a corn cropnear Rennes (48.1�N; 1.7�W), located in the north-west of France.Volatilization fluxes were monitored from 30 May (Day Of Year 150)to 3 June 2001 (DOY 154) with an additional sampling on DOY 159.
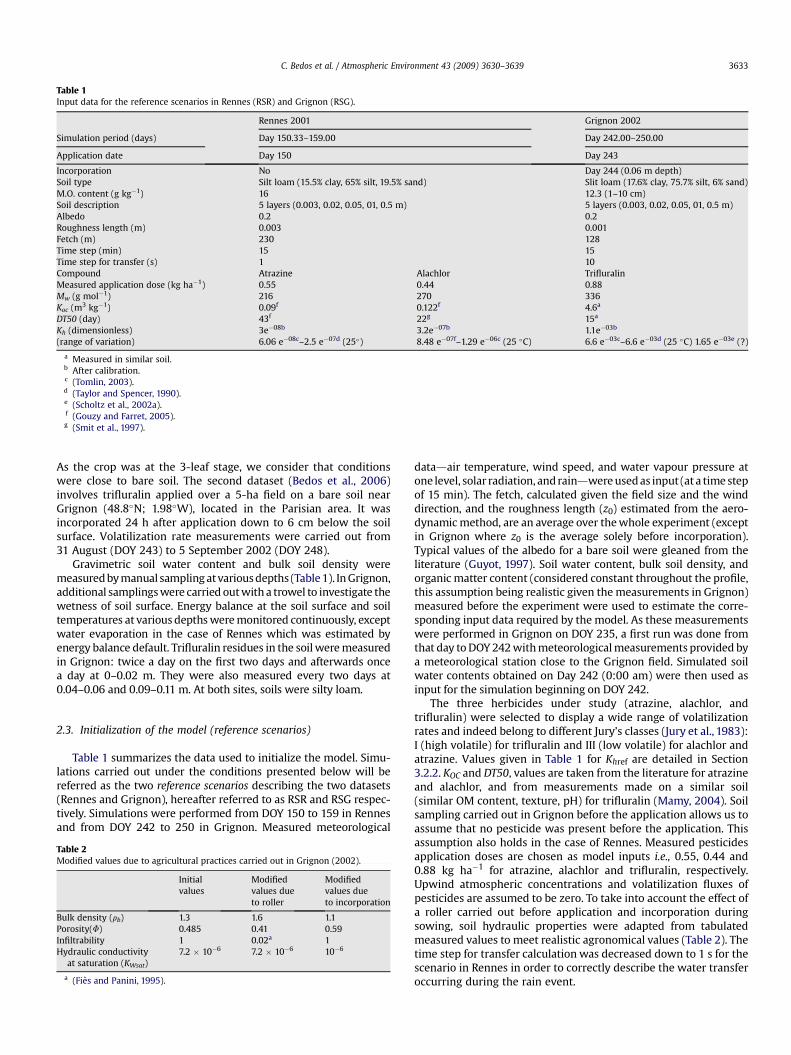
Table 1Input data for the reference scenarios in Rennes (RSR) and Grignon (RSG).
Rennes 2001 Grignon 2002
Simulation period (days) Day 150.33–159.00 Day 242.00–250.00
Application date Day 150 Day 243
Incorporation No Day 244 (0.06 m depth)Soil type Silt loam (15.5% clay, 65% silt, 19.5% sand) Slit loam (17.6% clay, 75.7% silt, 6% sand)M.O. content (g kg�1) 16 12.3 (1–10 cm)Soil description 5 layers (0.003, 0.02, 0.05, 01, 0.5 m) 5 layers (0.003, 0.02, 0.05, 01, 0.5 m)Albedo 0.2 0.2Roughness length (m) 0.003 0.001Fetch (m) 230 128Time step (min) 15 15Time step for transfer (s) 1 10Compound Atrazine Alachlor TrifluralinMeasured application dose (kg ha�1) 0.55 0.44 0.88Mw (g mol�1) 216 270 336Koc (m3 kg�1) 0.09f 0.122f 4.6a
DT50 (day) 43f 22g 15a
Kh (dimensionless) 3e�08b 3.2e�07b 1.1e�03b
(range of variation) 6.06 e�08c–2.5 e�07d (25�) 8.48 e�07f–1.29 e�06c (25 �C) 6.6 e�03c–6.6 e�03d (25 �C) 1.65 e�03e (?)
a Measured in similar soil.b After calibration.c (Tomlin, 2003).d (Taylor and Spencer, 1990).e (Scholtz et al., 2002a).f (Gouzy and Farret, 2005).g (Smit et al., 1997).
C. Bedos et al. / Atmospheric Environment 43 (2009) 3630–3639 3633
As the crop was at the 3-leaf stage, we consider that conditionswere close to bare soil. The second dataset (Bedos et al., 2006)involves trifluralin applied over a 5-ha field on a bare soil nearGrignon (48.8�N; 1.98�W), located in the Parisian area. It wasincorporated 24 h after application down to 6 cm below the soilsurface. Volatilization rate measurements were carried out from31 August (DOY 243) to 5 September 2002 (DOY 248).
Gravimetric soil water content and bulk soil density weremeasured by manual sampling at various depths (Table 1). In Grignon,additional samplings were carried out with a trowel to investigate thewetness of soil surface. Energy balance at the soil surface and soiltemperatures at various depths were monitored continuously, exceptwater evaporation in the case of Rennes which was estimated byenergy balance default. Trifluralin residues in the soil were measuredin Grignon: twice a day on the first two days and afterwards oncea day at 0–0.02 m. They were also measured every two days at0.04–0.06 and 0.09–0.11 m. At both sites, soils were silty loam.
2.3. Initialization of the model (reference scenarios)
Table 1 summarizes the data used to initialize the model. Simu-lations carried out under the conditions presented below will bereferred as the two reference scenarios describing the two datasets(Rennes and Grignon), hereafter referred to as RSR and RSG respec-tively. Simulations were performed from DOY 150 to 159 in Rennesand from DOY 242 to 250 in Grignon. Measured meteorological
Table 2Modified values due to agricultural practices carried out in Grignon (2002).
Initialvalues
Modifiedvalues dueto roller
Modifiedvalues dueto incorporation
Bulk density (rb) 1.3 1.6 1.1Porosity(F) 0.485 0.41 0.59Infiltrability 1 0.02a 1Hydraulic conductivity
at saturation (KWsat)7.2 � 10�6 7.2 � 10�6 10�6
a (Fies and Panini, 1995).
datadair temperature, wind speed, and water vapour pressure atone level, solar radiation, and raindwere used as input (at a time stepof 15 min). The fetch, calculated given the field size and the winddirection, and the roughness length (z0) estimated from the aero-dynamic method, are an average over the whole experiment (exceptin Grignon where z0 is the average solely before incorporation).Typical values of the albedo for a bare soil were gleaned from theliterature (Guyot, 1997). Soil water content, bulk soil density, andorganic matter content (considered constant throughout the profile,this assumption being realistic given the measurements in Grignon)measured before the experiment were used to estimate the corre-sponding input data required by the model. As these measurementswere performed in Grignon on DOY 235, a first run was done fromthat day to DOY 242 with meteorological measurements provided bya meteorological station close to the Grignon field. Simulated soilwater contents obtained on Day 242 (0:00 am) were then used asinput for the simulation beginning on DOY 242.
The three herbicides under study (atrazine, alachlor, andtrifluralin) were selected to display a wide range of volatilizationrates and indeed belong to different Jury’s classes (Jury et al., 1983):I (high volatile) for trifluralin and III (low volatile) for alachlor andatrazine. Values given in Table 1 for Khref are detailed in Section3.2.2. KOC and DT50, values are taken from the literature for atrazineand alachlor, and from measurements made on a similar soil(similar OM content, texture, pH) for trifluralin (Mamy, 2004). Soilsampling carried out in Grignon before the application allows us toassume that no pesticide was present before the application. Thisassumption also holds in the case of Rennes. Measured pesticidesapplication doses are chosen as model inputs i.e., 0.55, 0.44 and0.88 kg ha�1 for atrazine, alachlor and trifluralin, respectively.Upwind atmospheric concentrations and volatilization fluxes ofpesticides are assumed to be zero. To take into account the effect ofa roller carried out before application and incorporation duringsowing, soil hydraulic properties were adapted from tabulatedmeasured values to meet realistic agronomical values (Table 2). Thetime step for transfer calculation was decreased down to 1 s for thescenario in Rennes in order to correctly describe the water transferoccurring during the rain event.
C. Bedos et al. / Atmospheric Environment 43 (2009) 3630–36393634
2.4. Sensitivity analysis
A sensitivity analysis was performed with the pedo-climaticconditions of Rennes and was applied to trifluralin and atrazine, thesecompounds depicting contrasted physico-chemical characteristics.We focused our analysis on two criteria: (1) the maximum volatili-zation rate and (2) the cumulated losses in order to cover the differentpatterns exhibited by the various pesticides as well as the effect of soilresidue availability over a long period of simulation. Results areexpressed as the ratio of the considered criteria obtained with a givenvalue of the selected factor over the criteria obtained for the simula-tion with the selected value of the criteria in the reference scenariospresented in Section 2.3. The ranges of variation of the differentparameters were selected in accordance with the actual ones. The firstsensitivity analysis dealt with the physico-chemical properties of thecompounds which are characterized by a high degree of uncertaintyleading to multiple values in the literature for a given compound(Table 1). Consequently, 8 values of Kh ranging from 2.4 � 10�8 to3.0�10�7 for atrazine and from 8.8� 10�4 to 1.1�10�2 for trifluralinwere selected. As Koc is estimated with an uncertainty as large as oneorder of magnitude (Calvet et al., 2005), the 8 values ranged from1.8� 10�2 to 9.0� 10�1 for atrazine and from 9.2�10�1 to 4.6�10þ1
for trifluralin. Then, tests were performed on soil hydraulic charac-teristics (soil water pressure head at saturation (hWsat) and hydraulic
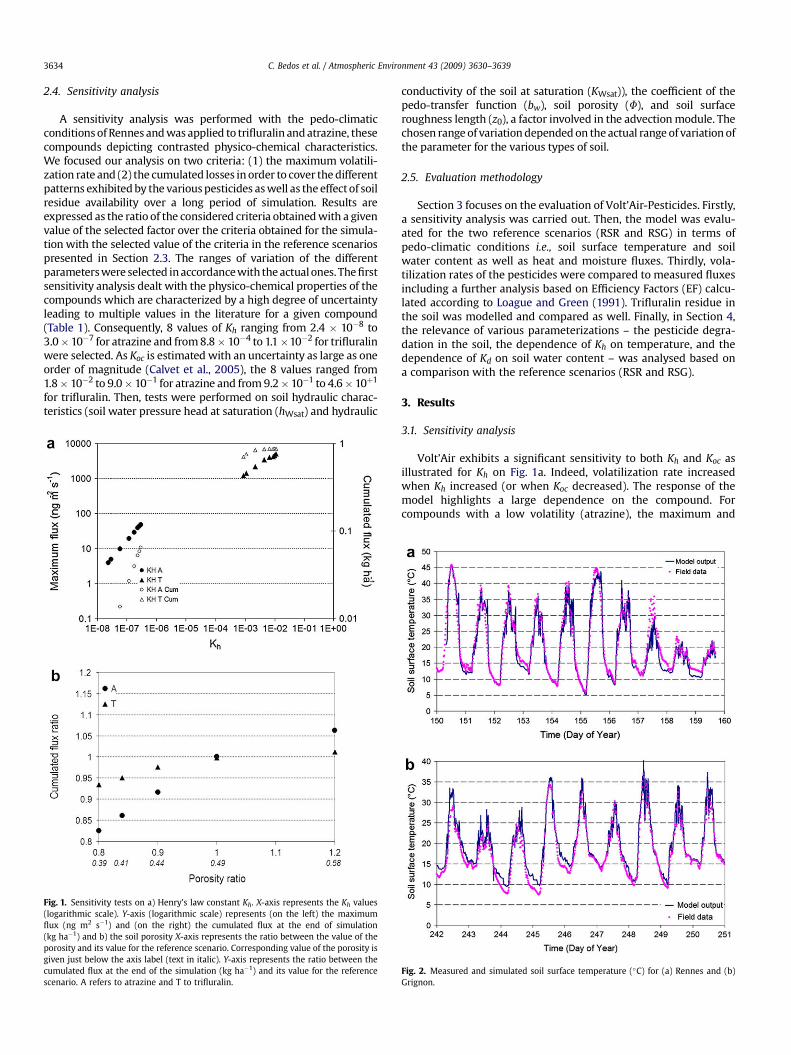
Fig. 1. Sensitivity tests on a) Henry’s law constant Kh. X-axis represents the Kh values(logarithmic scale). Y-axis (logarithmic scale) represents (on the left) the maximumflux (ng m2 s�1) and (on the right) the cumulated flux at the end of simulation(kg ha�1) and b) the soil porosity X-axis represents the ratio between the value of theporosity and its value for the reference scenario. Corresponding value of the porosity isgiven just below the axis label (text in italic). Y-axis represents the ratio between thecumulated flux at the end of the simulation (kg ha�1) and its value for the referencescenario. A refers to atrazine and T to trifluralin.
conductivity of the soil at saturation (KWsat)), the coefficient of thepedo-transfer function (bw), soil porosity (F), and soil surfaceroughness length (z0), a factor involved in the advection module. Thechosen range of variation depended on the actual range of variation ofthe parameter for the various types of soil.
2.5. Evaluation methodology
Section 3 focuses on the evaluation of Volt’Air-Pesticides. Firstly,a sensitivity analysis was carried out. Then, the model was evalu-ated for the two reference scenarios (RSR and RSG) in terms ofpedo-climatic conditions i.e., soil surface temperature and soilwater content as well as heat and moisture fluxes. Thirdly, vola-tilization rates of the pesticides were compared to measured fluxesincluding a further analysis based on Efficiency Factors (EF) calcu-lated according to Loague and Green (1991). Trifluralin residue inthe soil was modelled and compared as well. Finally, in Section 4,the relevance of various parameterizations – the pesticide degra-dation in the soil, the dependence of Kh on temperature, and thedependence of Kd on soil water content – was analysed based ona comparison with the reference scenarios (RSR and RSG).
3. Results
3.1. Sensitivity analysis
Volt’Air exhibits a significant sensitivity to both Kh and Koc asillustrated for Kh on Fig. 1a. Indeed, volatilization rate increasedwhen Kh increased (or when Koc decreased). The response of themodel highlights a large dependence on the compound. Forcompounds with a low volatility (atrazine), the maximum and
Fig. 2. Measured and simulated soil surface temperature (�C) for (a) Rennes and (b)Grignon.
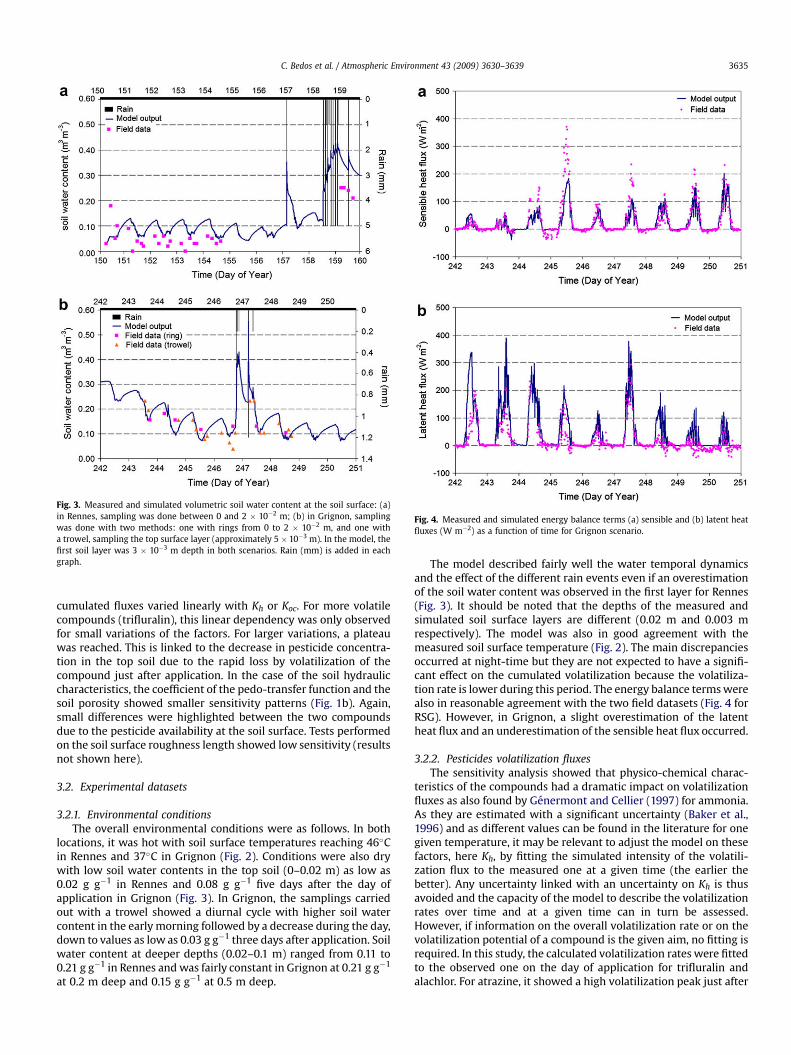
Fig. 3. Measured and simulated volumetric soil water content at the soil surface: (a)in Rennes, sampling was done between 0 and 2 � 10�2 m; (b) in Grignon, samplingwas done with two methods: one with rings from 0 to 2 � 10�2 m, and one witha trowel, sampling the top surface layer (approximately 5 � 10�3 m). In the model, thefirst soil layer was 3 � 10�3 m depth in both scenarios. Rain (mm) is added in eachgraph.
Fig. 4. Measured and simulated energy balance terms (a) sensible and (b) latent heatfluxes (W m�2) as a function of time for Grignon scenario.
C. Bedos et al. / Atmospheric Environment 43 (2009) 3630–3639 3635
cumulated fluxes varied linearly with Kh or Koc. For more volatilecompounds (trifluralin), this linear dependency was only observedfor small variations of the factors. For larger variations, a plateauwas reached. This is linked to the decrease in pesticide concentra-tion in the top soil due to the rapid loss by volatilization of thecompound just after application. In the case of the soil hydrauliccharacteristics, the coefficient of the pedo-transfer function and thesoil porosity showed smaller sensitivity patterns (Fig. 1b). Again,small differences were highlighted between the two compoundsdue to the pesticide availability at the soil surface. Tests performedon the soil surface roughness length showed low sensitivity (resultsnot shown here).
3.2. Experimental datasets
3.2.1. Environmental conditionsThe overall environmental conditions were as follows. In both
locations, it was hot with soil surface temperatures reaching 46�Cin Rennes and 37�C in Grignon (Fig. 2). Conditions were also drywith low soil water contents in the top soil (0–0.02 m) as low as0.02 g g�1 in Rennes and 0.08 g g�1 five days after the day ofapplication in Grignon (Fig. 3). In Grignon, the samplings carriedout with a trowel showed a diurnal cycle with higher soil watercontent in the early morning followed by a decrease during the day,down to values as low as 0.03 g g�1 three days after application. Soilwater content at deeper depths (0.02–0.1 m) ranged from 0.11 to0.21 g g�1 in Rennes and was fairly constant in Grignon at 0.21 g g�1
at 0.2 m deep and 0.15 g g�1 at 0.5 m deep.
The model described fairly well the water temporal dynamicsand the effect of the different rain events even if an overestimationof the soil water content was observed in the first layer for Rennes(Fig. 3). It should be noted that the depths of the measured andsimulated soil surface layers are different (0.02 m and 0.003 mrespectively). The model was also in good agreement with themeasured soil surface temperature (Fig. 2). The main discrepanciesoccurred at night-time but they are not expected to have a signifi-cant effect on the cumulated volatilization because the volatiliza-tion rate is lower during this period. The energy balance terms werealso in reasonable agreement with the two field datasets (Fig. 4 forRSG). However, in Grignon, a slight overestimation of the latentheat flux and an underestimation of the sensible heat flux occurred.
3.2.2. Pesticides volatilization fluxesThe sensitivity analysis showed that physico-chemical charac-
teristics of the compounds had a dramatic impact on volatilizationfluxes as also found by Genermont and Cellier (1997) for ammonia.As they are estimated with a significant uncertainty (Baker et al.,1996) and as different values can be found in the literature for onegiven temperature, it may be relevant to adjust the model on thesefactors, here Kh, by fitting the simulated intensity of the volatili-zation flux to the measured one at a given time (the earlier thebetter). Any uncertainty linked with an uncertainty on Kh is thusavoided and the capacity of the model to describe the volatilizationrates over time and at a given time can in turn be assessed.However, if information on the overall volatilization rate or on thevolatilization potential of a compound is the given aim, no fitting isrequired. In this study, the calculated volatilization rates were fittedto the observed one on the day of application for trifluralin andalachlor. For atrazine, it showed a high volatilization peak just after
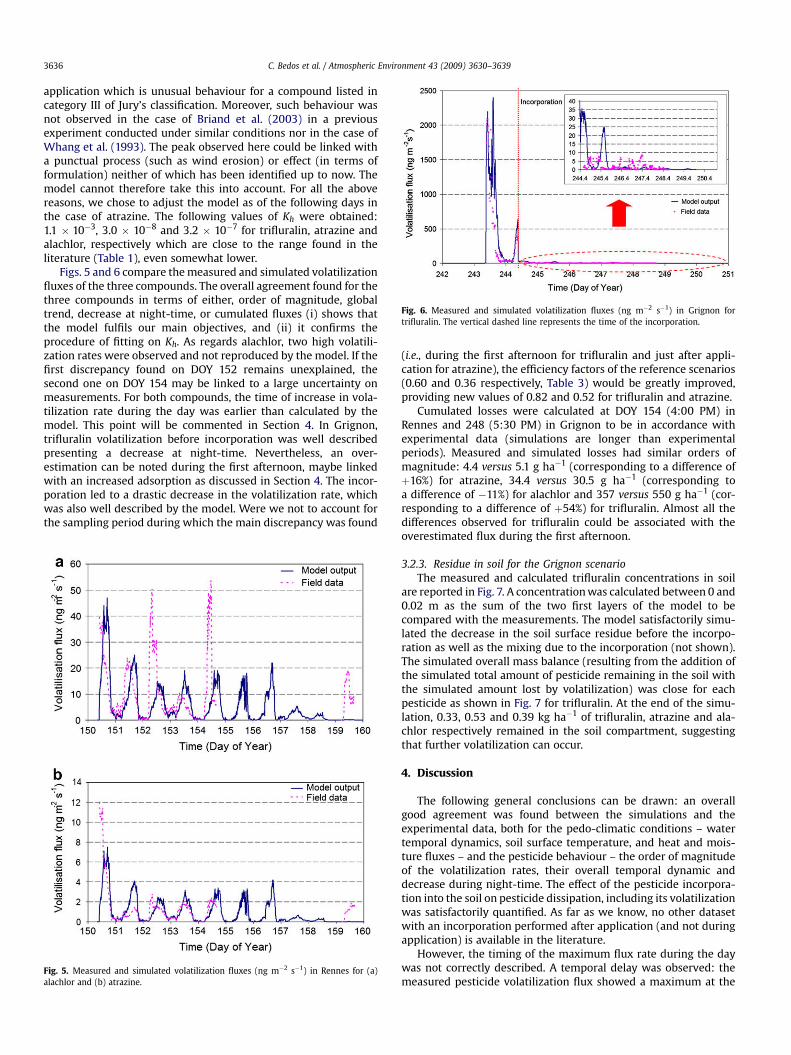
Fig. 6. Measured and simulated volatilization fluxes (ng m�2 s�1) in Grignon fortrifluralin. The vertical dashed line represents the time of the incorporation.
C. Bedos et al. / Atmospheric Environment 43 (2009) 3630–36393636
application which is unusual behaviour for a compound listed incategory III of Jury’s classification. Moreover, such behaviour wasnot observed in the case of Briand et al. (2003) in a previousexperiment conducted under similar conditions nor in the case ofWhang et al. (1993). The peak observed here could be linked witha punctual process (such as wind erosion) or effect (in terms offormulation) neither of which has been identified up to now. Themodel cannot therefore take this into account. For all the abovereasons, we chose to adjust the model as of the following days inthe case of atrazine. The following values of Kh were obtained:1.1 � 10�3, 3.0 � 10�8 and 3.2 � 10�7 for trifluralin, atrazine andalachlor, respectively which are close to the range found in theliterature (Table 1), even somewhat lower.
Figs. 5 and 6 compare the measured and simulated volatilizationfluxes of the three compounds. The overall agreement found for thethree compounds in terms of either, order of magnitude, globaltrend, decrease at night-time, or cumulated fluxes (i) shows thatthe model fulfils our main objectives, and (ii) it confirms theprocedure of fitting on Kh. As regards alachlor, two high volatili-zation rates were observed and not reproduced by the model. If thefirst discrepancy found on DOY 152 remains unexplained, thesecond one on DOY 154 may be linked to a large uncertainty onmeasurements. For both compounds, the time of increase in vola-tilization rate during the day was earlier than calculated by themodel. This point will be commented in Section 4. In Grignon,trifluralin volatilization before incorporation was well describedpresenting a decrease at night-time. Nevertheless, an over-estimation can be noted during the first afternoon, maybe linkedwith an increased adsorption as discussed in Section 4. The incor-poration led to a drastic decrease in the volatilization rate, whichwas also well described by the model. Were we not to account forthe sampling period during which the main discrepancy was found
Fig. 5. Measured and simulated volatilization fluxes (ng m�2 s�1) in Rennes for (a)alachlor and (b) atrazine.
(i.e., during the first afternoon for trifluralin and just after appli-cation for atrazine), the efficiency factors of the reference scenarios(0.60 and 0.36 respectively, Table 3) would be greatly improved,providing new values of 0.82 and 0.52 for trifluralin and atrazine.
Cumulated losses were calculated at DOY 154 (4:00 PM) inRennes and 248 (5:30 PM) in Grignon to be in accordance withexperimental data (simulations are longer than experimentalperiods). Measured and simulated losses had similar orders ofmagnitude: 4.4 versus 5.1 g ha�1 (corresponding to a difference ofþ16%) for atrazine, 34.4 versus 30.5 g ha�1 (corresponding toa difference of �11%) for alachlor and 357 versus 550 g ha�1 (cor-responding to a difference of þ54%) for trifluralin. Almost all thedifferences observed for trifluralin could be associated with theoverestimated flux during the first afternoon.
3.2.3. Residue in soil for the Grignon scenarioThe measured and calculated trifluralin concentrations in soil
are reported in Fig. 7. A concentration was calculated between 0 and0.02 m as the sum of the two first layers of the model to becompared with the measurements. The model satisfactorily simu-lated the decrease in the soil surface residue before the incorpo-ration as well as the mixing due to the incorporation (not shown).The simulated overall mass balance (resulting from the addition ofthe simulated total amount of pesticide remaining in the soil withthe simulated amount lost by volatilization) was close for eachpesticide as shown in Fig. 7 for trifluralin. At the end of the simu-lation, 0.33, 0.53 and 0.39 kg ha�1 of trifluralin, atrazine and ala-chlor respectively remained in the soil compartment, suggestingthat further volatilization can occur.
4. Discussion
The following general conclusions can be drawn: an overallgood agreement was found between the simulations and theexperimental data, both for the pedo-climatic conditions – watertemporal dynamics, soil surface temperature, and heat and mois-ture fluxes – and the pesticide behaviour – the order of magnitudeof the volatilization rates, their overall temporal dynamic anddecrease during night-time. The effect of the pesticide incorpora-tion into the soil on pesticide dissipation, including its volatilizationwas satisfactorily quantified. As far as we know, no other datasetwith an incorporation performed after application (and not duringapplication) is available in the literature.
However, the timing of the maximum flux rate during the daywas not correctly described. A temporal delay was observed: themeasured pesticide volatilization flux showed a maximum at the
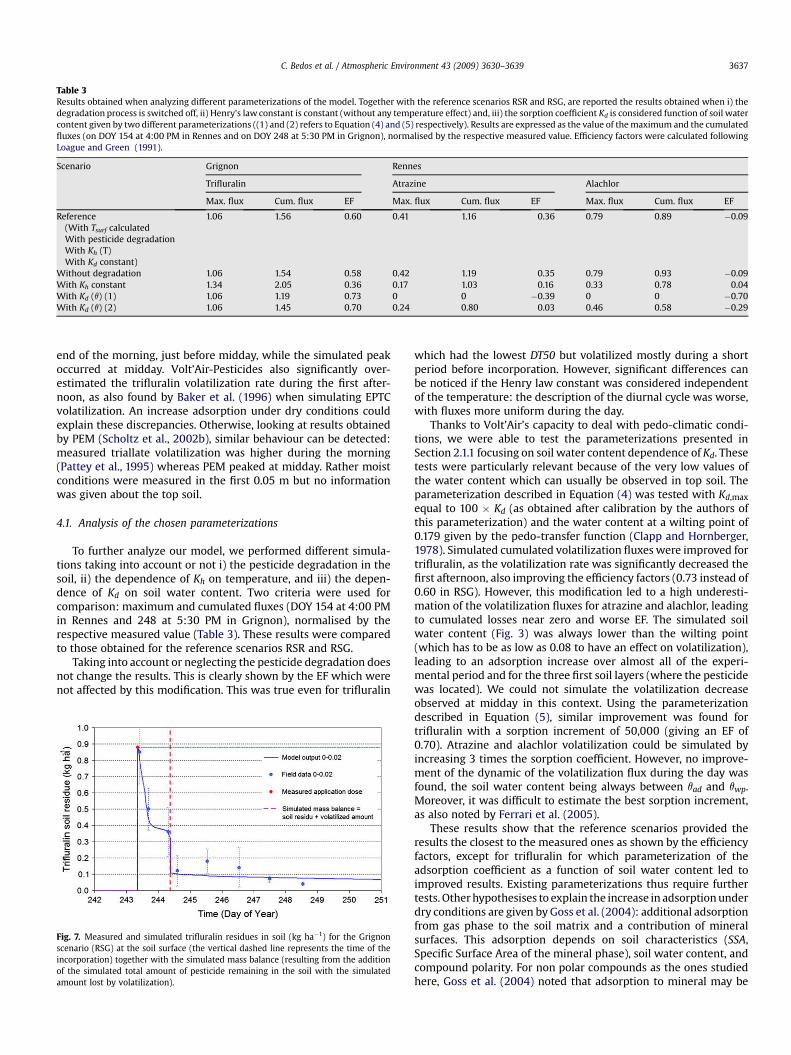
Table 3Results obtained when analyzing different parameterizations of the model. Together with the reference scenarios RSR and RSG, are reported the results obtained when i) thedegradation process is switched off, ii) Henry’s law constant is constant (without any temperature effect) and, iii) the sorption coefficient Kd is considered function of soil watercontent given by two different parameterizations ((1) and (2) refers to Equation (4) and (5) respectively). Results are expressed as the value of the maximum and the cumulatedfluxes (on DOY 154 at 4:00 PM in Rennes and on DOY 248 at 5:30 PM in Grignon), normalised by the respective measured value. Efficiency factors were calculated followingLoague and Green (1991).
Scenario Grignon Rennes
Trifluralin Atrazine Alachlor
Max. flux Cum. flux EF Max. flux Cum. flux EF Max. flux Cum. flux EF
Reference 1.06 1.56 0.60 0.41 1.16 0.36 0.79 0.89 �0.09(With Tsurf calculatedWith pesticide degradationWith Kh (T)With Kd constant)
Without degradation 1.06 1.54 0.58 0.42 1.19 0.35 0.79 0.93 �0.09With Kh constant 1.34 2.05 0.36 0.17 1.03 0.16 0.33 0.78 0.04With Kd (q) (1) 1.06 1.19 0.73 0 0 �0.39 0 0 �0.70With Kd (q) (2) 1.06 1.45 0.70 0.24 0.80 0.03 0.46 0.58 �0.29
C. Bedos et al. / Atmospheric Environment 43 (2009) 3630–3639 3637
end of the morning, just before midday, while the simulated peakoccurred at midday. Volt’Air-Pesticides also significantly over-estimated the trifluralin volatilization rate during the first after-noon, as also found by Baker et al. (1996) when simulating EPTCvolatilization. An increase adsorption under dry conditions couldexplain these discrepancies. Otherwise, looking at results obtainedby PEM (Scholtz et al., 2002b), similar behaviour can be detected:measured triallate volatilization was higher during the morning(Pattey et al., 1995) whereas PEM peaked at midday. Rather moistconditions were measured in the first 0.05 m but no informationwas given about the top soil.
4.1. Analysis of the chosen parameterizations
To further analyze our model, we performed different simula-tions taking into account or not i) the pesticide degradation in thesoil, ii) the dependence of Kh on temperature, and iii) the depen-dence of Kd on soil water content. Two criteria were used forcomparison: maximum and cumulated fluxes (DOY 154 at 4:00 PMin Rennes and 248 at 5:30 PM in Grignon), normalised by therespective measured value (Table 3). These results were comparedto those obtained for the reference scenarios RSR and RSG.
Taking into account or neglecting the pesticide degradation doesnot change the results. This is clearly shown by the EF which werenot affected by this modification. This was true even for trifluralin
Fig. 7. Measured and simulated trifluralin residues in soil (kg ha�1) for the Grignonscenario (RSG) at the soil surface (the vertical dashed line represents the time of theincorporation) together with the simulated mass balance (resulting from the additionof the simulated total amount of pesticide remaining in the soil with the simulatedamount lost by volatilization).
which had the lowest DT50 but volatilized mostly during a shortperiod before incorporation. However, significant differences canbe noticed if the Henry law constant was considered independentof the temperature: the description of the diurnal cycle was worse,with fluxes more uniform during the day.
Thanks to Volt’Air’s capacity to deal with pedo-climatic condi-tions, we were able to test the parameterizations presented inSection 2.1.1 focusing on soil water content dependence of Kd. Thesetests were particularly relevant because of the very low values ofthe water content which can usually be observed in top soil. Theparameterization described in Equation (4) was tested with Kd,max
equal to 100 � Kd (as obtained after calibration by the authors ofthis parameterization) and the water content at a wilting point of0.179 given by the pedo-transfer function (Clapp and Hornberger,1978). Simulated cumulated volatilization fluxes were improved fortrifluralin, as the volatilization rate was significantly decreased thefirst afternoon, also improving the efficiency factors (0.73 instead of0.60 in RSG). However, this modification led to a high underesti-mation of the volatilization fluxes for atrazine and alachlor, leadingto cumulated losses near zero and worse EF. The simulated soilwater content (Fig. 3) was always lower than the wilting point(which has to be as low as 0.08 to have an effect on volatilization),leading to an adsorption increase over almost all of the experi-mental period and for the three first soil layers (where the pesticidewas located). We could not simulate the volatilization decreaseobserved at midday in this context. Using the parameterizationdescribed in Equation (5), similar improvement was found fortrifluralin with a sorption increment of 50,000 (giving an EF of0.70). Atrazine and alachlor volatilization could be simulated byincreasing 3 times the sorption coefficient. However, no improve-ment of the dynamic of the volatilization flux during the day wasfound, the soil water content being always between qad and qwp.Moreover, it was difficult to estimate the best sorption increment,as also noted by Ferrari et al. (2005).
These results show that the reference scenarios provided theresults the closest to the measured ones as shown by the efficiencyfactors, except for trifluralin for which parameterization of theadsorption coefficient as a function of soil water content led toimproved results. Existing parameterizations thus require furthertests. Other hypothesises to explain the increase in adsorption underdry conditions are given by Goss et al. (2004): additional adsorptionfrom gas phase to the soil matrix and a contribution of mineralsurfaces. This adsorption depends on soil characteristics (SSA,Specific Surface Area of the mineral phase), soil water content, andcompound polarity. For non polar compounds as the ones studiedhere, Goss et al. (2004) noted that adsorption to mineral may be
C. Bedos et al. / Atmospheric Environment 43 (2009) 3630–36393638
relevant if the ratio SSA/foc is high and in very dry conditions. Largevalues for this ratio have been estimated under our conditions(around several thousand based on an estimated SSA followingPetersen et al. (1996). Thus, it could be interesting to test this secondhypothesis. Finally, it would also appear necessary to analyze thevalidity of the physico-chemical equilibrium hypothesis. Indeed, theexistence of a liquid phase as assumed here is maybe questionablewhen soil water content decreases drastically (Baker et al., 1996).
4.2. Potential use of the model: simulated effect on volatilizationlosses of pesticide incorporation into the soil
Predicting the effect of a pesticide incorporation into the soil maybe very useful (Yates, 2006). Using Volt’Air-Pesticides, incorporationperformed either during the application or 8 h after instead of 24 h(as recommended for trifluralin and as simulated in the referencescenario RSG) led to a reduction in the volatilization: on day 248 at5:30 PM, cumulated losses reached 0.04 and 0.44 kg ha�1 respec-tively, instead of 0.55 kg ha�1 in RSG. When no incorporation wasevaluated, the model found that almost all the trifluralin applied waslost by volatilization within 3 days after application. In this case,Volt’Air-Pesticides could be a useful tool for decisions making.
5. Conclusion and perspectives
The adaptation of Volt’Air-NH3 to pesticide application has beendescribed. This involved the physico-chemical equilibrium calcu-lations, the degradation of pesticides in soil and their transfer.Sensitivity tests showed high sensitivity to physico-chemicalproperties of compounds like Kh and Koc. Testing it againstmeasured datasets showed good agreement for Volt’Air-Pesticidesestimates of pedo-climatic conditions and the order of magnitudeof the volatilization flux of all three compounds. The model alsosatisfactorily simulated the decrease in the volatilization rate of thethree pesticides at night-time as well as the decrease in the soilsurface residue of trifluralin before and after incorporation. This isclosely linked with the fact that the model correctly simulated thesoil surface temperature and that temperature dependence of Kh isalso taken into account.
However, the exact time in the day of the maximum volatiliza-tion rate was not correctly described. Both datasets showed rela-tively dry soil conditions with high soil surface temperatures. Thevalidity of the chemical equilibrium calculation should be exam-ined when soil water content drastically decreases, whichfrequently occurs at the soil surface. The first tests carried out withexisting parameterizations on increased adsorption under dryconditions showed improved results but further work is necessary.Moreover, adsorption through gaseous/solid interactions andcontribution of soil minerals have to be analyzed. Further validationof the model dealing with the soil surface water content under dryconditions is also necessary, focusing on the validity of the pedo-transfer functions in the not settled top soil layer and on the rele-vance of the hydraulic characteristics used. The model could also betested with a scenario under ‘‘wet conditions’’ and with differentpesticides (e.g., polar ones for which the pH calculation moduleimplemented for mineral fertilizers could be helpful).
Even if further validation is desirable, Volt’Air-Pesticides canalready be used without any tuning on Kh to test agriculturalpractices, like incorporation, volatilization potential, or overallestimation of the volatilization rate of a given compound.
Acknowledgements
This research was carried out within a project founded by theFrench Ministry of Environment (PE00/122000/023, under the
programme ‘‘Pesticides’’) and datasets used in this study wereobtained in collaboration with the LERES (ENSP, Rennes, France) –O. Briand and R. Seux – who are gratefully acknowledged. Specialthanks to S. Tanis-Plant for fruitful discussions and significantcontribution in editing in English.
References
Asman, W., Jorgensen, A., Jensen, P.K., 2003. Dry Deposition and Spray Drift ofPesticides to Nearby Water Bodies. No 66. Danish Environmental ProtectionAgency, 171 pp.
Baker, J.M., Koskinen, W.C., Dowdy, R.H., 1996. Volatilization of EPTC: simulationand measurement. Journal of Environmental Quality 25, 169–177.
Bedos, C., Cellier, P., Calvet, R., Barriuso, E., Gabrielle, G., 2002. Mass transfer ofpesticides into the atmosphere by volatilization from soils and plants: over-view. Agronomie 22, 21–33.
Bedos, C., Rousseau-Djabri, M.F., Gabrielle, B., Flura, D., Duran, B., Barriuso, E., Cellier, P.,2006. Measurement of trifluralin volatilization in the field: relation to soil residueand effect of soil incorporation. Environmental Pollution 144, 958–966.
Briand, O., Millet, M., Bertrand, F., Cellier, P., Bedos, C., Seux, R., 2003. Atmosphericconcentrations and volatilisation fluxes of two herbicides applied on maize.Fresenius Environmental Bulletin 12 (7), 675–679.
Calvet, R., Barriuso, E., Bedos, C., Benoit, P., Charnay, M.P., Coquet, Y., 2005. Les pesticidesdans le sol. Consequences agronomiques et environnementales, Paris, 637 pp.
Carsel, R.F., Imhoff, J.C., Hummel, P.R., Cheplick, J.M., Donigian, J.A.S., 1999. PRZM-3,a Model for Predicting Pesticide and Nitrogen Fate in the Crop Root andUnsaturated Soil Zones: Manual for Release 3.12. Environmental ProtectionAgency, Athens, Georgia, U.S.
Cellier, P., Bedos, C., Briand, O., Barriuso, E., Clement, M., Flura, D., Gabrielle, B.,Rousseau-Djabri, M.F., Seux, R., 2004. TAPAS: Transfert de pesticides vers l’at-mosphere par derive et volatilisation de post-application. Implications pour lebilan environnemental d’une culture, la contamination de l’atmosphere etl’exposition de l’humain, 87 pp. þ annexes.
Cellier, P., Richard, G., Robin, P., 1996. Partition of sensible heat fluxes into bare soiland the atmosphere. Agricultural and Forest Meteorology 82, 245–265.
Clapp, R.B., Hornberger, G.M., 1978. Empirical equations for some soil hydraulicproperties. Water Resources Research 14, 601–604.
Ferrari, F., Klein, M., Capri, E., Trevisan, M., 2005. Prediction of pesticide volatili-zation with PELMO 3.31. Chemosphere 60, 705–713.
Ferrari, F., Trevisan, M., Capri, E., 2003. Predicting and measuring environmentalconcentration of pesticides in air after soil application. Journal of Environ-mental Quality 32, 1623–1633.
Fies, J.C., Panini, T., 1995. Infiltrability and measurement of physical characteristicsof crust developed on wet or dry soil aggregates under simulated rains.Agronomie 15, 205–220.
Genermont, S., Cellier, P., 1997. A mechanistic model for estimating ammoniavolatilization from slurry applied to bare soil. Agricultural and Forest Meteo-rology 88, 145–167.
Goss, K.U., Bushmann, J., Schwarzenbach, R., 2004. Adsorption of organic vapors toair-dry soils: model predictions and experimental validation. EnvironmentalScience and Technology 38 (13), 3667–3673.
Gouzy, A., Farret, R., 2005. Determination des pesticides a surveiller dans le com-partiment aerien: approche par hierarchisation. Synthese du comite depilotage. N�INERIS-DRC-MECO-CGR-143/2005-AGo. INERIS, 141 pp.
Guilioni, L., Cellier, P., Ruget, F., Nicoullaud, B., Bonhomme, R., 2000. A model toestimate the temperature of a maize apex from meteorological data. Agricul-tural and Forest Meteorology 100 (2–3), 213–230.
Guyot, G., 1997. Climatologie de l’environnement. De la plante aux ecosystemes,Paris, 505 pp.
Itier, B., Perrier, A., 1976. Presentation analytique de l’advection. I. Advec tion lieeaux variations horizontales de concentration et de temperature. AnnalesAgronomiques 27 (2), 111–140.
Itier, B., Brunet, Y., McAneney, K.J., Lagouarde, J.P., 1994. Downwind evolution of scalarfluxes and surface resistance under conditions of local advection. Part I: a reap-praisal of boundary conditions. Agricultural and Forest Meteorology 71, 211–225.
Jansma, J.W., Linders, J.B.H.J., 1995. Volatilization of Pesticides from Soil and Plantsafter Spraying. n 679102030. National Institute of Pubic Health and Environ-mental Protection, Bilthoven, 48 pp.
Jury, W.A., Ghodrati, M., 1989. Overview of organic chemical environmental fate andtransport modelling approaches. In: Reactions and movement of organicchemicals in soils, Soil Sci. Soc. Am. Special Publication No. 22, pp. 271–304.
Jury, W.A., Spencer, W.F., Farmer, W.J.,1983. Behavior assessment model for trace organicsin soil: I. Model description. Journal of Environmental Quality 12 (4), 558–564.
Klein, M., 1995. PELMO: Pesticide Leaching Model Version 2.01. Fraunhofer Institutfur Umweltchemie und Okotoxikolgie, Schmallenberg, Germany.
Le Cadre, E., 2004. Modelisation de la volatilisation d’ammoniac en interaction avecles processus chimiques et biologiques du sol: le modele Volt’Air. INAPG, EcoleDoctorale ABIES, 315 pp.
Leistra, M., van der Linden, A.M.A., Boesten, J.J.T.I., Tiktak, A., ven den Berg, F., 2001.PEARL Model Pesticide Behaviour and Emissions in Soil–plant Systems;Descriptions of the Processes in FOCUS PEARL v. 1.1.1. Alterra-Report 013, RIVMreport 711401 009. Alterra RIVM, Wageningen, 115 pp.
C. Bedos et al. / Atmospheric Environment 43 (2009) 3630–3639 3639
Loague, K., Green, R.E., 1991. Statistical and graphical methods for evaluating solute trans-port models: overview and application. Journal of Contaminant Hydrology 7, 51–73.
Mamy, L., 2004. Comparaison des impacts environnementaux des herbicides a largespectre et des herbicides selectifs: Caracterisation de leur devenir dans le sol etmodelisation. Institut National Agronomique Paris-Grignon, UMR INRA INAPGEnvironnement et Grandes Cultures de Grignon, 333 pp.
Noilhan, J., Planton, S., 1989. A simple parameterization of land surface processes formeteorological models. Monthly Weather Review 117, 536–549.
Pattey, E., Cessna, A.J., Desjardins, R.L., Kerr, L.A., Rochette, P., St-Amour, G., Zhu, T.,Headrick, K., 1995. Herbicides volatilization measured by the relaxed eddy-accumulation technique using two trapping media. Agricultural and ForestMeteorology 76 (3–4), 201–220.
Petersen, L.W., Moldrup, P., Jacoben, O.H., Rolston, D.E.,1996. Relations between specificsurface area and soil physical and chemical properties. Soil Science 161 (1), 9–21.
Scholtz, M.T., Bidleman, T.F., 2006. Modelling of the long term fate of pesticide residuesin agricultural soils and their surface exchange with the atmosphere: part I. Modeldescription and evaluation. Science of the Total Environment 368, 823–838.
Scholtz, M.T., Bidleman, T.F., 2007. Modelling of the long-term fate of pesticidesresidues in agricultural soils and their surface exchange with the atmosphere:part II. Projected long-term fate of pesticide residues. Science of the TotalEnvironment 377, 61–80.
Scholtz, M.T., Voldner, E., McMillan, A.C., Van Heyst, B.J., 2002a. A pesticideemission model (PEM) part I: model development. Atmospheric Environment36, 5005–5013.
Scholtz, M.T., Voldner, E., Van Heyst, B.J., McMillan, A.C., Pattey, E., 2002b. Apesticide emission model (PEM) part II: model evaluation. Atmospheric Envi-ronment 36, 5015–5024.
Smit, A.A.M.F.R., Van den Berg, F., Leistra, M., 1997. Estimation Method for theVolatilization of Pesticides from Fallow Soil. Agricultural Research Department,DLO, Wageningen, The Netherlands, 94 pp.
Smit, A.A.M.F.R., Leistra, M., van den Berg, F., 1998. Estimation Method for theVolatilization of Pesticides from Plants. Agricultural Research Department, DLO,Wageningen, 101 pp.
Taylor, A.W., Spencer, W.F., 1990. Volatilization and Vapor Transport Processes,Pesticides in the Soil Environment. Soil Science Society of America Book Series,Madison, WI, USA, pp. 213–269.
Tiktak, A., van den Berg, F., Boesten, J.J.T.I., van Kraalingen, D., Leistra, M., van derLinden, A.M.A., 2000. Manual of FOCUSPEARL Version 1.1.1. RIVM Report711401008, Alterra Report 28. RIVM, Bilthoven, 144 pp.
Tomlin, C.D.S.E., 2003. The Pesticide Manual. British Library Cataloguing, 1344 pp.van den Berg, F., Leistra, M., 2004. Improvment of the Model Concept for Volatili-
sation of Pesticides from Soils and Plant Surfaces in PEARL. Alterra, Wagenin-gen, Netherlands, 30 pp.
van den Berg, F., Kubiak, R., Benjey, W.G., Majewski, M.S., Yates, S.R., Reeves, G.L.,Smelt, J.H., van der Linden, A.M.A., 1999. Emission of pesticides into the air.Water, Air, and Soil Pollution 115, 195–218.
van den Berg, F., Wolters, A., Jarvis, N., Klein, M., Boesten, J.J.T.I., Leistra, M.,Linneman, V., Smelt, J.H., Vereecken, H., 2003. Improvement of concepts forpesticide volatilization from bare soil in PEARL, PELMO and MACRO models. In:Attilio Amerigo Maria Del Re, E.C., Padovani, Laura, Trevisan, Marco (Eds.), XIISymposium on Pesticide Chemistry, Piacenza, Italy, La Goliardica Pavese s.r.l. Ed.,pp. 973–983.
Vanclooster, M., Pineros Garcet, J.D., Boesten, J.J.T.I., Ven den Berg, F., Leistra, M.,Smelt, J., Jarvis, N., Roulier, S., Burauel, P., Vereecken, H., Wolters, A.,Linneman, V., Fernandez, E., Trevisan, M., Capri, E., Padovani, L., Klein, M.,Tiktak, A., Van der Linden, A., De Nie, D., Bidoglio, G., Baouroui, F., Jones, A.,Armstrong, A., 2003. Effective Approaches for Assessing the PredictedEnvironmental Concentrations of Pesticides: a Proposal Supporting theHarmonised Registration of Pesticides in Europe. APECOP, QLK4-CT-1999-01238, 158 pp. <http://www.geru.ucl.ac.be/recherche/projets/apecop-pub/pub/files/Apecop_final_report.pdf>.
Wang, D., Yates, S.R., Gan, J., 1997. Organic chemicals in the environment.Temperature effect on methyl bromide volatilization in soil fumigation. Journalof Environmental Quality 26, 1072–1079.
Whang, J.M., Schomburg, C.J., Glotfelty, D.E., Taylor, A.W., 1993. Volatilization offonofos, chlorpyrifos, and atrazine from conventional and no-till surface soils inthe field. Journal of Environmental Quality 22, 173–180.
Wolters, A., Klein, M., Vereecken, H., 2004. An improved description of pesticidevolatilization: refinement of the pesticide leaching model (PELMO). Journal ofEnvironmental Quality 33, 1629–1637.
Woodrow, J.E., Seiber, J.N., Baker, L.W., 1997. Correlation techniques for estimatingpesticide volatilization flux and downwind concentrations. EnvironmentalScience and Technology 31, 523–529.
Yates, S.R., 2006. Simulating herbicide volatilization from bare soil affected byatmospheric conditions and limited solubility in water. Environmental Scienceand Technology 40, 6963–6968.
Yates, S.R., Wang, D., Papiernik, S.K., Gan, J., 2002. Predicting pesticide volatilizationfrom soils. Environmetrics 13, 569–578.