Modelling of Luminous Flux Directed to the Upper ... - MDPI
21
Citation: Novak, T.; Becak, P.; Dubnicka, R.; Raditschova, J.; Gasparovsky, D.; Valicek, P.; Ullman, J. Modelling of Luminous Flux Directed to the Upper Hemisphere from Electrical Substation before and after the Refurbishment of Lighting Systems. Energies 2022, 15, 345. https://doi.org/10.3390/en15010345 Academic Editors: Annika K. Jägerbrand and Ulrika Wänström Lindh Received: 16 August 2021 Accepted: 28 December 2021 Published: 4 January 2022 Publisher’s Note: MDPI stays neutral with regard to jurisdictional claims in published maps and institutional affil- iations. Copyright: © 2022 by the authors. Licensee MDPI, Basel, Switzerland. This article is an open access article distributed under the terms and conditions of the Creative Commons Attribution (CC BY) license (https:// creativecommons.org/licenses/by/ 4.0/). energies Article Modelling of Luminous Flux Directed to the Upper Hemisphere from Electrical Substation before and after the Refurbishment of Lighting Systems Tomas Novak 1, *, Petr Becak 1 , Roman Dubnicka 2 , Jana Raditschova 2 , Dionyz Gasparovsky 2 , Pavel Valicek 1 and Jiri Ullman 1 1 Department of Electrical Power Engineering, Faculty of Electrical Engineering and Computer Science, VSB—Technical University of Ostrava, 17 Listopadu 2172/15, 708 00 Ostrava, Czech Republic; [email protected] (P.B.); [email protected] (P.V.); [email protected] (J.U.) 2 Institute of Power and Applied Electrical Engineering, Slovak University of Technology in Bratislava, Ilkovicova 3, 812 19 Bratislava, Slovakia; [email protected] (R.D.); [email protected] (J.R.); [email protected] (D.G.) * Correspondence: [email protected] Abstract: This article deals with options for how to express the luminous flux from outdoor electrical substations of the electric transmission system. Processing of the models of light emissions before and after refurbishment of lighting systems was motivated by setting out rules for the design and erection of refurbished lighting systems in outdoor electrical substations, which are most commonly built in inhabited rural areas with low luminance of the background. The proposed model and calculations are based on requirements of international standards and recommendations for lighting of outdoor workplaces as well as on internal regulations of the ˇ CEPS (Czech Transmission System Operator). These requirements are implemented in real electrical substations and lighting models that are extended by the calculation space of the software goniophotometer. The software goniophotometer was used to evaluate light distribution characteristics of entire electric stations in various situations. This article assesses the impact of different lighting systems installed at electrical substations from the perspective of both direct and total luminous flux directed to the upper hemisphere. It takes into account three outdoor electrical substations (420 kV) of a transmission network and their lighting systems before and after refurbishment. The aim of this article is to determine to what extent the electrical substations contribute to emissions of luminous flux to the upper hemisphere. Results from calculations on models show reduced radiation to the upper hemisphere up to 52.3% after refurbishment of obsolete lighting systems, although total installed flux actually increased due to a change in the ratio of direct and reflected luminous flux after refurbishment of lighting systems. Keywords: software goniophotometer; light pollution; electrical substation; light distribution charac- teristic; model; lighting system; sustainable development 1. Introduction Electrical substations as nodes of the electric transmission network are very good examples for creating a model for distribution of light emissions in the framework of geographical locality. In the Czech Republic, there are a total of 32 outdoor electrical substations of the transmission network with a total area of 2.57 mil. m 2 . In the Slovak Republic, 19 substations represent a total area of 1.2 mil. m 2 . The average area of one electrical substation in both the Czech and Slovak Republic is then 73,906 m 2 and the total area is 3.77 mil. m 2 . Electrical substations of the transmission system work in principle in two modes. Only luminaires of the perimeter, some of the major communications and entrances to the buildings, are running all night long. Such systems can be compared to road-lighting systems in cities and villages. All other luminaires are operated occasionally Energies 2022, 15, 345. https://doi.org/10.3390/en15010345 https://www.mdpi.com/journal/energies
-
Upload
khangminh22 -
Category
Documents
-
view
0 -
download
0
Transcript of Modelling of Luminous Flux Directed to the Upper ... - MDPI

�����������������
Citation: Novak, T.; Becak, P.;
Dubnicka, R.; Raditschova, J.;
Gasparovsky, D.; Valicek, P.; Ullman,
J. Modelling of Luminous Flux
Directed to the Upper Hemisphere
from Electrical Substation before and
after the Refurbishment of Lighting
Systems. Energies 2022, 15, 345.
https://doi.org/10.3390/en15010345
Academic Editors: Annika
K. Jägerbrand and Ulrika
Wänström Lindh
Received: 16 August 2021
Accepted: 28 December 2021
Published: 4 January 2022
Publisher’s Note: MDPI stays neutral
with regard to jurisdictional claims in
published maps and institutional affil-
iations.
Copyright: © 2022 by the authors.
Licensee MDPI, Basel, Switzerland.
This article is an open access article
distributed under the terms and
conditions of the Creative Commons
Attribution (CC BY) license (https://
creativecommons.org/licenses/by/
4.0/).
energies
Article
Modelling of Luminous Flux Directed to the Upper Hemispherefrom Electrical Substation before and after the Refurbishmentof Lighting SystemsTomas Novak 1,*, Petr Becak 1, Roman Dubnicka 2, Jana Raditschova 2, Dionyz Gasparovsky 2, Pavel Valicek 1
and Jiri Ullman 1
1 Department of Electrical Power Engineering, Faculty of Electrical Engineering and Computer Science,VSB—Technical University of Ostrava, 17 Listopadu 2172/15, 708 00 Ostrava, Czech Republic;[email protected] (P.B.); [email protected] (P.V.); [email protected] (J.U.)
2 Institute of Power and Applied Electrical Engineering, Slovak University of Technology in Bratislava,Ilkovicova 3, 812 19 Bratislava, Slovakia; [email protected] (R.D.); [email protected] (J.R.);[email protected] (D.G.)
* Correspondence: [email protected]
Abstract: This article deals with options for how to express the luminous flux from outdoor electricalsubstations of the electric transmission system. Processing of the models of light emissions before andafter refurbishment of lighting systems was motivated by setting out rules for the design and erectionof refurbished lighting systems in outdoor electrical substations, which are most commonly built ininhabited rural areas with low luminance of the background. The proposed model and calculationsare based on requirements of international standards and recommendations for lighting of outdoorworkplaces as well as on internal regulations of the CEPS (Czech Transmission System Operator).These requirements are implemented in real electrical substations and lighting models that areextended by the calculation space of the software goniophotometer. The software goniophotometerwas used to evaluate light distribution characteristics of entire electric stations in various situations.This article assesses the impact of different lighting systems installed at electrical substations fromthe perspective of both direct and total luminous flux directed to the upper hemisphere. It takes intoaccount three outdoor electrical substations (420 kV) of a transmission network and their lightingsystems before and after refurbishment. The aim of this article is to determine to what extent theelectrical substations contribute to emissions of luminous flux to the upper hemisphere. Resultsfrom calculations on models show reduced radiation to the upper hemisphere up to 52.3% afterrefurbishment of obsolete lighting systems, although total installed flux actually increased due to achange in the ratio of direct and reflected luminous flux after refurbishment of lighting systems.
Keywords: software goniophotometer; light pollution; electrical substation; light distribution charac-teristic; model; lighting system; sustainable development
1. Introduction
Electrical substations as nodes of the electric transmission network are very goodexamples for creating a model for distribution of light emissions in the framework ofgeographical locality. In the Czech Republic, there are a total of 32 outdoor electricalsubstations of the transmission network with a total area of 2.57 mil. m2. In the SlovakRepublic, 19 substations represent a total area of 1.2 mil. m2. The average area of oneelectrical substation in both the Czech and Slovak Republic is then 73,906 m2 and the totalarea is 3.77 mil. m2. Electrical substations of the transmission system work in principlein two modes. Only luminaires of the perimeter, some of the major communications andentrances to the buildings, are running all night long. Such systems can be compared toroad-lighting systems in cities and villages. All other luminaires are operated occasionally
Energies 2022, 15, 345. https://doi.org/10.3390/en15010345 https://www.mdpi.com/journal/energies

Energies 2022, 15, 345 2 of 21
(in a control or emergency mode), and thus are comparable to lighting systems of outdoorworkplaces or sport facilities. Average horizontal illuminance of all areas of such outdoorworkplaces is in the range of several tens of lux. In collaboration with the Czech Transmis-sion System Operator (CEPS) on the design of lighting systems for electrical substations ofthe transmission system, it is possible to compare models of the emission of three electricalsubstations (TR Prosenice, TR Nošovice and TR Slavetice) within this case study. Modelsof the mentioned substations were created for an optimized lighting system so that thesecould be compared with the TR Prosenice electrical substation modelled in the stage beforerefurbishment.
Lighting recommendations for outdoor workplaces were established in CIE S 015/E:2005Lighting of Outdoor Workplaces with further guidelines in CIE 129-1998 Guide for lightingexterior work areas. Lighting requirements for safety and security of outdoor workplacesare specified in ISO/CIE 8995-3:2018 Lighting of workplaces. These international standardsand recommendations are implemented in national or regional standards; for example, in theEuropean Union, the scope of the EN 12464-2 covers both safety/security and application-specific aspects. From a safety point of view, a very low risk level poses min. 5 lx ofmaintained illuminance, low-risk areas need at least 10 lx, medium risks require 20 lx ormore and high-risk workplaces, including the investigated electric switchyards, shall beilluminated to a min. 50 lx. The uniformity must be at least 0.25 for very low risks and 0.40otherwise. Photometric parameters required for selected workplaces in electrical substationsare shown in Table 1.
Table 1. Photometric requirements for specific power- and electricity-related outdoor workplaces [1].
Type of the Space, Task or Activity Em [lx] Uo [-] RGL [-] Ra [-]
Pedestrian movements within electrically safe areas 5 0.25 50 20
Overall inspection 50 0.40 50 20
General servicing work and reading of instruments 100 0.40 45 40
Repair of electric devices (local lighting shouldbe used) 200 0.50 45 60
Key: Em—maintained average illuminance, Uo—overall uniformity of illumination, RGL—glare rating index GR,Ra—color rendering index.
We are focusing on electric substations because commissioning of these led to refusalof getting approval from the authorities due to excessive light emissions upwards. In theInternational Commission on Illumination, CIE, the problems of obtrusive light are in thescope of three Technical Reports: CIE 126-1997 Guidelines for minimizing sky glow, CIE001-1980 Guidelines for minimizing urban sky glow near astronomical observatories, andthe CIE 150:2017 Guide on the limitation of the effects of obtrusive light from outdoorlighting installations, Second Edition. In addition to CIE documents on obtrusive light,requirements for the mitigation of adverse effects of outdoor lighting installations areincluded as self-standing sections in application standards such as CIE S 015, CIE 129and EN 12464-2. In contradiction to the presumed higher contribution of the lighting ofoutdoor workplaces, very little is known about particular figures of radiation emissioncharacteristics to the upper hemisphere and there is huge gap in peer-reviewed studiesfocused on this kind of obtrusive light.
In road lighting, the highest lighting class for pedestrians and slow traffic P1 requiresilluminance of 15 lx, and in C classes (conflict zones) the highest class C0 specifies 50 lx. Incomparison to road lighting there is a considerable distinction when it comes to outdoorworkplaces. First of all, light levels are significantly higher than for road lighting. Valuesin Table 1 indicate that for rough visual tasks such as overall inspection 50 lx is requiredand for more visually demanding work this can be as high as 100 or 200 lx. To comparethese figures with road lighting, lighting classes for pedestrians range from 2 lx (class P6) to15 lx (class P1) and the highest class for conflict areas (class C1) recommends an illuminationlevel of 50 lx. Required illuminance for outdoor workplaces is of course that for common

Energies 2022, 15, 345 3 of 21
illuminance in indoor workplaces for comparable work tasks, but outdoors this is applied inlarge areas and leads to a huge amount of the needed luminous flux to satisfy the requiredluminous parameters. Moreover, having no walls and ceilings outdoors, there is no indirectcomponent helping to satisfy the needs and no physical barrier to hinder the light fromreaching the adjacent surroundings. In this respect the illuminance levels and the necessaryluminous flux associated with these levels and the illuminated areas must be treated asvery high. High light levels in combination with illumination of large areas result in anumber of adverse effects and light pollution is just one of the aspects. More light meansincreased energy consumption, which is chained with climate changes and remarkablecarbon footprints from a long-term perspective [2]. It is crucial to design the illuminationof outdoor workplaces aiming for the maximum possible efficiency, localizing the lightingto the task area where it is needed and tailoring the operation time only to periods whenthe particular task is carried out.
Luminaires for illumination of outdoor workplaces and for public lighting in resi-dential areas have typical luminous intensity distribution curves (LIDC) in e.g., C-planeswhere the direction is described by the pair of angles (C, γ) [3] and orientation of selectedC-planes, and an example of LIDC curves of a road-lighting luminaire in two principalC-planes is depicted in Figure 1.
Figure 1. Orientation of selected C-planes for an outdoor lighting luminaire.
The paper is based on the results of previous investigation of large light-source mod-els [4,5] and from the setting of lighting calculations that are used to evaluate the radiationof large lighting systems in the upper hemisphere [6]. Outcomes of this article are intendedto demonstrate the change in luminous flux before and after refurbishment of lighting sys-tems and comparison of radiation in the upper hemisphere between similar large sources.Knowledge of these changes can help to assess the behaviour of emissions of outdoorworkplaces and potential for the mitigation of these emissions in both time and space.
2. Description of the Illumination of Electrical Substations
Illumination of electrical substations of the transmission system is respecting require-ments of the standard EN 12464-2—Light and Lighting—Lighting of workplaces—Part 2:Outdoor workplaces. More detailed requirements are specified in the in-house standardCEPS TN/59—Outdoor lighting in electrical substations of the transmission system. Be-cause the investigated substations are located in Czech Republic, all relevant nationalstandards were also taken into account where applicable.
2.1. Surveillance Lighting
This lighting installation should work all night long like the classical road lightinginstallation does. Annual operation time can be thus estimated to ca. 4100 h. For optimiza-tion of the operation time, it is suitable to associate this lighting system with requirementsof the surveillance security cameras so that during dusk and dawn any situations when the

Energies 2022, 15, 345 4 of 21
surveillance system is unable to provide necessary information from security cameras [7,8]are fully avoided.
For the purpose of surveillance lighting, common road lighting luminaires are nor-mally used. Luminous flux distribution of these luminaires (primarily constructed forroad lighting) can perform well in the area of corridors covered by security cameras andsafeguard sufficient camera component of illumination needed for quality imaging of thesecurity cameras, and at the same time satisfy requirements for the horizontal componentin order to warn potential intruders that the area is under permanent monitoring. Theluminaires are equipped with flat glass and are not tilted. Flat glass is recommended inorder to minimize the luminance observed by the security cameras and also to limit theemission of direct luminous flux into the upper hemisphere. In the role of light sources,the LED lamps are used, having correlated colour temperature (CCT) of ca. 3000 K (warmwhite colour of light) and colour rendering index better than 70 due to sensitivity of thesecurity cameras to higher wavelengths [9].
2.2. Road Lighting
The road-lighting installation is designed to ensure safe drive-through for inspectionworkers. For this lighting system, operation time is only a few tens of hours per year andis assumed when it comes to situations of common monitoring, inspection, maintenanceand servicing of equipment of the electrical substation. For this purpose, again ordinaryroad lighting luminaires can be used. Circular internal roads in electrical substations donot have properties of roads. On the other hand, such properties within workspaces havespecific sections of roads near transformers, buildings of secondary equipment and thecentral building, and roads along switchers where values of maintained illuminance levelEm ≥ 5 lx for pedestrians and Em ≥ 10 lx for slowly moving vehicles is stated according tostandard EN 12464-2 (see Table 1) are required [1]. The European Standard EN 13201 anddocument CIE 115:2010 are not implemented at electrical substations.
2.3. Distribution Fields (Operational Lighting)
The lighting installation for illumination of distribution fields is designed to safeguardsafe inspection of devices in fields of the distribution substation. For illumination ofdistribution fields, luminaires with asymmetrical light distribution curves are used. Suchluminaires can uniformly illuminate large areas without glaring from high mountingheights because it is not necessary to tilt the luminaires. Flat glass is needed in order to limitthe emission of direct luminous flux into the upper hemisphere. For illumination of outdoorworkplaces in electrical substations, values of maintained illuminance level Em ≥ 50 lx foroverall inspection visual task according to EN 12464-2 (see Table 1) are required.
2.4. Transformers, Shunt Reactors and Terciars Lighting Systems
The lighting installation for illumination of transformers (shunt reactors, terciars)is designed to safeguard safe inspection of devices placed on transformers and read thekey indicators by the camera system. For illumination of transformers, luminaires withasymmetrical light distribution curves are used. Such luminaires can uniformly illuminateboth vertical and horizontal areas without glaring from high mounting heights (fireproofwalls) because it is not necessary to tilt the luminaires. It is necessary to illuminate allsurfaces of the transformers (shunt reactors, terciars), in particular their upper parts in-cluding bushings of power transformers. For safety reasons, it is indispensable to obeyrequirements for horizontal and vertical maintained illuminance Em ≥ 50 lx (see Table 1).
2.5. Lighting Systems of Buildings and Drive-Ins
The lighting installation for illumination of buildings and drive-ins is designed tosafeguard safe inspection of drive-ins and entrances of buildings by means of a camerasystem. For this lighting system, operation time of only a few tens of hours per year isassumed when it comes to situations of common monitoring, inspection, maintenance and

Energies 2022, 15, 345 5 of 21
servicing of equipment of the electrical substation. For illumination of vertical surfaces, inparticular, luminaires with asymmetrical light distribution curves are used. In surroundingsof the luminaire observed by cameras, such luminaires can ensure sufficient horizontal aswell as camera component of lighting for quality imaging of the security cameras. Flat glassis recommended in order to minimize the luminance observed by the security cameras andalso to limit the emission of direct luminous flux into the upper hemisphere. Illuminationof buildings and drive-ins is part of the surveillance lighting.
3. Materials and Methods
Methodology and basic principles of the proposed model on selected case studiesof electrical substations are described in the following two sections to clarify what ap-proach was used to achieve results for reducing obtrusive light and reduction of powerconsumption of refurbished lighting systems while respecting normative documents withappropriate visual conditions for employers of electrical substations.
3.1. Methods
The shape of the LIDC for different luminaires depends on particular lighting applica-tion and the target exterior area to be lit [1] comprising the task area and other associatedareas that should be illuminated according to the relevant lighting standards. From thespatial distribution of the luminous intensity, it is possible to calculate the total luminousflux of a luminaire using the Formula (1).
Φ =∫ π
γ=0
∫ 2π
C=0I(C, γ)sinγdγdC·(lm) (1)
In practice, the total luminous flux is measured by means of goniophotometers thatdiffer in construction and measurement principle. The far-field goniophotometer is one ofthe common types based on longer photometric distance with which the inverse squarelaw for a point source can be applied to calculation of luminous intensity in a givendirection [9,10]. The measured data are then stored in photometric exchange file formats(e.g., CEN, LDT, IEC, CIE etc.) for given angular intervals of the pair of angles (C, γ) [6].For the purpose of this article, the total luminous flux emitted by an outdoor lightinginstallation is calculated using a software goniophotometer created in the WILS lightingcalculation software. Furthermore, this software goniophotometer was validated by meansof goniophotometry with known LIDC of real luminaire [11]. Graphically, it is presented inFigure 2, which respects theoretical principles of the goniophotometry of luminaires, wherefrom sufficient distance the outdoor lighting installation with areas of specified reflectancecan be deemed as a point light source placed in a photometric center and by which it ispossible to compose a LDT exchange file format, similarly as for luminaires includingboth the direct and reflected component of a light directed in the upper hemisphere whichrepresents a basement for determination of quantitative parameters of obtrusive light of asky [12,13] in vicinity of illuminated outdoor workplaces or public lighting in residentialareas. Thus, the normal illuminance EN which is determined in each calculation point of asoftware goniophotometer can be expressed by Formula (2),
EN =Iγ
l2 (lx) where Iγ = I⊥ cos γ (cd) (2)
where l is the distance between the modelled object and the grid of calculation points.The software goniophotometer then by calculation transforms the normal illuminance inindividual calculation points into the luminous intensity Iγ coming out from the middleof the model (point source). Usual lighting calculation software, which can work withmeasured LIDC in the form of photometric files of real luminaires, can work only withLambertian surfaces. In real surroundings the mirror reflection is negligible and all surfacesare very close to the Lambertian surface.

Energies 2022, 15, 345 6 of 21
Figure 2. The grid of calculation points of a software goniophotometer for calculation of emissioncharacteristics of outdoor lighting systems [4,11].
3.2. Modelling of Emission Characterestics of Case Studies
Calculation of individual luminous intensities in given directions (calculation pointsof the software goniophotometer are depicted in Figure 2 by yellow colour dots) is usedfor composition of the luminous intensity distribution curves, not only of primary lightsources (luminaires) but also for generation of emission characteristics of large entities(e.g., lighting systems of electrical substations). In result there is the emission characteristicwith the calculated efficiency related to the total luminous flux of a lighting systems eitheronly for the direct component or for combination of the direct and the reflected componentof the luminous flux. Comparison was made from the viewpoint of verifying the shapeof the luminous intensity curve and from the viewpoint of the total luminous flux that isgenerated in the space from the obtained LDT data [11].
Object in the red circle (see Figure 2) is an enclosed area representing the light sourcewhich can be, e.g., an urban quarter, neighbourhood, industrial yard or other large areaunder investigation. For modelling purposes, the area is supposed to be a point sourcewith a given spatial luminous flux distribution. Detail of area in the red circle is depictedin Figure 3. The direct component is that part of luminous flux which is directly emittedfrom luminaires and spreads out in the upper hemisphere. The reflected component ispart of the luminaire’s flux which hits the target area of illumination as well as any othersurrounding areas where it is partly reflected upwards, thus also spreading in the upperhemisphere. The calculation grid displayed normal illuminance in direction to the middleof sphere and represents virtual luxmeter sensors [11], depicted in Figure 3.
Common surfaces that can be found in outdoor workplaces have usually diffuse (matt)finishing with a certain reflectance [11]. As secondary sources of light these surfaces can bedescribed by the Lambertian luminous intensity distribution curve as depicted in Figure 4.Then, assumed LIDCs of reflected parts of light from the ground are rotational symmetricaccording to axis of normal luminous intensity directions.
These spatial characteristics recorded in form of photometric exchange file formatsrepresent light emissions from outdoor lighting installations. These files serve as input datafor calculation of obtrusive light parameters such as the total luminous flux to the upperhemisphere by means of lighting calculation software. The upward luminous flux can beused, e.g., for comparison of lighting systems before and after refurbishment. Obtrusivelight represents a total luminous flux that spreads to the upper hemisphere and thereforeincreases sky glow. It is formed by direct and indirect (reflected) luminous flux from theterrain and particular objects. The most important thing is the evaluation of the luminousflux that is distributed directly to the upper hemisphere by non-dimensional parameterULR, defined by equation [14]:
ULR =ULOR
ULOR + DLOR(3)

Energies 2022, 15, 345 7 of 21
where:
ULR—proportional direct luminous flux radiated to the upper hemisphereULOR—luminous flux radiated directly from the luminaire to the upper hemisphereDLOR—luminous flux reflected from the surfaces of the surrounding objectsULOR + DLOR—total luminous flux radiated to the upper hemisphere.
Figure 3. Calculation grid showing normal illuminance of the software goniophotometer [11].
Figure 4. Spatial distribution of the reflected component from outdoor lighting installations.
Results of the modelling of spatial emission characteristics by means of the softwaregoniophotometer can be used also for the design of outdoor lighting installations as a practi-cal tool for lighting designers instead of application of more expensive and time-consumingmeasuring systems for determination of the extent of sky glow [15,16]. Modelling of theluminous flux emissions is based on an application of the software goniophotometer [11,14]into a standard lighting calculation software in which it is possible to work and calculatewith real luminous intensity curves of discrete luminaires, where it is also possible toinsert any arbitrary distribution curves (windows, car headlights) [4,6] and which enablescalculation of the reflected component based on behaviour of a Lambertian surfaces. Thiskind of modelling has been proved [11] on implementation of known luminous intensitycurves into a lighting software and consequent evaluation after calculation by the softwaregoniophotometer. The software goniophotometer enables insertion of a grid of calculationpoints as a sphere where calculation points represent normal illuminance aiming into thecentre of the sphere. Thus, the designed system is emulating the function of a real gonio-photometer. Hence, the software goniophotometer fulfills the same function, and the only

Energies 2022, 15, 345 8 of 21
difference is that instead of virtual insertion of a luminaire described by its calculation datait is possible to insert directly entire models such as part of a city or an electrical substationassuming true dimensions and the given calculation data. The software goniophotometeralso enables to choosing any density of calculation points in angular steps according to thenormally used C, γ-planes for measurement of luminaires. Density of calculation pointshas, of course, significant influence on the computing time and accuracy of the results.
Due to the fact that calculation of obtrusive light is not yet standardized and assess-ment of lighting designs from this point of view is not yet unified, it is necessary to look atthis calculation from a different vantage point. In addition, the boundary conditions formodelling of obtrusive light must respect these specific aspects.
• The most important boundary condition is setting of the total maintenance factor to 1.It means carrying out calculations for lighting systems in the condition when they arenew because new installations have the highest light emissions [17] and thus also theupward component of these emissions;
• The second boundary condition is based on consensus for reflectance of surfacesso that these are as close as possible to their true reflectance and at the same timethese are mutually comparable within evaluation of the impact of individual lightinginstallations [4,6]. In a flat area what corresponds to the case of electrical substation itis to take only a few reflections into account because other interreflections betweenbuildings and luminaires are negligible. In the town areas or residential zones, itis necessary to assume for calculation higher orders of reflections, but it is a time-consuming calculation for usual computers used in the practice of lighting designers;
• The third boundary condition is that the modelled object must behave like a pointsource. This means that the object has neglectable dimensions with respect to the gridof calculation points of the software goniophotometer used for the calculation. Thisratio is usually more than 5 and such light source (model of a lighting installation) canbe then deemed as a point source [11].
3.3. Example of Background on the Model before Refurbishment of Outdoor Lighting System in theElectrical Substation
Processing of the results of light emissions in the upper hemisphere before refurbish-ment of the electrical substation was divided into two principal operation modes so thatthese modes could be compared with the situation after refurbishment and with other light-ing installations. Light-emission characteristics of the model for both principal operationalmodes of the electrical substations are presented in Section 5. Besides the characteristicsthemselves (direct and total emission), the luminous flux of the lighting systems is figuredout as well.
The calculated light emission of the direct luminous flux from the surveillance lightingcorresponds to the light emission characteristics of the used luminaires equipped with high-pressure sodium lamps and with a convex cover of the optical chamber with a luminousintensity distribution curve suitable for road lighting. A major part of light emissions tothe upper hemisphere is, however, formed by the reflected component of the surveillancelighting system, which is in good correlation with the resulting emission characteristicsshape, which is close to the cosine function.
On the other hand, the electrical substation with fully operated lighting systems hasa completely reversed behaviour. From the calculated luminous intensity distribution, itfollows that the direct component of luminous flux to the upper hemisphere is clearly dom-inant. This is caused by usage of symmetrical-beam and yet tilted luminaires illuminatingdistribution fields and the transformers. While assessing the emission characteristics ofboth direct and reflected components of the luminous flux to the upper hemisphere it is ev-ident that the reflected component (the cosine shape of part of the emission characteristics)is proportionally and significantly lower than, e.g., the sole surveillance lighting.

Energies 2022, 15, 345 9 of 21
3.4. Example of Background on the Model after Refurbishment of Outdoor Lighting System in theElectrical Substation
For processing of the results of upward light emissions, electrical substations havebeen divided into two essential operation modes the same as before refurbishment. In thefirst step the light emission of the electrical substation in the mode of surveillance lighting(all night operation) was evaluated. It means that the lighting is provided predominantlyaround the station’s perimeter, along major communications and drive-ins to the build-ings. To fulfill safety requirements, these lighting installations are operated all night long,i.e., 4100 h annually. Such lighting systems, the parameters of which (luminaire types,mounting heights, spacings, illuminance on the target area) are similar to road-lightinginstallations and can be compared with light emissions from classical road-lighting systems,in particular in sparsely inhabited areas (low number of shading elements). The second partof the analysis is again taking into account the whole electrical substation in full lightingmode for potential failure in the substation. It means that all lighting installations of theelectrical substation are on. Operation time of this mode is at most only a few tens of hoursper year. In this operation mode the substation is comparable with other outdoor work-places (storage areas, sewing yards, transhipments etc.) and eventually with less-occupiedshopping centres.
Light emission characteristics of the model for both principal operational modes ofthe electrical substations are presented in Section 5. Besides the characteristics themselves(direct and total emission), the luminous flux of lighting systems is figured out as well.Shape and magnitude of luminous intensities of the calculated emission characteristicsfor the model of the electrical substation correspond to the assumptions. The calculatedluminous intensity distribution curve for the direct component is zero thanks to lightdistribution characteristics and no tilt of luminaires. Hereby it is necessary to emphasizethat the light distribution and zero tilt of luminaires belonged to key requirements laidon the design and erection of refurbished lighting systems so that no direct componentof the luminous flux is emitted in the upper hemisphere. Hence, the calculated luminousintensity distribution curves correspond solely to the reflected component of the flux andtheir shape even approaches the cosine function. Deviations from the cosine function arecaused by vertical obstructions in the model (buildings, fireproof walls, transformers) thatlead to deformation of the cosine curve.
4. Case Study on Particular Outdoor Lighting of the Electrical Substations of theTransmission Network (420 kV)
The first part of this section is describing outdoor lighting system of the electricalsubstation TR Prosenice and boundary conditions that are necessary for calculations neededto estimate emission of radiation in the upper hemisphere. This part of the section treatsexamples of modelled lighting systems in TR Prosenice before and after refurbishment andshows basic information about installed power, radiated luminous flux and average initialilluminance overall area of electrical substation. The second part of this section describesnew outdoor lighting systems of electrical susbtations TR Slavetice and TR Nošoviceafter refurbishment.
4.1. Description of Outdoor Lighting Systems TR Prosenice
In the framework of lighting refurbishment, the electrical substation TR Prosenicewas classified to the environmental zone E2 (represents low district brightness areas, suchas industrial or residential rural areas) according to EN 12464-2. It means that for thisinstallation a maximum 5% of the luminous flux from all luminaires of the installationis allowed to be directed upwards. A model of light emission in the upper hemispherefor the electrical substation TR Prosenice was constructed in variants as for the electricalsubstations TR Nošovice and TR Slavetice.

Energies 2022, 15, 345 10 of 21
4.1.1. Surveillance Lighting
Surveillance lighting is installed along the whole outer fencing including entrances tobuildings of secondary equipment, the central building, drive-ins and along the operationalfencing. The surveillance lighting is safeguarding correct sensing of the cameras thatmonitor the surveillance perimeter, and this is common for the entire electrical substation.The surveillance lighting is in operation all night long regardless of any lighting control [18].Before refurbishment of the electrical substation TR Prosenice, common road-lightingluminaires with high-pressure sodium lamps 70 W, system power 81 W and luminousflux 3.77 klm were used for surveillance lighting. In the first part of the installation,luminaires were mounted 8 m above the ground, in amount of 11 pcs. Luminous fluxfrom the luminaires was directed from fences towards fields of the distribution substation.After extension of the substation, the surveillance lighting also was prolonged. Seventeenluminaires of the same type were installed in mounting height of 6 m. Spacing betweenluminaires was reduced from 47 m to 19 m and the luminaires were rotated by 180◦ sothat their light was then directed from the fields towards the fence. The extension of theinstallation also comprised an additional 5 luminaires installed at a height of 8 m, used forroad lighting and simultaneously as part of the surveillance lighting. In total, 28 luminaires,were directed from fencing towards the distribution fields.
Within refurbishment (reconstruction) of lighting of the electrical substation, all lu-minaires were replaced. The luminaires equipped with high-pressure sodium lamps werereplaced by LED luminaires with input power 52 W, flat glass, CCT 3000 K, luminous flux7.45 klm and wide beam angle for road lighting. A total of 46 luminaires were used forsurveillance lighting, directed towards the fencing. At the same time the mounting heightof luminaires was unified to 7 m and the spacing of luminaires was unified to 26 m. Thedistance between the installed luminaires and the fence of the facility equals 4 m. This dis-tance is needed for marking out the surveillance perimeter, which is used for surveillancecameras so that these are able to detect persons attempting to intrude the locality of theelectrical substation. This lighting system is turned on for the whole night after sunset, anoperational time corresponding to 4100 h per year, like the usual road lighting systems.
4.1.2. Operational Lighting
Operational lighting is used for illumination of technological elements to providegood visual conditions for overall verification of the equipment and its parts. Operationallighting illuminates fields of the distribution substation and the site of the transformersand the shunt reactors.
Within refurbishment of the operational lighting, a former lighting system consistingof symmetrical-beam luminaires with input power 2280 W and luminous flux 147 klmequipped with metal halide lamps with 2000 W wattage and CCT 4200 K in the amount of18 pcs installed at a height of 24 m and tilted to 50◦ was replaced by asymmetrical-beamluminaires with input power 1100 W, luminous flux 97 klm equipped with high-pressuresodium lamps with 1000 W wattage in the amount of 17 pcs installed at a height of 23 m.The installed power was significantly reduced to ca. 50% after refurbishment. The newlighting system utilizes solely asymmetrical luminaires with zero tilt angle, i.e., no luminousflux is emitted directly to the upper hemisphere. This lighting system is turned on onlya few hours per year according to the need to use it during malfunctions and tests of theelectric power substation.
4.1.3. Road Lighting
Road lighting is used to illuminate important internal communications such as roadsand footpaths in outdoor areas of the electrical substation for safe operation, movementof persons and mechanical vehicles at reduced visibility. With respect to the importancelevel of internal communications, major roads are illuminated (the drive-in road fromthe gate to the central building and the road between the central building, buildings forsecondary equipment and sites of the transformers and the shunt reactors). The former

Energies 2022, 15, 345 11 of 21
lighting installation utilized common road-lighting luminaires with high-pressure sodiumlamps 70 W with system power 81 W and luminous flux 3.77 klm installed in the amount of21 pcs at a mounting height of 6 m and identical luminaires with 150 W sodium lamps withsystem power 165 W and luminous flux 9.42 klm in the amount of 5 pcs at an 8 m mountingheight. After refurbishment the new lighting system now consists of 64 LED luminaireswith wattage of 68 W, flat glass, CCT 3000 K, luminous flux 7.17 klm and wide-beam lightdistribution suitable for road lighting purposes, installed at a mounting height of 6 m. Theoperation time of road lighting is turned on in order of tenth hours per year. It serves onlyfor maintenance of the electric power substation systems.
4.1.4. Lighting of the Transformers and Shunt Reactors
Before refurbishment the lighting was provided only for 1 transformer and consistedof 8 symmetrical-beam luminaires with input power 440 W and luminous flux 25.6 klm,equipped with 400 W metal halide lamps. Luminaires were installed at a 9 m height andtilted to 40◦. For security reasons and for the sake of sensitivity of camera systems, thenew lighting covers all sites of the transformers and the shunt reactors including upperparts with bushings, as required. At areas where important equipment and displays areplaced, the normal illuminance is designed to 50 lx. Here, asymmetrical LED luminaireswith input power 68 W, luminous flux 7.17 klm and CCT 3000 K were installed. A total of41 luminaires were mounted at a height of 5 m, and their tilt angle is zero. The operationaltime is the same as it was stated in the Section 4.1.2 for operational lighting.
4.1.5. Model of Light Emissions from the Electrical Substations (Case Studies)
This section presents boundary conditions, models and parameters of the electricalsubstation TR Prosenice before and after refurbishment of outdoor lighting by replacingold luminaires for LED luminaires. The total reflectance of diffuse surfaces was chosenas follows:
• reflectance of the grass vegetation—10%;• reflectance of the communications—10%;• reflectance of the building facades and the fireproof walls—30%;• reflectance of the surfaces of transformers and shunt reactors—30%;• reflectance of the walkable concrete ground surface—25%.
4.1.6. TR Prosenice before Refurbishment
• Model of the electrical substation before refurbishment is based on the project docu-mentation from 2013;
• The electrical substation before refurbishment covered total area of 83,000 m2;• The maintenance factor used for calculations was set to f m = 1;• Rules for LIDC calculation are the same as for luminaires. Plane C0 is perpendicular
to the longer dimension of the electrical substation;• The final 3D model of emission characteristics before refurbishment of outdoor lighting
luminaires is shown in Figure 5.
4.1.7. TR Prosenice after Refurbishment
• Model of the electrical substation after refurbishment is based on the project documen-tation from 2018;
• The electrical substation after refurbishment covers a total area of 94,000 m2;• The maintenance factor f m = 1 and reflectance of surfaces have been selected identically
as for the case before refurbishment;• The final 3D model of emission characteristics after refurbishment of outdoor lighting
luminaires is shown in Figure 5.
Energies 2022, 15, 345 12 of 21
Figure 5. 3D models of light emissions from the electrical substation TR Prosenice before (left-handside) and after (right-hand side) refurbishment.
4.1.8. Comparison of the Old and New Lighting System in TR Prosenice
For assessment of behavior of all lighting systems before and after refurbishment inTR Prosenice (see Table 2), a comparison of the total installed input power and the initialhorizontal illuminance on the entire area of the electrical substation was performed.
Table 2. Comparison of key parameters of the model of lighting installation in TR Prosenice beforeand after refurbishment.
StatusTotal Installed Power of
All LightingSystems [kW]
Total InstalledLuminous Flux of AllLight Sources [klm]
IlluminanceE0 [lx]
after refurbishment 29.4 3375 27.9
before refurbishment 49.4 4649 32.3
4.2. Description of Outdoor Lighting Systems of the Electrical Substations TR Nošoviceand TR Slavetice
To compare behavior of other electric stations of the transmission network, models ofelectric stations TR Nošovice and TR Slavetice have been also analyzed. These models wereestablished on the similar principle as the model for the electrical substation TR Prosenice(maintenance factor, reflectances). Because these models were prepared for the needs of theCEPS as a document to prove the limitation of the luminous flux emissions to the upperhemisphere, the models were been constructed only for new lighting systems and not theolder systems before refurbishment. It means that in this section, only models for the newsystems are presented.
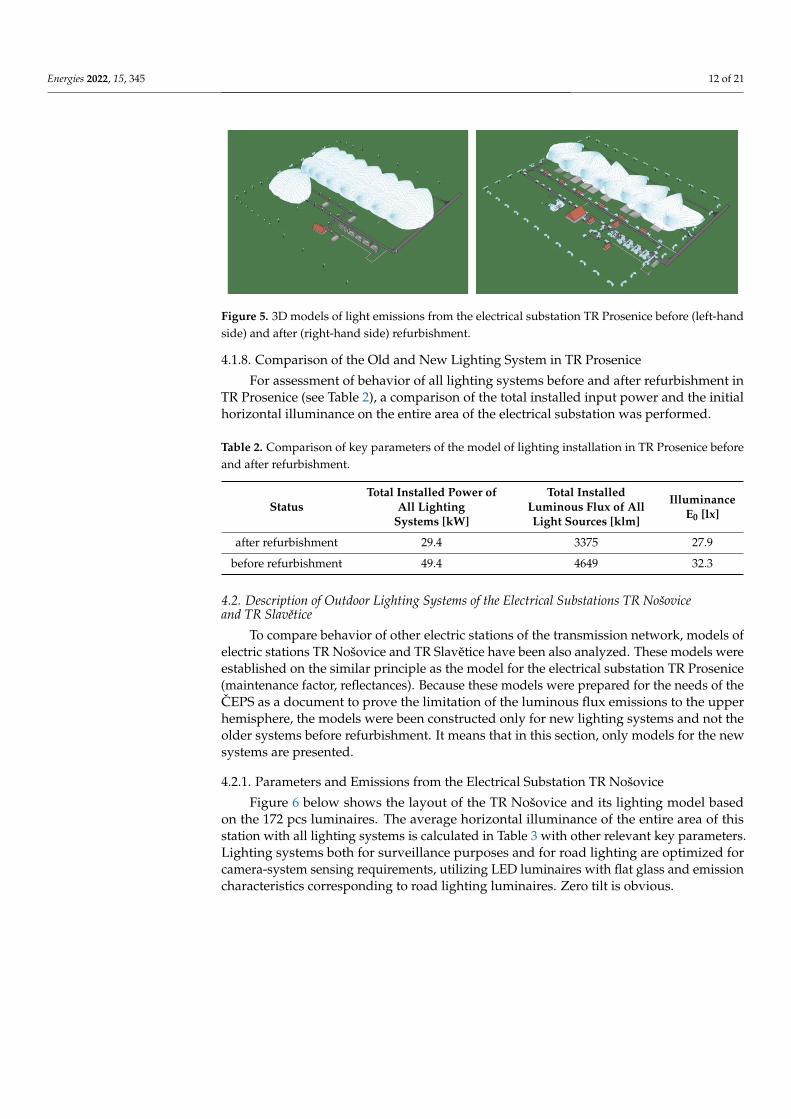
4.2.1. Parameters and Emissions from the Electrical Substation TR Nošovice
Figure 6 below shows the layout of the TR Nošovice and its lighting model basedon the 172 pcs luminaires. The average horizontal illuminance of the entire area of thisstation with all lighting systems is calculated in Table 3 with other relevant key parameters.Lighting systems both for surveillance purposes and for road lighting are optimized forcamera-system sensing requirements, utilizing LED luminaires with flat glass and emissioncharacteristics corresponding to road lighting luminaires. Zero tilt is obvious.

Energies 2022, 15, 345 13 of 21
Figure 6. Layout of the electrical substation TR Nošovice; the area for modelling is marked.
Table 3. Key parameters of the model of new lighting installation in TR Nošovice after refurbishment.
StatusTotal Installed Power of
All Lighting Systems[kW]
Total InstalledLuminous Flux of AllLight Sources [klm]
IlluminanceE0 [lx]
All lighting 61.0 8068 67.0
Other lighting systems (for distribution fields, transformers) comprise luminaireswith slightly asymmetric light distribution, equipped with metal halide and high-pressuresodium lamps, unavoidably tilted to the maximum value of 55◦.
The model for light emissions to the upper hemisphere for the electrical substationTR Nošovice was again constructed for two variants. Only with direct component of theluminous flux and combination of direct and reflected components. Calculations for thesevariants have been carried out for the surveillance lighting system and for all lightingsystems too.
4.2.2. Description of Parameters and Emissions from the Electrical Substation TR Slavetice
The Figure 7 below shows the layout of the TR Slavetice and its lighting model. Theaverage horizontal illuminance of the entire area of this substation with all lighting systemsis presented in Table 4 with other key parameters. Lighting systems consist of 319 pcs ofluminaires both for surveillance purposes and for road lighting. They are also optimisedfor camera system sensing requirements, utilizing LED luminaires with flat glass andemission characteristics corresponding to road lighting luminaires and asymmetrical-beamluminaires for illumination of the entrances to the buildings of secondary equipment. Zerotilt is obvious.
Table 4. Key parameters of the model of new lighting installation in TR Slavetice after refurbishment.
StatusTotal Installed Power of
All Lighting Systems[kW]
Total InstalledLuminous Flux of AllLight Sources [klm]
IlluminanceE0 [lx]
All lighting 96.9 11,148 43.0
Other lighting systems (for distribution fields, transformers) comprise luminaireswith asymmetric light distribution, equipped with metal halide and high-pressure sodiumlamps, with zero tilt angle.

Energies 2022, 15, 345 14 of 21
Figure 7. Layout of the electrical substation TR Slavetice, the area for modelling is marked.
5. Results
LIDCs describe emission of the radiation in the upper hemisphere from electric susb-tations areas in different modes are presented in the section. Evaluation and comparison ofresults for each case study is shown in figures and tables.
5.1. Results Acquired from the Model of Light Emissions in TR Prosenice before Refurbishment
The ratio of the total, i.e., the sum of the direct and reflected luminous flux to theupper hemisphere, from the surveillance lighting was calculated by the means of softwaregoniophotometer to 4.1% of the total luminous flux of all light sources of the surveillancelighting installation and corresponds to the value of 15.1 klm. The direct component ofthe luminous flux to the upper hemisphere equal to 1.48 klm corresponds to 0.4% of thetotal luminous flux of all light sources of the surveillance lighting installation. In the caseof the overall lighting of the electrical substation the direct component of luminous flux251 klm corresponds to 5.4% of the total luminous flux of all light sources of all lightinginstallations. When considering both direct and reflected components of the luminous fluxemitted to the upper hemisphere, the luminous flux equals 432 klm and corresponds to9.3% of the total luminous flux of all light sources of all lighting installations (see Table 5).
From model calculations it follows that the overall illumination of the electrical sub-station TR Prosenice is able to generate almost 29 times more luminous flux in the upperhemisphere than in the mode of surveillance lighting only. The model also gave evidencethat the former lighting installation did not obey requirements to the environmental zoneE2 to which this lighting system was historically classified, i.e., the directly emitted lumi-nous flux to the upper hemisphere did not fall into the range of a maximum 5% of thetotal luminous flux from all luminaires, according to the standard EN 12464-2. Because thepercentual comparison leading to 5.4% is related to the luminous flux of light sources, it isobvious that percentual expression related to the luminous flux emitted from luminaireswill be higher, 8.1% in particular.

Energies 2022, 15, 345 15 of 21
Table 5. Light emission characteristics of two operational modes of the electrical substation TRProsenice before refurbishment.
Operation Mode of the ElectricalSubstation
Light Emission Characteristics ComprisingOnly the Direct Component of the
Luminous Flux to the Upper Hemisphere
Light Emission Characteristics ComprisingBoth the Direct and Reflected Components
of the Luminous Flux to theUpper Hemisphere
Surveillance lighting
1.48 klm 15.1 klm
All-purpose lighting—the electrical substation
completely on
251 klm 432 klm
5.2. Results Acquired from the Model of Light Emissions in TR Prosenice after Refurbishment
The ratio of the total luminous flux to the upper hemisphere was calculated by themeans of software goniophotometer to 7.4% of the total luminous flux of all light sourcesof the surveillance lighting installation and corresponds to the value of 59.3 klm. In thecase of the overall lighting of the electrical substation the total luminous flux to the upperhemisphere corresponds to the value of 233 klm and equals 6.9% of the total luminous fluxof all light sources of all lighting installations (see Table 6).
From verification it follows that the overall illumination of fully switched on refur-bished electrical substation TR Prosenice generates almost four times more luminous fluxto the upper hemisphere than in the mode of surveillance lighting only. Based on thesoftware model it is also possible to show that the refurbished lighting is complying withthe requirements of the E2 environmental zone. Because the electric substation is locatedoutside inhabited areas, this classification can be assigned only on the basis of quantificationof the direct emission of light into the upper hemisphere.

Energies 2022, 15, 345 16 of 21
Table 6. Light emission characteristics of two operational modes of the electric station TR Proseniceafter refurbishment.
Operation Mode of the ElectricalSubstation
Light Emission Characteristics ComprisingOnly the Direct Component of the
Luminous Flux to the Upper Hemisphere
Light Emission Characteristics ComprisingBoth the Direct and Reflected Components
of the Luminous Flux to theUpper Hemisphere
Surveillance lighting
0 klm 59.3 klm
All-purpose lighting—the electrical substation
completely on
0 klm 233 klm
5.3. Comparison of the Modeling Results before and after Refurbishment of Lighting Installations inthe TR Prosenice Electrical Substation
When comparing the surveillance lighting systems it can be concluded that in respectto the standard EN 12464-2 the new outdoor lighting has the direct emission of luminousflux to the upper hemisphere mitigated to zero, but considering both the direct and thereflected component of the luminous flux it is increased four times because the surveillance-lighting installation was optimized to respect requirements for lighting of the camerasystems [19] as is presented in Table 7.
Table 7. Comparison of the operational modes of the TR Prosenice electric station before and afterrefurbishment.
Lighting System Area(m2)
Installed Power(kW)
Installed LuminousFlux of All Light
Sources(klm)
Direct LuminousFlux to the Upper
Hemisphere(klm)
Direct and ReflectedLuminous Flux to theUpper Hemisphere
(klm)
TR Prosenice—afterrefurbishment
(surveillance/all lighting)94,000 6.74/29.4 802/3375 0/0 59.3/233
TR Prosenice—beforerefurbishment
(surveillance/all lighting)83,000 4.79/49.4 369/4649 1.48/251 15.1/432
TR Prosenice—relativechange before and after
refurbishment(surveillance/all
lighting) in %
+13.2% +40.7%/−40.5% +117.3%/−27.4% −100%/−100% +292.7%/−46.1%
Thanks to optimization of the lighting of the distribution fields and the transformers,the luminous flux emitted from these lighting systems was considerably reduced. Thedirect luminous flux in the upper hemisphere was eliminated and the total luminous fluxemitted from the electric station in the upper hemisphere then dropped to almost half. By

Energies 2022, 15, 345 17 of 21
means of usage of modern luminaires and light sources, the installed power of the lightingof the electrical substation was significantly reduced by 40%, although area of the stationwas extended by 12%.
5.4. Results of the Modeling of Lighting Installations in the TR Nošovice Electrical Substation
From results of the modelling of luminous flux emitted to the upper hemisphere,it follows that the surveillance lighting generates no direct luminous flux in the upperhemisphere (see Table 8). The reflected luminous flux 43.8 klm corresponds to 8.6% of theluminous flux emitted by the surveillance lighting system.
Table 8. Light emission characteristics of two operational modes of the electrical substation TRNošovice.
Operation Mode of the ElectricalSubstation
Light Emission Characteristics ComprisingOnly the Direct Component of the
Luminous Flux to the Upper Hemisphere
Light Emission Characteristics ComprisingBoth the Direct and Reflected Components
of the luminous Flux to the UpperHemisphere
Surveillance lighting
0 klm 43.8 klm
All-purpose lighting 702 klmthe electrical substation
completely on
113 klm 702 klm
When taking into account all lighting systems in the electrical substation TR Nošovice,the impact of the direct emission to the upper hemisphere is clearly visible (see Table 9). Itis caused by tilted luminaires, respecting that the tilting is necessary in order to fulfill thelighting task. The value of the direct luminous flux 113 klm is, however, still very low andcorresponds to only 2% of the total luminous flux emitted from all luminaires. Thus, thiselectric station can be classified to the environmental zone E2.
Table 9. Overview of the operational modes of TR Nošovice electrical substation.
Lighting System Area(m2)
Installed Power(kW)
Installed LuminousFlux of All Light
Sources(klm)
Direct LuminousFlux to the Upper
Hemisphere(klm)
Direct and ReflectedLuminous Flux to theUpper Hemisphere
(klm)
TR Nošovice(surveillance/all lighting) 73,000 3.31/61 509/8068 0/113 43.8/702
5.5. Results of the Modeling of Lighting Installations in the TR Slavetice Electrical Substation
From results of modelling of the luminous flux emitted to the upper hemisphere itfollows that the surveillance lighting generates no luminous flux in this direction (see

Energies 2022, 15, 345 18 of 21
Table 10). The reflected luminous flux 47.1 klm corresponds to 5.6% of the luminous fluxemitted by the surveillance lighting system.
Table 10. Light emission characteristics of two operational modes of the electrical substation TRSlavetice.
Operation Mode of the ElectricalSubstation
Light Emission Characteristics ComprisingOnly the Direct Component of the
Luminous Flux to the Upper Hemisphere
Light Emission Characteristics ComprisingBoth the Direct and Reflected Components
of the Luminous Flux to the UpperHemisphere
Surveillance lighting
0 klm 47.1 klm
All-purpose lighting—the electrical substation
completely on
0 klm 479 klm
When taking into account all lighting systems in the electrical substation TR Slavetice,nil impact of the direct emission to the upper hemisphere is clearly visible. It is caused byasymmetrical-beam luminaires with zero tilt angle from the horizontal plane. Zero directcomponent of the luminous flux thus confirms the previous classification of this electricalsubstation to the environmental zone E2 (see Table 11). With respect to direct emission tothe upper hemisphere, this electrical substation is in compliance with requirements of theenvironmental zone E1.
Table 11. Overview of the operational modes of TR Slavetice electrical substation.
Lighting System Area(m2)
Installed Power(kW)
Installed LuminousFlux of All Light
Sources(klm)
Direct LuminousFlux to the Upper
Hemisphere(klm)
Direct and ReflectedLuminous Flux to theUpper Hemisphere
(klm)
TR Slavetice(surveillance/all lighting) 175,000 6.87/96.9 842/11,148 0/0 47.1/479
5.6. Final Comparison of Results of the Modeling of Lighting Installations in ChosenElectrical Substations
From Table 12 it follows that thanks to simple refurbishment of lighting installationsand by implementing rules for proper lighting design aimed at the most efficient and theleast obtrusive lighting, there is huge potential to reduce the installed power of lightingand at the same time to significantly mitigate the upward luminous flux.

Energies 2022, 15, 345 19 of 21
Table 12. Final comparison of the light emissions from lighting of outdoor workplaces versus lightemissions from road-lighting systems.
Lighting System Area(m2)
Installed Power(kW)
Installed LuminousFlux of All Light
Sources(klm)
Direct LuminousFlux to the Upper
Hemisphere(klm)
Direct and ReflectedLuminous Flux to theUpper Hemisphere
(klm)
TR Prosenice—beforerefurbishment(all lightings)
83,000 49.4 4649 251 432
TR Prosenice—afterrefurbishment(all lightings)
94,000 29.4 3375 0 233
TR Slavetice(all lightings) 175,000 96.9 11,148 0 479
TR Nošovice(all lightings) 73,000 61 8068 113 702
TR Prosenice—beforerefurbishment
(surveillance lighting)- 4.79 369 1.48 15.1
TR Prosenice—afterrefurbishment
(surveillance lighting)- 6.74 802 0 59.3
TR Slavetice(surveillance lighting) - 6.87 842 0 47.1
TR Nošovice(surveillance lighting) - 3.31 509 0 43.8
Another important factor having an essential impact on the reduction of obtrusivelight is the operation time of individual lighting systems. To satisfy appropriate luminousconditions for the operation of camera systems it is sufficient to keep running all night longonly the surveillance lighting, which makes only a few tens of percent of the total upwardluminous flux generated within the entire electrical substation while other lighting systemsshall be operated only in case of emergency situations or equipment monitoring activitiesfor what is annually only a few hours in total (see Table 12).
6. Discussion—Comparison of the Results of Modelling of Upward Light Emissionsfrom Large Entities
Models of light emissions from large entities described above can help to estimate theextent of the total as well as direct luminous flux emitted to the upper hemisphere. Potentialreduction of light emissions can be derived from comparison of lighting systems beforeand after refurbishment. In the overall context it is also possible to apply the models tosimilar systems of outdoor lighting [20] because constructing an accurate model dedicatedto a particular lighting installation is very demanding on time and working capacity.
The model can be used also for comparison of light emissions from outdoor workplaceswith light emissions from road-lighting systems and urban settlements [21,22]. The modelcan be easily extended and supplemented by further light sources such as luminousadvertisement, car headlights or interior lighting passing out through windows. This casestudy can also establish a base for a database of specific luminous fluxes emitted from unitareas of various types of illuminated spaces as is described in Table 13.
For future comparisons of radiation in the upper hemisphere it would be interestingto check not only luminous flux, but luminous exitance (lm/m2). This parameter can behelpful to recognise if the lighting system (luminaires [23] and reflected areas) is from apoint of view of obtrusive light generation appropriate or not.

Energies 2022, 15, 345 20 of 21
Table 13. Final comparison of the area-related specific upward light emissions from lighting installations.
Lighting System Area(m2)
Installed Power(W/m2)
Installed LuminousExitance of Light
Sources(lm/m2)
Direct LuminousExitance to the
Upper Hemisphere(lm/m2)
Direct and ReflectedLuminous Exitance to
the Upper Hemisphere(lm/m2)
TR Prosenice—beforerefurbishment(all lightings)
83,000 0.595 56 3.02 5.2
TR Prosenice—afterrefurbishment(all lightings)
94,000 0.313 35.9 0 2.48
TR Slavetice(all lightings) 175,000 0.554 63.7 0 2.74
TR Nošovice(all lightings) 73,000 0.836 111 1.55 9.62
Note: the worst results of calculated parameters according to proposed model; the best results of calculatedparameters according to proposed model (green colour best values, red colour worst values).
Author Contributions: Conceptualization, T.N. and P.B.; methodology, T.N.; software, P.B.; valida-tion, R.D. and J.R.; formal analysis, D.G.; investigation, R.D.; resources, R.D.; data curation, P.V.;writing—original draft preparation, T.N. and D.G.; writing—review and editing, R.D. and P.V.; visu-alization, J.U.; supervision, T.N. and D.G.; project administration, P.V.; funding acquisition, T.N. Allauthors have read and agreed to the published version of the manuscript.
Funding: This research was funded by VSB-TU Ostrava grant number SP2021/107 of the StudentGrant System and by Ministry of Education Youth and Sports of the Czech Republic grant numberEF17_049/0008425.
Institutional Review Board Statement: Not applicable.
Informed Consent Statement: Not applicable.
Data Availability Statement: The data presented in this study are available on request from thecorresponding author. The data are not publicly available due to usage of specific file format.
Acknowledgments: This paper was elaborated in the framework of the project SP2021/107 of theStudent Grant System VSB-TU Ostrava and the project EF17_049/0008425 of the Ministry of EducationYouth and Sports of the Czech Republic.
Conflicts of Interest: The authors declare no conflict of interest.
References1. EN 12464-2; Lighting of Work Places. Part 2: Outdoor Work Places. European Committee for Standardization: Brusel, Belgium,
2014.2. Jägerbrand, A.K. New Framework of Sustainable Indicators for Outdoor LED (Light Emitting Diodes) Lighting and SSL (Solid
State Lighting). Sustainability 2015, 7, 1028–1063. [CrossRef]3. CIE Commission Internationale de l’Éclairage. CIE 121. In The Photometry and Goniophotometry of Luminaires; International
Commission on Illumination: Vienna, Austria, 1996.4. Pollard, N. Sky-glow conscious lighting design. Int. J. Light. Res. Technol. 1994, 26, 151. [CrossRef]5. Novak, T.; Gasparovsky, D.; Becak, P.; Sokansky, K. Modelling of Large Light Sources Radiation to the Upper Hemisphere—
Obtrusive Light. In Proceedings of the 29th CIE SESSION, Washington, DC, USA, 14 June 2019; pp. 1684–1693. [CrossRef]6. Kyba, C.C.M.; Haenel, A.; Hoelker, F. Redefining efficiency for outdoor lighting. Energy Environ. Sci. 2014, 7, 1806–1809.
[CrossRef]7. Ullman, J.; Novak, T.; Sebesta, J.; Ullman, I. Fence Lighting System in Transmission System Substations—Night Visibility. In
Proceedings of the 21st International Scientific Conference on Electric Power Engineering (EPE), Prague, Czech Republic, 19–21October 2020; IEEE: Piscataway, NJ, USA; pp. 1–4. [CrossRef]
8. Bos, P.; Baleja, R.; Sokansky, K.; Novak, T.; Ullman, I. Selection of Lighting Systems in Outdoor Electrical Stations WorkingTogether with Camera Systems. In Proceedings of the 2016 IEEE Lighting Conference of the Visegrad Countries, Lumen V4,Karpacz, Poland, 13–16 September 2016; IEEE: Piscataway, NJ, USA; pp. 1–6. [CrossRef]
9. EN 13032-1 + A1; Light and Lighting. Light and Lighting. Measurement and Presentation of Photometric Data of Lamps andLuminaires. Measurement and File Format. DIN: Berlin, Germany, 2012.

Energies 2022, 15, 345 21 of 21
10. EN 13032-2; Light and Lighting. Measurement and Presentation of Photometric Data of Lamps and Luminaires. Part 2:Presentation of Data for Indoor and Outdoor Work Places. European Committee for Standardization: Brusel, Belgium, 2017.
11. Becak, P.; Novak, T.; Baleja, R.; Sokansky, K. Testing of the Software Goniophotometer in Wils—Building Design ComputationalProgramme. In Proceedings of the 19th International Scientific Conference on Electric Power Engineering (EPE), Brno, CzechRepublic, 16–18 May 2018; IEEE: Piscataway, NJ, USA; pp. 1–5. [CrossRef]
12. Elsahragty, M.; Kim, J.L. Assessment and Strategies to Reduce Light Pollution Using Geographic Information Systems. ProcediaEng. 2015, 118, 479–488. [CrossRef]
13. Bouroussis, C.A.; Topalis, F.V. Assessment of outdoor lighting installations and their impact on light pollution using unmannedaircraft systems—The concept of the drone-gonio-photometer. J. Quant. Spectrosc. Radiat. Transf. 2020, 253, 107155. [CrossRef]
14. Becak, P.; Wlosokova, J.; Picha, J.; Novak, T.; Sokansky, K. Modeling of Luminous Flux Radiation to the Upper Hemisphere fromReal Model of Town. In Proceedings of the 20th International Scientific Conference on Electric Power Engineering (EPE), Koutynad Desnou, Czech Republic, 15–17 May 2019; pp. 164–168. [CrossRef]
15. Becak, P.; Novak, T.; Baleja, R.; Sokansky, K. Radiation of the Luminous Flux into the Upper Half-Space in Wils—Building Design.In Proceedings of the 7th Lighting Conference of the Visegrad Countries (LUMEN V4), Trebic, Czech Republic, 18–20 November2018; IEEE: Piscataway, NJ, USA; pp. 1–5. [CrossRef]
16. Petržala, J.; Kómar, L. Data regression on sphere for luminance map creation from sky scanner measurements. Sol. Energy 2015,117, 203–212. [CrossRef]
17. Gasparovsky, D. Measurement of Daylight Illuminance Levels in Transient Periods for Public Lighting Control. Prz. Elektrotech.2013, 89, 320–323.
18. Bouroussis, C.; Lowenthal, J.; Bara, S.; Jägerbrand, A.; Jechow, A.; Longcore, T.; Motta, M.; Sanhueza, P.; Schlangen, L.; Schroer, S.Bio-Environment Report. In On-Line Workshop Dark and Quiet Skies for Science and Society Report and Recommendations.Procedings of the On-Line Workshop Dark and Quiet Skies for Science and Society Report and Recommendations, Paris, France,9 December 2020; International Astronomical Union: Paris, France; pp. 92–117.
19. Bos, P.; Baleja, R.; Sokansky, K.; Novak, T. Outdoor Power Stations CCTV Systems that Work Synergistically with the SecurityLighting. In Proceedings of the 2017 17th IEEE International Conference on Environment and Electrical Engineering and 20171st IEEE Industrial and Commercial Power Systems Europe, EEEIC/I and CPS Europe 2017, Milan, Italy, 6–9 June 2017; IEEE:Piscataway, NJ, USA; pp. 1–5. [CrossRef]
20. Hold-Geoffroy, Y.; Athawale, A.; Lalonde, J. Deep Sky Modeling for Single Image Outdoor Lighting Estimation. In Proceedings ofthe IEEE Conference on Computer Vision and Pattern Recognition, Long Beach, CA, USA, 15 June 2019; IEEE: Piscataway, NJ,USA; pp. 6920–6928. [CrossRef]
21. Walczak, K.; Gyuk, G.; Garcia, J.; Tarr, C. Light Pollution Mapping from a Stratospheric High-Altitude Balloon Platform. Int. J.Sustain. Lighting (IJSL) 2021, 23, 20–32. [CrossRef]
22. Xing, G.; Zhou, X.; Peng, Q.; Liu, Y.; Qin, X. Lighting Simulation of Augmented Outdoor Scene Based on a Legacy Photograph.Comput. Graph. J. 2013, 32, 101–110. [CrossRef]
23. Gasparovsky, D.; Smola, A.; Macha, M.; Janiga, P. New Approach to Determination of Luminaire Maintenance Factor Curves forVarious Conditions. Light Eng. 2012, 20, 17–26.