Modelling hysteretic behaviour of coupled walls for dynamic analysis
16
EARTHQUAKE ENGINEERING AND STRUCTURAL DYNAMICS, VOL. II, 711 726 (1983) MODELLING HYSTERETIC BEHAVIOUR OF COUPLED WALLS FOR DYNAMIC ANALYSIS MURAT SAATCIOGLU* Department of Cinil Engineering, University of Toronto, Toronto, Ontario, Canada ARNALDO T. DERECHO~ Wiss, Janney, Elstner & Assoc., Northbrook, Ill., U.S.A. AND w. G. CORLEY~ Construction Technology Laboratories, Skokie, Illinois, U.S.A. SUMMARY Modelling techniques for dynamic inelastic response analysis of coupled wall structures are investigated. Emphasis is placed o n effects of parameters defining the force-displacement hysteresis loop. Specifically, effects of axial force-moment interaction, strength reduction, shear yielding, pinching, reloading and unloading branches of hysteresis loops are considered. Effects of modelling parameters on selected response quantities are investigated and discussed in detail. A 20-storey coupled wall structure was selected for dynamic analysis. Ranges of parameters characterizing force- displacement hysteresis loops were obtained from laboratory tests under slowly reversed static loading. Previously recorded strong motion accelerograms were used as input motions. Results indicate that wall axial forces and beam strength reduction can have significant effects on response envelopes. Moderate variations in unloading and reloading branches of hysteresis loops and pinching appear to have little effect on dynamic response. INTRODUCTION Reinforced concrete coupled walls are often used to stiffen multistorey structures against seismic forces. Under strong ground excitations, portions of a coupled wall system can be expected to deform beyond the elastic limit. Therefore, dynamic response analysis of coupled walls should consider inelastic behaviour. Computer time required for dynamic inelastic analysis is significantly affected by the complexity of the force-deformation hysteresis model used. Increased refinements in analytical models must be balanced against the increased costs incurred in the analysis. The objective of this paper is to evaluate the significance of a number of experimentally observed features of force-deformation hysteresis loops in relation to dynamic inelastic response of a 20-storey coupled wall structure. Properties of a 20-storey coupled wall structure selected for dynamic analysis are given in Table I and Figure 1. A modified version of computer program DRAIN-2D' was used for the analysis. Each structural member was idealized as a line element. Inelastic action was simulated by allowing formation of hinges at member ends. Program capabilities, as modified by the Construction Technology Laboratories, include modelling of inelastic moment-rotation and shear-distortion relationships. Axial force-deformation relationships were considered to be linearly elastic throughout the investigation. An inelastic force- deformation model for shear was used only when effects of shear yielding and pinching were being investigated. Former Senior Structural Engineer, Construction Technology Laboratories.$ f Former Manager. Structural Analytical Section, Construction Technology Laboratories.$ :[ Divisional Director, Engineering Development Division. 8 Construction Technology Laboratories is a Division of Portland Cement Association, Skokie, Ill., U.S.A. 0098-8847/83/050711-16$01.60 Received I2 January 1982 (0 1983 by John Wiley & Sons, Ltd. Revised I March 1983
-
Upload
independent -
Category
Documents
-
view
3 -
download
0
Transcript of Modelling hysteretic behaviour of coupled walls for dynamic analysis

EARTHQUAKE ENGINEERING AND STRUCTURAL DYNAMICS, VOL. I I , 711 726 (1983)
MODELLING HYSTERETIC BEHAVIOUR OF COUPLED WALLS FOR DYNAMIC ANALYSIS
MURAT SAATCIOGLU*
Department of Cinil Engineering, University of Toronto, Toronto, Ontario, Canada
ARNALDO T. DERECHO~
Wiss , Janney, Elstner & Assoc., Northbrook, Ill., U.S.A.
AND
w. G . C O R L E Y ~
Construction Technology Laboratories, Skokie, Illinois, U.S .A.
SUMMARY
Modelling techniques for dynamic inelastic response analysis of coupled wall structures are investigated. Emphasis is placed on effects of parameters defining the force-displacement hysteresis loop. Specifically, effects of axial force-moment interaction, strength reduction, shear yielding, pinching, reloading and unloading branches of hysteresis loops are considered. Effects of modelling parameters on selected response quantities are investigated and discussed in detail.
A 20-storey coupled wall structure was selected for dynamic analysis. Ranges of parameters characterizing force- displacement hysteresis loops were obtained from laboratory tests under slowly reversed static loading. Previously recorded strong motion accelerograms were used as input motions.
Results indicate that wall axial forces and beam strength reduction can have significant effects on response envelopes. Moderate variations in unloading and reloading branches of hysteresis loops and pinching appear to have little effect on dynamic response.
INTRODUCTION
Reinforced concrete coupled walls are often used to stiffen multistorey structures against seismic forces. Under strong ground excitations, portions of a coupled wall system can be expected to deform beyond the elastic limit. Therefore, dynamic response analysis of coupled walls should consider inelastic behaviour.
Computer time required for dynamic inelastic analysis is significantly affected by the complexity of the force-deformation hysteresis model used. Increased refinements in analytical models must be balanced against the increased costs incurred in the analysis. The objective of this paper is to evaluate the significance of a number of experimentally observed features of force-deformation hysteresis loops in relation to dynamic inelastic response of a 20-storey coupled wall structure.
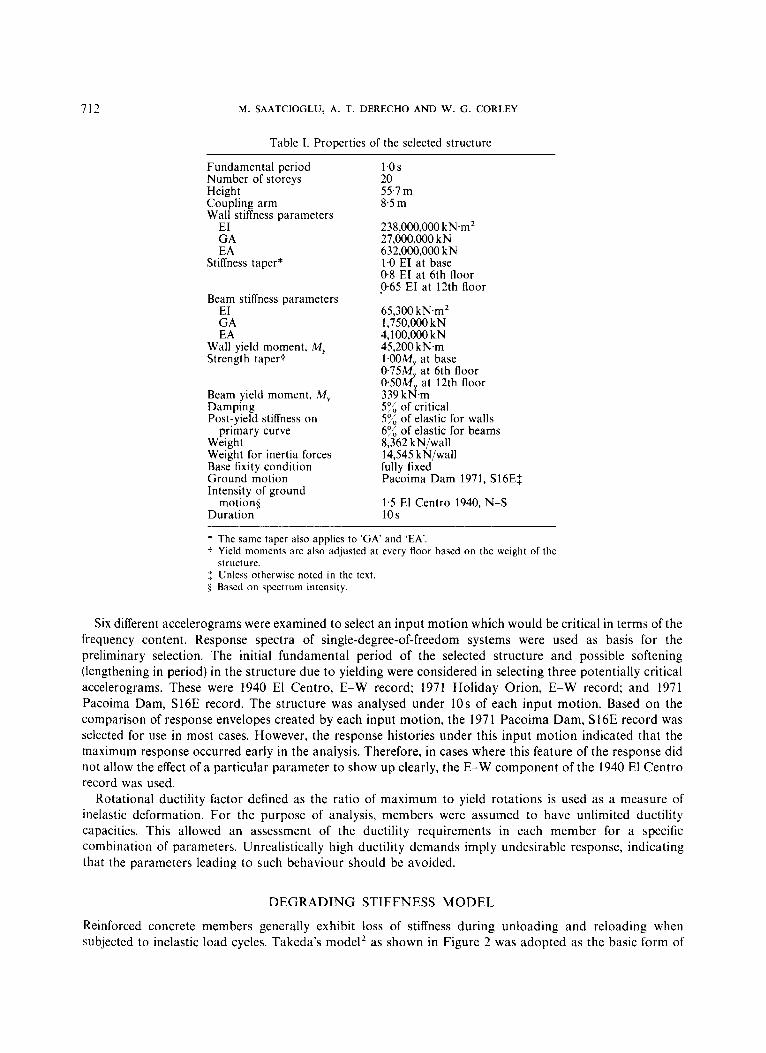
Properties of a 20-storey coupled wall structure selected for dynamic analysis are given in Table I and Figure 1. A modified version of computer program DRAIN-2D' was used for the analysis. Each structural member was idealized as a line element. Inelastic action was simulated by allowing formation of hinges at member ends. Program capabilities, as modified by the Construction Technology Laboratories, include modelling of inelastic moment-rotation and shear-distortion relationships. Axial force-deformation relationships were considered to be linearly elastic throughout the investigation. An inelastic force- deformation model for shear was used only when effects of shear yielding and pinching were being investigated.
Former Senior Structural Engineer, Construction Technology Laboratories.$ f Former Manager. Structural Analytical Section, Construction Technology Laboratories.$ :[ Divisional Director, Engineering Development Division. 8 Construction Technology Laboratories is a Division of Portland Cement Association, Skokie, Ill., U.S.A. 0098-8847/83/050711-16$01.60 Received I2 January 1982 (0 1983 by John Wiley & Sons, Ltd. Revised I March 1983
712 M. SAATCIOGLU, A . T. DERECHO AND W. G. CORLEY
Table I. Properties of the selected structure
Fundamental period Number of storeys Height Coupling arm Wall stiffness parameters
EI GA EA
Stiffness taper*
Beam stiffness parameters EI GA EA
Wall yield moment, My Strength taper?
Beam yield moment, My Damping Post-yield stiffness on
Weight Weight for inertia forces Base fixity condition Ground motion Intensity of ground
Duration
primary curve
motion$
1.0s 20 55.7 m 8.5 m
23 8,000,000 kN.m2 27,000,000 kN 632,000,000 kN 1.0 EI at base 0.8 EI at 6th floor 0.65 EI at 12th floor
65,300 kN.m2 1,750,000 kN 4,100,000 kN 45,200 kN.m 1.00MY at base 0.75M at 6th floor 0.50d at 12th floor 339 kd.m 5% of critical 5% of elastic for walls 604, of elastic for beams 8,362 kN/wall 14,545 kN/wall fully fixed Pacoima Dam 1971, S16ES
1.5 El Centro 1940, N-S 10s
* The same taper also applies to ‘GA’ and ‘EA’. t Yield moments are also adjusted at every floor based on the weight of the
1 Unless otherwise noted in the text. 5 Based on spectrum intensity.
structure.
Six different accelerograms were examined to select an input motion which would be critical in terms of the frequency content. Response spectra of single-degree-of-freedom systems were used as basis for the preliminary selection. The initial fundamental period of the selected structure and possible softening (lengthening in period) in the structure due to yielding were considered in selecting three potentially critical accelerograms. These were 1940 El Centro, E-W record; 1971 Holiday Orion, E-W record; and 1971 Pacoima Dam, S16E record. The structure was analysed under 10s of each input motion. Based on the comparison of response envelopes created by each input motion, the 1971 Pacoima Dam, S16E record was selected for use in most cases. However, the response histories under this input motion indicated that the maximum response occurred early in the analysis. Therefore, in cases where this feature of the response did not allow the effect of a particular parameter to show up clearly, the E-W component of the 1940 El Centro record was used.
Rotational ductility factor defined as the ratio of maximum to yield rotations is used as a measure of inelastic deformation. For the purpose of analysis, members were assumed to have unlimited ductility capacities. This allowed an assessment of the ductility requirements in each member for a specific combination of parameters. Unrealistically high ductility demands imply undesirable response, indicating that the parameters leading to such behaviour should be avoided.
DEGRADING STIFFNESS MODEL
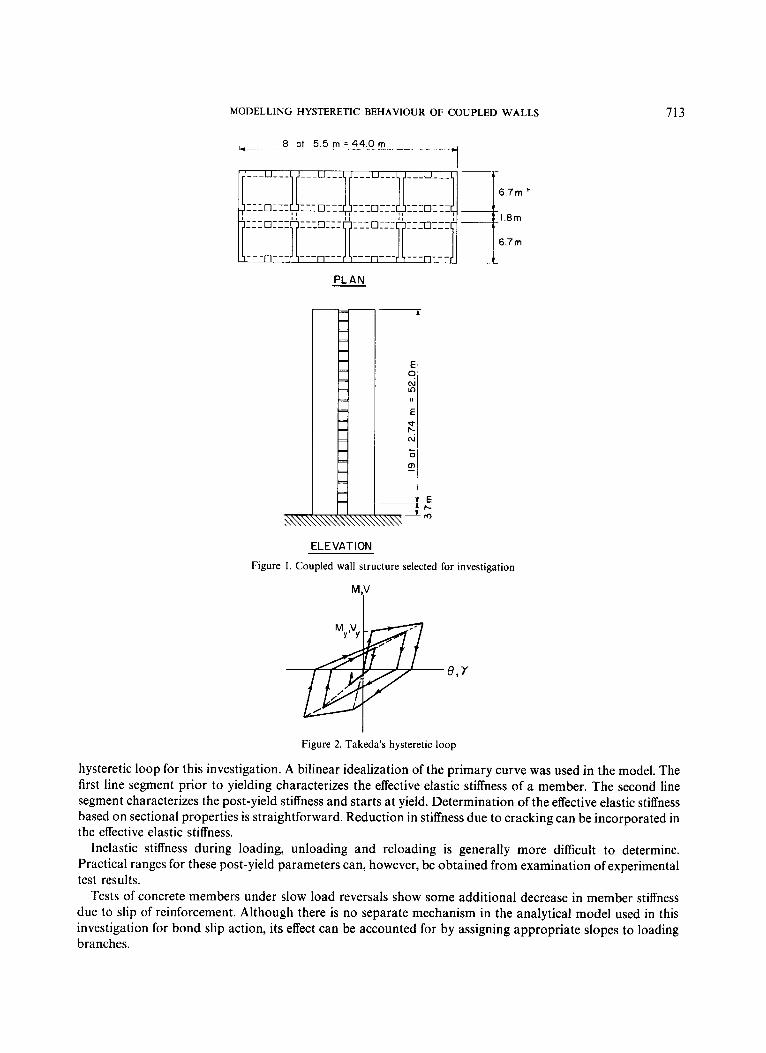
Reinforced concrete members generally exhibit loss of stiffness during unloading and reloading when subjected to inelastic load cycles. Takeda’s model’ as shown in Figure 2 was adopted as the basic form of
MODELLING HYSTERETIC BEHAVIOUR OF COUPLED WALLS 713
8 at 5 5 m - 4 4 O m -~
PLAN
ELE VAT1 ON
Figure 1 . Coupled wall structure selected for investigation
Figure 2. Takeda’s hysteretic loop
hysteretic loop for this investigation. A bilinear idealization of the primary curve was used in the model. The first line segment prior to yielding characterizes the effective elastic stiffness of a member. The second line segment characterizes the post-yield stiffness and starts at yield. Determination of the effective elastic stiffness based on sectional properties is straightforward. Reduction in stiffness due to cracking can be incorporated in the effective elastic stiffness.
Inelastic stiffness during loading, unloading and reloading is generally more difficult to determine. Practical ranges for these post-yield parameters can, however, be obtained from examination of experimental test results.
Tests of concrete members under slow load reversals show some additional decrease in member stiffness due to slip of reinforcement. Although there is no separate mechanism in the analytical model used in this investigation for bond slip action, its effect can be accounted for by assigning appropriate slopes to loading branches.
714 M. SAATCIOGLU, A. T. DERECHO AND W. G. CORLEY
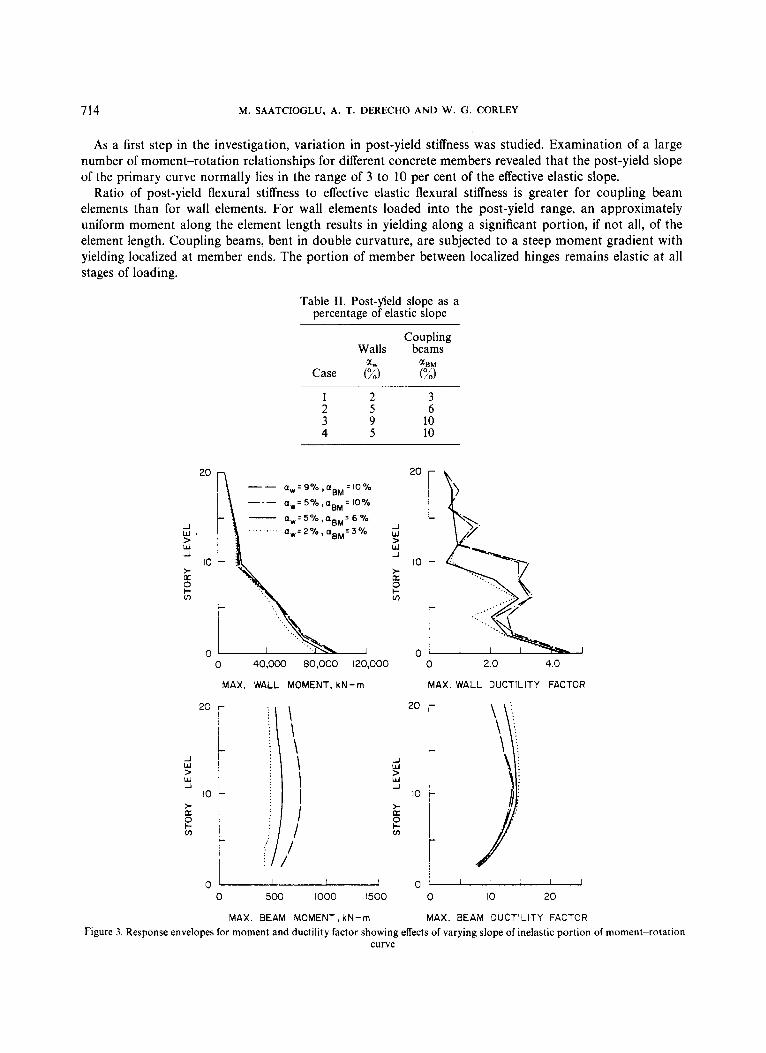
As a first step in the investigation, variation in post-yield stiffness was studied. Examination of a large number of moment-rotation relationships for different concrete members revealed that the post-yield slope of the primary curve normally lies in the range of 3 to 10 per cent of the effective elastic slope.
Ratio of post-yield flexural stiffness to effective elastic flexural stiffness is greater for coupling beam elements than for wall elements. For wall elements loaded into the post-yield range, an approximately uniform moment along the element length results in yielding along a significant portion, if not all, of the element length. Coupling beams, bent in double curvature, are subjected to a steep moment gradient with yielding localized at member ends. The portion of member between localized hinges remains elastic at all stages of loading.
Table 11. Post-yield slope as a percentage of elastic slope
Coupling Walls beams
1 2 3 2 5 6 3 9 10 4 5 10
- a , = 5 % , o g M = 6 % aw = 2 % , aBM = 3%
I 0 40,000 80,000 120,000 0 2.0 4.0
MAX. WALL MOMENT, kN - rn MAX. WALL DUCTILITY FACTOR
2o r
c
2o r 1
I I I 0-
0 500 1000 1500 0 I0 20
MAX. BEAM MOMENT, kN-rn MAX. aEAM DUCTILITY FACTCR Figure 3. Response envelopes for moment and ductility factor showing effects of varying slope of inelastic portion of moment-rotation
curve

MODELLING HYSTERETIC BEHAVIOUR OF COUPLED WALLS 715
A set of analyses was conducted to determine the significance of variations in post-yield slope of the primary curve within the range observed in tests. The 20-storey coupled wall structure was analysed four times with different percentages of effective elastic slope used for post-yield slope of the primary curve. Cases covered are listed in Table 11.
Response envelopes for these four cases are compared in Figures 3 and 4. Results indicate that for the range of values assumed, maximum wall displacements and forces are not significantly affected by variations in post-yield slope. On the other hand, maximum forces in beams appear to be affected by changes in magnitude of the second slope. This can be attributed to high levels of inelastic action and associated ductilities in coupling beams.
Effects of varying unloading and reloading stiffnesses were investigated. As shown in Figure 5, parameters ‘u’ and ‘r’ define unloading and reloading stiffnesses, respectively. In a previous study3 of isolated walls, it was concluded that within the assumed range, variations in unloading and reloading stiffnesses do not significantly affect dynamic response. In this investigation, ‘u’ and ‘r’ were held constant at 0 1 and 0.0, respectively, for wall elements. For coupling beams, three analyses were carried out using unloading and reloading parameters listed in Table 111.
Maximum forces and displacements for the three cases considered were found to differ by no more than 5 per cent.
20
J W > w
0 0 I00 200 300
MAX. HORIZONTAL DISPLACEMENT, mm
2o i c $ 1 w
I O L
I-
i \ )) -8000 0 8000 16000 24000
MAX. AXIAL FORCE IN WALLS ,kN
I 0 ‘ I I I
0 400 800 120G
MAX. BEAM SHEAR, kN MAX. WALL SHEAR, kN Figure 4. Response envelopes for displacement, axial force and shear showing effects of varying slope of inelastic portion of moment-
rotation curve

716 M. SAATCIOGLU, A. T. DERECHO AND W. G. CORLEY
Figure 5 . Moment-rotation curve showing parameters defining unloading and reloading stiffnesses
Table 111. Unloading and reloading para- meters for coupling beams
Unloading Reloading Case parameter, u parameter, r
1 0.1 0 2 0.3 0 3 0.1 1 .o
AXIAL FORCE-FLEXURE INTERACTION MODEL
Coupled walls undergo significant changes in level of axial force during response to lateral forces. Variations in axial forces directly influence force-deformation characteristics of members. Strength and stiffness properties of coupled walls can be altered significantly by changes in the level of axial force.4 Therefore, the reducing stiffness model was modified to include axial force-flexure interaction. The modified model is shown in Figure 6. A set of hysteretic loops, corresponding to different levels of axial force, is used as a guide in predicting change in stiffness due to axial force effects. The basic concept in introducing the effect of changing axial forces is to update stiffness for the subsequent time increment, based on axial force calculated for the current time increment. Consequently, if there is an increase in axial force then the hysteretic loop will be directed towards the corresponding moment-rotation loop which has higher yield strength. This will
M
Figure 6. Moment-rotation curve including axial load effects

MODELLING HYSTERETIC BEHAVIOUR OF COUPLED WALLS 717
produce a higher slope of the hysteretic loop indicating an increase in stiffness. Details of the model are explained with examples in Reference 5.
Figure 7 shows a plot of base moment versus hinge rotation for the 20-storey coupled wall structure when the modified model was used. Also shown is the moment-rotation curve associated with the primary curve without interaction. Reduction in wall strength and stiffness when the wall is in tension and the reverse effect when the wall is in compression can be observed when the interaction effect is included.
80,000
60,000
40,000
20,000
0
-20,000
-40,000
- 6 0,000
Wall 0 Tension
npression
--- Primary Curve without M - P Interaction
- Model with M-P interaction
I I I
-0 002 -0 001 0 0.001 0.002
-80.000
Rotation of Hinging Region (radians)
80,000
60,000 E ' 40,000 5
20,000
E 0
c c
P 0 -20,000 In 0
-40,000
-60,000
-80,000
wal l Q
--- Primary Curve without M - P Interaction
- Model with M-P interoction
I I I I -0.002 -0.001 0 0.001 0.002
Rotation of Hinging Region, (radians)
Figure 7. Effect of moment-axial load interaction on hysteretic loops
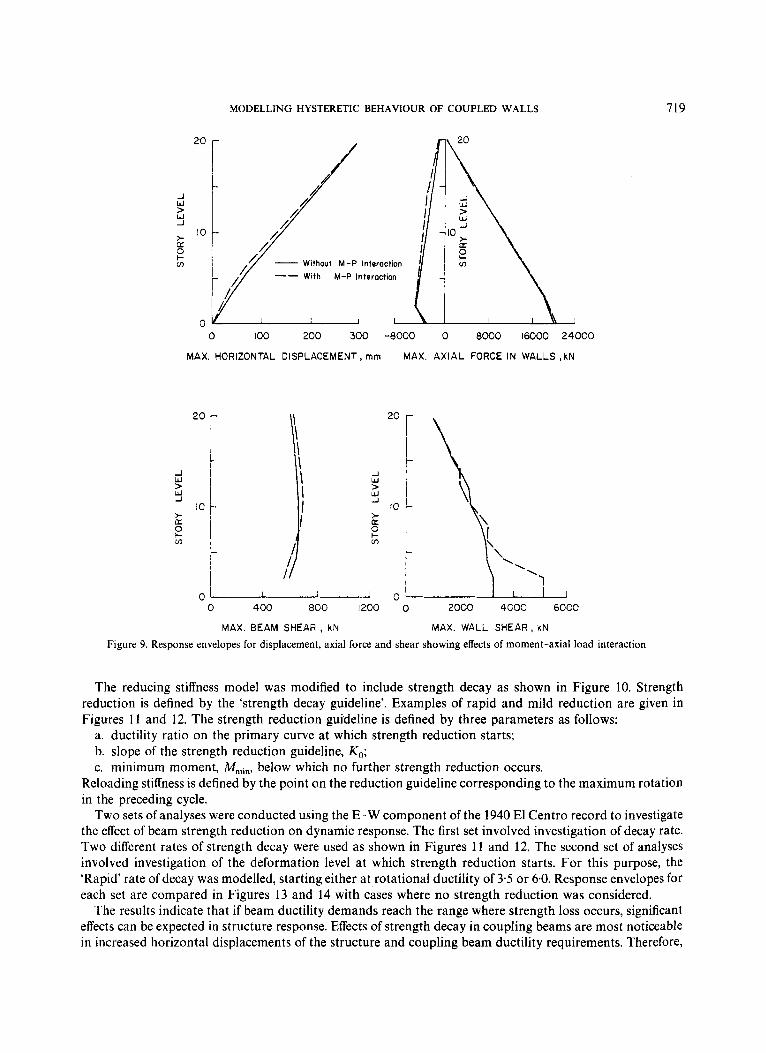
The significance of axial force-flexure interaction on response envelopes was investigated. For this purpose, the 20-storey coupled wall structure was analysed twice. The modified model with axial force- flexure interaction was used in the first analysis. In the second analysis, axial force-flexure interaction was ignored. Response envelopes for the two cases are compared in Figures 8 and 9.
The results indicate that maximum forces in the walls can be affected significantly by axial forces. When the effect of axial force was ignored maximum shear and moment in the base wall were underestimated by as much as 50 per cent. Moreover, the sequence of yielding and the yielding pattern for the two structures were different since the yield level is affected by concurrent axial force. It should be noted that the difference between the maximum wall ductilities of the two cases compared in Figure 8 due to the lower yield level of

718 M. SAATCIOGLU, A. T. DERECHO AND W. G . CORLEY
20
- Without M-P Interaction
J w > W -1
t
0 t- fn
With M-P Interaction --
a
20
-1 w > w
a 0 t- m
0 0 40,000 80,000 120,000 0 2.0 4.0
MAX. WALL MOMENT, kN-m MAX. WALL DUCTILITY FACTOR
c
W J I 10 r
z l 0 t-
m I t
1 /
/
2o r
1 2 0 I- l o r
J W > w J
fn
r I I /
0- 0- 0 500 1000 1500 0 10 20
MAX. SEAM MOMENT, kN-m MAX. BEAM DUCTILITY FACTOR
Figure 8. Response envelopes for moment and ductility factor showing effects of moment-axial load interaction
tension walls. It does not necessarily imply increased horizontal displacements of tension walls. Maximum horizontal displacements are shown in Figure 9.
It can be concluded from the above comparison that in performing dynamic inelastic analysis of coupled walls, effects of axial forces should be considered. Inaccurate response quantities can result if these effects are ignored.
STRENGTH REDUCTION UNDER LOAD REVERSALS
Reinforced concrete members generally show strength reduction or strength decay under repeated load reversals. The term strength decay is used to signify a reduction in maximum force that can be carried by a member under successive reversing loads. The degree of strength decay depends on structure geometry, reinforcement detailing, confinement and history of loading. Experiments have shown that a reduction in strength generally occurs under high levels of inelastic In the case of coupled wall structures, wall ductilities are usually limited to values of approximately 3.0. Coupling beams can be expected to dissipate most of the energy by developing ductilities in the range of 6.0 or more. Therefore strength decay in coupled wall structures is generally associated with coupling beams.
MODELLING HYSTERETIC BEHAVIOUR OF COUPLED WALLS 719
20
-1 W > W -I
> lo a 0 t- cn
0 0 I00 200 300 -8000 0 8000 16000 24000
MAX. HORIZONTAL DISPLACEMENT, rnrn MAX. AXIAL FORCE IN WALLS ,kN
i $ 1 W J
10
t I
I I
I I i c W J l
2 cn lCl \ 1
The reducing stiffness model was modified to include strength decay as shown in Figure 10. Strength reduction is defined by the ‘strength decay guideline’. Examples of rapid and mild reduction are given in Figures 1 1 and 12. The strength reduction guideline is defined by three parameters as follows:
a. ductility ratio on the primary curve at which strength reduction starts; b. slope of the strength reduction guideline, KO; c. minimum moment, Mmi,, below which no further strength reduction occurs.
Reloading stiffness is defined by the point on the reduction guideline corresponding to the maximum rotation in the preceding cycle.
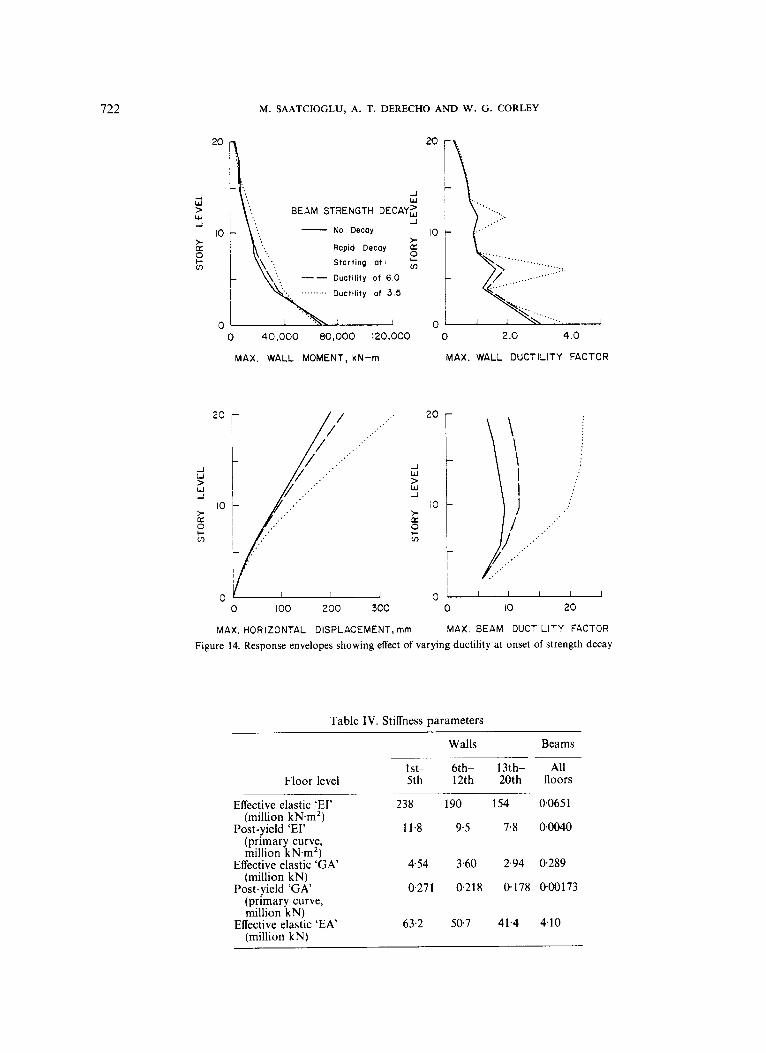
Two sets of analyses were conducted using the E-W component of the 1940 El Centro record to investigate the effect of beam strength reduction on dynamic response. The first set involved investigation of decay rate. Two different rates of strength decay were used as shown in Figures 11 and 12. The second set of analyses involved investigation of the deformation level at which strength reduction starts. For this purpose, the ‘Rapid’ rate of decay was modelled, starting either at rotational ductility of 3.5 or 6.0. Response envelopes for each set are compared in Figures 13 and 14 with cases where no strength reduction was considered.
The results indicate that if beam ductility demands reach the range where strength loss occurs, significant effects can be expected in structure response. Effects of strength decay in coupling beams are most noticeable in increased horizontal displacements of the structure and coupling beam ductility requirements. Therefore,

720 M. SAATCIOGLU, A. T. DERECHO AND W. G. CORLEY
Figure 10. Force deformation hysteretic loop including strength decay
RAPID DECAY STARTING AT f i = 3 5
KO" 20 K I
K2= 6 % KI
My =339 k N - m I I M,,,z 34 k N - m
Figure 1 1 . Rapid strength decay
M
t e MILD DECAY
STARTING AT fi = 3 5
K,=IO % KI
K 2 = 6 % KI
M, = 339 hN-m
M,,,= 203 kN-rn
Figure 12. Mild strength decay

MODELLING HYSTERETIC BEHAVIOUR OF COUPLED WALLS
0
72 1
.... ......... ......
....
c /. Y.’ .......................
’\. .. .... I 1 ‘...I
y. . J
2o 1 i w > w _1
>- [I 0 I- In
I0
0
-I w
BEAM STRENGTH DECAY= No Decay ’
Mild Decay > a
Rapid Decay ....... 2 m 1 \ Ductiiity of 3.5
I I
I I I
0 40,000 80,000 120,000
MAX, WALL MOMENT, kN-m
0 2.0 4.0
MAX. WALL DUCTILITY FACTOR
0 0 10 20
0 : 0 I00 200 300
MAX, HORIZONTAL DISPLACEMENT, rnm MAX. BEAM DUCTILITY FACTOR
Figure 13. Response envelopes showing effects of rate of strength decay
in modelling hysteretic loops for dynamic inelastic analysis, care should be taken to simulate strength reduction of beams appropriately depending on the expected maximum deformation level.
SHEAR YIELDING
Tests of isolated walls conducted under slow load reversals at the Construction Technology Laboratories indicate that flexural yielding is usually accompanied by shear yielding.6. ’ To investigate the effect of shear yielding on dynamic response, the shear force-shear distortion hysteretic loop was modelled on the basis of Takeda’s2 rules as shown in Figure 2.
The 20-storey coupled wall structure was analysed twice, first with shear yielding and then without shear yielding. Effective elastic flexural and shear stiffnesses were used to define the primary force-deformation relationship. Table IV gives the stiffness parameters used in the analyses. The shear deformations were computed using shear stiffnesses based on the hysteretic model shown in Figure 2. The shear yield level in the model was governed by flexural yielding, a phenomenon observed in laboratory ’ Accordingly, shear yielding was allowed following flexural yielding even if the previously specified shear yield level was not achieved. Because the structure under consideration was designed to avoid premature shear failure, shear yielding could only occur due to the flexural yielding and the subsequent change in shear resisting mechanism. Response envelopes for the two cases are compared in Figures 15 and 16.
122 M. SAATCIOGLU, A. T. DERECHO AND W. G. CORLEY
20
4 w > W -1 10
0
-1 w
BEAM STRENGTH DECAY2 -1
2.
0
- NO Decoy
Ropid Decoy a Stor t ing o t : $ Ducti l i ty of 6.0
Ducti l i ty of 3.5
I I
-1 w
BEAM STRENGTH DECAY2 -1
2.
0
- NO Decoy
Ropid Decoy a Stor t ing o t : $ Ducti l i ty of 6.0
Ducti l i ty of 3.5
I I
0 40,000 80,000 120,000 0 2 .o 4.0
MAX. WALL MOMENT, kN-rn MAX. WALL DUCTILITY FACTOR
20 r i W > W d 10
2. 0: 0 c 63
0 0 I00 200 300
W -1
i0 i-
i 0 1 I I 1 I I
0 10 20
MAX. HORIZONTAL DISPLACEMENT, mm MAX. BEAM DUCTiL iTY FACTOR
Figure 14. Response envelopes showing effect of varying ductility at onset of strength decay
Table IV. Stiffness parameters
Floor level
Effective elastic ‘EI’ (million kN.m2)
Post-yield ‘EI’ (primary curve, million kN.m2)
Effective elastic ‘GA’ (million kN)
Post-yield ‘GA’ (primary curve, million kN)
Effective elastic ‘EA (million kN)
Walls Beams
5th 12th 20th floors 1st- 6th- 13th- All
~
238 190 154 0.0651
11.8 9.5 7.8 0.0040
4.54 3.60 2.94 0.289
0.271 0.218 0.178 OQ0173
63.2 50.7 41.4 4.10
MODELLING HYSTERETIC BEHAVIOUR OF COUPLED WALLS 723
20
i W > W _I
>- 0 t v)
10 a
0
1 Elastic Shear
. . . . . . . . . Inelostic Shear with Pinching
Inelastic Shear wilhout Pinching
20
-1 W > W -1
> 0 I- v)
10 a
0 0 40,000 80,000 120,000 0 2.0 4 0
MAX. WALL MOMENT, k N - r n M A X . WALL DUCTILITY FACTOR
2o r W > 4 W I
0 500 1000 1500 0 10 20
M A X , BEAM MOMENT, kN-rn M A X . BEAM DUCTILITY FACTOR
Figure 15. Response envelopes for moment and ductility factor showing effects of inelastic shear and pinching
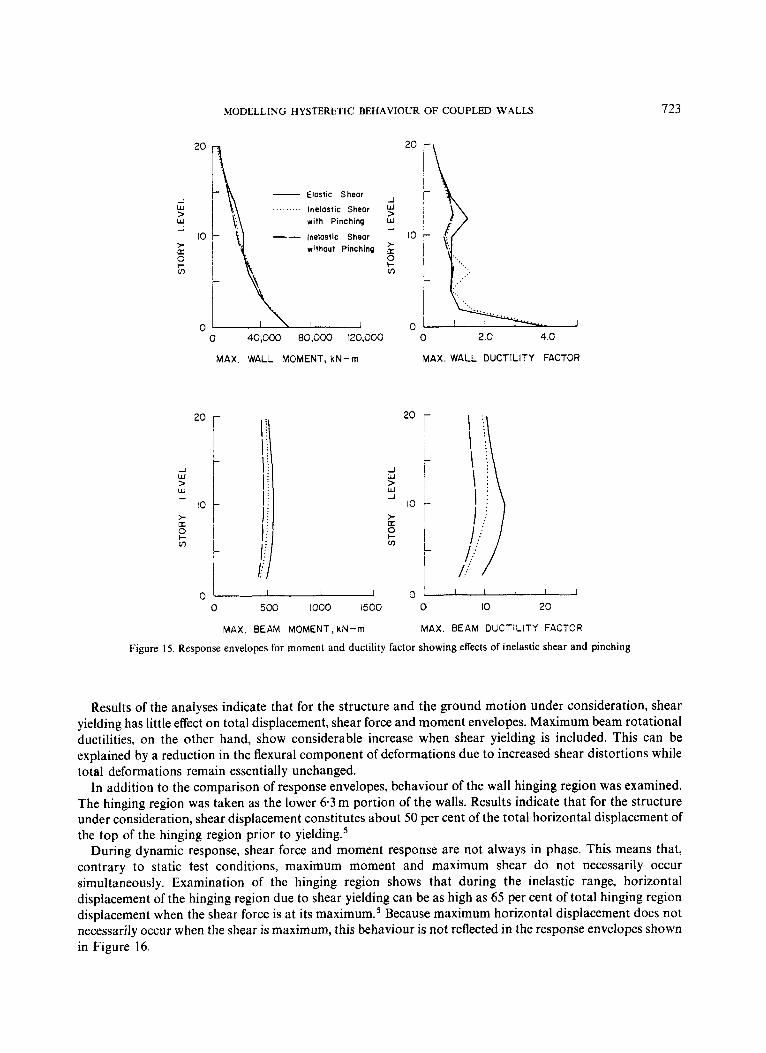
Results of the analyses indicate that for the structure and the ground motion under consideration, shear yielding has little effect on total displacement, shear force and moment envelopes. Maximum beam rotational ductilities, on the other hand, show considerable increase when shear yielding is included. This can be explained by a reduction in the flexural component of deformations due to increased shear distortions while total deformations remain essentially unchanged.
In addition to the comparison of response envelopes, behaviour of the wall hinging region was examined. The hinging region was taken as the lower 6.3 m portion of the walls. Results indicate that for the structure under consideration, shear displacement constitutes about 50 per cent of the total horizontal displacement of the top of the hinging region prior to ~ i e ld ing .~
During dynamic response, shear force and moment response are not always in phase. This means that, contrary to static test conditions, maximum moment and maximum shear do not necessarily occur simultaneously. Examination of the hinging region shows that during the inelastic range, horizontal displacement of the hinging region due to shear yielding can be as high as 65 per cent of total hinging region displacement when the shear force is at its m a ~ i m u r n . ~ Because maximum horizontal displacement does not necessarily occur when the shear is maximum, this behaviour is not reflected in the response envelopes shown in Figure 16.

724 M. SAATCIOGLU, A. T. DERECHO AND W. G. CORLEY
0 I00 200 300 -8000 0 8000 16000 24030
MAX. HORIZONTAL DISPLACEMENT, mm MAX. AXIAL FORCE IN WALLS ,kN
I 0 ' I I 1 0 1 I ) : I I
0 400 8OC 1200 0 2000 4000 6000
MAX. BEAM SHEAR, kN MAX. WALL SHEAR, k N Figure 16. Response envelopes for displacement, axial force and shear showing effects of inelastic shear and pinching
The same set of analyses was repeated ufider a different earthquake motion. Input motion used for this case was the E-W component of the 1940 El Centro record. Comparison of response envelopes indicates that shear yielding has very little effect on response.
It is obviously important to use reasonably accurate estimates of flexural and shear stiffnesses of members in defining primary force-deformation relationships. Tests indicate that flexural and shear cracking of members reduce their stiffnesses substantially. Effective flexural stiffness prior to yielding can be as low as 30 per cent to 50 per cent of uncracked stiffness. Effective shear stiffness can be as low as 10 per cent to 30 per cent of the stiffness associated with gross (uncracked) area. In the above two sets of analyses, 50 per cent and 10 per cent of uncracked stiffnesses were used for flexure and shear, respectively. It should be noted that the relatively high reduction in shear stiffness was intentionally used to stimulate the inelastic shear deformation effect.
A third set of analyses included higher shear stiffness. In this set of analyses, flexural stiffness remained the same while the shear stiflness was increased by a factor of 5 to 50 per cent of uncracked stiffness. Results indicate that shear yielding effects on response envelopes are further reduced showing a maximum of 5 per cent difference in response between the structure with elastic shear and the structure in which shear yielding was considered.
MODELLING HYSTERETIC BEHAVIOUR OF COUPLED WALLS 725
PINCHING IN HYSTERESIS LOOPS
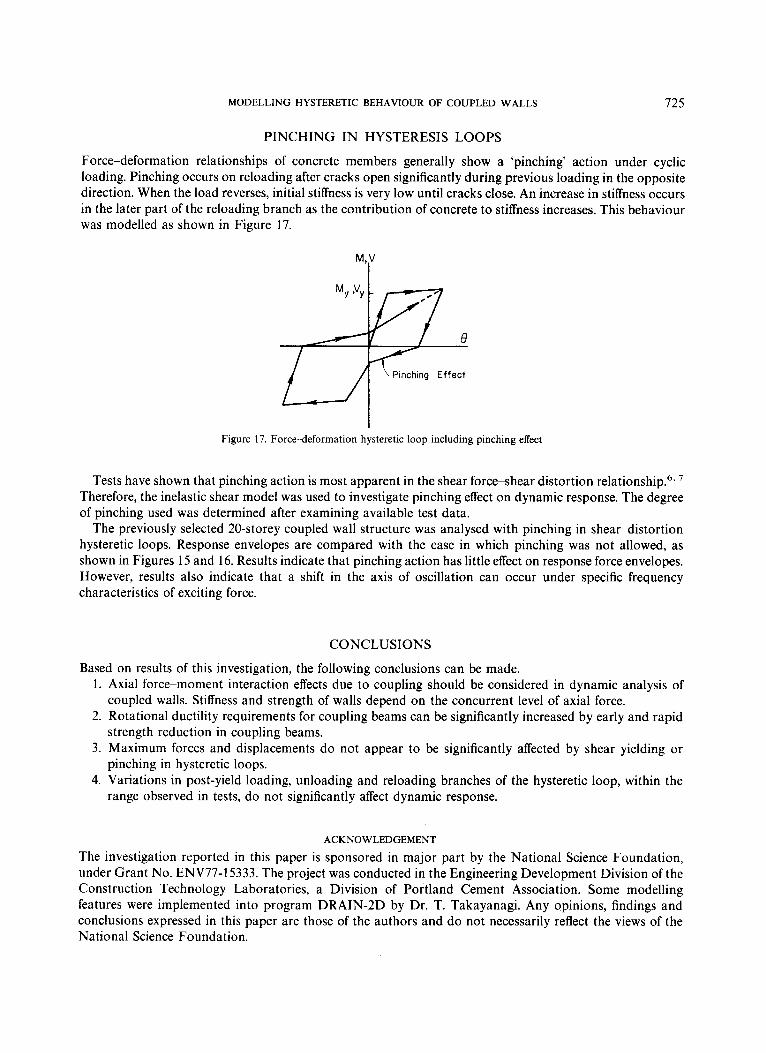
Force-deformation relationships of concrete members generally show a 'pinching' action under cyclic loading. Pinching occurs on reloading after cracks open significantly during previous loading in the opposite direction. When the load reverses, initial stiffness is very low until cracks close. An increase in stiffness occurs in the later part of the reloading branch as the contribution of concrete to stiffness increases. This behaviour was modelled as shown in Figure 17.
Figure 17. Force-deformation hysteretic loop including pinching effect
Tests have shown that pinching action is most apparent in the shear force-shear distortion relationship.6. Therefore, the inelastic shear model was used to investigate pinching effect on dynamic response. The degree of pinching used was determined after examining available test data.
The previously selected 20-storey coupled wall structure was analysed with pinching in shear-distortion hysteretic loops. Response envelopes are compared with the case in which pinching was not allowed, as shown in Figures 15 and 16. Results indicate that pinching action has little effect on response force envelopes. However, results also indicate that a shift in the axis of oscillation can occur under specific frequency characteristics of exciting force.
CONCLUSIONS
Based on results of this investigation, the following conclusions can be made. 1. Axial force-moment interaction effects due to coupling should be considered in dynamic analysis of
2. Rotational ductility requirements for coupling beams can be significantly increased by early and rapid
3. Maximum forces and displacements do not appear to be significantly affected by shear yielding or
4. Variations in post-yield loading, unloading and reloading branches of the hysteretic loop, within the
coupled walls. Stiffness and strength of walls depend on the concurrent level of axial force.
strength reduction in coupling beams.
pinching in hysteretic loops.
range observed in tests, do not significantly affect dynamic response.
ACKNOWLEDGEMENT
The investigation reported in this paper is sponsored in major part by the National Science Foundation, under Grant No. ENV77-15333. The project was conducted in the Engineering Development Division of the Construction Technology Laboratories, a Division of Portland Cement Association. Some modelling features were implemented into program DRAIN-2D by Dr. T. Takayanagi. Any opinions, findings and conclusions expressed in this paper are those of the authors and do not necessarily reflect the views of the National Science Foundation.

726 M. SAATCIOGLU, A. T. DERECHO AND W. G . CORLEY
REFERENCES 1. A. E. Kanaan and G. H. Powell, ‘General purpose computer program for inelastic dynamic response of plane structures’, Report No.
EERC 7 3 4 , Earthquake Engineering Research Center, University of California, Berkeley, CA, Apr. 1973 2. T. Takeda, M. A. Sozen and N. N. Nielsen, ‘Reinforced concrete response to simulated earthquakes’, J . struct. diu. ASCE 96, 2557-
2573 (1970). 3. A. T. Derecho, S. K. Ghosh, M. Iqbal, G. N. Freskakis and M. Fintel, ‘Structural walls in earthquake-resistant buildings, dynamic
analysis of isolated structural walls, parametric studies’, Report to the National Science Foundation, Portland Cement Association, Mar. 1978.
4. M. Saatcioglu and A. T. Derecho, ‘Dynamic inelastic response of coupled walls as affected by axial forces’, Proc. CSCE-ASCE-ACI- CEB int. symp. nonlinear des. concrete struct., S M Study N o . 14, University of Waterloo Press, Waterloo, Ontario, 1980.
5. M. Saatcioglu, A. T. Derecho and W. G. Corley, ‘Coupled walls in earthquake resistant buildings, modelling techniques and dynamic analysis’, Report to the National Science Foundation, Portland Cement Association, June 1980, National Technical Information Service, 5285 Port Royal Road, Springfield, VA (NTIS Accession No. PB81-132698).
6 . R. G. Oesterle, J. D. Aristizabal-Ochoa, A. E. Fiorato, H. G. Russell and W. G. Corley, ‘Earthquake resistant structural walls-tests of isolated walls-phase II’, Report to the National Science Foundation, Portland Cement Association, Oct. 1979 (NTIS Accession
7. R. G. Oesterle, A. E. Fiorato, L. S. Johal, J. E. Carpenter, H. G. Russell and W. G. Corley, ‘Earthquake resistant structural walls- tests of isolated walls’, Report to the National Science Foundation, Portland Cement Association, Nov. 1976 (NTIS Accession No. PB271467/AS).
8. G. B. Barney, K. N. Shiu, B. G. Rabbat and A. E. Fiorato, ‘Earthquake resistant structural walls-tests of coupling beams’, Report to the National Science Foundation, Portland Cement Association, Jan. 1978 (NTIS Accession No. PB281733).
NO. PB80- 13241 8).