
Rodin: an open toolset for modelling and reasoning in Event-B
Upload
independentCategory
view
0download
0
Modelling event-related responses in the brain.
Olivier David, Lee Harrison, Karl Friston
To cite this version:
Olivier David, Lee Harrison, Karl Friston. Modelling event-related responses in the brain..NeuroImage, Elsevier, 2005, 25 (3), pp.756-70. <10.1016/j.neuroimage.2004.12.030>. <inserm-00391142>
HAL Id: inserm-00391142
http://www.hal.inserm.fr/inserm-00391142
Submitted on 24 Jul 2009
HAL is a multi-disciplinary open accessarchive for the deposit and dissemination of sci-entific research documents, whether they are pub-lished or not. The documents may come fromteaching and research institutions in France orabroad, or from public or private research centers.
L’archive ouverte pluridisciplinaire HAL, estdestinee au depot et a la diffusion de documentsscientifiques de niveau recherche, publies ou non,emanant des etablissements d’enseignement et derecherche francais ou etrangers, des laboratoirespublics ou prives.
1
Modelling event-related responses in the brain
OLIVIER DAVID*, LEE HARRISON, KARL J. FRISTON
Wellcome Department of Imaging Neuroscience, Functional Imaging Laboratory, 12 Queen
Square, London WC1N 3BG, UK
* Corresponding author:
Tel: 44 207 833 7480
Fax: 44 207 813 1420
2
Abstract
The aim of this work was to investigate the mechanisms that shape evoked
electroencephalographic (EEG) and magneto-encephalographic (MEG) responses. We used
a neuronally plausible model to characterise the dependency of response components on the
models parameters. This generative model was a neural mass model of hierarchically
arranged areas using three kinds of inter-area connections (forward, backward and lateral).
We investigated how responses, at each level of a cortical hierarchy, depended on the
strength of connections or coupling. Our strategy was to systematically add connections and
examine the responses of each successive architecture. We did this in the context of
deterministic responses and then with stochastic spontaneous activity. Our aim was to show,
in a simple way, how event-related dynamics depend on extrinsic connectivity. To
emphasise the importance of nonlinear interactions we tried to disambiguate the components
of event-related potentials (ERPs) or event-related fields (ERFs) that can be explained by a
linear superposition of trial-specific responses and those engendered nonlinearly (e.g. by
phase-resetting).
Our key conclusions were; (i) when forward connections, mediating bottom-up or extrinsic
inputs, are sufficiently strong, nonlinear mechanisms cause a saturation of excitatory
interneuron responses. This endows the system with an inherent stability that precludes non-
dissipative population dynamics. (ii) The duration of evoked transients increases with the
hierarchical depth or level of processing. (iii) When backward connections are added,
evoked transients become more protracted, exhibiting damped oscillations. These are
formally identical to late or endogenous components seen empirically. This suggests late
components are mediated by reentrant dynamics within cortical hierarchies. (iv) Bilateral
connections produce similar effects to backward connections but can also mediate zero-lag
phase-locking among areas. (v) Finally, with spontaneous activity, ERPs/ERFs can arise
from two distinct mechanisms: For low levels of (stimulus related and ongoing) activity the
systems response conforms to a quasi-linear superposition of separable responses to the fixed
and stochastic inputs. This is consistent with classical assumptions that motivate trial
averaging to suppress spontaneous activity and disclose the ERP/ERF. However, when
activity is sufficiently high, there are nonlinear interactions between the fixed and stochastic
inputs. This interaction is expressed as a phase-resetting and represents a qualitatively
different explanation for the ERP/ERF.
3
1 Introduction
Classical event-related potentials (ERPs) and event-related fields (ERFs) have been used for
decades as putative electrophysiological correlates of perceptual and cognitive operations.
However, the exact neurobiological mechanisms underlying their generation are largely
unknown. Recently there has been a special interest in the distinction between evoked and
induced responses. Evoked responses are disclosed by conventional averaging procedures,
whereas the latter usually call for single trial analyses of induced oscillations. In this paper
we used neuronal simulations to examine the mechanisms that underpin ERPs/ERFs. In a
companion paper we will examine induced responses using time-frequency analyses and
other transforms of single trial data.
Neural-mass models
The complexity of neural networks generating MEG/EEG signals (DeFelipe et al.,
2002;Thomson and Deuchars, 1997) is considerable. This means that MEG/EEG
observation models rely upon simplifying assumptions and empirical priors (David and
Friston, 2003;Freeman, 1978;Valdes et al., 1999;Lopes da Silva et al., 1974;Robinson et al.,
2001;Stam et al., 1999;Van Rotterdam et al., 1982;Wendling et al., 2000). The primary aim
of this paper is to describe a candidate forward model and establish its face validity. This
model was designed to reproduce responses seen empirically and enable mechanistic
enquiries into the generation of evoked and induced responses. This is the focus of the
current paper. However, we will also use this model in a forthcoming paper as an
observation model, allowing its parameters to be inferred from real data (David et al.,
2004b). In this context, face validity is especially important.
Neural-mass models of MEG/EEG usually comprise cortical macro-columns, which can be
treated as surrogates for cortical areas and, sometimes, thalamic nuclei. These models use a
small number of state variables to represent a neuronal population mean state. This approach,
referred to loosely as a mean-field approximation, is efficient when determining the steady-
state behaviour of neuronal systems but its accuracy in a dynamic or non-stationary context is
less established (Haskell et al., 2001). However, we will assume that the mean field
approximation is sufficient for our purposes. The majority of neural mass models of
MEG/EEG have been designed to generate alpha rhythms (Lopes da Silva et al., 1974;Jansen
and Rit, 1995;Stam et al., 1999;Van Rotterdam et al., 1982). Recent studies have shown that
it is possible to reproduce the whole spectrum of MEG/EEG oscillations, using appropriate
values of model parameters (David and Friston, 2003;Robinson et al., 2001). In addition
4
these models have been used to test specific hypotheses about brain function, e.g. focal
attention (Suffczynski et al., 2001). Pathological activity such as epilepsy can also be
emulated. This means, in principle, generative models of the sort employed above could be
used to characterise the pathophysiological mechanisms underlying seizure activity
(Robinson et al., 2002;Wendling et al., 2002).
To date, modelling event-related activity using neural mass models has received much less
attention. An early attempt, in the context of visual ERPs, showed that it was possible to
emulate ERP-like damped oscillations (Jansen and Rit, 1995). A more sophisticated thalamo-
cortical model has been used to simulate event-related synchronisation (ERS) and event-
related desynchronisation (ERD), commonly found in the alpha band (Suffczynski et al.,
2001). Finally, it has been shown that model parameters can be adjusted to fit real ERPs
(Rennie et al., 2002). These studies (Rennie et al., 2002;Suffczynski et al., 2001), emphasise
the role of the thalamo-cortical interactions by modelling the cortex as a single compartment.
Hierarchical models
It is well-known that the cortex has a hierarchical organisation (Crick and Koch,
1998;Felleman and Van Essen, 1991), comprising bottom-up, top-down and lateral processes
that can be understood from an anatomical and cognitive perspective (Engel et al., 2001).
We have previously discussed the importance of hierarchical processes, in relation to
perceptual inference in the brain, using the intimate relationship between hierarchical models
and empirical Bayes (Friston, 2002). The current work was more physiologically motivated.
Using a hierarchical neural mass model, we were primarily interested in the effects, on event-
related MEG/EEG activity, of connections strengths, and how these effects were expressed at
different hierarchical levels. In addition, we were interested in how nonlinearities in these
connections might be expressed in observed responses.
The neuronal model described below embodies many neuroanatomic and physiological
constraints which lend it a neuronal plausibility. It has been designed to (i) explore emergent
behaviours that may help understand empirical phenomena and, critically, (ii) as the basis of
dynamic observation models. Although the model comprises coupled systems, the coupling
is highly asymmetric and heterogeneous. This contrasts with homogenous and symmetrically
coupled map lattices (CML) and globally coupled maps (GCM) encountered in more analytic
treatments. Using the concepts of chaotic dynamical systems, GCMs have motivated a view
of neuronal dynamics that is cast in terms of high-dimensional transitory dynamics among
‘exotic’ attractors (Tsuda, 2001). Much of this work rests on uniform coupling, which
induces a synchronisation manifold, around which the dynamics play. The ensuing chaotic
5
itinerancy has many intriguing aspects that can be related to neuronal systems (Breakspear et
al., 2003;Kaneko and Tsuda, 2003). However, the focus of this work is not chaotic itinerancy
but chaotic transience (the transient dynamics evoked by perturbations to the systems state),
in systems with asymmetric coupling. This focus precludes much of the analytic treatment
available for GCMs (but see (Jirsa and Kelso, 2000) for an analytical description of coherent
pattern formation in a spatially continuous neural system with a heterogeneous connection
topology). However, as we hope to show, simply integrating the model, to simulate
responses, can be a revealing exercise.
Mechanisms of ERP/ERF generation; linear or nonlinear?
It is generally held that an ERP/ERF is the result of averaging a set of discrete stimulus-
evoked brain transients (Coles and Rugg, 1995). However, several groups (Jansen et al.,
2003;Klimesch et al., 2004;Kolev and Yordanova, 1997;Makeig et al., 2002) have suggested
that some ERP/ERF components might be generated by stimulus-induced changes in ongoing
brain dynamics. This is consistent with views emerging from several neuroscientific fields,
suggesting that phase-synchronization, of ongoing rhythms, across different spatio-temporal
scales mediates the functional integration necessary to perform higher cognitive tasks (Penny
et al., 2002;Varela et al., 2001). In brief, a key issue is the distinction between processes that
do and do not rely on phase-resetting of ongoing spontaneous activity. Both can lead to the
expression of ERP/ERF components but their mechanisms are very different.
EEG and MEG signals are effectively ergodic and cancel when averaged over a sufficient
number of randomly chosen epochs. The fact that ERPs/ERFs exhibit systematic waveforms,
when the epochs are stimulus locked, suggests either a reproducible stimulus-dependent
modulation of amplitude or phase-locking of ongoing MEG/EEG activity (Tass, 2003). The
key distinction, between these two explanations, is whether the stimulus-related component
interacts with ongoing or spontaneous activity. If there is no interaction the spontaneous
component will be averaged out, because it has no consistent phase-relationship with
stimulus onset. Conversely if there is an interaction, dominant frequencies of the
spontaneous activity must experience a phase-change, so that they acquire a degree of phase-
locking to the stimulus. Note that phase-resetting is a stronger-requirement than induced
oscillations. It requires any induced dynamics to be phase-locked in peristimulus time. In
short, phase-resetting is explicitly nonlinear and implies an interaction between stimulus-
related response and ongoing activity. Put simply, this means that the event-related response
depends on ongoing activity. This dependency can be assessed with the difference between
responses elicited with and without the stimulus (if we could reproduce exactly the same
6
ongoing activity). In the absence of interactions there will be no difference. Any difference
implies nonlinear interactions. Clearly this cannot be done empirically but it can be pursued
using neuronal simulations.
The secondary aim of the current work was to use realistic neural-mass models of
hierarchically organised cortical areas to see whether phase-resetting is an emergent
phenomenon and a plausible candidate for causing ERPs/ERFs. Phase-resetting is used in
this paper as an interesting example of nonlinear responses that have been observed
empirically. We use it to show that nonlinear mechanisms can be usefully explored with
neuronal models of the sort developed here. In particular, static nonlinearities, in neuronal
mass models, are sufficient to explain phase-resetting. Phase-resetting represents nonlinear
behaviour because, in the absence of amplitude changes, phase-changes can only be mediated
in a nonlinear way. This is why phase-synchronization plays a central role in detecting
nonlinear coupling among sources (Breakspear, 2002;Tass, 2003).
Overview
This paper is structured as follows. In the first section we introduce the hierarchical neural
mass model used in the remaining sections. It is based on previous neuroanatomic studies by
Felleman and van Essen (Felleman and Van Essen, 1991) and work by Jansen and Rit on
modelling MEG/EEG data (Jansen and Rit, 1995). In the second section we demonstrate the
basic behaviour of the model, by successive elaboration of a cortical hierarchy. We start
with forward connections and then add backward and lateral connections. The goal of this
approach was to provide an intuitive understanding of MEG/EEG like dynamics generated by
coupled nonlinear systems. These simulations were performed in the absence of spontaneous
activity. In the third section we examine the interaction between evoked and spontaneous
activity, using a representative hierarchical architecture established in the previous section.
Finally, we discuss the potential benefits of this modelling approach, for the study of
measured MEG/EEG activity.
2 Hierarchical models of event-related MEG/EEG activity
2.1 Cortico-cortical connections
Although neural mass models originated in the early 1970’s (Freeman, 1978;Lopes da Silva
et al., 1974;Wilson and Cowan, 1972), none have addressed explicitly the hierarchical nature
of cortical organisation. The minimal model we propose, which accounts for directed
7
extrinsic connections, uses the rules in Felleman and Van Essen, (1991). Extrinsic
connections are connections that traverse white matter and connect cortical regions (and
subcortical structures). These rules, based upon a tri-partitioning of the cortical sheet (into
supra-, infra-granular layers and granular layer 4), have been derived from experimental
studies of cat visual cortex. We will assume that they can be generalised to the whole cortex.
The ensuing model is general, and can be used to model various cognitive paradigms (David
et al., 2004b). However, variability among different cytoarchitectonic regions is restricted to
differences in physiological parameters, under the same microcircuitry. Under this
simplifying assumption, the connections can be defined as in Figure 1: (i) Bottom-up or
forward connections originate in agranular layers and terminate in layer 4. (ii) Top-down or
backward connections only connect agranular layers. (iii) Lateral connections originate in
agranular layers and target all layers. All these long-range or extrinsic cortico-cortical
connections are excitatory and are mediated through the axons of pyramidal cells.
Figure 1 about here
Although the thalamocortical connections have been the focus of several modelling studies,
they represent a minority of extrinsic connections: in contrast, it is thought that at least 99%
of axons in white matter link cortical areas of the same hemisphere (Abeles, 1991). For this
reason, and for simplicity, we do not include the thalamic nuclei in our model. However,
they can be included for any application where the role of the thalamus (or other subcortical
structure) is thought important.
2.2 Jansen model of a cortical area
The neocortex is commonly described as a 6-layered structure (DeFelipe et al., 2002). Spiny
neurons (pyramidal cells and spiny stellate cells) and smooth neurons are the two major
groups of cortical neurons. The majority of cortical neurons are pyramidal cells that are
found in layers 2 to 6. Most spiny stellate cells are interneurons that are located in the middle
cortical layers. Smooth neurons are essentially GABAergic interneurons distributed in all
layers. In general, cortical neurons are thought to be organized into multiple, small repeating
microcircuits. In spite of cortical heterogeneity, a common basic microcircuit has emerged.
Its skeleton is formed by a pyramidal cell which receives excitatory inputs that originate from
extrinsic afferent systems and spiny cells. Inhibitory inputs originate mostly from
GABAergic interneurons. These micro-anatomical characteristics have been found in all
8
cortical areas and species examined so far and, therefore, they can be considered as
fundamental aspects of cortical organization (DeFelipe et al., 2002).
The Jansen model (Jansen and Rit, 1995) follows the microcircuitry described above to
emulate the MEG/EEG activity of a cortical area. Consequently, it is particularly well suited
to embed in a hierarchical structure. A cortical area is modelled by three subpopulations. A
population of excitatory pyramidal (output) cells receives inputs from inhibitory and
excitatory populations of interneurons, via intrinsic connections (intrinsic connections are
confined to the cortical sheet). Within this model, excitatory interneurons can be regarded as
spiny stellate cells found predominantly in layer 4 and in receipt of forward connections
(Miller, 2003). Excitatory pyramidal cells and inhibitory interneurons will be considered to
occupy agranular layers and receive backward and lateral inputs.
We have described dynamics of these three subpopulations previously. We will review the
model briefly but refer interested reader to (David and Friston, 2003) for more details. The
main difference (c.f. David and Friston, 2003) is that ERPs/ERFs are modelled as small
perturbations around the resting potential. Therefore, all the variables below are zero-mean,
centred on the resting state we assumed to be zero. The evolution of population dynamics
rests on two operators. The first transforms p, the average density of pre-synaptic input
arriving at the population, into v, the average postsynaptic membrane potential. This is
modelled by the linear transformation phv , where denotes convolution and h is the
impulse response or kernel
00
0)exp(
t
ttHt
th
. (1)
The excitatory (e) and inhibitory (i) kernels, he and hi respectively, are parameterised by He,i
and ie, modelling specific properties of inhibition and excitation. The parameters He,i
control the maximum post-synaptic potential and ie, are lumped time-constants of passive
membrane currents and other spatially distributed delays in the dendritic tree. The second
operator transforms the average membrane potential of each subpopulation into an average
firing rate. This is assumed to be instantaneous and is described by the sigmoid function
00
exp1
2e
rv
evS
(2)
9
where e0 and r are parameters that determine its shape (e.g. voltage sensitivity). It is this
function that endows the simulation with nonlinear behaviours that are critical for
phenomena like phase-resetting.
Interactions, among the different subpopulations, depend on the constants i , which
control the strength of intrinsic connections and the total number of synapses expressed by
each subpopulation. The relative values of these constants are fixed, using anatomical
information from the literature, as described in (Jansen and Rit, 1995):
14312 25.0,8.0 . The Jansen model is summarised in Figure 2.
Figure 2 about here
We assume MEG/EEG signals are a linear mixture of the average depolarisation of
pyramidal cells. This mixture depends upon source lead-fields that model the spatial
distribution of the ensuing electromagnetic fields (Baillet et al., 2001). We further assume
the depolarisation of pyramidal cells is proportional to the cortical current source densities,
which are estimated using inverse solutions (Baillet et al., 2001). Therefore, we consider the
indirectly observed ‘output’ of the Jansen model to be the depolarisation of pyramidal cells.
For simplicity, we ignore the effects of instrumental amplifiers and assume that MEG/EEG
cortical current densities can be estimated precisely and refer to them as “MEG/EEG
signals”. Thus, unless otherwise specified, signals are simply the depolarisation of pyramidal
cells.
For given synaptic kernels h and sigmoid functions S, the Jansen model can reproduce a
large variety of MEG/EEG-like waveforms (David and Friston, 2003;Jansen and Rit,
1995;Wendling et al., 2000). Although we have presented the dynamics in terms of a
convolution operator and static nonlinearly, the integration of the model actually proceeds
using the equivalent differential equations. These are provided in the Appendix. Being able
to formulate the model in terms of differential equations is important for extending the neural
mass formulation used here to a true mean field approximation using the Fokker-Plank
formalism (De Groff et al., 1993; Fourcaud and Brunel, 2002). This will be the subject of a
future communication (Harrison et al in preparation).
2.3 Hierarchical extension of the Jansen model
Using the connection rules above, it is straightforward to construct hierarchical cortico-
cortical networks using Jansen models of cortical areas. The different types of connections
10
are shown in Figure 3, in terms of connections among the three subpopulations. To model
event-related responses, the network receives inputs via input connections. These
connections are exactly the same as forward connections delivering fixed or stochastic inputs
u to the spiny stellate cells in layer 4. In the present context they can be regarded as
connections from thalamic or geniculate nuclei. Inputs u can model incoming stimuli and
stochastic background activity. The influence of the ith input is controlled by the parameter
ci.
Figure 3 about here
Connections among areas are mediated by long-range excitatory (glutaminergic) pathways.
As discussed in section 2.1, we consider three types of extrinsic connections (Figure 3):
forward, backward, and lateral. The strength of each type of connection is controlled by a
coupling parameter a: aF for forward, aB for backward and aL for lateral. We model
propagation delays for these connections (see Appendix).
Using these connections, hierarchical cortical models for MEG/EEG can be constructed to
test various hypotheses, and represent examples of dynamic causal models (Friston et al.,
2003). The causal model here is a multiple-input multiple-output system that comprises m
inputs and l outputs with one output per region. The m inputs correspond to designed causes
(e.g., stimulus functions encoding the occurrence of events) or stochastic processes
modelling background activity. In principle, each input could have direct access to every
region. However, in practice the effects of inputs are usually restricted to a single input
region, usually the lowest in the hierarchy. Each of the l regions produces a measured output
that corresponds to the MEG/EEG signal. Each region has five ( 1,, ,, ieieH ) intrinsic
parameters such as the membrane time constants described above. These play a crucial role
in generating regional responses. However, in the present study, we will consider them fixed
and focus on the extrinsic coupling parameters or effective connectivity. These are the
matrices C, AF, AB and AL that contain the coupling parameters c, aF, aB and aL. The values
of these parameters, used in the following simulations, are provided in the Appendix and in
Figure captions.
11
3 Input-output behaviour
In this section we characterise the input-output behaviour of a series of canonical networks in
terms of their impulse response functions. This is effectively the response (mean
depolarisation of pyramidal subpopulations) to a delta-function-input or impulse. The
simulations of this section can be regarded modelling event-related responses to events of
short duration, in the absence of spontaneous activity or stochastic input. In the next section
we will use more realistic inputs that comprise both stimulus-related and stochastic
components.
3.1 The effects of inputs
Inputs u act directly on the spiny stellate neurons of layer 4. Their influence is mediated by
the forward connections parameterised by the matrix C. When these connections are
sufficiently strong, the output of the spiny stellate subpopulation saturates, due to the
nonlinear sigmoid function in (2). This nonlinearly has important consequences for event-
related responses and the ensuing dynamics. In brief, the form of the impulse response
function changes qualitatively with input strength. To illustrate this point, we modelled a
single area, which received an impulse at time zero and calculated the corresponding
response for different values of c (Figure 4). With weak inputs, the response is linear,
leading to a linear relationship between c and peak MEG/EEG responses. However, with
large values of c neuronal activity leaves the linear domain of the sigmoid function in (2), the
spiking saturates and the shape of the evoked response changes.
Figure 4 about here
This behaviour is not surprising and simply reflects the nonlinear relationship between
firing rates and postsynaptic depolarisation modelled by the nonlinearity. This nonlinearity
causes saturation in the responses of units to intrinsic and extrinsic inputs. For example,
when the input is strong enough to saturate spiny stellate spiking, the pyramidal response
exhibits a short plateau (right panel in Figure 4). This saturation persists until the membrane
potential of spiny stellate cells returns to its resting state. The sigmoid function models
phenomenon; (i) at the single unit level, like refractoriness and spike rate adaptation and (ii)
aspects of neuronal ensembles at the population level, like the distribution of thresholds
involved in the generation of action potentials. The ensuing behaviour confers an inherent
12
stability on dynamics because it is recapitulated in the response to all bottom-up influences,
as shown next.
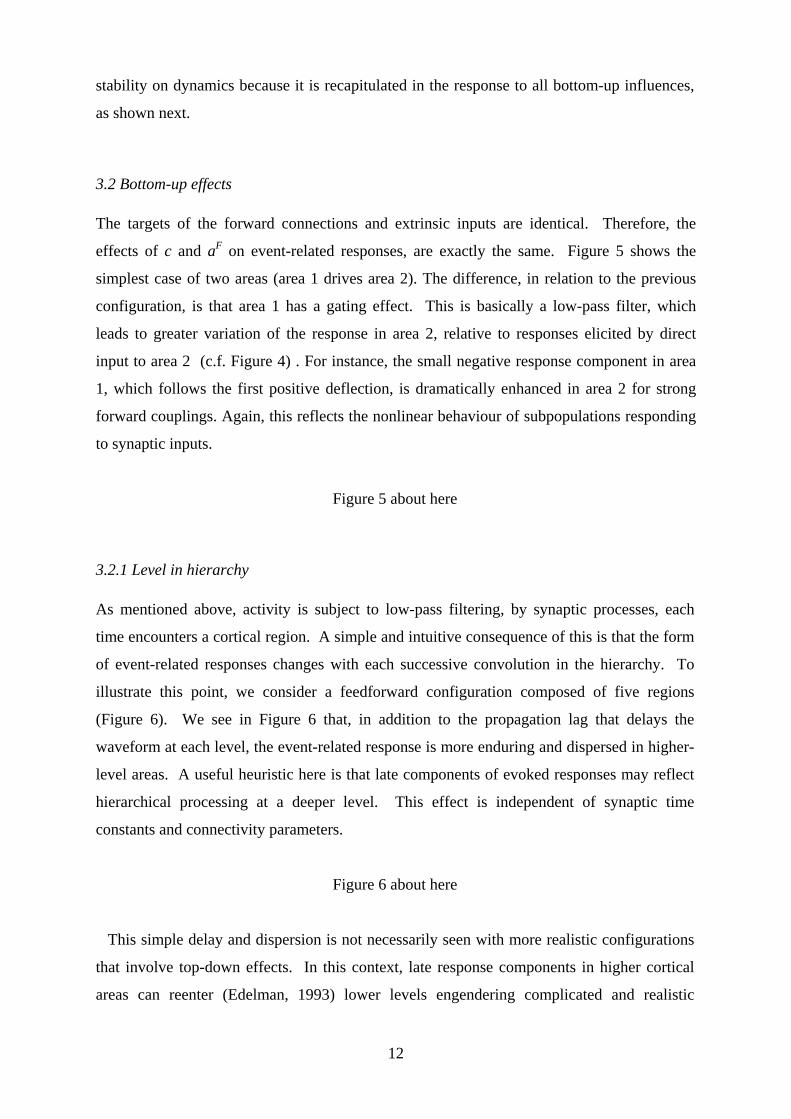
3.2 Bottom-up effects
The targets of the forward connections and extrinsic inputs are identical. Therefore, the
effects of c and aF on event-related responses, are exactly the same. Figure 5 shows the
simplest case of two areas (area 1 drives area 2). The difference, in relation to the previous
configuration, is that area 1 has a gating effect. This is basically a low-pass filter, which
leads to greater variation of the response in area 2, relative to responses elicited by direct
input to area 2 (c.f. Figure 4) . For instance, the small negative response component in area
1, which follows the first positive deflection, is dramatically enhanced in area 2 for strong
forward couplings. Again, this reflects the nonlinear behaviour of subpopulations responding
to synaptic inputs.
Figure 5 about here
3.2.1 Level in hierarchy
As mentioned above, activity is subject to low-pass filtering, by synaptic processes, each
time encounters a cortical region. A simple and intuitive consequence of this is that the form
of event-related responses changes with each successive convolution in the hierarchy. To
illustrate this point, we consider a feedforward configuration composed of five regions
(Figure 6). We see in Figure 6 that, in addition to the propagation lag that delays the
waveform at each level, the event-related response is more enduring and dispersed in higher-
level areas. A useful heuristic here is that late components of evoked responses may reflect
hierarchical processing at a deeper level. This effect is independent of synaptic time
constants and connectivity parameters.
Figure 6 about here
This simple delay and dispersion is not necessarily seen with more realistic configurations
that involve top-down effects. In this context, late response components in higher cortical
areas can reenter (Edelman, 1993) lower levels engendering complicated and realistic
13
impulse response functions. In the reminder of this section we look at the effects of adding
backward and then lateral connections to the forward architecture considered above.
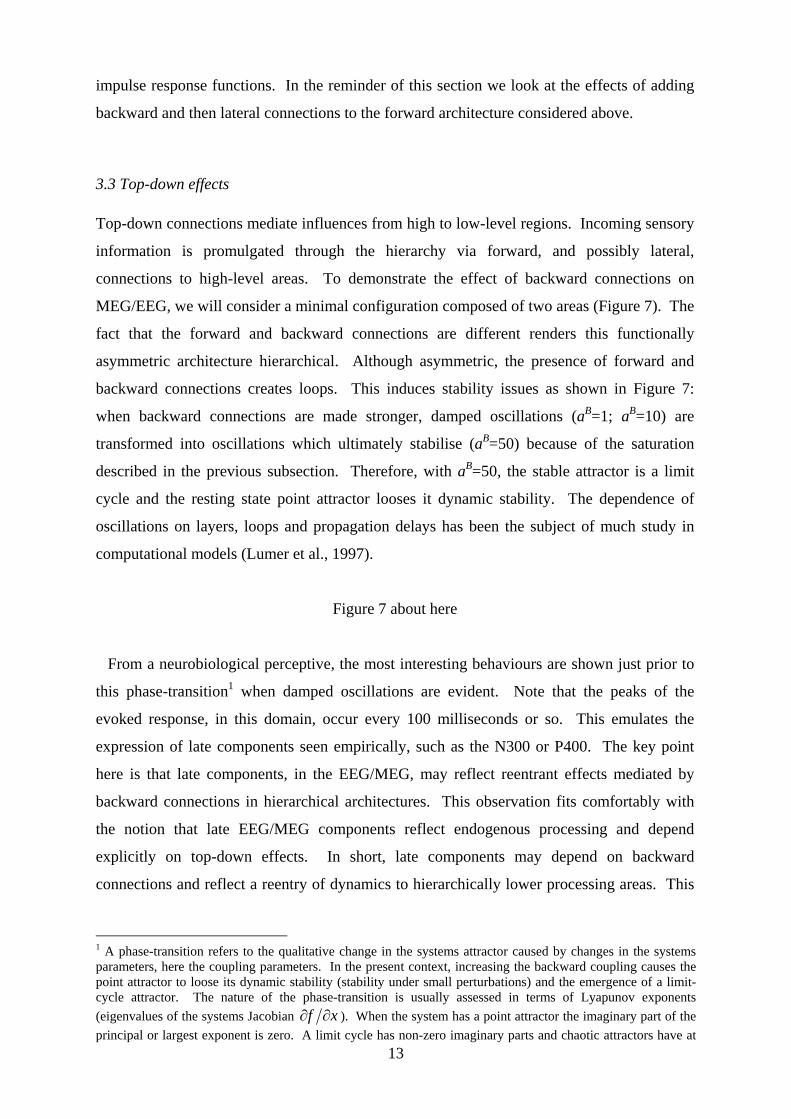
3.3 Top-down effects
Top-down connections mediate influences from high to low-level regions. Incoming sensory
information is promulgated through the hierarchy via forward, and possibly lateral,
connections to high-level areas. To demonstrate the effect of backward connections on
MEG/EEG, we will consider a minimal configuration composed of two areas (Figure 7). The
fact that the forward and backward connections are different renders this functionally
asymmetric architecture hierarchical. Although asymmetric, the presence of forward and
backward connections creates loops. This induces stability issues as shown in Figure 7:
when backward connections are made stronger, damped oscillations (aB=1; aB=10) are
transformed into oscillations which ultimately stabilise (aB=50) because of the saturation
described in the previous subsection. Therefore, with aB=50, the stable attractor is a limit
cycle and the resting state point attractor looses it dynamic stability. The dependence of
oscillations on layers, loops and propagation delays has been the subject of much study in
computational models (Lumer et al., 1997).
Figure 7 about here
From a neurobiological perceptive, the most interesting behaviours are shown just prior to
this phase-transition1 when damped oscillations are evident. Note that the peaks of the
evoked response, in this domain, occur every 100 milliseconds or so. This emulates the
expression of late components seen empirically, such as the N300 or P400. The key point
here is that late components, in the EEG/MEG, may reflect reentrant effects mediated by
backward connections in hierarchical architectures. This observation fits comfortably with
the notion that late EEG/MEG components reflect endogenous processing and depend
explicitly on top-down effects. In short, late components may depend on backward
connections and reflect a reentry of dynamics to hierarchically lower processing areas. This
1 A phase-transition refers to the qualitative change in the systems attractor caused by changes in the systems parameters, here the coupling parameters. In the present context, increasing the backward coupling causes the point attractor to loose its dynamic stability (stability under small perturbations) and the emergence of a limit-cycle attractor. The nature of the phase-transition is usually assessed in terms of Lyapunov exponents
(eigenvalues of the systems Jacobian xf ). When the system has a point attractor the imaginary part of the
principal or largest exponent is zero. A limit cycle has non-zero imaginary parts and chaotic attractors have at
14
dependency can be seen clearly by comparing the two left-hand panels in Figure 7 that show
the emergence of late components on increasing the backward connection from one to ten.
The phase transition from damped late components to oscillations is critical. Before the
transition the system is controllable. This means that the response can be determined
analytically given the input. As discussed in (Friston, 2000a) long impulse responses endow
the brain with a 'memory' of past inputs that enables perceptual processing of temporally
extended events. In (Friston, 2000b) this was demonstrated using a Volterra kernel
formulation and the simulation of spatiotemporal receptive fields in the visual system.
However, after the transition it is no longer possible to determine when the input occurred
given the output. This violates the principle of maximum information transfer (Linsker,
1990) and precludes this sort of response in the brain. In short, it is likely that reentrant
dynamics prolong neuronal transients but will stop short of incurring a phase-transition to
oscillations. If this phase transition occurs it is likely to be short-lived or pathological (e.g.
photosensitive seizure activity).
It should be noted that the oscillations in the right hand panels of Figure 7 do not represent
a mechanism for induced oscillations. The oscillations here are deterministic component of
the systems impulse response function and are time-locked to the stimulus. Induced
oscillations, by definition, are not time-locked to the stimulus and probably arise from a
stimulus-related change in the system's control parameters (i.e. short-term changes in
connectivity). We will return to this point later.
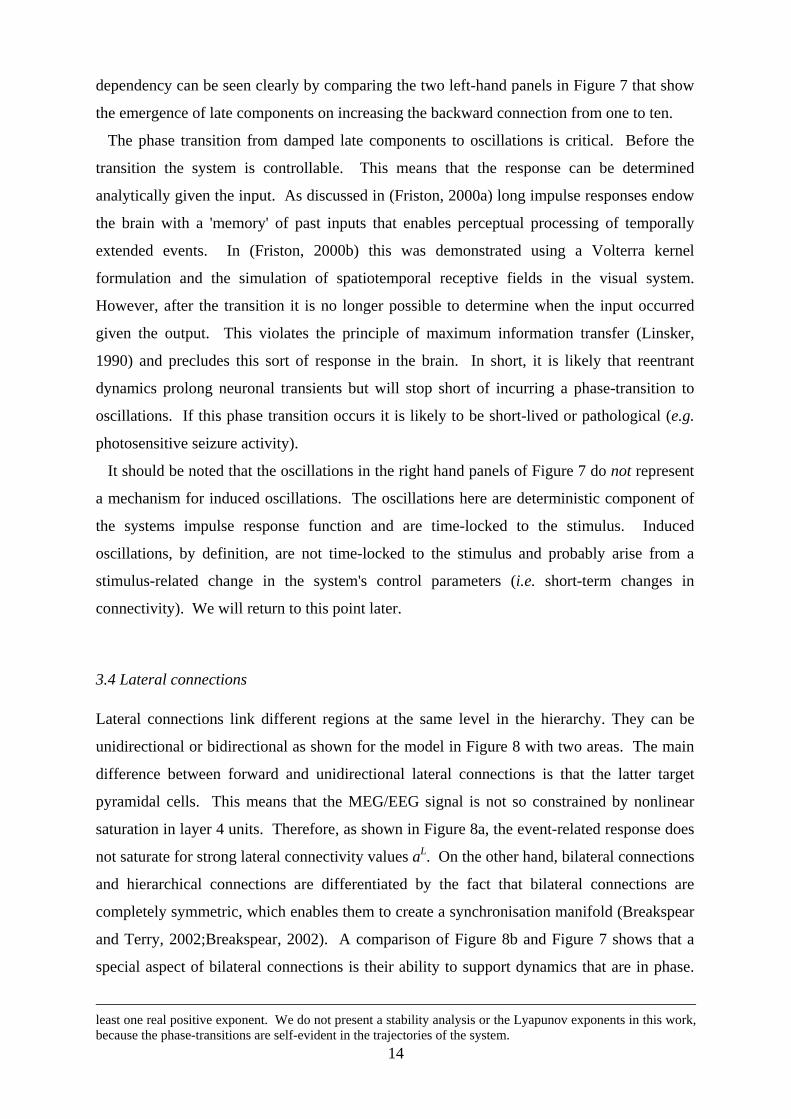
3.4 Lateral connections
Lateral connections link different regions at the same level in the hierarchy. They can be
unidirectional or bidirectional as shown for the model in Figure 8 with two areas. The main
difference between forward and unidirectional lateral connections is that the latter target
pyramidal cells. This means that the MEG/EEG signal is not so constrained by nonlinear
saturation in layer 4 units. Therefore, as shown in Figure 8a, the event-related response does
not saturate for strong lateral connectivity values aL. On the other hand, bilateral connections
and hierarchical connections are differentiated by the fact that bilateral connections are
completely symmetric, which enables them to create a synchronisation manifold (Breakspear
and Terry, 2002;Breakspear, 2002). A comparison of Figure 8b and Figure 7 shows that a
special aspect of bilateral connections is their ability to support dynamics that are in phase.
least one real positive exponent. We do not present a stability analysis or the Lyapunov exponents in this work, because the phase-transitions are self-evident in the trajectories of the system.
15
This sort of zero-lag phase-synchronisation is commonplace in the brain. Its mediation by
lateral connections in this model concurs with previous modelling studies of zero-lag
coupling in triplets of cortical areas that involve at least one set of bilateral or reciprocal
connections (Chawla et al., 2001). For very large values of aL, architectures with bilateral
connections are highly nonlinear and eventually undergo a second phase transition (see
Figure 8b).
Figure 8 about here
In this section we have provided a deterministic characterisation of simple hierarchical
models in terms of their impulse responses. We have tried to show that the model exhibits a
degree of face validity in relation to real evoked responses and have related certain
mechanistic aspects to previous modelling work to provide some construct validity. We now
turn to the secondary biological focus of this paper; namely the plausibility of nonlinear
mechanisms that might explain ERP/ERF components.
4 Ongoing and event-related activity
So far, we have considered noise-free systems. Event-related responses were modelled in
terms of deterministic impulse responses that were unique to a given neuronal configuration.
In this context it is not necessary to evoke the notion of averaging. However, real MEG/EEG
signals show a great variability from trial to trial (Arieli et al., 1996). In this section we
model this variability by adding a stochastic component (a zero-mean Gaussian process) to
the input u. The output corresponding to a stochastic input is referred to ongoing activity, i.e.
oscillations in the MEG/EEG signal that share no phase relationship with the stimulus. This
does not mean that ongoing activity should be considered as noise, just that there is no
obvious stimulus-related structure.
4.1 Ongoing activity
Ongoing activity is shaped by the same nonlinear convolution experienced by deterministic
inputs. In the context of stationary inputs, the outputs can be characterised in terms of their
16
spectral properties, which are determined by the generalised transfer functions of the Volterra
kernels associated with any controllable analytic system. The impulse response function is
the first-order kernel. As soon as the connectivity parameters of a hierarchical network
change, the principal modes of this network, defined by the principal frequencies of
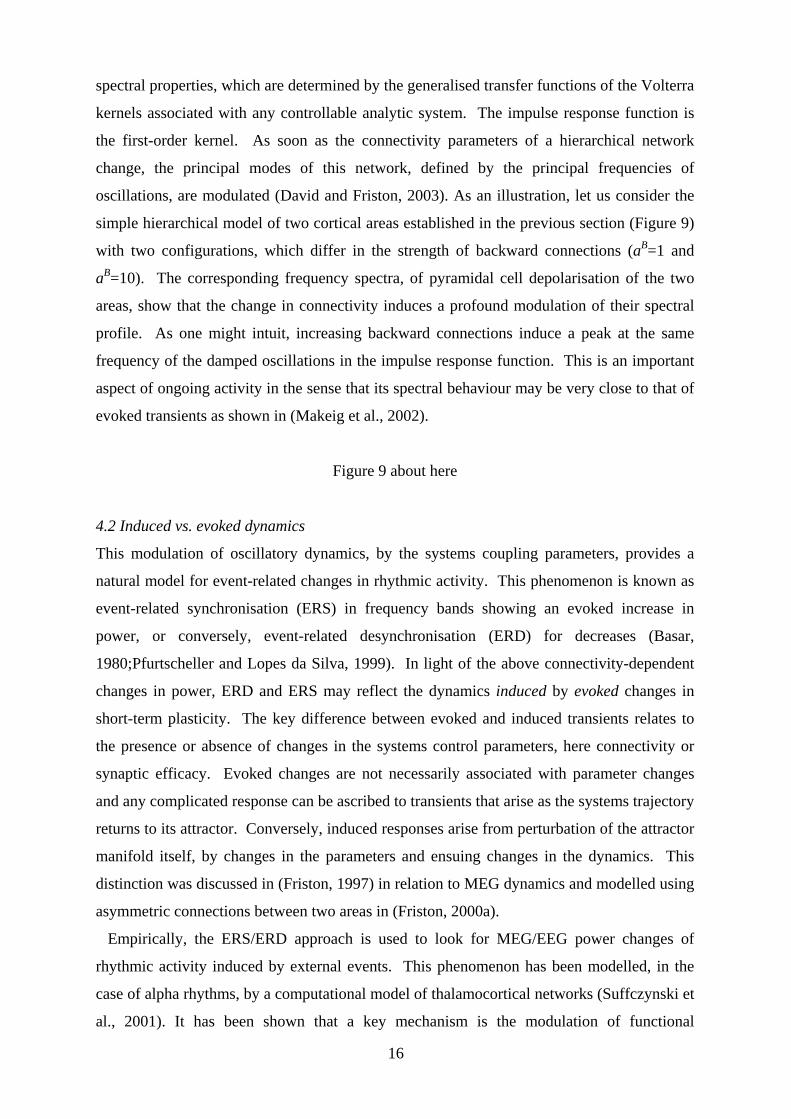
oscillations, are modulated (David and Friston, 2003). As an illustration, let us consider the
simple hierarchical model of two cortical areas established in the previous section (Figure 9)
with two configurations, which differ in the strength of backward connections (aB=1 and
aB=10). The corresponding frequency spectra, of pyramidal cell depolarisation of the two
areas, show that the change in connectivity induces a profound modulation of their spectral
profile. As one might intuit, increasing backward connections induce a peak at the same
frequency of the damped oscillations in the impulse response function. This is an important
aspect of ongoing activity in the sense that its spectral behaviour may be very close to that of
evoked transients as shown in (Makeig et al., 2002).
Figure 9 about here
4.2 Induced vs. evoked dynamics
This modulation of oscillatory dynamics, by the systems coupling parameters, provides a
natural model for event-related changes in rhythmic activity. This phenomenon is known as
event-related synchronisation (ERS) in frequency bands showing an evoked increase in
power, or conversely, event-related desynchronisation (ERD) for decreases (Basar,
1980;Pfurtscheller and Lopes da Silva, 1999). In light of the above connectivity-dependent
changes in power, ERD and ERS may reflect the dynamics induced by evoked changes in
short-term plasticity. The key difference between evoked and induced transients relates to
the presence or absence of changes in the systems control parameters, here connectivity or
synaptic efficacy. Evoked changes are not necessarily associated with parameter changes
and any complicated response can be ascribed to transients that arise as the systems trajectory
returns to its attractor. Conversely, induced responses arise from perturbation of the attractor
manifold itself, by changes in the parameters and ensuing changes in the dynamics. This
distinction was discussed in (Friston, 1997) in relation to MEG dynamics and modelled using
asymmetric connections between two areas in (Friston, 2000a).
Empirically, the ERS/ERD approach is used to look for MEG/EEG power changes of
rhythmic activity induced by external events. This phenomenon has been modelled, in the
case of alpha rhythms, by a computational model of thalamocortical networks (Suffczynski et
al., 2001). It has been shown that a key mechanism is the modulation of functional
17
interaction between populations of thalamocortical cells and the reticular nucleus. This and
related issues will be addressed in a subsequent paper on induced responses. Here we focus
on evoked changes.
The present analysis concludes by examining the sensitivity of evoked transients to state
changes caused by ongoing activity, when the parameters are held constant. In particular we
see if this sensitivity can be expressed as phase-resetting. The key issue here is the presence
of nonlinear interactions between the current state of the system and its perturbation by a
stimulus.
4.3 Phase-resetting and nonlinear interactions.
In the following, we investigate the effect of ongoing activity, on stimulus-dependent
responses, to reconcile apparently contradictory conclusions from studies of event-related
potentials. On one hand, classical studies have shown that event-related potentials are
associated with amplitude changes in the MEG/EEG signal that represent a linear summation
of an impulse response and ongoing activity (Arieli et al., 1996;Shah et al., 2004). In this
scheme, the variability at the single-trial level is due to, and only to, ongoing activity, which
is removed after averaging to estimate the impulse response. On the other hand, it has been
hypothesised that event-related waveforms, obtained after averaging, could be due to a
phase-resetting of ongoing activity with no necessary change in the amplitude (i.e. power) of
any stimulus locked transient (Jansen et al., 2003;Makeig et al., 2002). Although
mathematically well defined, the neural mechanisms that could instantiate phase-resetting of
ongoing activity are unknown.
We will take phase-resetting to imply a nonlinear interaction between ongoing activity and
stimulus-related input that results in phase-locking to stimulus onset. Although phase-
locking can be produced by evoking oscillatory transients (i.e. amplitude modulation) this
mechanism involves no change or resetting of the ongoing dynamics. To assess the
contribution of phase-resetting in our simulations we therefore need to look for interactions
between ongoing and stimulus-related inputs that produced phase-locking in the outputs. As
mentioned in the introduction this was addressed, in a simple way, by subtracting the
response to ongoing activity alone from the response to a mixture of ongoing activity and
stimulus input. In the absence of interactions this difference (the evoked response) should be
the same. On the other hand, if interactions are prevalent, the difference should change with
each realisation of ongoing activity. We performed these analyses with different levels of
input and assessed the degree of phase-locking in the outputs with the phase-locking value
(PLV) (Lachaux et al., 1999;Tallon-Baudry et al., 1996): trials
tjtPLV ))(exp()( where
18
the instantaneous phase )(t was obtained from the Hilbert transform (Le Van Quyen et al.,
2001).
4.3.1 Testing for interactions
To evaluate the effect of background activity on single-trial event-related responses, we used
the two area hierarchical model above, with aB=1 (Figure 9). The first area was driven by an
impulse function (stimulus) and Gaussian random noise (background activity) of standard
deviation =0.05. The output of this region can be considered a mixture of evoked response
and ongoing activity. We considered two conditions: one with low levels of mixed input
(c=102) and another with high levels (c=2.104). These values were chosen to emphasise the
systems nonlinear properties; with the smaller value of c, neuronal responses remain largely
to the linear regime of the nonlinear function. The larger value of c was chosen so that
excursions of the states encroached on the nonlinear regime, to produce neuronal saturation
in some trials. In both cases, the stimulus was a delta-function. The simulated responses, for
100 trials, are shown in Figure 10.
When input levels are low (left hand side of Figure 10), event-related activity at the single-
trial level shows a relatively reproducible waveform after stimulus onset (Figure 10B). This
transient is reflected in the ERP/ERF after averaging (Figure 10C). To confirm the
experimental results of (Arieli et al., 1996), we decomposed each event-related response into
two components. First, the stochastic component (the response to ongoing activity alone -
Figure 10D) and second, an extra component elicited by adding the stimulus (Figure 10E).
This is the difference between the response elicited by stochastic component alone (Figure
10D) and the response to the mixed input (Figure 10B). If the system was linear, these
differences should not exhibit any variability over trials, and thus define the “reproducible
response” (Arieli et al., 1996). Effectively, the stimulus-dependent component shows no
variability and we can conclude that the response components due to stimulus and ongoing
activity are linearly separable. In other words, there are no interactions that could mediate
phase-resetting. Despite this, there is ample evidence for phase-locking. This is shown in
Figure 10F, using the PLV index.
However, the situation is very different when we repeat the simulations with high input
levels (right hand side of Figure 10). In this context, the event-related responses do not show
any obvious increase in amplitude after the stimulus (Figure 10B). However, the averaged
event-related activity (Figure 10C) is very similar to that above (left hand side of Figure
10C). The fact that one obtains an ERP by averaging in this way suggests that the stimulus
19
input induced phase-resetting of the ongoing oscillations. This is confirmed by the large
variation in stimulus-dependent components from trial to trial. This variation reflects
nonlinear interactions between the stimulus and ongoing activity (Figure 10E). These
interactions are associated with phase-locking as shown in Figure 10F.
Figure 10 about here
In summary, the fact that the difference in evoked responses with and without background
noise (panel E, Figure 10) shows so much variability, suggests that background activity
interacts with the stimulus: When ongoing activity is high, stellate cells outputs saturate and
the stimulus-related response is attenuated. Conversely, when ongoing activity is low the
evoked-response is expressed fully. This dependency on ongoing activity is revealed by
variation in the evoked responses with high input levels. In conclusion, the apparently
contradictory results presented in (Arieli et al., 1996;Jansen et al., 2003;Makeig et al.,
2002;Shah et al., 2004) can be reproduced in most part and reconciled within the same
framework. With high activity levels, the ongoing and stimulus-dependent components
interact, through nonlinearities in the population dynamics, to produce phase-resetting and a
classical ERP on averaging. When activity is lower, the stimulus and endogenous dynamics
do not interact and the ERP simply reflects the transient evoked by stimuli that is linearly
separable from ongoing dynamics.
5 Discussion
We have shown that it is possible to construct hierarchical models for MEG/EEG signals. To
that end, we have assumed an architecture for cortical regions and their connections. In
particular, we have used the Jansen model (Jansen and Rit, 1995) for each source, and a
simplified version of the connection rules of Felleman and Van Essen, (1991) to couple these
sources. Here, we have fixed the parameters intrinsic to each source (synaptic time
constants, output function, and intrinsic connections) and have focused on manipulating
extrinsic connections among areas. We have used this model to address some issues in the
genesis of evoked responses as observed with MEG/EEG.
Inferring neural mass models and their parameters, on the basis of the EEG and MEG
alone, is a dynamical inverse problem that does not have a unique solution. The model we
have described is one possible model among many others. We have used this model to afford
20
a balance between simple neuronal models that are unrealistic but sufficient to emulate
dynamics seen empirically, and more complicated models that have an explicit relation to
electrophysiology but are difficult to manipulate. In future work we will compute the relative
likelihood of, or evidence for, different models (with Bayesian model selection) using real
MEG/EEG data (David et al., 2004b). At this stage we focus on establishing the face validity
of a representative model by showing it can reproduce a range of biological behaviours.
Deterministic simulations
In section 3, we ignored the stochastic component of MEG/EEG signals. This allowed us to
study various configurations in terms of their deterministic input-output behaviour. Each
type of extrinsic connection (forward, backward and lateral) had specific effects on event-
related dynamics. The key conclusions from these analyses were; (i) When forward
connections, mediating bottom-up or extrinsic inputs, are sufficiently strong, nonlinear
mechanisms cause a saturation of neuronal responses. This endows the system with an
inherent stability that precludes non-dissipative dynamics. (ii) The duration of evoked
transients increases with the hierarchical depth or level of processing. (iii) When backward
or bilateral connections are added, evoked transients become more protracted, exhibiting
damped oscillations. These are formally identical to late or endogenous components.
These simulations suggest that late components are mediated by reentrant dynamics within
cortical hierarchies. Increasing the strength of extrinsic backward or bilateral connections
causes the number of late components to increase until a phase transition into a quasi-
oscillatory regime, whose dynamic stability is assured by the nonlinear saturation above. We
discussed, briefly, the importance of this phase transition in relation to information theoretic
constraints on neuronal computations. In short, it is likely that selective pressure will extend
the duration of transients so that the mutual information between current activity and past
perceptual brain states is maximised (see Friston, 2000a for a fuller discussion). However,
phase-transitions to oscillation are not adaptive because the system is no longer controllable
and the informational link with the past is lost. A simple mechanism for increasing the
memory of neuronal systems is to re-enter past states from hierarchical levels via backward
connections. This is precisely what we simulated. In summary, late components may
represent dynamic “echoes” that allow current sensory information to interact with perpetual
constructs from higher areas, based on previous sensory input. We have discussed one form
of this hierarchical reentry, using an empirical Bayesian perspective on predictive coding
(Friston, 2002).
21
Stochastic simulations
In the second section, we introduced stochastic components to the inputs, to study event-
related responses in the context of background activity. This work was motivated by
apparently contradictory views of ERP/ERF generation. Some authors (Arieli et al.,
1996;Shah et al., 2004) have argued that ERPs/ERFs can be considered as the impulse
response function of a linear system, despite the huge variability at the single-trial level. In
contrast, it has been proposed (Duzel et al., 2003;Jansen et al., 2003;Klimesch et al.,
2004;Makeig et al., 2002) that ERPs/ERFs could be due to a phase-resetting process that
does not require the notion of a linear impulse response. This induces some hypothetical
neural mechanism that can implement a phase-resetting of ongoing activity. These two
views are supported by analyses of real MEG/EEG data. We showed that our model
reproduces data that support both views. In our framework, the key factor is the level of
activity. When activity is low, the model operates in a quasi-linear regime and reproduces
the linear behaviours reported in (Arieli et al., 1996). Conversely, when activity is high,
single-trial responses do not show any amplitude modulation and yet still produce an ERP on
averaging. This is consistent with the observations of Jansen et al., (2003) and Makeig et al.,
(2002).
Our analyses suggest that phase-resetting involves a nonlinear interaction between
stimulus-related responses and ongoing activity. This observation is very reminiscent of a
similar finding, pertaining to fast-oscillatory dynamics induced in simulated populations.
These simulations (Chawla et al., 2000) showed that functional connectivity or dynamic
integration between two populations increases with mean background activity and with
stimulus-related rate modulation. Furthermore, as the background activity increases, the
populations become increasingly sensitive to the intensity of the stimulus in terms of a
predisposition to transient phase-locking. This reflected an interaction between background
activity and stimulus-intensity in producing dynamic correlations. The mechanism of these
interactions was modelled at the level of membrane time constants and temporal integration
over milliseconds, using single-compartment units and the Hodgkin-Huxley formalism. Our
simulations were at a much less detailed level, employing mean field-like approximations.
Furthermore, they addressed evoked transients as opposed to induced fast dynamics.
However, they both speak to the central role of nonlinear interactions between ongoing
activity and stimuli in causing phase-locking. In our case, of evoked responses, this phase-
locking was to stimulus onset and the mechanism can be attributed directly to the only
nonlinearity in our model: namely the sigmoid response function transforming depolarisation
to firing rate. This nonlinearly renders ongoing activity sensitive to stimulus perturbations
22
(this is the definition of an interaction). This sensitivity is due to the saturating nature of the
sigmoid function. When ongoing activity is high the system states are close to the nonlinear
regime of the sigmoid function and perturbations due to the stimulus cause neuronal
saturation. This saturation causes the ongoing activity to “forget” its history and experience
a resetting of its phase.
Phase resetting vs. Phase-locking
In this paper we have made a clear distinction between phase-locking and phase-resetting.
Phase-locking, as measured by the PLV implies a statistical dependency among phases, over
ERPs (i.e. knowing the phase from one ERP allows one to predict the phase of another).
Phase-locking can be mediated in a number of ways. As shown in Figure 10F, there is no
real difference between the phase-locking measures obtained from linear and nonlinear
single-trial responses. Conversely, phase-resetting refers to a change in the phase, within
ERPs. This can be mediated by linear or nonlinear mechanisms (i.e. a second or high-order
interaction between ongoing dynamics and the stimulus). The key debate here is not about
phase-resetting itself, but whether it is caused by nonlinear mechanisms (i.e. without changes
in amplitude). We therefore focused on the distinction between linear or nonlinear, rather
than phase-resetting per se. In a future paper we will look at phase-resetting, explicitly, using
background activity that is periodic and of known phase (see below).
In this paper, phase-resetting is taken to imply a nonlinear interaction between ongoing
dynamics and a stimulus that induces a phase-locking over trials. This generalizes the notion
of alpha phase-resetting that is usually characterised empirically. Our simulations and
analysis were not limited to a single frequency. The ongoing activity we used was broad-
spectrum and the phase-locking measure was not frequency-specific. In empirical studies it
is not possible to analyse the interaction between stimulus and ongoing activity, because no
single trial can be replicated in the absence of the stimulus. This means that empirical studies
have to use epochs that show oscillations at a particular frequency to demonstrate phase-
resetting. In a future communication we will apply this phase-resetting analysis (c.f. (Makeig
et al., 2002)) to stimulations in which our stochastic ongoing activity is replaced with a
deterministic sinusoidal forcing term, in the alpha range. This will allow us to partition
phase-locking into components that are mediated by linear superposition and phase-resetting
respectively.
Evoked vs. induced oscillations
23
We have also noted that event-related activity is not restricted to ERPs/ERFs. It
encompasses event-related changes in oscillations (power and synchronisation). We have
suggested that this phenomenon can be explained by changes of connectivity due to short-
term neuronal plasticity (see (Friston, 2000a) for a related discussion on nonlinear
connections). We will be pursuing this in a subsequent paper on induced responses. The
same changes in connectivity are also responsible for the modulation of long-range
synchrony (or any type of interdependence measure) between distant MEG/EEG oscillators
(David and Friston, 2003;David et al., 2004a).
Modelling and estimation
Generally, it was striking how different connections engendered such diverse event-related
waveforms. This raises the issue of how models, of the sort described here, can be applied to
real data. The long-term agenda of our modelling programme is to establish the validity of
neuronal network models so that they can be used as forward models to explain real data.
The key advantage of this approach is that the parameters of the model, which are estimated,
have a direct physiological interpretation. Several studies have shown that it is possible to
estimate the parameters of observation models using real MEG/EEG data, in the case of both
rhythmic activity (Valdes et al., 1999) and ERPs (Rennie et al., 2002). An important issue, in
this context, is the ability to constrain, or regularise, the inverse problem that dynamic
forward models like this pose. These issues can be addressed using Bayesian inference and
dynamic causal modelling (Friston et al., 2003). A great advantage of using neuronally
plausible forward models is that constraints on the solution can be applied, in an informed
way, using priors on the model parameters. At present, our team has published Bayesian
inference procedures for dynamic causal modelling of functional MRI (Friston et al.,
2003;Penny et al., 2004). In forthcoming reports, we will extend this approach to a variety of
models, including the neural mass model for MEG/EEG described here. A preliminary report
has already been published in which we estimate the parameters of this neural mass model
but without localising the sources (David et al., 2004b). In our next communication we will
combine neural mass models and forward MEG/EEG modelling to study cognitive functions,
and in particular to infer changes in connectivity among experimental conditions.
6 Conclusion
We have shown that neural mass models (David and Friston, 2003;Jansen and Rit,
1995;Lopes da Silva et al., 1997;Nunez, 1974;Rennie et al., 2002;Robinson et al., 2001;Stam
24
et al., 1999;Suffczynski et al., 2001;Valdes et al., 1999;Wendling et al., 2002) can reproduce
a large variety of MEG/EEG signal characteristics. The potential advantage they afford, in
comparison to standard data analysis, is their ability to pinpoint specific neuronal
mechanisms underlying normal or pathological activity. Effort is needed to incorporate them,
more systematically, in MEG/EEG analyses to enable enquiry into mechanistic questions
about macroscopic neuronal processes. In forthcoming studies, we will describe the
estimation of such models in a Bayesian framework (Friston et al., 2002) and will apply the
present model to the analysis of real ERPs.
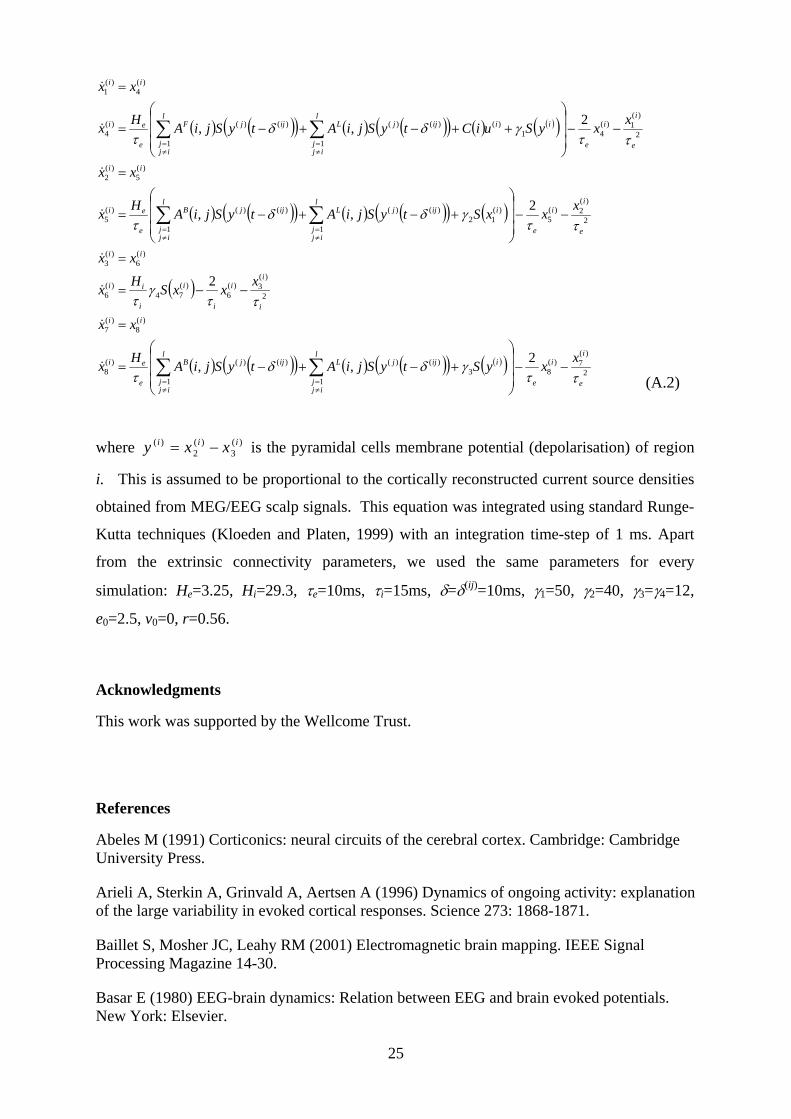
Appendix
In this appendix, we provide differential equations for the ith of l cortical areas of the
hierarchical Jansen model as described in section 2.3. The activity of the ith cortical area is
described by eight state variables x(i), the rate of change of which is described by an equation
of the following form:
CAAAtyStutxftx LBFijjiii ,,,,,, )()()()()( with ji. (A.1)
u(i) is the extrinsic input to region i not modeled by other areas. S(y(j)) is the firing rate of
pyramidal cells of region j. AF, AB, AL are l x l connectivity matrices for forward, backward
and lateral connections, respectively. C is the connectivity vector for extrinsic inputs. (ij) is
the propagation delay between region i and region j. Equations (1) and (2) in the main text
describe neuronal input and output operators that correspond to the following state equation
which is the specific version of A.1 for our model:
25
2
)(7)(
831
)()(
1
)()()(8
)(8
)(7
2
)(3)(
6)(
74)(
6
)(6
)(3
2
)(2)(
5)(
121
)()(
1
)()()(5
)(5
)(2
2
)(1)(
411
)()()(
1
)()()(4
)(4
)(1
2,,
2
2,,
2,,
e
ii
e
il
ijj
ijjLl
ijj
ijjB
e
ei
ii
i
ii
i
i
i
ii
ii
e
ii
e
il
ijj
ijjLl
ijj
ijjB
e
ei
ii
e
ii
e
il
ijj
iijjLl
ijj
ijjF
e
ei
ii
xxyStySjiAtySjiA
Hx
xx
xxxS
Hx
xx
xxxStySjiAtySjiA
Hx
xx
xxySuiCtySjiAtySjiA
Hx
xx
(A.2)
where )(3
)(2
)( iii xxy is the pyramidal cells membrane potential (depolarisation) of region
i. This is assumed to be proportional to the cortically reconstructed current source densities
obtained from MEG/EEG scalp signals. This equation was integrated using standard Runge-
Kutta techniques (Kloeden and Platen, 1999) with an integration time-step of 1 ms. Apart
from the extrinsic connectivity parameters, we used the same parameters for every
simulation: He=3.25, Hi=29.3, e=10ms, i=15ms, =(ij)=10ms, 1=50, 2=40, 3=4=12,
e0=2.5, v0=0, r=0.56.
Acknowledgments
This work was supported by the Wellcome Trust.
References
Abeles M (1991) Corticonics: neural circuits of the cerebral cortex. Cambridge: Cambridge University Press.
Arieli A, Sterkin A, Grinvald A, Aertsen A (1996) Dynamics of ongoing activity: explanation of the large variability in evoked cortical responses. Science 273: 1868-1871.
Baillet S, Mosher JC, Leahy RM (2001) Electromagnetic brain mapping. IEEE Signal Processing Magazine 14-30.
Basar E (1980) EEG-brain dynamics: Relation between EEG and brain evoked potentials. New York: Elsevier.
26
Breakspear M (2002) Nonlinear phase desynchronization in human electroencephalographic data. Hum Brain Mapp 15: 175-198.
Breakspear M, Terry JR (2002) Nonlinear interdependence in neural systems: motivation, theory, and relevance. Int J Neurosci 112: 1263-1284.
Breakspear M, Terry JR, Friston KJ (2003) Modulation of excitatory synaptic coupling facilitates synchronization and complex dynamics in a biophysical model of neuronal dynamics. Network 14: 703-732.
Chawla D, Friston KJ, Lumer ED (2001) Zero-lag synchronous dynamics in triplets of interconnected cortical areas. Neural Netw 14: 727-735.
Chawla D, Lumer ED, Friston KJ (2000) Relating macroscopic measures of brain activity to fast, dynamic neuronal interactions. Neural Comput 12: 2805-2821.
Coles MGH, Rugg MD (1995) Event-related brain potentials: An introduction. In: Electrophysiology of mind (Rugg MD, Coles MGH, eds), pp 1-26. Oxford: Oxford University Press.
Crick F, Koch C (1998) Constraints on cortical and thalamic projections: the no-strong-loops hypothesis. Nature 391: 245-250.
David O, Cosmelli D, Friston KJ (2004a) Evaluation of different measures of functional connectivity using a neural mass model. Neuroimage 21: 659-673.
David O, Friston KJ (2003) A neural mass model for MEG/EEG: coupling and neuronal dynamics. Neuroimage 20: 1743-1755.
David, O., Harrison, L., Kilner, J., Penny, W., and Friston, K. J. Studying effective connectivity with a neural mass model of evoked MEG/EEG responses. Halgren, E., Ahlfors, S., Hamalainen, M., and Cohen, D. 135-138. 2004b. Boston. Proceedings of the 14th international conference on biomagnetism BIOMAG 2004. Ref Type: Conference Proceeding
De Groff D, Neelakanta PS, Sudhakar R, Aalo V (1993) Stochastical aspects of neuronal dynamics: Fokker-Planck approach. Biol Cybern 69: 155-164.
DeFelipe J, Alonso-Nanclares L, Arellano JI (2002) Microstructure of the neocortex: comparative aspects. J Neurocytol 31: 299-316.
Duzel E, Habib R, Schott B, Schoenfeld A, Lobaugh N, McIntosh AR, Scholz M, Heinze HJ (2003) A multivariate, spatiotemporal analysis of electromagnetic time-frequency data of recognition memory. Neuroimage 18: 185-197.
Edelman GM (1993) Neural Darwinism: selection and reentrant signaling in higher brain function. Neuron 10: 115-125.
Engel AK, Fries P, Singer W (2001) Dynamic predictions: oscillations and synchrony in top-down processing. Nat Rev Neurosci 2: 704-716.
Felleman DJ, Van Essen DC (1991) Distributed hierarchical processing in the primate cerebral cortex. Cereb Cortex 1: 1-47.
27
Fourcaud N, Brunel N (2002) Dynamics of the firing probability of noisy integrate-and-fire neurons. Neural Comput 14: 2057-2110.
Freeman WJ (1978) Models of the dynamics of neural populations. Electroencephalogr Clin Neurophysiol [Suppl] 34: 9-18.
Friston K (2002) Functional integration and inference in the brain. Prog Neurobiol 68: 113-143.
Friston KJ (1997) Another neural code? Neuroimage 5: 213-220.
Friston KJ (2000a) The labile brain. I. Neuronal transients and nonlinear coupling. Philos Trans R Soc Lond B Biol Sci 355: 215-236.
Friston KJ (2000b) The labile brain. III. Transients and spatio-temporal receptive fields. Philos Trans R Soc Lond B Biol Sci 355: 253-265.
Friston KJ, Harrison L, Penny W (2003) Dynamic causal modelling. Neuroimage 19: 1273-1302.
Friston KJ, Penny W, Phillips C, Kiebel S, Hinton G, Ashburner J (2002) Classical and Bayesian inference in neuroimaging: theory. Neuroimage 16: 465-483.
Haskell E, Nykamp DQ, Tranchina D (2001) Population density methods for large-scale modelling of neuronal networks with realistic synaptic kinetics: cutting the dimension down to size. Network 12: 141-174.
Jansen BH, Agarwal G, Hegde A, Boutros NN (2003) Phase synchronization of the ongoing EEG and auditory EP generation. Clin Neurophysiol 114: 79-85.
Jansen BH, Rit VG (1995) Electroencephalogram and visual evoked potential generation in a mathematical model of coupled cortical columns. Biol Cybern 73: 357-366.
Jirsa VK, Kelso JA (2000) Spatiotemporal pattern formation in neural systems with heterogeneous connection topologies. Phys Rev E Stat Phys Plasmas Fluids Relat Interdiscip Topics 62: 8462-8465.
Kaneko K, Tsuda I (2003) Chaotic itinerancy. Chaos 13: 926-936.
Klimesch W, Schack B, Schabus M, Doppelmayr M, Gruber W, Sauseng P (2004) Phase-locked alpha and theta oscillations generate the P1-N1 complex and are related to memory performance. Brain Res Cogn Brain Res 19: 302-316.
Kloeden PE, Platen E (1999) Numerical solution of stochastic differential equations. Berlin: Springer-Verlag.
Kolev V, Yordanova J (1997) Analysis of phase-locking is informative for studying event-related EEG activity. Biol Cybern 76: 229-235.
Lachaux J-P, Rodriguez E, Martinerie J, Varela FJ (1999) Measuring phase synchrony in brain signals. Hum Brain Mapp 8: 194-208.
28
Le Van Quyen M, Foucher J, Lachaux J, Rodriguez E, Lutz A, Martinerie J, Varela FJ (2001) Comparison of Hilbert transform and wavelet methods for the analysis of neuronal synchrony. J Neurosci Methods 111: 83-98.
Linsker R (1990) Perceptual neural organization: some approaches based on network models and information theory. Annu Rev Neurosci 13: 257-281.
Lopes da Silva FH, Hoeks A, Smits H, Zetterberg LH (1974) Model of brain rhythmic activity. The alpha-rhythm of the thalamus. Kybernetik 15: 27-37.
Lopes da Silva FH, Pijn JP, Velis D, Nijssen PC (1997) Alpha rhythms: noise, dynamics and models. Int J Psychophysiol 26: 237-249.
Lumer ED, Edelman GM, Tononi G (1997) Neural dynamics in a model of the thalamocortical system. I. Layers, loops and the emergence of fast synchronous rhythms. Cereb Cortex 7: 207-227.
Makeig S, Westerfield M, Jung TP, Enghoff S, Townsend J, Courchesne E, Sejnowski TJ (2002) Dynamic brain sources of visual evoked responses. Science 295: 690-694.
Miller KD (2003) Understanding layer 4 of the cortical circuit: a model based on cat V1. Cereb Cortex 13: 73-82.
Nunez PL (1974) The brain wave equation: A model for the EEG. Math Biosci 21: 279-297.
Penny W, Stephan K, Mechelli A, Friston K (2004) Comparing dynamic causal models. Neuroimage.
Penny WD, Kiebel SJ, Kilner JM, Rugg MD (2002) Event-related brain dynamics. Trends Neurosci 25: 387-389.
Pfurtscheller G, Lopes da Silva FH (1999) Event-related EEG/MEG synchronization and desynchronization: basic principles. Clin Neurophysiol 110: 1842-1857.
Rennie CJ, Robinson PA, Wright JJ (2002) Unified neurophysical model of EEG spectra and evoked potentials. Biol Cybern 86: 457-471.
Robinson PA, Rennie CJ, Rowe DL (2002) Dynamics of large-scale brain activity in normal arousal states and epileptic seizures. Phys Rev E Stat Nonlin Soft Matter Phys 65: 041924.
Robinson PA, Rennie CJ, Wright JJ, Bahramali H, Gordon E, Rowe DL (2001) Prediction of electroencephalographic spectra from neurophysiology. Phys Rev E 63: 021903.
Shah AS, Bressler SL, Knuth KH, Ding M, Mehta AD, Ulbert I, Schroeder CE (2004) Neural dynamics and the fundamental mechanisms of event-related brain potentials. Cereb Cortex 14: 476-483.
Stam CJ, Pijn JP, Suffczynski P, Lopes da Silva FH (1999) Dynamics of the human alpha rhythm: evidence for non-linearity? Clin Neurophysiol 110: 1801-1813.
Suffczynski P, Kalitzin S, Pfurtscheller G, Lopes da Silva FH (2001) Computational model of thalamo-cortical networks: dynamical control of alpha rhythms in relation to focal attention. Int J Psychophysiol 43: 25-40.
29
Tallon-Baudry C, Bertrand O, Delpuech C, Pernier J (1996) Stimulus specificity of phase-locked and non-phase-locked 40 Hz visual responses in human. J Neurosci 16: 4240-4249.
Tass PA (2003) Stochastic phase resetting of stimulus-locked responses of two coupled oscillators: transient response clustering, synchronization, and desynchronization. Chaos 13: 364-376.
Thomson AM, Deuchars J (1997) Synaptic interactions in neocortical local circuits: dual intracellular recordings in vitro. Cereb Cortex 7: 510-522.
Tsuda I (2001) Toward an interpretation of dynamic neural activity in terms of chaotic dynamical systems. Behav Brain Sci 24: 793-810.
Valdes PA, Jimenez JC, Riera J, Biscay R, Ozaki T (1999) Nonlinear EEG analysis based on a neural mass model. Biol Cybern 81: 415-424.
Van Rotterdam A, Lopes da Silva FH, van den EJ, Viergever MA, Hermans AJ (1982) A model of the spatial-temporal characteristics of the alpha rhythm. Bull Math Biol 44: 283-305.
Varela F, Lachaux J-P, Rodriguez E, Martinerie J (2001) The brainweb: phase synchronization and large-scale integration. Nat Rev Neurosci 2: 229-239.
Wendling F, Bartolomei F, Bellanger JJ, Chauvel P (2002) Epileptic fast activity can be explained by a model of impaired GABAergic dendritic inhibition. Eur J Neurosci 15: 1499-1508.
Wendling F, Bellanger JJ, Bartolomei F, Chauvel P (2000) Relevance of nonlinear lumped-parameter models in the analysis of depth- EEG epileptic signals. Biol Cybern 83: 367-378.
Wilson HR, Cowan JD (1972) Excitatory and inhibitory interactions in localized populations of model neurons. Biophys J 12: 1-24.
30
Figure Captions
Figure 1: Connection rules adopted for the construction of hierarchical models for
MEG/EEG signals. These rules are a simplified version of those proposed by (Felleman and
Van Essen, 1991). The cortical sheet is divided into two components: the granular layer
(layer 4) and the agranular layers (supra- and infra-granular layers). Bottom-up connections
originate in agranular layers and terminate in layer 4. Top-down connections only engage
agranular layers. Lateral connections originate in agranular layers and target all layers.
Figure 2: Jansen’s model of a cortical area. Three neuronal subpopulations are considered to
model a cortical area. Pyramidal cells interact with both excitatory and inhibitory
interneurons with the connectivity constants 14312 25.0,8.0 . The parameters He,i
and ie, control the expression of post-synaptic potentials as shown in equation (1). We
assume the average depolarisation of pyramidal cells y is proportional to reconstructed
cortical current densities obtained with source reconstruction algorithms using MEG/EEG
scalp data. For simplicity, we use the same term “MEG/EEG signal” for estimated cortical
and measured scalp MEG/EEG data.
Figure 3: Hierarchical connections among Jansen units (Figure 2) based on simplified
Felleman and van Essen rules (Figure 1). Long range connectivity is mediated by pyramidal
cells axons. Their targets depend upon the type of connections. Coupling or connectivity
parameters control the strength of each type of connection: aF for forward, aB for backward,
and aL for lateral.
Figure 4: The strength of input modulates the shape of MEG/EEG signal. The output of one
area (variable y, see Appendix) has been calculated for different values of c, the strength of
forward connections mediating input u (delta function). When c is small (c=1, c=1000), the
output is not saturated and the MEG/EEG signal (y) amplitude is linearly related to c. For
large values of c (c=106, c=109), spiny stellate cells saturate and the shape of event-related
MEG/EEG response changes substantially.
Figure 5: The MEG/EEG signal of area 1 (black) and area 2 (grey) is plotted as a function of
the forward connectivity aF. Bottom-up connectivity has the same effect as input connectivity
31
c: high values cause a saturation of spiny stellate cells (input cells), with a dramatic effect on
MEG/EEG event-related responses. Nonlinear effects are particularly strong for the largest
value of aF (right panel) as the small negative component of area 1 (seen best in the left
panel) induces a huge negative response in area 2.
Figure 6: A feedforward system composed of five areas. The MEG/EEG signal (y) of each
area elicited by a single pulse on area 1 is plotted in successive panels from left to right.
Event-related activity lasts longer in high-level cortical areas of feedforward architectures.
At each level in the hierarchy, the event-related response of pyramidal cells experiences
successive low-pass filters, embodied by synaptic processes that transform the input signals
to output.
Figure 7: Backward connections have a key influence on the stability of MEG/EEG event-
related activity as demonstrated by this simple model composed of two areas (area coded in
black and area 2 coded in grey). The forward connectivity aF has been fixed to 40 and
backward connectivity aB varies between 1 and 50 from left to right. When top-down effects
are small, their reentry leads to longer lasting event-related responses characterised by
damped oscillations (aB=1; aB=10). However, over a critical threshold of aB (which depends
upon aF), the system undergoes a phase transition, loses its point attractor and expresses
oscillatory dynamics (aB=25; aB=50).
Figure 8: The effects of lateral connections are shown with a simple model composed of two
areas (black: area 1, grey: area 2). The depolarisation of pyramidal cells (y) is plotted for
several values of lateral connectivity aL. a) Unilateral connections support transients that
differ from those elicited by forward connections (Figure 4). In particular, the saturation of
layer 4 is not so important and the signal exhibits less saturation for large aL. b) Increasing
bi-directional lateral connections has a similar effect to increasing backward connections.
The main difference is the relative phase of evoked oscillations, which are synchronised at
zero-lag. For very large values of aL, the model is highly nonlinear and eventually exits the
oscillatory domain of parameter space.
Figure 9: The modulation of backward connectivity (aB=1 or aB=10) has huge effect on the
power spectrum of ongoing MEG/EEG dynamics (variable y is plotted in black for area 1 and
in grey for area 2). When aB increases from 1 to 10, there is loss of power below 3 Hz, and an
excess between 3 and 7 Hz. The amplitude spectra in the right panel were obtained by
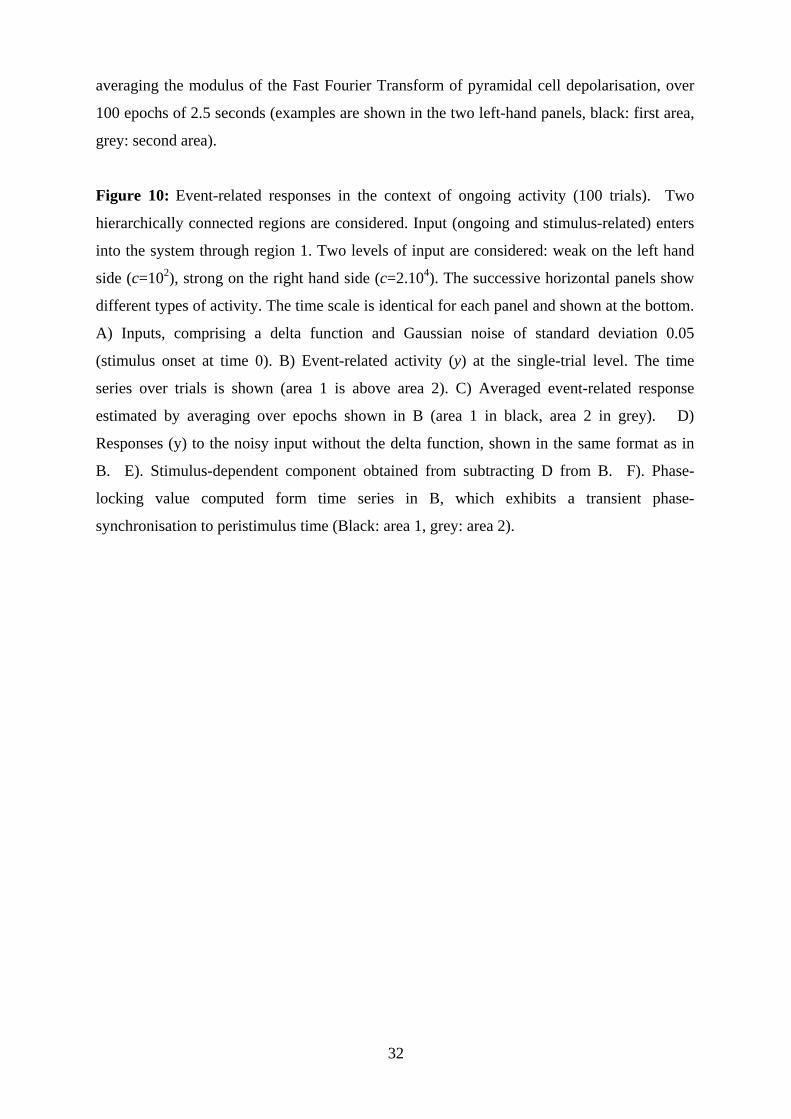
32
averaging the modulus of the Fast Fourier Transform of pyramidal cell depolarisation, over
100 epochs of 2.5 seconds (examples are shown in the two left-hand panels, black: first area,
grey: second area).
Figure 10: Event-related responses in the context of ongoing activity (100 trials). Two
hierarchically connected regions are considered. Input (ongoing and stimulus-related) enters
into the system through region 1. Two levels of input are considered: weak on the left hand
side (c=102), strong on the right hand side (c=2.104). The successive horizontal panels show
different types of activity. The time scale is identical for each panel and shown at the bottom.
A) Inputs, comprising a delta function and Gaussian noise of standard deviation 0.05
(stimulus onset at time 0). B) Event-related activity (y) at the single-trial level. The time
series over trials is shown (area 1 is above area 2). C) Averaged event-related response
estimated by averaging over epochs shown in B (area 1 in black, area 2 in grey). D)
Responses (y) to the noisy input without the delta function, shown in the same format as in
B. E). Stimulus-dependent component obtained from subtracting D from B. F). Phase-
locking value computed form time series in B, which exhibits a transient phase-
synchronisation to peristimulus time (Black: area 1, grey: area 2).
Copyright © 2022 FDOKUMEN