Modeling of the migration of glycerol monoester plasticizers in highly plasticized poly(vinyl...
12
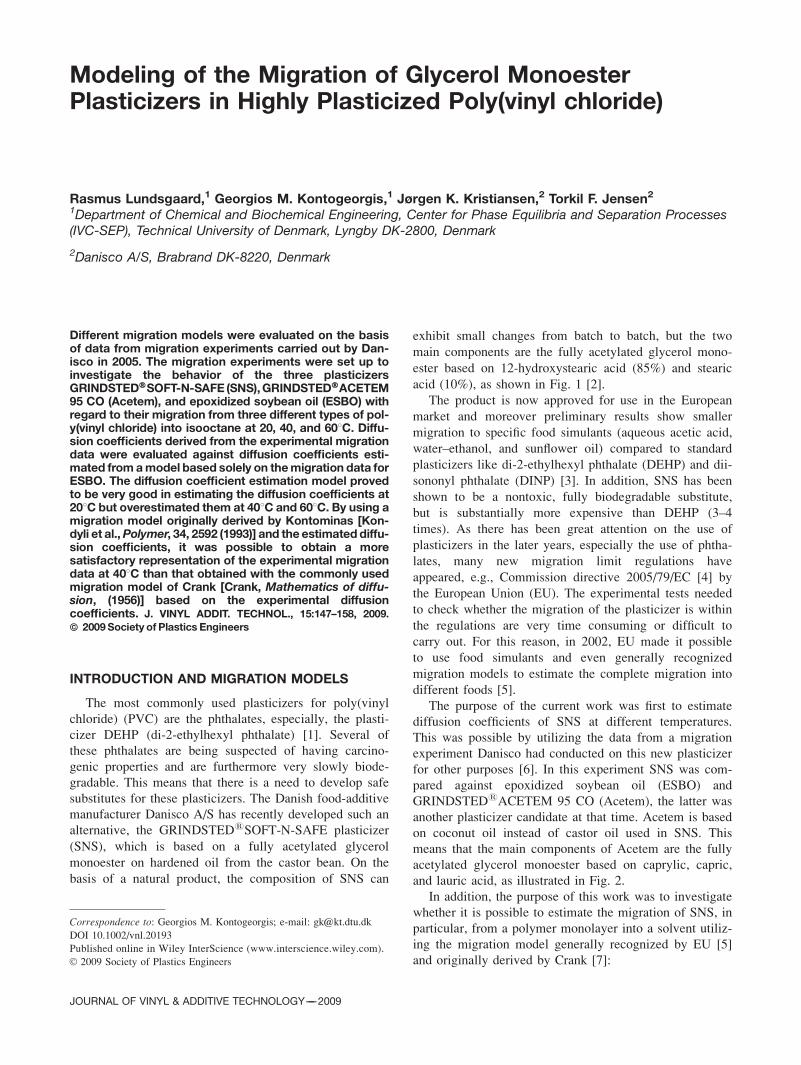
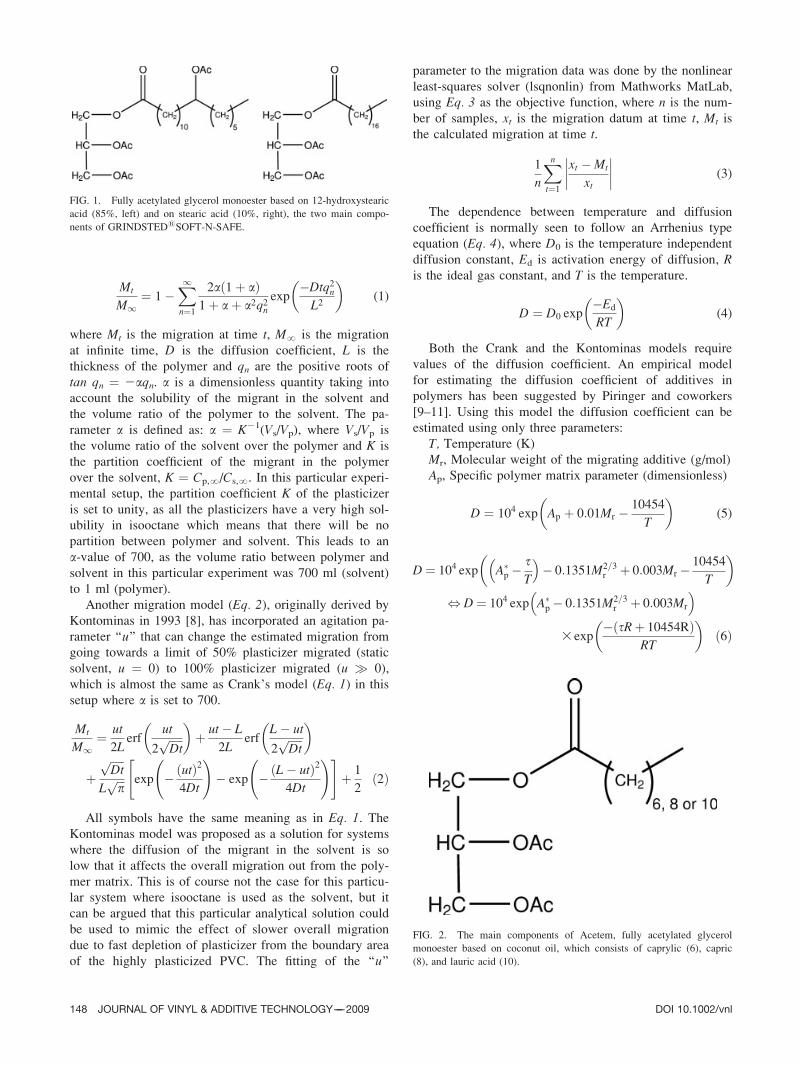
Modeling of the Migration of Glycerol Monoester Plasticizers in Highly Plasticized Poly(vinyl chloride) Rasmus Lundsgaard, 1 Georgios M. Kontogeorgis, 1 Jørgen K. Kristiansen, 2 Torkil F. Jensen 2 1 Department of Chemical and Biochemical Engineering, Center for Phase Equilibria and Separation Processes (IVC-SEP), Technical University of Denmark, Lyngby DK-2800, Denmark 2 Danisco A/S, Brabrand DK-8220, Denmark Different migration models were evaluated on the basis of data from migration experiments carried out by Dan- isco in 2005. The migration experiments were set up to investigate the behavior of the three plasticizers GRINDSTED Ò SOFT-N-SAFE (SNS), GRINDSTED Ò ACETEM 95 CO (Acetem), and epoxidized soybean oil (ESBO) with regard to their migration from three different types of pol- y(vinyl chloride) into isooctane at 20, 40, and 608C. Diffu- sion coefficients derived from the experimental migration data were evaluated against diffusion coefficients esti- mated from a model based solely on the migration data for ESBO. The diffusion coefficient estimation model proved to be very good in estimating the diffusion coefficients at 208C but overestimated them at 408C and 608C. By using a migration model originally derived by Kontominas [Kon- dyli et al., Polymer , 34, 2592 (1993)] and the estimated diffu- sion coefficients, it was possible to obtain a more satisfactory representation of the experimental migration data at 408C than that obtained with the commonly used migration model of Crank [Crank, Mathematics of diffu- sion, (1956)] based on the experimental diffusion coefficients. J. VINYL ADDIT. TECHNOL., 15:147–158, 2009. ª 2009 Society of Plastics Engineers INTRODUCTION AND MIGRATION MODELS The most commonly used plasticizers for poly(vinyl chloride) (PVC) are the phthalates, especially, the plasti- cizer DEHP (di-2-ethylhexyl phthalate) [1]. Several of these phthalates are being suspected of having carcino- genic properties and are furthermore very slowly biode- gradable. This means that there is a need to develop safe substitutes for these plasticizers. The Danish food-additive manufacturer Danisco A/S has recently developed such an alternative, the GRINDSTED 1 SOFT-N-SAFE plasticizer (SNS), which is based on a fully acetylated glycerol monoester on hardened oil from the castor bean. On the basis of a natural product, the composition of SNS can exhibit small changes from batch to batch, but the two main components are the fully acetylated glycerol mono- ester based on 12-hydroxystearic acid (85%) and stearic acid (10%), as shown in Fig. 1 [2]. The product is now approved for use in the European market and moreover preliminary results show smaller migration to specific food simulants (aqueous acetic acid, water–ethanol, and sunflower oil) compared to standard plasticizers like di-2-ethylhexyl phthalate (DEHP) and dii- sononyl phthalate (DINP) [3]. In addition, SNS has been shown to be a nontoxic, fully biodegradable substitute, but is substantially more expensive than DEHP (3–4 times). As there has been great attention on the use of plasticizers in the later years, especially the use of phtha- lates, many new migration limit regulations have appeared, e.g., Commission directive 2005/79/EC [4] by the European Union (EU). The experimental tests needed to check whether the migration of the plasticizer is within the regulations are very time consuming or difficult to carry out. For this reason, in 2002, EU made it possible to use food simulants and even generally recognized migration models to estimate the complete migration into different foods [5]. The purpose of the current work was first to estimate diffusion coefficients of SNS at different temperatures. This was possible by utilizing the data from a migration experiment Danisco had conducted on this new plasticizer for other purposes [6]. In this experiment SNS was com- pared against epoxidized soybean oil (ESBO) and GRINDSTED 1 ACETEM 95 CO (Acetem), the latter was another plasticizer candidate at that time. Acetem is based on coconut oil instead of castor oil used in SNS. This means that the main components of Acetem are the fully acetylated glycerol monoester based on caprylic, capric, and lauric acid, as illustrated in Fig. 2. In addition, the purpose of this work was to investigate whether it is possible to estimate the migration of SNS, in particular, from a polymer monolayer into a solvent utiliz- ing the migration model generally recognized by EU [5] and originally derived by Crank [7]: Correspondence to: Georgios M. Kontogeorgis; e-mail: [email protected] DOI 10.1002/vnl.20193 Published online in Wiley InterScience (www.interscience.wiley.com). Ó 2009 Society of Plastics Engineers JOURNAL OF VINYL & ADDITIVE TECHNOLOGY——2009
Transcript of Modeling of the migration of glycerol monoester plasticizers in highly plasticized poly(vinyl...
Modeling of the Migration of Glycerol MonoesterPlasticizers in Highly Plasticized Poly(vinyl chloride)
Rasmus Lundsgaard,1 Georgios M. Kontogeorgis,1 Jørgen K. Kristiansen,2 Torkil F. Jensen2
1Department of Chemical and Biochemical Engineering, Center for Phase Equilibria and Separation Processes(IVC-SEP), Technical University of Denmark, Lyngby DK-2800, Denmark
2Danisco A/S, Brabrand DK-8220, Denmark
Different migration models were evaluated on the basisof data from migration experiments carried out by Dan-isco in 2005. The migration experiments were set up toinvestigate the behavior of the three plasticizersGRINDSTED�SOFT-N-SAFE (SNS),GRINDSTED�ACETEM95 CO (Acetem), and epoxidized soybean oil (ESBO) withregard to their migration from three different types of pol-y(vinyl chloride) into isooctane at 20, 40, and 608C. Diffu-sion coefficients derived from the experimental migrationdata were evaluated against diffusion coefficients esti-mated from amodel based solely on themigration data forESBO. The diffusion coefficient estimation model provedto be very good in estimating the diffusion coefficients at208C but overestimated them at 408C and 608C. By using amigration model originally derived by Kontominas [Kon-dyli et al.,Polymer, 34, 2592 (1993)] and the estimateddiffu-sion coefficients, it was possible to obtain a moresatisfactory representation of the experimental migrationdata at 408C than that obtained with the commonly usedmigration model of Crank [Crank, Mathematics of diffu-sion, (1956)] based on the experimental diffusioncoefficients. J. VINYL ADDIT. TECHNOL., 15:147–158, 2009.ª 2009Society of Plastics Engineers
INTRODUCTION AND MIGRATION MODELS
The most commonly used plasticizers for poly(vinyl
chloride) (PVC) are the phthalates, especially, the plasti-
cizer DEHP (di-2-ethylhexyl phthalate) [1]. Several of
these phthalates are being suspected of having carcino-
genic properties and are furthermore very slowly biode-
gradable. This means that there is a need to develop safe
substitutes for these plasticizers. The Danish food-additive
manufacturer Danisco A/S has recently developed such an
alternative, the GRINDSTED1SOFT-N-SAFE plasticizer
(SNS), which is based on a fully acetylated glycerol
monoester on hardened oil from the castor bean. On the
basis of a natural product, the composition of SNS can
exhibit small changes from batch to batch, but the two
main components are the fully acetylated glycerol mono-
ester based on 12-hydroxystearic acid (85%) and stearic
acid (10%), as shown in Fig. 1 [2].
The product is now approved for use in the European
market and moreover preliminary results show smaller
migration to specific food simulants (aqueous acetic acid,
water–ethanol, and sunflower oil) compared to standard
plasticizers like di-2-ethylhexyl phthalate (DEHP) and dii-
sononyl phthalate (DINP) [3]. In addition, SNS has been
shown to be a nontoxic, fully biodegradable substitute,
but is substantially more expensive than DEHP (3–4
times). As there has been great attention on the use of
plasticizers in the later years, especially the use of phtha-
lates, many new migration limit regulations have
appeared, e.g., Commission directive 2005/79/EC [4] by
the European Union (EU). The experimental tests needed
to check whether the migration of the plasticizer is within
the regulations are very time consuming or difficult to
carry out. For this reason, in 2002, EU made it possible
to use food simulants and even generally recognized
migration models to estimate the complete migration into
different foods [5].
The purpose of the current work was first to estimate
diffusion coefficients of SNS at different temperatures.
This was possible by utilizing the data from a migration
experiment Danisco had conducted on this new plasticizer
for other purposes [6]. In this experiment SNS was com-
pared against epoxidized soybean oil (ESBO) and
GRINDSTED1ACETEM 95 CO (Acetem), the latter was
another plasticizer candidate at that time. Acetem is based
on coconut oil instead of castor oil used in SNS. This
means that the main components of Acetem are the fully
acetylated glycerol monoester based on caprylic, capric,
and lauric acid, as illustrated in Fig. 2.
In addition, the purpose of this work was to investigate
whether it is possible to estimate the migration of SNS, in
particular, from a polymer monolayer into a solvent utiliz-
ing the migration model generally recognized by EU [5]
and originally derived by Crank [7]:
Correspondence to: Georgios M. Kontogeorgis; e-mail: [email protected]
DOI 10.1002/vnl.20193
Published online in Wiley InterScience (www.interscience.wiley.com).
� 2009 Society of Plastics Engineers
JOURNAL OF VINYL & ADDITIVE TECHNOLOGY——2009
Mt
M1¼ 1�
X1n¼1
2að1þ aÞ1þ aþ a2q2n
exp�Dtq2nL2
� �(1)
where Mt is the migration at time t, M? is the migration
at infinite time, D is the diffusion coefficient, L is the
thickness of the polymer and qn are the positive roots of
tan qn ¼ 2aqn. a is a dimensionless quantity taking into
account the solubility of the migrant in the solvent and
the volume ratio of the polymer to the solvent. The pa-
rameter a is defined as: a ¼ K21(Vs/Vp), where Vs/Vp is
the volume ratio of the solvent over the polymer and K is
the partition coefficient of the migrant in the polymer
over the solvent, K ¼ Cp,?/Cs,?. In this particular experi-
mental setup, the partition coefficient K of the plasticizer
is set to unity, as all the plasticizers have a very high sol-
ubility in isooctane which means that there will be no
partition between polymer and solvent. This leads to an
a-value of 700, as the volume ratio between polymer and
solvent in this particular experiment was 700 ml (solvent)
to 1 ml (polymer).
Another migration model (Eq. 2), originally derived by
Kontominas in 1993 [8], has incorporated an agitation pa-
rameter ‘‘u’’ that can change the estimated migration from
going towards a limit of 50% plasticizer migrated (static
solvent, u ¼ 0) to 100% plasticizer migrated (u � 0),
which is almost the same as Crank’s model (Eq. 1) in this
setup where a is set to 700.
Mt
M1¼ ut
2Lerf
ut
2ffiffiffiffiffiDt
p� �
þ ut� L
2Lerf
L� ut
2ffiffiffiffiffiDt
p� �
þffiffiffiffiffiDt
p
Lffiffiffip
p exp �ðutÞ24Dt
!� exp �ðL� utÞ2
4Dt
!" #þ 1
2ð2Þ
All symbols have the same meaning as in Eq. 1. TheKontominas model was proposed as a solution for systems
where the diffusion of the migrant in the solvent is so
low that it affects the overall migration out from the poly-
mer matrix. This is of course not the case for this particu-
lar system where isooctane is used as the solvent, but it
can be argued that this particular analytical solution could
be used to mimic the effect of slower overall migration
due to fast depletion of plasticizer from the boundary area
of the highly plasticized PVC. The fitting of the ‘‘u’’
parameter to the migration data was done by the nonlinear
least-squares solver (lsqnonlin) from Mathworks MatLab,
using Eq. 3 as the objective function, where n is the num-
ber of samples, xt is the migration datum at time t, Mt is
the calculated migration at time t.
1
n
Xnt¼1
xt �Mt
xt
�������� (3)
The dependence between temperature and diffusion
coefficient is normally seen to follow an Arrhenius type
equation (Eq. 4), where D0 is the temperature independent
diffusion constant, Ed is activation energy of diffusion, Ris the ideal gas constant, and T is the temperature.
D ¼ D0 exp�Ed
RT
� �(4)
Both the Crank and the Kontominas models require
values of the diffusion coefficient. An empirical model
for estimating the diffusion coefficient of additives in
polymers has been suggested by Piringer and coworkers
[9–11]. Using this model the diffusion coefficient can be
estimated using only three parameters:
T, Temperature (K)
Mr, Molecular weight of the migrating additive (g/mol)
Ap, Specific polymer matrix parameter (dimensionless)
D ¼ 104 exp Ap þ 0:01Mr � 10454
T
� �(5)
D¼ 104 exp A�p �
sT
� �� 0:1351M2=3
r þ 0:003Mr � 10454
T
� �
, D¼ 104 exp A�p � 0:1351M2=3
r þ 0:003Mr
� �3 exp
�ðsRþ 10454RÞRT
� �ð6Þ
FIG. 1. Fully acetylated glycerol monoester based on 12-hydroxystearic
acid (85%, left) and on stearic acid (10%, right), the two main compo-
nents of GRINDSTED1SOFT-N-SAFE.
FIG. 2. The main components of Acetem, fully acetylated glycerol
monoester based on coconut oil, which consists of caprylic (6), capric
(8), and lauric acid (10).
148 JOURNAL OF VINYL & ADDITIVE TECHNOLOGY——2009 DOI 10.1002/vnl
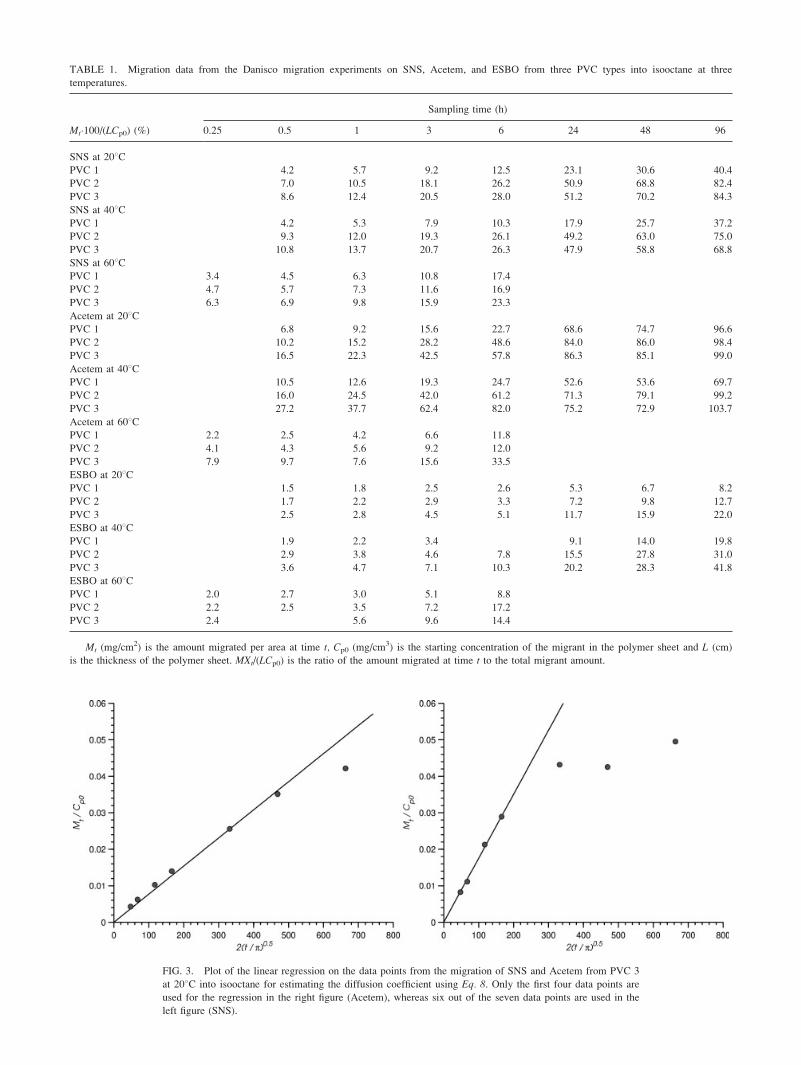
TABLE 1. Migration data from the Danisco migration experiments on SNS, Acetem, and ESBO from three PVC types into isooctane at three
temperatures.
Mt�100/(LCp0) (%)
Sampling time (h)
0.25 0.5 1 3 6 24 48 96
SNS at 208CPVC 1 4.2 5.7 9.2 12.5 23.1 30.6 40.4
PVC 2 7.0 10.5 18.1 26.2 50.9 68.8 82.4
PVC 3 8.6 12.4 20.5 28.0 51.2 70.2 84.3
SNS at 408CPVC 1 4.2 5.3 7.9 10.3 17.9 25.7 37.2
PVC 2 9.3 12.0 19.3 26.1 49.2 63.0 75.0
PVC 3 10.8 13.7 20.7 26.3 47.9 58.8 68.8
SNS at 608CPVC 1 3.4 4.5 6.3 10.8 17.4
PVC 2 4.7 5.7 7.3 11.6 16.9
PVC 3 6.3 6.9 9.8 15.9 23.3
Acetem at 208CPVC 1 6.8 9.2 15.6 22.7 68.6 74.7 96.6
PVC 2 10.2 15.2 28.2 48.6 84.0 86.0 98.4
PVC 3 16.5 22.3 42.5 57.8 86.3 85.1 99.0
Acetem at 408CPVC 1 10.5 12.6 19.3 24.7 52.6 53.6 69.7
PVC 2 16.0 24.5 42.0 61.2 71.3 79.1 99.2
PVC 3 27.2 37.7 62.4 82.0 75.2 72.9 103.7
Acetem at 608CPVC 1 2.2 2.5 4.2 6.6 11.8
PVC 2 4.1 4.3 5.6 9.2 12.0
PVC 3 7.9 9.7 7.6 15.6 33.5
ESBO at 208CPVC 1 1.5 1.8 2.5 2.6 5.3 6.7 8.2
PVC 2 1.7 2.2 2.9 3.3 7.2 9.8 12.7
PVC 3 2.5 2.8 4.5 5.1 11.7 15.9 22.0
ESBO at 408CPVC 1 1.9 2.2 3.4 9.1 14.0 19.8
PVC 2 2.9 3.8 4.6 7.8 15.5 27.8 31.0
PVC 3 3.6 4.7 7.1 10.3 20.2 28.3 41.8
ESBO at 608CPVC 1 2.0 2.7 3.0 5.1 8.8
PVC 2 2.2 2.5 3.5 7.2 17.2
PVC 3 2.4 5.6 9.6 14.4
Mt (mg/cm2) is the amount migrated per area at time t, Cp0 (mg/cm3) is the starting concentration of the migrant in the polymer sheet and L (cm)
is the thickness of the polymer sheet. MXt/(LCp0) is the ratio of the amount migrated at time t to the total migrant amount.
FIG. 3. Plot of the linear regression on the data points from the migration of SNS and Acetem from PVC 3
at 208C into isooctane for estimating the diffusion coefficient using Eq. 8. Only the first four data points are
used for the regression in the right figure (Acetem), whereas six out of the seven data points are used in the
left figure (SNS).
In Eqs. 5 and 6, D is expressed in cm2/s. Two versions
of the model are currently suggested by Piringer (Eqs. 5and 6). Equation 5 is the original version, where the poly-
mer matrix parameter (Ap) is independent of temperature,
and the equation is recommended for polymer additives
with low molecular weights (Mr \ 1000 g/mol) in an
unplasticized polymer. The more recent model (Eq. 6) hastwo parameters for the polymer matrix (Ap ¼ A�
p 2 s/T).When Eq. 6 is compared with the standard Arrhenius type
equation (Eq. 4), it is seen that:
D0 ¼ 104 exp A�p � 0:1351M2=3
r þ 0:003Mr
� �and
Ed ¼ sRþ 10454R ¼ sRþ Edh i ð7ÞIt can now be seen from Eq. 7 that s is the correction
contribution to the mean activation energy term of the
model (Ed ¼ sR þ hEdi).
EXPERIMENTAL DATA
A series of migration experiments was carried out by
DANISCO A/S in 2005 for the migration of GRIND-
STED1SOFT-N-SAFE (SNS), GRINDSTED1ACETEM
95 CO (Acetem), and epoxidized soybean oil (ESBO)
from three different PVC types. These experiments were
carried out for a possible customer of the key product,
SNS. The migration experiments were carried out with
the three different plasticizers, on the three different PVC
types, at three different temperatures. This gave in all 18
migration experiments.
Plasticizers
GRINDSTED1SOFT-N-SAFE (SNS).
GRINDSTED1ACETEM 95 CO (Acetem).
Epoxidized soybean oil (ESBO).
Polymers
PVC 1:50 phr plasticizer, 2.5 phr surfactant, and stabi-
lizer.
PVC 2:50 phr plasticizer, 7 phr lubricant, and 2.5 phr
surfactant and stabilizer.
PVC 3:67 phr plasticizer, 2.5 phr surfactant, and stabi-
lizer.
[phr ¼ parts per hundred resin (by weight)].
Temperatures
208C, 408C, and 608C.
Sampling
0.5 h, 1 h, 3 h, 6 h, 24 h, 48 h, and 96 h (for experi-
ments at 608C, sampling was started at 0.25 h and
stopped after 6 h).
Each PVC sheet (2.5 cm 3 4.0 cm 3 0.1 cm) was
accurately weighed and then put into 700 ml of isooctane
in a closed container at the specified temperature under
mild agitation; 1 ml samples were then taken according to
the sampling times. The 1 ml sample was evaporated to
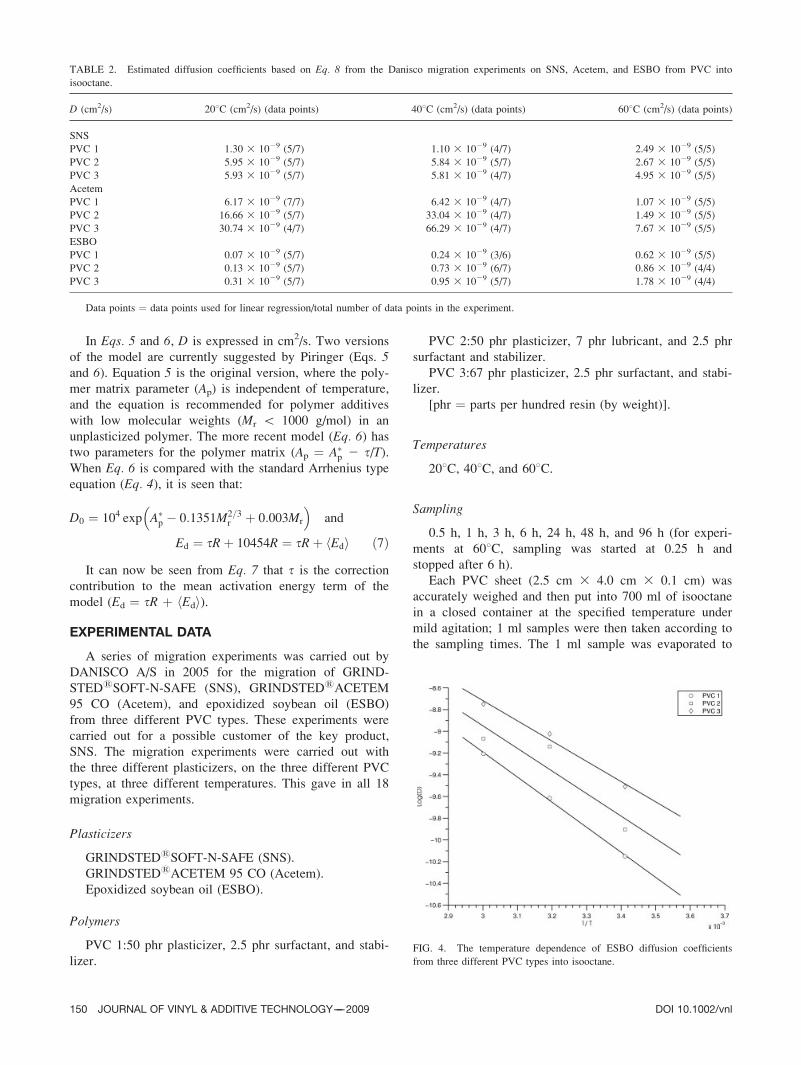
TABLE 2. Estimated diffusion coefficients based on Eq. 8 from the Danisco migration experiments on SNS, Acetem, and ESBO from PVC into
isooctane.
D (cm2/s) 208C (cm2/s) (data points) 408C (cm2/s) (data points) 608C (cm2/s) (data points)
SNS
PVC 1 1.30 3 1029 (5/7) 1.10 3 1029 (4/7) 2.49 3 1029 (5/5)
PVC 2 5.95 3 1029 (5/7) 5.84 3 1029 (5/7) 2.67 3 1029 (5/5)
PVC 3 5.93 3 1029 (5/7) 5.81 3 1029 (4/7) 4.95 3 1029 (5/5)
Acetem
PVC 1 6.17 3 1029 (7/7) 6.42 3 1029 (4/7) 1.07 3 1029 (5/5)
PVC 2 16.66 3 1029 (5/7) 33.04 3 1029 (4/7) 1.49 3 1029 (5/5)
PVC 3 30.74 3 1029 (4/7) 66.29 3 1029 (4/7) 7.67 3 1029 (5/5)
ESBO
PVC 1 0.07 3 1029 (5/7) 0.24 3 1029 (3/6) 0.62 3 1029 (5/5)
PVC 2 0.13 3 1029 (5/7) 0.73 3 1029 (6/7) 0.86 3 1029 (4/4)
PVC 3 0.31 3 1029 (5/7) 0.95 3 1029 (5/7) 1.78 3 1029 (4/4)
Data points ¼ data points used for linear regression/total number of data points in the experiment.
FIG. 4. The temperature dependence of ESBO diffusion coefficients
from three different PVC types into isooctane.
150 JOURNAL OF VINYL & ADDITIVE TECHNOLOGY——2009 DOI 10.1002/vnl
dryness at 708C under a stream of N2. SNS and Acetem
were analyzed by GC-FID and ESBO by GC-MS.
All the data from the migration experiments are col-
lected in Table 1 and shown as the ratio of the amount
migrated at time t over the total amount of plasticizer
used in the experiment.
RESULTS AND DISCUSSION
In the first part of the migration, the concentration of
the migrant in the solvent will be zero, and since the con-
centration in the solvent is very low compared to the con-
centration in the polymer, the migration will follow the
simplified version of Crank’s [7] migration model shown
in Eq. 8 [9, 12].
Mt ¼ 2Cp0
ffiffiffiffiffiDt
p
r, Mt
Cp0
¼ffiffiffiffiD
p� 2
ffiffiffit
p
r(8)
Following Eq. 8 it is possible to develop an expression
of the migration (Mt) as a linear function of the square
root of time (t), where the slope is the square root of the
diffusion coefficient (D). By plotting Mt/Cp0 against
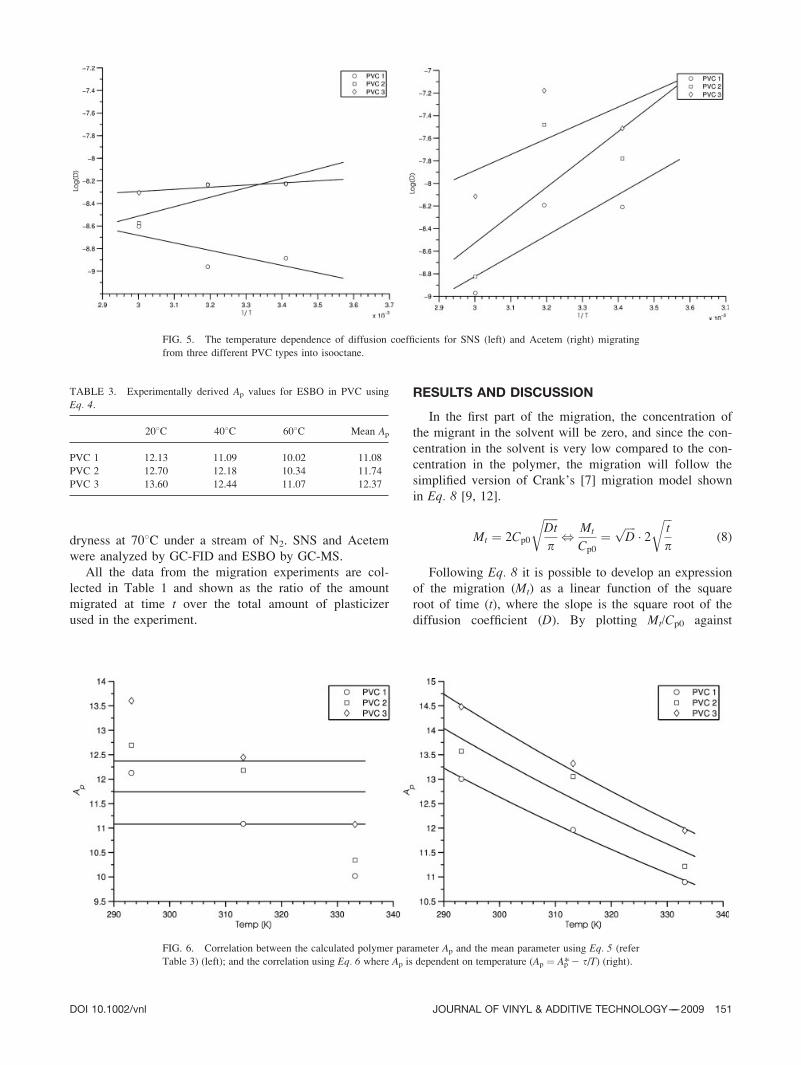
FIG. 5. The temperature dependence of diffusion coefficients for SNS (left) and Acetem (right) migrating
from three different PVC types into isooctane.
TABLE 3. Experimentally derived Ap values for ESBO in PVC using
Eq. 4.
208C 408C 608C Mean Ap
PVC 1 12.13 11.09 10.02 11.08
PVC 2 12.70 12.18 10.34 11.74
PVC 3 13.60 12.44 11.07 12.37
FIG. 6. Correlation between the calculated polymer parameter Ap and the mean parameter using Eq. 5 (refer
Table 3) (left); and the correlation using Eq. 6 where Ap is dependent on temperature (Ap ¼ A*p 2 s/T) (right).
DOI 10.1002/vnl JOURNAL OF VINYL & ADDITIVE TECHNOLOGY——2009 151

2 (t/p)1/2 it is possible to estimate the diffusion coefficient
by linear regression from the experimentally measured
migration data. The problem with this method for estimat-
ing the diffusion coefficient is that there must be a suffi-
cient number of data points in this first part of the migra-
tion area where this simplified model is valid. The first
four of the seven data points from the experiment with
Acetem migrating from PVC 3 into isooctane at 208C(Fig. 3, right), clearly lie in the linear part of the migra-
tion, whereas the last three data points break off from the
linear model. For the same system, with SNS as the plas-
ticizer, only the first six of the seven data points were
used for the regression (Fig. 3, left).
Diffusion Coefficients from Experimental Data
One of the purposes of this project was to estimate the
diffusion coefficients of SNS at different temperatures,
based on the migration data from the Danisco A/S experi-
ments. This was done with linear regression using Eq. 8.As the migration experiments also included the plasticizer
candidate Acetem and the widely used plasticizer ESBO,
the diffusion coefficients were calculated for these plasti-
cizers as well. All the estimated diffusion coefficients are
listed in Table 2 along with the number of datapoints that
have been used for the regression.
As can be seen from the estimated diffusion coeffi-
cients in Table 2, ESBO has the lowest diffusion coeffi-
cient, thus the slowest migration. SNS has a diffusion
coefficient approximately a factor of 10 higher and Ace-
tem almost a factor of 50 higher on average, compared to
ESBO. This means that it should be expected that SNS
exhibits a slightly faster migration from PVC into isooc-
tane compared to ESBO. As displayed in Fig. 4, there is
good agreement between the estimated diffusion coeffi-
cients of ESBO and the temperature dependency sug-
gested by the Arrhenius equation (Eq. 4).The diffusion coefficients tend to reach higher values
(faster migration) at higher temperatures, as expected.
Unlike ESBO, the estimated diffusion coefficients of SNS
TABLE 4. The fitted polymer parameters of Eq. 6, and the collective
Arrhenius activation energy Ed 5 (t þ 10454)R, according to Eq. 7.
A�p s Ed (kJ/mol)
PVC 1 24.5 25140 44.16
PVC 2 25.5 25667 39.78
PVC 3 26.5 26160 35.68
FIG. 7. The estimation of the diffusion coefficient for PVC 3. The dot-
ted lines are estimations with Eq. 5 and the solid lines are estimations
using Eq. 6, at the three temperatures 208C (bottom), 408C (middle), and
608C (top). It can be seen that the estimated diffusion coefficients of
Acetem (Mr ¼ 330 g/mol) and SNS (Mr ¼ 500 g/mol) are in good agree-
ment with the results of experiments performed at 208C (circled data
points), but that as the temperature gets higher, the experimentally
derived diffusion coefficient is too low compared to the model calcula-
tions.
TABLE 5. Estimated diffusion coefficients (Dcalc in cm2/s) and the error % (Err) calculated by 100 � logðDcalc�logðDexpÞlogðDexpÞ
� �for Acetem, SNS, and ESBO
in all three PVC types at 208C, 408C, and 608C.
PVC 1 PVC 2 PVC 3
Mean Err Mean ErrDcalc (cm2/s) Err (%) Dcalc (cm
2/s) Err (%) Dcalc (cm2/s) Err (%)
208C (310210) 0.77
Ace 63.27 20.14 140.49 0.93 277.78 0.58 0.55
SNS 13.44 20.16 29.84 3.65 59.01 0.02 1.28
ESBO 0.73 20.13 1.62 21.14 3.20 20.15 0.48
408C (31029) 2.69
Ace 20.14 26.06 39.86 21.09 70.79 20.40 2.52
SNS 4.28 26.60 8.47 21.96 15.04 25.01 4.52
ESBO 0.23 0.21 0.46 2.17 0.82 0.72 1.03
608C (31028) 9.6
Ace 5.58 219.15 9.98 220.68 16.13 216.30 18.71
SNS 1.18 27.88 2.12 210.50 3.43 210.12 9.50
ESBO 0.06 20.16 0.11 21.40 0.19 20.21 0.59
Mean Err 4.5 4.84 3.72
The mean error is calculated as the mean absolute error.
152 JOURNAL OF VINYL & ADDITIVE TECHNOLOGY——2009 DOI 10.1002/vnl
(migration from PVC into isooctane) seem to be tempera-
ture independent (Fig. 5, left). It is difficult to explain this
behavior, as higher temperatures imply faster Brownian
movement of the molecules, thus the molecules will reach
the lowest energy state of the system more quickly (equi-
librium, Mt ¼ M?). One explanation for this unexpected
behavior could be that the high solubility of SNS in iso-
octane combined with the high diffusion rate of SNS in
the plasticized PVC may result in an extraction of SNS in
the boundary area of the polymer. This almost empty part
of the PVC will then have a much different physical char-
acter than the plasticized part of the PVC, and thus
lead to a much different diffusion rate of SNS in this
area. This will lead to a much different overall mean dif-
fusion coefficient for the total system, which is what is
calculated by the method described in the start of this
section (using Eq. 8). This could be an explanation of
why the experimentally measured diffusion coefficients
do not increase with temperature as would have been
expected.
For Acetem there seem to be some correlation between
temperature and diffusion, as the diffusion coefficients of
all three PVC types behave in the same manner. But, as
in the case of SNS, the temperature dependence does not
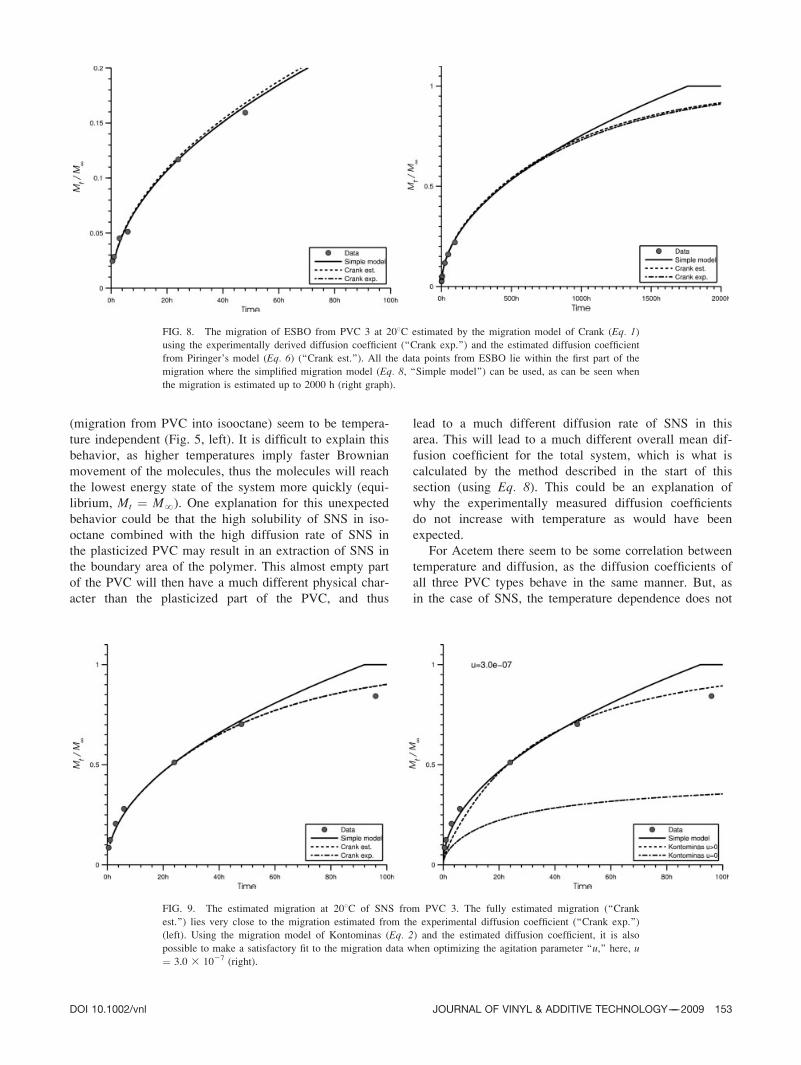
FIG. 8. The migration of ESBO from PVC 3 at 208C estimated by the migration model of Crank (Eq. 1)using the experimentally derived diffusion coefficient (‘‘Crank exp.’’) and the estimated diffusion coefficient
from Piringer’s model (Eq. 6) (‘‘Crank est.’’). All the data points from ESBO lie within the first part of the
migration where the simplified migration model (Eq. 8, ‘‘Simple model’’) can be used, as can be seen when
the migration is estimated up to 2000 h (right graph).
FIG. 9. The estimated migration at 208C of SNS from PVC 3. The fully estimated migration (‘‘Crank
est.’’) lies very close to the migration estimated from the experimental diffusion coefficient (‘‘Crank exp.’’)
(left). Using the migration model of Kontominas (Eq. 2) and the estimated diffusion coefficient, it is also
possible to make a satisfactory fit to the migration data when optimizing the agitation parameter ‘‘u,’’ here, u
¼ 3.0 3 1027 (right).
DOI 10.1002/vnl JOURNAL OF VINYL & ADDITIVE TECHNOLOGY——2009 153
follow the Arrhenius equation. As Acetem has an even
faster diffusion than SNS in the plasticized PVC, it is
again likely that some sort of boundary layer of empty
rigid PVC is built up on the rim of the polymer, thus
resulting in an overall slower migration from the polymer
to the solvent, and thus a lower diffusion coefficient for
the total system calculated by this method.
Estimation of the Diffusion Coefficient
Since the experimentally derived diffusion coefficients
of ESBO followed exactly the Arrhenius correlation, these
data can be used to estimate the specific polymer parame-
ters for each PVC type as proposed for the use of the Pir-
inger model [9] (Eq. 5). First, the Ap parameter for each
experiment was calculated, using the molecular weight of
ESBO and the temperature for each experiment. The
mean value of the three calculated Ap parameters of each
PVC type was taken as the specific Ap parameter and the
results are shown in Table 3.
As seen from Table 3, is it clear that there is some
temperature dependence of the Ap parameter, which is
accounted for in Eq. 6. In the same way the Ap parameter
was first calculated for each experiment when using
Eq. 5, we can use Eq. 6 knowing that Ap ¼ A�p 2 s/T.
Afterwards the two polymer specific parameters (A�p and
s) were estimated by linear regression as illustrated in
(Fig. 6, right).
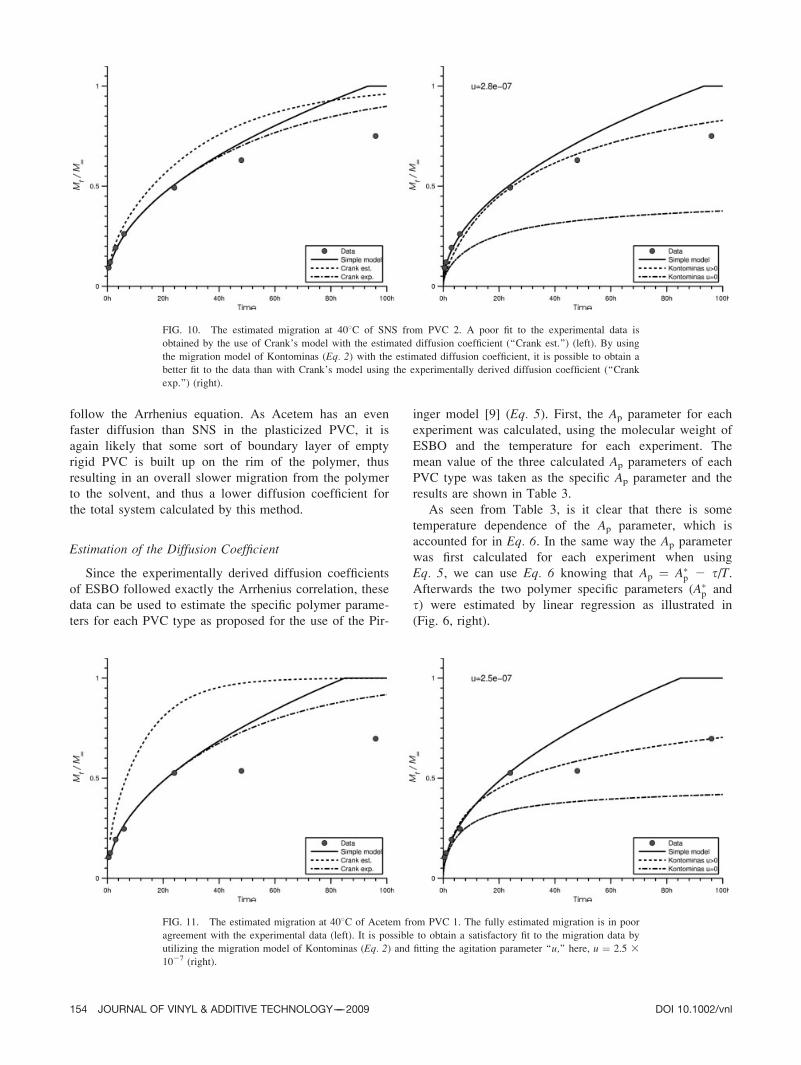
FIG. 10. The estimated migration at 408C of SNS from PVC 2. A poor fit to the experimental data is
obtained by the use of Crank’s model with the estimated diffusion coefficient (‘‘Crank est.’’) (left). By using
the migration model of Kontominas (Eq. 2) with the estimated diffusion coefficient, it is possible to obtain a
better fit to the data than with Crank’s model using the experimentally derived diffusion coefficient (‘‘Crank
exp.’’) (right).
FIG. 11. The estimated migration at 408C of Acetem from PVC 1. The fully estimated migration is in poor
agreement with the experimental data (left). It is possible to obtain a satisfactory fit to the migration data by
utilizing the migration model of Kontominas (Eq. 2) and fitting the agitation parameter ‘‘u,’’ here, u ¼ 2.5 31027 (right).
154 JOURNAL OF VINYL & ADDITIVE TECHNOLOGY——2009 DOI 10.1002/vnl

As seen in Fig. 6, is it clear that the Ap parameter
depends on temperature for these specific experiments, as
was expected because of the highly plasticized PVC poly-
mer matrix. All the calculated polymer specific parame-
ters for the three PVC types for use with Eq. 6 are listed
in Table 4.
Using these polymer specific parameters based solely
on the data of ESBO migration, it should be possible to
estimate the diffusion coefficients for the two other plasti-
cizers (SNS and Acetem) in the three PVC types, know-
ing that ESBO has a molecular weight of 905 g/mol, SNS
of 500 g/mol, and Acetem of 330 g/mol. The estimation
for PVC 3 can be seen in Fig. 7.
All the estimated diffusion coefficients and the error
compared to the experimentally measured diffusion coeffi-
cients are shown in Table 5. The error is calculated as the
logarithmic error of the calculated diffusion coefficient
compared to the experimental one. As can be seen the
error of the estimated diffusion coefficients of SNS and
Acetem at 208C is in the area of 0–1%, whereas at 408C,the error rises to 1–6% and at 608C is as large as 10–
20%. Both at 408C and 608C, the model overestimates the
diffusion coefficients compared to the experimental data,
which is also seen in Fig. 7. This is in very good agree-
ment with the postulated buildup of a boundary layer in
the polymer where diffusion into isooctane is very fast for
SNS and Acetem at higher temperatures. This will almost
give an extraction of the plasticizer in the boundary layer,
and hence a much lower diffusion coefficient in this
layer.
Estimation of Migration
As the polymer parameters of the diffusion coefficient
estimation model (Eqs. 5 and 6) were determined by
using the ESBO migration data, we cannot draw a conclu-
sion on the possibility of using the estimated diffusion
coefficients to predict migration for this plasticizer. Fur-
thermore, the migration of ESBO is so slow that all the
data points lie within the first part of the migration where
even the simplified migration model (Eq. 8) can be used,
as shown in Fig. 8.
The estimation of migration for SNS and Acetem at
208C is almost as good as for ESBO, as the deviation of
the estimated diffusion coefficients from the experimental
values is under 1% (see Table 5). This is shown by
‘‘Crank est.’’ � ‘‘Crank exp.’’ in Fig. 9. Even though a
satisfactory representation is obtained with the migration
model of Crank (Eq. 1) at 208C, the migration model of
Kontominas was also evaluated (Eq. 2; ‘‘Kontominas’’ in
Fig. 9).
The deviations of the estimated diffusion coefficients
of SNS and Acetem at 408C lie in the area of 1–6%
TABLE 6. The fitted ‘‘u’’ parameters for SNS and Acetem at 208C and
408C.
u (31027) PVC 1 PVC 2 PVC 3
SNS
208C Dexp 0.68 2.99 3.01
Dcalc 0.67 2.96 3.01
408C Dexp 0.51 2.82 2.06
Dcalc 0 2.79 2.57
Acetem
208C Dexp 4.9 11.06 17.93
Dcalc 4.92 11.09 18.12
408C Dexp 1.74 17.43 35.11
Dcalc 2.5 17.34 35.84
It was not possible to tune the model of Kontominas (Eq. 2) to fit
the migration data at 608C. There seems to be a tendency towards a cor-
relation of parameters for each PVC type and plasticizer, independently
of temperature.
FIG. 12. The estimated migration at 608C of SNS and Acetem from PVC 2. The diffusion coefficients are
overestimated to such an extent that even the lower limit of the migration model of Kontominas (u ¼ 0,
Eq. 2) gives a faster migration compared to the experimental migration data.
DOI 10.1002/vnl JOURNAL OF VINYL & ADDITIVE TECHNOLOGY——2009 155

(Table 5), which means that a poor fit to the experimental
migration data is obtained by the use of Crank’s model
with estimated diffusion coefficients (‘‘Crank est.’’ in
Figs. 10 and 11). However, with Crank’s model and ex-
perimental diffusion coefficients, the migration is in good
agreement with experimental data. A very good fit to the
experimental data is made possible by using the migration
model of Kontominas (Eq. 2) when adjusting the agitation
parameter ‘‘u’’ to the data. This migration model yields in
some of the cases an even better fit to the data than
Crank’s model using the experimentally derived diffusion
coefficient (‘‘Crank exp.’’) as illustrated in Fig. 10.
At 608C, the error of the estimated diffusion coeffi-
cients of SNS and Acetem is 10–20% (Table 5), and even
the lower limit value of the migration model of Kontomi-
nas (when u ¼ 0 in Eq. 2) is too high compared to the
measured migration (Fig. 12).
When all the fitted ‘‘u’’ parameters are listed together
(Table 6) it seems as if there is almost a specific ‘‘u’’
parameter for each PVC type with each plasticizer inde-
pendent of temperature. Unfortunately, the deviation of
the estimated and experimental data at 608C is so large
that it is not possible to use the migration model of Kon-
tominas (Eq. 2), and no unique ‘‘u’’ parameters could then
be fitted. This ‘‘u’’ parameter was fitted only to the data
at 208C and 408C.The final result of the fitted ‘‘u’’ parameters for the use
of the Kontominas migration model was compared to the
original migration model of Crank by calculating the
mean absolute error (MAE ¼ 1n
Pni¼1
jxt �Mtj) and the mean
absolute percentage error (MAPE ¼ 100%n
Pni¼1
xt�Mt
xt
��� ���) for
the two models. The overall statistical errors can be seen
in Tables 7 and 8. At 208C, there is no gain overall in
using the Kontominas model with an optimized ‘‘u’’ pa-
rameter. At 408C, there are even some cases where the
error for the Kontominas model with the fully estimated
TABLE 7. The mean absolute error (MAE) for the two migration models and the experimental data using the purely estimated diffusion coefficient
(Dcalc) and the diffusion coefficient fitted to the migration data (Dexp).
MAE (31022)
PVC 1 PVC 2 PVC 3
Crank Kontominas Crank Kontominas Crank Kontominas
SNS
208C Dexp 2.05 3.81 1.47 3.81 1.92 4.51
Dcalc 2.23 3.74 8.86 6.80 1.93 4.53
408C Dexp 2.69 2.56 4.03 6.01 6.35 6.56
Dcalc 18.48 1.66 8.22 4.11 17.40 2.71
Acetem
208C Dexp 4.91 3.41 3.78 3.56 3.79 5.49
Dcalc 4.74 3.38 3.94 3.96 4.03 5.88
408C Dexp 6.86 6.00 6.96 7.79 9.25 9.75
Dcalc 21.86 2.58 8.91 7.11 8.48 9.62
The error is calculated by MAE ¼ 1n
Pnt¼1
jxt �Mtj, where n is the number of samples, xt is the migration datum at time t, Mt is the calculated migra-
tion at time t with either equation 1 or 2 for the Crank and Kontominas models, respectively.
TABLE 8. The mean absolute percentage error (MAPE) for the two migration models and the experimental data using the purely estimated diffusion
coefficient (Dcalc) and the diffusion coefficient fitted to the migration data (Dexp).
MAPE (%)
PVC 1 PVC 2 PVC 3
Crank Kontominas Crank Kontominas Crank Kontominas
SNS
208C Dexp 10.90 33.15 2.98 22.31 8.16 27.40
Dcalc 10.84 33.35 26.11 27.48 8.26 12.04
408C Dexp 15.64 31.28 11.05 28.63 18.21 32.06
Dcalc 103.04 21.90 16.76 15.22 41.52 15.03
Acetem
208C Dexp 13.45 12.95 10.26 8.52 5.56 11.64
Dcalc 13.94 12.69 8.00 10.45 5.99 12.67
408C Dexp 16.91 30.81 10.49 15.16 13.72 17.07
Dcalc 61.86 11.28 16.02 14.13 12.14 16.52
The error is calculated by MAPE ¼ 100%n
Pnt¼1
xt�Mt
xt
��� ���, where n is the number of samples, xt is the migration datum at time t, Mt is the calculated
migration at time t with either equation 1 or 2 for the Crank and Kontominas models, respectively.
156 JOURNAL OF VINYL & ADDITIVE TECHNOLOGY——2009 DOI 10.1002/vnl
diffusion coefficient (Dcalc) is lower than that obtained by
using Crank’s model with the experimental diffusion coef-
ficient (Dexp). But in all cases, at 408C, the Kontominas
model (Eq. 2) with the estimated diffusion coefficient
(Dcalc) is at least as good as the Crank model (Eq. 1) withthe experimentally derived diffusion coefficient (Dexp).
CONCLUSIONS
By using the simplified version of the migration model
of Crank [7] (Eq. 8) it was possible to estimate diffusion
coefficients for various PVC-plasticizer systems using the
experimental migration data. A very good agreement with
the expected Arrhenius temperature dependency of the
diffusion coefficients was seen for ESBO, whereas
the diffusion coefficients of SNS seemed temperature in-
dependent. A buildup of a boundary layer because of the
fast migration of the plasticizer is suggested as an expla-
nation for this odd behavior. By using the data for ESBO
alone, polymer specific parameters were estimated for the
diffusion coefficient estimation model of Piringer (Eqs. 5and 6). From this model it was possible to estimate the
diffusion coefficients of SNS and Acetem at 208C in good
agreement with the experimentally derived coefficients.
The overestimation of the diffusion coefficients at 408Cand 608C can also be explained by using the postulated
mechanism of a buildup of a boundary layer because of
the fast migration.
The migration model of Crank [7] (Eq. 1) performed
very well in estimating migration data at 208C, but did
not succeed equally well for the data at 408C and 608Ceven when using the experimentally based diffusion coef-
ficients. The migration model of Crank works only for
systems where the migrant is evenly distributed in the
polymer matrix and the diffusion coefficient can be seen
as concentration independent. For this particular system,
at higher temperatures, the migration is so fast that this
condition no longer applies.
By using a migration model originally derived by Kon-
tominas and coworkers[8] (Eq. 2) and the estimated diffu-
sion coefficient, it was possible to get an even better fit to
the experimental migration data at 408C than that
obtained with the migration model of Crank using the
experimentally derived diffusion coefficient. The fitted
agitation parameter ‘‘u’’ from the migration model of
Kontominas seemed to be specific to the polymer and
plasticizer independently of temperature, especially for
SNS. Since the deviation of the estimated diffusion coeffi-
cients from the experimentally derived values at 608Cwas too large to be compensated for by the migration
model of Kontominas, no fit of the ‘‘u’’ parameters could
be done at this temperature.
The migration model of Crank is very useful for sys-
tems where the migration is so slow that the migrant con-
centration in the polymer matrix can be seen as uniform.
For systems where a small boundary layer is built up it is
possible to use the migration model of Kontominas when
fitting the ‘‘u’’ parameter, but when the depletion of the
plasticizer from the polymer is too fast this model is no
longer applicable either, as was seen for the systems at
608C.
ACKNOWLEDGMENTS
The authors acknowledge Danisco for making this pro-
ject possible. We also thank Bjarne Nielsen and Ulrik
Aunskjær of Danisco for providing fund for the continua-
tion of this project as a Ph. D. study.
NOMENCLATURE
Abbreviations
Acetem GRINDSTED1ACETEM 95 CO
DEHP di-2-ethylhexyl phthalate
DINP diisononyl phthalate
ESBO epoxidized soybean oil
phr Parts per hundred resin
PVC poly(vinyl chloride)
SNS GRINDSTED1SOFT-N-SAFE
List of Symbols
a Ratio of solvent volume over polymer volume
and the partition coefficient of the migrant in
the two, a ¼ K21(Vs/Vp)
Cp0 Initial concentration of plasticizer in polymer
(mg/cm3)
D0 Temperature independent diffusion constant
(cm2/s)
D Diffusion coefficient (cm2/s)
Ed Activation energy of diffusion (J/mol)
erf Error function, erfðxÞ ¼ 2ffiffip
pR x0e�t2dt
K Partition coefficient of the migrant polymer/
solvent, K ¼ Cp,?/Cs,?
L Thickness of polymer (cm)
M? Migration at infinite time (mg/cm2)
Mr Molecular weight of the migrating additive
(g/mol)
Mt Migration at time t (mg/cm2)
n Integer used in Eq. 1qn Positive roots of Tan qn ¼ 2aqnt Time (s)
u Agitation parameter (cm/s)
REFERENCES
1. S. Braucks, ‘‘Green Paper: Environmental Issues of PVC,’’
in The Commission of the European Communities, July
(2000).
2. T.F. Jensen, Complete Composition of GRINDSTED1
SOFT-N-SAFE, Danisco Research Report.
DOI 10.1002/vnl JOURNAL OF VINYL & ADDITIVE TECHNOLOGY——2009 157

3. Danisco, GRINDSTED1SOFT-N-SAFE—The SustainablePlasticiser for PVC, Danisco, August (2006).
4. M. Kyprianou, Off. J. Eur. Union, 91, 17 (2007).
5. D. Byrne, Off. J. Eur. Union, 220, 18 (2002).
6. T.F. Jensen, Migration of Plasticizers from PVC to iso-octane, Danisco Research Report.
7. J. Crank, Mathematics of Diffusion, 1st ed., Clarendon press,
Oxford (1956).
8. E. Kondyli, M. Kontominas, and M. Kosmas, Polymer, 34,2592 (1993).
9. O.-G. Piringer and A.L. Baner, Plastic Packaging Materials
for Food Barrier Function, Mass Transport, Quality Assur-
ance and Legislation, Wiley-VCH, Weinheim (2000).
10. O.-G. Piringer, Food Addit. Contam., 11, 221 (1994).
11. T. Begley, L. Castle, A. Feigenbaum, R. Franz, K. Hinrichs,
T. Lickly, P. Mercea, M. Milana, A. O’Brien, S. Rebre,
R. Rijk, and O. Piringer, Food Addit. Contam., 22, 73
(2005).
12. P. Zygoura, A. Goulas, K. Riganakos, and M. Kontominas,
J. Food Eng., 78, 870 (2007).
158 JOURNAL OF VINYL & ADDITIVE TECHNOLOGY——2009 DOI 10.1002/vnl