Modeling effect of GABAergic current in a basal ganglia computational model
11
1 23 Cognitive Neurodynamics ISSN 1871-4080 Cogn Neurodyn DOI 10.1007/s11571-012-9203-3 Modeling effect of GABAergic current in a basal ganglia computational model Felix Njap, Jens Christian Claussen, Andreas Moser & Ulrich G. Hofmann
-
Upload
independent -
Category
Documents
-
view
1 -
download
0
Transcript of Modeling effect of GABAergic current in a basal ganglia computational model
1 23
Cognitive Neurodynamics ISSN 1871-4080 Cogn NeurodynDOI 10.1007/s11571-012-9203-3
Modeling effect of GABAergic current in abasal ganglia computational model
Felix Njap, Jens Christian Claussen,Andreas Moser & Ulrich G. Hofmann

1 23
Your article is protected by copyright and
all rights are held exclusively by Springer
Science+Business Media B.V.. This e-offprint
is for personal use only and shall not be self-
archived in electronic repositories. If you
wish to self-archive your work, please use the
accepted author’s version for posting to your
own website or your institution’s repository.
You may further deposit the accepted author’s
version on a funder’s repository at a funder’s
request, provided it is not made publicly
available until 12 months after publication.

RESEARCH ARTICLE
Modeling effect of GABAergic current in a basal gangliacomputational model
Felix Njap • Jens Christian Claussen •
Andreas Moser • Ulrich G. Hofmann
Received: 21 July 2011 / Revised: 13 March 2012 / Accepted: 16 April 2012
� Springer Science+Business Media B.V. 2012
Abstract Electrical high frequency stimulation (HFS) of
deep brain regions is a method shown to be clinically effective
in different types of movement and neurological disorders. In
order to shed light on its mode of action a computational
model of the basal ganglia network coupled the HFS as
injection current into the cells of the subthalamic nucleus
(STN). Its overall increased activity rendered a faithful
transmission of sensorimotor input through thalamo-cortical
relay cells possible. Our contribution uses this model by Rubin
and Terman (J Comput Neurosci, 16, 211–223, 2004) as a
starting point and integrates recent findings on the importance
of the extracellular concentrations of the inhibiting neuro-
transmitter GABA. We are able to show in this computational
study that besides electrical stimulation a high concentration
of GABA and its resulting conductivity in STN cells is able to
re-establish faithful thalamocortical relaying, which other-
wise broke down in the simulated parkinsonian state.
Keywords Computational model � Synaptic
conductances � c-Aminobutyric acid � Deep brain
stimulation � Parkinsonian condition
Introduction
Deep brain stimulation (DBS), especially of the subtha-
lamic nucleus (STN), utilizing chronically implanted
electrodes has become an effective, though symptomatic,
therapy for a wide range of neurological disorders (Ben-
abid et al. 2002; Benabid 2007; McIntyre et al. 2004; Deep-
Brain Stimulation for Parkinson’s Disease Study Group
2001). However the detailed working mechanism regarding
molecular and pharmacological aspects is not yet fully
understood. During the past decade computational neuro-
science has attempted to shed light on the mechanism of
DBS by numerical simulations to optimize the therapeutic
outcome of DBS in movement disorders (Alejandro 2006;
Pirini et al. 2009). With this aim a cellular-based model of
the basal ganglia system was implemented by Rubin and
Terman (2004). The original model was able to reproduce
the physiological and pathological activities of STN and
thalamus cells (TC) in a realistic basal ganglia network and
proposed such an explanation for the reduction of parkin-
sonian symptoms under electrical HFS. Their findings are
based on increasing the firing activity of STN rather than
shutting it down.
The following study utilizes the original model, but
develops it further in light of recently presented neuro-
chemical findings on the DBS rationale. Those experi-
ments quantitatively measured extracellular neurotrans
mitter concentrations, and showed that electrical high
frequency stimulation (HFS) induced selective c-amino-
butyric acid (GABA) release as a mechanistic basis of
F. Njap (&) � U. G. Hofmann
Institute for Signal Processing, University of Lubeck,
23538 Lubeck, Germany
e-mail: [email protected]
U. G. Hofmann
e-mail: [email protected]
F. Njap � J. C. Claussen
Graduate School for Computing Medicine and Life Sciences,
University of Lubeck, Lubeck, Germany
J. C. Claussen
Institute for Neuro-and Bioinformatics, University of Lubeck,
23538 Lubeck, Germany
A. Moser
Department of Neurology, University of Lubeck, 23538 Lubeck,
Germany
123
Cogn Neurodyn
DOI 10.1007/s11571-012-9203-3
Author's personal copy

HFS (Mantovani et al. 2006, 2009; Hiller et al. 2007;
Feuerstein et al. 2011). Whereas usually DBS is consid-
ered to provide excitatory input to STN neurons leading to
an increased activity, we replaced it with inhibitory post-
synaptic current (IPSC) exclusively conveyed by GABA
(Gerstner and Kistler 2002; Hutt and Longtin 2010; Foster
et al. 2008; Liu et al. 2010). Our current study seeks to
numerically examine the thalamus’ output response under
DBS-related current and compare this to output response
with GABAergic currents applied to the same target cells
in STN instead.
Methods
Our model follows up on the seminal model of the basal
ganglia thalamic network by Rubin and Terman and the
modified version described in our recent contribution. Each
cell type in our model network is described by a single
compartment and has Hodgkin-Huxley-type spike gener-
ating currents as described previously (Njap et al. 2011). A
detailed description including all parameters and nonlinear
equations has been published elsewhere (e.g., Guo et al.
2008).
The voltage in the original Rubin and Terman’s original
model obeys the following Eq. (1):
CmdV
dt¼ �INa � IK � ICa � IT � IAHP � ILeak þ IDBS; ð1Þ
The model features: potassium and sodium spike-
producing currents IK, INa; a low-threshold T-type (Ca2?)
current (IT); a high-threshold (Ca2?)current (ICa); a Ca2?
activated, voltage-independent after hyper polarization K?
current (IAHP), and a leak current (ILeak). All these currents
are described by Hodgkin-Huxley formalism. IDBS
represents the deep brain stimulation current of the STN
modeled with the following periodic step function (2):
IDBS ¼ iD sin 2pt=qDð Þð Þ 1� h sin 1þ dDð Þ=qDð Þð Þ; ð2Þ
where iD is the stimulation amplitude, qD stimulation
period, dD duration of each impulse, and h represents the
Heaviside step function given by (3)
h xð Þ ¼0 x\012
x ¼ 0
1 x [ 0
8<
:: ð3Þ
In the original model, during stimulation IDBS(t) was
taken as a large positive constant and was applied directly
to the neuronal membrane in the STN neuron model. In our
current study the new membrane potential of each STN
neuron integrates over additional ion channels and
stochastic Cmg to obtain more realistic simulations but
also to account for a specific type of experimentally
recorded pattern which can not be seen in purely
deterministic simulations (Braun et al. 2000). It obeys the
following Eq. (4):
CmdV
dt¼ �INa � IK � ICa � IT � IAHP � ILeak þ Isyn tð Þþ Cmg;
ð4Þ
where Isyn (t) = gsyn (t) s(V - Esyn) represents an
inhibitory channels where s satisfies the stochastic
differential equation (Higham 2001) (5):
ds ¼ a 1� sð Þ � bs½ �dt þ rdg; ð5Þ
a and b are the forward and backward rate constants, and
the Gaussian white noise included is characterized by mean
hgi = 0, and variances hg(t)g(0)i = 2rdg, with r the
strength of the noise. The noise strength r decreases as the
square root of the number of ions channels (Fox 1997) (6):
r ¼ ½að1� sÞ þ bs�=½ðsNsÞ�1=2; ð6Þ
with parameters a = 1 ms-1, s = 100 ms-1, Ns = 500
and is chosen such that aaþb ¼ 0:2. r is expressed in units of
mV2/ms, time in ms, currents in lA/cm2. In all our simu-
lations parameter values were chosen to produce reason-
able visual agreement with experimental records.
The parameter Esyn and the function gsyn(t) can be used
to characterize different types of synapses. The parameters
that describe the conductivity of transmitter-activated ion
channels at a certain synapse are chosen in such a way as to
mimic a time course and the amplitude of experimentally
observed spontaneous postsynaptic currents. In this paper,
to take heterogeneity into account the conductance current
is described by the following kinetic equation (7):
gsyn tð Þ ¼X
f
�gsyne� t�t fð Þð Þh t � t fð Þ� �
ð7Þ
where t(f) denotes the arrival time of a presynaptic action
potential which follow a Poisson distribution at rate 0.05
spikes/s. Esyn = -75 mV is the reversal potential,
s = 5 ms is the time constant and �gsynis the amplitude
describing the maximal synaptic conductance of GABA.
The time-dependent conductance of inhibitory synapses in
deep cerebellar nuclei can be described by a simple
exponential decay given by Eq. (7). In the basal ganglia,
the majority of neurons uses GABA as neurotransmitter
and has inhibitory effects on their targets (Chakravarthy
et al. 2010; Boyes and Bolam 2007). For the sake of
computation and simplicity, our model included only the
slow component GABAA synapse. Parameter values were
the same as in Rubin and Terman’s model. All simulations
were performed using the software XPPAUT written by
Ermentrout (2002) and MATLAB for analysis. The
Cogn Neurodyn
123
Author's personal copy

numerical method used was an adaptive-step fourth order
Runge–Kutta method (Qualst.RK4 in XPP) with a typical
time step of 0.01 ms.
The model network is depicted in Fig. 1. It consists of
five anatomical nuclei representing the external segment of
globus pallidus (GPe), subthalamic nucleus (STN), the
internal segment of globus pallidus (GPi), thalamus, and
cortex, where the first three nuclei belong to the basal
ganglia network. Arrows with dashed lines indicate inhib-
itory synaptic connections and inputs, whereas solid lines
indicate excitatory synaptic connection and inputs. In the
original model GPe and GPi neurons were biased with
applied currents that varied between the normal-healthy
and parkinsonian conditions, modeling changes in the
strength of striatal inhibition.
To simulate a parkinsonian state, parameters were
chosen to reproduce the behavior of experimentally
recorded cells of an 1-methyl-4-phenyl-1,2,3,6-tetrahy-
dropyridine (MPTP), non-human primate model of Par-
kinson’ diseases (PD) shown in (Guo et al. 2008). We then
applied GABA-mediated currents onto STN cells during
this parkinsonian condition and observed the direct effect
on thalamus cells (TC) to relay sensorimotor input to the
cortex. Secondly, as Rubin and Terman did, we observed
the thalamus’ ability to faithfully relay sensorimotor input
to the cortex as we slowly increased the synaptic conduc-
tance of GABA. Our model’s output was compared to the
optimal DBS current described in the original model. Thus
we were finally able to evaluate our network model using
two performance scores (error index and coefficient of
variation) with the aim of measuring thalamocortical cell
responsiveness to stimulus input.
Results
Normal and parkinsonian firing patterns
Although the network parameters are set to produce the
parkinsonian state in the absence of DBS, Rubin’s DBS
model show that the presence of electrical DBS restores the
faithful relay of inputs to the cortex by the TC. On the other
hand, during parkinsonian condition, the thalamus is no
longer able to relay sensorimotor input faithfully due to the
bursting activity of GPi. This tonical activity may consid-
erably influence thalamic responsiveness activity. At this
stage we replaced DBS current with inhibitory postsynaptic
current (IPSC) in STN cells and questioned the ability of
thalamus to produce the same output. Figure 4 shows that
the thalamus cells produce similar network effects when
sensorimotor input
Cortex
striatal input
GABA
STN
GPe
GPi
Thalamus
Fig. 1 Network model consisting of sixteen STN, GPe and GPi and
two TC. The thalamus receives synaptic inhibition from GPi and
excitatory input, related to sensorimotor activity. GPi and GPe both
receive excitatory input from STN, and GPi receives inhibition from
GPe. There is interpallidal inhibition among GPe neurons. STN
receives inhibition from GPe and GABAergic currents. Each STN
neuron receives inhibitory input from two GPe neurons. Each GPe
neuron receives excitatory input from three STN neurons and
inhibitory input from two other GPe neurons. Each GPi neuron
receives excitatory input from one STN neuron. Each thalamic neuron
receives inhibitory input from eight GPi neurons. The thalamus is
viewed as a ‘‘relay station’’ where cells have the unique role of
responding faithfully to each excitatory sensorimotor input. GPe
receives striatal input. (Adapted from Rubin and Terman 2004)
Cogn Neurodyn
123
Author's personal copy

replacing DBS excitatory input with the GABAergic
inhibitory current at higher synaptic conductances. The loss
of connectivity observed in parkinsonian state (Fig. 2) is
restored, corroborating the key role of synaptic inhibition.
DBS acts excitatory and GABAA-type currents
inhibitory
Thalamus cells are not able to relay information to the
cortex as seen in Fig. 3 (right) with vanishing synaptic
GABAA currents. Therefore, we limited our simulations in
the beginning to two different input regimes consisting of
smaller and larger synaptic inputs.
Increasing the synaptic conductance up to 40 pS, our
simulations results show, that TC cell relay fidelity is
qualitatively restored the same way as DBS is able to do
(Fig. 4). Above �gsyn ¼ 40� �
our networks are no longer
stable. The loss of faithful relaying quickly returns for
small values of synaptic conductance (see Fig. 5).
In order to quantify TC cells’ output in term of correct
responses, we utilized two performance scores: The error
index (EI) and the coefficient of variation (CV).
As Rubin and Terman defined the EI is the total number
of errors divided by the total number of input stimuli. The
CV is defined as the ratio of standard deviation to the
average of the inter-spike intervals. This coefficient pro-
vides information on the output of the thalamocortical
cells. By thresholding (Vth = -45 mV) the membrane
potential, we defined the thalamic cell spike response to
each stimulus amplitude. For a perfect relay of our periodic
input we expect CV = 0 and EI = 0. This ideal scenario
corresponds to constant inter-spike intervals, but EI = 0 is
not incompatible with CV = 0 (for example if pulses are
relayed but timing is slightly affected). On the other hand,
an EI = 0 and CV = 0 correspond to one stimulus pulse
relayed periodically every two or more input pulses
(Alejandro 2006). Table 1 lists different values of CV, and
EI in normal state, parkinsonian state, optimal applied DBS
current and with the GABA input that seems to produce the
most beneficial therapeutic effect in our simulation.
To analyze the results displayed in Fig. 4, we successively
introduced the coherence measure taken from (White et al.
1998) within and between spike trains of basal ganglia different
nuclei when synaptic conductances fluctuate and computed the
coherence reduction (CR) described by (Moran et al. 2012).
The functional integration between the different parts of the
brain is usually quantified through a measure of coherence. The
correlation or the coherence measure determines the level of
synchrony and quantifies the linear correlation in time–fre-
quency domain. Therefore, one distinguishes the magnitude
square coherence function and the phase function. We
approximated both spike trains by a series of square pulses of
unit height and fixed width of 20% of the period of the fastest
firing cell. Each square wave is centered around the peak of the
individual action potentials in the train. The shared area of the
square pulses from each train that overlap in time is then cal-
culated for the duration of the simulation. We took the cross-
correlation at zero time lag of these pulse trains. This is
Fig. 2 Periodic sensorimotor
stimulation input and TC
responsiveness in the two
clinical states: normal (left) and
parkinsonian (right) and
corresponding GPi and STN
activity under these conditions.
Arrows indicate dropped
responses of TC on driving
input, thus indicating poor
information transfer to the
cortex. During the normal state,
STN neurons fire irregularly
whereas in parkinsonian state,
each STN neuron fires in a
periodic tremor-like fashion,
thus leading STN neurons’
populations to break up into two
clusters. (Adapted from Rubin
and Terman 2004)
Cogn Neurodyn
123
Author's personal copy

equivalent to calculating the shared area of the unit-height
pulses. Finally, we took the coherence as the sum of these
shared areas, divided by the square root of the product of the
summed areas of each individual pulse train (Baker et al. 2002).
If x(t) is the series of unit height pulses for the first cell
over N time steps and y(t) is the series of pulses for the
second cell, then the coherence measure or correlation in
time-domain is calculated as:
Fig. 3 Periodic sensorimotor
stimulation input and TC cells
responsiveness in the optimal
DBS stimulation (left) and with
vanishing GABA synaptic
conductance amplitude (right).Electrical HFS increases
activity in the STN (Garcia et al.
2005), thus leading to increased
tonic activity in GPi cells. This
seemingly contradicts the idea
that electrical HFS is a way of
silencing the pathologically
overactive indirect pathway as it
is done in therapeutic lessoning
(Olanow et al. 2000). Under
stimulation conditions, DBS
restores the thalamus ability to
transmit information, whereas
with vanishing synaptic
conductance amplitude, TC
cells are unable to transmit
information to the cortex
Fig. 4 The output model
membrane potential of TC, GPi
and STN cells with optimal
DBS stimulation (left) and
GABAergic tonic inhibition
(right)
Cogn Neurodyn
123
Author's personal copy

Coherence measure ¼PN
t¼1 x tð Þ � y tð ÞffiffiffiffiffiffiffiffiffiffiffiffiffiffiffiffiffiffiffiffiffiffiffiffiffiffiffiffiffiffiffiffiffiffiffiffiffiffiffiffiffiffiffiffiPN
t¼1 x tð Þ �PN
t¼1 y tð Þq : ð8Þ
Given the spike-trains x(t) and y(t), their Fourier
transforms X(x) and Y(x), and complex conjugates
X*(x) and Y*(x), the coherence is readily computed in
the frequency domain as:
CXY xð Þ ¼ PXX xð ÞffiffiffiffiffiffiffiffiffiffiffiffiffiffiffiffiffiffiffiffiffiffiffiffiffiffiffiffiffiPXX xð ÞPYY xð Þ
p ; ð9Þ
where PXX(x) = X(x) X*(x) is the power spectrum of x(t),
and PXY(x) = X(x) Y*(x) is the cross-spectrum of x(t) and
y(t). In this study, since both models produces spike output,
PXX(x), PYY(x) and PXY(x), were computed for the mean
spike trains using multi-taper estimation methods on
256 ms windows and discrete sequences every 64 ms over
the trial time span. Coherences were then computed from
trial-averaged spectra. We note that coherence is only
meaningful at frequencies with non-vanishing power.
In all our simulation results, the spiking activity of the
GPi cells reduces drastically as the synaptic conductances
strength increases. The mean firing rate recorded during
deep brain stimulation was 161 spikes/s, whereas with the
GABA input producing the most beneficial therapeutic
outcomes the mean firing rate was 40 spikes/s. Further-
more, the coherence reduction (CR) in Fig. 7 is in line with
recently findings by (Moran et al. 2012; Wilson et al. 2011)
and supports this hypothesis on declining coherence in
neuronal spiking activity within and between different
nuclei of the basal ganglia during STN macro-stimulation.
Our results are similar to those of (Moran et al. 2012), but
our explanations differ considerably. They saw a decline in
coherence during stimulation. They mainly attributed the
decline to the STN oscillatory decoupling from the GPi. In
our work we controlled for this synaptic coupling factor,
using a smaller parameter value \5% differences in
afferent synaptic currents gSTN?GPi rather than in large
currents (base value is 0.3 mS/cm2). This achieved similar
relative differences in intrinsic firing rates, and we still saw
a drop-off in coherence. Moreover, when the synaptic
coupling is extremely fast, the coupling tends to push the
neurons towards anti-synchrony (Skinner et al. 1994; Wang
and Rinzel 1992).
Effects of different conductances
Figure 5 illustrates the model cell dynamics in dependence
on synaptic conductance. One observes different effects on
the relay properties of TC cells. For an increase in synaptic
conductance, TC cells relay properties improve. Figure 6
illustrates the effects of the synaptic conductance on the
Fig. 5 Cellular activity
exhibited by the TC, STN and
GPi cell models for three
different synaptic conductance
levels. With an increase in
synaptic conductance, the relay
properties of TC cells improve
as can be seen on the EI and CV,
respectively. EI, CV(10) = 0.4241, 0.4851; EI, CV(20) = 0.3608, 0.5683; EI, CV(30) = 0.2089, 0.5333
Table 1 Averaged error index and coefficient of variation
Normal Parkinson Optimal DBS gsyn = 37.5
EI 0.0612 0.6265 0.1734 0.0949
CV 0.7318 0.6602 0.3087 0.3048
Cogn Neurodyn
123
Author's personal copy

relay properties of TC cells as quantified by the error index
(circles) and the coefficient of variation (stars). When
taking the average of both TC cell outputs, we found that
the EI decreased with increasing inhibition, resulting from
a decreasing number of incorrectly transmitted responses.
The coefficient of variation does not show a similar
tendency to decrease with synaptic connectivity; however
similarities with the error index cannot be taken much
further.
The mean frequency-domain coherogram in Fig. 7 over
50 trials is 0.4049 with �gsyn ¼ 37:5, whereas the average
coherence is 0.9921 when �gsyn ¼ 0. The model thus
exhibits a decreased coherence as the synaptic weight
parameter increases. Our numerical simulations show that
at gamma frequency 30–80 Hz, a significant synchrony is
observed, however, with heterogeneous cells, synchrony
may not be possible at all frequencies. In particular, a
network of this kind seems unlikely to support synchronous
firing at a frequency [200 Hz (Fig. 7). The advantage of
this approach is that an understanding of the complexity of
the nonlinear, interacting dynamics has been obtained
using previous theoretical insights on inhibitory network
dynamics.
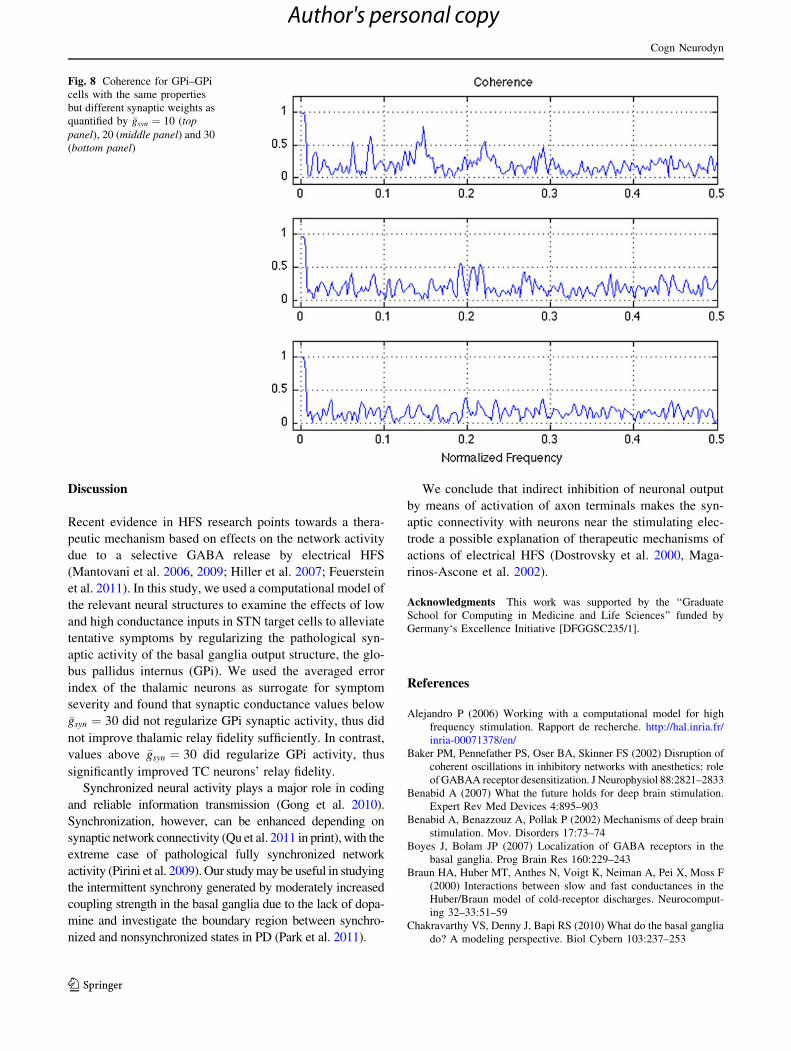
Figure 8 shows the mean coherence within the same
target nucleus of the GPi cell. Significant coherence is
found at a normalized frequency of 0.25 when shifting
zero-frequency component to center of spectrum whereas
between STN-GPi, it is found at 80 Hz. The response of
the network depends on the firing frequency and the time
constant of the synaptic weight. Coherence can be reduced
in two qualitatively different ways depending on the
parameters—either by increasing gradually the synaptic
weight coupling parameter, or through suppression, the
latter neurons with higher intrinsic rates fire near snchrony
and keep their slower counterparts from firing.
Fig. 6 Shows average error index EI (circles) of the two thalamic
cells and (CV) coefficient of variation (star) dependence of synaptic
conductance (Mayer et al. 2006). Dashed and solid lines consist of
linear interpolation representing lines (y = 0.6007 - 0.0120 9 x and
y = 0.6007 - 0.0120 9 x) best fit which best approximates EI and
CV respectively
Fig. 7 Mean coherence
measure in frequency domain
for GPi-STN cells (top panel)and the coherence reduction
(CR) over the synapic
conductances input (bottompanel)
Cogn Neurodyn
123
Author's personal copy
Discussion
Recent evidence in HFS research points towards a thera-
peutic mechanism based on effects on the network activity
due to a selective GABA release by electrical HFS
(Mantovani et al. 2006, 2009; Hiller et al. 2007; Feuerstein
et al. 2011). In this study, we used a computational model of
the relevant neural structures to examine the effects of low
and high conductance inputs in STN target cells to alleviate
tentative symptoms by regularizing the pathological syn-
aptic activity of the basal ganglia output structure, the glo-
bus pallidus internus (GPi). We used the averaged error
index of the thalamic neurons as surrogate for symptom
severity and found that synaptic conductance values below
�gsyn ¼ 30 did not regularize GPi synaptic activity, thus did
not improve thalamic relay fidelity sufficiently. In contrast,
values above �gsyn ¼ 30 did regularize GPi activity, thus
significantly improved TC neurons’ relay fidelity.
Synchronized neural activity plays a major role in coding
and reliable information transmission (Gong et al. 2010).
Synchronization, however, can be enhanced depending on
synaptic network connectivity (Qu et al. 2011 in print), with the
extreme case of pathological fully synchronized network
activity (Pirini et al. 2009). Our study may be useful in studying
the intermittent synchrony generated by moderately increased
coupling strength in the basal ganglia due to the lack of dopa-
mine and investigate the boundary region between synchro-
nized and nonsynchronized states in PD (Park et al. 2011).
We conclude that indirect inhibition of neuronal output
by means of activation of axon terminals makes the syn-
aptic connectivity with neurons near the stimulating elec-
trode a possible explanation of therapeutic mechanisms of
actions of electrical HFS (Dostrovsky et al. 2000, Maga-
rinos-Ascone et al. 2002).
Acknowledgments This work was supported by the ‘‘Graduate
School for Computing in Medicine and Life Sciences’’ funded by
Germany‘s Excellence Initiative [DFGGSC235/1].
References
Alejandro P (2006) Working with a computational model for high
frequency stimulation. Rapport de recherche. http://hal.inria.fr/
inria-00071378/en/
Baker PM, Pennefather PS, Oser BA, Skinner FS (2002) Disruption of
coherent oscillations in inhibitory networks with anesthetics: role
of GABAA receptor desensitization. J Neurophysiol 88:2821–2833
Benabid A (2007) What the future holds for deep brain stimulation.
Expert Rev Med Devices 4:895–903
Benabid A, Benazzouz A, Pollak P (2002) Mechanisms of deep brain
stimulation. Mov. Disorders 17:73–74
Boyes J, Bolam JP (2007) Localization of GABA receptors in the
basal ganglia. Prog Brain Res 160:229–243
Braun HA, Huber MT, Anthes N, Voigt K, Neiman A, Pei X, Moss F
(2000) Interactions between slow and fast conductances in the
Huber/Braun model of cold-receptor discharges. Neurocomput-
ing 32–33:51–59
Chakravarthy VS, Denny J, Bapi RS (2010) What do the basal ganglia
do? A modeling perspective. Biol Cybern 103:237–253
Fig. 8 Coherence for GPi–GPi
cells with the same properties
but different synaptic weights as
quantified by �gsyn ¼ 10 (toppanel), 20 (middle panel) and 30
(bottom panel)
Cogn Neurodyn
123
Author's personal copy

Deep-Brain Stimulation for Parkinson’s Disease Study Group (2001)
Deep-brain stimulation of the subthalamic nucleus or the pars
interna of the globus pallidus in parkinson’s disease. New Eng J
Med 345:956–963
Dostrovsky JO, Levy R, Wu JP, Hutchison WD, Tasker RR, Lozano
AM (2000) Microstimulation-induced inhibition of neuronal
firing in human globus pallidus. J Neurophysiol 84:570–574
Ermentrout B (2002) Simulating, analyzing, and animating dynamical
systems: a guide to XPPAUT for researchers and student. SIAM
Press, Philadelphia
Feuerstein TJ, Kammerer M, Lucking CH, Moser A (2011) Selective
GABA release as a mechanistic basic of high-frequency
stimulation used for the treatment of neuropsychiatric diseases.
Naunyn-Schmiedberg’s Arch Pharmacol. 384(1):1–20
Foster BL, Bojak I, Liley DTJ (2008) Population based models of
cortical drug response: insights from anaesthesia. Cogn Neuro-
dyn 2:283–296
Fox RF (1997) Stochastic versions of the Hodgkin-Huxley equations
Biophys. J. 72(5):2068–2074
Garcia L, D’Allexandro G, Bioulac B, Hammond C (2005) High
frequency stimulation in parkinson’s disease: more or less?
Trends Neurosci 28(4):209–216
Gerstner W, Kistler W (2002) Spiking neuron models. Single neurons,
populations, plasticity. Cambridge University Press, Cambridge
Gong HY, Zhang YY, Liang PJ, Zhang PM (2010) Neural coding
properties based on spike toming and pattern correlation of
retinal ganglia cells. Cogn Neurodyn 4:337–346
Guo Y, Rubin JE, McIntyre CC, Vitek JJ, Terman D (2008)
Thalamocortical relay fidelity varies across subthalamic nucleus
deep brain stimulation protocols in a data driven computational
model. J Neurophysiol 99:1477–1492
Higham DJ (2001) An algorithmic introduction to numerical simulation
of stochastic differential equations. SIAM Rev 43:525–546
Hiller A, Loeffler S, Haupt C, Litza M, Hofmann UG, Moser A
(2007) Electrical high frequency stimulation of the caudate
nucleus induces local GABA outflow in freely moving rats.
J. Neurosci Meth 159:286–290
Hutt A, Longtin A (2010) Effects of the anesthetic agent propofol on
neural populations. Cogn Neurodyn 4:37–59
Liu Y, Wang R, Zhang Z, Jiao X (2010) Analysis of stability of neural
network with inhibitory neurons. Cogn Neurodyn 4(1):61–68
Magarinos-Ascone C, Pazo JH, Macadar O, Buno W (2002) High-
frequency stimulation of the subthalamic nucleus silences
subthalamic nucleus: a possible cellular mechanism in parkin-
son’s disease. Neuroscience 115:1109–1117
Mantovani M, Van Velthoven V, Fuellgraf H, Feuerstein TJ, Moser A
(2006) Neuronal electrical high frequency stimulation enhances
GABA outflow from human neocortical slices. Neurochem Int
49:347–350
Mantovani M, Moser A, Haas AC, Zentner J, Feuerstein TJ (2009)
GABAA autoreceptors enhance GABA release from human
neocortex: towards a mechanism for high-frequency stimulation
(HFS) in Brain? Naunyn-Schmiedberg’s Arch Pharmacol
380:45–58
Mayer J, Schuster HG, Claussen JC (2006) The role of inhibitory
feedback for information processing in thalamocortical circuits.
Phys Rev E 73:031908
McIntyre CC, Savasta M, Walter LB, Vitek JL (2004) How does deep
brain stimulation work? Present understanding and future
questions. J Clin Neurophys 21:40–50
Moran A, Stein E, Tischler H, Bar-Gad I (2012) Decoupling neuronal
oscillations during subthalamic nucleus stimulation in the
parkinsonian primate. Neurobiol Disease 45:583–590
Njap F, Claussen JC, Moser A, Hofmann UG (2011) Comparing
realistic subthalamic nucleus neuron models. AIP Conf Proc
1371:102–109
Olanow W, Brin M, Obeso J (2000) The role of deep brain
stimulation as a surgical treatment for parkinson’s disease.
Neurology 55(6):S60–S66
Park C, Worth RM, Rubchinsky LL (2011) Neural dynamics in
parkinson brain: the boundary between synchronized and
nonsynchronized dynamics. Phys Rev E 83:042901
Pirini M, Rocchini L, Sensi M, Chiari L (2009) A computational
modeling approach to investigate different targets in deep brain
stimulation for parkinson’s disease. J Comput Neurosci 26:
91–107
Qu J, Wang R, Du Y, Cao J (2011) Synchronization study in ring-like
and grid-like neuronal networks. Cogn Neurodyn. doi:10.10
07/s11571-011-9174-9
Rubin JE, Terman D (2004) High frequency stimulation of the
subthalamic nucleus eliminates pathological thalamic rhythmic-
ity in a computational model. J Comput Neurosci 16:211–223
Skinner F, Kopell N, Mardr E (1994) Mechanisms for oscillations and
frequency control in network of mutually inhibitory relaxation
oscillators. J Comp Neurosci 1:69–87
Wang X-J, Rinzel J (1992) Alternating and synchronous rythms in
reciprocally inhibitory model neurons. Neural Comp 4:84–97
White J, Chow C, Ritt J, Soto-Trevino C, Kopell N (1998)
Synchronization and oscillatory dynamics in heterogeneous,
mutually inhibited neurons. J Comput Neurosci 5:5–16
Wilson CJ, Beverlin B II, Netoff T (2011) Chaotic desynchronization
as the therapeutic mechanism of deep brain stimulation. Front
Syst Neurosci 5:50. doi:10.3389/fnsys.2011.00050
Cogn Neurodyn
123
Author's personal copy