On the stabilization by fixation of configurational states in beef heart mitochondria
Upload
independentCategory
view
6download
0
lable at ScienceDirect
Polymer 51 (2010) 5833e5845
Contents lists avai
Polymer
journal homepage: www.elsevier .com/locate/polymer
Modeling diffusion-control in the cure kinetics of epoxy-amine thermoset resins:An approach based on configurational entropy
Silvia Corezzi a,*, Daniele Fioretto a, Giovanni Santucci b, Josè M. Kenny b
aDipartimento di Fisica, Università di Perugia, Via A. Pascoli, I-06100 Perugia, ItalybMaterials Engineering Center, Università di Perugia, Loc. Pentima Bassa, I-05100 Terni, Italy
a r t i c l e i n f o
Article history:Received 31 May 2010Received in revised form29 September 2010Accepted 29 September 2010Available online 8 October 2010
Keywords:Diffusion-controlKineticsEpoxy
* Corresponding author. Tel.: þ39 0755852799; faxE-mail address: [email protected] (S. Co
0032-3861/$ e see front matter � 2010 Elsevier Ltd.doi:10.1016/j.polymer.2010.09.073
a b s t r a c t
In this study we propose a new equation to describe the effect of diffusional limitations on the curekinetics of epoxy-amine resins, based on (i) modeling the average diffusion coefficient D via a powerelawrelationship with the structural relaxation time s (i.e. Dsx ¼ const, with x a fractional exponent) and(ii) describing the increase of s with the advancement of reaction in terms of configurational entropyreduction driven by covalent bond formation. The approach proposed reconciles the description of thediffusion-controlled kinetics with the configurational entropy-based description of the structuraldynamics near vitrification, already applied successfully to epoxy-amine polymerization. The modelequation is built on a modified version of the Kamal equation where the initial ratio of amino hydrogensto epoxy groups appears explicitly, in addition to the exponents m and n giving the effective order ofreaction. Replacing each chemical rate constant with an overall diffusion-corrected one, allows us todescribe the full polymerization process. A comparison with experimental data indicates that, contrary towhat assumed in the literature, the effect of diffusional limitations cannot be properly described byassuming the diffusion coefficient to be inversely proportional to the relaxation time (x ¼ 1). Rather, wefind that for many systems the fractional exponent x takes values very close to the parameter b thatmeasures the stretching of the relaxation function. Concerning the chemically intrinsic parameters, it isfound that the rate constants kc1 and kc2 for all the systems scale onto a master-curve corresponding tothermally activated behavior with, surprisingly, the same activation energy for the non-catalytic andautocatalytic process. Moreover, m and n assume approximately constant values, independent of thetemperature and molar ratio of the mixture, with m z 1 and n in the range between 1 and 2. Althoughthese results contradict other reported findings and the widespread belief that the autocatalytic processhas a lower activation energy, they are consistent with the expectation that a similar mechanismunderlies the general reaction between epoxy group and amino hydrogen, and thatm and n are related tothe intrinsic reaction mechanism. The new modeling also removes some evident discrepancies amongresults from different studies.
� 2010 Elsevier Ltd. All rights reserved.
1. Introduction
In order that a chemical reaction may occur, two molecules haveto diffuse distances comparable to the intermolecular distancesbefore the reactive sites on them can collide and eventually bond.Therefore, the kinetics of reaction is sensitive both to the intrinsicrate of the chemical reaction process between molecules being atcontact and to transport limitations of the molecules bearing thereactive sites. If the reactants may considerably diffuse within thetime required for bonding, the rate of reaction depends only on
: þ39 07544666.rezzi).
All rights reserved.
the concentrations and intrinsic reactivities of the reactive sites,with rate constants which are independent of the extent of reaction(chemically-controlled limit). If the transport of reactants is limitedby a low diffusion coefficient, the rate of reaction is controlledmostly by the probability of encounter between the reacting pairs(diffusion-controlled limit). It often happens that a transition fromchemically-controlled to diffusion-controlled limit occurs graduallyas the reaction product decreases the diffusivities in the system.Many thermoset materials of widespread use such as epoxy-amineresins are the result of reactions where such crossover takes place[1e3].
The epoxy-amine cure progressively transforms an initially fluidsmall-molecule mixture into an insoluble network, which is typi-cally solid. In the early stages of cure, when the system consists
S. Corezzi et al. / Polymer 51 (2010) 5833e58455834
mainly of monomers and oligomers, the reactions are chemicallycontrolled. As the reacting entities become bigger in size, diffusionaleffects begin to play a role in the kinetics. At high extents of reaction,the rate of polymerization is primarily determined by the masstransfer of the reactants. Therefore, modeling the cure kinetics ofepoxy thermosets requires not only an accurate description of thereaction kinetics in absence of diffusional limitations but alsoa proper description of how diffusional limitations intervene ata later stage. With a good model, valid over the entire range of cure,it is possible to predict how the systemwill behave during cure andwhat its final condition will be, and consequently to optimize theprocessing conditions and control the performance of the finalproduct. Indeed, the most striking effect of the attainment of thediffusion-control is that the reaction stops before full conversion ofthe reactants and dangling ends in the polymer network survive tothe curing process, which can provide the poor mechanical prop-erties of the product of reaction [4] and the ageing of the resinduring its service life.
Despite several attempts made, there is still much scope formodeling diffusion-control in the cure kinetics of epoxy-aminethermosets. In this work, we propose a new modeling based on theconfigurational entropy approach employed to study chemical vitri-fication in epoxy-amine systems [5e7], which markedly improvesthe agreement with experimental data and provides new significantinformation. The paper is organized as follows. Sec. 2 recalls themainequations used to describe the chemically-controlled regime ofepoxy-amine cure, and the main approaches to modify these equa-tions in the diffusion-controlled regime of the reaction. Sec. 3describes the new kinetic model. In Sec. 4e6 we test the modelequation against a large number of epoxy-amine systems and discussthe implicationsof the resultsobtained.A summaryandfinal remarksare presented in Sec. 7.
2. Background
2.1. Chemically-controlled regime
The chemistry involved in the epoxy-amine curing process israther complex [8e11], with several reactions participating in thenetwork formation: addition of the primary and secondary aminogroups to the epoxy ring, reaction between an epoxy ring anda hydroxyl group of the forming products (etherification), andhomopolymerization of epoxide. The mechanism of the mentionedindividual partial reactions, whose relative importance depends onthe curing conditions and the type of the epoxy-amine system, maybe rather complicated, with the formation of various reactive orunreactive intermediary complexes [9,12e15]. Cyclization (i.e.formation of rings by intramolecular reactions) and substitutioneffects (i.e. dependent reactivity of a functional group on thereaction state of a neighboring functionality) may also be operativeto a different extent depending on the character of the reagents.Moreover, for the addition of an amine to the epoxide (the stronglypredominating reaction) two different reaction pathways, autoca-talyzed by hydroxyl groups formed in the reaction and catalyzed byimpurities initially present in the system, have to be considered. Asa result of this complexity, it is almost impossible to describerigorously the overall reaction mechanism of the system epoxide-amine, and existing kinetic models based on mechanistic consid-erations always involve certain assumptions and approximationswhich adjust the models to fit certain systems better than others.
Horie et al. translated a simplified reaction scheme into a simplekinetic equation [16]
da=dt ¼ ðk1 þ k2aÞð1� aÞðr � aÞ (1)
where a is the conversion of epoxy groups, k1 and k2 are respec-tively the non-catalytic and the autocatalytic rate constants, andr^ [H0]/[E0] is the ratio of amino hydrogens to epoxy groups in theinitial mixture. This equation takes into account the autocatalyticnature of the two-step epoxy-amine reaction and the possibility ofstoichiometric unbalance of the mixture, but disregards the possi-bility of other reactions as well as of unequal reactivities of primaryand secondary amino hydrogens. Cole et al. [17,18] extended themodel to explicitly take into account the etherification reaction, butthey had to retain the assumption of equal reactivities in order toobtain an exact solution. Attempts to include in the kineticdescription less simplified reaction schemes complicate the math-ematics considerably [19].
Semiempirical approaches, based on the modification of kineticexpressions that had been derived under simplifying assumptions,provide an alternative in favor of obtaining a good fit to the data ina large number of systems and in awide range of curing conditions,at the expenses of the possibility of giving all the fit parametersa direct interpretation. The best-known equation to model caseswhere Eq. (1) is inadequate was proposed by Kamal and coworkers[20,21]
da=dt ¼ ðk1 þ k2amÞð1� aÞn (2)
Herem and n are empirical factors, withmþ n known as the overallreaction order. Letting the exponents m and n be temperature-dependent and assume fractional values, makes this equation moreflexible than Eq. (1) and other more sophisticated equations[22e28].
2.2. Diffusion-controlled regime
While the adjustment of several parameters of the previouskinetic models allows one to obtain a good fit to experimental datain the first stages of reaction, systematic deviations are observed athigh levels of conversion. In this region, the mobility of unreactedgroups is more and more hindered due to molecular-size effectsand the decreasing rate at which they diffuse within the bulk inturn decreases the rate at which they react. The resulting negativefeedback between the physical process of diffusion and the chem-ical process of bonding brings both processes to vanishing levels,even if reaction has not reached its full extent.
The diffusion-control in the kinetics of cure is intimately con-nected with the slowing down of molecular motions leading toa frozen structure, and hence to the system vitrification [29].Indeed, most of the approaches that have been used to describe thecure in the diffusion-controlled regime are inspired by glass tran-sition theories, although a general consensus on the most appro-priate way to do it is lacking.
A first approach considers the rate of polymerization to vanishat vitrification and introduces in Eq. (2) the maximum achievableconversion amax as a phenomenological parameter [30]. Otherapproaches account for the reduced but still not negligible diffusionin the glassy state by introducing a rate constant for diffusion kd,whose combination with the chemical rate of reaction producesa continuous cure-dependent reduction of the overall reaction ratealso beyond the vitrification point. The models proposed in theliterature differ in the way in which they combine kd with thechemical reaction rate, and for the expression used to describethe dependence of kd on a.
Concerning the first issue, many authors have assumed that inthe later stages of curing the rate of reaction da/dt becomes multi-plied by an a-dependent factor, f ðaÞ ¼ 1=½1þ expðDða� acÞÞ�,where ac is a critical conversion andD is a constant that depends onthe structure, system and curing temperature. The expression for

S. Corezzi et al. / Polymer 51 (2010) 5833e5845 5835
f(a) was originally derived by assuming that (i) da/dt can be factor-ized into an a-dependent term and an Arrhenius term kc(T), thelatter representing the chemically-controlled rate constant; (ii) thediffusion rate constant can bewritten as kd ¼ kcexp½�Dða� acÞ�, asproposed by Chern and Poehlein [31]; (iii) kc and kd combine intoan overall rate constant given by kðaÞ�1 ¼ k�1
c þ k�1d , according to
the Rabinowitch model for small-molecule reactions [32]. Underthese conditions, the normalized quantity k(a)/kc ¼ f(a) provides ana-dependent correction to da/dt that makes it equally applicable tothe chemically and diffusion-controlled regime. However, becausethe chemical kinetic equations used for modeling the epoxy-aminereaction cannot be factorized according to the point (i), and theexpressionof ChernandPoehlein [31] is basedon the approximationthat the reciprocal free volume, or alternatively the glass transitiontemperature Tg varies linearly with a d which is clearly incorrectover awide range of ad the use of thementioned procedure shouldbe only considered as an empirical practice. Other empiricalexpressions for f(a) have also been employed [33].
Another strategy has been to consider that each rate constant ki(i ¼ 1,2) that appears in the chemical kinetic equation, for examplein Eq. (1) or Eq. (2), is itself the result of a chemical and a diffusionalcontribution combined together according to the Rabinowitchmodel [32]
k�1i ¼ k�1
ci þ k�1d (3)
Here, kci (i ¼ 1,2) is the intrinsic rate constant which is given by thechemistry of the system, and kd is the rate coefficient for a systemwith no chemical barriers where reactions occur upon collision offunctional groups. This last coefficient depends on the diffusiontime scale of the system, that is an average parameter to which allthe monomeric units contribute independently of the chemicalprocess in which they are eventually involved. Eq. (3) simply statesthat the time required to form a new bond (through the autocat-alytic or the non-catalytic pathway of reaction) is the sum of theamount of time required for two molecules of any size to approacheach other plus the time required in order that repeated collisionsbetween nearby molecules (assisted or not by hydroxyl groups)become fruitful to bond a reactive pair. Due to the parallel sum of kciand kd, Eq. (3) represents control by chemical reaction in the earlystages of reaction, when the system consists mainly of monomersand oligomers and the particle mobility is high (kd[kci, hencekizkci), and represents control by diffusion at high extents ofreaction, when the molecular-size dependence of the diffusioncoefficient limits the reactivity of unreacted groups (kd � kci, hencekiz kd). It should be noted that according to Eq. (3) the time scale ofdiffusion effects, k�1
d , is the same for the autocatalytic and the non-catalytic process, and hence the onset of diffusion-control occursearlier for the major (autocatalytic) reaction. Indeed, within suchapproach, the effects of diffusion on the rate constant of the minor(non-catalytic) reaction have sometimes been completely neglec-ted [34].
Concerning the a dependence of kd, it is generally assumed tovary with a in the same manner as the average diffusion coefficientD of the reacting entities, kd(a) w D(a), consistently with the factthat the time scale k�1
d should be associated with the averagediffusion time. As the relation between D and a is not known, it isassumed to be the same as s�1, with s the structural relaxation time,i.e.D(a)w s�1(a). Several expressions for s(a) have been considered.Johari and coworkers [35] have used an empirical equation, sw exp(Sap), where S and p are temperature and system dependentparameters. Other authors have derived an expression by incorpo-rating the a dependence of the glass transition temperature into anexpression relating s and Tg. Either empirical [34] or semiempiricalTg(a) expressions [36e40] have been inserted in phenomenological
s(Tg) relations [41e43] (e.g. theWilliamseLandeleFerry relation) orin equations inspired by glass transition theories (e.g. the freevolume theory [31,44e46], and the configurational entropy theory[47]).
It has to be pointed out that the assumptionDw s�1dwhichwerefer to as DebyeeStokeseEinstein (DSE) relation d follows fromcombining together the StokeseEinstein (SE) and DebyeeStokes(DS) equations, the former predicting that the translational diffusioncoefficient of a particle in amedium of viscosity h and temperature Tis D w T/h, and the latter predicting that the rotational correlationtime of the particle is s w h/T. As such, there are certain limitationsto this assumption that might have an effect on the description ofthe diffusion-controlled kinetics. One limitation is due to the factthat the DS relationship between s and h does not apply to network-forming thermosets [48,49]. Another limitation arises because theDSE relationship between translational diffusion and rotationalrelaxation is derived within the theory of macroscopic hydrody-namics, and consequently D and s should refer to a macroscopicparticle diffusing in a continuous medium. Although the SE and DSequations have been found to be well verified in ordinary liquidsand inmany simple glass-forming fluids, irrespective of the fact thatthey should be strictly valid for particles larger than the surroundingmolecules, the existence of appreciable deviations from the expec-ted behavior in high viscosity fluids close to the glass transition hasbeen documented by a number of experimental works [50e58].When these equations fail, their modification by the introduction ofa fractional exponent has been found to correlate successfully theexperimental data in many cases. Similar considerations areimplicitly accounted for in thework by Deng andMartin [59], wherethe relationship between the overall diffusion coefficient D and the(dipole) rotational relaxation time s during polymerization iswritten as a powerelaw
Dsx ¼ const (4)
with x a constant independent of conversion and reactiontemperature. The central point in the diffusion model of Deng andMartin [59] is that the fractional exponent x is the same relating sand sx�1
n , with s the ionic conductivity and xn the number-averagedegree of polymerization, and hence x may be determined bymeans of dielectric measurements of ion conductivity and dipolerelaxation time performed during the reaction.
Since a re-examination of this point plays an important role inthe model presented in the next section, it is worth having a closerlook at the reasoning of Deng and Martin [59], which consists oftwo fundamental steps. In the first step they correlate themonomerdiffusion to the overall diffusion. Assuming that the diffusioncoefficient of any molecule in a system polymerizing by a stepwisemechanism is inversely proportional to its size d the so-calledStokesian limit of diffusion d the overall diffusion coefficient, orthe average diffusion coefficient of monomer unit, is formallywritten as D ¼ Dmx�1
n , where Dm is the diffusion coefficient ofmonomer. In the second step they correlate the monomer diffusionto the diffusion of ionic species present in the cure system.Assuming the validity of the SE equation, the ratio of the monomerdiffusion coefficient to the diffusion coefficient of ions, Dm/Di, istaken to be the ratio of the sizes of ions to that of monomer, andtreated as a constant during an isothermal cure. Since Di w s
according to the Einstein relationship, the diffusion coefficient ofmonomer would be proportional to the ionic conductivity, Dm w s.Combining gives sx�1
n sx ¼ const, which in principle allows todetermine the exponent x from the plot of logðsx�1
n Þ against s. Acritical evaluation of such procedure requires an analysis of thevalidity of the assumptions made in each step of the abovereasoning. Concerning the first step, recent simulation data of step-

S. Corezzi et al. / Polymer 51 (2010) 5833e58455836
growth polymerization show that the expression D ¼ Dmx�1n
provides an excellent modeling to D over the entire reaction,despite the assumption of Stokesian diffusion proves incorrect [60].In the second step, instead, the result Dm w s is obtained withina hydrodynamic model and could be replaced by a fractionalanalogue, on the lines of what is done in the case of other mobility-related properties [50e58]. Consequently, the fractional exponent xrelating s and D in Eq. (4) would differ from that relating s and s.
Indeed, the kinetic model constructed by inserting into theRabinowitch model (Eq. (3)) the diffusion coefficient determinedfrom Eq. (4) d with x fixed to the value obtained from the exper-imental data of s and s d is able to capture the essentials of thediffusion-controlled kinetics during the cure of a thermosettingpolymer, but still describes a change too fast of the conversion ratewhen approaching the glass transition, producing a non-negligibledeviation from the experimental data [34]. This indicates thata better modeling of molecular diffusion is required, which may bethe key ingredient to properly describe the diffusion-controlledkinetics in reacting systems.
3. Kinetic model
The classical Kamal equation (Eq. (2)) represents the modelmost often used to describe the chemical kinetics of thermosetresins on a semiempirical basis, since the presence of the variableexponents m and n ensures a good level of adaptability of theequation and usually makes it able to compensate for the effect ofvarious reactions which are not taken explicitly into account in thederivation of the model case withm ¼ 1 and n ¼ 2 (Horie equation,Eq. (1)). The effect of a stoichiometric unbalance of epoxy andamino groups (rs1) has generally been incorporated into thevalues of m and n, and Eq. (2) has been applied both to stoichio-metric and non-stoichiometric cases without distinction. In thepresent work, we retain a semiempirical approach, but we adoptthe following modification to the Horie equation
da=dt ¼ ðk1 þ k2amÞð1� aÞn=2ðr � aÞn=2 (5)
where the exponent n is equally distributed between the last twofactors in the right-hand side. This equation contains explicitly thestoichiometric ratio r without introducing extra parameters withrespect to the Kamal equation, to which it reduces in the stoi-chiometric case, r¼ 1. The advantages of using Eq. (5) in place of Eq.(2) will be discussed in Sec. 6.
Like Eq. (2), Eq. (5) with k1 and k2 taken as constant valuesthroughout the reaction is typically able to reproduce the evolutionof a(t) up to 60�70% of its final value, and even more for hightemperatures of cure. However, beyond a certain point it generallyoverestimates the experimental data, as the reaction becomesdiffusion-controlled. To describe the effects of a reduced moleculardiffusion on the rate of reaction we use diffusion-corrected rateconstants, as given by Eq. (3). The resulting kinetic model wouldaccount for chemically and diffusion-controlled reactions and alsothe crossover between the two, provided that an appropriateexpression for kd(a) w D(a) is given.
As mentioned in the previous section, equations taken as suchfrom the theory of macroscopic hydrodynamics are often inade-quate to model diffusion in high viscosity fluids when approachingmolecular length scales. Therefore, we agree with Deng and Martin[59] that the relationship between the overall diffusion coefficientof the molecules participating in the reaction and the structuralrelaxation time may be better written as a powerelaw, Dsx ¼ const,where x is a fractional exponent which is constant during cure,rather than as an inverse proportionality, Ds ¼ const. However, onthe basis of the considerations presented in the previous section
the exponent x is expected to differ from that obtained from theexperimentally observed relationship between s and sx�1
n , andconsequently we release any constraint on the value of x.
Now, in order to define kd(a) it remains to give an expression fors(a). In recent studies of epoxy-amine systems we have shown thatthe increase of the structural relaxation time during step-growthpolymerization can be successfully rationalized in terms ofconfigurational entropy reduction, controlled by the increasingnumber of covalent bonds between the reacting molecules [5e7].The model provides the a dependence of s as
s ¼ s0exp�
Baa0 � a
�(6)
where s0 and B are system dependent parameters, the formerapproximately independent of both T and a and the latter onlydependent on T, while a0 is a parameter that, in the appropriatea and T range [61], is only determined by the molar ratio andfunctionality of the reagents in the mixture, according to a0 ¼ 1=f ,where f is the average epoxy functionality. According to Eq. (6), theprogressive slowdown of the dynamics during cure stronglyresembles the classical vitrification process of supercooling, witha rapidly increasing and apparently diverging relaxation time athigh conversions.
Substitution of Eq. (6) in Eq. (4) yields for kd(a) w D(a) thefollowing expression
kd ¼ k0exp�� xBaa0 � a
�(7)
where k0, x, B and a0 are constants. The parameters B and a0 are thesame describing the behavior of the structural relaxation time.
The concept underlying this equation is that reducing thenumber of configurations available to the system not only increasesthe time needed by the molecules to relax, but also decreases theirability to move through the sample. However, the movementsrequired to perform a structural rearrangement may differ from themovements required to diffuse, and then the configurations avail-able to the system may not be equally effective to the twoprocesses. In the terms of the Adam-Gibbs theory [62], the criticalconfigurational entropy s*c of the smallest cooperative subsystemthat can perform a transition into another configuration ‘effective’to the process, as well as the potential energy barrier hindering therearrangement, will be different for the relaxation and the diffusionprocesses. As the average transition probability is given byWwexpð�Dms*c=kBTScÞ d where Sc is the molar configurationalentropy of the macroscopic sample, and Dm is largely the potentialenergy hindering the cooperative transition per mole of rearrang-ing units d the value of the fractional exponent x is given by theratio of Dms*c for the diffusion and the relaxation processes.
Eq. (5) with k1 and k2 determined by Eq. (3) and kd given by Eq.(7) represents the full version of the diffusion-controlled kineticmodel used in the present work. For further use we write itexplicitly as
dadt
¼24 kc1
1þkc1k0exp
�xBaa0�a
�þ kc2
1þkc2k0exp
�xBaa0�a
�am35ð1�aÞn=2ðr�aÞn=2
(8)
4. Experimental section
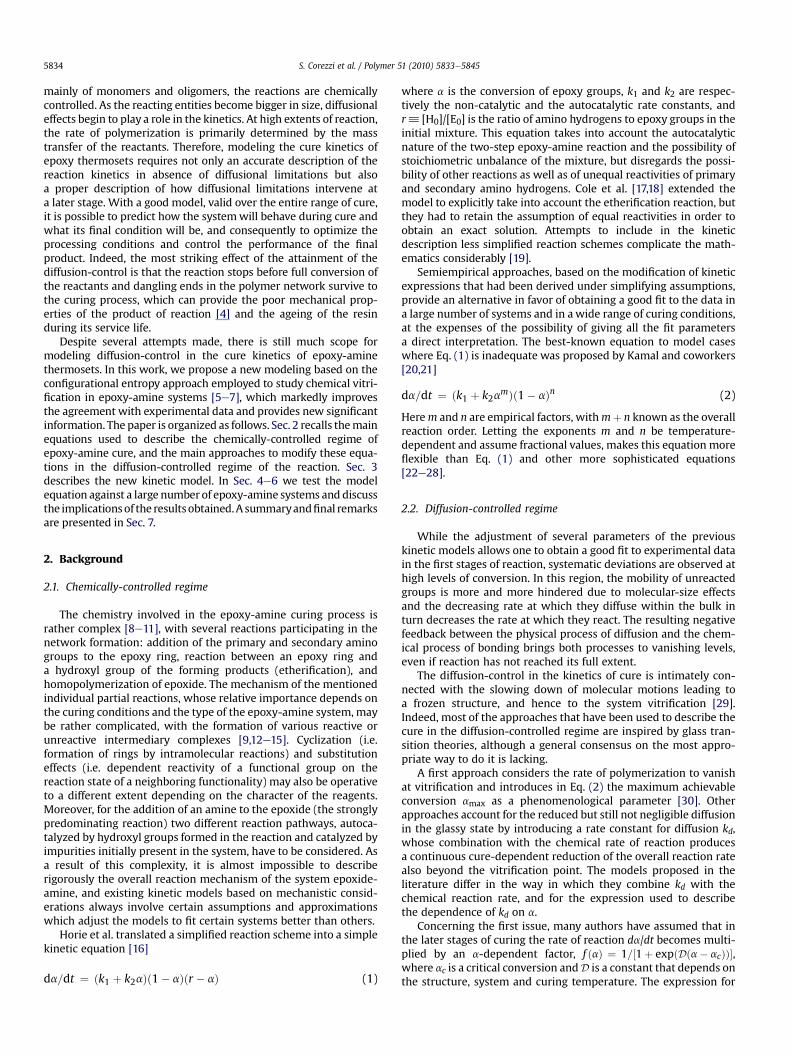
We test the model Eq. (8) by analyzing the kinetic data of manydifferent epoxy-amine systems. Most of them are taken from theliterature. Table 1 lists the chemicals involved in the studied
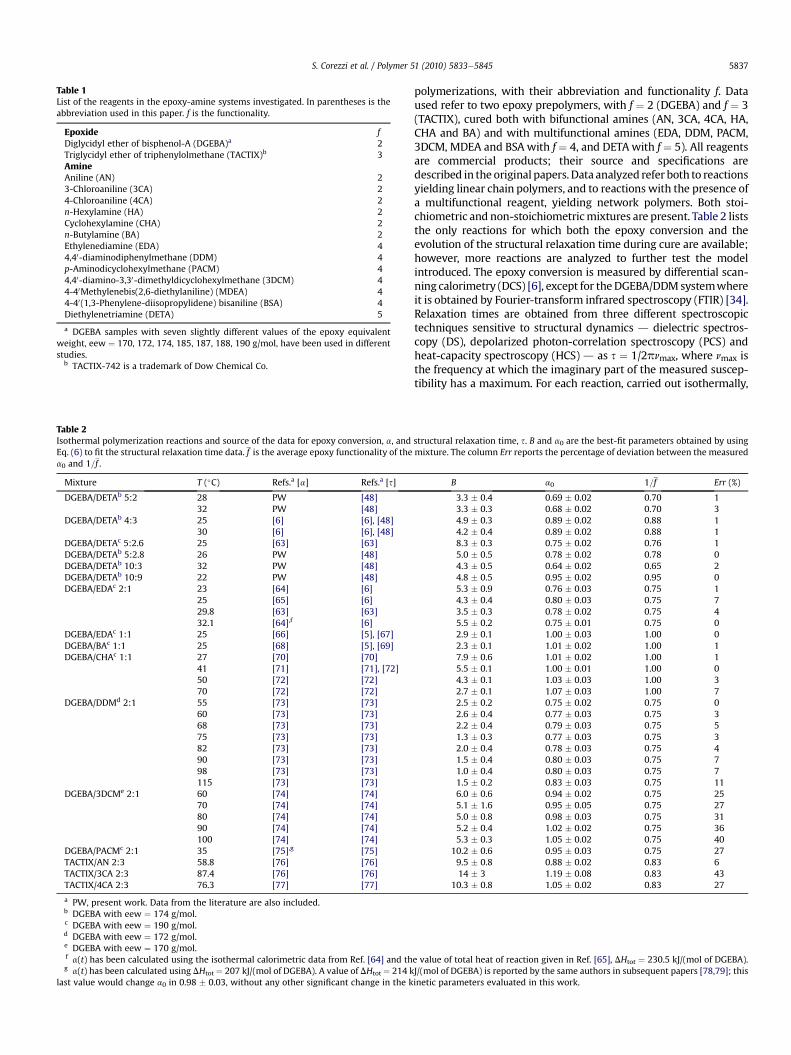
Table 1List of the reagents in the epoxy-amine systems investigated. In parentheses is theabbreviation used in this paper. f is the functionality.
Epoxide fDiglycidyl ether of bisphenol-A (DGEBA)a 2Triglycidyl ether of triphenylolmethane (TACTIX)b 3AmineAniline (AN) 23-Chloroaniline (3CA) 24-Chloroaniline (4CA) 2n-Hexylamine (HA) 2Cyclohexylamine (CHA) 2n-Butylamine (BA) 2Ethylenediamine (EDA) 44,40-diaminodiphenylmethane (DDM) 4p-Aminodicyclohexylmethane (PACM) 44,40-diamino-3,30-dimethyldicyclohexylmethane (3DCM) 44-40Methylenebis(2,6-diethylaniline) (MDEA) 44-40(1,3-Phenylene-diisopropylidene) bisaniline (BSA) 4Diethylenetriamine (DETA) 5
a DGEBA samples with seven slightly different values of the epoxy equivalentweight, eew ¼ 170, 172, 174, 185, 187, 188, 190 g/mol, have been used in differentstudies.
b TACTIX-742 is a trademark of Dow Chemical Co.
Table 2Isothermal polymerization reactions and source of the data for epoxy conversion, a, andEq. (6) to fit the structural relaxation time data. f is the average epoxy functionality of thea0 and 1=f .
Mixture T (�C) Refs.a [a] Refs.a [s]
DGEBA/DETAb 5:2 28 PW [48]32 PW [48]
DGEBA/DETAb 4:3 25 [6] [6], [48]30 [6] [6], [48]
DGEBA/DETAc 5:2.6 25 [63] [63]DGEBA/DETAb 5:2.8 26 PW [48]DGEBA/DETAb 10:3 32 PW [48]DGEBA/DETAb 10:9 22 PW [48]DGEBA/EDAc 2:1 23 [64] [6]
25 [65] [6]29.8 [63] [63]32.1 [64],f [6]
DGEBA/EDAc 1:1 25 [66] [5], [67]DGEBA/BAc 1:1 25 [68] [5], [69]DGEBA/CHAc 1:1 27 [70] [70]
41 [71] [71], [72]50 [72] [72]70 [72] [72]
DGEBA/DDMd 2:1 55 [73] [73]60 [73] [73]68 [73] [73]75 [73] [73]82 [73] [73]90 [73] [73]98 [73] [73]115 [73] [73]
DGEBA/3DCMe 2:1 60 [74] [74]70 [74] [74]80 [74] [74]90 [74] [74]100 [74] [74]
DGEBA/PACMc 2:1 35 [75],g [75]TACTIX/AN 2:3 58.8 [76] [76]TACTIX/3CA 2:3 87.4 [76] [76]TACTIX/4CA 2:3 76.3 [77] [77]
a PW, present work. Data from the literature are also included.b DGEBA with eew ¼ 174 g/mol.c DGEBA with eew ¼ 190 g/mol.d DGEBA with eew ¼ 172 g/mol.e DGEBA with eew ¼ 170 g/mol.f a(t) has been calculated using the isothermal calorimetric data from Ref. [64] and thg a(t) has been calculated using DHtot ¼ 207 kJ/(mol of DGEBA). A value of DHtot ¼ 214 k
last value would change a0 in 0.98 � 0.03, without any other significant change in the k
S. Corezzi et al. / Polymer 51 (2010) 5833e5845 5837
polymerizations, with their abbreviation and functionality f. Dataused refer to two epoxy prepolymers, with f ¼ 2 (DGEBA) and f ¼ 3(TACTIX), cured both with bifunctional amines (AN, 3CA, 4CA, HA,CHA and BA) and with multifunctional amines (EDA, DDM, PACM,3DCM, MDEA and BSAwith f ¼ 4, and DETAwith f ¼ 5). All reagentsare commercial products; their source and specifications aredescribed in the original papers. Data analyzed refer both to reactionsyielding linear chain polymers, and to reactions with the presence ofa multifunctional reagent, yielding network polymers. Both stoi-chiometric and non-stoichiometricmixtures are present. Table 2 liststhe only reactions for which both the epoxy conversion and theevolution of the structural relaxation time during cure are available;however, more reactions are analyzed to further test the modelintroduced. The epoxy conversion is measured by differential scan-ning calorimetry (DCS) [6], except for theDGEBA/DDMsystemwhereit is obtained by Fourier-transform infrared spectroscopy (FTIR) [34].Relaxation times are obtained from three different spectroscopictechniques sensitive to structural dynamics d dielectric spectros-copy (DS), depolarized photon-correlation spectroscopy (PCS) andheat-capacity spectroscopy (HCS) d as s ¼ 1/2pnmax, where nmax isthe frequency at which the imaginary part of the measured suscep-tibility has a maximum. For each reaction, carried out isothermally,
structural relaxation time, s. B and a0 are the best-fit parameters obtained by usingmixture. The column Err reports the percentage of deviation between the measured
B a0 1=f Err (%)
3.3 � 0.4 0.69 � 0.02 0.70 13.3 � 0.3 0.68 � 0.02 0.70 34.9 � 0.3 0.89 � 0.02 0.88 14.2 � 0.4 0.89 � 0.02 0.88 18.3 � 0.3 0.75 � 0.02 0.76 15.0 � 0.5 0.78 � 0.02 0.78 04.3 � 0.5 0.64 � 0.02 0.65 24.8 � 0.5 0.95 � 0.02 0.95 05.3 � 0.9 0.76 � 0.03 0.75 14.3 � 0.4 0.80 � 0.03 0.75 73.5 � 0.3 0.78 � 0.02 0.75 45.5 � 0.2 0.75 � 0.01 0.75 02.9 � 0.1 1.00 � 0.03 1.00 02.3 � 0.1 1.01 � 0.02 1.00 17.9 � 0.6 1.01 � 0.02 1.00 15.5 � 0.1 1.00 � 0.01 1.00 04.3 � 0.1 1.03 � 0.03 1.00 32.7 � 0.1 1.07 � 0.03 1.00 72.5 � 0.2 0.75 � 0.02 0.75 02.6 � 0.4 0.77 � 0.03 0.75 32.2 � 0.4 0.79 � 0.03 0.75 51.3 � 0.3 0.77 � 0.03 0.75 32.0 � 0.4 0.78 � 0.03 0.75 41.5 � 0.4 0.80 � 0.03 0.75 71.0 � 0.4 0.80 � 0.03 0.75 71.5 � 0.2 0.83 � 0.03 0.75 116.0 � 0.6 0.94 � 0.02 0.75 255.1 � 1.6 0.95 � 0.05 0.75 275.0 � 0.8 0.98 � 0.03 0.75 315.2 � 0.4 1.02 � 0.02 0.75 365.3 � 0.3 1.05 � 0.02 0.75 40
10.2 � 0.6 0.95 � 0.03 0.75 279.5 � 0.8 0.88 � 0.02 0.83 614 � 3 1.19 � 0.08 0.83 43
10.3 � 0.8 1.05 � 0.02 0.83 27
e value of total heat of reaction given in Ref. [65], DHtot ¼ 230.5 kJ/(mol of DGEBA).J/(mol of DGEBA) is reported by the same authors in subsequent papers [78,79]; thisinetic parameters evaluated in this work.

S. Corezzi et al. / Polymer 51 (2010) 5833e58455838
experimental data of s as function of conversion are fitted by Eq. (6),with s0, B and a0 as free parameters (see, for instance, Fig. 1(b)). Thevalues of B and a0 obtained from the fit are listed inTable 2 for the setof the 35 polymerizations studied.
5. Data analysis
As an example, Fig. 1(a) and (b) show the data of epoxyconversion and of relaxation time as function of conversion for theDGEBA/DETA system, studied both in stoichiometric (molar ratio5:2) and non-stoichiometric composition (molar ratios 10:3, 5:2.8,4:3,10:9) at different temperatures. It can be seen in Fig.1(a) that forall themixtures the rate of polymerization increases during the firststage of reaction and then progressively decreases, revealing theautocatalytic nature of the reaction. The temperature, at the valuesindicated, has only an effect on the rate of polymerization of a givenmixture, without significantly changing the plateau value of theconversion curve; instead, the epoxy-amine ratio has a systematiceffect on the maximum value of conversion achieved by differentmixtures, with the higher plateau value the lower the relative epoxycontent. In no case the epoxy conversion attains the idealmaximumvalue corresponding to a total consumption of epoxy groups (a ¼ 1for the stoichiometric and amine-excess DGEBA/DETA mixtures,and a ¼ 0.75 for the epoxide-excess mixture DGEBA/DETA 10:3),
Fig. 1. (a) Epoxy conversion, a, as a function of the time of reaction, t, during cure ofthe DGEBA/DETA system at different values of the epoxy-amine molar ratio anddifferent temperatures as indicated in the legend. (b) Dependence on a of the struc-tural relaxation time, s, measured by photon-correlation spectroscopy during cure ofthe DGEBA/DETA system; the symbols are the same as in panel (a). Solid lines are thebest fit with Eq. (6). The dashed square in panel (a) locates the region corresponding tothe increase of s reported in panel (b) for the system DGEBA/DETA 4:3 at T ¼ 30 �C.
thus revealing the presence of diffusion-control in the last stage ofreaction. Indeed, Fig.1(b) shows that the slowdownof the dynamicsduring cure already occurs rapidly over a relatively small range ofconversion preceding the point where the conversion curve startsto level out. In the reaction DGEBA/DETA 4:3 at T ¼ 30 �C, forinstance, the structural relaxation time increases by w5 orders ofmagnitude in the region 0.6<a< 0.75 [the regionwithin the dashedsquare in Fig. 1(a)]; the remaining part of the cure, up to a w 0.8,then proceeds under conditions of even more reduced structuralmobility, and eventually in the glassy state.
We illustrate in the case of a typical reaction, DGEBA/DETA 5:2 atT¼ 28 �C, the strategy of data analysis performed in this work. Fig. 2(a) and (b) show the evolution of a vs. t and da/dt vs. a, and theeffect of different approximations for k1 and k2 on the description ofthe advancement of reaction using Eq. (5). In this case, r ¼ 1(stoi-chiometric mixture) and Eq. (5) reduces to the Kamal equation.When it is fitted to the experimental data by keeping k1 and k2 as a-independent parameters, the upper limit of the a range wherea good agreement to the data is obtained is w0.42, i.e. about a 70%of the final a value. The best-fit parameters are k1 ¼ (2.16 � 0.03)10�5 s�1, k2 ¼ (1.80 � 0.06)10�4 s�1, m ¼ 0.83 � 0.02,n ¼ 1.54 � 0.03. At higher conversions, the kinetic model witha-independent rate constants departs from the experimental data,to reach da/dt ¼ 0 at a ¼ 1 (dashed line in Fig. 2(a) and (b)). In thisregion, i.e. for a approximately between 0.42 and 0.61, the diffusion
a
b
Fig. 2. (a) Epoxy conversion, a, as a function of the time of reaction, t, during cure ofthe system DGEBA/DETA 5:2 at T ¼ 28 �C. Symbols are experimental data. The dashedline represents the fit of the Kamal equation (Eq. (5) with r ¼ 1) to the first part of thereaction, up to a ¼ 0.42, using a-independent rate constants. The dash-dotted line isthe best fit, to all the data, of Eq. (8) with x ¼ 1, using B ¼ 3.3 and a0 ¼ 0.69 as obtainedfrom the fit of s(a) with Eq. (6). The solid line is the best fit of Eq. (8) with B ¼ 3.3 anda0 ¼ 0.69, by releasing the constraint x ¼ 1. (b) Conversion rate, da/dt, as function of a,from the experimental data and the fit curves shown in panel (a).

Fig. 4. Conversion rate, da/dt, as function of a, during cure of the DGEBA/CHA 1:1system at different cure temperatures (data taken from Refs. [70e72]). Solid lines arethe best fit of Eq. (8), with B and a0 fixed from the behavior of s(a).
S. Corezzi et al. / Polymer 51 (2010) 5833e5845 5839
at molecular level is increasingly hindered by the reduction ofconfigurational entropy associated to the growth of oligomers andpolymer structures, as also reflected in the marked increase of thestructural relaxation time measured by PCS and reported in Fig. 1(b). The s(a) behavior is fitted by Eq. (6) with B ¼ 3.3 � 0.4 anda0 ¼ 0.69� 0.02. On the other hand, the structural arrest is so rapidthat an equally rapid evolution of the molecular diffusion coeffi-cient would make the reaction come to an all too abrupt deceler-ation. To illustrate this important point, we show in Fig. 2(a) and (b)the results of fitting Eq. (5) to the experimental kinetic data usingEq. (3) for the definition of k1 and k2 and Eq. (7) for the expressionof kd(a), using x ¼ 1, B ¼ 3.3 and a0 ¼ 0.69 as fixed parameters; orequivalently, of fitting Eq. (8) with x¼ 1, using the parameters B anda0 which describe the s(a) behavior. This choice is equivalent toassuming a diffusion rate constant proportional to the rate ofstructural relaxation, kd w s�1. The dash-dotted line obtained fromthe fit procedure shows that this assumption tends to overestimatethe reaction rate in the first part of the reaction, 0.15<a < 0.30, andto compensate afterwards, giving a sudden change at a w 0.56;finally, the fit curve closes at a lower value as compared to theexperimental data. This result suggests that molecular diffusiondiverges more slowly than the structural relaxation, a situation thatcan be modeled by a fractional powerelaw kd w s�x with 0<x < 1,and hence by leaving x as a free parameter in Eq. (8). The solid linein Fig. 2(a) and (b) is obtained under these circumstances. It can beseen that, in this case, the fit function is able to reproduce very wellthe behavior of a vs. t and da/dt vs. a over the whole reaction range,describing a smooth transition from the chemical to the diffusion-controlled regime.
It has to be noticed that, with the parameters B and a0 knownfrom s(a) the fit procedure adjusts six parameters. However, if theeffect of diffusion on the cure kinetics is unimportant in the earlystage of reaction, four of them are expected to be shared by thedescription of the first part of the cure. Indeed, without anyconstraint imposed, the intrinsic rate constants kc 1 and kc 2, as wellas the exponents m and n, determined by fitting all the data withEq. (8), are coincident within the errors with the parametersobtained by fitting with the Kamal equation the first part of thereaction only, up to a w 0.42 [The best-fit parameters arekc1 ¼ (2.25 � 0.09)10�5 s�1, kc2 ¼ (1.80 � 0.2)10�4 s�1,m ¼ 0.85 � 0.05, n ¼ 1.43 � 0.11]. The same does not happen if theconstraint x ¼ 1 is used. This result demonstrates that the devel-oped approach is able to account for the a-dependent effect ofdiffusion without affecting the parameters describing the
Fig. 3. Conversion rate, da/dt, as function of a, during cure of the DGEBA/DETA systemat different values of the epoxy-amine molar ratio (and different cure temperatures) asindicated in the legend (data from the present work). Solid lines are the best fit of Eq.(8), with B and a0 fixed from the behavior of s(a).
chemically-controlled regime. With the intrinsic parametersknown from the early stage of cure, the diffusion-controlled kineticmodel has only two extra adjustable constants, i.e. k0 and thefractional exponent x. Nevertheless, instead of a two-step proce-dure we prefer to perform a single-step fit of the kinetic data, withsix adjustable parameters all at once, in order not to leave out thepossibility of a small but non-negligible effect of diffusion since thefirst stages of reaction.
6. Results and discussion
The fit procedure described above has been extended to thewhole set of epoxy-amine reactions for which both the epoxyconversion and the structural relaxation time during cure areavailable (see Table 2). For each reaction, experimental data of da/dtas function of a have been fitted by Eq. (8), with the parameters Band a0 fixed to the values describing the behavior of s(a) accordingto Eq. (6). The results of the fit are shown in Figs. 3e9.
Data of other reactions have been analyzed without informationon the structural relaxation time, by using a0 as an additionalfree parameter. An example is shown in Fig. 10 for the reactionDGEBA/DETA 5:2 at T ¼ 60,70,80 �C. In this case, the fit with Eq. (8)cannot determine x and B separately and their product definesa single fit parameter. The results, compared with those obtained
Fig. 5. Conversion rate, da/dt, as function of a, during cure of the DGEBA/EDA systemat different cure temperatures. Open symbols are for DGEBA/EDA 2:1 (data from Refs.[63e65]), closed symbols for DGEBA/EDA 1:1 (data from Ref. [66]). Solid lines are thebest fit of Eq. (8), with B and a0 fixed from the behavior of s(a).

Fig. 6. Conversion rate, da/dt, as function of a, during cure of the system DGEBA/DDM2:1 at different curing temperatures. Epoxy conversion data (from Ref. [73]) aremeasured by FTIR. Solid lines are the best fit of Eq. (8), with B and a0 fixed from thebehavior of s(a).
Fig. 8. Conversion rate, da/dt, as function of a, for the reaction of TACTIX with differentcuring agents in molar ratio 2:3 (data from Refs. [76,77]). Solid lines are the best fit ofEq. (8), with B and a0 fixed from the behavior of s(a).
S. Corezzi et al. / Polymer 51 (2010) 5833e58455840
from the s-constrained fit, are useful to assess the robustness of thekinetic model.
6.1. Comparison with the predicted value of a0
In almost all the reactions reported in Table 2, the experimentalvalue of a0 obtained by fitting the relaxation time data is very closeto that calculated from the stoichiometry of the mixture accordingto a0 ¼ 1=f , with f the average epoxy functionality. For a genericepoxy/amine Ne : Na mixture one has f ¼ feNe=ðNe þ NaÞ, where feis the number of epoxy groups on a monomer. This result indicatesthat in many systems a range of curing conditions does exist wherethe theoretical value of a0 can be used with a good confidence. Inthese cases, the routine use of Eq. (8) for describing the kinetics ofcure does not necessarily require the separate characterization ofthe structural relaxation by a spectroscopic technique.
As discussed at length in Ref. [61], the conditions under whichthe configurational entropy-based model has been derived limitthe a and T range where it is expected to hold. In particular,increasing the temperature brings the system out of the range ofvalidity of Eq. (6), and the reaction is expected to proceed to anextent greater than the value of a0 predicted on a molecular basis.As a matter of fact, any polymerization can be brought to its fullextent by progressively increasing the reaction temperature, and
Fig. 7. Conversion rate, da/dt, as function of a, during cure of the DGEBA/3DCM 2:1system at different cure temperatures (data from Ref. [74]). Solid lines are the best fit ofEq. (8), with B and a0 fixed from the behavior of s(a).
this is normally used to evaluate the total heat of reaction viacalorimetry. Also the characteristics of the reagents (their structureand reactivity) may be responsible for a departure from the idealFlory’s conditions underlying Eq. (6). In this case, 1=f is expected torepresent only a lower limit to the a value at which s tends todiverge. The high percentage of excess-deviation between themeasured a0 and 1=f in the reactions involving 3DCM, 3CA and4CA, for example, could be an indication that significant cyclization,substitution effects, or secondary reactions, occur in the reactivesystem.
It is important to note that, while the prediction a0 ¼ 1=f doesnot apply when the reaction temperature is high or the systemdeviates significantly from the Flory’s hypotheses, anyway theexperimental observation indicates that the a dependence of sremains well represented by Eq. (6). Therefore, the use of Eq. (8) fordescribing the kinetics of cure can be continuedwith the parametersa0 and B provided by the analysis of spectroscopic data. Fig.11 showsfor the systems DGEBA/DDM 2:1 and DGEBA/DETA 5:2 that a0obtained from the fit of relaxation time data (solid symbols) hasa tendency to move over the predicted value (horizontal lines) fortemperatures exceeding, respectively, w360 K and w325 K. Opensymbols, obtained from the fit of kinetic datawithout any constrainton the parameter a0, confirm that a tendency of s to diverge (i.e. of Dto vanish) occurs at increasingly high values ofa. Thematch between
Fig. 9. Conversion rate, da/dt, as function of a, for the reaction DGEBA/BA 1:1 at 25 �C(data from Ref. [68]) and DGEBA/PACM 2:1 at 35
�C (data from Ref. [75]). Solid lines are
the best fit of Eq. (8), with B and a0 fixed from the behavior of s(a).
Fig. 10. Conversion rate, da/dt, as function of a, for the reaction DGEBA/DETA 5:2 (datafrom Ref. [80]). Solid lines are the best fit of Eq. (8), with Bx and a0 as free parameters.
a
S. Corezzi et al. / Polymer 51 (2010) 5833e5845 5841
the trend of the closed and open symbols indicates that, even in theabsence of information from the structural relaxation behavior, Eq.(8) is able to determine the parameter a0 self-consistently.
b
6.2. Chemical rate constants
Fig. 12(a) shows the Arrhenius-plot representation of thechemical rate constants kc1 and kc2 for all the reactions that havebeen carried out isothermally at more than two different temper-atures. In all systems a linear dependence of logkci vs. 1/T is found,fitted by the relationship
kci ¼ k0iexp�� 3iRT
�i ¼ 1;2 (9)
where 3i is the activation energy, R the gas constant and T theabsolute temperature. The activation energies 3i are found to be ina range comparable to that reported by many other authors. Onequestion that is not been resolved, however, is that of the relativevalue of 31 and 32. While it is frequently reported as a reasonablefinding that 32 is lower than 31 because 32 represents the catalytic
Fig. 11. Parameter a0 vs. the reaction temperature for the system DGEBA/DDM 2:1(disconnected symbols) and DGEBA/DETA 5:2 (connected symbols). Solid symbolsrepresent values obtained from the fit of s vs. a. Open symbols represent valuesobtained from the fit of da/dt vs. a using Eq. (8) with all parameters free. For eachsystem, different symbols correspond to a different source for the kinetic data [DGEBA/DETA: (cross circles) present work; (cross triangles) Ref. [80]. DGEBA/DDM: (-)Ref. [73]; (>) Ref. [81]; (B) Ref. [82]; (open stars) Ref. [83]; (7) Ref. [44]. Horizontallines represent the theoretically predicted values of a0.
Fig. 12. (a) Dependence of kc1 (square symbols) and kc2 (circles) on the reciprocaltemperature for different reactions. (b) Master curve obtained by multiplying by anappropriate factor each set of data in panel (a); same legend. The dashed lines are theArrhenius fit to the data for the DGEBA/DDM reaction.

Fig. 13. Exponents m and n and overall reaction order m þ n for all the reactionsanalyzed. Solid symbols are the same as in Fig. 12. Opens symbols correspond to single-temperature reactions, not shown in Fig. 12.
Fig. 14. Exponents m and n for the mixture DGEBA/DETA in six different compositionsas indicated in the legend. The ratio 5:2 corresponds to the stoichiometric composition.Solid symbols are obtained by fitting the kinetic data with Eq. (8). Open symbols areobtained by replacing the chemical part of Eq. (8) with the Kamal equation, orequivalently using Eq. (8) with r ¼ 1.
S. Corezzi et al. / Polymer 51 (2010) 5833e58455842
reaction of the epoxy compound with the amine [34,44,81,83], theevidence for this is not entirely convincing. In fact, the opposite hasbeen reported [18] and also conflicting data for a given system. Thecase of DGEBA/DDM is illustrative of this last situation. Hugueninand Klein [44] and Deng andMartin [34] analyzed the first stages ofcure of DGEBA/DDM by means of the Horie equation, obtaining[31 (kJ/mol), 32 (kJ/mol)]¼ [71.2, 49.4] and [63.2, 48.8], respectively.Ramirez and coworkers [81] and Kim and Char [82] analyzed thereaction in a similar temperature range with the Kamal equation,obtaining respectively [94.3, 61.5] and [67.9, 52.0]. Liu andcoworkers [83] obtained [66 � 4, 51 � 9] by using a generalizedKamal equation derived from a mechanistic model. Interestingly,re-analyzing the data of the previous authors by means of Eq. (8),we find a close agreement of all the kc1 and kc2 data from differentstudies, with the same value of activation energy for the autocat-alytic and non-catalytic processes (31 ¼ 69:5� 1:6 kJ/mol,32 ¼ 70� 4 kJ/mol). Moreover, a comparison of the data fordifferent systems (Fig. 12) shows that while the autocatalyticprocess is the dominant one, with a rate constant kc2 at least oneorder of magnitude higher than kc1, the activation energies are verysimilar for the two processes in all systems. The autocatalyticmechanism cannot therefore be easily dismissed as an effectassociated with a lower energy barrier for the reaction of theepoxyehydroxyl complex with the amine. Instead, it appears tohave a significant effect on the chemical mechanisms whichdetermine the pre-exponential factor in Eq. (9), by making k02much higher than k01.
Furthermore, we find that by using an appropriate scaling factorfor each set of data, they all collapse on the activation lines of theDGEBA/DDM system (Fig. 12(b)). This scaling indicates that theactivation energy is the same for all the reactions investigated, andsuggests a similar mechanism underlying the reaction betweenepoxy group and amino hydrogen, independently of the details ofthe molecular structure to which they are attached and of therelative concentration of epoxy and amino groups.
6.3. Exponents m and n
There is no general agreement in the literature about the valuesof m and n and about their temperature dependence. Values ofm þ n from 2 to 4 have been observed. Constant values of m and nhave been reported, but also their variation (either increase ordecrease) with the curing temperature. The comparison of resultsof different studies is made more difficult by the sensitivity of thetwo exponents m and n, especially n, to the kinetic model used todescribe the experimental data, and by the fact that the sum m þ nhas sometimes been additionally constrained to be 2 or 3.
Fig. 13 shows the values of the exponents m and n obtained forall the reactions analyzed in the present work, including thosereactions carried out at a single temperature, by fitting the exper-imental data with Eq. (8) without any constraint on m and n. Thevalue of m is always very close to 1. Within experimental error, thevalue of n is temperature-independent for a given mixture, butthe values for different mixtures spread out over the range from 1to 2, which yields an overall reaction orderm þ n between 2 and 3,depending on the system investigated. Thus the constraintm þ n ¼ 2 or 3, as found in the literature, seems not to be a pos-teriori justified within our model.
A comparison between the fit parameters obtained by using Eq.(5) to describe the chemical kinetics and those obtained bydescribing the chemical kinetics with the Kamal equation may beuseful to assess themerits of Eq. (5), where the stoichiometric ratio rappears explicitly. Fig. 14 shows this comparison for the exponentsm and n in the DGEBA/DETA mixture at six different compositionsincluding the stoichiometric balance 5:2, and shows that the
difference is very slight for the parameter m(z0.93 � 0.08), whilethere is a systematic effect on the value of n. Using Eq. (5) increasesnin mixtures with an excess of amino hydrogens (r > 1) anddecreases n in mixtures with an excess of epoxy groups (r < 1),producing the overall effect that all mixtures have the same value of

Fig. 15. Correlation of the powerelaw index x with the stretching b parameter. Thedashed line represents x ¼ b. Different systems are labeled on the plot as: 1, DGEBA/DETA 10:3; 2, DGEBA/DETA 5:2; 3, DGEBA/DETA 5:2.6; 4, DGEBA/DETA 5:2.8; 5,DGEBA/DETA 4:3; 6, DGEBA/DETA 10:9; 7, TACTIX/AN 2:3; 8, TACTIX/3CA 2:3; 9,DGEBA/PACM 2:1; 10, DGEBA/DDM 2:1; 11, TACTIX/4CA 2:3; 12, DGEBA/HA 1:1; 13,DGEBA/BAM 1:1; 14, DGEBA/CHA 1:1; 15, DGEBA/EDA 2:1; 16, DGEBA/EDA 1:1.
S. Corezzi et al. / Polymer 51 (2010) 5833e5845 5843
n(z1.4� 0.1) independently of the stoichiometric ratio. Thisfindingis quite consistent with the basic idea that m and n should beexponents related to the mechanism of reaction, which is expectednot to change for a given system by changing the relative concen-tration of epoxy and amino groups.
6.4. Fractional exponent x and stretching parameter b
For each system, at all temperatures, a good agreement betweenEq. (8) and experimental data is found with the value of the power-law index x, which relates the structural relaxation time to theoverall diffusion coefficient (see Eq. (4)), in the range 0:2(x(0:45,i.e. much smaller than that corresponding to inverse proportion-ality between s and D, x¼ 1, and also smaller than the value x¼ 0.81used in Ref. [34] for the DGEBA/DDM system. This result suggeststhat the use of x ¼ 0.81 made in Ref. [34], based on the assumptionthat diffusion constants are proportional to particle sizes and thatthe SE equation still holds close to the glass transition, is toosimplified and that the complex nature of a step-polymerizingsystem reflects in a large departure from the SE diffusion law.
Another parameter that is found to take values remarkably smallin step-polymer systems, is the stretching parameter b, whichdescribes the degree of nonexponentiality of the relaxation func-tion FðtÞwexp½�ðt=sÞb�. (A stretched-exponential relaxation is alsoknown as KWW relaxation.) It is observed that b decreases whena second component is added to a one-component system, and thatthe value of b can be varied by changing the relative amount of thetwo components [7]. In experiments using probe moleculesdispersed in two-monomer thermoset matrixes, the b parameterof the probe rotation correlation function decreases with theincreasing amount of the minor reagent [84]. The departure fromexponential relaxation is attributed to heterogeneity in thedynamics of the material. Pronounced nonexponential relaxation(or broadening of the relaxation time distribution) is observed inother systems with complex structures like crosslinked polymers,polymer blends and block copolymers, where substantial spatiallyheterogeneous dynamics is expected.
We have analyzed the available experimental data from DS andPCS during epoxy-amine polymerization, including our recentresults [6,7,48], as well as earlier data [63,69,70,72,73,75e77,79,85e88]. In the PCS experiments b was determined by fittingthe time dependent signal using the KWW form for the normalizedautocorrelation function of the scattered electric field; in the DSexperiments b was obtained by fitting the normalized dielectricspectra in the frequency domain to the Fourier transform of theKWW function. Looking for a possible correlation between x and b,we have plotted the first as a function of the second quantity. InFig. 15, this dependence is shown for 16 different polymerizingsystems. Fig. 15 immediately points out that x approximatelycorresponds to b in the studied systems.
Note that for many mixtures b has not a constant value duringthe reaction, and tends to decrease as the polymerization prog-resses. However, it is almost constant over the late stage of reaction,which is also the stage determining the value of x. Moreover, withinexperimental error, the values of x and b are temperature-inde-pendent for a given mixture. Consequently, each point in Fig. 15represents the quantities x and b over the diffusion-controlledpart of the reaction, averaged over all the reaction temperatures.
There is no a priori reasonwhy the fractional exponent x relatingthe structural relaxation time to the diffusion coefficient should becorrelated with the extent b of nonexponentiality of the structuralrelaxation, in the sense that no theory of the glass transitionpredicts an explicit relationship between them. Hence, theobserved relation between x and b in many step-polymerizingmixtures, in the form of Fig. 15 is striking. Its existence strongly
suggests that the two parameters share a common origin, orequivalently that they are associated to the same mechanism. Ourfinding highlights that the parameter x quantifies the effect ofdynamic heterogeneity in terms of enhancement of translation inthe same way as the parameter b does in terms of departure fromexponentiality of relaxation.
It is interesting to note that the change in scaling law fromDw s�1 to Dw s�x can be qualitatively described as enhancement oftranslational diffusion over rotational diffusion, and therefore thecorrelation between x and b observed here recalls the correlationbetween enhanced translation and nonexponential relaxationobserved by Ediger and coworkers [52,53,57]. These authors usedthe ratio Ds/(Ds)DSE, i.e. the product Ds normalized to the value ofthis product predicted by the DSE equation (a measure of the devi-ation from the hydrodynamic results) to quantify the enhancementof translation at the glass transition for different probe molecules inglass-forming host matrixes. In the following we show how theircorrelation between this ratio and the parameter b can be read interms of our findings.
If the DSE equation is replaced near vitrification by Dsx ¼ const,this ratio canbewrittenasDs/(Ds)DSEw s(1�x).When it is evaluatedattheglass transitionpointdwhere the relaxation timehasa referencevalue of sz 102 sd one has [Ds/(Ds)DSE]glassw 102(1�x). By applyingthe result in Fig. 15, i.e. xz b, it becomes [Ds/(Ds)DSE]glass w 102(1�b),i.e. a straight line with slope �2 in a logarithmic plot vs. b. Whilea linear correlation between enhanced translation and KWWbparameterat theglass transition is qualitativelyobserved in Fig. 9 ofRef. [53], apparently there is no agreement with the slope.
To explain this disagreement and compare further, it should betaken into account that the quantities correlated in Fig. 15 refer toneat samples, while those correlated in Fig. 9 of Ref. [53] charac-terize the rotational and translational motion of probes of differentsize dissolved in the samples. The effect of probe size on breakdownof the SE equation in glass-forming liquids has been studied byHeuberger and Sillescu [54], showing that breakdown is sup-pressed for probe sizes exceeding the size of the solvent molecules.Recently, Rajian et al. [58] have collected data from the literatureand pointed out that these clearly delineate a dependence of theextent of enhanced translation [Ds/(Ds)DSE]glass on the relative sizeof probe-to-host, with a sharp increase when the size ratio is nearunity and an enhancement of translational diffusion of about 3
S. Corezzi et al. / Polymer 51 (2010) 5833e58455844
decades for probes smaller than the host. Moreover, Wang andRichert [89] have shown that the rotation correlation function ofprobe molecules matches the collective nonexponentiality of thehost liquid when the probe-to-host size ratio is lower than unity,but a relatively sharp transition to exponentiality occurs as theratio begins to exceed 1. On the basis of these findings, weconclude that only the data in Fig. 9 of Ref. [53] that correspond toprobes smaller than the host should match the expectation thatlogð½Ds=ðDsÞDSE�glassÞ is approximately linear vs. b with a slope ofabout �2. Indeed, if we restrict to these data, we find that thedependence of enhanced translation on the stretching parameteris in good agreement with the expectation based on the results ofthe present work.
7. Conclusions
In this study we have introduced a new equation to describe thekinetics of epoxyeamine polymerization over the entire range ofcure, built on a modification of the Horie equation to account forthe chemically intrinsic rate of reaction, and the Rabinowitchmodel to account for the effect of diffusional limitations througha a-dependent diffusion rate constant. This rate constant and itsdependence on the extent of reaction can be properly associatedwith the average diffusion coefficient and hence with the structuralrelaxation time, assuming a powerelaw relation between D and s.In contrast to one of the commonly found approximations in theliterature, the results of this study clearly indicate that the effect ofdiffusional limitations cannot be properly described by assumingthat s�1, the relaxation rate directly gives the diffusional rate.Neither does the quantity s�x with x z 0.8. We have found thata fractional exponent x z b, with b the KWW stretching parameterranging between 0.2 and 0.4 in the systems investigated, is requiredto reproduce the experimental results well, suggesting that b inthese systems provides a measure of the decoupling between thetranslational diffusion of the chemically reacting sites and thereorientational motion of molecular entities that appears asrelaxation measured by PCS and DS.
Another key ingredient of the equation proposed has beenmodeling the increase of structural relaxation time, and associateddecrease of diffusion coefficient on polymerization in terms ofconfigurational entropy reductiondrivenbycovalentbond formation.Thus, the approach proposed reconciles the description of the diffu-sion-controlled kinetics of reaction,wherediffusionhas a leading rolewhen approaching the glass transition, with the configurationalentropy-based description of the structural dynamics near vitrifica-tion that has been applied successfully to epoxyeamine polymeri-zation in previous studies.
We have obtained a very good agreement of the model equationwith the experimental data of a large number of systems in a widerange of temperature, both in the chemically-controlled anddiffusion-controlled regime of the reaction as well as in the cross-over region between the two. The equation is able to determine theparameter a0 (the a value at which the configurational entropy ofthe system tends to vanish) consistently with the theory’s expec-tation and with its limit of validity, while the parameters thatcharacterize the intrinsic rate of reaction reveal a homogeneousbehavior among different systems. In particular, two remarkableresults have been found. The first concerns the behavior of the mand n exponents: for each epoxy-amine system investigated m andn assume approximately constant values, independent of thetemperature and molar ratio of the mixture, which is in agreementwith our expectation that these exponents are related to theintrinsic reaction mechanism, not changing by changing the reac-tion temperature or the relative concentration of epoxy and aminogroups. The value m z 1 found in all systems suggests that the
overall order of the epoxy-amine reaction is suitably described bythe introduction of only one parameter, n. It remains, however, anopen question how to give an interpretation of such exponents inmechanistic terms. The second result concerns the intrinsic rateconstants: for each constant (kc1 or kc2) we can collapse the data forall the systems onto a master-curve corresponding to thermallyactivated behavior with, surprisingly, the same activation energyfor the two constants kc1 and kc2. Although such result, obtained byanalyzing the data with Eq. (8), contradicts the widespread beliefthat the autocatalytic process has a lower activation energy, inter-estingly it removes some evident discrepancies existing in theliterature among results reported for a given system in differentstudies.
The analysis of the diffusion-controlled regime is not weakenedby the use of a phenomenological equation to describe the chem-ically-controlled limit of the epoxy-amine reaction. Indeed, thesoundness of the approach adopted to model diffusion-control inthe case of epoxy-amine systems d which is based on replacingeach chemical rate constant with an overall one, built on theRabinowitchmodel and the assumption of proportionality betweenkd and the overall diffusion coefficient d also emerges from therecent simulation of irreversible polymerization in a model system,which does not suffer from ambiguity in the intrinsic chemicalkinetics and permits a precise determination of the diffusioncoefficient [60].
References
[1] Young RJ, Lovell PA. Introduction to polymers. New York: Chapman and Hall;1991.
[2] Pascault JP, Sauterau H, Verdu J, Williams RJJ. Thermosetting polymers. NewYork: Marcel Dekker; 2002.
[3] Boogh L, Mezzenga R. Processing principles for thermoset composites. In:Kelly A, Zweben C, editors. Comprehensive composite materials. Polymermatrix composites, vol. 2. Oxford: Pergamon; 2000.
[4] de Gennes PG. Scaling concepts in polymer physics. Ithaca, NY: CornellUniversity Press; 1979.
[5] Corezzi S, Fioretto D, Rolla P. Nature 2002;420:653.[6] Corezzi S, Fioretto D, Puglia D, Kenny JM. Macromolecules 2003;36:5271.[7] Volponi R, Corezzi S, Fioretto D. Macromolecules 2007;40:3450.[8] Barton J. Adv Polym Sci 1985;72:111.[9] Rozenberg BA. Adv Polym Sci 1986;75:113.
[10] Du�sek K. Adv Polym Sci 1985;78:1.[11] Oleinik EF. Adv Polym Sci 1985;80:50.[12] Mat�ejka L, Du�sek K. Macromolecules 1989;22:2902.[13] Mijovic J, Fishbain A, Wijaya J. Macromolecules 1992;25:979.[14] Mijovic J, Wijaya J. Macromolecules 1994;27:7589.[15] Mat�ejka L. Macromolecules 2000;33:3611.[16] Horie K, Hiura H, Sawada M, Mita I, Kambe H. J Polym Sci Part A 1970;8:1357.[17] Cole KC. Macromolecules 1991;24:3093.[18] Cole KC, Hechler J-J, Noël D. Macromolecules 1991;24:3098.[19] Chiao L. Macromolecules 1990;23:1286.[20] Kamal MR. Polym Eng Sci 1974;14:23.[21] Sourour S, Kamal MR. Thermochim Acta 1976;14:41.[22] Riccardi CC, Williams RJJ. J Appl Polym Sci 1986;32:3445.[23] Wisanrakkit G, Gillham JK. J Appl Polym Sci 1990;41:2885.[24] Verchere D, Sautereau H, Pascault JP, Riccardi CC, Moschiar SM, Williams RJJ.
Macromolecules 1990;23:725.[25] Serier A, Pascault JP, My LT. J Polym Sci Part A Polym Chem 1991;29:209.[26] Lopez-Quintela A, Prendes P, Pazos-Pellín M, Paz M, Paz-Abuín S. Macro-
molecules 1998;31:4770.[27] Zvetkov VL. Thermochim Acta 2005;435:71.[28] Zvetkov VL. Macromol Chem Phys 2002;203:467.[29] In an alternative view, the reaction slows down when the glass transition
temperature Tg of the reacting system approaches the curing temperature Tc,and stops when Tg exceeds Tc by a certain amount. Depending on the system,the onset of diffusion-control may precede the vitrification point considerably.
[30] Kenny JM, Trivisano A. Polym Eng Sci 1991;31:1426.[31] Chern CS, Poehlein GW. Polym Eng Sci 1987;27:788.[32] Rabinowitch E. Trans Faraday Soc 1937;33:1245.[33] Fournier J, Williams G, Duch C, Aldridge GA. Macromolecules 1996;29:7097.[34] Deng Y, Martin GC. Macromolecules 1994;27:5147.[35] Wang J, Johari GP. J Chem Phys 2002;117:9897.[36] Adabbo HE, Williams RJJ. J Appl Polym Sci 1982;27:1327.[37] DiBenedetto AT. J Polym Sci Polym Phys 1987;25:1949.[38] Pascault JP, Williams RJJ. J Polym Sci Polym Phys 1990;28:85.
S. Corezzi et al. / Polymer 51 (2010) 5833e5845 5845
[39] Venditti RA, Gillham JK. Polym Mater Sci Eng 1993;69:434.[40] Swier S, Van Assche G, Van Mele B. J Appl Polym Sci 2004;91:2798.[41] Wisanrakkit G, Gillham JK. J Coat Technol 1990;62:35.[42] Wise CW, Cook WD, Goodwin AA. Polymer 1997;38:3251.[43] Meng Y, Simon SL. Thermochim Acta 2005;437:179.[44] Huguenin FCAE, Klein MT. Ind Eng Chem Prod Res 1985;24:166.[45] Kim DS, Kim SC. Polym Eng Sci 1994;34:625.[46] Simon SL, Gillham JK. J Appl Polym Sci 1993;47:461.[47] Havlí�cek I, Du�sek K. In: Sedlacek B, Kahovec J, editors. Crosslinked epoxies.
Berlin: Walter de Gruyter; 1987. p. 417.[48] Corezzi S, Fioretto D, Kenny JM. Phys Rev Lett 2005;94:065702.[49] Corezzi S, Palmieri L, Kenny JM, Fioretto D. J Phys Condens Matter 2005;
17:S3557.[50] Ehlich D, Sillescu H. Macromolecules 1990;23:1600.[51] Fujara F, Geil B, Sillescu H, Fleischer G. Z Phys B 1992;88:195.[52] Cicerone MT, Ediger MD. J Chem Phys 1996;104:7210.[53] Blackburn FR, Wang Chia-Ying, Ediger MD. J Phys Chem 1996;100:18249.[54] Heubergen G, Sillescu H. J Phys Chem 1996;100:15255.[55] Andreozzi L, DiSchino A, Giordano M, Leporini D. J Phys Condens Matter
1996;8:9605.[56] Andreozzi L, DiSchino A, Giordano M, Leporini D. Europhys Lett 1997;38:669.[57] Ediger MD. Annu Rev Phys Chem 2000;51:99.[58] Rajian JR, Quitevisa EL. J Chem Phys 2007;126:224506.[59] Deng Y, Martin GC. Macromolecules 1994;27:5141.[60] Corezzi S, Fioretto D, De Michele C, Zaccarelli E, Sciortino F. J Phys Chem B
2010;114:3769.[61] Corezzi S, Fioretto D, Rolla PA. Chem Phys 2006;323:622.[62] Adam G, Gibbs JH. J Chem Phys 1965;43:139.[63] Venkateshan K, Johari GP. J Chem Phys 2006;125:014907.
[64] Cassettari M, Salvetti G, Tombari E, Veronesi S, Johari GP. J Non-Cryst Solids1994;172e174:554.
[65] Johari GP, Ferrari C, Tombari E, Salvetti G. J Chem Phys 1999;110:11592.[66] Levita G, Livi A, Rolla PA, Culicchi C. J PolymSci Part B PolymPhys 1996;34:2731.[67] Casalini R, Corezzi S, Fioretto D, Livi A, Rolla PA. Chem Phys Lett 1996;258:470.[68] Rohr DF, Klein MT. Ind Eng Chem Res 1988;27:1361.[69] Gallone G, Capaccioli S, Levita G, Rolla PA, Corezzi S. Polym Int 2001;50:545.[70] Johari GP, Ferrari C, Salvetti G, Tombari E. Phys Chem Chem Phys 1999;1:2997.[71] Tombari E, Ferrari C, Salvetti G, Johari GP. J Phys Condens Matter 1997;9:7017.[72] Presto S, Tombari E, Salvetti G, Johari GP. Phys Chem Chem Phys 2002;4:3415.[73] Deng Y, Martin GC. J Polym Sci B 1994;32:2115.[74] Montserrat S, Roman F, Colomer P. Polymer 2003;44:101.[75] Tombari E, Ferrari C, Salvetti G, Johari GP. Phys Chem Chem Phys 1999;1:1965.[76] Wasylyshyn DA, Johari GP. J Polym Sci Part B Polym Phys 1997;35:437.[77] Wasylyshyn DA, Johari GP. J Polym Sci Part B Polym Phys 1998;36:2703.[78] Tombari E, Salvetti G, Johari GP. J Chem Phys 2000;113:6957.[79] Cardelli C, Tombari E, Johari GP. J Phys Chem B 2001;105:11035.[80] Kim BC, Lee DS, Hyun SW. J Ind Eng Chem 2001;7:449.[81] Ramírez C, Rico M, López J, Montero B, Montes R. J Appl Polym Sci 2007;
103:1759.[82] Kim H, Char K. Bull Korean Chem Soc 1999;20:1329.[83] Liu G, Zhao B, Zhou X, Wang J, Gao J, Qu X, et al. Macromol Theory Simul
2006;15:339.[84] Wang Chia-Ying, Ediger MD. J Poly Sci Part B Polym Phys 2000;38:2232.[85] Parthun MG, Johari GP. J Chem Phys 1995;102:6301.[86] Wasylyshyn DA, Parthun MG, Johari GP. J Mol Liq 1996;69:283.[87] Wasylyshyn DA, Johari GP. J Chem Phys 1996;104:5683.[88] Ferrari C, Salvetti G, Tombari E, Johari GP. Phys Rev E 1996;54:R1058.[89] Wang Li-Min, Richert R. J Chem Phys 2004;120:11082.
Copyright © 2022 FDOKUMEN