Modeling cooperative volume signaling in a plexus of nitric oxide synthase-expressing neurons
13
Behavioral/Systems/Cognitive Modeling Cooperative Volume Signaling in a Plexus of Nitric Oxide Synthase-Expressing Neurons Andrew Philippides, 1 Swidbert R. Ott, 1 Philip Husbands, 1 Thelma A. Lovick, 2 and Michael O’Shea 1 1 Sussex Centre for Neuroscience, School of Life Sciences, University of Sussex, Brighton BN1 9QG, United Kingdom, and 2 Department of Physiology, The Medical School, University of Birmingham, Birmingham B15 2TT, United Kingdom In vertebrate and invertebrate brains, nitric oxide (NO) synthase (NOS) is frequently expressed in extensive meshworks (plexuses) of exceedingly fine fibers. In this paper, we investigate the functional implications of this morphology by modeling NO diffusion in fiber systems of varying fineness and dispersal. Because size severely limits the signaling ability of an NO-producing fiber, the predominance of fine fibers seems paradoxical. Our modeling reveals, however, that cooperation between many fibers of low individual efficacy can generate an extensive and strong volume signal. Importantly, the signal produced by such a system of cooperating dispersed fibers is significantly more homogeneous in both space and time than that produced by fewer larger sources. Signals generated by plexuses of fine fibers are also better centered on the active region and less dependent on their particular branching morphology. We conclude that an ultrafine plexus is configured to target a volume of the brain with a homogeneous volume signal. Moreover, by translating only persistent regional activity into an effective NO volume signal, dispersed sources integrate neural activity over both space and time. In the mammalian cerebral cortex, for example, the NOS plexus would preferentially translate persistent regional increases in neural activity into a signal that targets blood vessels residing in the same region of the cortex, resulting in an increased regional blood flow. We propose that the fineness-dependent properties of volume signals may in part account for the presence of similar NOS plexus morphologies in distantly related animals. Key words: gaseous transmitter; brain; computer simulation; diffusion; neurotransmission; cerebral cortex Introduction The gas nitric oxide (NO) is a signaling molecule in the CNS of both vertebrate and invertebrate animals (for review, see Garth- waite and Boulton, 1995; Davies, 2000; Jacklet, 2001). The small size and nonpolarity of NO mean that it can pass through lipid membranes and rapidly diffuse away from the source neuron with limited impediment from intervening cellular structures (Lancaster, 1997; Liu et al., 1998, 2002). Because NO synthase (NOS) is not necessarily confined to presynaptic or postsynaptic specializations, NO can potentially be released from extensive extrasynaptic regions of nitrergic neurons (for counter- examples, see Cao and Eldred, 2001; Burette et al., 2002; and Discussion). These features suggest that NO participates in non- synaptic volume signaling in which a relatively extensive region containing many potential targets may be affected (Gally et al., 1990; Montague et al., 1991; Edelman and Gally, 1992; O’Shea et al., 1997; Ott et al., 2001). Physiological evidence for such exten- sive NO signals that function without synapse specificity over distances exceeding 150 m has been obtained in rat cerebellum (Hartell, 1996, 2001; Jacoby et al., 2001). A number of studies have shown that source morphology in- fluences the spatial and temporal properties of the NO signal (Gally et al., 1990; Montague et al., 1991; Lancaster, 1997; O’Shea et al., 1997; Philippides et al., 2000). Considering this, it is note- worthy that NOS-expressing neurons frequently adopt similar plexus morphologies in widely differing organisms. In the mam- malian cerebral cortex, for example, a sparse scattered population of NOS-expressing neurons invade the entire neuropil with an extensive network of exceedingly fine fibers (Vincent and Kimura, 1992; DeFelipe, 1993). The fiber diameters approach the practical lower limits imposed by the need to accommodate es- sential organelles. In other words, it appears that, if these nitrergic fibers could be finer, they would be. We document in this study that a strikingly similar picture emerges from an analysis of ni- trergic neurons in invertebrates. Such a widespread occurrence of a fine plexus morphology suggests that it confers some functional advantage over a system comprising fewer coarser fibers. In pre- vious work, however, we showed that the smaller the NO source, the less effective it is in generating an NO signal in its vicinity (Philippides et al., 2000). This suggests that an effective volume signal cannot be generated by very slender fibers unless many in the same region cooperate in a manner proposed by Gally et al. (1990) and Montague et al. (1991). Although these were important early models of volume sig- naling, they were not intended as analyses of the signals or of the spatial scale over which cooperation might occur (Montague et al., 1991). Using a model that is explicit about the spatial and temporal scales of NO diffusion, we show that effective coopera- tion between fine fibers will indeed occur over the spatial scales encountered in real plexus morphologies over a wide range of parameter values. Moreover, the ensuing spatiotemporal proper- ties of the volume signal provide one possible functional expla- nation for the widespread occurrence of ultrafine plexus mor- phologies adopted by nitrergic neurons. Received Dec. 3, 2004; revised May 20, 2005; accepted May 20, 2005. This work was supported by British Telecommunications and the Biotechnology and Biological Sciences Research Council of the United Kingdom. Correspondence should be addressed to Michael O’Shea, Sussex Centre for Neuroscience, School of Life Sciences, University of Sussex, Brighton BN1 9QG, UK. E-mail: [email protected]. DOI:10.1523/JNEUROSCI.1264-05.2005 Copyright © 2005 Society for Neuroscience 0270-6474/05/256520-13$15.00/0 6520 • The Journal of Neuroscience, July 13, 2005 • 25(28):6520 – 6532
Transcript of Modeling cooperative volume signaling in a plexus of nitric oxide synthase-expressing neurons

Behavioral/Systems/Cognitive
Modeling Cooperative Volume Signaling in a Plexus of NitricOxide Synthase-Expressing NeuronsAndrew Philippides,1 Swidbert R. Ott,1 Philip Husbands,1 Thelma A. Lovick,2 and Michael O’Shea1
1Sussex Centre for Neuroscience, School of Life Sciences, University of Sussex, Brighton BN1 9QG, United Kingdom, and 2Department of Physiology,The Medical School, University of Birmingham, Birmingham B15 2TT, United Kingdom
Invertebrateandinvertebratebrains,nitricoxide(NO)synthase(NOS)isfrequentlyexpressedinextensivemeshworks(plexuses)ofexceedinglyfine fibers. In this paper, we investigate the functional implications of this morphology by modeling NO diffusion in fiber systems of varyingfineness and dispersal. Because size severely limits the signaling ability of an NO-producing fiber, the predominance of fine fibers seemsparadoxical. Our modeling reveals, however, that cooperation between many fibers of low individual efficacy can generate an extensive andstrong volume signal. Importantly, the signal produced by such a system of cooperating dispersed fibers is significantly more homogeneous inboth space and time than that produced by fewer larger sources. Signals generated by plexuses of fine fibers are also better centered on the activeregion and less dependent on their particular branching morphology. We conclude that an ultrafine plexus is configured to target a volume of thebrain with a homogeneous volume signal. Moreover, by translating only persistent regional activity into an effective NO volume signal, dispersedsources integrate neural activity over both space and time. In the mammalian cerebral cortex, for example, the NOS plexus would preferentiallytranslate persistent regional increases in neural activity into a signal that targets blood vessels residing in the same region of the cortex, resultingin an increased regional blood flow. We propose that the fineness-dependent properties of volume signals may in part account for the presenceof similar NOS plexus morphologies in distantly related animals.
Key words: gaseous transmitter; brain; computer simulation; diffusion; neurotransmission; cerebral cortex
IntroductionThe gas nitric oxide (NO) is a signaling molecule in the CNS ofboth vertebrate and invertebrate animals (for review, see Garth-waite and Boulton, 1995; Davies, 2000; Jacklet, 2001). The smallsize and nonpolarity of NO mean that it can pass through lipidmembranes and rapidly diffuse away from the source neuronwith limited impediment from intervening cellular structures(Lancaster, 1997; Liu et al., 1998, 2002). Because NO synthase(NOS) is not necessarily confined to presynaptic or postsynapticspecializations, NO can potentially be released from extensiveextrasynaptic regions of nitrergic neurons (for counter-examples, see Cao and Eldred, 2001; Burette et al., 2002; andDiscussion). These features suggest that NO participates in non-synaptic volume signaling in which a relatively extensive regioncontaining many potential targets may be affected (Gally et al.,1990; Montague et al., 1991; Edelman and Gally, 1992; O’Shea etal., 1997; Ott et al., 2001). Physiological evidence for such exten-sive NO signals that function without synapse specificity overdistances exceeding 150 �m has been obtained in rat cerebellum(Hartell, 1996, 2001; Jacoby et al., 2001).
A number of studies have shown that source morphology in-fluences the spatial and temporal properties of the NO signal(Gally et al., 1990; Montague et al., 1991; Lancaster, 1997; O’Sheaet al., 1997; Philippides et al., 2000). Considering this, it is note-
worthy that NOS-expressing neurons frequently adopt similarplexus morphologies in widely differing organisms. In the mam-malian cerebral cortex, for example, a sparse scattered populationof NOS-expressing neurons invade the entire neuropil with anextensive network of exceedingly fine fibers (Vincent andKimura, 1992; DeFelipe, 1993). The fiber diameters approach thepractical lower limits imposed by the need to accommodate es-sential organelles. In other words, it appears that, if these nitrergicfibers could be finer, they would be. We document in this studythat a strikingly similar picture emerges from an analysis of ni-trergic neurons in invertebrates. Such a widespread occurrence ofa fine plexus morphology suggests that it confers some functionaladvantage over a system comprising fewer coarser fibers. In pre-vious work, however, we showed that the smaller the NO source,the less effective it is in generating an NO signal in its vicinity(Philippides et al., 2000). This suggests that an effective volumesignal cannot be generated by very slender fibers unless many inthe same region cooperate in a manner proposed by Gally et al.(1990) and Montague et al. (1991).
Although these were important early models of volume sig-naling, they were not intended as analyses of the signals or of thespatial scale over which cooperation might occur (Montague etal., 1991). Using a model that is explicit about the spatial andtemporal scales of NO diffusion, we show that effective coopera-tion between fine fibers will indeed occur over the spatial scalesencountered in real plexus morphologies over a wide range ofparameter values. Moreover, the ensuing spatiotemporal proper-ties of the volume signal provide one possible functional expla-nation for the widespread occurrence of ultrafine plexus mor-phologies adopted by nitrergic neurons.
Received Dec. 3, 2004; revised May 20, 2005; accepted May 20, 2005.This work was supported by British Telecommunications and the Biotechnology and Biological Sciences Research
Council of the United Kingdom.Correspondence should be addressed to Michael O’Shea, Sussex Centre for Neuroscience, School of Life Sciences,
University of Sussex, Brighton BN1 9QG, UK. E-mail: [email protected]:10.1523/JNEUROSCI.1264-05.2005
Copyright © 2005 Society for Neuroscience 0270-6474/05/256520-13$15.00/0
6520 • The Journal of Neuroscience, July 13, 2005 • 25(28):6520 – 6532

Materials and MethodsNOS histochemistry. NADPH diaphorase (NADPHd) histochemistry wasused to reveal the detailed arborization morphology of NOS-expressingneurons (Dawson et al., 1991; Hope et al., 1991). Frozen sections offormaldehyde-fixed rat brain were prepared and stained following theprotocol of Vincent and Kimura (1992). For detection of NOS-relatedNADPHd expression in locust, brains including the optic lobes and ocelliwere fixed in methanol/Formalin and treated with acetate buffer, pH 4.The protocol is described and discussed in detail by Ott and Elphick(2002). To optimize anatomical resolution further, a polyester waxpreembedding technique was used in place of frozen sections. The pro-tocol was given in detail previously (Kurylas et al., 2005). In brief, intactbrains were stained en bloc and dehydrated following the whole-mountNADPHd protocol of Ott and Elphick (2003), infiltrated with polyesterwax (BDH, Poole, UK) at 40°C (15 min each in 20, 40, 60, and 80%polyester wax in methanol and two times for 1 h pure polyester wax), andcut at 5–10 �m. Sections were dewaxed in methanol and mounted inaqueous medium (Immu-Mount; Shandon, Pittsburgh, PA).
General NO diffusion model. Diffusion of NO was modeled using thestructure-based model of Philippides et al. (2000, 2003). A completeexplanation of the methods used is given by Philippides (2001). Briefly,in this approach, the dynamics of diffusion are governed by the modifieddiffusion equation with first-order decay:
�C�x�, t�
�t� Dƒ2C�x�, t� � P�x�, t� � �C�x�, t�, (1)
where C(x�, t) is the concentration at point x� and time t and
P�x�, t� � � Q� inside the source during synthesis0 else . (2)
The following values were used for parameters pertaining to the proper-ties of NO except when stated otherwise. The production rate Q� �1.32 � 10 �4 mol � �m�3 � s �1, which gives a good match to experimen-tal data (Philippides et al., 2000), although its value is likely to vary notonly with the degree of activation of a particular nitrergic neuron but alsobetween different types of NOS-expressing neurons. Note, however, thatafter integrating Equations 1 and 2 to produce solutions, the productionrate is a constant that multiplies the resulting concentrations as in Equa-tion 3 below. Thus, the results are qualitatively independent of Q�, andthe effect of a different value can be seen simply by rescaling the concen-trations. The diffusion coefficient D � 3300 �m 2 � s �1 as measured inan aqueous salt solution (Malinski et al., 1993). Because NO is dilute, D isassumed to be independent of NO concentration and thus constant(Vaughn et al., 1998b). This value has been used widely (Lancaster, 1994;Wood and Garthwaite, 1994; Vaughn et al., 1998a). The decay rate is � �0.1386 s �1, giving a half-life (t1/2) of 5 s, which is that recorded fordissolved NO perfused over living tissues in oxygenated saline (Moncadaet al., 1989). The effects of varying D and � are explored in detail inResults.
Single fiber sources. For straight NO-producing fibers with a circularcross-sectional area, Equations 1 and 2 can be solved analytically to givethe following:
C�r, t, R� �
Q��0
t �0
R
e��t�1
2Dt�exp��r2
4Dt��exp��r�2
4Dt��I0� rr�
2Dt��dr�dt�, (3)
where C(r, t, R) is the NO concentration at a distance r from the center ofa fiber of radius R that has emitted NO continuously for the previous tseconds (Carslaw and Jaeger, 1959; Philippides et al., 2003). Note that thesolution is radially symmetric and has no dependence on the length of thesource because the fiber is infinitely long (see below). Equation 3 wasintegrated numerically using an extended trapezoidal rule (Press et al.,1992) for the outer integration (over time) and an adaptive recursiveNewton Cotes 8 panel rule (Davis and Rabinowitz, 1984) for the innerintegration (over radial distance). This integral is improper at t � 0, and
so it should be noted that, at t � 0, the instantaneous solution (i.e., thevalue of the inner integral at t � 0) is as follows:
C�r, 0, R� � � Q� r � RQ�/ 2 r � R.
0 else(4)
Routines were written in the programming language Matlab (Math-Works, Natick, MA) using a custom program for the outer integrationand the “quad8” function for the inner, with solutions evaluated to arelative accuracy of 0.5%.
Numerical solution for multiple and branched sources. For multiple orbranched fiber sources, Equations 1 and 2 were solved numerically usingalternating direction implicit (ADI) finite difference methods in two andthree space dimensions (Ames, 1992). In these schemes, space is firstdiscretized into a square or cubic grid, and then each time step is split intotwo or three substeps, one for each spatial dimension. For each substep, onlyone spatial derivative is evaluated at the advanced time step, which ensuresthat the resultant subsystem is tridiagonal and therefore tractable (Press et al.,1992). For the two-dimensional version we have the following:
un�1/ 2 � un
�t/ 2� D��x
2un�1/ 2 �y2un� P�i, j, n� �
�
2�un�1/ 2 un�
un�1 � un�1/ 2
�t/ 2� D��x
2un�1/ 2 �y2un�1� P�i, j, n 1
2�
��
2�un�1 un�1/ 2�, (5)
where �x, �y, and �t are the spatial and temporal step-sizes, respectively,and
un � ui, j,n � u�i�x, j�y, n�t�
�x2un � �x
2ui, j,n � ui�1, j,n � 2ui, j,n ui�1, j,n
�y2un � �y
2ui, j,n � ui, j�1,n � 2ui, j,n ui, j�1,n. (6)
Note that concentrations at the advanced time step un�1 are derivedusing the solution at the intermediate time step un�1/2, which is not itselfa valid concentration but rather an approximation to the solution at thetime n�1. For the three-dimensional version, two subsequent approxi-mations, u*n�1 and u**n �1, to the solution at the advanced time step aregenerated in the course of deriving the actual solution, un�1, as follows:
u*n�1 � un
�t� D1
2�x
2�u*n�1 un� �y2un �z
2un P�i, j, k, n�
��
2�u*n�1 un�
u**n�1 � un
�t� D1
2�x
2�u*n�1 un� 1
2�y
2�u**n�1 un� �z2un
P�i, j, k, n� ��
2�u**n�1 un�
un�1 � un
�t� D1
2�x
2�u*n�1 un� 1
2�y
2�u**n�1 un�
1
2�z
2�un�1 un� P�i, j, k, n� ��
2�un�1 un�. (7)
Here the notation has been extended from two to three dimensions in theobvious way so that, for instance, �x, �y, and �z are the spatial step sizes and
un � ui, j,k,n � u�i�x, j�y, k�z, n�t�
�z2un � �z
2ui, j,k,n � ui, j,k�1,n � 2ui, j,k,n ui, j,k�1,n. (8)
Philippides et al. • Cooperative NO Volume Signaling J. Neurosci., July 13, 2005 • 25(28):6520 – 6532 • 6521

Fibers in the difference equation models havesquare cross-sectional areas, and the length ofone side of the square is referred to as the “di-ameter” of the source. Because solutions aregenerated on a grid of finite size, the concentra-tion gradient at the edge of the grid must bespecified as a boundary condition. For the datapresented here, we assumed that the gradient isflat at the edge of the grid. To ensure that thisassumption and the size of the grid had negligi-ble effect on the solutions (�0.5% relative er-ror), we reran the models with a constant gra-dient at grid edges. Spatial and temporal scaleswere also checked by rerunning with smallervalues and were found to have negligible effect.The program to solve the equations was writtenin C; for full details of the implementation and abroader introduction to the methods used, seePhilippides (2001).
Arrays of parallel fibers. To model the diffu-sion of NO from parallel arrays of straight, un-branched fibers, we used the two-dimensionalvariant of the ADI finite difference equationtechnique with a 1000 � 1000 �m 2 or 3000 �3000 �m 2 grid, a spatial scale (step size) of 1�m, and a time step of 1 ms. Ordered arrayswere constructed by spreading fibers evenlywithin a central square region of the grid re-ferred to as the “synthesizing region” so thateach fiber is the same distance, S, from its im-mediate neighbors. This distance is the “separa-tion” of the fibers and is measured from thecenter of one fiber to the center of its neighbor.
Both the single fiber model (analytical solu-tion) and the two-dimensional ADI model(parallel fiber arrays) assume fibers of infinitelength. Because the fibers are straight and thearrays parallel, the solution is symmetric alongthe z-axis. Thus, we give results only for cross-sectional slices in a single plane perpendicularto the direction of the fibers. For finite fibers,the results are for obvious reasons dependenton fiber length, with shorter fibers yieldinglower lateral NO concentrations. However, inthe present context, we are concerned solelywith the signaling implications of different fiberdiameters and configurations, and infinite fiberlength was assumed throughout. Moreover, forfinite fibers of the dimensions seen in the locustoptic lobe (2 �m diameter, �250 �m long), thesignal around the center of the fiber is negligibly different from the infi-nite case (Philippides, 2001).
Plexus of fibers. To model NO diffusion from plexuses of fibers, weused the three-dimensional version of the ADI difference equation tech-nique with a 300 � 300 � 300 �m 3 cubic grid, a spatial step size of 1 �m,a time step of 4 ms, and the same flat boundary condition as for arrays.Plexuses with a density of 0.01 were generated in the central 100 � 100 �100 �m3 subvolume of the main volume (referred to as the “synthesizingvolume”) using the following growing algorithm. (1) Randomly select aface of the inner cube that is the synthesizing volume. (2) Randomlyselect a starting point on the face. (3) Randomly select fiber length (in therange [5, 50]) and orientation (ensuring fiber grows forward with respectto parent fiber). (4) Randomly decide (with a probability of 0.25)whether the fiber branches at its endpoint or not. (5) If fiber branches,repeat from step 3 for each branch, ensuring that each fiber grows into adifferent hemisphere; if not, repeat from step 3. The process continuesuntil a density of source of 0.01 is reached inside this volume. If a fiberexits the synthesizing volume, that fiber is terminated at the exit point. Ifat any point there are no fibers remaining for further growth, one restarts
the process from step 1, keeping the fibers already produced. Severaldifferent parameter values for the maximum and minimum fiber lengthand probability of branching were tried, with negligible effects on theresults (Philippides, 2001). The algorithm is not meant to mimic anyparticular instance of a neuronal growth strategy but simply to be arandom growth process. Note also that, in our case, the growth process isnot itself shaped by NO but serves only to create a plexus in which tostudy the effect of morphology on the NO signal generated by it. This iscomplementary to the model of Montague et al. (1991), who studied theeffect of a diffusible signal on activity-dependent connectivity andbranching morphology.
ResultsThe fine NOS plexus in mammalian and invertebrate brainsThe NADPH diaphorase reaction is a sensitive histochemicalmarker for NOS (Bredt et al., 1991; Dawson et al., 1991; Hope etal., 1991) that delineates NOS-expressing neurons in sharp,Golgi-like anatomical definition. An analysis of NOS expressionin the brains of both vertebrate and invertebrate animals reveals
Figure 1. Plexus morphology of NOS-expressing fibers in the brain of a vertebrate (rat; A, B) and an insect (locust; C, D). Bothgroups of animals have convergently adopted an NO source architecture in which extensive meshworks of exceedingly fine fibersarise from comparatively few neurons. A, The plexus of NOS-expressing fibers in the rat cerebral cortex arises from a scatteredpopulation of neurons. Targets include both an extensive volume of (synaptic) gray matter and the blood vessels within it (smallarrows in A). B, High-power image of the region indicated by the black frame in A reveals the ubiquity of exceedingly fine fibersthat constitute the plexus. C, The plexus of NOS-expressing fibers in the medulla of the locust optic lobe is similarly derived fromfew neurons and pervades an extensive volume of synaptic neuropil. D, High-power view of the region indicated by the blackframe in C.
6522 • J. Neurosci., July 13, 2005 • 25(28):6520 – 6532 Philippides et al. • Cooperative NO Volume Signaling

the widespread occurrence of extensive, disordered, and seem-ingly random meshworks, composed predominantly of exceed-ingly slender fibers (Fig. 1). In the mammalian cerebral cortex,NADPH diaphorase staining shows a sparse and scattered popu-lation of NOS-expressing neurons (Bredt et al., 1991; Vincentand Kimura, 1992). As illustrated in Figure 1, A and B, theperikarya of these relatively few neurons give rise to an extensiveplexus of remarkably fine nerve fibers that invade the entire vol-ume of the cortex. Similar plexus architectures, consisting of veryfine NOS-positive fibers, have also been observed in the two ma-jor invertebrate Phyla, namely mollusks [e.g., in the brain of thecuttlefish, Sepia officinalis (Di Cosmo et al., 2000)] and arthro-pods [e.g., in the CNS of the locust, Schistocerca gregaria (Elphicket al., 1996; Ott and Burrows, 1998)]. A particularly striking ex-ample of a fine NOS-positive plexus can be seen in the medullaneuropil of the optic lobe associated with the compound eye ofthe locust (Fig. 1C,D).
In all cases, the great majority of the plexus fibers is far lessthan 1 �m in diameter, and such fibers therefore are likely to haveonly very limited capacity for NO signaling (Philippides et al.,2000, and below). Nonetheless, it is reasonable to assume that NOgeneration by an ultrafine plexus does serve a signaling role and,moreover, that an effective signal within a region may result fromthe summation of NO derived from many small dispersedsources. This however does not explain why ultrafine fibers ap-pear to have been favored by evolution, because the same targetscould be affected by scattering fewer but larger sources within thesame region (e.g., by a coarse plexus). Because this clearly doesnot correspond to the typical NOS plexus architecture, there maybe signaling advantages to be gained by dispersing many smallNO sources rather than adopting a morphologically simpler ar-rangement using fewer larger ones.
In the following sections, we investigate the properties ofplexus-mediated NO signaling. We first analyze the relationshipbetween source diameter and the spread of NO from single fibers.We then examine the spatial and temporal dynamics of NO sig-nals generated by multiple cooperating fibers. In interpreting thedata, it is important to note that there is continuing uncertaintyin the literature about the half-maximally effective concentration(EC50) of NO on its primary receptor, soluble guanylyl cyclase(sGC). The range reported is from 1 �M (Artz et al., 2001) to 1 nM (Mo et al., 2004). The reported sensitivity of another NOtarget, the respiratory enzyme cytochrome c oxidase, whose inhi-bition by NO causes synaptic depression, falls in the middle ofthis range (IC50 values of �120 nM at 20 –30 �M O2) (Bon andGarthwaite 2001, 2002; Bellamy et al., 2002). At times, it is nev-ertheless helpful to assume a nominal threshold concentrationthat must be reached within a region for NO to be effective. Thisallows us to refer to an “affected region” as the volume of thebrain containing NO above the nominal threshold concentra-tion and then to quantify and compare the extent of the vol-ume signals that arise from different source configurations. Itis important to bear in mind, however, that no sharp thresholdexists for a graded signal such as NO.
NO signaling by single nerve fibers: effect of fiber diameterFor spherical NO sources, size is a major factor limiting the rangeof an effective NO signal (Philippides et al., 2000). To assess thesignaling efficacy of nitrergic nerve fibers rather than spheres, wemodeled the diffusion of NO from long cylinders of varying cal-iber (Fig. 2). Again, source size, in this case fiber diameter, is adecisive factor in limiting signaling range. The most obviousmanifestation of this is that the concentration of NO at the fiber
surface is lower the more slender the fiber (Fig. 2A, showingsurface concentrations after 1 s of synthesis). On the surface, asignal of 10 nM cannot be achieved by fibers less than 0.6 �m indiameter, and, for a 100 nM surface signal, fiber diameter must beat least 2.5 �m. The surface concentration is of course the maxi-mum that is reached anywhere external to the fiber because, asNO diffuses away from the source, its concentration decreaseswith distance. Importantly, this decline is considerably steeperaround thinner fibers, further diminishing their distance-signaling capability. Thus, the distance over which NO declines to50% of the surface concentration is 12 �m for a 5 �m diameterfiber, 6 �m for a 1 �m fiber, and just 2 �m for a 0.1 �m fiber (Fig.2B). In summary, thinner fibers generate less NO on their sur-face, and this initially weak signal declines more steeply overdistance. Consequently, the region around a fiber that experi-ences NO above a given concentration shrinks rapidly as the fiberdiameter decreases.
This limitation cannot be overcome by extending the durationof NO synthesis because, for fine fibers, the NO concentrationquickly approaches a steady state at which the amount of NObeing produced equals that diffusing away. The smaller the fiber,the sooner a steady-state concentration is approached, and hencethe lower this steady-state concentration is. For fiber diametersunder 1 �m, effective steady state (defined as above 80% of max-imum NO concentration) is reached around the fibers within 100ms. Further extending the duration of NO synthesis does not there-fore appreciably increase the local NO concentrations or extend itsradius of action.
Although a small NO-generating fiber is a relatively ineffectivesource, it would be a mistake to think that a wide region around itdoes not contain NO. On the contrary, a steep initial concentra-tion gradient drives NO rapidly away from the source into theinitially empty surround. Thus, the small amount of NO gener-ated by a small source spreads quickly to occupy an extensivevolume around the source, albeit at a very low concentration.Even a 0.1 �m fiber covers a region stretching beyond 20 �mfrom itself in a very light “fog” of NO at �20% of the surface
Figure 2. The signaling efficacy of a single NO-producing fiber critically depends on its di-ameter. A, The NO concentration at the fiber surface declines dramatically for thinner fibers.Surface concentrations after 1 s of continuous synthesis are 440, 25.5, and 0.37 nM for fiberdiameters of 5, 1, and 0.1 �m, respectively (diameters chosen with reference to B). The inset inA shows the graph at a larger scale for diameters below 0.5 �m. B, The problem of the lowersurface concentration of thinner fibers is exacerbated by a steeper decline of the NO concentra-tion as one moves away from the fiber surface. NO concentration is plotted over distance fromthe fiber surface as percentage of the surface concentration for fiber diameters of 5 �m (solidline in B), 1 �m (dashed line in B), and 0.1 �m (dotted line in B). Note, however, that even verythin (0.1 �m) fibers reach 20% of the surface concentration 20 �m away from the surfaceafter 1 s of synthesis (hairlines in B). This extensive spread is the basis of cooperative volumesignaling (compare with Fig. 4).
Philippides et al. • Cooperative NO Volume Signaling J. Neurosci., July 13, 2005 • 25(28):6520 – 6532 • 6523

concentration (Fig. 2B, hairlines). Appre-ciating this point is the key to understand-ing how very slender and individually in-effectual sources can cooperate in thegeneration of an effective regional signal,as we show below. However, before doingso, it is necessary to establish the degree towhich this effect depends on the choice ofparameter values in the model.
Robustness of predicted spread toaltering the parameter valuesHow sensitive are our model predictionsto altering the values of NO inactivation(half-life), diffusion coefficient (D), andproduction rate (Q�)? It is clearly impor-tant to test the robustness of our predic-tions because there is uncertainty and dis-agreement in the literature about thevalues of parameters that would seem in-tuitively to affect both the concentration ofNO at the fiber surface and the spread ofNO away from the source.
Concerning inactivation, there is un-certainty about the half-life of NO invivo because it is curtailed by the avail-ability of reaction partners in the tissue.Lancaster (1997) gives the reportedrange of half-lives as 5–15 s. The cellularsink mechanism reported by Griffithsand Garthwaite (2001) would result inan effective half-life of 100 ms, whichtallies with an early in vivo measurementby Kelm and Schrader (1990). In verte-brates, the half-life will be affected by theproximity of blood vessels, because he-moglobin acts as a strong NO sink.Thomas et al. (2001) estimated the ex-travascular half-life to be between 90 msand �2 s, depending on the propinquityof vessels. In consideration of these find-ings, we have varied half-life between 5 sand 1 ms and examined the conse-quences for the spread of NO from a sin-gle fiber source of 1 �m diameter after 1s of synthesis (Fig. 3A). Note that there islittle effect on the surface concentrationor on the spread of NO for half-lives be-tween 5 s and 500 ms, and, furthermore, a half-life of 100 msstill preserves the general relationship between concentrationand spread. Only with significantly shorter half-lives of 10 msor less does the spread of NO drop enough to significantlyaffect the potential of the NO source to cooperate with othernearby sources. This can be judged by reference to the rangeover which the NO signal falls to say 20% of its concentrationat the surface of the source (the 20% NOmax range) (Fig. 3A,hairline in inset). For half-lives of 10 ms or less, the 20%NOmax range is �6 �m. This is because shortening the half-lifediminishes the relative signal strength more at greater dis-tances from the source. Thus, whereas shortening the half-life5000-fold from 5 s to 1 ms reduces the surface concentrationto 30% of its original value, at 10 �m from the fiber surface,the NO concentration is reduced to �0.25%. In summary,
only extremely short half-lives will severely hamper coopera-tion, based as it is on significant concentrations spreadingsignificant distances. Such very short half-lives are expectedwithin the lumen of blood vessels, but, in the extravascularspace, half-lives are �90 ms (Thomas et al., 2001). Therefore,the spread and, by implication, the ability of sources to coop-erate is affected little over the expected physiological range ofhalf-lives in the brain (50 ms to 5 s).
Next we investigated how a change in the diffusion coeffi-cient D affects the spread of NO and our model predictions.Some studies indicate that NO does not diffuse in vivo nearlyas freely as predicted from its behavior in aqueous salt solu-tions or lipids. In addition, in the retina, membrane-associated diffusion barriers have been invoked to explain theapparent retention of NO within individual cells and processes
Figure 3. Influence of half-life (t1/2 ) and diffusion coefficient ( D) on the spread of NO from a single fiber of 1 �m diameter after1 s of continuous NO synthesis. Main plots in A and B show the absolute NO concentrations plotted against distance from the centerof the fiber. In the insets, these concentrations are normalized to the concentration at the fiber surface. The distance over whichthe concentration drops to 20% of the surface concentration (the 20% NOmax range; hairline in insets) serves as a measure of therelative spread. A, Varying t1/2 5000-fold between 5 s and 1 ms while keeping D constant at 3300 �m 2 � s �1 has little effect onthe NO concentration at the source ( 30 and 10 nM, respectively). Although concentrations are affected more at distant points(as is evident from the diverging lines in the inset), the spread is curtailed significantly only when t1/2 is substantially shorter than100 ms. For example, 10 �m away from the source, the concentration is only halved by reducing t1/2 from 5 s to 100 ms. Likewise,the 20% NOmax range drops below 10 �m only when t1/2 is significantly shorter than 100 ms (hairline in inset). B, Varying Dbetween 2� and 0.1� its standard value while keeping t1/2 constant at 100 ms impacts on the absolute concentration at thesource but has much less effect at more distant points. The relative spread is likewise little affected (inset in B). A significant dropof the 20% NOmax range below 10 �m is predicted only with D � 330 �m 2 � s �1, 1⁄10 of its standard value. C, D, The 20% NOmax
range shown as a function of t1/2 for different D values. C, Varying t1/2 between 5 and 0.5 s has no significant effect on thespread, and the 20% NOmax range is 10 �m or more even for D � 330 �m 2 � s �1 (crossed hairlines). D, Over the range of t1/2 �50 –500 ms, spread changes more steeply. Importantly, however, with physiologically realistic values of D �1000 �m 2 � s �1, the 20% NOmax range is of the order of 10 �m or more (crossed hairlines).
6524 • J. Neurosci., July 13, 2005 • 25(28):6520 – 6532 Philippides et al. • Cooperative NO Volume Signaling

(Blute et al., 2000; Eldred, 2001). We did not model the effectof such local NO retention, but, at first approximation, itseffect and the effects of distributed retention may be inferredfrom a marked reduction of the diffusion coefficient D. Wehave therefore varied D from 1⁄10 to twice the standard valuemeasured in aqueous salt solution (3300 �m 2 � s �1) (Malin-ski et al., 1993). In our initial examination of the effect of D onNO spread from a single 1 �m fiber after 1 s of synthesis, weselected a short half-life of 100 ms to investigate the limits oncooperation (Fig. 3B). The lower the value of D, the slower NOspreads away from the source and the greater the NO concen-tration is in the immediate vicinity of the source. Farther awayfrom the source, however, for instance at 10 �m, the value of Dhas a minimal effect on the absolute NO concentration. If wenow consider the effect of D on relative NO concentration, wesee that doubling the standard value of D or reducing it to
one-third has relatively little effect (Fig.3B, inset). Thus, at the standard value ofD, the 20% NOmax concentration isreached at 13 �m, doubling D in-creases this to 17 �m, and reducing D toone-third decreases the range to 8 �m(Fig. 3B, hairline in inset).
Our analysis has shown that, for a dif-fusing messenger, both its half-life and Ddo affect spread. However, within a widerange of parameter values, cooperative sig-naling is permitted and has the same qual-itative character. The interplay betweenhalf-life and D in governing the spread ofNO is illustrated in Figure 3, C and D. Thisfigure shows the 20% NOmax range of asingle 1 �m fiber as a function of half-lifefor different values of D. Lowering D de-creases spread. However, even for the low-est value of D (330 �m 2 � s�1; probably anunrealistically low value for NO diffusionin vivo), a 1 �m fiber still achieves the 20%NOmax concentration at just over 10 �mdistance for any half-life longer than 0.5 s(Fig. 3C, crossed hairlines). In fact, for anyvalue of D, the spread is mostly indepen-dent of the half-life, provided half-life islonger than 0.5 s (Fig. 3C). For shorterhalf-lives, between 50 ms and 0.5 s, spreadincreases more steeply with increased half-life. Importantly, however, for physiologi-cally realistic half-lives (�50 ms) and val-ues of D (�1000 �m 2 � s�1), the spread ofNO from a 1 �m source is clearly sufficientfor cooperation over distances likely to beof significance in neural systems (tens ofmicrometers) (Fig. 3D, crossed hairlines).
Finally, we consider the impact of theNO production rate Q� � 1.32 � 10�4
mol � �m�3 � s�1 on our predictions. Thevalue will vary depending on both the de-gree of activation of a particular NOS-expressing neuron and the type of neuronin question. In this context, it should benoted that very different NO concentra-tions have been reported in vivo. In rat cer-ebellar slices, electrical stimulation ele-
vated NO by 6 – 60 nM (Shibuki, 1990; Maffei et al., 2003). Incontrast, Rivot et al. (1997) estimated a basal extracellular NOconcentration of 0.5 �M in rat dorsal horn, and concentrationsexceeding 3 �M were reported after electrical stimulation of sen-sory neurons (Schulte and Millar, 2003). These discrepanciesmay reflect different production rates and/or different methodsused to measure NO. The value of Q� is therefore the least pre-cisely known parameter value in the model. Importantly, how-ever, it is also the value that least affects the conclusions of thispaper because Q� acts only as a scaling factor of concentration(Eq. 3). We emphasize this particularly for the two properties thatare key to cooperative signaling, namely, the relative drop of NOconcentration over distance from the fiber surface and the depen-dency of this drop on the source fiber diameter. For this reason,Q� does not impact on the spatial and temporal dynamics andscales over which cooperative signaling is expected to occur.
Figure 4. Cooperative volume signals produced by ordered arrays of parallel NO-synthesizing fibers after 1 s of synthesis. Fiberdiameters (2 �m) and spacing (10 �m) approximate that in the locust optic lobe (Elphick et al., 1996). A, Concentrationdistribution of NO in 300 � 300 �m 2 slices across increasing numbers of active fibers (indicated by white dots). A single fiber isa relatively ineffectual NO source (1 fiber in A). Increasing numbers of fibers separated by 10 �m result in a cumulative buildup ofNO to substantial concentrations (4 –36 fibers in A). B, As the number of fibers increases, so does the volume that is affected by anNO signal over a particular concentration, here 100 nM. C, Cooperative generation of a volume signal is robust to variation inhalf-life (t1/2) within the limits reported in the literature. When t1/2 is reduced to 100 ms (Griffiths and Garthwaite, 2001), 1⁄50 ofthe value in A, the concentrations in the target volume fall to only approximately one-third (250 – 475 vs 700 –1300 nM). Furtherreduction of t1/2 to 10 ms yields a more spiky concentration distribution with 100 nM peaks at the fibers. However, at least 50% ormore of this peak concentration is still reached everywhere throughout the target volume. D, Strong cooperation is still observedwhen t1/2 is relatively short (100 ms) and D is reduced to 1100 �m 2 � s �1, one-third of its standard value. Compared with theresult with standard D (middle part of C), the volume signal shows less encroachment into areas outside the array.
Philippides et al. • Cooperative NO Volume Signaling J. Neurosci., July 13, 2005 • 25(28):6520 – 6532 • 6525
In summary, our analysis has shownthat a diffusing signal will spread tens ofmicrometers away from a fiber source at asignificant fraction of the maximal (sur-face) concentration over a wide range ofmodel parameter values. Our predictionsconcerning cooperative volume signalingbetween separated fiber sources are there-fore robust. This is not to say, however,that extreme parameter values might notpreclude significant spread external to asource. Indeed, in the retina, it seems thatsome NOS-expressing cells retain NO be-cause of the presence of a strong, but notwell understood, NO-binding property ofthe cell membrane (Blute et al., 2000; El-dred, 2001). In this case, if NO has an in-tercellular signaling function, it must beconfined to the immediate vicinity of thesource, and cooperative signaling, if it oc-curs at all, must be between very closeneighbors only.
Cooperative NO synthesis in parallelarrays of fibersTo analyze the spatial and temporal in-teraction of signals in systems of multi-ple sources that release NO simulta-neously, we first modeled thegeometrically simple case of orderedparallel arrays of fibers. That NO cansummate within such a system was indi-cated by the model of Lancaster (1997).A real-world example of this arrangement is found in the reti-notopic projections of NOS-expressing small-field visual in-terneurons in the insect optic lobe (Elphick et al., 1996). Herenear-neighbors are activated by the same visual stimuli andhence generate NO at the same time; the angle subtended bythe visual stimulus will determine the number of parallel unitsthat are coactivated. The anatomical arrangement found in theinsect’s optic lobe was modeled with arrays of 2-�m-diameterparallel fibers with a near-neighbor separation of 10 �m.
Figure 4A shows the spatial distribution of the NO signal after1 s of simultaneous synthesis by 1, 4, 9, 16, 25, and 36 parallelNO-generating fibers. As expected, a single 2 �m fiber is ineffec-tual (Fig. 4A, 1 fiber), producing a peak NO concentration of 120nM and a sharp decline in the very close vicinity of the fiber. Incontrast, simultaneous activation of many such fibers yields sub-stantial concentrations over large regions. For instance, 36 fibersgenerate a peak of 1300 nM and the region above 100 nM extendssignificantly beyond that occupied by the array itself (Fig. 4A, 36fibers). The volume that experiences an NO signal above a givenconcentration (e.g., 100 nM) thus increases with the number ofactive sources (Fig. 4B). Recall that a single fiber fails to generatea significant volume signal principally because the speed of dif-fusion means that NO spreads rapidly away from the source,becoming diluted within a large nearby volume. It is this thatenables well-separated fibers to cooperate in raising the concen-tration of NO throughout a region.
We have already seen in Figure 3 that the spread of NO from asingle fiber is reduced a little by a half-life of 100 ms and furthercurtailed by a half-life of 10 ms. This is reflected in Figure 4C inwhich we see how cooperation between fibers occurs for half-
lives of 10, 100, and 500 ms. As expected from Figure 3, reducingthe half-life from 5 s to 500 ms has very little effect on the coop-erative volume signal generated after 1 s of synthesis (Fig. 4, com-pare bottom of C with 36 fibers in A). Further reducing the half-life to 100 and 10 ms still leads to the production of a cooperativevolume signal. In fact, without changing the fiber separation, fora half-life of only 10 ms, the entire volume occupied by the arrayexperiences an NO signal at �50% of the peak concentration(Fig. 4C, top). In an additional test of the robustness of the vol-ume signal predictions, we combine a shortened half-life (100ms) with a diffusion coefficient D reduced to one-third of thestandard value. As predicted from results obtained for single fi-bers, this combination still allows significant interaction to occurand for the consequent generation of a cooperative volume signal(Fig. 4D).
Spatial and temporal effects of source separationAlthough the above results show that separated fibers can indeedcooperate in the generation of a volume signal, it is clear that thesame volume could be affected by a variety of source configura-tions of equivalent NO-generating power, for example, by plac-ing fewer but larger sources in the same volume or by a singlelarge source at its center. However, the predominance of fine anddiffuse NOS plexus morphologies in real brains suggests that ahighly dispersed arrangement confers particular signalingadvantages.
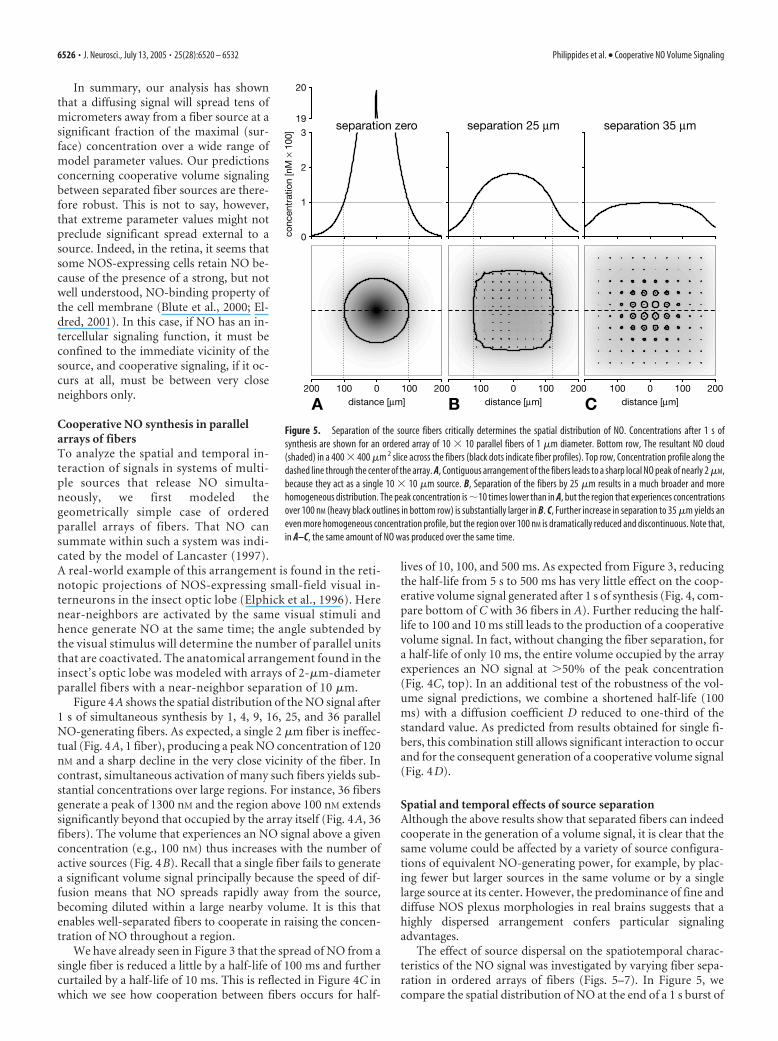
The effect of source dispersal on the spatiotemporal charac-teristics of the NO signal was investigated by varying fiber sepa-ration in ordered arrays of fibers (Figs. 5–7). In Figure 5, wecompare the spatial distribution of NO at the end of a 1 s burst of
Figure 5. Separation of the source fibers critically determines the spatial distribution of NO. Concentrations after 1 s ofsynthesis are shown for an ordered array of 10 � 10 parallel fibers of 1 �m diameter. Bottom row, The resultant NO cloud(shaded) in a 400 � 400 �m 2 slice across the fibers (black dots indicate fiber profiles). Top row, Concentration profile along thedashed line through the center of the array. A, Contiguous arrangement of the fibers leads to a sharp local NO peak of nearly 2 �M,because they act as a single 10 � 10 �m source. B, Separation of the fibers by 25 �m results in a much broader and morehomogeneous distribution. The peak concentration is 10 times lower than in A, but the region that experiences concentrationsover 100 nM (heavy black outlines in bottom row) is substantially larger in B. C, Further increase in separation to 35 �m yields aneven more homogeneous concentration profile, but the region over 100 nM is dramatically reduced and discontinuous. Note that,in A–C, the same amount of NO was produced over the same time.
6526 • J. Neurosci., July 13, 2005 • 25(28):6520 – 6532 Philippides et al. • Cooperative NO Volume Signaling

NO synthesis by 100 identical 1-�m-diameter fibers arrangedcontiguously, in effect a single source (Fig. 5A), or separated by 25�m (Fig. 5B) or 35 �m (Fig. 5C). The most obvious effect of fiberseparation is uniformity of the NO signal in space. Whereas acontiguous arrangement (zero separation) results in a sharp localpeak reaching 2000 nM (Fig. 5A), a separation of 25 �m gives amuch broader spatial distribution with a peak concentration ofless than 1⁄10 of this value (Fig. 5B). Moreover, the volume thatexperiences low concentrations is considerably larger when thesources are separated. Therefore, as long as separated fibers arecapable of cooperating enough to produce an effective signal (ofsay at least 100 nM), separation extends the affected volume (Fig.5, compare A, B, heavy black outlines in bottom panels). Indeed,depending on the concentration required to activate targetswithin a region, separation can be increased to affect a volumemany times the size affected by a single large source producingthe same amount of NO. For instance, assuming threshold con-centrations of 100, 10, and 1 nM, 100 evenly separated fibers canaffect regions 1.8�, 8�, and 24� greater than that affected by thesame fibers acting as a single source at the center. Clearly, how-ever, if the separation is too great, NO from neighboring fibersmay fail to reach the effective concentration. This is illustrated inFigure 5C in which the separation is 35 �m and the nominaleffective concentration is set to 100 nM. Notice, however, that thegreater separation has also resulted in an even more uniformdistribution of NO and that, at the end of the synthesis burst,
most of the region covered by the array experiences the sameconcentration.
The greater spatial uniformity of the signal also results ingreater temporal uniformity across the target volume. This effectof separation on the temporal dynamics is illustrated in Figure 6.Within the dispersed array (separation of 25 �m), the NO con-centration at the center and at 50 and 100 �m from the centerdevelops very similarly over time during synthesis (Fig. 6A). Incontrast, when the same amount of NO is generated by the samefibers acting as a single source, the signal rises very rapidly at thecenter, but the rate of increase at distances 50 and 100 �m fromthe center is markedly slower (Fig. 6B). Another, but less obvious,consequence of reducing separation is that the NO concentrationat points distant from the sources will continue to rise for a sig-nificant period of time after the end of synthesis. This effect canbe seen in Figure 6B for the 100 �m distance, in which the NO
Figure 6. Separation of the source fibers promotes synchrony and uniformity of the NOvolume signal. Local NO concentrations generated during and after 1 s of synthesis by an or-dered array of 10 � 10 fibers (fiber diameter of 1 �m), measured at three points: at the centerof the array (solid lines) and 50 �m (dashed lines) and 100 �m (dotted lines) away from thecenter. The duration of synthesis indicated by gray rectangles in bottom row. Top row, Points ofmeasurement and fiber profiles (black dots) superimposed on a snapshot of the spatial NOdistribution (shaded) at the end of synthesis (arrows). A, Fibers separated by 25 �m. The entireregion synchronously experiences a very similar time course of NO that is characterized by arelatively slow and approximately linear rise and fall. B, Fibers arranged contiguously so they actas a single 10 � 10 �m source. The center instantaneously experiences concentrations far inexcess of 100 nM; rise and fall are highly nonlinear. Points away from the center encounter amuch slower rise and fall with different temporal characteristics depending on their distancefrom the center. In particular, the farther from the center, the longer NO continues to rise afterthe end of synthesis.
Figure 7. Delayed volume signaling by separated NO sources (10 � 10 array of 1-�m-diameter NO-synthesizing fibers separated by 25 �m). A, B, Spatial concentration distributionsat three time points after the onset of synthesis: 500 ms (i), 515 ms (ii), and 530 ms (iii). A, NOconcentration profiles across the center of the array, along the dashed line in B. For illustrativepurposes, a nominal threshold concentration of 100 nM is assumed (dotted line in A). B showsthe region over 100 nM (gray) in cross sections through the array (fibers are indicated by blackdots). There is a substantial delay between the onset of synthesis and NO reaching 100 nM
anywhere within the volume of the array. After 500 ms of continuous synthesis (i in A, B), NOreaches 100 nM in the vicinity of central fibers. Additional synthesis pushes a large part of thetarget volume near simultaneously over 100 nM (ii, iii in A, B). C, Plotting the volume thatexperiences �100 nM NO over time shows a sharp, nonlinear rise after an initial delay of 500ms (solid line). Three hairlines with arrows indicate the time points shown in A and B. Alsoshown for comparison is the near-linear rise (dotted line in C) that is observed for the volumeover 100 nM when the same 10 � 10 fibers are arranged contiguously as a single source.
Philippides et al. • Cooperative NO Volume Signaling J. Neurosci., July 13, 2005 • 25(28):6520 – 6532 • 6527
concentration continues to rise for 0.5 s after the end of the syn-thesis pulse. The postsynthesis rise is attributable to the NO thataccumulated at the center during synthesis flowing out into moredistant regions after the end of synthesis.
Source separation has one additional and important conse-quence. There is a substantial delay before the cooperation be-tween separated sources becomes significant, i.e., reaches a nom-inal threshold of say 100 nM (Fig. 7). During synthesis,concentration rises steadily throughout the region containing thesources until it is just below 100 nM in a large fraction of thatregion (Fig. 7A,B, i). Any additional synthesis now pushes theentire volume, more or less simultaneously, over the nominalthreshold (Fig. 7A,B, ii, iii). By examining the size of the regionover 100 nM (Fig. 7B, gray areas), one therefore sees a delay of 0.5 s before this concentration is reached anywhere, but, overthe next few tens of milliseconds of synthesis, the volume over100 nM rises rapidly (Fig. 7C, solid line). In contrast, the samefibers with no separation generate a concentration above 100 nM
almost immediately, and the region above that concentrationrises linearly during synthesis (Fig. 7C, dotted line). Althoughcounterintuitive in view of the high speed of NO diffusion, thedelay is attributable to the time taken for NO from separate fibersto build up to a significant concentration at any point within thearray. The length of delay will of course depend on what concen-tration is effective and the fiber separation. Although these fac-tors will vary, whenever an effect requires NO from multiplesources to summate, there will be a delay. The delay can be re-garded as a low-pass filter because there must be persistent NOsynthesis before separated fibers can generate an effective signal.
Cooperative NO synthesis in a random plexusBy modeling ordered arrays, we have seen how cooperating smallfibers can produce an evenly spread NO volume signal. Here wepresent results obtained for randomly branched fibers that betterapproximate the plexus morphology found in real brains. Be-cause the aim is to gain insight into the consequences of plexusfineness, we compared signals generated by plexuses composed ofeither 1 or 5 �m diameter fibers. The plexuses were “grown”randomly within a defined bounding volume (the synthesizingvolume), and the sum total of source fiber volume, and hence thetotal rate of synthesis within the volume, was the same for the fine(1 �m) and coarse (5 �m) plexuses.
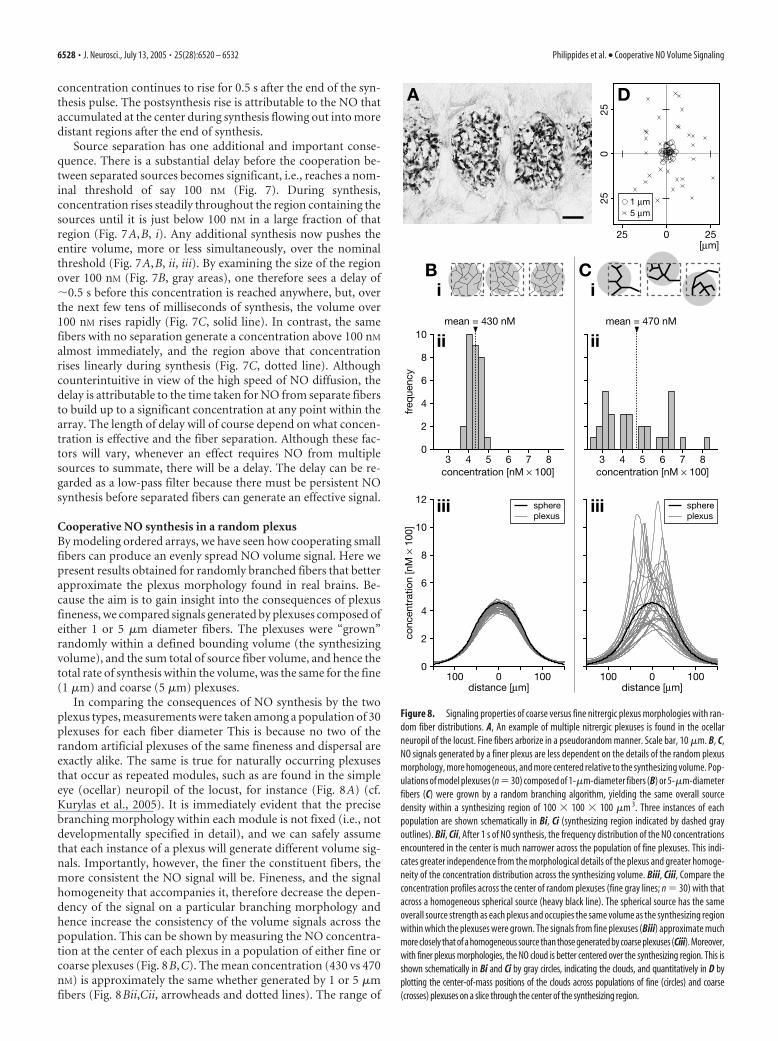
In comparing the consequences of NO synthesis by the twoplexus types, measurements were taken among a population of 30plexuses for each fiber diameter This is because no two of therandom artificial plexuses of the same fineness and dispersal areexactly alike. The same is true for naturally occurring plexusesthat occur as repeated modules, such as are found in the simpleeye (ocellar) neuropil of the locust, for instance (Fig. 8A) (cf.Kurylas et al., 2005). It is immediately evident that the precisebranching morphology within each module is not fixed (i.e., notdevelopmentally specified in detail), and we can safely assumethat each instance of a plexus will generate different volume sig-nals. Importantly, however, the finer the constituent fibers, themore consistent the NO signal will be. Fineness, and the signalhomogeneity that accompanies it, therefore decrease the depen-dency of the signal on a particular branching morphology andhence increase the consistency of the volume signals across thepopulation. This can be shown by measuring the NO concentra-tion at the center of each plexus in a population of either fine orcoarse plexuses (Fig. 8B,C). The mean concentration (430 vs 470nM) is approximately the same whether generated by 1 or 5 �mfibers (Fig. 8Bii,Cii, arrowheads and dotted lines). The range of
Figure 8. Signaling properties of coarse versus fine nitrergic plexus morphologies with ran-dom fiber distributions. A, An example of multiple nitrergic plexuses is found in the ocellarneuropil of the locust. Fine fibers arborize in a pseudorandom manner. Scale bar, 10 �m. B, C,NO signals generated by a finer plexus are less dependent on the details of the random plexusmorphology, more homogeneous, and more centered relative to the synthesizing volume. Pop-ulations of model plexuses (n�30) composed of 1-�m-diameter fibers (B) or 5-�m-diameterfibers (C) were grown by a random branching algorithm, yielding the same overall sourcedensity within a synthesizing region of 100 � 100 � 100 �m 3. Three instances of eachpopulation are shown schematically in Bi, Ci (synthesizing region indicated by dashed grayoutlines). Bii, Cii, After 1 s of NO synthesis, the frequency distribution of the NO concentrationsencountered in the center is much narrower across the population of fine plexuses. This indi-cates greater independence from the morphological details of the plexus and greater homoge-neity of the concentration distribution across the synthesizing volume. Biii, Ciii, Compare theconcentration profiles across the center of random plexuses (fine gray lines; n � 30) with thatacross a homogeneous spherical source (heavy black line). The spherical source has the sameoverall source strength as each plexus and occupies the same volume as the synthesizing regionwithin which the plexuses were grown. The signals from fine plexuses (Biii) approximate muchmore closely that of a homogeneous source than those generated by coarse plexuses (Ciii). Moreover,with finer plexus morphologies, the NO cloud is better centered over the synthesizing region. This isshown schematically in Bi and Ci by gray circles, indicating the clouds, and quantitatively in D byplotting the center-of-mass positions of the clouds across populations of fine (circles) and coarse(crosses) plexuses on a slice through the center of the synthesizing region.
6528 • J. Neurosci., July 13, 2005 • 25(28):6520 – 6532 Philippides et al. • Cooperative NO Volume Signaling
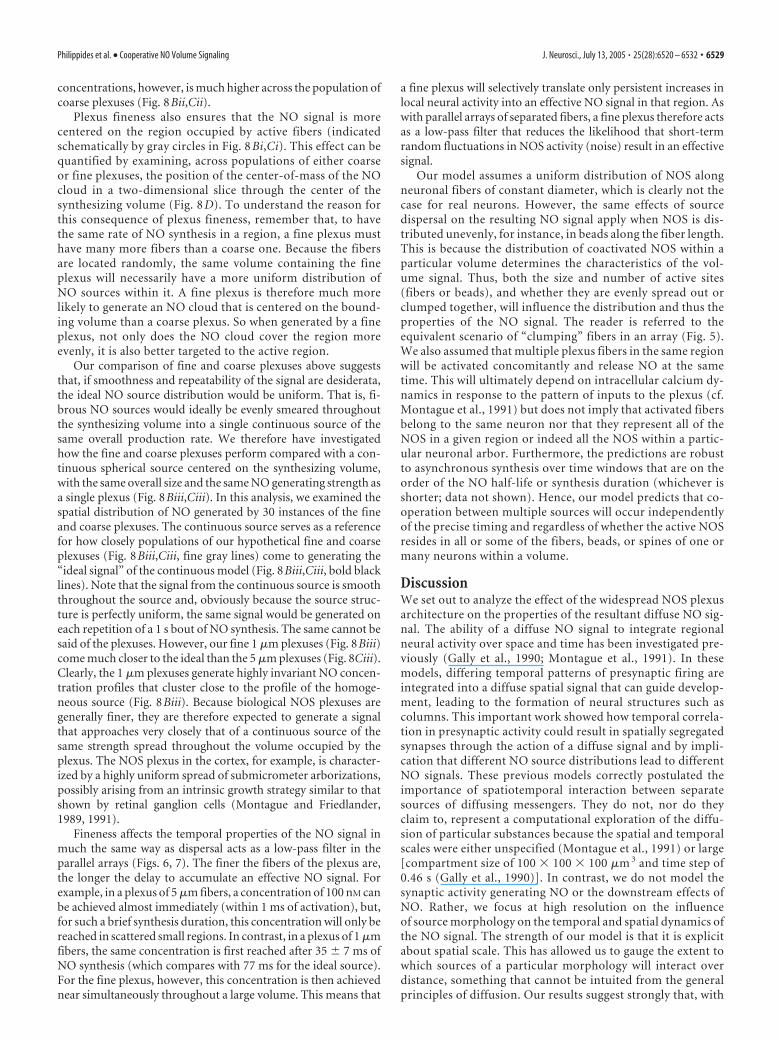
concentrations, however, is much higher across the population ofcoarse plexuses (Fig. 8Bii,Cii).
Plexus fineness also ensures that the NO signal is morecentered on the region occupied by active fibers (indicatedschematically by gray circles in Fig. 8 Bi,Ci). This effect can bequantified by examining, across populations of either coarseor fine plexuses, the position of the center-of-mass of the NOcloud in a two-dimensional slice through the center of thesynthesizing volume (Fig. 8 D). To understand the reason forthis consequence of plexus fineness, remember that, to havethe same rate of NO synthesis in a region, a fine plexus musthave many more fibers than a coarse one. Because the fibersare located randomly, the same volume containing the fineplexus will necessarily have a more uniform distribution ofNO sources within it. A fine plexus is therefore much morelikely to generate an NO cloud that is centered on the bound-ing volume than a coarse plexus. So when generated by a fineplexus, not only does the NO cloud cover the region moreevenly, it is also better targeted to the active region.
Our comparison of fine and coarse plexuses above suggeststhat, if smoothness and repeatability of the signal are desiderata,the ideal NO source distribution would be uniform. That is, fi-brous NO sources would ideally be evenly smeared throughoutthe synthesizing volume into a single continuous source of thesame overall production rate. We therefore have investigatedhow the fine and coarse plexuses perform compared with a con-tinuous spherical source centered on the synthesizing volume,with the same overall size and the same NO generating strength asa single plexus (Fig. 8Biii,Ciii). In this analysis, we examined thespatial distribution of NO generated by 30 instances of the fineand coarse plexuses. The continuous source serves as a referencefor how closely populations of our hypothetical fine and coarseplexuses (Fig. 8Biii,Ciii, fine gray lines) come to generating the“ideal signal” of the continuous model (Fig. 8Biii,Ciii, bold blacklines). Note that the signal from the continuous source is smooththroughout the source and, obviously because the source struc-ture is perfectly uniform, the same signal would be generated oneach repetition of a 1 s bout of NO synthesis. The same cannot besaid of the plexuses. However, our fine 1 �m plexuses (Fig. 8Biii)come much closer to the ideal than the 5 �m plexuses (Fig. 8Ciii).Clearly, the 1 �m plexuses generate highly invariant NO concen-tration profiles that cluster close to the profile of the homoge-neous source (Fig. 8Biii). Because biological NOS plexuses aregenerally finer, they are therefore expected to generate a signalthat approaches very closely that of a continuous source of thesame strength spread throughout the volume occupied by theplexus. The NOS plexus in the cortex, for example, is character-ized by a highly uniform spread of submicrometer arborizations,possibly arising from an intrinsic growth strategy similar to thatshown by retinal ganglion cells (Montague and Friedlander,1989, 1991).
Fineness affects the temporal properties of the NO signal inmuch the same way as dispersal acts as a low-pass filter in theparallel arrays (Figs. 6, 7). The finer the fibers of the plexus are,the longer the delay to accumulate an effective NO signal. Forexample, in a plexus of 5 �m fibers, a concentration of 100 nM canbe achieved almost immediately (within 1 ms of activation), but,for such a brief synthesis duration, this concentration will only bereached in scattered small regions. In contrast, in a plexus of 1 �mfibers, the same concentration is first reached after 35 � 7 ms ofNO synthesis (which compares with 77 ms for the ideal source).For the fine plexus, however, this concentration is then achievednear simultaneously throughout a large volume. This means that
a fine plexus will selectively translate only persistent increases inlocal neural activity into an effective NO signal in that region. Aswith parallel arrays of separated fibers, a fine plexus therefore actsas a low-pass filter that reduces the likelihood that short-termrandom fluctuations in NOS activity (noise) result in an effectivesignal.
Our model assumes a uniform distribution of NOS alongneuronal fibers of constant diameter, which is clearly not thecase for real neurons. However, the same effects of sourcedispersal on the resulting NO signal apply when NOS is dis-tributed unevenly, for instance, in beads along the fiber length.This is because the distribution of coactivated NOS within aparticular volume determines the characteristics of the vol-ume signal. Thus, both the size and number of active sites(fibers or beads), and whether they are evenly spread out orclumped together, will influence the distribution and thus theproperties of the NO signal. The reader is referred to theequivalent scenario of “clumping” fibers in an array (Fig. 5).We also assumed that multiple plexus fibers in the same regionwill be activated concomitantly and release NO at the sametime. This will ultimately depend on intracellular calcium dy-namics in response to the pattern of inputs to the plexus (cf.Montague et al., 1991) but does not imply that activated fibersbelong to the same neuron nor that they represent all of theNOS in a given region or indeed all the NOS within a partic-ular neuronal arbor. Furthermore, the predictions are robustto asynchronous synthesis over time windows that are on theorder of the NO half-life or synthesis duration (whichever isshorter; data not shown). Hence, our model predicts that co-operation between multiple sources will occur independentlyof the precise timing and regardless of whether the active NOSresides in all or some of the fibers, beads, or spines of one ormany neurons within a volume.
DiscussionWe set out to analyze the effect of the widespread NOS plexusarchitecture on the properties of the resultant diffuse NO sig-nal. The ability of a diffuse NO signal to integrate regionalneural activity over space and time has been investigated pre-viously (Gally et al., 1990; Montague et al., 1991). In thesemodels, differing temporal patterns of presynaptic firing areintegrated into a diffuse spatial signal that can guide develop-ment, leading to the formation of neural structures such ascolumns. This important work showed how temporal correla-tion in presynaptic activity could result in spatially segregatedsynapses through the action of a diffuse signal and by impli-cation that different NO source distributions lead to differentNO signals. These previous models correctly postulated theimportance of spatiotemporal interaction between separatesources of diffusing messengers. They do not, nor do theyclaim to, represent a computational exploration of the diffu-sion of particular substances because the spatial and temporalscales were either unspecified (Montague et al., 1991) or large[compartment size of 100 � 100 � 100 �m 3 and time step of0.46 s (Gally et al., 1990)]. In contrast, we do not model thesynaptic activity generating NO or the downstream effects ofNO. Rather, we focus at high resolution on the influenceof source morphology on the temporal and spatial dynamics ofthe NO signal. The strength of our model is that it is explicitabout spatial scale. This has allowed us to gauge the extent towhich sources of a particular morphology will interact overdistance, something that cannot be intuited from the generalprinciples of diffusion. Our results suggest strongly that, with
Philippides et al. • Cooperative NO Volume Signaling J. Neurosci., July 13, 2005 • 25(28):6520 – 6532 • 6529

sources approximating neurons in size and shape, cooperativeinteraction will occur over distances of tens of micrometers.
By modeling the spread of NO from multiple fibers, we havedemonstrated that their diameter and dispersal significantlyshape the spatial and temporal dynamics of the signal. We con-clude that there are distinct functional advantages to using verysmall and dispersed sources over an arguably simpler system us-ing fewer larger ones. A plexus of very fine fibers favors fourinterrelated aspects of the ensuing NO signal, namely, (1) coop-erative dispersal over an extensive region, (2) homogeneitywithin the region, (3) regional targeting, and (4) selective respon-siveness to persistent regional activity. Ultrafine plexus morphol-ogies thus appear to be configured to generate a homogeneouscooperative volume signal that complements conventional syn-aptic neurotransmission. The question of neuronal fineness hasalso been discussed in the context of point-to-point synaptictransmission. Neurons are thought to be selected for fine andhighly branched processes, first, because it allows a cell to cover avolume without occupying a significant proportion of that vol-ume, and second, because it allows many neurons to cover aparticular volume (Montague and Friedlander, 1991). Our anal-ysis suggests an additional potential evolutionary pressure to-ward fineness that applies specifically to neurons that use diffus-ible signals.
Central to our functional interpretation is that the size of anNO source will limit its radius of action. It is clear from resultspresented here and previously (Philippides et al., 2000, 2003) thatthis is the case regardless of what constitutes an effective NOconcentration [a subject of ongoing debate (Artz et al., 2001; Moet al., 2004)]. The limiting effect of source size has been con-firmed experimentally in clusters of macrophages comprisingvariable numbers of cells (Porterfield et al., 2001). Moreover,experimental data from neuronal systems suggest that, unlessthere is some retention factor, this range is on the order of 10 �mfor neuronal fibers of 5 �m diameter (Blute et al., 2000), in-creasing to 100 �m for larger sources (Park et al., 1998). Theprincipal reason why very small fibers fail to achieve significantconcentrations in their vicinity is the high speed of diffusion,resulting in the rapid spread of NO, which achieves a very lowconcentration in an extensive volume around the small source.Thus, the same feature of NO diffusion that prevents smallsources from acting alone allows cooperation between them. Ofcourse, if there is exceptionally rapid destruction of NO, or strongNO retention as suggested in some retinal neurons (Blute et al.,2000; Eldred, 2001), cooperation will be significantly limited. In-deed the uncertainty about the spread and half-life of NO in vivorequires predictions based on models of NO diffusion to be rela-tively insensitive to reasonable variations in the values of thesekey parameters. We have shown that cooperative volume signal-ing is likely to occur over a wide range of parameter values thatgovern the spread of NO. We do not want to imply, however, thatthe spatial and temporal characteristics of volume signaling wedescribe are exclusive to NO. On the contrary, we would expect tocome to a similar conclusion about other transmitters that arereleased by neuronal plexuses so long as their spread is isotropicand rapid. Our predictions may not therefore describe accuratelythe spread of larger polar transmitters such as dopamine, whichnonetheless is known to mediate volume signaling (Cragg et al.,2001).
In some neurons, for instance, in the retina, NOS is expressedspecifically at synaptic sites (Cao and Eldred, 2001). Also, in asubset of CA1 dendritic spines in the mammalian hippocampus,NOS is concentrated at postsynaptic densities (Burette et al.,
2002). Moreover, 50% of these NOS-positive spines are in di-rect apposition to presynaptic endings that contain the NO re-ceptor sGC. Together, these observations suggest that, in somecircumstances, NO acts as a local synapse-specific transmitter.Whether NO can perform this function without cooperation be-tween synapses will depend on the sensitivity of its receptors.Although our model does not rule out synapse-specific signaling,it does indicate that the NO concentration at a single active syn-apse is limited by the size of individual synaptic sources. In themammalian cerebral cortical plexus, NOS is clearly not confinedto the synapse. The same applies to some hippocampal neurons(Burette et al., 2002) and to plexus neurons in invertebrate brains(Elphick et al., 1996; Ott and Burrows, 1998; Ott and Elphick,2002; Kurylas et al., 2005). In all of these situations, even in neu-rons in which NOS is highly localized to the synapse, as NO willspread, significant cooperation between synapses is possible. Di-rect evidence for a physiologically relevant spread of NO overdistances exceeding 150 �m has been obtained in heterosynapticlong-term depression and potentiation in the rat cerebellum(Hartell, 1996; Jacoby et al., 2001). These data predict that cere-bellar long-term depression and potentiation will not be inputspecific at the single cell level under conditions that give rise toNO/cGMP production (Hartell, 2001).
A key feature of the signal generated by suitably dispersedsources is uniformity in space and time throughout the volume.Thus, cooperating systems of fine fibers avoid the generation of“hot spots” of potentially toxic NO concentrations. Moreover,the spatial uniformity of the signal suggests that, rather than in-dividual NO sources affecting individual targets, the plexus af-fects targets within the volume of the brain in which the plexusand targets coexist. This idea may help to account for the ability ofNOS plexus neurons in the mammalian cerebral cortex to trans-late increased regional neuronal activity into a regionally targetedincrease in cerebral blood supply (for review, see Estrada andDeFelipe, 1998). Although some individual fibers of the plexus docome into close apposition to arterioles (DeFelipe, 1993; Estradaand DeFelipe, 1998; Lovick et al., 1999), our analysis suggests thatsuch direct targeting could contribute only weakly to NO-mediated vasodilation. According to our model, however, thefact that a majority of cortical plexus fibers do not contact arte-rioles does not matter because the whole plexus is suited morpho-logically to generate a regional signal. Such a signal would inte-grate the energy demand in a volume of cortex and relate it to itsvascular supply, as hypothesized by Gally et al. (1990). In thisinterpretation, the low-pass filtering predicted for plexus-mediated signaling acquires functional significance because itwould ensure only a persistent and regional increase in neuralactivity causes vasodilation.
Whether NO is targeting blood vessels or other targets in thebrain, the same spatial and temporal properties of plexus-derivedNO volume signals will apply. It is these functional propertiesthat strongly suggest a role for plexuses in the integration of brainactivity in space and time. We propose that the properties pre-dicted by our model may in part explain the presence of ultra-fine plexus morphologies in distantly related animals and in avariety of functional contexts. That is, the plexus morphologymay represent a general structural adaptation for cooperativevolume signaling by NO and by other diffusing messengermolecules.
ReferencesAmes W (1992) Numerical methods for partial differential equations, Ed 3.
Boston: Academic.
6530 • J. Neurosci., July 13, 2005 • 25(28):6520 – 6532 Philippides et al. • Cooperative NO Volume Signaling

Artz JD, Toader V, Zavorin SI, Bennett BM, Thatcher GR (2001) In vitroactivation of soluble guanylyl cyclase and nitric oxide release: comparisonof NO donors and NO mimetics. Biochemistry 40:9256 –9264.
Bellamy TC, Griffiths C, Garthwaite J (2002) Differential sensitivity of gua-nylyl cyclase and mitochondrial respiration to nitric oxide measured us-ing clamped concentrations. J Biol Chem 277:31801–31807.
Blute TA, Lee MR, Eldred WD (2000) Direct imaging of nMDA-stimulatednitric oxide production in the retina. Vis Neurosci 17:557–566.
Bon CL, Garthwaite J (2001) Exogenous nitric oxide causes potentiation ofhippocampal synaptic transmission during low-frequency stimulation viathe endogenous nitric oxide-cGMP pathway. Eur J Neurosci 14:585–594.
Bon CL, Garthwaite J (2002) Adenosine acting on A1 receptors protectsNO-triggered rebound potentiation and LTP in rat hippocampal slices.J Neurophysiol 87:1781–1789.
Bredt DS, Glatt CE, Hwang PM, Fotuhi M, Dawson TM, Snyder SH (1991)Nitric oxide synthase protein and mRNA are discretely localized in neu-ronal populations of the mammalian CNS together with NADPH diaph-orase. Neuron 7:615– 624.
Burette A, Zabel U, Weinberg RJ, Schmidt HH, Valtschanoff JG (2002) Syn-aptic localization of nitric oxide synthase and soluble guanylyl cyclase inthe hippocampus. J Neurosci 22:8961– 8970.
Cao L, Eldred WD (2001) Subcellular localization of neuronal nitric oxidesynthase in turtle retina: electron immunocytochemistry. Vis Neurosci18:949 –960.
Carslaw H, Jaeger J (1959) Conduction of heat in solids. London:Oxford UP.
Cragg SJ, Nicholson C, Kume-Kick J, Tao L, Rice ME (2001) Dopamine-mediated volume transmission in midbrain is regulated by distinct extra-cellular geometry and uptake. J Neurophysiol 85:1761–1771.
Davies S (2000) Nitric oxide signalling in insects. Insect Biochem Mol Biol30:1123–1138.
Davis P, Rabinowitz P (1984) Methods of numerical integration, Ed 2. Or-lando, FL: Academic.
Dawson TM, Bredt DS, Fotuhi M, Hwang PM, Snyder SH (1991) Nitricoxide synthase and neuronal NADPH diaphorase are identical in brainand peripheral tissues. Proc Natl Acad Sci USA 88:7797–7801.
DeFelipe J (1993) A study of NADPH diaphorase-positive axonal plexusesin the human temporal cortex. Brain Res 615:342–346.
Di Cosmo A, Di Cristo C, Palumbo A, d’Ischia M, Messenger JB (2000)Nitric oxide synthase (NOS) in the brain of the cephalopod Sepia offici-nalis. J Comp Neurol 428:411– 427.
Edelman GM, Gally JA (1992) Nitric oxide: linking space and time in thebrain. Proc Natl Acad Sci USA 89:11651–11652.
Eldred W (2001) Real time imaging of the production and movement ofnitric oxide in the retina. Prog Brain Res 131:109 –122.
Elphick M, Williams L, O’Shea M (1996) New features of the locust opticlobe: evidence of a role for nitric oxide in insect vision. J Exp Biol199:2395–2407.
Estrada C, DeFelipe J (1998) Nitric oxide-producing neurons in the neocor-tex: morphological and functional relationship with intraparenchymalmicrovasculature. Cereb Cortex 8:193–203.
Gally JA, Montague PR, Reeke Jr GN, Edelman GM (1990) The NO hypoth-esis: possible effects of a short-lived, rapidly diffusible signal in the devel-opment and function of the nervous system. Proc Natl Acad Sci USA87:3547–3551.
Garthwaite J, Boulton CL (1995) Nitric oxide signaling in the central ner-vous system. Annu Rev Physiol 57:683–706.
Griffiths C, Garthwaite J (2001) The shaping of nitric oxide signals by acellular sink. J Physiol (Lond) 536:855– 862.
Hartell NA (1996) Strong activation of parallel fibers produces localizedcalcium transients and a form of LTD that spreads to distant synapses.Neuron 16:601– 610.
Hartell NA (2001) Receptors, second messengers and protein kinases re-quired for heterosynaptic cerebellar long-term depression. Neurophar-macology 40:148 –161.
Hope BT, Michael GJ, Knigge KM, Vincent SR (1991) Neuronal NADPHdiaphorase is a nitric oxide synthase. Proc Natl Acad Sci USA88:2811–2814.
Jacklet JW (2001) Nitric oxide as a neuronal messenger. Encyclopedia ofLife Sciences, Nature Publishing, www.els.net.
Jacoby S, Sims RE, Hartell NA (2001) Nitric oxide is required for the induc-
tion and heterosynaptic spread of long-term potentiation in rat cerebellarslices. J Physiol (Lond) 535:825– 839.
Kelm M, Schrader J (1990) Control of coronary vascular tone by nitric ox-ide. Circ Res 66:1561–1575.
Kurylas AE, Ott SR, Schachtner J, Elphick MR, Homberg U (2005) Local-ization of nitric oxide synthase in the central complex and surroundingmidbrain neuropils of the locust Schistocerca gregaria. J Comp Neurol484:206 –223.
Lancaster Jr JR (1994) Simulation of the diffusion and reaction of endog-enously produced nitric oxide. Proc Natl Acad Sci USA 9:8137– 8141.
Lancaster Jr JR (1997) A tutorial on the diffusibility and reactivity of freenitric oxide. Nitric Oxide 1:18 –30.
Liu X, Miller MJ, Joshi MS, Sadowska-Krowicka H, Clark DA, Lancaster Jr JR(1998) Diffusion-limited reaction of free nitric oxide with erythrocytes.J Biol Chem 273:18709 –18713.
Liu X, Samouilov A, Lancaster Jr JR, Zweier JL (2002) Nitric oxide uptake byerythrocytes is primarily limited by extracellular diffusion not membraneresistance. J Biol Chem 277:26194 –26199.
Lovick TA, Brown LA, Key BJ (1999) Neurovascular relationships in hip-pocampal slices: physiological and anatomical studies of mechanisms un-derlying flow-metabolism coupling in intraparenchymal microvessels.Neuroscience 92:47– 60.
Maffei A, Prestori F, Shibuki K, Rossi P, Taglietti V, D’Angelo E (2003) NOenhances presynaptic currents during cerebellar mossy fiber-granule cellLTP. J Neurophysiol 90:2478 –2483.
Malinski T, Taha Z, Grunfeld S, Patton S, Kapturczak M, Tombouliant P(1993) Diffusion of nitric oxide in the aorta wall monitored in situby porphyrinic microsensors. Biochem Biophys Res Commun193:1076 –1082.
Mo E, Amin H, Bianco IH, Garthwaite J (2004) Kinetics of a cellularnitric oxide/cGMP/phosphodiesterase-5 pathway. J Biol Chem279:26149 –26158.
Moncada S, Palmer R, Higgs E (1989) Biosynthesis of nitric oxide fromL-arginine. A pathway for the regulation of cell function and communi-cation. Biochem Pharmacol 38:1709 –1715.
Montague PR, Friedlander MJ (1989) Expression of an intrinsic growthstrategy by mammalian retinal neurons. Proc Natl Acad Sci USA86:7223–7227.
Montague PR, Friedlander MJ (1991) Morphogenesis and territorial coverageby isolated mammalian retinal ganglion cells. J Neurosci 11:1440–1457.
Montague PR, Gally JA, Edelman GM (1991) Spatial signaling in the devel-opment and function of neural connections. Cereb Cortex 1:199 –220.
O’Shea M, Colbert R, Williams L, Dunn S (1997) Nitric oxide compart-ments in the mushroom bodies of the locust brain. NeuroReport9:333–336.
Ott SR, Burrows M (1998) Nitric oxide synthase in the thoracic ganglia ofthe locust: distribution in the neuropiles and morphology of neurones.J Comp Neurol 395:217–230.
Ott SR, Elphick MR (2002) Nitric oxide synthase histochemistry in insectnervous systems: methanol/formalin fixation reveals the neuroarchitec-ture of formaldehyde-sensitive NADPH diaphorase in the cockroachPeriplaneta americana. J Comp Neurol 448:165–185.
Ott SR, Elphick MR (2003) New techniques for whole-mount NADPH-diaphorase histochemistry demonstrated in insect ganglia. J HistochemCytochem 51:523–532.
Ott SR, Burrows M, Elphick MR (2001) The neuroanatomy of nitric oxide–cyclic GMP signaling in the locust: functional implications for sensorysystems. Am Zool 41:321–331.
Park JH, Straub VA, O’Shea M (1998) Anterograde signaling by nitric oxide:characterization and in vitro reconstitution of an identified nitrergic syn-apse. J Neurosci 18:5463–5476.
Philippides A (2001) Modelling the diffusion of nitric oxide in brains. PhDthesis, University of Sussex.
Philippides A, Husbands P, O’Shea M (2000) Four-dimensional neuronalsignaling by nitric oxide: a computational analysis. J Neurosci20:1199 –1207.
Philippides A, Husbands P, Smith T, O’Shea M (2003) Structure basedmodels of NO diffusion in the nervous system. In: Computational neu-roscience: a comprehensive approach (Feng J, ed), pp 97–130. London,UK: Chapman and Hall/CRC.
Porterfield DM, Laskin JD, Jung SK, Malchow RP, Billack B, Smith PJ, Heck
Philippides et al. • Cooperative NO Volume Signaling J. Neurosci., July 13, 2005 • 25(28):6520 – 6532 • 6531

DE (2001) Proteins and lipids define the diffusional field of nitric oxide.Am J Physiol Lung Cell Mol Physiol 281:L904 –L912.
Press W, Teukolsky S, Vetterling W, Flannery B (1992) Numerical reci-pes in C: the art of scientific computing, Ed 2. New York:Cambridge UP.
Rivot JP, Barraud J, Montecot C, Jost B, Besson JM (1997) Nitric oxide(NO): in vivo electrochemical monitoring in the dorsal horn of the spinalcord of the rat. Brain Res 773:66 –75.
Schulte D, Millar J (2003) The effects of high- and low-intensity percutane-ous stimulation on nitric oxide levels and spike activity in the superficiallaminae of the spinal cord. Pain 103:139 –150.
Shibuki K (1990) An electrochemical microprobe for detecting nitric oxiderelease in brain tissue. Neurosci Res 9:69 –76.
Thomas DT, Liu X, Kantrow SP, Lancaster Jr JR (2001) The biological life-time of nitric oxide: implications for the perivascular dynamics of NO andO2. Proc Natl Acad Sci USA 98:355–360.
Vaughn M, Kuo L, Liao J (1998a) Effective diffusion distance of nitric oxidein the microcirculation. Am J Physiol 274:1705–1714.
Vaughn M, Kuo L, Liao J (1998b) Estimation of nitric oxide production andreaction rates in tissue by use of a mathematical model. Am J Physiol274:2163–2176.
Vincent SR, Kimura H (1992) Histochemical mapping of nitric oxide syn-thase in the rat brain. Neuroscience 46:755–784.
Wood J, Garthwaite J (1994) Models of the diffusional spread of nitric ox-ide: Implications for neural nitric oxide signalling and its pharmacologi-cal properties. Neuropharmacology 33:1235–1244.
6532 • J. Neurosci., July 13, 2005 • 25(28):6520 – 6532 Philippides et al. • Cooperative NO Volume Signaling