Modeling changes in milled rice ( Oryza sativa L.) kernel dimensions during soaking by image...
11
Modeling changes in milled rice (Oryza sativa L.) kernel dimensions during soaking by image analysis B.K. Yadav * , V.K. Jindal Food Engineering and Bioprocess Technology, Asian Institute of Technology, P.O. Box 4, Klongluang, Pathumathani 12120, Thailand Abstract Tests were performed for milled whole kernels of ten Thai rice varieties ranging from low to high amylose content (16–29%) with three initial moisture levels (approximately, 8, 12 and 16% d.b.) for monitoring the dimensional changes in rice kernels during soaking in rela- tion to the varietal differences manifested by the physicochemical properties. It was observed that the two-dimensional shape factor of the milled rice kernel remains constant during whole soaking duration. The change in kernel dimension during soaking could be best expressed by a modified exponential relationship with the R 2 for fitting ranging, respectively, from 0.983–0.999, 0.985–0.999, 0.984– 0.999 and 0.985–1.000 for kernel length, width, perimeter and projected area for all rice varieties. The parameters of the fitted relation- ship for describing changes in kernel dimensions during soaking were found to be the function of initial moisture content and physico- chemical properties of rice varieties under study. The dimensional features, namely, length, width, perimeter and projected area of milled rice kernel during soaking could be estimated from its initial moisture content and physicochemical properties such as amylose content, alkali spreading value, and protein content within ±5% of the experimental value. Keywords: Rice; Soaking; Dimensional change; Water uptake; Image analysis; Machine vision; Variety 1. Introduction Rice (Oryza sativa L.) is the staple food for most of the Asians and almost half of the world population. It is con- sumed as whole grain milled kernels in many countries. Soaking is a pretreatment operation usually done before cooking of milled rice to provide desired softness and tex- ture in the final cooked rice (http://www.ricegourmet.com/ About_RiceTypes.htm), which plays a vital role in deciding consumer’s preference. The process involves water absorp- tion and changes in kernel dimensions. Many models have been developed to describe the water absorption of milled rice in several forms, such as equations proposed by Hen- derson and Perry (1976) and Peleg (1988) as well as Fick’s law of diffusion (Banaszek & Siebenmorgen, 1990a; Engels, Hendrickx, Samblanx, Gryze, & Tobback, 1986; Lu, Sie- benmorgen, & Archer, 1994; Sopade & Obekpa, 1990; Sopade, Ajisegiri, & Badau, 1992; Thakur & Gupta, 2006). Some studies have been conducted on soaking of rice, namely, to study kernel fissures formation (Kunze & Choudhary, 1972) and effect of moisture adsorption on head rice yield (Banaszek & Siebenmorgen, 1990b; Chen & Kunze, 1983; Siebenmorgen & Jindal, 1986). Muthu- kumarappan, Jindal, and Gunasekaran (1992) measured the volumetric changes in rice kernels for a Thai rice vari- ety (RD-29) using an air comparison pycnometer. Ramesh (2001) reported swelling ratio during high temperature hot water hydration of Basmati rice. The instantaneous kernel dimensions during soaking are important parameters for correct modeling of the water absorption and desorption processes (Zanoni, Schivaldi, & Simonetta, 1995). How- ever, in situ measurement of dimensions during soaking has not been reported in the published literature. Usually, a rice variety is characterized with its physico- chemical properties such as amylose content, gel consis-
-
Upload
nduatkumarganjfaizabadup -
Category
Documents
-
view
1 -
download
0
Transcript of Modeling changes in milled rice ( Oryza sativa L.) kernel dimensions during soaking by image...
Modeling changes in milled rice (Oryza sativa L.) kerneldimensions during soaking by image analysis
B.K. Yadav *, V.K. Jindal
Food Engineering and Bioprocess Technology, Asian Institute of Technology, P.O. Box 4, Klongluang, Pathumathani 12120, Thailand
Abstract
Tests were performed for milled whole kernels of ten Thai rice varieties ranging from low to high amylose content (16–29%) with threeinitial moisture levels (approximately, 8, 12 and 16% d.b.) for monitoring the dimensional changes in rice kernels during soaking in rela-tion to the varietal differences manifested by the physicochemical properties. It was observed that the two-dimensional shape factor of themilled rice kernel remains constant during whole soaking duration. The change in kernel dimension during soaking could be bestexpressed by a modified exponential relationship with the R2 for fitting ranging, respectively, from 0.983–0.999, 0.985–0.999, 0.984–0.999 and 0.985–1.000 for kernel length, width, perimeter and projected area for all rice varieties. The parameters of the fitted relation-ship for describing changes in kernel dimensions during soaking were found to be the function of initial moisture content and physico-chemical properties of rice varieties under study. The dimensional features, namely, length, width, perimeter and projected area of milledrice kernel during soaking could be estimated from its initial moisture content and physicochemical properties such as amylose content,alkali spreading value, and protein content within ±5% of the experimental value.
Keywords: Rice; Soaking; Dimensional change; Water uptake; Image analysis; Machine vision; Variety
1. Introduction
Rice (Oryza sativa L.) is the staple food for most of theAsians and almost half of the world population. It is con-sumed as whole grain milled kernels in many countries.Soaking is a pretreatment operation usually done beforecooking of milled rice to provide desired softness and tex-ture in the final cooked rice (http://www.ricegourmet.com/About_RiceTypes.htm), which plays a vital role in decidingconsumer’s preference. The process involves water absorp-tion and changes in kernel dimensions. Many models havebeen developed to describe the water absorption of milledrice in several forms, such as equations proposed by Hen-derson and Perry (1976) and Peleg (1988) as well as Fick’slaw of diffusion (Banaszek & Siebenmorgen, 1990a; Engels,Hendrickx, Samblanx, Gryze, & Tobback, 1986; Lu, Sie-
benmorgen, & Archer, 1994; Sopade & Obekpa, 1990;Sopade, Ajisegiri, & Badau, 1992; Thakur & Gupta,2006). Some studies have been conducted on soaking ofrice, namely, to study kernel fissures formation (Kunze &Choudhary, 1972) and effect of moisture adsorption onhead rice yield (Banaszek & Siebenmorgen, 1990b; Chen& Kunze, 1983; Siebenmorgen & Jindal, 1986). Muthu-kumarappan, Jindal, and Gunasekaran (1992) measuredthe volumetric changes in rice kernels for a Thai rice vari-ety (RD-29) using an air comparison pycnometer. Ramesh(2001) reported swelling ratio during high temperature hotwater hydration of Basmati rice. The instantaneous kerneldimensions during soaking are important parameters forcorrect modeling of the water absorption and desorptionprocesses (Zanoni, Schivaldi, & Simonetta, 1995). How-ever, in situ measurement of dimensions during soakinghas not been reported in the published literature.
Usually, a rice variety is characterized with its physico-chemical properties such as amylose content, gel consis-
Nomenclature
a Peleg’s rate constantAp projected area, mm2
AC amylose content, % d.b.AS alkali spreading valueb Peleg’s capacity constantb0 constant termbi regression coefficient of ith predictorD0 dimension at soaking time t = 0De saturated dimension during soakingDt dimension, namely, L (mm), W (mm), P (mm)
and Ap (mm2), at soaking time t minGC gel consistency, mmk1 coefficient of dimension change rate, min�1
k2 coefficient of dimension change rate, min�n
L kernel length, mmMa actual moisture content of the milled rice, %
(d.b.)M0 target moisture content level, % (d.b.)n constantN number of significant terms in modelP kernel perimeter, mmPC protein content, % d.b.t soaking duration, minW kernel width, mmWf final weight of the sample corresponding to tar-
get moisture level (g)Xi predictor termsY dependent variable
tency, alkali spreading value or gelatinization temperatureand protein content. Previous studies have shown thatphysicochemical properties of milled rice were related tothe changes during processing. For example, a higher gela-tinization temperature or lower alkali spreading score wasindicative of a more crystalline structure of milled rice andprovided more resistance to water penetration and swellingin rice kernels during soaking (Metcalf & Lund, 1985).High protein rice required more water and longer time tocook (Husain, Hwa, & Ahmad, 1981). However, littlequantitative information on changes in kernel dimensionsduring soaking in relation to physicochemical propertieshas been reported.
Monitoring dimensional parameters of cereals andgrains manually are cumbersome and time consumingoperation. In situ measurement of the dimensions is almostimpossible during soaking operation of the milled rice withthe conventional techniques. Applications of the imageanalysis technique, once widely used in manufacturingand medical industries, are being used in grain-basedindustries, namely, for quality grading/classification ofthe cereals and grains based on their kernels size, shapeand appearance (Ding & Gunasekaran, 1994; Gunaseka-ran, Cooper, & Berlage, 1988; Liao, Paulsen, Reid, Ni, &Bonifacio-Maghirang, 1993; Ni, Paulsen, & Reid, 1997a,Ni, Paulsen, & Read, 1997b; Ni, Paulsen, Lia, & Reid,1997; Shouche, Rastogi, Bhagawat, & Sainis, 2001; Utku& Koksel, 1998; Zayas, Pomeranz, & Lai, 1985; Zayas,Converse, & Steele, 1990). With the aid of this techniquethe in situ dimensional measurement during processing isnot only possible but also very convenient. In view of this,image analysis techniques could be conveniently applied toin situ monitoring of the dimensional features of rice ker-nels during soaking.
Keeping these in view, the present study was undertakento investigate dimensional changes in the milled rice kernelsduring soaking in relation to the varietal differences mani-fested by physicochemical properties of the rice.
2. Materials and methods
2.1. Sample preparation
2.1.1. Sample procurement
Ten varieties of rough rice (paddy) samples with amy-lose content varying from low to high amylase content,namely, Mali scented rice-105 (KDML105), Klong Luangscented rice (HKLG), Suphan Buri scented rice (HSPR),Suphan Buri-60 (SPR60), Royal Rice Department-7(RD7), Royal Rice Department-23 (RD23), Suphan Buri-90 (SPR90), Suphan Buri-1 (SPR1), Chainat-1 (CNT1)and Leuang Pra Tew-123 (LPT123) were obtained fromthe Rice Experiment Center, Klong Luang, Pathumthani,with moisture contents ranging from 10% to 13% dry basis.
2.1.2. Milling rough rice
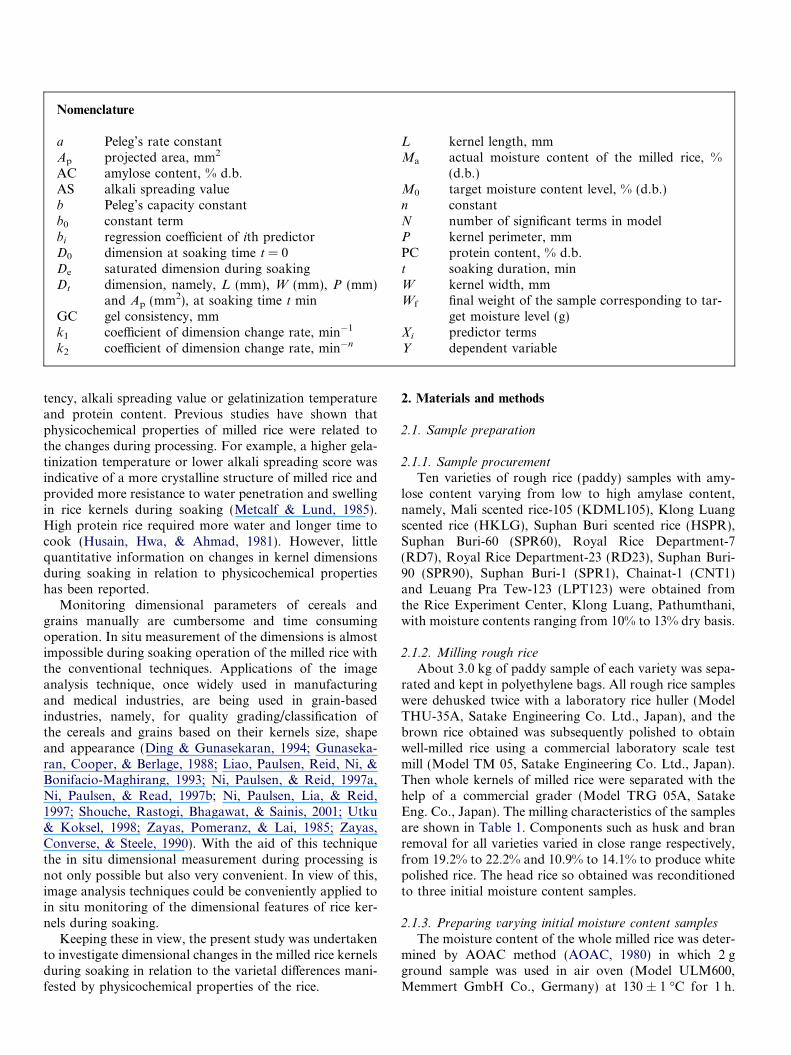
About 3.0 kg of paddy sample of each variety was sepa-rated and kept in polyethylene bags. All rough rice sampleswere dehusked twice with a laboratory rice huller (ModelTHU-35A, Satake Engineering Co. Ltd., Japan), and thebrown rice obtained was subsequently polished to obtainwell-milled rice using a commercial laboratory scale testmill (Model TM 05, Satake Engineering Co. Ltd., Japan).Then whole kernels of milled rice were separated with thehelp of a commercial grader (Model TRG 05A, SatakeEng. Co., Japan). The milling characteristics of the samplesare shown in Table 1. Components such as husk and branremoval for all varieties varied in close range respectively,from 19.2% to 22.2% and 10.9% to 14.1% to produce whitepolished rice. The head rice so obtained was reconditionedto three initial moisture content samples.
2.1.3. Preparing varying initial moisture content samples
The moisture content of the whole milled rice was deter-mined by AOAC method (AOAC, 1980) in which 2 gground sample was used in air oven (Model ULM600,Memmert GmbH Co., Germany) at 130 ± 1 �C for 1 h.
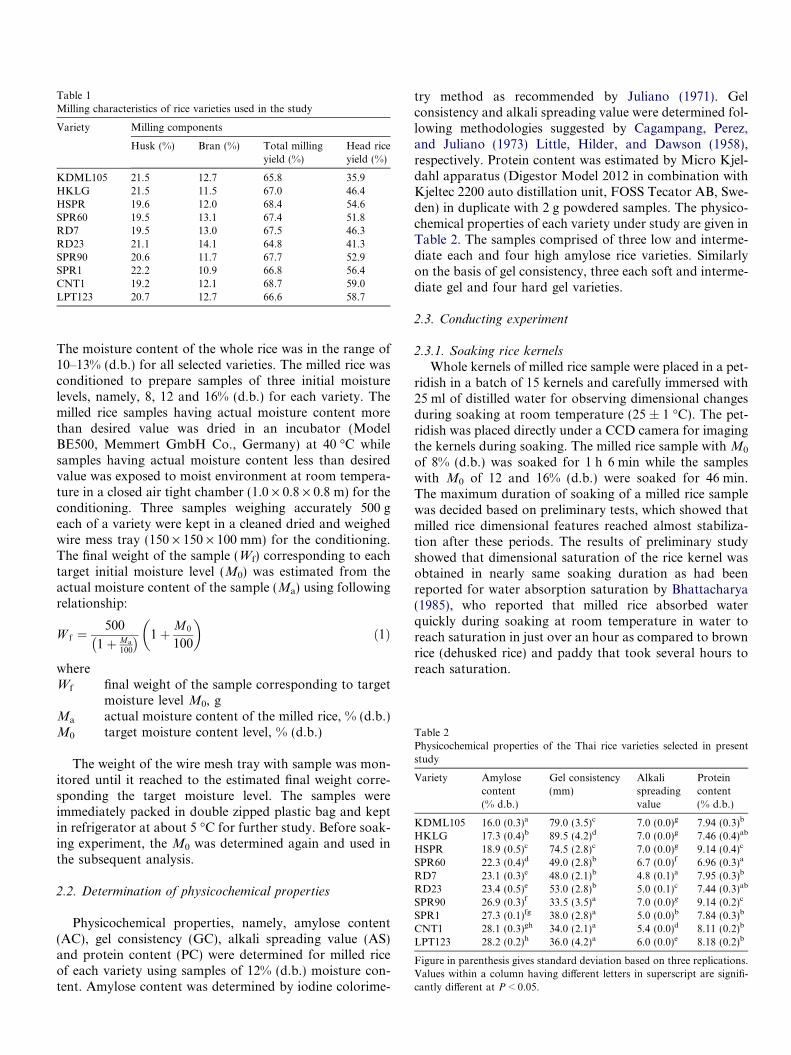
Table 1Milling characteristics of rice varieties used in the study
Variety Milling components
Husk (%) Bran (%) Total millingyield (%)
Head riceyield (%)
KDML105 21.5 12.7 65.8 35.9HKLG 21.5 11.5 67.0 46.4HSPR 19.6 12.0 68.4 54.6SPR60 19.5 13.1 67.4 51.8RD7 19.5 13.0 67.5 46.3RD23 21.1 14.1 64.8 41.3SPR90 20.6 11.7 67.7 52.9SPR1 22.2 10.9 66.8 56.4CNT1 19.2 12.1 68.7 59.0LPT123 20.7 12.7 66.6 58.7
Table 2Physicochemical properties of the Thai rice varieties selected in presentstudy
Variety Amylosecontent(% d.b.)
Gel consistency(mm)
Alkalispreadingvalue
Proteincontent(% d.b.)
KDML105 16.0 (0.3)a 79.0 (3.5)c 7.0 (0.0)g 7.94 (0.3)b
HKLG 17.3 (0.4)b 89.5 (4.2)d 7.0 (0.0)g 7.46 (0.4)ab
HSPR 18.9 (0.5)c 74.5 (2.8)c 7.0 (0.0)g 9.14 (0.4)c
SPR60 22.3 (0.4)d 49.0 (2.8)b 6.7 (0.0)f 6.96 (0.3)a
RD7 23.1 (0.3)e 48.0 (2.1)b 4.8 (0.1)a 7.95 (0.3)b
RD23 23.4 (0.5)e 53.0 (2.8)b 5.0 (0.1)c 7.44 (0.3)ab
SPR90 26.9 (0.3)f 33.5 (3.5)a 7.0 (0.0)g 9.14 (0.2)c
SPR1 27.3 (0.1)fg 38.0 (2.8)a 5.0 (0.0)b 7.84 (0.3)b
CNT1 28.1 (0.3)gh 34.0 (2.1)a 5.4 (0.0)d 8.11 (0.2)b
LPT123 28.2 (0.2)h 36.0 (4.2)a 6.0 (0.0)e 8.18 (0.2)b
Figure in parenthesis gives standard deviation based on three replications.Values within a column having different letters in superscript are signifi-cantly different at P < 0.05.
The moisture content of the whole rice was in the range of10–13% (d.b.) for all selected varieties. The milled rice wasconditioned to prepare samples of three initial moisturelevels, namely, 8, 12 and 16% (d.b.) for each variety. Themilled rice samples having actual moisture content morethan desired value was dried in an incubator (ModelBE500, Memmert GmbH Co., Germany) at 40 �C whilesamples having actual moisture content less than desiredvalue was exposed to moist environment at room tempera-ture in a closed air tight chamber (1.0 · 0.8 · 0.8 m) for theconditioning. Three samples weighing accurately 500 geach of a variety were kept in a cleaned dried and weighedwire mess tray (150 · 150 · 100 mm) for the conditioning.The final weight of the sample (Wf) corresponding to eachtarget initial moisture level (M0) was estimated from theactual moisture content of the sample (Ma) using followingrelationship:
W f ¼500
1þ Ma
100
� � 1þ M0
100
� �ð1Þ
whereWf final weight of the sample corresponding to target
moisture level M0, gMa actual moisture content of the milled rice, % (d.b.)M0 target moisture content level, % (d.b.)
The weight of the wire mesh tray with sample was mon-itored until it reached to the estimated final weight corre-sponding the target moisture level. The samples wereimmediately packed in double zipped plastic bag and keptin refrigerator at about 5 �C for further study. Before soak-ing experiment, the M0 was determined again and used inthe subsequent analysis.
2.2. Determination of physicochemical properties
Physicochemical properties, namely, amylose content(AC), gel consistency (GC), alkali spreading value (AS)and protein content (PC) were determined for milled riceof each variety using samples of 12% (d.b.) moisture con-tent. Amylose content was determined by iodine colorime-
try method as recommended by Juliano (1971). Gelconsistency and alkali spreading value were determined fol-lowing methodologies suggested by Cagampang, Perez,and Juliano (1973) Little, Hilder, and Dawson (1958),respectively. Protein content was estimated by Micro Kjel-dahl apparatus (Digestor Model 2012 in combination withKjeltec 2200 auto distillation unit, FOSS Tecator AB, Swe-den) in duplicate with 2 g powdered samples. The physico-chemical properties of each variety under study are given inTable 2. The samples comprised of three low and interme-diate each and four high amylose rice varieties. Similarlyon the basis of gel consistency, three each soft and interme-diate gel and four hard gel varieties.
2.3. Conducting experiment
2.3.1. Soaking rice kernels
Whole kernels of milled rice sample were placed in a pet-ridish in a batch of 15 kernels and carefully immersed with25 ml of distilled water for observing dimensional changesduring soaking at room temperature (25 ± 1 �C). The pet-ridish was placed directly under a CCD camera for imagingthe kernels during soaking. The milled rice sample with M0
of 8% (d.b.) was soaked for 1 h 6 min while the sampleswith M0 of 12 and 16% (d.b.) were soaked for 46 min.The maximum duration of soaking of a milled rice samplewas decided based on preliminary tests, which showed thatmilled rice dimensional features reached almost stabiliza-tion after these periods. The results of preliminary studyshowed that dimensional saturation of the rice kernel wasobtained in nearly same soaking duration as had beenreported for water absorption saturation by Bhattacharya(1985), who reported that milled rice absorbed waterquickly during soaking at room temperature in water toreach saturation in just over an hour as compared to brownrice (dehusked rice) and paddy that took several hours toreach saturation.
2.3.2. Imaging setup
The imaging system developed by Yadav and Jindal(2001) was used for the study. The operation of the systemwas carefully controlled for extracting reproducible fea-tures from the captured images of milled rice samplesthrough various adjustments. All the captured frames were8-bit (0–255) gray scale images.
The dimensional features of individual kernel imageswere extracted using the ImageTool program developedat the University of Texas Health Science Center at SanAntonio, Texas and available from the Internet (http://ddsdx.uthscsa.edu/dig/itdesc.html). The imaging systemwas calibrated with the help of brass disks having thicknessin the range close to that of milled rice kernels (1.22–2.88 mm) and by determining their diameter and projectedarea independently by a micrometer with a least count of0.01 mm. Table 3 shows the estimated average diameterand projected area of the selected disks. These estimatesshow a maximum absolute difference of 0.96% and1.91%, respectively, relative to the measured values.
2.3.3. Dimensional features extractionThe image of the kernels manually arranged in the petri
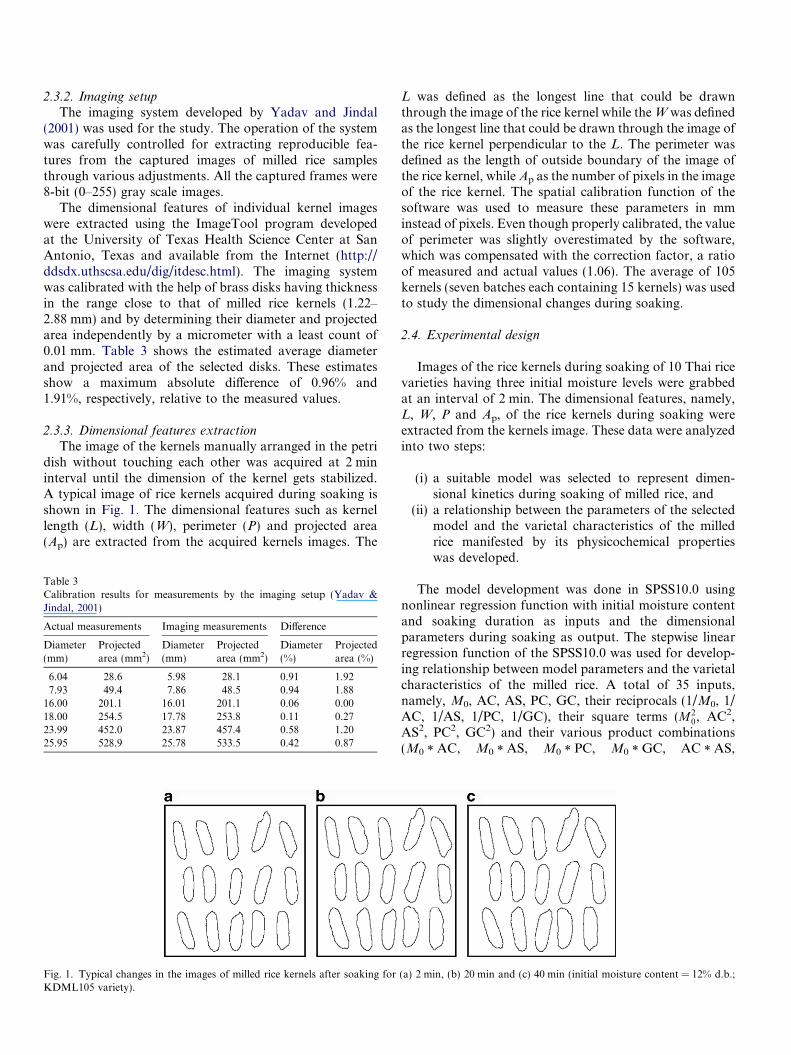
dish without touching each other was acquired at 2 mininterval until the dimension of the kernel gets stabilized.A typical image of rice kernels acquired during soaking isshown in Fig. 1. The dimensional features such as kernellength (L), width (W), perimeter (P) and projected area(Ap) are extracted from the acquired kernels images. The
Table 3Calibration results for measurements by the imaging setup (Yadav &Jindal, 2001)
Actual measurements Imaging measurements Difference
Diameter(mm)
Projectedarea (mm2)
Diameter(mm)
Projectedarea (mm2)
Diameter(%)
Projectedarea (%)
6.04 28.6 5.98 28.1 0.91 1.927.93 49.4 7.86 48.5 0.94 1.88
16.00 201.1 16.01 201.1 0.06 0.0018.00 254.5 17.78 253.8 0.11 0.2723.99 452.0 23.87 457.4 0.58 1.2025.95 528.9 25.78 533.5 0.42 0.87
Fig. 1. Typical changes in the images of milled rice kernels after soaking forKDML105 variety).
L was defined as the longest line that could be drawnthrough the image of the rice kernel while the W was definedas the longest line that could be drawn through the image ofthe rice kernel perpendicular to the L. The perimeter wasdefined as the length of outside boundary of the image ofthe rice kernel, while Ap as the number of pixels in the imageof the rice kernel. The spatial calibration function of thesoftware was used to measure these parameters in mminstead of pixels. Even though properly calibrated, the valueof perimeter was slightly overestimated by the software,which was compensated with the correction factor, a ratioof measured and actual values (1.06). The average of 105kernels (seven batches each containing 15 kernels) was usedto study the dimensional changes during soaking.
2.4. Experimental design
Images of the rice kernels during soaking of 10 Thai ricevarieties having three initial moisture levels were grabbedat an interval of 2 min. The dimensional features, namely,L, W, P and Ap, of the rice kernels during soaking wereextracted from the kernels image. These data were analyzedinto two steps:
(i) a suitable model was selected to represent dimen-sional kinetics during soaking of milled rice, and
(ii) a relationship between the parameters of the selectedmodel and the varietal characteristics of the milledrice manifested by its physicochemical propertieswas developed.
The model development was done in SPSS10.0 usingnonlinear regression function with initial moisture contentand soaking duration as inputs and the dimensionalparameters during soaking as output. The stepwise linearregression function of the SPSS10.0 was used for develop-ing relationship between model parameters and the varietalcharacteristics of the milled rice. A total of 35 inputs,namely, M0, AC, AS, PC, GC, their reciprocals (1/M0, 1/AC, 1/AS, 1/PC, 1/GC), their square terms (M2
0, AC2,AS2, PC2, GC2) and their various product combinations(M0 * AC, M0 * AS, M0 * PC, M0 * GC, AC * AS,
(a) 2 min, (b) 20 min and (c) 40 min (initial moisture content = 12% d.b.;
AC * PC, AC * GC, AS * PC, AS * GC, GC * PC,M0 * AC * AS, M0 * AC * PC, M0 * AC * GC, M0 * AS *PC, M0 * AS * GC, M0 * GC * PC, AC * AS * PC,AC * AS * GC, AC * PC * GC, AS * PC * GC), were used
0
5
10
15
20
25
30
35
Soaking duratio
Proj
ecte
d ar
ea c
hang
e, %
0
5
10
15
20
25
30
35
Soaking duratio
Peri
met
er c
hang
e, %
0
5
10
15
20
25
30
35
0 10 20
0 10 20
0 10 20
0 10 20
Soaking duratio
Len
gth
chan
ge, %
0
5
10
15
20
25
30
35
Soaking duratio
Wid
th c
hang
e, %
d
c
b
a
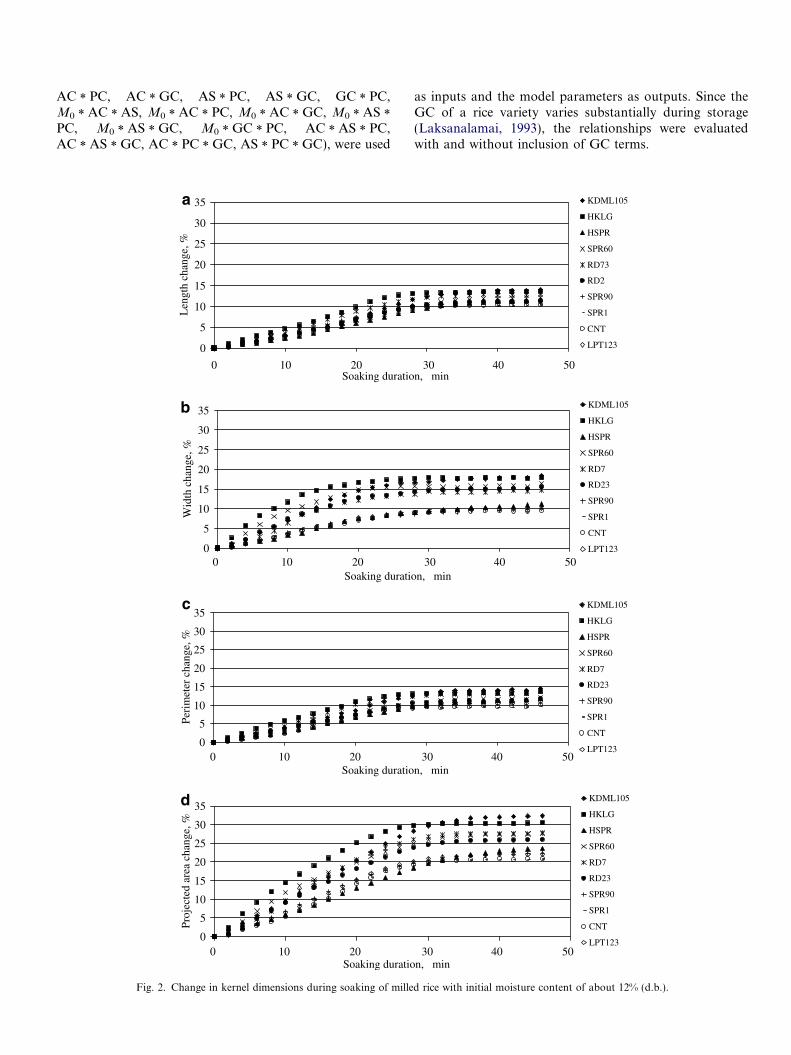
Fig. 2. Change in kernel dimensions during soaking of mille
as inputs and the model parameters as outputs. Since theGC of a rice variety varies substantially during storage(Laksanalamai, 1993), the relationships were evaluatedwith and without inclusion of GC terms.
n, min
KDML105
HKLG
HSPR
SPR60
RD7
RD23
SPR90
SPR1
CNT
LPT123
n, min
KDML105
HKLG
HSPR
SPR60
RD7
RD23
SPR90
SPR1
CNT
LPT123
30 40 50
30 40 50
30 40 50
30 40 50
n, min
KDML105
HKLG
HSPR
SPR60
RD73
RD2
SPR90
SPR1
CNT
LPT123
n, min
KDML105
HKLG
HSPR
SPR60
RD7
RD23
SPR90
SPR1
CNT
LPT123
d rice with initial moisture content of about 12% (d.b.).
2.5. Modeling experimental data
2.5.1. Dimensional changes during soaking
Based on the similarity between the plots of dimensionalchanges in kernels and water uptake during soaking, rela-tionships in exponential and modified exponential forms,and Peleg model used by previous researchers (Banaszek& Siebenmorgen, 1990a; Lu et al., 1994) were selected tomodel kernel dimension changes during soaking:
Dt � De
D0 � De
¼ Expð�k1 � tÞ ð2Þ
Dt � De
D0 � De
¼ Expð�k2 � tnÞ ð3Þ
Dt ¼ D0 þ1
ðaþ b � tÞ ð4Þ
whereDt dimension, namely, L (mm), W (mm), P (mm) and
Ap (mm2), at soaking time t minD0 dimension at soaking time t = 0De saturated dimension during soakingt soaking duration, mink1, k2, n constantsa Peleg’s rate constantb Peleg’s capacity constant
Y = 0.864 X
(R2
10
12
14
16
18
20
10 12 14 16 18 20
L*W, mm2
Proj
ecte
d ar
ea, m
m2
KDML105
= 0.987)
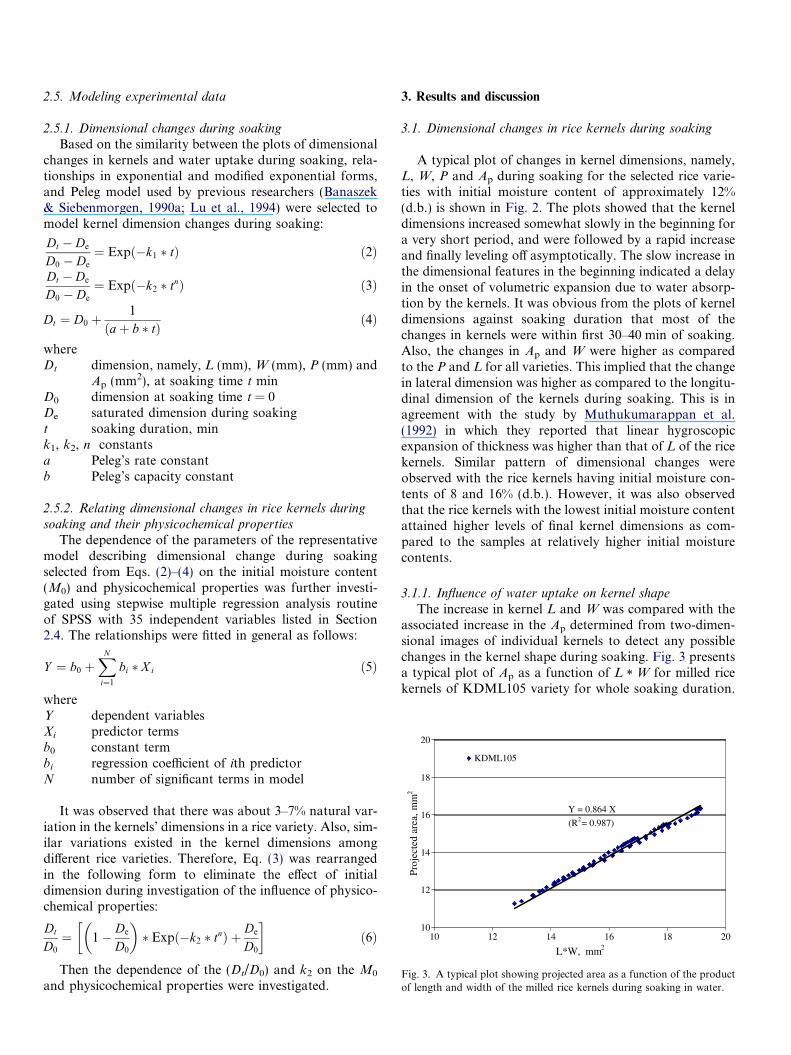
Fig. 3. A typical plot showing projected area as a function of the productof length and width of the milled rice kernels during soaking in water.
2.5.2. Relating dimensional changes in rice kernels during
soaking and their physicochemical properties
The dependence of the parameters of the representativemodel describing dimensional change during soakingselected from Eqs. (2)–(4) on the initial moisture content(M0) and physicochemical properties was further investi-gated using stepwise multiple regression analysis routineof SPSS with 35 independent variables listed in Section2.4. The relationships were fitted in general as follows:
Y ¼ b0 þXN
i¼1
bi � X i ð5Þ
whereY dependent variablesXi predictor termsb0 constant termbi regression coefficient of ith predictorN number of significant terms in model
It was observed that there was about 3–7% natural var-iation in the kernels’ dimensions in a rice variety. Also, sim-ilar variations existed in the kernel dimensions amongdifferent rice varieties. Therefore, Eq. (3) was rearrangedin the following form to eliminate the effect of initialdimension during investigation of the influence of physico-chemical properties:
Dt
D0
¼ 1� De
D0
� �� Expð�k2 � tnÞ þ De
D0
� �ð6Þ
Then the dependence of the (Dt/D0) and k2 on the M0
and physicochemical properties were investigated.
3. Results and discussion
3.1. Dimensional changes in rice kernels during soaking
A typical plot of changes in kernel dimensions, namely,L, W, P and Ap during soaking for the selected rice varie-ties with initial moisture content of approximately 12%(d.b.) is shown in Fig. 2. The plots showed that the kerneldimensions increased somewhat slowly in the beginning fora very short period, and were followed by a rapid increaseand finally leveling off asymptotically. The slow increase inthe dimensional features in the beginning indicated a delayin the onset of volumetric expansion due to water absorp-tion by the kernels. It was obvious from the plots of kerneldimensions against soaking duration that most of thechanges in kernels were within first 30–40 min of soaking.Also, the changes in Ap and W were higher as comparedto the P and L for all varieties. This implied that the changein lateral dimension was higher as compared to the longitu-dinal dimension of the kernels during soaking. This is inagreement with the study by Muthukumarappan et al.(1992) in which they reported that linear hygroscopicexpansion of thickness was higher than that of L of the ricekernels. Similar pattern of dimensional changes wereobserved with the rice kernels having initial moisture con-tents of 8 and 16% (d.b.). However, it was also observedthat the rice kernels with the lowest initial moisture contentattained higher levels of final kernel dimensions as com-pared to the samples at relatively higher initial moisturecontents.
3.1.1. Influence of water uptake on kernel shape
The increase in kernel L and W was compared with theassociated increase in the Ap determined from two-dimen-sional images of individual kernels to detect any possiblechanges in the kernel shape during soaking. Fig. 3 presentsa typical plot of Ap as a function of L * W for milled ricekernels of KDML105 variety for whole soaking duration.
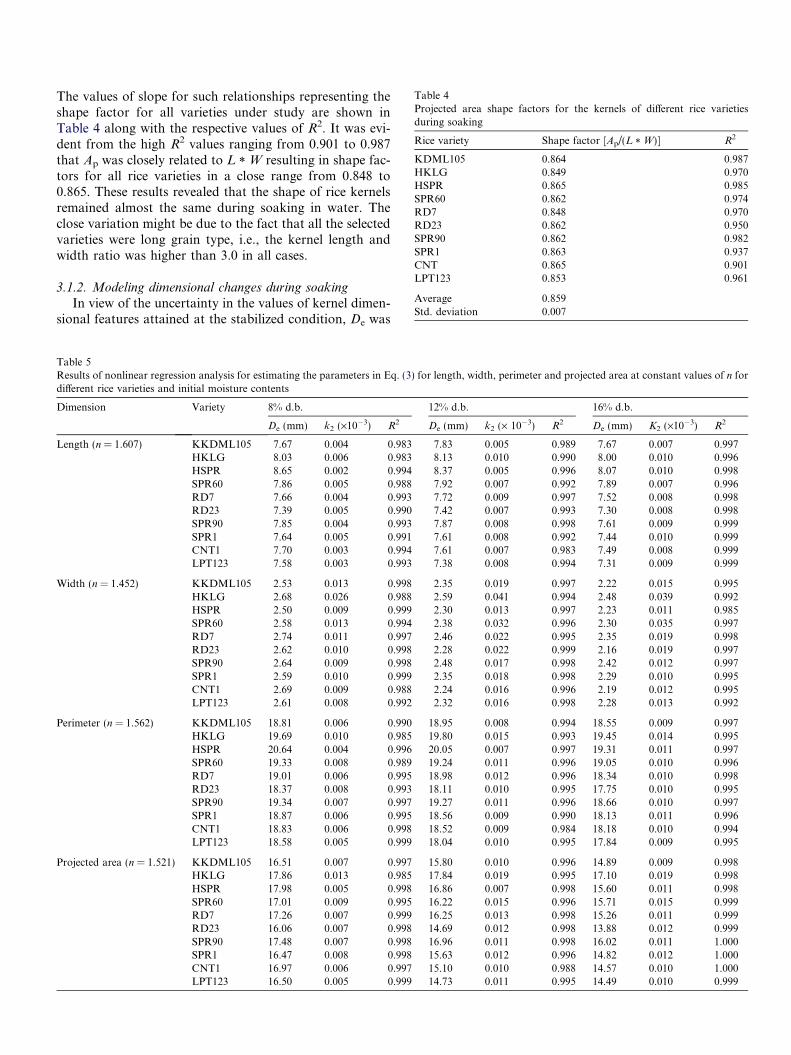
Table 4Projected area shape factors for the kernels of different rice varietiesduring soaking
Rice variety Shape factor [Ap/(L * W)] R2
KDML105 0.864 0.987HKLG 0.849 0.970HSPR 0.865 0.985SPR60 0.862 0.974RD7 0.848 0.970RD23 0.862 0.950SPR90 0.862 0.982SPR1 0.863 0.937CNT 0.865 0.901LPT123 0.853 0.961
Average 0.859Std. deviation 0.007
The values of slope for such relationships representing theshape factor for all varieties under study are shown inTable 4 along with the respective values of R2. It was evi-dent from the high R2 values ranging from 0.901 to 0.987that Ap was closely related to L * W resulting in shape fac-tors for all rice varieties in a close range from 0.848 to0.865. These results revealed that the shape of rice kernelsremained almost the same during soaking in water. Theclose variation might be due to the fact that all the selectedvarieties were long grain type, i.e., the kernel length andwidth ratio was higher than 3.0 in all cases.
3.1.2. Modeling dimensional changes during soaking
In view of the uncertainty in the values of kernel dimen-sional features attained at the stabilized condition, De was
Table 5Results of nonlinear regression analysis for estimating the parameters in Eq. (3) for length, width, perimeter and projected area at constant values of n fordifferent rice varieties and initial moisture contents
Dimension Variety 8% d.b. 12% d.b. 16% d.b.
De (mm) k2 (·10�3) R2 De (mm) k2 (· 10�3) R2 De (mm) K2 (·10�3) R2
Length (n = 1.607) KKDML105 7.67 0.004 0.983 7.83 0.005 0.989 7.67 0.007 0.997HKLG 8.03 0.006 0.983 8.13 0.010 0.990 8.00 0.010 0.996HSPR 8.65 0.002 0.994 8.37 0.005 0.996 8.07 0.010 0.998SPR60 7.86 0.005 0.988 7.92 0.007 0.992 7.89 0.007 0.996RD7 7.66 0.004 0.993 7.72 0.009 0.997 7.52 0.008 0.998RD23 7.39 0.005 0.990 7.42 0.007 0.993 7.30 0.008 0.998SPR90 7.85 0.004 0.993 7.87 0.008 0.998 7.61 0.009 0.999SPR1 7.64 0.005 0.991 7.61 0.008 0.992 7.44 0.010 0.999CNT1 7.70 0.003 0.994 7.61 0.007 0.983 7.49 0.008 0.999LPT123 7.58 0.003 0.993 7.38 0.008 0.994 7.31 0.009 0.999
Width (n = 1.452) KKDML105 2.53 0.013 0.998 2.35 0.019 0.997 2.22 0.015 0.995HKLG 2.68 0.026 0.988 2.59 0.041 0.994 2.48 0.039 0.992HSPR 2.50 0.009 0.999 2.30 0.013 0.997 2.23 0.011 0.985SPR60 2.58 0.013 0.994 2.38 0.032 0.996 2.30 0.035 0.997RD7 2.74 0.011 0.997 2.46 0.022 0.995 2.35 0.019 0.998RD23 2.62 0.010 0.998 2.28 0.022 0.999 2.16 0.019 0.997SPR90 2.64 0.009 0.998 2.48 0.017 0.998 2.42 0.012 0.997SPR1 2.59 0.010 0.999 2.35 0.018 0.998 2.29 0.010 0.995CNT1 2.69 0.009 0.988 2.24 0.016 0.996 2.19 0.012 0.995LPT123 2.61 0.008 0.992 2.32 0.016 0.998 2.28 0.013 0.992
Perimeter (n = 1.562) KKDML105 18.81 0.006 0.990 18.95 0.008 0.994 18.55 0.009 0.997HKLG 19.69 0.010 0.985 19.80 0.015 0.993 19.45 0.014 0.995HSPR 20.64 0.004 0.996 20.05 0.007 0.997 19.31 0.011 0.997SPR60 19.33 0.008 0.989 19.24 0.011 0.996 19.05 0.010 0.996RD7 19.01 0.006 0.995 18.98 0.012 0.996 18.34 0.010 0.998RD23 18.37 0.008 0.993 18.11 0.010 0.995 17.75 0.010 0.995SPR90 19.34 0.007 0.997 19.27 0.011 0.996 18.66 0.010 0.997SPR1 18.87 0.006 0.995 18.56 0.009 0.990 18.13 0.011 0.996CNT1 18.83 0.006 0.998 18.52 0.009 0.984 18.18 0.010 0.994LPT123 18.58 0.005 0.999 18.04 0.010 0.995 17.84 0.009 0.995
Projected area (n = 1.521) KKDML105 16.51 0.007 0.997 15.80 0.010 0.996 14.89 0.009 0.998HKLG 17.86 0.013 0.985 17.84 0.019 0.995 17.10 0.019 0.998HSPR 17.98 0.005 0.998 16.86 0.007 0.998 15.60 0.011 0.998SPR60 17.01 0.009 0.995 16.22 0.015 0.996 15.71 0.015 0.999RD7 17.26 0.007 0.999 16.25 0.013 0.998 15.26 0.011 0.999RD23 16.06 0.007 0.998 14.69 0.012 0.998 13.88 0.012 0.999SPR90 17.48 0.007 0.998 16.96 0.011 0.998 16.02 0.011 1.000SPR1 16.47 0.008 0.998 15.63 0.012 0.996 14.82 0.012 1.000CNT1 16.97 0.006 0.997 15.10 0.010 0.988 14.57 0.010 1.000LPT123 16.50 0.005 0.999 14.73 0.011 0.995 14.49 0.010 0.999
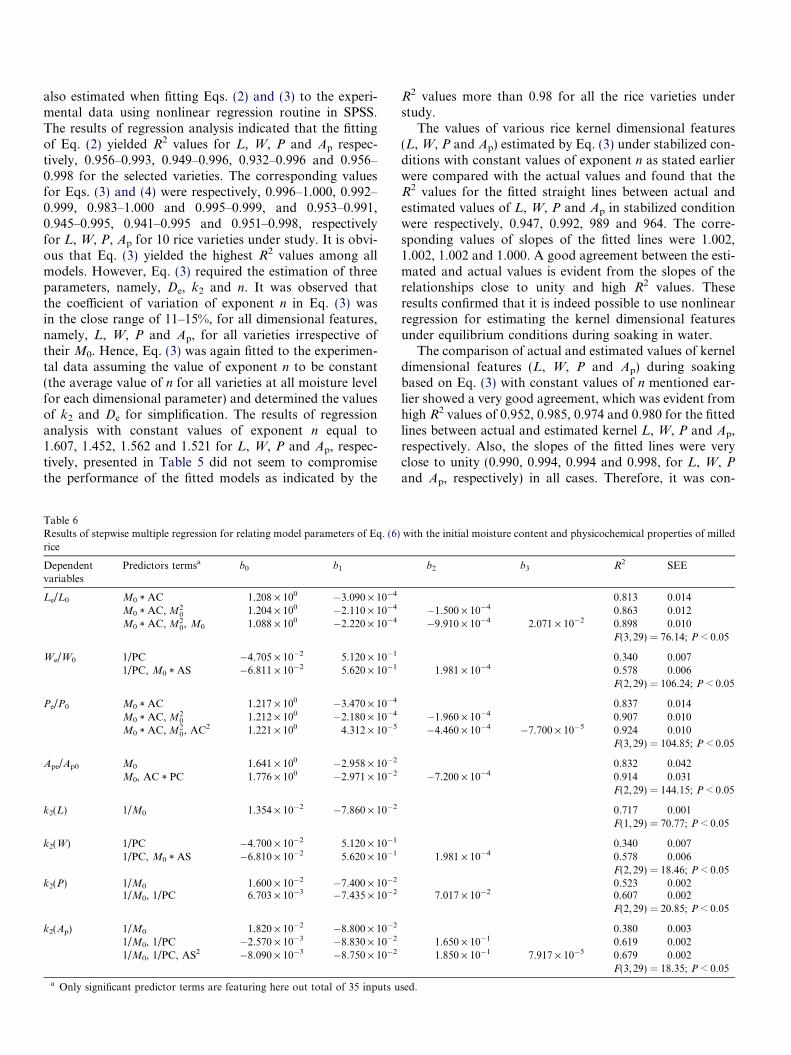
also estimated when fitting Eqs. (2) and (3) to the experi-mental data using nonlinear regression routine in SPSS.The results of regression analysis indicated that the fittingof Eq. (2) yielded R2 values for L, W, P and Ap respec-tively, 0.956–0.993, 0.949–0.996, 0.932–0.996 and 0.956–0.998 for the selected varieties. The corresponding valuesfor Eqs. (3) and (4) were respectively, 0.996–1.000, 0.992–0.999, 0.983–1.000 and 0.995–0.999, and 0.953–0.991,0.945–0.995, 0.941–0.995 and 0.951–0.998, respectivelyfor L, W, P, Ap for 10 rice varieties under study. It is obvi-ous that Eq. (3) yielded the highest R2 values among allmodels. However, Eq. (3) required the estimation of threeparameters, namely, De, k2 and n. It was observed thatthe coefficient of variation of exponent n in Eq. (3) wasin the close range of 11–15%, for all dimensional features,namely, L, W, P and Ap, for all varieties irrespective oftheir M0. Hence, Eq. (3) was again fitted to the experimen-tal data assuming the value of exponent n to be constant(the average value of n for all varieties at all moisture levelfor each dimensional parameter) and determined the valuesof k2 and De for simplification. The results of regressionanalysis with constant values of exponent n equal to1.607, 1.452, 1.562 and 1.521 for L, W, P and Ap, respec-tively, presented in Table 5 did not seem to compromisethe performance of the fitted models as indicated by the
Table 6Results of stepwise multiple regression for relating model parameters of Eq. (6)rice
Dependentvariables
Predictors termsa b0 b1
Le/L0 M0 * AC 1.208 · 100 �3.090 · 10�4
M0 * AC, M20 1.204 · 100 �2.110 · 10�4
M0 * AC, M20, M0 1.088 · 100 �2.220 · 10�4
We/W0 1/PC �4.705 · 10�2 5.120 · 10�1
1/PC, M0 * AS �6.811 · 10�2 5.620 · 10�1
Pe/P0 M0 * AC 1.217 · 100 �3.470 · 10�4
M0 * AC, M20 1.212 · 100 �2.180 · 10�4
M0 * AC, M20, AC2 1.221 · 100 4.312 · 10�5
Ape/Ap0 M0 1.641 · 100 �2.958 · 10�2
M0, AC * PC 1.776 · 100 �2.971 · 10�2
k2(L) 1/M0 1.354 · 10�2 �7.860 · 10�2
k2(W) 1/PC �4.700 · 10�2 5.120 · 10�1
1/PC, M0 * AS �6.810 · 10�2 5.620 · 10�1
k2(P) 1/M0 1.600 · 10�2 �7.400 · 10�2
1/M0, 1/PC 6.703 · 10�3 �7.435 · 10�2
k2(Ap) 1/M0 1.820 · 10�2 �8.800 · 10�2
1/M0, 1/PC �2.570 · 10�3 �8.830 · 10�2
1/M0, 1/PC, AS2 �8.090 · 10�3 �8.750 · 10�2
a Only significant predictor terms are featuring here out total of 35 inputs u
R2 values more than 0.98 for all the rice varieties understudy.
The values of various rice kernel dimensional features(L, W, P and Ap) estimated by Eq. (3) under stabilized con-ditions with constant values of exponent n as stated earlierwere compared with the actual values and found that theR2 values for the fitted straight lines between actual andestimated values of L, W, P and Ap in stabilized conditionwere respectively, 0.947, 0.992, 989 and 964. The corre-sponding values of slopes of the fitted lines were 1.002,1.002, 1.002 and 1.000. A good agreement between the esti-mated and actual values is evident from the slopes of therelationships close to unity and high R2 values. Theseresults confirmed that it is indeed possible to use nonlinearregression for estimating the kernel dimensional featuresunder equilibrium conditions during soaking in water.
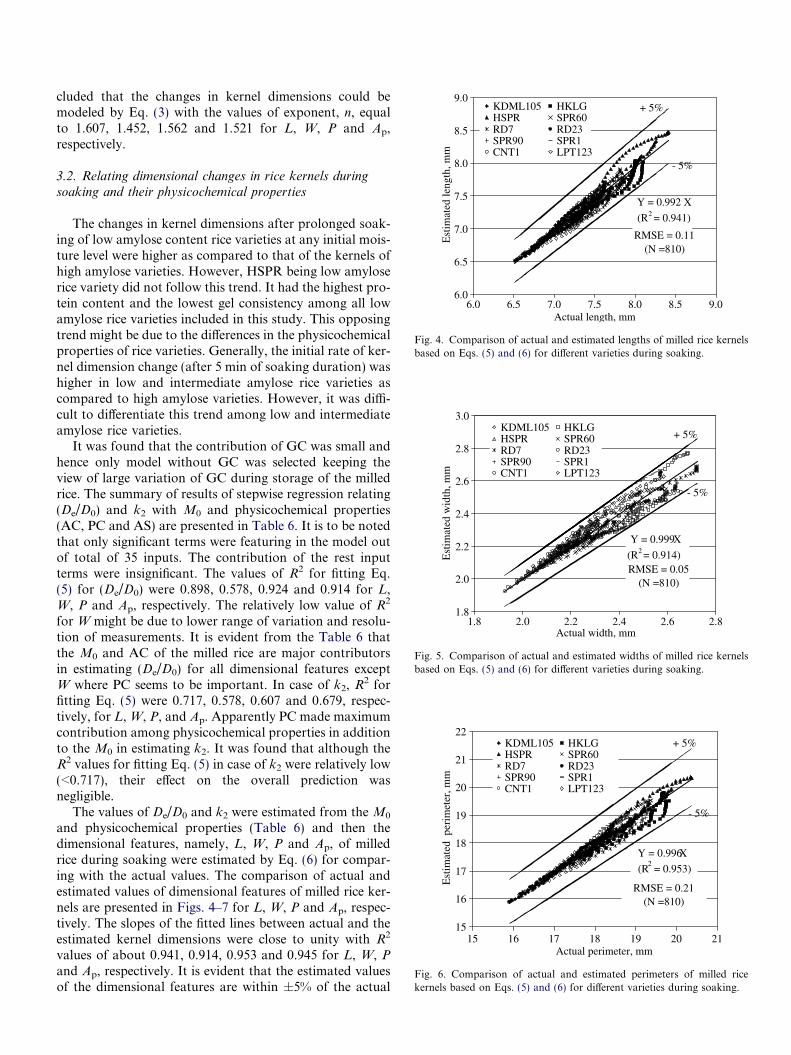
The comparison of actual and estimated values of kerneldimensional features (L, W, P and Ap) during soakingbased on Eq. (3) with constant values of n mentioned ear-lier showed a very good agreement, which was evident fromhigh R2 values of 0.952, 0.985, 0.974 and 0.980 for the fittedlines between actual and estimated kernel L, W, P and Ap,respectively. Also, the slopes of the fitted lines were veryclose to unity (0.990, 0.994, 0.994 and 0.998, for L, W, P
and Ap, respectively) in all cases. Therefore, it was con-
with the initial moisture content and physicochemical properties of milled
b2 b3 R2 SEE
0.813 0.014�1.500 · 10�4 0.863 0.012�9.910 · 10�4 2.071 · 10�2 0.898 0.010
F(3,29) = 76.14; P < 0.05
0.340 0.0071.981 · 10�4 0.578 0.006
F(2,29) = 106.24; P < 0.05
0.837 0.014�1.960 · 10�4 0.907 0.010�4.460 · 10�4 �7.700 · 10�5 0.924 0.010
F(3,29) = 104.85; P < 0.05
0.832 0.042�7.200 · 10�4 0.914 0.031
F(2,29) = 144.15; P < 0.05
0.717 0.001F(1,29) = 70.77; P < 0.05
0.340 0.0071.981 · 10�4 0.578 0.006
F(2,29) = 18.46; P < 0.050.523 0.002
7.017 · 10�2 0.607 0.002F(2,29) = 20.85; P < 0.05
0.380 0.0031.650 · 10�1 0.619 0.0021.850 · 10�1 7.917 · 10�5 0.679 0.002
F(3,29) = 18.35; P < 0.05
sed.
6.0
6.5
7.0
7.5
8.0
8.5
9.0
6.0 6.5 7.0 7.5 8.0 8.5 9.0Actual length, mm
Est
imat
ed le
ngth
, mm
KDML105 HKLGHSPR SPR60RD7 RD23SPR90 SPR1CNT1 LPT123
+ 5%
- 5%
Y = 0.992 X
(R2 = 0.941)
RMSE = 0.11 (N =810)
Fig. 4. Comparison of actual and estimated lengths of milled rice kernelsbased on Eqs. (5) and (6) for different varieties during soaking.
1.8
2.0
2.2
2.4
2.6
2.8
3.0
1.8 2.0 2.2 2.4 2.6 2.8Actual width, mm
Est
imat
ed w
idth
, mm
+ 5%
- 5%
KDML105 HKLGHSPR SPR60RD7 RD23SPR90 SPR1CNT1 LPT123
Y = 0.999 X
(R2 = 0.914)RMSE = 0.05
(N =810)
Fig. 5. Comparison of actual and estimated widths of milled rice kernelsbased on Eqs. (5) and (6) for different varieties during soaking.
15
16
17
18
19
20
21
22
15 16 17 18 19 20 21Actual perimeter, mm
Est
imat
ed p
erim
eter
, mm
KDML105 HKLGHSPR SPR60RD7 RD23SPR90 SPR1CNT1 LPT123
+ 5%
- 5%
Y = 0.996 X
(R2 = 0.953)
RMSE = 0.21 (N =810)
Fig. 6. Comparison of actual and estimated perimeters of milled ricekernels based on Eqs. (5) and (6) for different varieties during soaking.
cluded that the changes in kernel dimensions could bemodeled by Eq. (3) with the values of exponent, n, equalto 1.607, 1.452, 1.562 and 1.521 for L, W, P and Ap,respectively.
3.2. Relating dimensional changes in rice kernels duringsoaking and their physicochemical properties
The changes in kernel dimensions after prolonged soak-ing of low amylose content rice varieties at any initial mois-ture level were higher as compared to that of the kernels ofhigh amylose varieties. However, HSPR being low amyloserice variety did not follow this trend. It had the highest pro-tein content and the lowest gel consistency among all lowamylose rice varieties included in this study. This opposingtrend might be due to the differences in the physicochemicalproperties of rice varieties. Generally, the initial rate of ker-nel dimension change (after 5 min of soaking duration) washigher in low and intermediate amylose rice varieties ascompared to high amylose varieties. However, it was diffi-cult to differentiate this trend among low and intermediateamylose rice varieties.
It was found that the contribution of GC was small andhence only model without GC was selected keeping theview of large variation of GC during storage of the milledrice. The summary of results of stepwise regression relating(De/D0) and k2 with M0 and physicochemical properties(AC, PC and AS) are presented in Table 6. It is to be notedthat only significant terms were featuring in the model outof total of 35 inputs. The contribution of the rest inputterms were insignificant. The values of R2 for fitting Eq.(5) for (De/D0) were 0.898, 0.578, 0.924 and 0.914 for L,W, P and Ap, respectively. The relatively low value of R2
for W might be due to lower range of variation and resolu-tion of measurements. It is evident from the Table 6 thatthe M0 and AC of the milled rice are major contributorsin estimating (De/D0) for all dimensional features exceptW where PC seems to be important. In case of k2, R2 forfitting Eq. (5) were 0.717, 0.578, 0.607 and 0.679, respec-tively, for L, W, P, and Ap. Apparently PC made maximumcontribution among physicochemical properties in additionto the M0 in estimating k2. It was found that although theR2 values for fitting Eq. (5) in case of k2 were relatively low(<0.717), their effect on the overall prediction wasnegligible.
The values of De/D0 and k2 were estimated from the M0
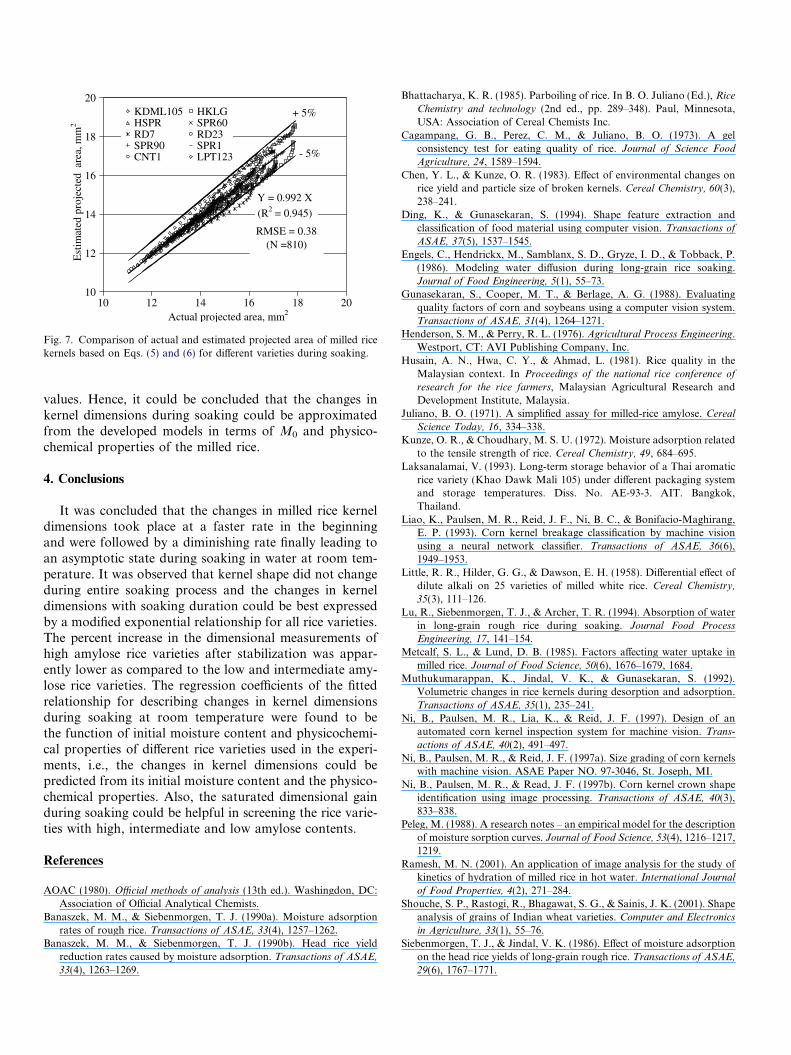
and physicochemical properties (Table 6) and then thedimensional features, namely, L, W, P and Ap, of milledrice during soaking were estimated by Eq. (6) for compar-ing with the actual values. The comparison of actual andestimated values of dimensional features of milled rice ker-nels are presented in Figs. 4–7 for L, W, P and Ap, respec-tively. The slopes of the fitted lines between actual and theestimated kernel dimensions were close to unity with R2
values of about 0.941, 0.914, 0.953 and 0.945 for L, W, P
and Ap, respectively. It is evident that the estimated valuesof the dimensional features are within ±5% of the actual
10
12
14
16
18
20
10 12 14 16 18 20Actual projected area, mm2
Est
imat
ed p
roje
cted
are
a, m
m2
+ 5%
- 5%
Y = 0.992 X
(R2 = 0.945)
RMSE = 0.38 (N =810)
KDML105 HKLGHSPR SPR60RD7 RD23SPR90 SPR1CNT1 LPT123
Fig. 7. Comparison of actual and estimated projected area of milled ricekernels based on Eqs. (5) and (6) for different varieties during soaking.
values. Hence, it could be concluded that the changes inkernel dimensions during soaking could be approximatedfrom the developed models in terms of M0 and physico-chemical properties of the milled rice.
4. Conclusions
It was concluded that the changes in milled rice kerneldimensions took place at a faster rate in the beginningand were followed by a diminishing rate finally leading toan asymptotic state during soaking in water at room tem-perature. It was observed that kernel shape did not changeduring entire soaking process and the changes in kerneldimensions with soaking duration could be best expressedby a modified exponential relationship for all rice varieties.The percent increase in the dimensional measurements ofhigh amylose rice varieties after stabilization was appar-ently lower as compared to the low and intermediate amy-lose rice varieties. The regression coefficients of the fittedrelationship for describing changes in kernel dimensionsduring soaking at room temperature were found to bethe function of initial moisture content and physicochemi-cal properties of different rice varieties used in the experi-ments, i.e., the changes in kernel dimensions could bepredicted from its initial moisture content and the physico-chemical properties. Also, the saturated dimensional gainduring soaking could be helpful in screening the rice varie-ties with high, intermediate and low amylose contents.
References
AOAC (1980). Official methods of analysis (13th ed.). Washingdon, DC:Association of Official Analytical Chemists.
Banaszek, M. M., & Siebenmorgen, T. J. (1990a). Moisture adsorptionrates of rough rice. Transactions of ASAE, 33(4), 1257–1262.
Banaszek, M. M., & Siebenmorgen, T. J. (1990b). Head rice yieldreduction rates caused by moisture adsorption. Transactions of ASAE,
33(4), 1263–1269.
Bhattacharya, K. R. (1985). Parboiling of rice. In B. O. Juliano (Ed.), Rice
Chemistry and technology (2nd ed., pp. 289–348). Paul, Minnesota,USA: Association of Cereal Chemists Inc.
Cagampang, G. B., Perez, C. M., & Juliano, B. O. (1973). A gelconsistency test for eating quality of rice. Journal of Science Food
Agriculture, 24, 1589–1594.Chen, Y. L., & Kunze, O. R. (1983). Effect of environmental changes on
rice yield and particle size of broken kernels. Cereal Chemistry, 60(3),238–241.
Ding, K., & Gunasekaran, S. (1994). Shape feature extraction andclassification of food material using computer vision. Transactions of
ASAE, 37(5), 1537–1545.Engels, C., Hendrickx, M., Samblanx, S. D., Gryze, I. D., & Tobback, P.
(1986). Modeling water diffusion during long-grain rice soaking.Journal of Food Engineering, 5(1), 55–73.
Gunasekaran, S., Cooper, M. T., & Berlage, A. G. (1988). Evaluatingquality factors of corn and soybeans using a computer vision system.Transactions of ASAE, 31(4), 1264–1271.
Henderson, S. M., & Perry, R. L. (1976). Agricultural Process Engineering.Westport, CT: AVI Publishing Company, Inc.
Husain, A. N., Hwa, C. Y., & Ahmad, L. (1981). Rice quality in theMalaysian context. In Proceedings of the national rice conference of
research for the rice farmers, Malaysian Agricultural Research andDevelopment Institute, Malaysia.
Juliano, B. O. (1971). A simplified assay for milled-rice amylose. Cereal
Science Today, 16, 334–338.Kunze, O. R., & Choudhary, M. S. U. (1972). Moisture adsorption related
to the tensile strength of rice. Cereal Chemistry, 49, 684–695.Laksanalamai, V. (1993). Long-term storage behavior of a Thai aromatic
rice variety (Khao Dawk Mali 105) under different packaging systemand storage temperatures. Diss. No. AE-93-3. AIT. Bangkok,Thailand.
Liao, K., Paulsen, M. R., Reid, J. F., Ni, B. C., & Bonifacio-Maghirang,E. P. (1993). Corn kernel breakage classification by machine visionusing a neural network classifier. Transactions of ASAE, 36(6),1949–1953.
Little, R. R., Hilder, G. G., & Dawson, E. H. (1958). Differential effect ofdilute alkali on 25 varieties of milled white rice. Cereal Chemistry,
35(3), 111–126.Lu, R., Siebenmorgen, T. J., & Archer, T. R. (1994). Absorption of water
in long-grain rough rice during soaking. Journal Food Process
Engineering, 17, 141–154.Metcalf, S. L., & Lund, D. B. (1985). Factors affecting water uptake in
milled rice. Journal of Food Science, 50(6), 1676–1679, 1684.Muthukumarappan, K., Jindal, V. K., & Gunasekaran, S. (1992).
Volumetric changes in rice kernels during desorption and adsorption.Transactions of ASAE, 35(1), 235–241.
Ni, B., Paulsen, M. R., Lia, K., & Reid, J. F. (1997). Design of anautomated corn kernel inspection system for machine vision. Trans-
actions of ASAE, 40(2), 491–497.Ni, B., Paulsen, M. R., & Reid, J. F. (1997a). Size grading of corn kernels
with machine vision. ASAE Paper NO. 97-3046, St. Joseph, MI.Ni, B., Paulsen, M. R., & Read, J. F. (1997b). Corn kernel crown shape
identification using image processing. Transactions of ASAE, 40(3),833–838.
Peleg, M. (1988). A research notes – an empirical model for the descriptionof moisture sorption curves. Journal of Food Science, 53(4), 1216–1217,1219.
Ramesh, M. N. (2001). An application of image analysis for the study ofkinetics of hydration of milled rice in hot water. International Journal
of Food Properties, 4(2), 271–284.Shouche, S. P., Rastogi, R., Bhagawat, S. G., & Sainis, J. K. (2001). Shape
analysis of grains of Indian wheat varieties. Computer and Electronics
in Agriculture, 33(1), 55–76.Siebenmorgen, T. J., & Jindal, V. K. (1986). Effect of moisture adsorption
on the head rice yields of long-grain rough rice. Transactions of ASAE,
29(6), 1767–1771.

Sopade, P. A., Ajisegiri, E. S., & Badau, M. H. (1992). The use of Peleg’sequation to model water absorption in some cereal grains duringsoaking. Journal of Food Engineering, 15(4), 269–283.
Sopade, P. A., & Obekpa, J. A. (1990). Modeling water absorption insoybean, cowpea and peanuts at three temperatures using Peleg’sequation. Journal of Food Science, 55(4), 1880–1887.
Thakur, A. Kr., & Gupta, A. K. (2006). Water absorption characteristicsof paddy, brown rice and husk during soaking. Journal of Food
Engineering, 75, 252–257.Utku, H., & Koksel, H. (1998). Use of statistical filters in the classification
of wheats by image analysis. Journal of Food Engineering, 36(4),385–394.
Yadav, B. K., & Jindal, V. K. (2001). Monitoring milling quality of riceby image analysis. Computer and Electronics in Agriculture, 33(1),19–33.
Zanoni, B., Schivaldi, A., & Simonetta, R. (1995). A naı̈ve model of starchgelatinization kinetics. Journal of Food Engineering, 24(1), 25–33.
Zayas, I., Converse, H., & Steele, J. (1990). Discrimination of whole frombroken corn kernels with image analysis. Transactions of ASAE, 33(5),1642–1646.
Zayas, I., Pomeranz, Y., & Lai, F. S. (1985). Discrimination betweenArthur and Arkan wheats by image analysis. Cereal Chemistry, 62(6),478–480.