
Modeling and Control for Advanced Automotive Thermal ...
100
System Safety Development of a Performance PHEV Through a Model-Based Systems Engineering Approach THESIS Presented in Partial Fulfillment of the Requirements for the Degree Master of Science in the Graduate School of The Ohio State University By Samuel Yacinthe Graduate Program in Mechanical Engineering The Ohio State University 2016 Master's Examination Committee: Prof. Shawn Midlam-Mohler, Advisor Prof. Giorgio Rizzoni
-
Upload
khangminh22 -
Category
Documents
-
view
0 -
download
0
Transcript of Modeling and Control for Advanced Automotive Thermal ...

System Safety Development of a Performance PHEV Through a Model-Based
Systems Engineering Approach
THESIS
Presented in Partial Fulfillment of the Requirements for the Degree Master of Science in
the Graduate School of The Ohio State University
By
Samuel Yacinthe
Graduate Program in Mechanical Engineering
The Ohio State University
2016
Master's Examination Committee:
Prof. Shawn Midlam-Mohler, Advisor
Prof. Giorgio Rizzoni

Copyright by
Samuel Yacinthe
2016
ii
Abstract
The Ohio State University is participating in EcoCAR 3, which is a four-year long
competition amongst 16 North American university teams to redesign the 2016 Chevrolet
Camaro to reduce its environmental impact, while maintaining the muscle and performance
expected from the iconic American car. To effectively assess and increase overall product
quality and readiness of Ohio State’s vehicle, this work defines and deploys a state of the
art Model-Based Systems Engineering (MBSE) approach for managing engineering
complexity as it relates to requirements management, traceability, and fulfillment. To
demonstrate the effectiveness of the implemented approach, this work presents system
safety development activities that have been conducted during the first two years of the
competition. As EcoCAR 3 transitions into year-three, this work has already contributed
to over a dozen awards by increasing overall documentation, traceability and workflow
management as part of the overall engineering development process.

iii
Dedication
This is dedicated to my family and friends who have helped support and guide me over
the years during my pursuit of higher education.

iv
Acknowledgments
I would like to thank my advisor, Prof. Shawn Midlam-Mohler, for his superb
guidance and knowledge throughout this thesis work and throughout my tenure with the
EcoCAR team. His ideas, thoughts, and management made my time on the EcoCAR team
successful and this thesis possible. I'd also like to acknowledge the team members who
have been a part of EcoCAR 3 that have helped make this experience beyond educational,
while also playing key roles in making the first two years of competition successful at Ohio
State: Brandon Bishop, Tom Brown, Greg Jankord, Aditya Karumanchi, Arjun Khanna,
Dennis Kibalama, Aditya Modak, Brielle Reiff, Jenn Shafer, Trevor Thompkins, Nick
Tomczak, and Jason Ward. A special shout-out to M.J. Yatsko for dealing with all the
things that I did not want to deal with. Also, a special thanks to Prof. Giorgio Rizzoni and
all the EcoCAR industry sponsors, for their support throughout my time on EcoCAR.

v
Vita
February 22, 1991 ..........................................Born – Cap-Haitien, Haiti
2009................................................................West Boca Community High School
2014................................................................B.S. Mechanical Engineering, University of
Central Florida
2014 to present ..............................................Graduate Fellow, The Ohio State University
Publications
Yacinthe, S., Khanna, A., Ward, J., Yatsko, M. et al., "Development of the Design of a
Plug-In Hybrid-Electric Vehicle for the EcoCAR 3 Competition," SAE Technical Paper
2016-01-1257, 2016, doi:10.4271/2016-01-1257.
Khanna, A., Yacinthe, S., Ward, J., Yatsko, M. et al., "Model and Controls Development
of a Post-Transmission PHEV for the EcoCAR 3 Competition," SAE Technical Paper
2016-01-1252, 2016, doi:10.4271/2016-01-1252.
Field of Study
Major Field: Mechanical Engineering

vi
Table of Contents
Abstract ............................................................................................................................... ii
Dedication .......................................................................................................................... iii
Acknowledgments.............................................................................................................. iv
Vita ...................................................................................................................................... v
Table of Contents ............................................................................................................... vi
List of Tables ..................................................................................................................... ix
List of Figures ..................................................................................................................... x
Chapter 1: Introduction ....................................................................................................... 1
1.1 Background ......................................................................................................... 1
1.2 Motivation ........................................................................................................... 1
1.3 Project Objective ................................................................................................. 4
1.4 Organization of Thesis ........................................................................................ 4
Chapter 2: Literature Review .............................................................................................. 5
1.1 Systems Engineering ........................................................................................... 5
1.1.1 Motivation and Introduction ......................................................................... 5

vii
1.1.2 Model-Based Systems Engineering ............................................................ 15
1.1.3 System Safety Alignment ........................................................................... 23
1.1.4 State of the Art Methodologies ................................................................... 27
Chapter 3: Model-Based Systems Engineering Approach ................................................ 36
1.1 Implemented Approach ..................................................................................... 36
1.2 Supporting Tools Implemented......................................................................... 39
1.3 Alignment with System Safety Development ................................................... 41
1.4 Deployment Strategy ........................................................................................ 45
Chapter 4: System Safety Analysis ................................................................................... 48
1.1 Introduction ....................................................................................................... 48
1.2 Preliminary Hazard Analysis and Safety Concept ............................................ 48
1.3 Requirements Generation and Management ..................................................... 55
Chapter 5: System Safety Design and Implementation .................................................... 63
1.1 Introduction ....................................................................................................... 63
1.2 Software Design ................................................................................................ 64
1.3 Implementation and Testing ............................................................................. 70
Chapter 6: Accomplishments and Future Work ................................................................ 80
1.1 Accomplishments .............................................................................................. 80
1.2 Future Work ...................................................................................................... 80

viii
Bibliography ..................................................................................................................... 81
Appendix ........................................................................................................................... 83
1.1 Safety Analysis: Diagrams and Snapshots of Working Documentation .......... 83

ix
List of Tables
Table 1: Ohio State EcoCAR 3 Vehicle Architecture Component Specifications ............. 3
Table 2: Tables and Matrix Summary Views [16]............................................................ 44
Table 3: Summary of Additional Safety Systems Identified ............................................ 54
Table 4: Torque Estimation Methods for Transmitting Devices ...................................... 68

x
List of Figures
Figure 1: Vehicle Development Process ............................................................................. 2
Figure 2: Ohio State EcoCAR 3 Vehicle Architecture ....................................................... 2
Figure 3: Traditional Product Development Sequential Process [10] ................................ 6
Figure 4: Systems Engineering Practice and Process [10] .................................................. 9
Figure 5: Traditional V-model for Systems Engineering [10] .......................................... 10
Figure 6: The Common Process Validation Leading to Integration Wars [10] ................ 14
Figure 7: Continuous Validation with the Customer in the Loop [10] ............................. 14
Figure 8: INCOSE MBSE Roadmap [9] ........................................................................... 17
Figure 9: Traceability from Requirements to Engineering Artifacts [7] .......................... 19
Figure 10: Traceability Between Elements of Different Artifacts [6] .............................. 20
Figure 11: Systems Modeling and Common Elements [7] ............................................... 21
Figure 12: Requirements Coverage and Fulfillment [7] ................................................... 22
Figure 13: Main Tools for MBSE [8] ............................................................................... 24
Figure 14: Systems Models and Functional Safety Analysis [12] .................................... 26
Figure 15: Model- and State-Based Control Architecture ("Control Diamond") [11] .... 28
Figure 16: Conceptual Layout of Requirements, Functions, and Components. [11] ....... 29
Figure 17: Vitech MBSE Primary SE Activities [11] ....................................................... 31
Figure 18: Vitech MSBE Primary SE Domains [11] ........................................................ 32

xi
Figure 19: Harmony Integrated Systems and Software Development Process [11] ......... 33
Figure 20: Harmony-SE Process Elements [11] ............................................................... 35
Figure 21: Rational Integrated Systems/Embedded Software Development Process [14] 37
Figure 22: Rational Solution for Systems and Software Engineering [15] ...................... 38
Figure 23: IBM Rational Supporting Tools ...................................................................... 39
Figure 24: MathWorks and dSPACE Model-Based Design Tools for SW Dev. ............. 41
Figure 25: Example of FTA Linked to Requirements [16] ............................................... 43
Figure 26: Deployment Timeline for Integration of MSBE Approach............................. 45
Figure 27: High Level Block Diagram of Functional Control System ............................. 49
Figure 28: Hazard Identification and Classification Process ............................................ 50
Figure 29: Hazard Identification Example ........................................................................ 51
Figure 30: Process for Developing Diagnostic and Mitigation Strategies ........................ 52
Figure 31: Examples of Developed Diagnostic and Mitigation Strategies ....................... 53
Figure 32: Hazard Metrics Translation Process ................................................................ 56
Figure 33: Hazard Metrics Translation Example .............................................................. 57
Figure 34: Process for Defining Safety Requirements ..................................................... 58
Figure 35: Example for defining safety requirements ...................................................... 58
Figure 36: Process for Developing Preliminary V&V Plans ............................................ 59
Figure 37: Highlight of IBM Quality Manager for V&V Plans ....................................... 60
Figure 38: Initial Documentation Workflow .................................................................... 61
Figure 39: Snapshots of IBM DOORS Tool Integration .................................................. 62
Figure 40: OSU Controls Software Development Process ............................................... 63
xii
Figure 41: High-level Functional Safety Software Design ............................................... 65
Figure 42: Torque Security Monitoring Process ............................................................... 66
Figure 43: Comparison of Feedback Torque, Estimated Torque, and Allowable Range . 69
Figure 44: DOORS Integration for Requirements Traceability ........................................ 70
Figure 45: V-Process with Verification and Validation Emphasis ................................... 71
Figure 46: Controls Software Development Process [need citation] ................................ 73
Figure 47: Example of Directional Torque Flow in EV Only Mode ................................ 74
Figure 48: Example of EM Torque Signals ...................................................................... 75
Figure 49: Statistics for Requested Torque versus Commanded Torque ......................... 75
Figure 50: Statistics for Commanded Torque versus Torque Feedback ........................... 76
Figure 51: Example Testing for Fault Insertion ................................................................ 77
Figure 52: Tiered Fault Mitigation Strategy ..................................................................... 78
Figure 53: Example of Tiered Fault Mitigation Strategy ................................................. 79
Figure 54: CAN Interactions ............................................................................................. 83
Figure 55: Electrical Interactions ...................................................................................... 84
Figure 56: Torque Flow Interactions ................................................................................ 85
Figure 57: Snapshot of Working Documentation for Preliminary Hazard Analysis ........ 86
Figure 58: Snapshot of Working Documentation for Safety Concept .............................. 87

1
Chapter 1: Introduction
1.1 Background
Given the continued trends in the automotive industry for increased fuel economy
and reduced emissions, solutions have been driven by innovative research in the area of
hybrid electric vehicles and subsequent technologies. To help support this effort, the United
States Department of Energy (U.S. DOE) has sponsored the Advanced Vehicle Technology
Competitions (AVTC’s) for over the past 27 years. Through management by Argonne
National Labs (ANL), the AVTC program has partnered with North American OEMs and
automotive suppliers to serve as the premier training ground in developing the next
generation of automotive engineers and future leaders in engineering. The latest ATVC is
EcoCAR 3, in which students are challenged to re-engineer a stock conventional vehicle
to a hybrid-electric powertrain.
1.2 Motivation
In particular, the Ohio State University is participating in EcoCAR 3, which is a
four-year long competition amongst 16 North American university teams to redesign the
2016 Chevrolet Camaro to reduce its environmental impact, while maintaining the muscle
and performance expected from the iconic American car. Figure 1 illustrates the four-year

2
long vehicle development process, highlighting the design, integration, development, and
market engagement gates throughout the years.
Figure 1: Vehicle Development Process
To meet the performance hybrid vehicle requirements of the competition, the Ohio State
team has designed a plug-in hybrid-electric architecture that’s illustrated in Figure 2.
Figure 2: Ohio State EcoCAR 3 Vehicle Architecture

3
As Figure 2 highlights the configuration of the vehicle, Table 1 details the architecture
components, including the manufacturer, model, and key performance specifications.
Table 1: Ohio State EcoCAR 3 Vehicle Architecture Component Specifications
Component Manufacturer & Model Performance Specifications
Engine 2.0L GDI TiVCT I4 E85 119 kW, 198 Nm
Transmission Tremec T-5 5-speed MT (to be automated)
BAS Motor Denso ISG 32 kW, 350V
BAS Inverter Rinehart PM100DX 360V Max DC; 300 Arms/350 Apeak
Electric Machine Parker GVM-210-150S 112 kW peak, 350V
EM Inverter Rinehart PM150DX 360V Max DC; 450 Arms/750 Apeak
Mechanical
Coupler American Axle Custom Designed and Made
Rear Differential General Motors Stock 2016 Camaro part
Fuel Tank OSU custom made 8.2 Gal capacity
Charger Brusa NLG513 3.7 kW, air cooled
To effectively assess and increase overall product quality and readiness, a robust
framework for managing engineering complexity is needed throughout the vehicle
development process. Specifically, in order to realize requirements driven by the EcoCAR
3 competition and the Ohio State team, there must be processes and tools in place for
requirements management, traceability, and fulfillment throughout all levels of the
development process. Implementing a suite of processes and supporting tools that align
with development activities will lead to increased documentation, reduced re-work, and
ultimately an accelerated engineering environment.

4
1.3 Project Objective
The goal of this project is to lay down a foundation for increasing the overall
product quality and readiness of Ohio State’s EcoCAR 3 vehicle. This work defines and
deploys a state of the art Model-Based Systems Engineering (MBSE) approach for
managing engineering complexity as it relates to requirements management, traceability,
and fulfillment. To demonstrate the effectiveness of the implemented approach, this work
presents development activities for system safety that have been conducted so far.
1.4 Organization of Thesis
The rest of the thesis is organized as follows:
Chapter 2 will introduce the concept of systems engineering and its motivation. This
chapter will also elaborate on MBSE, the state of the art approaches, and the supporting
tools that have been implemented.
Chapter 3 will elaborate on the specific MBSE approach that the Ohio State team is
implementing, focusing on specific supporting tools, and how the approach aligns with
EcoCAR 3 and system safety activities.
Chapter 4 will go into specific system safety analysis activities that have been conducted
and how they have been integrated into the MBSE framework
Chapter 5 will be a deep dive into system safety software design, implementation and
testing to demonstrate how the MBSE framework supports these development activities.
Chapter 6 will draw conclusions on the project by highlighting accomplishments and areas
where future work can be conducted.

5
Chapter 2: Literature Review
1.1 Systems Engineering
1.1.1 Motivation and Introduction
Motivation for Systems Engineering
Presented in Figure 3 is today’s sequential process for product development which
is geared towards static, stand-alone, hardware-centric products. The procedure begins with
bright individuals asking, “What can we build that will make money?” and concludes with
a complete product that’s handed off to manufacturing. This process assumes that all
requirements can be determined a head of time and treats changes to requirements as an
undesirable burden [1].
In particular, these static requirements are viewed as outputs of the planning stage
and inputs to the design stage, while the sets of requirements for hardware and software
are related. For hardware and software design and development, these activities are done
independently without much collaboration amongst teams. Next, the system design,
including hardware, software, and the associated bill-of-materials (BOM) are released to
manufacturing, which optimize time and cost to build the product. Lastly, hardware and
software integration takes place at the end of the development process [1].

6
Figure 3: Traditional Product Development Sequential Process [1]
Initially this traditional waterfall approach for product development may seem to
make sense by enabling teams of experts to focus on their respective areas. But it’s
becoming clear that with today’s evolving products, the traditional process can be
improved in a number of areas including the following [1]:
Aversion to change: As end-users and customers change their minds along with
the availability of new technologies and competitive products, requirements do
change, thus requirements stability is beyond optimistic in sequential product
development. In such a process, change is considered incredibly disruptive to
previously defined plans that lead to a significant amount of rework. As change is
7
inevitable and will continue to increase, rethinking traditional approaches for
managing change is critical [1].
Inefficient use of engineering resources: The sharing of data, information, and
expertise are constrained due to silos of development. On the off chance that one is
developing a new product that shares features with or has comparable elements to
an existing product, the new product is developed from scratch [1].
Internal focus: The traditional waterfall product development process often has an
internal focus. For better agility and to improve the development process,
opportunities need to viewed for continuous gathering of information from stake
holders and operational systems [1].
Misaligned metrics: Metrics frequently have an inner core interest on internal
processes. Effective metrics need to highlight how well a product meets
specifications [1].
Late discovery of defects: The inevitable integration wars begin due to integration
of mechanical, electrical, and software systems happening at the end of
development. Integration problems are difficult to diagnose as they are discovered
very late in the engineering process [1].
Gap between needs and requirements: After the completion of integration wars,
and the system has gone through exhaustive testing, the validation process begins.
As this process takes place at the end to check how well the product meets the
customer and end-user needs, needs have changed, and there’s a significant gap
between user expectations and product performance [1].
8
Introduction to Systems Engineering
Systems engineering can be defined as, “an interdisciplinary approach for creating
large, complex systems that meet a defined set of business and technical requirements”.
With a new era of smarter and highly connected products, the fundamentals of systems
engineering can be used to develop these smarter, interconnected products, though the
specific approach could use some work. Produced out of the space program systems
engineering consist of both a practice and a process[1]:
As a practice, systems engineering deals with the overall behavioral and functional
features of systems, how they interface amongst other systems and users, the
interactions between the subsystems, and how the interdisciplinary of engineering
unite to work together [1].
As a process, systems engineering lays out “a robust, structured approach to system
development that can be applied at a system- of- systems level or within specific
engineering disciplines”. Figure 4 illustrates the “realm” of systems engineering,
highlighting the alignment of practice and process [1].
9
Figure 4: Systems Engineering Practice and Process [1]
“Since the 1990s, systems engineering has been successfully helping companies
grapple with increasingly complex products”. Today, the systems engineering philosophy,
“of viewing products as one part of an overall system and defining a structured approach
to development” continues to be valid as it has been in the past. The traditional systems
engineering process, illustrated by the V-model in Figure 5, is however sequential in
nature, and as stated previously sequential process are far from ideal moving forward. Thus
new approaches to implementing systems engineering must be explored [1].

10
Figure 5: Traditional V-model for Systems Engineering [1]
Given current trends of increased product complexity, an overall systems focus
should be kept, “not only just on the system you’re building but also on the larger system
it’s a part of and on the system that the larger system is a part of”. Thus, any new approaches
to systems engineering should build on the following key components [1]:
Levels of abstraction: This component aids with establishing defined scopes and
boundaries between elements of work to enable those elements to be further refined
and developed in parallel. “System decomposition is a critical technique for
improving parallelism in the development process” [1].

11
Modeling: System models allows for complexity at different levels of abstraction
to be captured, thus enabling exploration of the details at each level. These models
also provide a method for capturing system decomposition at levels of abstraction
without the need of providing all the implementation details. “Modeling languages,
such as the Systems Modeling Language (SysML), use a common vernacular to
represent system models in order to promote shared understanding” [1].
Traceability: “All the steps on the left side of the “V” are linked through
requirements, which are referenced as the steps up the right side of the “V” are
executed, providing the ability to trace all design elements back to specific
requirements” [1].
What is considered to be a good system engineering process “captures traceability between
the different artifacts in the life cycle to capture relationships and document decisions so
you can better understand cause-and-effect, explore the impact and scope of a change, and
provide auditability for compliance reasons” [1].
Systems engineering has provided a solid foundation for product development, “it
has traditionally been carried out as a series of sequential processes, traversing the “V”
from left to right, starting with requirements and ending with release to manufacturing”.
Though, what is needed now is a less constrained approach to systems engineering, “that
welcomes change by leveraging an open tools platform to ensure that all users have easy
access to information anywhere in the life cycle at any time”. On the bright side, the high-
tech industry is quickly producing new developments that support turning systems
engineering into a “powerhouse” for smarter product development [1].

12
Ensuring that the system is built to the desired specification is great, but what if
initial requirements driven by the customers or stakeholders change? This is where
validation is key. Validation is a process that ensures that requirements conform with the
users’ needs and uses. In particular, it involves these two things [1]:
“Helping your customers figure out their needs because users can’t always
conceptualize exactly what it is they need” [1]
“Making sure to share the same understanding of what you’re going to build for
your customers” [1]
Some example of questions that able to be answered through validation include:
“Should a user be able to customize the fields in the display on a runner’s watch?”
[1]
“What’s the right behavior of a Wi-Fi-enabled home dialysis system when the
connection is intermittent?” [1]
“Is this {command1, command2, . . .} the right sequence of voice commands for
making a phone call while driving your car?” [1]
Although validation is not a new concept when developing a product, it is common practice
to validate a system against customer needs, but only after the system has been designed,
developed, tested, and integrated. The new approach to validation in the concept of
“continuous engineering” is about when and how often validation is done. “Continuous
engineering challenges you to validate your progress continuously with your customer
throughout the entire design — not just at the end” [1].
13
Further, the concept of continuous validation is, “an ongoing, iterative discovery
process through which you continuously improve your understanding of end-user needs
throughout the product development process”. By doing so, end-users better articulate and
refine their needs throughout the development process, while the system requirements are
updated to reflect the newly discovered needs [1]. For the sake of a detailed anecdote that
illustrates continuous validation:
If you hired an architect and builder to create your dream home, would you
be content with seeing the house for the first time only after the construction is
over? Or would you prefer that the architect and builder check in with you
periodically to validate their assumptions and make sure the project is on track to
meet (or exceed) your expectations? People aren’t always good at imagining the
end product based on requirements. For instance, is a 110 square foot kitchen big
enough to comfortably prepare a meal for six people? Who knows until you can
walk around in it or at least see it mocked up in a drawing or model. While you
may wish that you could get to a stable, “frozen” set of requirements, that is
unrealistic. And if customers’ requirements get refined or even changed, wouldn’t
you prefer to know as early as possible, rather than at the end? Continuous
validation enables you to compress time to end-user feedback, which means that
you find out early on if there’s a gap between the latest end-user needs and the
current set of requirements [1].
Closing the loop with the end-user or stakeholders as much as possible, leads to the
avoidance of defects and reduction in business risk. The V model, previously presented,

14
“applies to waterfall development process just as it applies to iterative processes and even
to Agile development around the bottom of the V. But the truth is that in reality, product
development goes through many Vs”, as illustrated in Figure 6 [1].
Figure 6: The Common Process Validation Leading to Integration Wars [1]
By applying continuous engineering practices, the interaction with the stake holders and/or
end-user becomes much more frequent, as illustrated in Figure 7 [1].
Figure 7: Continuous Validation with the Customer in the Loop [1]
15
1.1.2 Model-Based Systems Engineering
Motivation
“Standard development lifecycles are often described in a document centric fashion
(e.g. ISO 26262 defines a V-Model with Work Products after each Lifecycle step to be
verified)”. Each department describes requirements in a document through the document
centric approach, usually in a document type out of the Microsoft Office Family, which
seems easy to implement initially. Although there is very little training that needed with
standard office tools that are widely available, many failures can be made here, and
document maintainability may become very error-prone” [2].
Worst case scenario, critical documents are saved on a server without any version
control or configuration/change management. As documents are simply forwarded to
various engineering departments for implementation, this simple hand-over without any
structured approval process is not ideal for traceability. “Links and references to additional
related documents may be deeply nested within documents, not updated, and hard to
follow. In such a scenario traceability would be hard to implement and maintain” [2].
Further, in document centric development process that lacks appropriate supporting
tools, maintenance and verification/validation activities have to be done manually. Thus,
given the complexity of today’s products, this becomes infeasible, “Therefore companies
may fail to prove compliance to ISO 26262 despite best intent” [2].
16
Model centric or Model based development is, “focusing on providing the
information within one repository on the basis of a model”. The same steps are followed
as seen in the document centric development process. A typical workflow includes:
Requirements are forwarded to the system via written specifications hold in a
requirements engineering and management tool (RME Tool). The RME tool is
interfacing the modelling tool via direct tool interfaces for instance Rhapsody
Doors Gateway. The modelling tool holds the model artefacts and allows the
creation of the model in descriptive languages like SysML or UML. Describing the
systems architecture in a model is guiding and formalizing the analysis task and
providing the requirements for the following engineering activities, i.e. for the
implementation domains like HW and SW [2].
Requirements management (RM) is not being replaced by modeling, it is actually assisting
with understanding the rationale for design decisions. Especially for complex systems, both
are much needed for a complete understanding. “RM provides the traceability and
contractual basis, Modelling allows multiple views using different diagrams and helping
to understand the requirements and assuring consistency thereof by having them linked
into the model”. As modeling act as the “glue” between levels of requirements, model tools
also help automate verification tasks that are error-prone, such as traceability and
consistency check [2]. Lastly, Figure 8 illustrates the roadmap for extending the maturity
and capability of MSBE.

17
Figure 8: INCOSE MBSE Roadmap [3]
Requirements Management and Traceability
When requirements management is built on the foundation of a systems engineering
paradigm, this “enables organizations to capture and validate software requirements, link
them to downstream development and testing activities and to manage their completion
through a unified process across the lifecycle”. The activities that are performed within the
area of requirements become management-focused, once the requirements become
developed and the product begins to take shape [4].
This is what can be referred to as the “living” stage of the product development
lifecycle, as new information can surface throughout the development process,
requirements and any upstream or downstream artifacts are informed. Thus,

18
“modifications, enhancements, corrections and additions occur during this living period of
the product's lifecycle, leading to the generation of a significant amount of information”.
All this information needs to be fulfilled through traceability and management, and
approaching these tasks manually leads to increased cost and error. Further, “automation
requires that all engineering artifacts and work products are somehow connected - an
inherent quality of the systems engineering approach to product development” [4].
For visibility into the engineering process, traceability from the requirements to the
engineering artifacts yields key metrics and insights. Any lack of traceability also offers
insight into the requirements that are not traced to a model. So when approached from a
systems engineering perspective, the overall goal should be to, “seamlessly trace and
interactively navigate within a project through various levels of requirements to design
features, specifications, assigned tasks, testing and deployment activities, and view activity
in context with associated source code changes - all within in a single system and user
interface” This idea of traceability from requirements to engineering artifacts is illustrated
in Figure 9 [4].

19
Figure 9: Traceability from Requirements to Engineering Artifacts [4]
Navigation of linked items provide insight to all types of important information
including relevance to compliance, impact analysis and reporting. Ultimately by linking
the entire system to its related work products, “one can confirm that all requirements have
functional specifications and test cases so that they are developed and tested before the
product is released or project milestones are reached”. In addition, standards related to
compliance, need/want assurance that requirements in implementation are connected from
the engineering process, and vise-versa, “that each model element is there for a reason and

20
that reason is identified by the traced requirements”. For instance, when test cases and
acceptance criteria from software artifacts are tied to their source system models and
requirements, “predicting possible risks can be simplified, allowing for more informed
changes to work products and informing artifacts, and better risk assessment” [4]. Figure
10 illustrates the idea of tracing elements of different artifacts.
Figure 10: Traceability Between Elements of Different Artifacts [5]
Architecture and Design Management
So, as system engineering approach assist with the workflow of information
exchange, tracking changes to collaborative artifacts, and propagating modifications to
related requirements and work products, “Models and other graphical elements which are
generally the output of a systems engineering approach can dramatically improve this
21
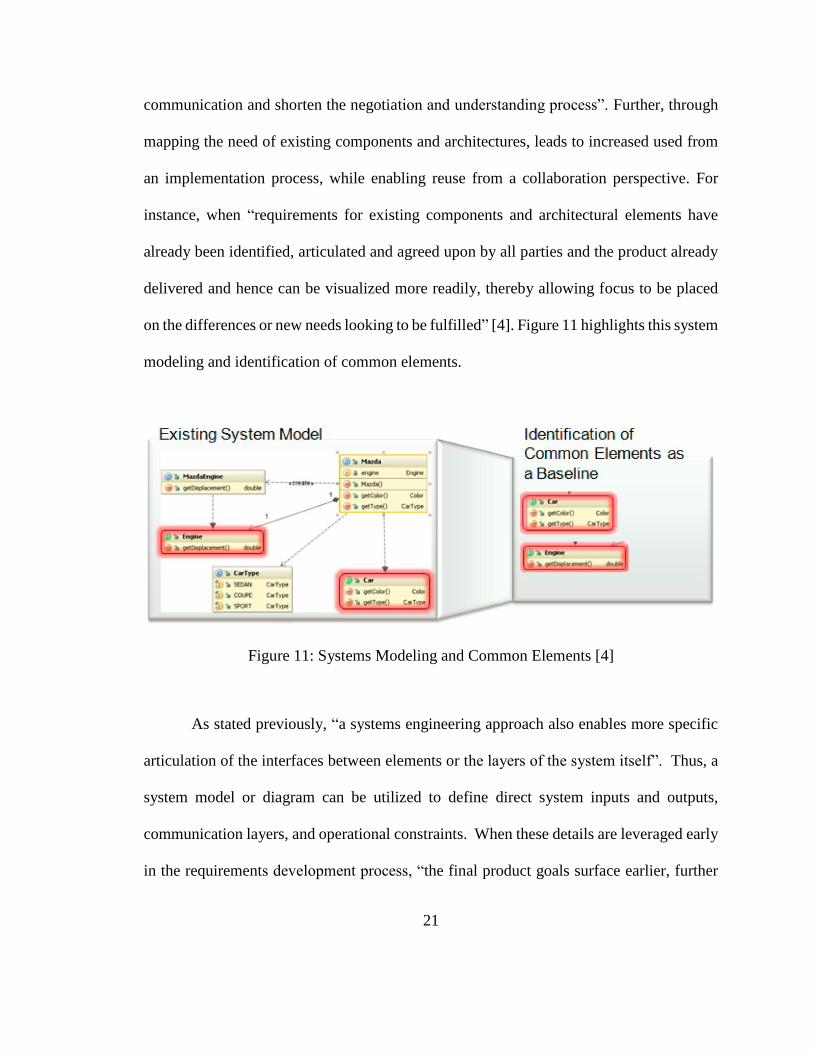
communication and shorten the negotiation and understanding process”. Further, through
mapping the need of existing components and architectures, leads to increased used from
an implementation process, while enabling reuse from a collaboration perspective. For
instance, when “requirements for existing components and architectural elements have
already been identified, articulated and agreed upon by all parties and the product already
delivered and hence can be visualized more readily, thereby allowing focus to be placed
on the differences or new needs looking to be fulfilled” [4]. Figure 11 highlights this system
modeling and identification of common elements.
Figure 11: Systems Modeling and Common Elements [4]
As stated previously, “a systems engineering approach also enables more specific
articulation of the interfaces between elements or the layers of the system itself”. Thus, a
system model or diagram can be utilized to define direct system inputs and outputs,
communication layers, and operational constraints. When these details are leveraged early
in the requirements development process, “the final product goals surface earlier, further

22
informing other downstream activities and arriving at a more complete starting set of
requirements through techniques stemming from a systems engineering approach” [4].
Requirements Coverage and Fulfillment
A critical aspect of management, is visibility into the development process for
effective planning and quality control throughout product development. Thus, the state of
product release and readiness needs to reviewed frequently by management teams [4].
Figure 12: Requirements Coverage and Fulfillment [4]
Key to the determination of project completion and fulfillment as it aligns with product
goals, are readiness indicators such as the degree of requirements coverage and
consistency. For instance, “a project that encompasses hundreds of live requirements that
may be subject to modifications and edits presents a complicated management task. By
connecting requirements to work products and engineering artifacts as they are created,

23
developed and subsequently modified, one can utilize metrics and reports to identify the
extent of completion of a product based on how many requirements have been met; how
many are in progress; and how many requirements are not associated with an existing or
completed work product”. As a results, informed decisions based on release readiness can
be made by management. Requirements management becomes of increased importance as
the complexity of a product increases. Thus, “a systems engineering approach to managing
these requirements ensures that valuable information tying critical product elements – from
requirements to informing artifacts and work products - is tracked, managed and accounted
for”. So while considering the entire system and its related goals, this can yield the
following benefits [4]:
“Assurance of consistency from stated requirements to upstream and downstream
artifacts” [4]
“Management visibility of progress at critical parts of the development cycle” [4]
“Compliance validation at selected points in the process” [4]
“Design reconciliation at an early stage of product development” [4]
1.1.3 System Safety Alignment
The Model Based Design approach also serves as an enabler for an iterative safety
analysis method, as requirements change constantly because of refinement or systems
parameter updates to adapt to meet other system interfaces. “As a rule of thumb, two
percent of the sum of all requirements changes per month. Therefore a single requirements
analysis phase in a standard V-cycle or waterfall model is not strictly applicable” [2].

24
Figure 13: Main Tools for MBSE [2]
Further, faster and more efficient adaption of requirements or designs are enabled
by the Model Based approach. As requirements are changed, the impact to the design of
safety concept is analyzed easier given a model based design. Given that the requirements
are linked to specific model elements, the requirements are changed, the links become
“suspect”, and the supporting tool assist with showing the propagation of the change into
the design. Additionally, “information about modifications is also forwarded into the
safety analysis tool, as this is based on the modelled artefacts which have changed by the
initial requirements change.” Thus, with the main supporting tools for MBSE as seen in

25
Figure 13, the analyst can identify various changes and judge if there is an impacting the
safety case or not [2].
The main purpose of safety analyses is to prove that the system is safe with respect
to random occurrences of hardware failures. According to ISO 26262, “this means the
probability of the violation of the safety goals is below an ASIL specific target value and
evidence is given for an appropriate ASIL specific limitation of the hazards caused by
single- and dual point faults”. Therefore, the initial step of the safety analysis is to populate
the architecture model with failure information. Secondly, the analysis models are
manually or automatically derive from the enhanced model containing failure information.
Finally, “the analysis activities are performed and depending on the outcome new
requirements are specified. As the safety analyses are ASIL and safety goal specific traces
between the safety goals and the different analyses assist in establishing the final safety
case” [6].
Figure 14 illustrates what this approach may look like as it relates to safety analysis.
This approach has been practically implemented with available tools in order to pilot
functional safety focused engineering projects. In particular, with commercially available
tools including IBM Rational Rhapsody and Medini, architecture and design models were
developed and used for functional safety analysis tasks. [6].

26
Figure 14: Systems Models and Functional Safety Analysis [6]
Further, once safety related information is imported into a model, such as “failure
modes and failure rates of parts and blocks have been added, safety analysis activities like
FTA”, applications such as hardware diagnostic coverage metrics etc. can then be executed.
As a result, “traceability to safety requirements and safety goals is established through an
allocation of functional or technical safety requirements to elements of the architecture
model” [6].

27
1.1.4 State of the Art Methodologies
Presented will be an overview of a few of the more notable MBSE methodologies
that have, “have received attention in the various industry forums and publications and are
intended to serve as candidates for adoption and tailoring to an organization’s SE practices
and procedures”. Each methodology is briefly described along with a highlight of available
tools that support each approach [7].
JPL State Analysis
A JPL-developed MBSE methodology that “leverages a model- and state-based
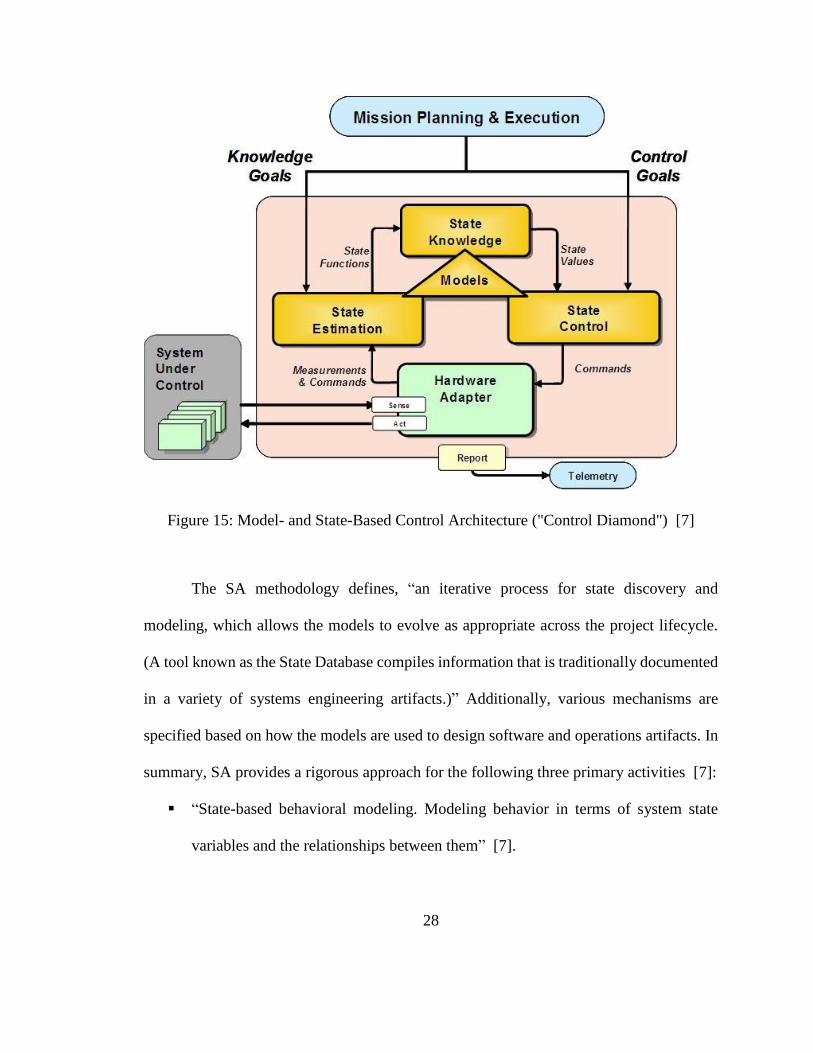
control architecture” is State Analysis (SA), Figure 15 illustrates this method. State is
defined to be “a representation of the momentary condition of an evolving system,” and
models describe how a state evolves. Further, “SA provides a process for capturing system
and software requirements in the form of explicit models, thereby helping reduce the gap
between the requirements on software specified by systems engineers and the
implementation of these requirements by software engineers”. Traditionally, the translation
of requirements to system behavior was done manually by software engineers with the
hope that the understanding of the system behavior was accurately captured. In SA, model-
based requirements are mapped directly to software artifacts [7].
28
Figure 15: Model- and State-Based Control Architecture ("Control Diamond") [7]
The SA methodology defines, “an iterative process for state discovery and
modeling, which allows the models to evolve as appropriate across the project lifecycle.
(A tool known as the State Database compiles information that is traditionally documented
in a variety of systems engineering artifacts.)” Additionally, various mechanisms are
specified based on how the models are used to design software and operations artifacts. In
summary, SA provides a rigorous approach for the following three primary activities [7]:
“State-based behavioral modeling. Modeling behavior in terms of system state
variables and the relationships between them” [7].
29
“State-based software design. Describing the methods by which objectives will be
achieved” [7] .
“Goal-directed operations engineering. Capturing mission objectives in detailed
scenarios motivated by operator intent” [7].
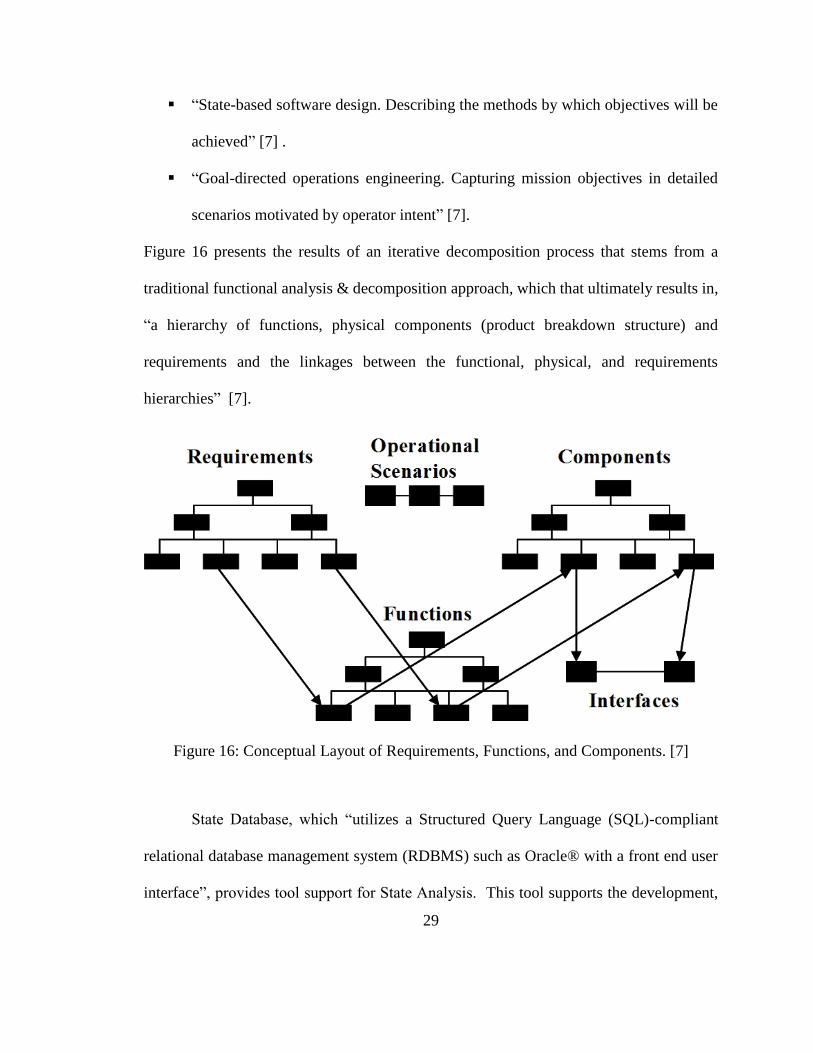
Figure 16 presents the results of an iterative decomposition process that stems from a
traditional functional analysis & decomposition approach, which that ultimately results in,
“a hierarchy of functions, physical components (product breakdown structure) and
requirements and the linkages between the functional, physical, and requirements
hierarchies” [7].
Figure 16: Conceptual Layout of Requirements, Functions, and Components. [7]
State Database, which “utilizes a Structured Query Language (SQL)-compliant
relational database management system (RDBMS) such as Oracle® with a front end user
interface”, provides tool support for State Analysis. This tool supports the development,
30
management, inspection, and validation of system and software requirements that are
captured throughout the SA process. To support system safety development techniques,
including hazard analysis, “commercial tools such as Specifications Tool and
Requirements Methodology (SpecTRM) and the formal requirements language used in that
tool, SpecTRM-RL, as well as SpecTRM-GSC (Generic Spacecraft Component) are
available from Safeware Engineering” [7] .
Vitech Model-Based System Engineering Methodology
Vitech Corporation, the providers of the CORE® product suite, offer “a MBSE
methodology via a set of tutorials developed and offered by Vitech CEO and Chief
Methodologist James (“Jim”) E. Long”. In fact, variations of the tutorial have been
delivered at a numerous INCOSE International Symposia. Illustrated in Figure 17 is the
Vitech MBSE methodology which is based on, “four primary concurrent SE activities that
are linked and maintained through a common System Design Repository” [7].

31
Figure 17: Vitech MBSE Primary SE Activities [7]
Each of the primary Systems Engineering (SE) activities are linked within the
appropriate context as they associated with the specific domains illustrated in Figure 18. In
particular, the SE activities are considered, “elements of a particular kind of domain known
as the Process Domain. In the Vitech MBSE methodology, it is stressed that a MBSE
System Definition Language (SDL) is needed to manage model artifacts, which means that
an agreed-upon information model in the form of a schema or ontology is necessary to
manage the syntax (structure) and semantics (meaning) of the model artifacts”. Thus, an
“SDL” a numerous uses including “struced” or common context-free language for
technical communication, which can serve as a, “guide for requirements analysts, system

32
designers, and developers, and providing a structure for the graphic view generators, report
generator scripts, and consistency checkers” [7].
Figure 18: Vitech MSBE Primary SE Domains [7]
Although the Vitech MSBE approach is considered to be tool-independent, there
are strong ties to the CORE tool set, “There is no process framework tool offered by Vitech
Corporation or third party provider that supports the Vitech MBSE methodology. Vitech
does offer an MBSE tool set via its CORE® product suite” [7].

33
IBM Harmony-SE
“Harmony-SE is a subset of a larger integrated systems and software development
process known as Harmony®. Development of Harmony-SE and Harmony® originated at
ILogix, Inc., formerly a leading provider of modeling tools for the embedded market.”
Figure 19 illustrates the Harmony integrated systems and software development process as
it mirrors the classic “V” process [7].
Figure 19: Harmony Integrated Systems and Software Development Process [7]
Although components of the Harmony process are supported by the Telelogic
Rhapsody “model-driven development environment”, this method is designed to be tool
and vendor neutral. As the Harmony process somewhat mirrors the classic “V”
development process, it assumes model and requirement artifacts are managed/maintained
34
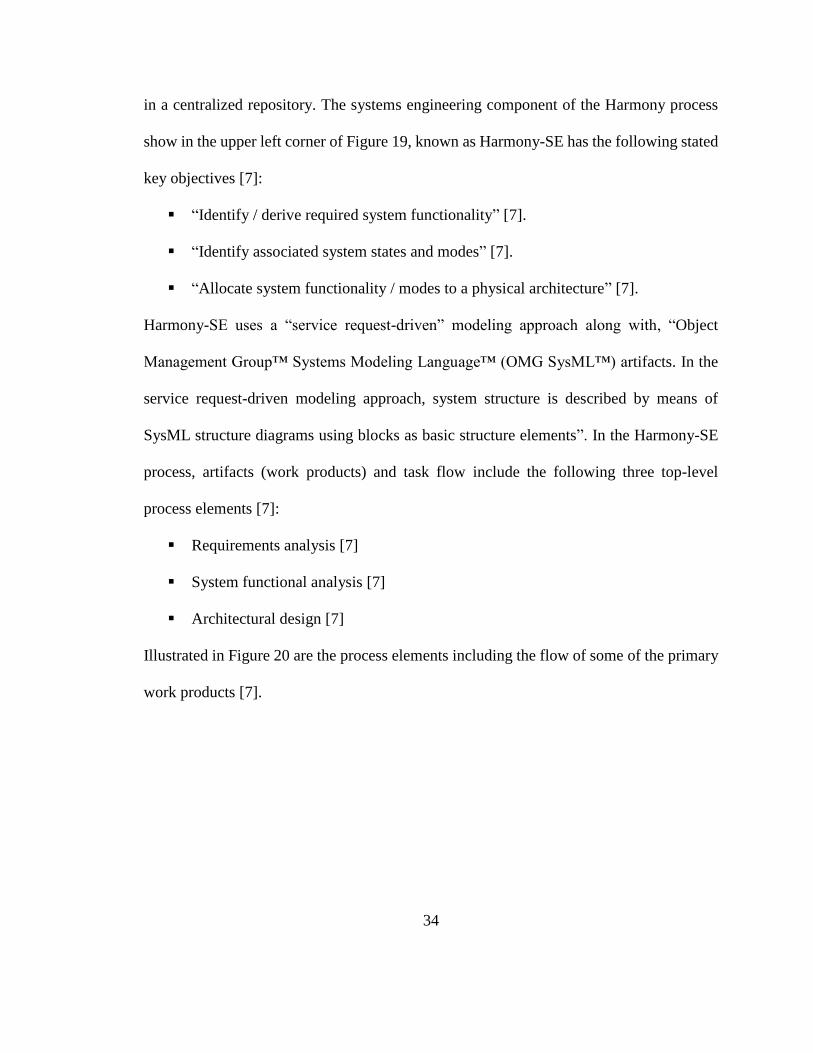
in a centralized repository. The systems engineering component of the Harmony process
show in the upper left corner of Figure 19, known as Harmony-SE has the following stated
key objectives [7]:
“Identify / derive required system functionality” [7].
“Identify associated system states and modes” [7].
“Allocate system functionality / modes to a physical architecture” [7].
Harmony-SE uses a “service request-driven” modeling approach along with, “Object
Management Group™ Systems Modeling Language™ (OMG SysML™) artifacts. In the
service request-driven modeling approach, system structure is described by means of
SysML structure diagrams using blocks as basic structure elements”. In the Harmony-SE
process, artifacts (work products) and task flow include the following three top-level
process elements [7]:
Requirements analysis [7]
System functional analysis [7]
Architectural design [7]
Illustrated in Figure 20 are the process elements including the flow of some of the primary
work products [7].

35
Figure 20: Harmony-SE Process Elements [7]
Although the Harmony-SE and Harmony MBSE methods were created as tool
independent, tool support for these methods are of course provided by IBM, specifically
IBM Telelogic via the Telelogic Tau and Telelogic Rhapsody product offerings [7].
36
Chapter 3: Model-Based Systems Engineering Approach
1.1 Implemented Approach
After much consideration and review of the state of the art approaches for
practically implementing MBSE, it became clear that the Ohio State team would move
forward with the Harmony Integrated Systems and Software Development Process with
IBM supporting tools. Although no case studies or pilots exist that capture the full
integration of the chosen IBM process and tools for automotive development, the Ohio
State EcoCAR team is confident in IBM’s capabilities given the case studies that do exist,
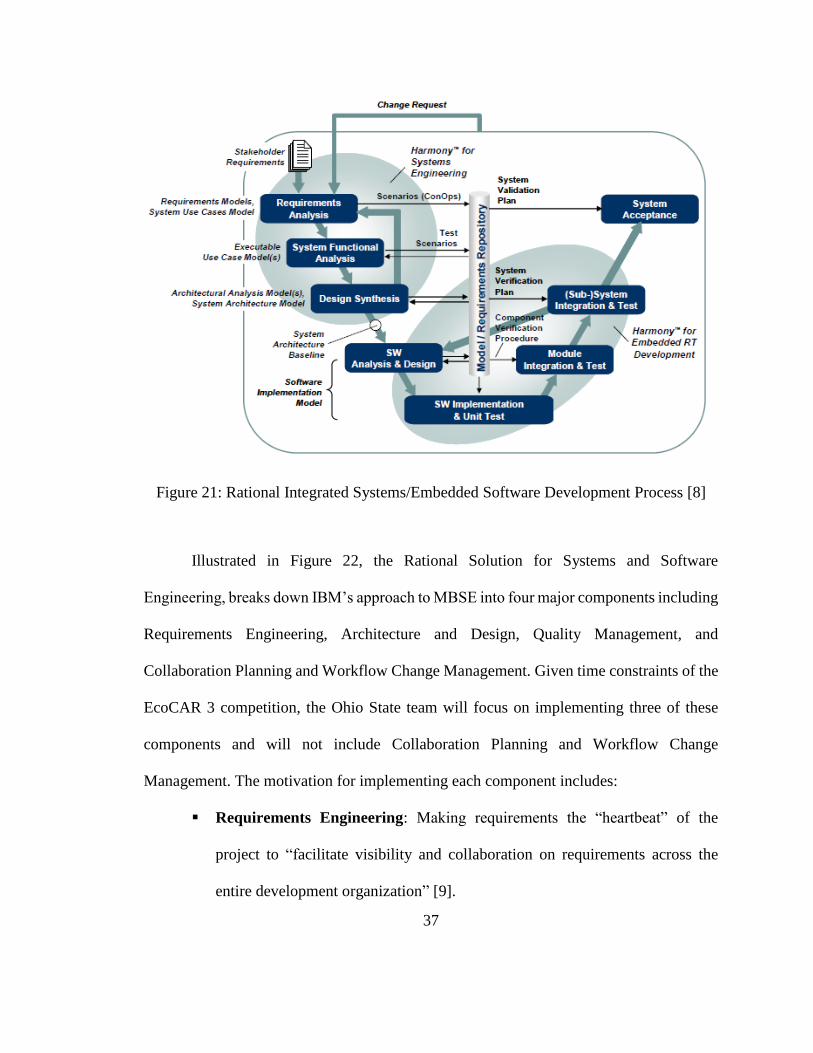
and the developed relationship between the Ohio State EcoCAR team and IBM. Figure 21
details the high-level “V” process in which the Ohio State team is implementing for MSBE,
the IBM Rational Integrated Systems/Embedded Software Development Process. The
systems engineering requirements generation process is highlighted, as well as the software
development and implementation process as it aligns with the traditional “V” diagram.
37
Figure 21: Rational Integrated Systems/Embedded Software Development Process [8]
Illustrated in Figure 22, the Rational Solution for Systems and Software
Engineering, breaks down IBM’s approach to MBSE into four major components including
Requirements Engineering, Architecture and Design, Quality Management, and
Collaboration Planning and Workflow Change Management. Given time constraints of the
EcoCAR 3 competition, the Ohio State team will focus on implementing three of these
components and will not include Collaboration Planning and Workflow Change
Management. The motivation for implementing each component includes:
Requirements Engineering: Making requirements the “heartbeat” of the
project to “facilitate visibility and collaboration on requirements across the
entire development organization” [9].
38
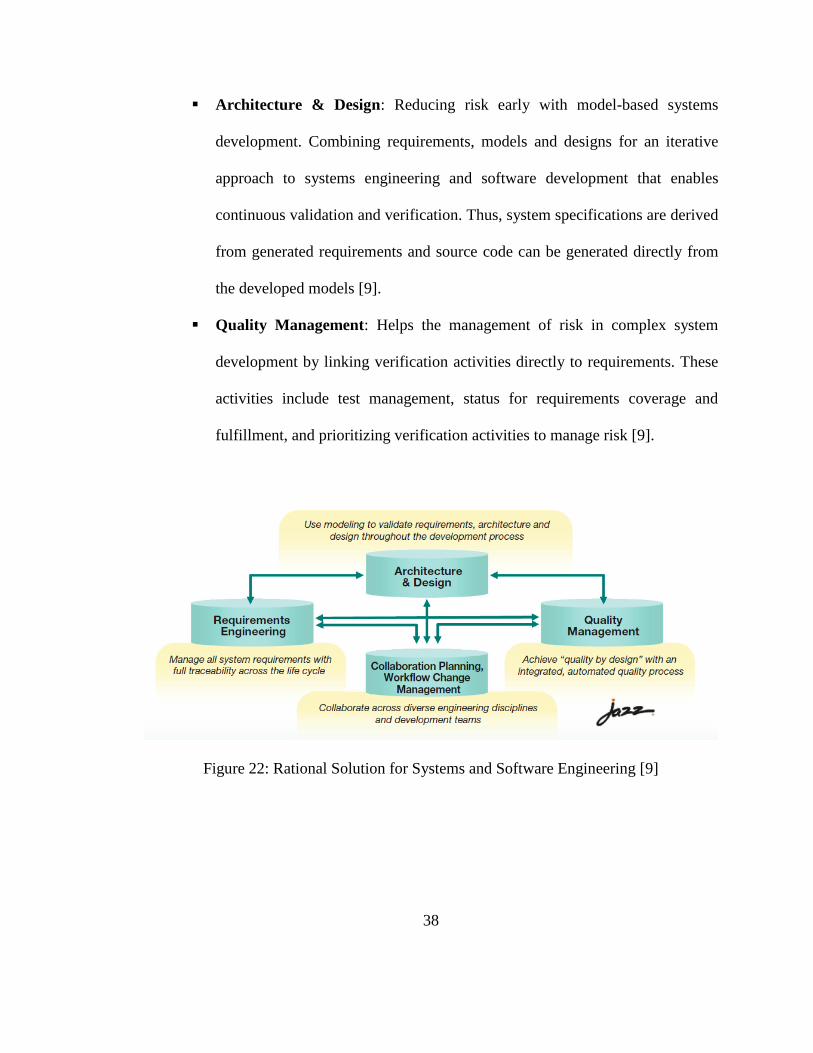
Architecture & Design: Reducing risk early with model-based systems
development. Combining requirements, models and designs for an iterative
approach to systems engineering and software development that enables
continuous validation and verification. Thus, system specifications are derived
from generated requirements and source code can be generated directly from
the developed models [9].
Quality Management: Helps the management of risk in complex system
development by linking verification activities directly to requirements. These
activities include test management, status for requirements coverage and
fulfillment, and prioritizing verification activities to manage risk [9].
Figure 22: Rational Solution for Systems and Software Engineering [9]
39
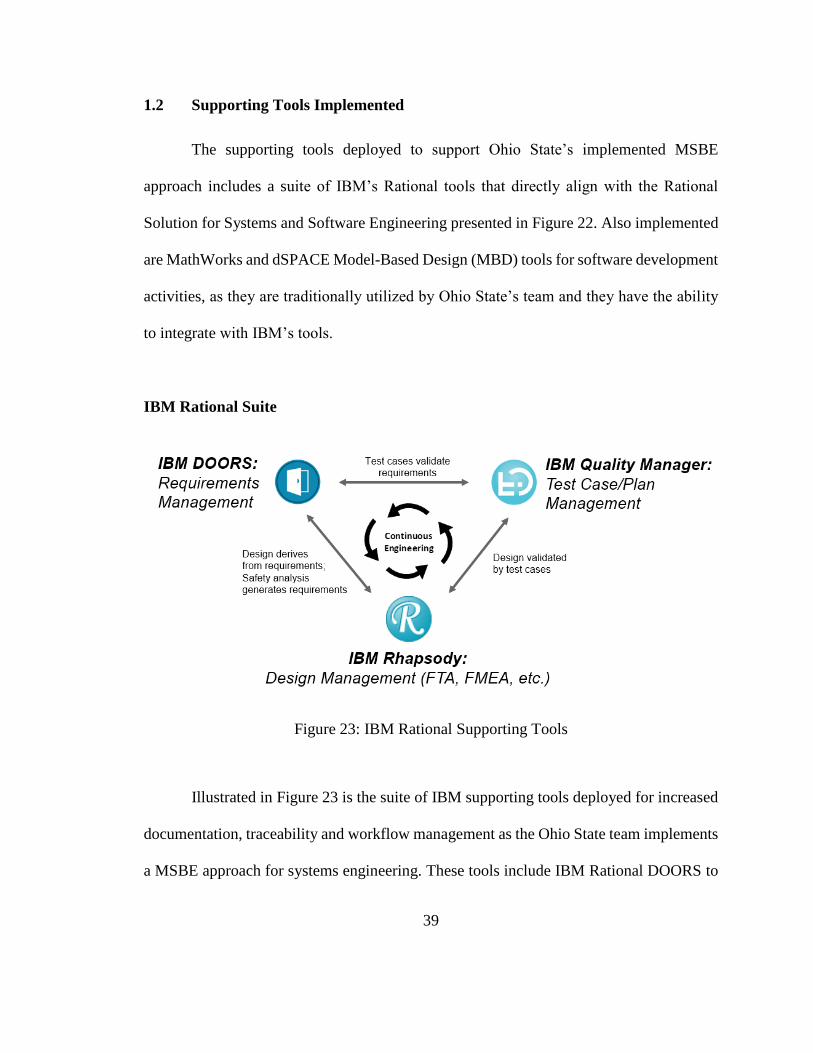
1.2 Supporting Tools Implemented
The supporting tools deployed to support Ohio State’s implemented MSBE
approach includes a suite of IBM’s Rational tools that directly align with the Rational
Solution for Systems and Software Engineering presented in Figure 22. Also implemented
are MathWorks and dSPACE Model-Based Design (MBD) tools for software development
activities, as they are traditionally utilized by Ohio State’s team and they have the ability
to integrate with IBM’s tools.
IBM Rational Suite
Figure 23: IBM Rational Supporting Tools
Illustrated in Figure 23 is the suite of IBM supporting tools deployed for increased
documentation, traceability and workflow management as the Ohio State team implements
a MSBE approach for systems engineering. These tools include IBM Rational DOORS to

40
support requirements management and traceability, Quality Manager for managing V&V
test activities for requirements coverage and fulfillment, and Rhapsody for architecture and
design management. Motivations for each tool includes:
Requirements Management and Traceability:
IBM Rational DOORS® – “A world leading requirements management system that
contains proven capabilities to help increase quality and efficiency by optimizing
requirements communication and collaboration”. Web-based tool with key
capabilities including the ability to import existing requirement documents from
formats including word and excel, and integration capabilities with MathWorks and
MBD tools for traceability [9].
Architecture and Design Management:
IBM Rational Rhapsody® – “A visual analysis and development solution for both
systems engineering and embedded software development that helps to graphically
abstract and simulate complex designs to aid in improving productivity and
reducing costs and risk.” Also supports system safety development activities
including FTA/DMFEA, and integration of MathWorks models [9].
Requirements Coverage and Fulfillment:
IBM Rational Quality Manager – “A robust solution which provides testing teams
with the means to track and manage the whole quality life cycle. IBM Rational
Quality Manager is a web-based test management environment for quality
professionals who seek a collaborative and customizable solution for test planning,
workflow control, tracking, and metrics reporting, designed to help unite teams by
41
seamlessly sharing test information, accelerating project schedules and making
informed release decisions” [9].
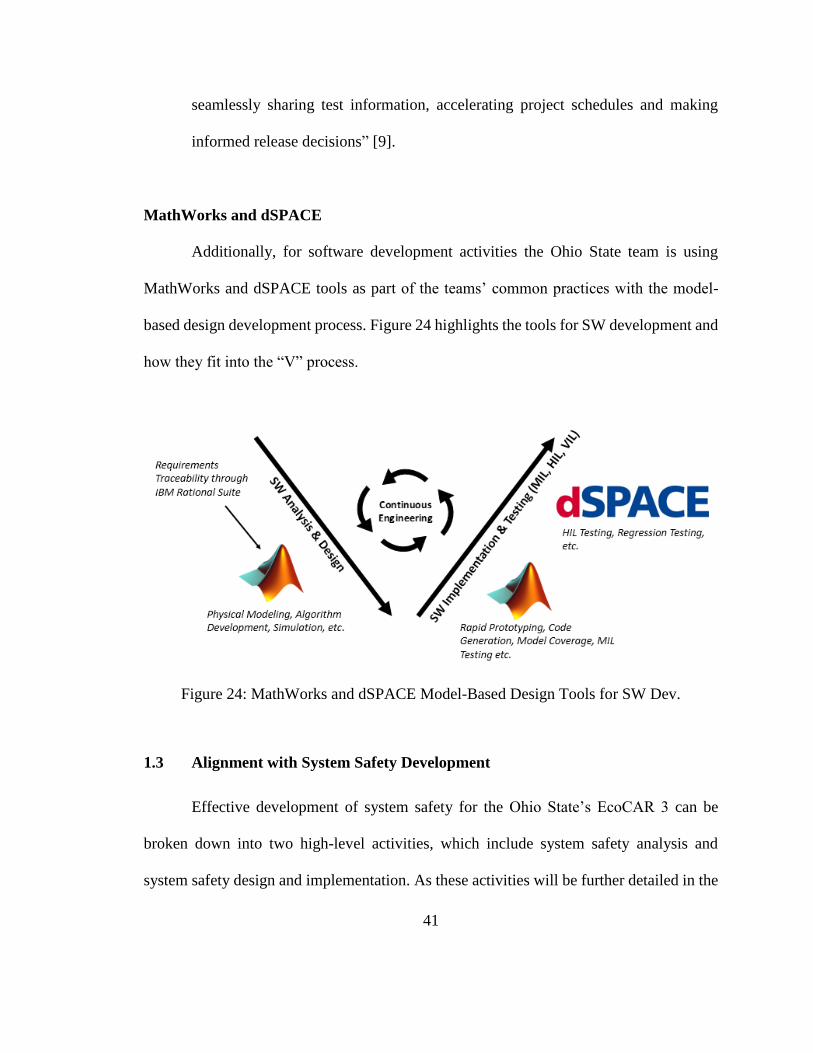
MathWorks and dSPACE
Additionally, for software development activities the Ohio State team is using
MathWorks and dSPACE tools as part of the teams’ common practices with the model-
based design development process. Figure 24 highlights the tools for SW development and
how they fit into the “V” process.
Figure 24: MathWorks and dSPACE Model-Based Design Tools for SW Dev.
1.3 Alignment with System Safety Development
Effective development of system safety for the Ohio State’s EcoCAR 3 can be
broken down into two high-level activities, which include system safety analysis and
system safety design and implementation. As these activities will be further detailed in the

42
upcoming chapters, this section briefly introduces how the capabilities of the implemented
MSBE approach support and align with system safety development.
System Safety Analysis
As system safety analysis is conducted to understand how system faults lead to
hazards and how they can be addressed, a model-centric approach to analyzing the system
can aid the development of safety systems. In particular, IBM Rational Rhapsody (which
is one of the tools that the Ohio State team is implementing to support the MSBE approach)
is a UML based tool with capabilities of supporting this effort, “UML is a modeling
language that is commonly applied to both software and systems development. It provides
a semantic basis of fundamental concepts and views (diagrams) that depicts the interaction
of elements of interest. UML can aid the development of safety critical systems in a number
of ways” [10]:
“By providing design clarity” [10]
“By modeling architectural redundancy” [10]
“By modeling low-level redundancy” [10]
“By creating safety-relevant views of the requirements and design” [10]
“By aiding in safety analysis” [10]
Specifically, IBM Rational Rhapsody supports a number of analysis techniques
including Fault Tree Analysis (FTA), “an analytic approach discussed later in the paper, is
a common technique for analyzing how faults lead to hazards and how to add safety
measures to address these concerns”. Figure 25 illustrates an example of an FTA model in

43
Rhapsody while highlighting traceability capabilities to requirements. Also, matrix and
tabular views are available for summaries of results from analyses [10].
Figure 25: Example of FTA Linked to Requirements [10]
While there are many FTA tools available, the advantages are that, “the
requirements, design model and safety analysis are all co-located and all interconnected.
This allows developers to reliably navigate between these three kinds of views with ease”.
44
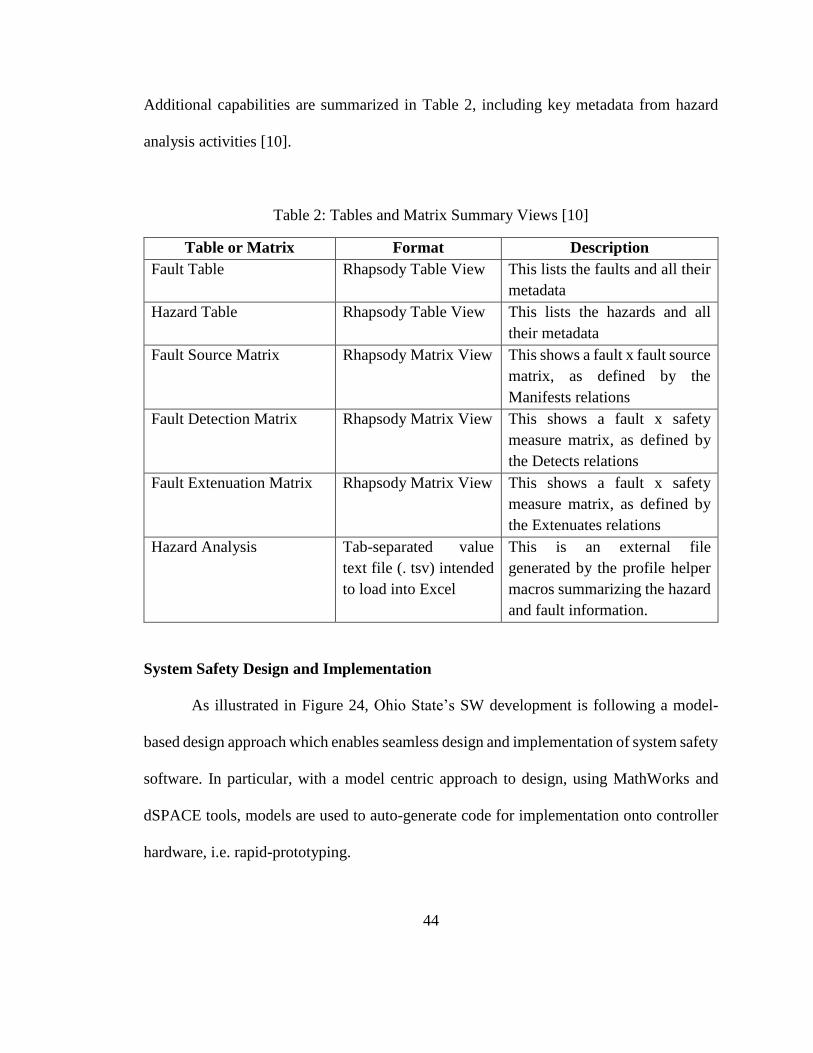
Additional capabilities are summarized in Table 2, including key metadata from hazard
analysis activities [10].
Table 2: Tables and Matrix Summary Views [10]
Table or Matrix Format Description
Fault Table Rhapsody Table View This lists the faults and all their
metadata
Hazard Table Rhapsody Table View This lists the hazards and all
their metadata
Fault Source Matrix Rhapsody Matrix View This shows a fault x fault source
matrix, as defined by the
Manifests relations
Fault Detection Matrix Rhapsody Matrix View This shows a fault x safety
measure matrix, as defined by
the Detects relations
Fault Extenuation Matrix Rhapsody Matrix View This shows a fault x safety
measure matrix, as defined by
the Extenuates relations
Hazard Analysis Tab-separated value
text file (. tsv) intended
to load into Excel
This is an external file
generated by the profile helper
macros summarizing the hazard
and fault information.
System Safety Design and Implementation
As illustrated in Figure 24, Ohio State’s SW development is following a model-
based design approach which enables seamless design and implementation of system safety
software. In particular, with a model centric approach to design, using MathWorks and
dSPACE tools, models are used to auto-generate code for implementation onto controller
hardware, i.e. rapid-prototyping.

45
1.4 Deployment Strategy
Given the overall competition development timeline, and specifically system safety
deliverables, there needed to be a deployment strategy for effectively implementing the
selected MSBE approach and respective supporting tools. Figure 26 illustrates a
deployment timeline for integrating each major MSBE component as they align with the
overall competition development timeline and major system safety activities.
Figure 26: Deployment Timeline for Integration of MSBE Approach
In particular, the development timeline is four years long consisting of the following major
activities during each year:
Year One: Main focus is design, including vehicle architecture selection and initial
component testing and system modeling and simulation.
Year Two: Main focus is full vehicle integration, and rigorous testing of major
components, as well as controls development for initial deployment.
Year Three: Main focus is development, full vehicle testing and refinement as it
relates to component integration and controls development.

46
Year Four: Main focus is vehicle optimization and finalizing verification and
validation activities to achieve 100% build.
Further, as defined by the EcoCAR 3 competition and driven by major deliverables, system
safety activities fits into the overall development timeline as follow:
Year One: The system safety component of EcoCAR was not deployed until year
two, thus there were no deliverables during year one.
Year Two: Main focus is initial safety requirements generation through hazard and
fault analysis for initial system safety concept, defining safety requirements, and
generation of preliminary V&V plans.
Year Three: Main focus is system safety design and implementation, including
system and component level DFMEA/FTA activities and updates to V&V plans.
Year Four: Main focus is safety verification and validation through exhaustive
testing and reviews.
Lastly, the deployment of each phase and supporting tool of the MBSE process will be as
follows to be in line with expectations and requirements of the EcoCAR 3 competition:
Year One: Main focus was the review and selection process for an MBSE method
and supporting tools, including brief pilots of potential methods and tools.
Year Two: Main focus was to commit to a MBSE approach and supporting tools,
including the full deployment of the requirements management tool IBM Rational
DOORS and initial deployment of Test Management Tool IBM Quality Manager.
Year two also included the initial deployment of IBM Rational Rhapsody.

47
Year Three: Main focus will be the full deployment of IBM Rational Rhapsody
and final integration of IBM Quality Manager.
Year Four: Main focus will be assessing the overall MBSE method as it is fully
integrated, and identifying areas for workflow improvement

48
Chapter 4: System Safety Analysis
1.1 Introduction
According to the EcoCAR 3 competition, system safety development is described
as a “disciplined and comprehensive engineering effort to identify safety related risks to be
either eliminated or controlled”. This includes a number of tasks which were briefly
highlighted in Chapter 3 and will be further detailed in this chapter. In particular, as the
EcoCAR 3 is currently in transition to year three of the competition, this chapter will
highlight system safety activities that have been done during year two of the competition.
Overall, this will include preliminary hazard analysis and system safety concept, and
requirements generation and management activities conducted by the Ohio State team.
1.2 Preliminary Hazard Analysis and Safety Concept
Conducting a preliminary hazard analysis and developing an initial safety concept
for iterative refinements begins with defining the functional control system that fully
describes the system being analyzed and developing processes for key activities including
vehicle hazard identification and classification, and diagnostic and mitigation strategies.

49
Functional Control System
Illustrated in Figure 27 is the high level block diagram of the functional control
system which lays out the major components of Ohio State’s EcoCAR 3 vehicle. Also
highlighted are the primary functions of each component and the key information being
transmitted between components. In brief, the system contains a number of controllers
which communicate through CAN (Controller Area Network) to send out commands to
their respective components based on driver demand and feedback from the overall state
of the vehicle including individual components (i.e. battery state of charge, vehicle speed,
etc.). Lower level diagrams and interactions are included in the appendix.
Figure 27: High Level Block Diagram of Functional Control System
50
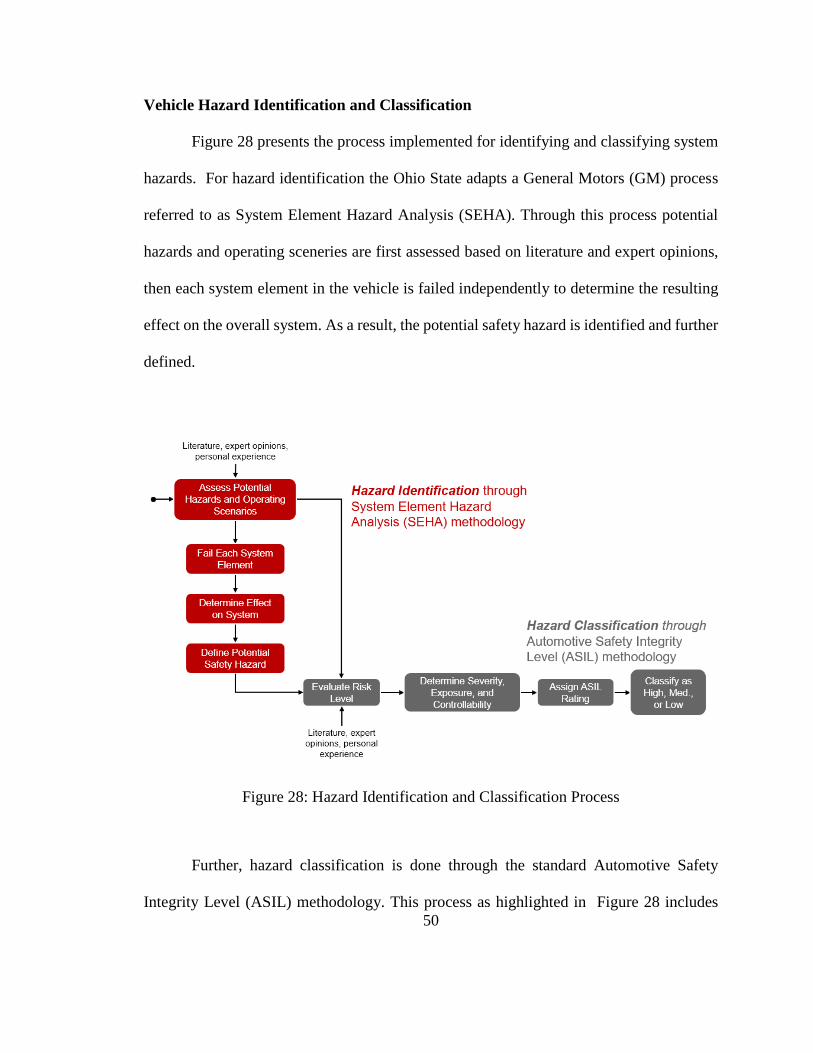
Vehicle Hazard Identification and Classification
Figure 28 presents the process implemented for identifying and classifying system
hazards. For hazard identification the Ohio State adapts a General Motors (GM) process
referred to as System Element Hazard Analysis (SEHA). Through this process potential
hazards and operating sceneries are first assessed based on literature and expert opinions,
then each system element in the vehicle is failed independently to determine the resulting
effect on the overall system. As a result, the potential safety hazard is identified and further
defined.
Figure 28: Hazard Identification and Classification Process
Further, hazard classification is done through the standard Automotive Safety
Integrity Level (ASIL) methodology. This process as highlighted in Figure 28 includes
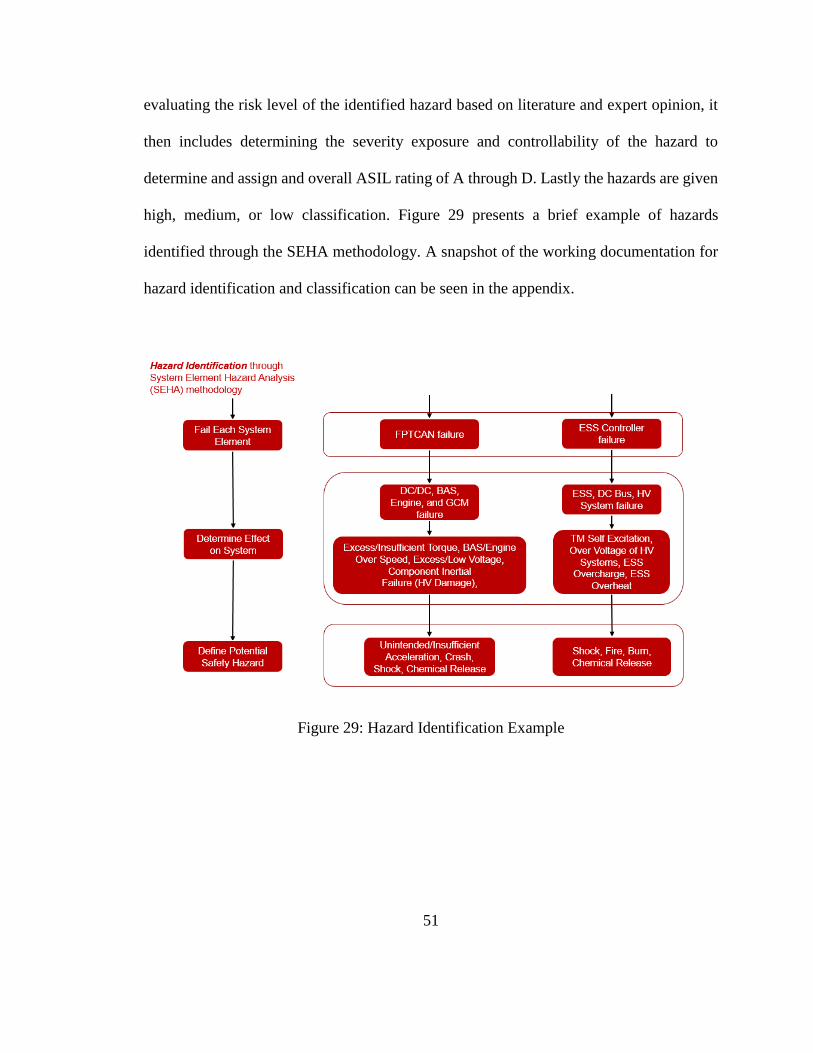
51
evaluating the risk level of the identified hazard based on literature and expert opinion, it
then includes determining the severity exposure and controllability of the hazard to
determine and assign and overall ASIL rating of A through D. Lastly the hazards are given
high, medium, or low classification. Figure 29 presents a brief example of hazards
identified through the SEHA methodology. A snapshot of the working documentation for
hazard identification and classification can be seen in the appendix.
Figure 29: Hazard Identification Example
52
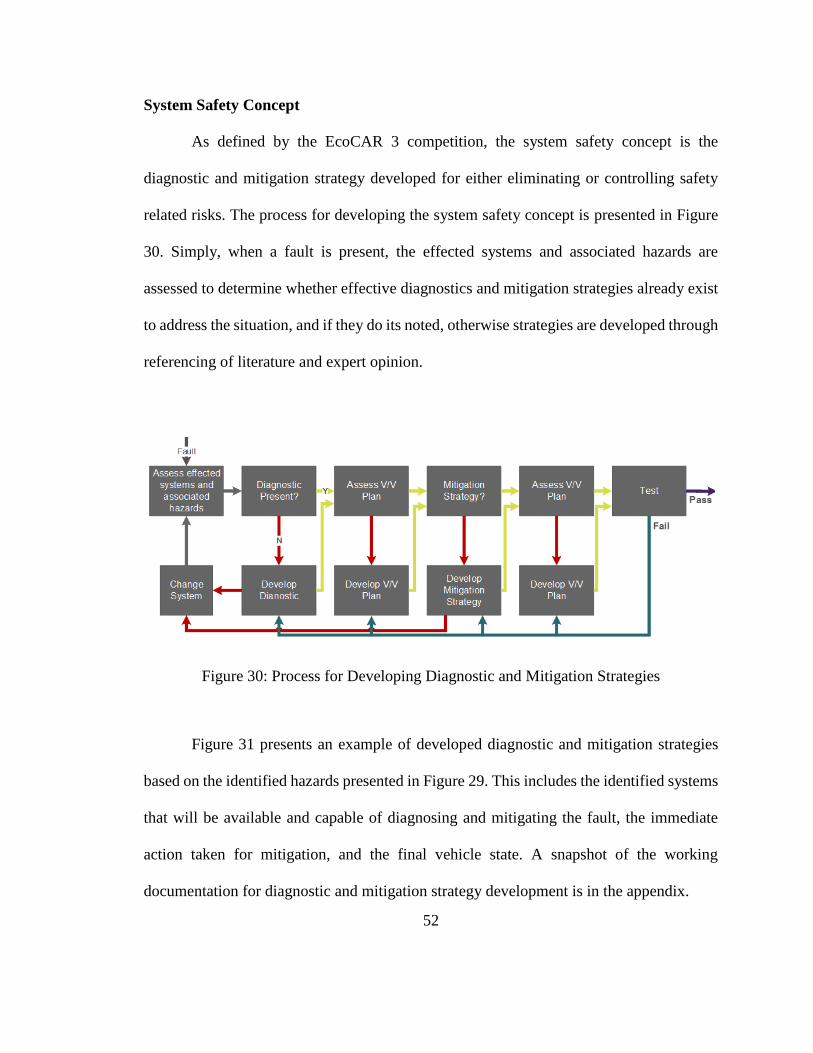
System Safety Concept
As defined by the EcoCAR 3 competition, the system safety concept is the
diagnostic and mitigation strategy developed for either eliminating or controlling safety
related risks. The process for developing the system safety concept is presented in Figure
30. Simply, when a fault is present, the effected systems and associated hazards are
assessed to determine whether effective diagnostics and mitigation strategies already exist
to address the situation, and if they do its noted, otherwise strategies are developed through
referencing of literature and expert opinion.
Figure 30: Process for Developing Diagnostic and Mitigation Strategies
Figure 31 presents an example of developed diagnostic and mitigation strategies
based on the identified hazards presented in Figure 29. This includes the identified systems
that will be available and capable of diagnosing and mitigating the fault, the immediate
action taken for mitigation, and the final vehicle state. A snapshot of the working
documentation for diagnostic and mitigation strategy development is in the appendix.

53
Figure 31: Examples of Developed Diagnostic and Mitigation Strategies
Identification of Additional Safety Systems
As a result of the system safety analysis activities, and number of safety systems
were identified to assist with eliminating and controlling identified safety risk with Ohio
State’s EcoCAR 3 vehicle. These safety systems are summarized in Table 3, and included
the hazard being addressed, the needed safety system and the current status of implemented
the system. The major systems needed are related to software development torque security
risk related to unintended vehicle acceleration.

54
Table 3: Summary of Additional Safety Systems Identified
HAZARD Safety Systems Status
Unintended
Direction
Redundant PRNDL sensors, detection/mitigation
SW
Implemented
Unintended
Acceleration/
Deceleration
Acc. pedal detection/mitigation SW Refine
Torque security detection/mitigation SW Refine
Force park mitigation SW Refine
Driveline/torque coupling device speed sensors Needed
Regen braking detection/mitigation SW Needed
Shock/HV
Exposure
Industry standard conduit/insulating materials Implemented
Ground fault detection/mitigation Implemented
Charging/driving diagnostics/mitigation SW Implemented
Unintended
Thermal Energy
Shields, thermal wrap Implemented
Coolant temperature and flow sensors,
diagnostic/mitigation SW
Needed
Access to Rotating
Components
Shields, i.e. BAS coupling to engine Implemented
Future Activities
As preliminary safety analysis activities for EcoCAR 3 year two are completed,
system safety development is well positioned for EcoCAR 3 year three. As mentioned in
the deployment strategy timeline in Chapter 3, primary system safety analysis deliverables
for year three include DMFEA and FTA, and to support this effort IBM Rational Rhapsody
is aligned to be deployed as part of the suite of supporting tools for MBSE. Thus, future
supporting activities include translating the functional control system diagrams into
rhapsody models for centralized documentation, increased traceability and management.
55
1.3 Requirements Generation and Management
EcoCAR 3 year two requirements generation activities included hazard metrics
translation in which vehicle level hazard metrics are translated to system specific metrics.
Another activity included requirements decomposition and allocation to specific software
and hardware systems/components. Additionally, preliminary V&V plans were generated
and an initial documentation workflow was defined which included integration of IBM
Rational DOORS and Quality Manager for effective management of requirements.
Hazard Metrics Translation
Outlined in Figure 32 is the hazard metrics translation process that is followed by
the Ohio State team. The process includes first defining the vehicle level hazard metrics
from primarily the vehicle level hazard analysis and sources including competition rules,
product data sheets, literature, and expert opinion. Once the vehicle level hazard metric is
defined, systems that contribute or have an effect on the hazard metric are identified.
Lastly, the systems are analyzed through testing, basic calculation, or simulations to
translate the vehicle level hazard metric to a system specific engineering requirements.

56
Figure 32: Hazard Metrics Translation Process
Figure 33 illustrates a hazard metric translation example based on basic calculations
with key vehicle parameters. The excel sheet translation snapshot shows the working
documentation of how vehicle level hazard metrics are translated into system specific
engineering requirements. This example highlights an unintended acceleration metric that
cannot be violated, and shows the translated metrics specific to torque producing
components that must not be violated in order to abide by the vehicle level metric. Also
noted is the EcoSIM Vehicle Simulator, which in this context supports the efforts of hazard
metric translation by enabling scenarios to be simulated for capturing predicted system
specific behavior. Thus, based on vehicle level outputs/metrics, system specific
outputs/metrics can be captured.

57
Figure 33: Hazard Metrics Translation Example
Requirements Decomposition and Allocation
Outlined in Figure 34 is the process for defining safety requirements, thus
decomposing and allocating system level safety requirements to specific hardware (HW)
and software (SW). This process begins with a system level safety requirement (derived
from sources including the system safety strategy, hazard metric translation activities, etc.),
then HW and SW that contribute to meeting that requirement are identified, and lastly the
requirement is decomposed and allocated to the contributed HW and SW resulting in
HW/SW specific engineering requirements. Figure 35 illustrates an example of the
decomposition and allocation of a system level requirement into specific SW and HW
components.

58
Figure 34: Process for Defining Safety Requirements
Figure 35: Example for defining safety requirements
59
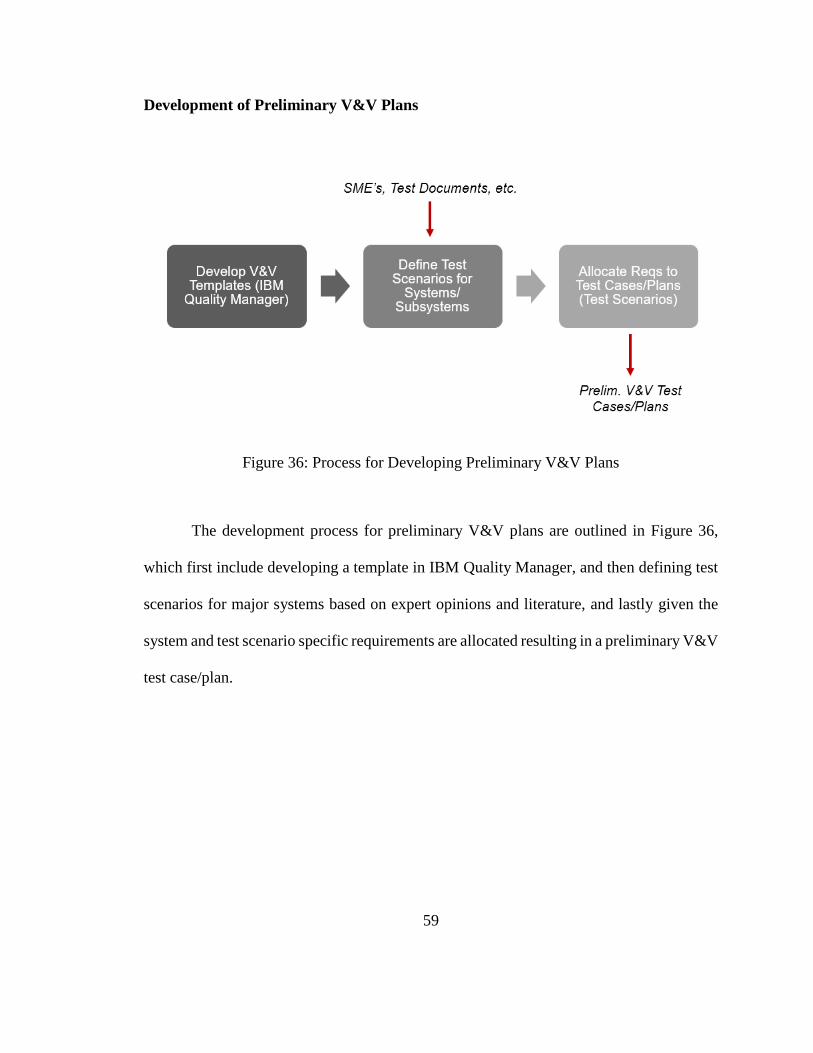
Development of Preliminary V&V Plans
Figure 36: Process for Developing Preliminary V&V Plans
The development process for preliminary V&V plans are outlined in Figure 36,
which first include developing a template in IBM Quality Manager, and then defining test
scenarios for major systems based on expert opinions and literature, and lastly given the
system and test scenario specific requirements are allocated resulting in a preliminary V&V
test case/plan.

60
Figure 37: Highlight of IBM Quality Manager for V&V Plans
Figure 37 highlights a snapshot of a preliminary V&V plan developed in IBM
Quality Manager. It highlights to the structure of the plan on the left of the diagram, and
on the right of the diagram is shows that the plan was derived from a template. In the center
of the diagram gives a brief description of the test case and highlights all the requirements
that are linked from IBM DOORS.

61
Documentation Workflow
Figure 38: Initial Documentation Workflow
Based on EcoCAR 3 year two deliverables and all the system safety activities
discussed in this chapter, Figure 38 highlights the initial documentation work flow for
management as part of the MSBE approach. This includes populating all the excel docs
from initial analysis activities into IBM DOORS for traceability to the derived
requirements. For further traceability as it relates to requirements coverage and fulfillment,
requirements for IBM DOORS are linked to preliminary V&V test cases/plans in IBM
Quality Manager. Optionally, a traceability matrix in excel formatting is exported. Figure
39 presents snapshots of traceability using IBM DOORS. The top images show a default
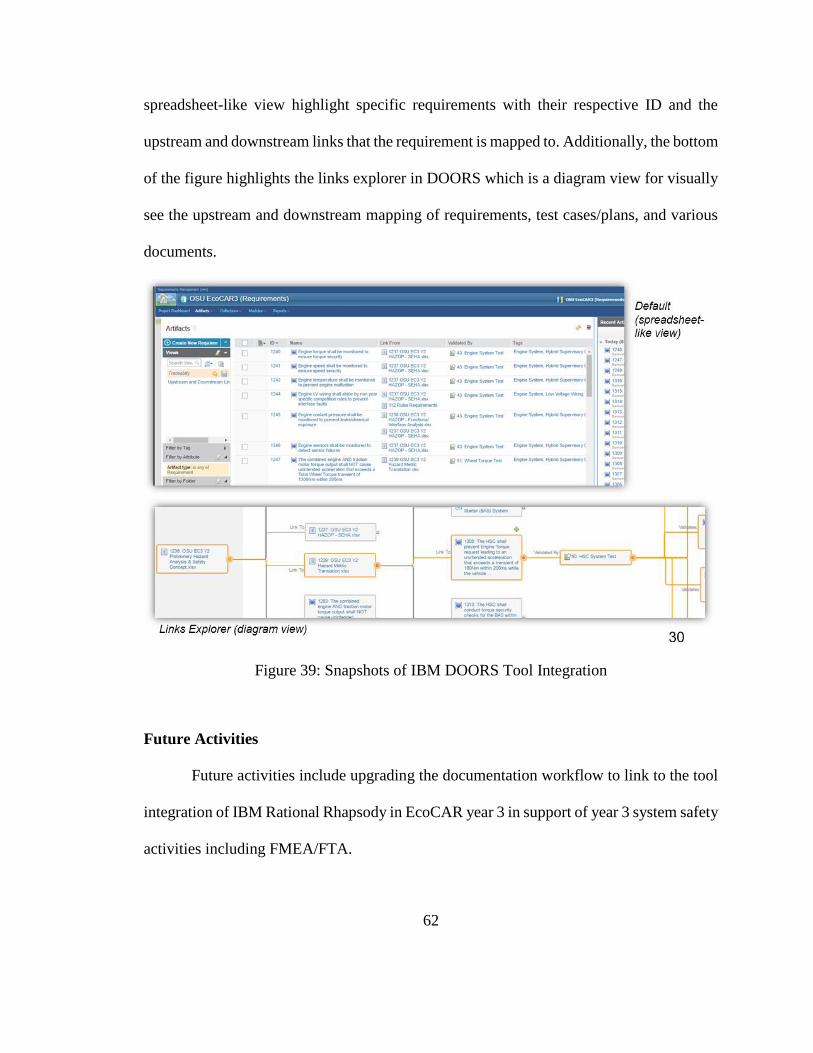
62
spreadsheet-like view highlight specific requirements with their respective ID and the
upstream and downstream links that the requirement is mapped to. Additionally, the bottom
of the figure highlights the links explorer in DOORS which is a diagram view for visually
see the upstream and downstream mapping of requirements, test cases/plans, and various
documents.
Figure 39: Snapshots of IBM DOORS Tool Integration
Future Activities
Future activities include upgrading the documentation workflow to link to the tool
integration of IBM Rational Rhapsody in EcoCAR year 3 in support of year 3 system safety
activities including FMEA/FTA.

63
Chapter 5: System Safety Design and Implementation
1.1 Introduction
As Chapter 4 focused primarily on system safety analysis for the development of
requirements, Chapter 5 transitions into software development for fulfilling the generated
system safety requirements. As highlighted previously, the OSU team is using MBD for
software/controls development as it aligns with the MBSE approach. In particular, Figure
40 illustrates the controls software development process followed by OSU.
Figure 40: OSU Controls Software Development Process

64
The controls software development process is broken down into two major
activities including software design, and implementation and testing which will be model-
centric and developed using MathWorks tools. This chapter will focus on these two
activities as they align with the year-two goals of EcoCAR and the MBSE approach.
1.2 Software Design
As a re-cap, at the time of this work the OSU team is transitioning into year-three
of the competition, in which the main focus will be system safety design and
implementation. This section focuses on the initial work completed for system safety
software design as it aligns with year-two competition goals, including the high-level
software design and specific system safety software functions related to torque security.
High-Level Design
The OSU team is implementing a three-stage functional safety software design to
meet robust system safety goals. The design is illustrated in Figure 41 and includes fault
detection and diagnostic, fault management, and fault mitigation. Stage 1 is responsible for
detecting and diagnosing faults for all team developed software and hardware, while Stage
2 manages all potential faults in the system including faults from procured subsystems with
pre-existing fault detection and diagnostic. Lastly, Stage 3 deploys fault mitigation
strategies based on the combination of faults detected in the system.

65
Fault Detection & Diagnostic
Fault Management Fault MitigationTo SW/HWFrom SW/HW
STAGE 1 STAGE 2 STAGE 3
To Dash/OBD
Figure 41: High-level Functional Safety Software Design
Given OSU’s functional safety design, testing activities need to ensure that all three
stages of the functional safety algorithm are verified and validated in each development
environment (MIL/HIL/VIL). To support this effort, model development is focused on two
key areas including model fidelity and accuracy. For instance, model fidelity will be
increased to ensure that models have sufficient I/O to meet testing needs, while model
accuracy will be increased to ensure accurate responses to fault insertion in areas such as
the accelerator pedal potentiometer.
Torque Security
Within stage 1 of the functional safety software design is vehicle torque security,
which ensures the integrity of driver requested torque. In particular, specific software
functions include the following:
DIRECTIONAL torque flow and ZERO torque flow based on PRNDL position.

66
- When the PRNDL enters drive or reverse, the algorithm verifies and updates
the appropriate rotational DIRECTION for the Traction Motor, and the
appropriate gear for the transmission.
- When the PRNDL enters park or neutral, the algorithm ensures ZERO
torque flow by saturating driver torque request to ZERO.
Position sensors for PRNDL, accelerator and brake pedals.
- TWO string potentiometers in each device transmits a unique voltage range.
- Verifies that sensors are in the appropriate voltage range
- Verifies that sensor ratios/offsets always agree with one another to
diagnosis if sensors are faulty
Additionally, the OSU team is implementing a robust torque monitoring function to ensure
that each torque producing component is effectively delivering the requested torque. This
monitoring function for torque security is illustrated in Figure 42, and highlights the high-
level process for evaluating whether or not torque production for each component is faulty.
Torque FeedbackTorque Producers (i.e. BAS, Engine, TM)
ComparisonTorque Request
Torque Request
Theoretical Torque Estimation
Sensor Inputs
Fault
Continuous Torque Monitoring
Figure 42: Torque Security Monitoring Process
67
Overall, this process is a two prong approach which utilizes an allowable torque
range, as well as a torque estimation based off of other sensor inputs. The torque security
monitoring function first begins when torque is produced by subsystems in the powertrain.
First, an allowable torque range is generated from the current torque commanded. This
allowable torque range is then compared to the feedback torque received by the torque
producing component, creating the first torque check in the system. At the same the
feedback torque is being checked, an additional sensor is utilized to estimate torque
generation. Utilizing a different sensor to provide a check creates a more robust system
through redundancies that ensures against faulty readings from any one signal. If any of
the torque checks fail, the torque producing components of the vehicle will immediately
halt torque production. Table 4 details the torque estimation methods for the torque
transmitting devices in the vehicle.

68
Table 4: Torque Estimation Methods for Transmitting Devices
Torque Transmitting
Devices
Estimator Options
Engine OSU derived estimator based on air per cylinder,
RPM, and coolant temperature
Belted Starter
Alternator
(8 estimates possible)
Torque prediction based on phase currents A, B,
and C (3 estimates) and speed (BAS and engine)
Torque prediction based on DC current and speed
(BAS and engine)
Traction Motor
(12 estimates possible)
Torque prediction based on phase currents A, B,
and C (3 estimates) and speed (BAS, Transmission
output, and rear wheel speeds)
Torque prediction based on DC current and speed
(BAS, Transmission output, and rear wheel speeds)
Total Wheel Torque Estimate of wheel torque based on measured grade,
velocity, and estimated vehicle mass*
*Vehicle mass requires a state estimator to be designed; it
will utilize the baseline mass of the vehicle and estimate
cargo capacity based on nominal reported torque.
Torque Coupling
Devices
For each torque coupling device, our system includes speed
sensors that allow assessing the status of the coupler (i.e.
gear ratio, slip ratio, or broken shaft.)
For example, as part of the torque-monitoring function, Figure 43 illustrates a
torque comparison for the engine. The upper and lower torque limits illustrate the 10%
torque tolerance determined from the requested torque signal, while estimated torque
illustrates the predicted torque of the engine based on the method detailed in Table 4, and
feedback torque simply illustrates the reported torque from the engine ECU. Both torques,
feedback and estimated, lie within the requested torque tolerance; thus no faults are
triggered for the given time interval.

69
Figure 43: Comparison of Feedback Torque, Estimated Torque, and Allowable Range
Alignment with MBSE Approach
These software designs are being developed using MBD, thus there is direct
alignment with MBSE as MBD is a model-centric approach for software design.
Additionally, for requirements traceability, Rational DOORS integrates with MathWorks
tools for tracing requirements to specific model/SW components. Figure 44 illustrates an
example snapshot of this capability.

70
Figure 44: DOORS Integration for Requirements Traceability
Future Activities
Given system safety analysis activities presented in Chapter 4, future software
design activities for system safety as it relates to torque security, includes diagnostic and
mitigation software for regenerative braking.
1.3 Implementation and Testing
Following from the previous section of software design for system safety as it to
torque security, this section focuses on the high-level development strategy for system
safety software implementation and testing, and highlights results from initial xIL (MIL,
HIL, VIL) development for torque security.

71
High-Level Development Strategy
As part of the MBSE approach that OSU is implementing, implementation and
testing for verification and validation (V&V) of software fits within the latter phase of the
MBSE framework. Figure 45 illustrates the V-Process with an emphasis on V&V, while
highlighting the structure and tools implemented for managing this development process.
Figure 45: V-Process with Verification and Validation Emphasis
The development process in Figure 45 highlights the generation of requirements,
which are covered by the test plan/case generation, followed by the execution of test
plans/cases to validate the system design (i.e. supervisory control algorithm) against the
generated requirements. Lastly, there is traceability of reported results from test plan/case
execution for requirements and/or system design refinement.

72
In addition, the team structure for this process isolates requirement/test developers,
system developers, and testers. This enables a more robust validation because of separation
of duties between these roles. The key tools implemented throughout this process are IBM
Rational DOORS for requirements management, and IBM Rational Quality Manager for
test plan/case generation, execution, and reporting. OSU leverages these two tools together
for a seamless synergy between requirements traceability, test plan/case coverage, and
reporting.
More specifically as it relates to software development, the OSU team follows an
xIL process as part of MBD V&V. Figure 46 details each testing phase of the process
including model in the loop (MIL), hardware in the loop (HIL), and vehicle in the loop
(VIL). These three phases essentially go from desktop to vehicle testing platforms in which
the software code is verified and validated to ensure it fulfills requirements.

73
Figure 46: Controls Software Development Process
Development of Torque Security
A few examples will now be presented that illustrates results from the development
of torque security as part of EcoCAR year-two. Firstly, to illustrate how the OSU team
ensures the directional torque security for the traction motor, Figure 47 is presented along
with the following requirements that are being met for the given scenario:
REQID 1105: The HSC shall disable EM inverter, change Rotation Direction
Parameter to 1 and re-enable EM inverter when the PRND goes into Reverse
REQID 1106: The HSC shall disable EM inverter, change Rotation Direction
Parameter to 0 and re-enable EM inverter when the PRND goes from Reverse to
Drive.
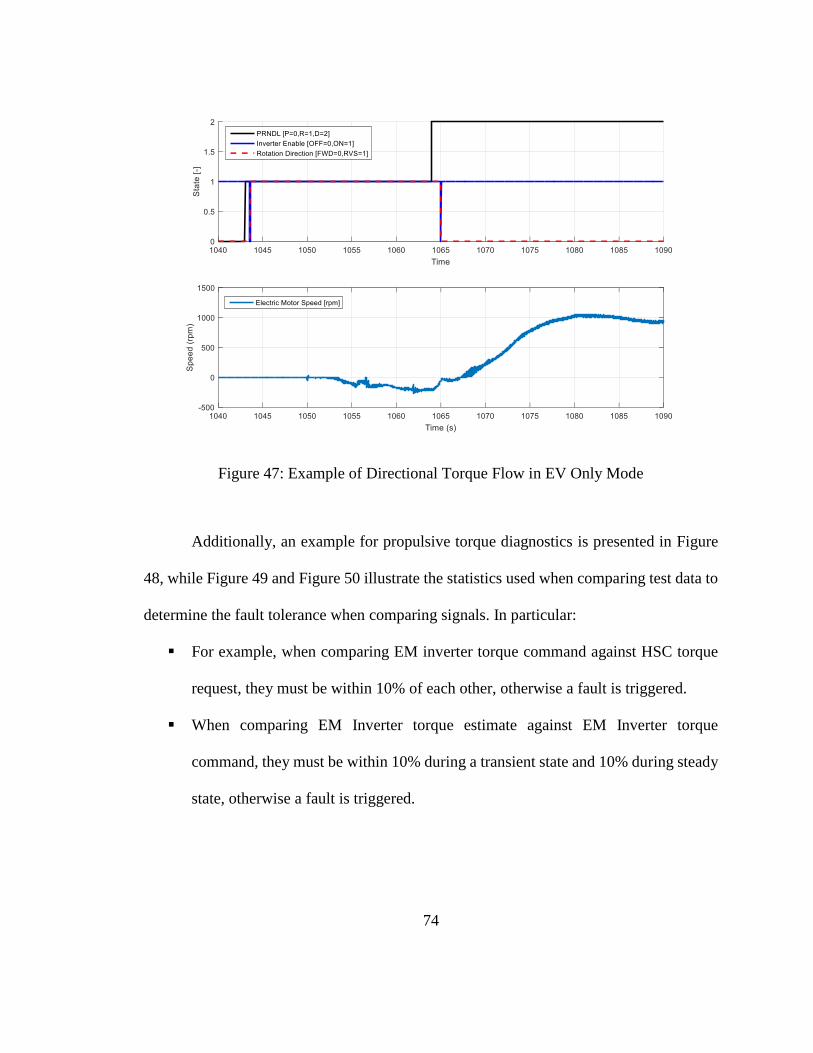
74
Figure 47: Example of Directional Torque Flow in EV Only Mode
Additionally, an example for propulsive torque diagnostics is presented in Figure
48, while Figure 49 and Figure 50 illustrate the statistics used when comparing test data to
determine the fault tolerance when comparing signals. In particular:
For example, when comparing EM inverter torque command against HSC torque
request, they must be within 10% of each other, otherwise a fault is triggered.
When comparing EM Inverter torque estimate against EM Inverter torque
command, they must be within 10% during a transient state and 10% during steady
state, otherwise a fault is triggered.

75
Figure 48: Example of EM Torque Signals
Figure 49: Statistics for Requested Torque versus Commanded Torque
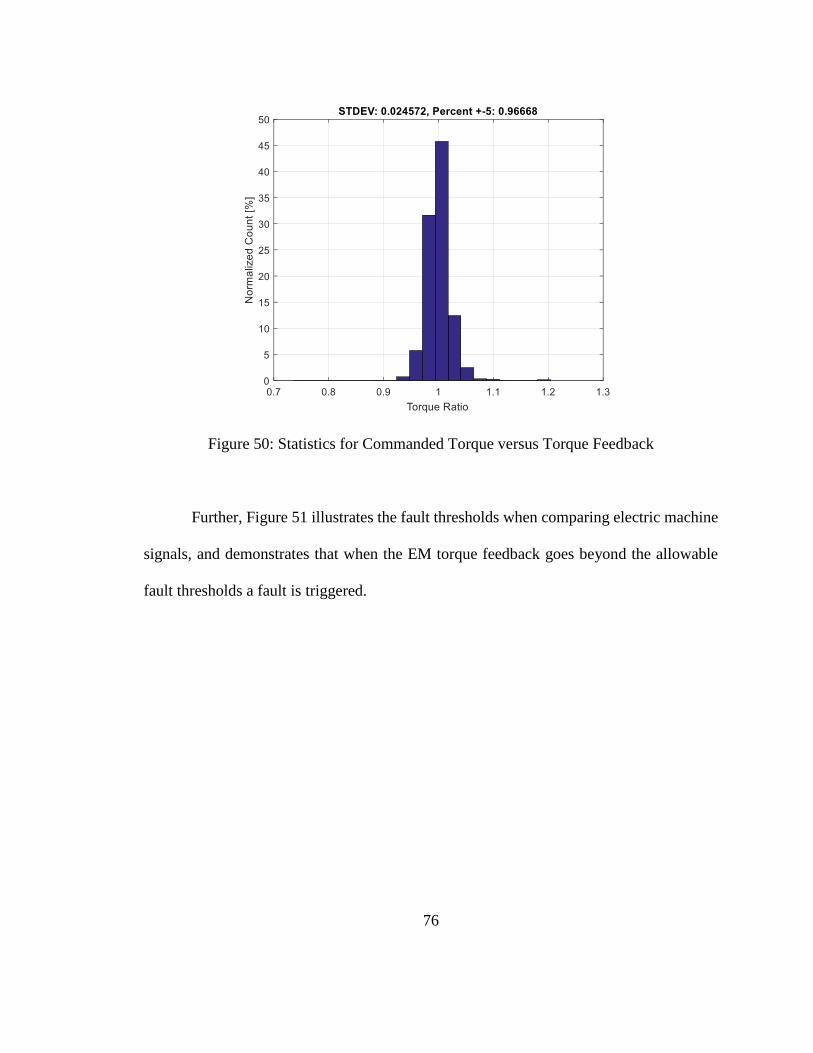
76
Figure 50: Statistics for Commanded Torque versus Torque Feedback
Further, Figure 51 illustrates the fault thresholds when comparing electric machine
signals, and demonstrates that when the EM torque feedback goes beyond the allowable
fault thresholds a fault is triggered.

77
Figure 51: Example Testing for Fault Insertion
Once faults are detected, OSU mitigates faults by following a tiered fault mitigation
strategy that is presented in Figure 52. In particular:
Vehicle fault mode is determined based on severity of fault
Limp home modes allow for safe vehicle operation under certain conditions to
allow driver to get vehicle to a safe location
Limp home modes include: Limited EV, Engine Only, Series
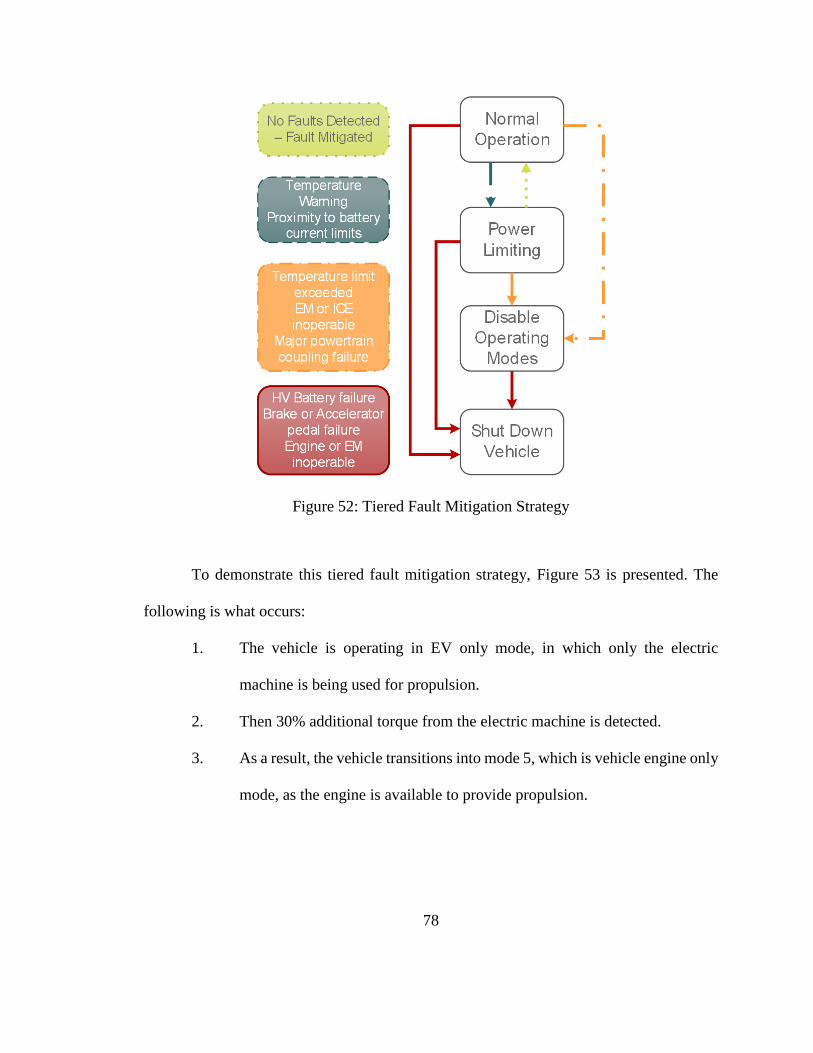
78
Figure 52: Tiered Fault Mitigation Strategy
To demonstrate this tiered fault mitigation strategy, Figure 53 is presented. The
following is what occurs:
1. The vehicle is operating in EV only mode, in which only the electric
machine is being used for propulsion.
2. Then 30% additional torque from the electric machine is detected.
3. As a result, the vehicle transitions into mode 5, which is vehicle engine only
mode, as the engine is available to provide propulsion.

79
Figure 53: Example of Tiered Fault Mitigation Strategy
Alignment with MBSE Approach
The results from the testing activities presented in this section is supported by
Rational Quality Manager, for test case and test plan management to ensure that the
requirements developed for each scenario were fulfilled.
80
Chapter 6: Accomplishments and Future Work
1.1 Accomplishments
As EcoCAR 3 transitions into year-three, this work has already contributed to over
a dozen awards by increasing overall documentation, traceability and workflow
management as part of the overall engineering development process. In particular, this
work contributed to the following year-two EcoCAR 3 awards:
2nd Place MathWorks
1st Place dSPACE
1st Place WW HIL Review
1st Place Y2 HIL Review
1st Place Controls
1st Place Functional Safety
1.2 Future Work
A future activities section can be found in previous chapters that align with the
information presented. Overall, the next major step as part of the deployed MSBE approach
will be to implement Rational Rhapsody in order to support safety analysis activities a part
of EcoCAR 3 year-three activities.

81
Bibliography
[1] “Continuous Engineering for Dummies.” [Online]. Available:
http://www.scmsolution.com/wp-content/uploads/2016/01/continuous-engineering-
for-dummies-ibm-limited-edition.pdf. [Accessed: 07-Jun-2016].
[2] T. Lovric, M. Schneider-Scheyer, and S. Sarkic, “SysML as Backbone for
Engineering and Safety - Practical Experience with TRW Braking ECU,” 2014.
[3] “MBSE Roadmap,” INCOSE MBSE IW, 2012.
[4] C. Perdikoulias and D. Akers, “A Systems Engineering Approach to Requirements
Elicitation and Management,” SAE Int. J. Passeng. Cars - Mech. Syst., vol. 5, no. 4,
pp. 1285–1293, Sep. 2012.
[5] G. Beier, A. Figge, R. Müller, U. Rothenburg, and R. Stark, “Supporting Product
Development through Cross-Discipline Dependency-Modeling–Novel Approaches
for Traceability-Usage,” Lect. Notes Inf. Theory Vol, vol. 1, no. 1, 2013.
[6] M. Born, O. Kath, E. Holz, and B. Douglass, “Safety Analysis and Design for ISO
26262 - Model Based and Tool Supported,” 2013.
[7] J. A. Estefan and others, “Survey of model-based systems engineering (MBSE)
methodologies,” Incose MBSE Focus Group, vol. 25, no. 8, 2007.
[8] “IBM Model-Based Systems Engineering with Rational Rhapsody and Rational
Harmony for Systems Engineering -- Deskbook 3.1.2 - United States,” 15-Feb-2016.
[Online]. Available: http://www-
01.ibm.com/support/docview.wss?uid=swg27023356. [Accessed: 09-Jun-2016].
[9] “http://www.sedcconference.org/wp-content/uploads/2013/09/Commercial-The-
Rational-Solution-for-Systems-and-Software-Engineering-Greg-Gorman.pdf -
Google Search.” [Online]. Available:
https://www.google.com/?gws_rd=ssl#q=http:%2F%2Fwww.sedcconference.org%2
Fwp-content%2Fuploads%2F2013%2F09%2FCommercial-The-Rational-Solution-
for-Systems-and-Software-Engineering-Greg-Gorman.pdf. [Accessed: 09-Jun-
2016].
[10] BruceDouglass, “Safety Analysis with the UML - Bruce Douglass Blog,”
19:47:19.08. [Online]. Available:
https://www.ibm.com/developerworks/community/blogs/BruceDouglass/entry/safet
y_analysis_with_the_uml8?lang=en. [Accessed: 09-Jun-2016].
[11] H. Martin, M. Krammer, B. Winkler, and C. Schwarzl, “Model-based Engineering
Workflow for Automotive Safety Concepts,” 2015.
82
[12] M. Lu, “Systems Engineering - Directions and Challenges,” 2014.
[13] S. Christiaens, J. Ogrzewalla, and S. Pischinger, “Functional Safety for Hybrid and
Electric Vehicles,” 2012.
[14] J. Zhang and G. Rizzoni, “Functional Safety of Electrified Vehicles Through Model-
Based Fault Diagnosis,” IFAC-Pap., vol. 48, no. 15, pp. 454–461, 2015.
[15] C. Moure and K. Kersting, “Development and Comparison of Monitoring Functions
for Electric Vehicles,” 2013.
[16] R. Isermann, “Model-based fault-detection and diagnosis–status and applications,”
Annu. Rev. Control, vol. 29, no. 1, pp. 71–85, 2005.

83
Appendix
1.1 Safety Analysis: Diagrams and Snapshots of Working Documentation
Figure 54: CAN Interactions

84
Figure 55: Electrical Interactions
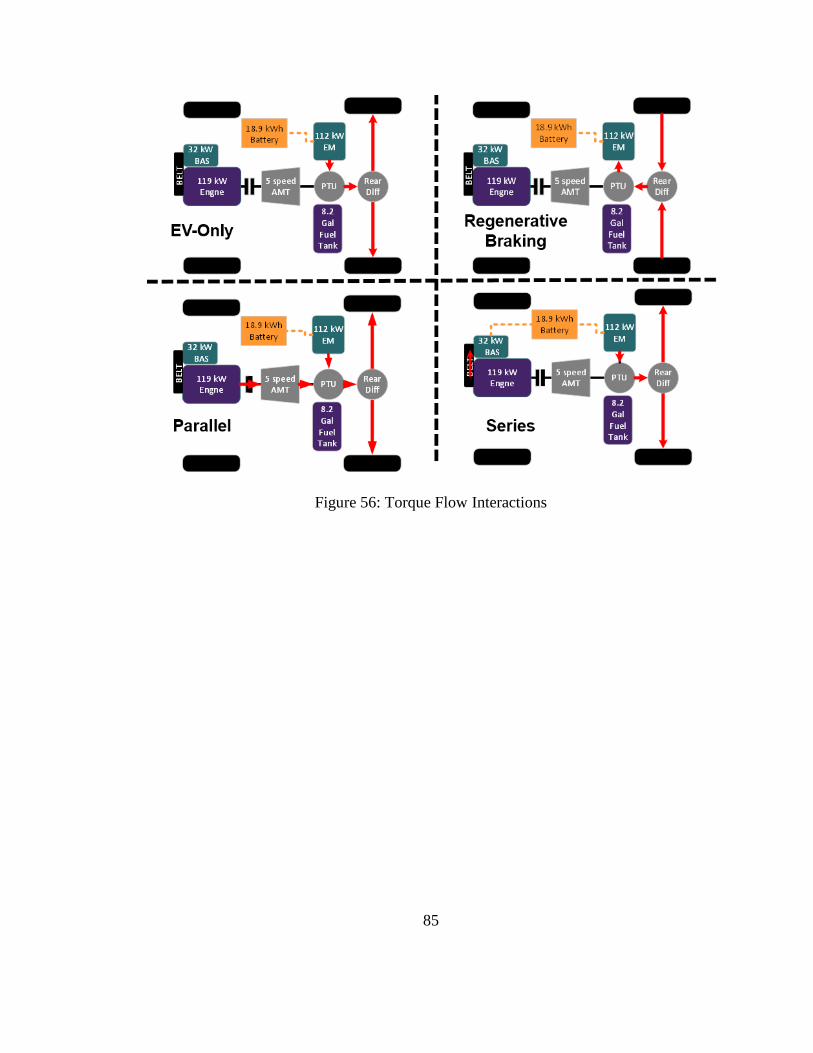
85
Figure 56: Torque Flow Interactions

86
Figure 57: Snapshot of Working Documentation for Preliminary Hazard Analysis

87
Figure 58: Snapshot of Working Documentation for Safety Concept