Global Earth Observation System of Systems - ESA Earth Online
Model problems of optical tomography for remote sensing of the atmosphere and the near Earth space
Oleg Martynov, Victor Alpatov and Yury RomanovskyFedorov Institute of Applied Geophysics, Moscow, Russia 129128
Alexei Lichachev and Valery PickalovInstitute of Theoretical and Applied Mechanics, Novosibirsk, Russia, 630090
ABSTRACT
To analyze the optical tomography reconstruction (0Th) methods applications for reconstruction of meso- and large-scale irregularities of minor gas and aerosol components in the atmosphere and near Earth space (NES) the principal modelproblems of 0Th are considered. The results of computer simulation to reconstruct the model irregular structure in NES arepresented and discussed.
1. INTRODUCTION
The remote sensing methods are widely used for a satellite investigations and monitoring of the atmosphere and NES'.Optical techniques and instruments used in a satellite remote observations provide data on regular iD-distribution of theatmosphere parameters and 2D-images of the atmosphere and NES. It's of importance the complete atmosphere and NESmodels to be developed the experimental data on 3D-distribution ofthe parameters would be known. The same affirmation istruthful for researches of meso- and large-scale irregularities generating in the atmosphere and NES by the natural processesand antropogenic impacts. These irregularities are as follows: the ozone "holes" and aerosol structures in the stratosphere,the noctilicent cloud and hydroxyl emission "patches" in the mesosphere, auroral structures and the plasma irregularities inthe ionosphere, the neutral gas clouds and the "ionosphere holes" caused by the rocket launchings.
OTR methods which are usually applied in physical plasma -gas experiments2 can be considered for analyzing the3D-structures of the atmosphere and NES. The OTR methods application for 3D-reconstruction of the artificialformation(AC) and auroral structures were firstly successfully attempted in 36 The analysis of 0Th methods applicationfor NES researches was carried out in ". This paper following concerns with the principal problems of simulation of0Th oflarge-scale natural irregularities optically appeared as also as with the computer simulation of OTR of the model oflarge-scale irregularities.
2. FOUNDATION OF OTR METHODS FOR RECONSTRUCTION OF OBJECTSIN THE ATMOSPHERE AND NES
2. 1. Mathematical foundations.
Problems of OTR belong to the integral geometry class and can beformulated with equations well known 2 Let g(x) bea function in n-dimensional space (X€R") and let M(y) be a family of k-dimensional manifolds in R", where k<n. If thefunction f(y) is defined as an integral:
1(i) = $W(x,y)g(x)da, (1)M(y)
where W(x,y) is a weighting function in (n+k)-dimensional space and da is an element of measure on M), then problem ofintegral geometry is to study the interrelationships of the properties of the functions g and J the weights W, and themanifolds M. if the problem is formulated in application to an experimental situation, when the local characteristics of anobject (described by the function g(x)) must be determined from the integral relation (1), then one arrives at the problem ofreconstructive tomography. The problem (1) reduces to inverse problem of the first kind. To solve it the principle ofregularization is usually realized7.
154 ISPIE Vol. 2582 O-8194-1946-X/95/$6.QQ

In order to assess the possibilities of tomography methods for diagnostics of investigation objects (JO) in theatmosphere and NES, it is necessary to analyze the propagation of the sounding radiation in the medium, determine theequations relating the measured parameters within the JO and the radiation characteristics, find appropriate methods forinversion of the projections, and analyze the optimal schemes for observations of JO. Such an analysis was performed in3'4for artificial clouds and showed that the relation between the experimentally recorded optical emission of an AC and thespatial distribution of any parameter, such as the concentration of molecules and ions, can be described quite accurately bythe radiation transfer equation8. This equation assumes different forms, depending on the specific conditions, for example,the scheme used for performing the measurements. In this connection, different tomographic schemes for acquiring data onJo, including different modifications of the transmission and emission sounding schemes as like as optical tomography ofscattering media, were examined in3'4. The advantages and disadvantages of each scheme and the effectiveness of themethod used must to be determined. The possibilities and advantages of schemes are largely determined by parameters suchas the optical thickness of the 10 and the energy of the radiation emitted by the JO and reaching the detector.
2.2. Information analysis.
In order to assess the OTR of JO the information analysis need to be carried out. The analysis includes the calculationsof the required number of projections and the amount of data needed in each projection. It's must be analyzed as thereconstruction accuracy is affected by noise of measurements, exposure time, structural features of the object being observed,possibility of using a priory data, and the spatial, temporal, and spectral resolutions ofthe projection records and their energyand spectral sensitivities.
In the general case, exact reconstruction of tomograms of arbitrary objects is possible from an infinite number ofprojections. If, however, the class of experimental objects is limited by definite conditions, then the tomograms of suchobjects can be reconstructed using a finite number of projections 9,1O• jis of practical interest to estimate the constraints of10 as one class of formalized objects taking into account the requirements of existing methods of tomography and realexperimental conditions, characterized by the fact that usually only small number of projections can be obtained. Theexample of procedure to determine the optical number ofprojection for OTR ofan object in NES is presented in 35.
To compensate the inadequacy of projection data on 10 it is possible to use a priori information about JO. Methods ofusing such information have been developed, but the specific nature of each problem requires additional modification ordevelopment of new methods. Additional information on 10 can essentially reduces the number of projections. In this case itis of particularly interest is a few angles tomography (from 10 to several tens of angles) and ultra few angles tomography(only 3-5 projections)3' 6
As different projections provide inadequacy information about the JO it is necessaiy to use special parameters todetermine information content of each projection. This parameter called as the informativity criterion (0-criterion) is able tobe calculated using special techniques3' 5. The Q-criterion may be used for definition of the index of angular nonuniformity'YQmax1Qmin' which is useful for comparison ofinformation content ofdifferent projections.
2.3. The mathematical algorithms
In numerical simulations OTR procedures is essentially dependent on the algorithms developed and used for specialcases of analysis. In multiangles tomography Kormak's well-known algorithms is preferable. For a few angles and ultra fewangles tomography a veiy promising class of algorithms of the type ART and Gershberg-Populis2' 3. This algorithms makemaximum use of a priory information about the object in both the spatial and frequency domains. In some simulations themaximum entropy algorithm provides best results than other ones 3.
2.4. The complete reconstruction effectiveness
Reconstruction effectiveness is determined by complex factors and parameters, such as: a number of projections, theinformation content of projections, quality of initial images, signal to noise ratio for projections, effectiveness of algorithmsand other. All problems used to be analyzed specially for each OTR realization to determine in quantitative manner the
SPIE Vol. 2582 / 155

accuracy of an object reconstruction in special computer simulation with using the model of object considered. This approachwas demonstrated in OTR ofartfficial clouds in NES and aurora structures in ALIS project5.
3. THE COMPUTER SIMULATION OF OTR OF OBJECT IN NES
To demonstrate OTR effectiveness of natural objects in the atmosphere and NES the example of reconstruction of wellknown large-scale irregular ionospheric structure called as the ionospheric "bubble" is below considered.
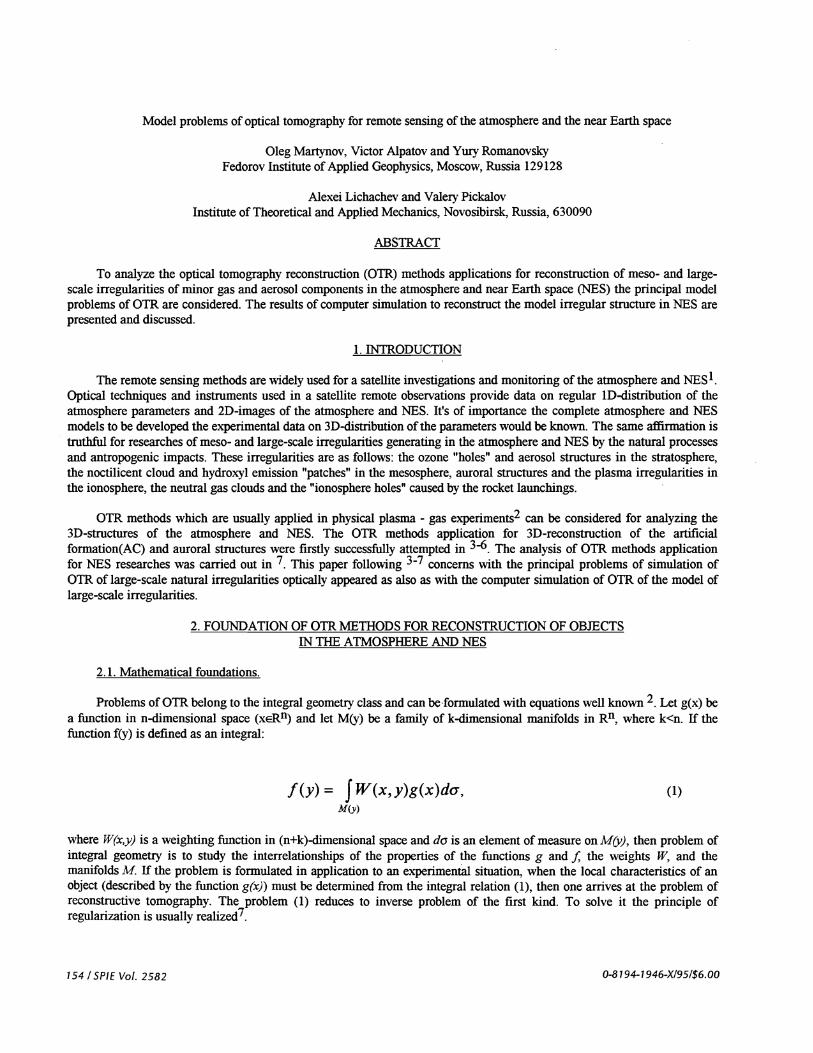
A 'bubble" is 3D region in the equatorial ionosphere which is characterized by significant depletion of plasma bycomparing the ambient ionosphere. This structure has a "mushroom" structure with a "hat" aligned the geomagnetic field atdistances about 1000 km and a "foot" with length about some hundreds kilometers. Some similar "bubbles" usually aresimultaneously observed (Fig. 1). A "bubble" has a decreased intensity of emission of atomic oxygen red line and can beobserved by remote sensing methods using a satellite imager with red filter' ' 12
The scheme of a simulation is shown in Fig. 1. Three model "bubbles" are inserted within the "tomographic box" (TB)which is sampled into 64x64x64 voxels. The satellite equipped with an imager is placed above the TB and observes the"bubbles" structure. The satellite orbit crossing the axis Z is inclined to X at angles p = 0, 45 and 9Ø0• Along eachtrajectory 56 points were fixed to calculate cone projections at different 0-angles. The imager axis was supposed to beoriented at the center of the Earth. To determine the more and less informative projections along the satellite orbit the mapof informativity criterion, Q, calculated for q—0 coordinates is shown in Fig.2. One can see that the most informativeprojections would be given at q 45-50° and 9 = 1-2°. The model "bubble" cross-sections in the X-Z plane of TB arepresented in Fig. 3. OTR images of Hbubbles were calculated for following situations:
- 8 projections with maximal Q (Fig. 4)- 8 projections closed to projections with maximal Qbut with increased interval between points of observation (Fig. 5)- 16projections distributed with equal interval between 56 points (Fig. 6)
2) q = 45°- 8 projections with maximal Q (9 = -2.2° ÷ 3.00) (Fig. 7)
2) p = 900- 8projections with maximal Q (Fig. 8)
In all cases OTR was realized using the same number of iterations. The ART algorithm was used for reconstruction. Intables 1-5 the coordinates of points for which images were calculated are presented. The X, Y, Z -coordinates in TB arecoupled with linear distances and dimensions. So the altitude ofcircular satellite orbit is about 500 km.
The comparison of the model cross-sections presented in Fig. 3 and reconstructed ones (Fig. 4-8) gives the followingevidences:
- the images with maximal Q reconstruct the model better then other ones;- increaseofthe number ofprojections (16 instead of8) don't enhance essentially the reconstruction features;- the reconstruction for p =450 is more accurate than for 900;- in some cases (Fig. 4) the artifacts provided by ART algorithm are observed.
The object reconstruction accuracy determined as in3 was found to be equal 32-37%.
4. CONCLUSION
The OTR method developed and used for simulated reconstruction of the large-scale ionospheric irregularity in NES isable to be used for OTR of other structures in the atmosphere and NES mentioned in the introduction. The numerical
156 ISPIE Vol. 2582

simulation gives evidences for optimizing of the remote sensing investigations and monitoring of the atmosphere and NESoptically appeared irregular structures in special experiments.
5. ACKNOWLEDGEMENTS
The authors thanks A.Tsema for help in the manuscript preparation. This investigation was supported by the RussianFoundation of Fundamental Research, grant N 93-05-14137 and partly by the International Science Foundation, grantNQ RC 1000.
6. REFERENCES
1. M.S.Malkevitch. "Satellite optical investigations ofthe atmosphere". Nauka, Moscow, 1973 (in Russian).2. V.V.Pikalov and N.G.Preobrazensky. "Computational tomography and physical experiment". Usp.Fiz.Nauk,
Vol.141, N2 3, p. 469, 1983 (in Russian).3. V.V.Alpatov, G.G.Levin, V.V.Pikalov and Yu.A.Romanovsky. "Optical tomography of artificial formation in
circumterrestrial space", Cosmic research, Vol. 31, N2 1, pp. 97-107, 1993.4. V.V.Alpatov, F.V.Bulygin, G.G.Levin et al. "Possibility of studying artificial ionospheric formations of by methods
of optical tomography". In "Abstracts ofReports at the 4th All-Union symposium on computational tomography'ç Tashkent,1989 (in Russian).
5. V.V.Alpatov and A.Steen. "Comparison of various projections inlormativity criteria in few-views optical auroratomography". In "Abstracts of2lstAnnual European meeting on atmospheric studies by optical methods'ç London, 1994.
6. V.V.Alpatov, G.G.Levin, V.V.Pikalov and Yu.A.Romanovsky. "Ultra-low view optic tomography of artificialstructures in the ionosphere". Proceedings ofthe 19th Annual European meeting on atmospheric studies by optical methods,p. 511-516, 1992.
7. V.V.Alpatov, Yu.A.Romanovsky. "Model evaluation of 3D optical-tomographic reconstruction of opticalirregularities in the Earth atmosphere at remote sensing". Abstracts of 1st European Symposium on Satellite RemoteSensing, Rome, p. 23, 1994.
8. A.N.Tikhonov, V.Ya.Arsenin and A.A.Timonov. "Mathematical problems of computer tomography", Nauka,Moscow, 1987 (in Russian).
9. K.H.Lloyd. "Theoretical models for the radiance of contaminant glow clouds in the upper atmosphere".Austr.J.Phys., Vol. 18, N2 4, p. 158, 1965.
10. J.Howard. "Tomography and reliable information". J.Opt.Soc.Am., A5, N2 7, 1965.11. V.V.Alpatov and Yu.A.Romanovsky. "On applications of optic tomography techniques to study irregular structure
of the low latitude and equatorial ionosphere". Abstracts of COSPAR colloquium on low-latitude ionospheric physics, p.171, Taipei, 1993.
12. V.V.Alpatov, V.E.Kunitsyn and Yu.A.Romanovsky. "Optical-radiophysical tomography of the ionosphere".Abstracts of International beacon satellite symposium, p. 84, 1994.
SPIE Vol. 2582 1157

Tab
les
1 -5
. Dat
a on
the
proj
ectio
ns pa
ram
eter
es:
- 0
- th
e an
gle b
etw
een
Z-a
xis
and
the
imag
er a
xis
orie
nted
at t
he E
arth
cen
ter:
- x,
Y,z
- the
"to
mog
raph
ic bo
x" c
oord
inat
es (F
ig.
1) in
rela
tive u
nits
cor
rela
ted
with
line
ar d
ista
nces
.
Lu
03
C-,
) 0
1 2
T
a b
1 e
S
3
9,0
y z
1 2
72.9
0
88.7
2 1.
8 63
.8
0 89
3 1.
5 54
.7
0 89
.3
4 1.
3 45
.6
0 89
.5
5 1
36.5
0
89.7
6 0.
8 27
.4
0 89
.7
7 0.
5 18
.2
0 89
.9
4
0,0
x y
z 1
3 10
9.4
0 87
.1
2 2.
3 82
.1
0 88
.4
3 1.
5 54
.7
0 89
.3
4 0.
8 27
.4
0 89
.8
5 0
0 0
90
6 -0
.7
-27.
4 0
89.8
7 -1
.5
-54.
7 0
89.3
5
8 0.
3 9.
1 0
90
0,0
x y
z o,
° x
y z
1 6
218.
5 0
78.6
1
3.8
96.7
96
.7
85.5
2 5.
3 19
1.2
0 81
.2
2 3
77.3
77
.3
87.1
3 4.
5 16
4 0
83.6
3
2.3
58
58
88.4
4 3.
8 13
6.7
0 85
.5
4 1.
5 38
.7
38.7
89
.3
5 3
109.
4
•
0 87
.1
5 0.
8 19
.3
13.3
89
.8
6 2.
3 82
.1
0 88
.4
6 0
0 0
90
7 1.
5 54
.7
0 89
.3
7 -0
.7
-19.
3 -1
9.3
89.9
8
-2.2
-8
2.1
O
88.4
8
0.8
27.4
0,0
x y
z 1
3 0
109.
4 87
.1
2 2.
3 0
82.1
88
.4
3 1.
5 0
54.7
89
.3
4 0.
8 0
27.4
89
.8
5 0
0 0
90
6 -0
.7
0 -2
7.4
89.8
7 -1
.5
0 -5
4.7
89.3
8 -2
.2
0 -8
2.1
88.4
0
89.8
8
-1.5
-38
.7
-38.
7 89
.3
9 0
0 0
90
10
-0.7
-2
7.4
0 89
.8
11
-1.5
-5
4.7
0 89
.3
12
-2.2
-8
2.1
0 88
.4
13
-3
-109
.4
0 87
.1
14
-3.7
-13
6.7
0 85
.5
15
-4.5
-1
64
0 83
.6
16
-5.2
-19
1.2
0 81
.2
(for
Fig
. 4)
(f
or F
ig.
5)
(for
Fig
. 6)
(f
or F
ig. 7
) (f
or F
ig. 8
)

B5.9
73,6
61.4
49,1
3&8
245
12,3
0.26
[Z]
— :::f.:.::.:::
•:.:::.::::
I Ji•r! '4 LIX]/[Y1
1
thecente oftheEarth
1,2,3 - the ionospheric "bubbles"; - asatellitewith an huager- a satellite orbit plane
Fig. 1. The scheme of computational simulation
(p0
Fig. 2. The map of the mformativity criterium
80
SPIE Vol. 2582 / 159

0 rT,
03
, 4 .
—
J 4*
r —
4
%
x
Fig
3. X
-Z c
ross
-sec
tions
of t
he 'b
ubbl
e" m
odel
. T
he n
umbe
r of a
cro
ss-s
ectio
n (t
otal
64)
is m
arke
d in
the
corn
er o
f the
cell.
z

x
1
•ii:
2 4
8 P
8
RO
JEC
TIO
NS
, p =
12
, 20
,, k\
*
28
* *
* *
, *,
, 4\
36
:):f.
E
::
44
K
.. "
RE
CO
NST
RU
CT
ION
OF
TH
E M
OD
EL
Z
Fig
4. T
he "
bubb
le" m
odel
S p
roje
ctio
ns fo
r q
= O
(Tab
le 1
) and
reco
nstr
uctio
n ofX
-Z cr
oss-
sect
ions
oft
he m
odel
(see
Fig
. 3)
calc
ulat
ed u
sing
the
proj
ectio
ns

1
2
3
—
4
, 5
6
7
. 8
8 PR
OJE
CT
ION
S, p
=
12
20
28
"k'
*4
.
1e
. 5
(4
36
• ??
H .
• . .
... .
. •:
•.
44
J1
x
RE
CO
NST
RU
CT
ION
OF
TH
E M
OD
EL
Z
Fig
5. T
he s
imul
ar d
ata a
s in
Fig.
4 f
or o
ther
initi
al 8
pro
ject
ions
(Tab
le 2
)

I 2
cc
3 4
' 5
6
' 7
8
:::
;. .e
.
. 9
10
11
12
13
14
15
16
- 16
PR
OJE
CT
ION
S, p
=
12
20
, .
/
4 28
c
. 4A
36
• .
.
44
x
Lu
03
RE
CO
NST
RU
CT
ION
OF
TH
E M
OD
EL
Z
Fig
6. T
he s
imul
ar d
ata b
ut fo
r 16
pro
ject
ions
(T
able
3)

0•
NJ
'J1
NJ
x
,
r •r
*4
RE
CO
NST
RU
CT
ION
OF
TH
E M
OD
EL
Fig
7. T
he s
imul
ar d
ata
for
8 pr
ojec
tions
at q
= 45
° (T
able
4)
z
8 PR
OJE
CT
ION
S, p
- 45°

J1
03
a'
'J1
x
1 2
3 4
5
> I
6 7
8
8 PR
OJE
CT
ION
S, p
= 9
00
12
20
,
28
d$*3
, 36
44
RE
CO
NST
RU
CT
ION
OF
TH
E M
OD
EL
Fig
8. T
he s
imul
ar d
ata
for
8 pr
ojec
tions
at q
= 9
Ø) (
Tab
le 5
)
z
Copyright © 2022 FDOKUMEN