Mobilization of Microspheres from a Fractured Soil during Intermittent Infiltration Events
10
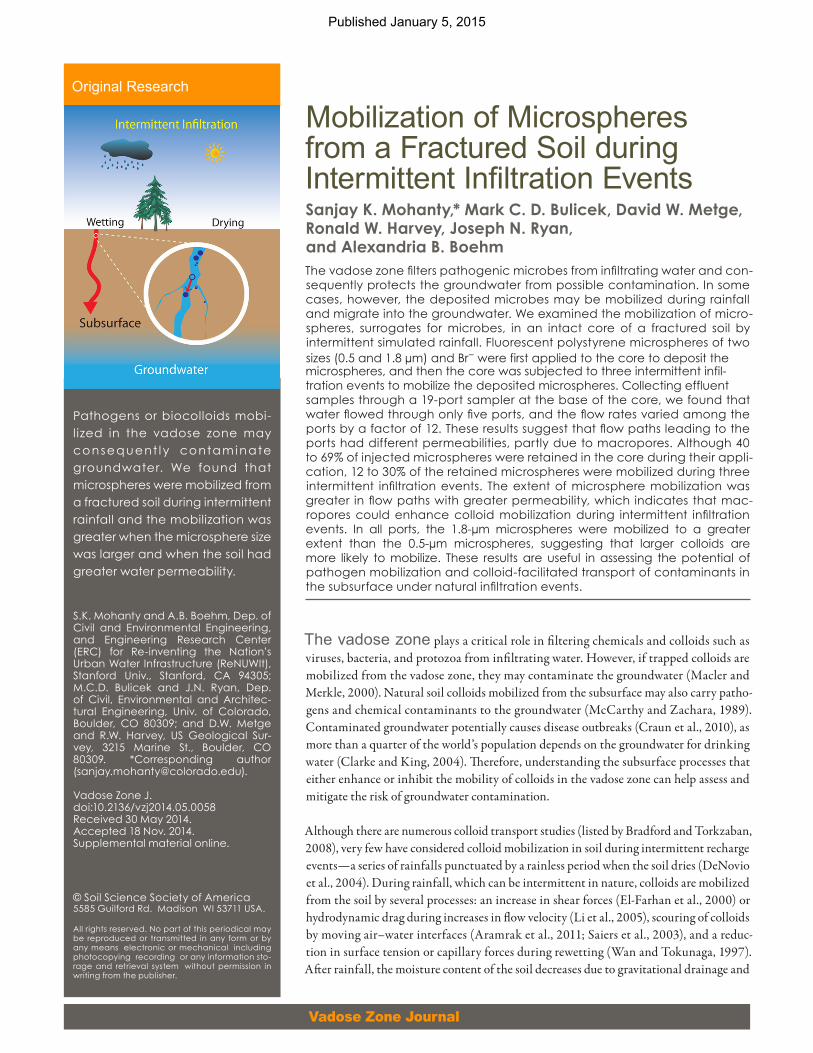
Vadose Zone Journal Mobilization of Microspheres from a Fractured Soil during Intermittent Infiltration Events Sanjay K. Mohanty,* Mark C. D. Bulicek, David W. Metge, Ronald W. Harvey, Joseph N. Ryan, and Alexandria B. Boehm The vadose zone filters pathogenic microbes from infiltrating water and con- sequently protects the groundwater from possible contamination. In some cases, however, the deposited microbes may be mobilized during rainfall and migrate into the groundwater. We examined the mobilization of micro- spheres, surrogates for microbes, in an intact core of a fractured soil by intermittent simulated rainfall. Fluorescent polystyrene microspheres of two sizes (0.5 and 1.8 µm) and Br − were first applied to the core to deposit the microspheres, and then the core was subjected to three intermittent infil- tration events to mobilize the deposited microspheres. Collecting effluent samples through a 19-port sampler at the base of the core, we found that water flowed through only five ports, and the flow rates varied among the ports by a factor of 12. These results suggest that flow paths leading to the ports had different permeabilities, partly due to macropores. Although 40 to 69% of injected microspheres were retained in the core during their appli - cation, 12 to 30% of the retained microspheres were mobilized during three intermittent infiltration events. The extent of microsphere mobilization was greater in flow paths with greater permeability, which indicates that mac- ropores could enhance colloid mobilization during intermittent infiltration events. In all ports, the 1.8-µm microspheres were mobilized to a greater extent than the 0.5-µm microspheres, suggesting that larger colloids are more likely to mobilize. These results are useful in assessing the potential of pathogen mobilization and colloid-facilitated transport of contaminants in the subsurface under natural infiltration events. The vadose zone plays a critical role in filtering chemicals and colloids such as viruses, bacteria, and protozoa from infiltrating water. However, if trapped colloids are mobilized from the vadose zone, they may contaminate the groundwater (Macler and Merkle, 2000). Natural soil colloids mobilized from the subsurface may also carry patho- gens and chemical contaminants to the groundwater (McCarthy and Zachara, 1989). Contaminated groundwater potentially causes disease outbreaks (Craun et al., 2010), as more than a quarter of the world’s population depends on the groundwater for drinking water (Clarke and King, 2004). erefore, understanding the subsurface processes that either enhance or inhibit the mobility of colloids in the vadose zone can help assess and mitigate the risk of groundwater contamination. Although there are numerous colloid transport studies (listed by Bradford and Torkzaban, 2008), very few have considered colloid mobilization in soil during intermittent recharge events—a series of rainfalls punctuated by a rainless period when the soil dries (DeNovio et al., 2004). During rainfall, which can be intermittent in nature, colloids are mobilized from the soil by several processes: an increase in shear forces (El-Farhan et al., 2000) or hydrodynamic drag during increases in flow velocity (Li et al., 2005), scouring of colloids by moving air–water interfaces (Aramrak et al., 2011; Saiers et al., 2003), and a reduc- tion in surface tension or capillary forces during rewetting (Wan and Tokunaga, 1997). Aſter rainfall, the moisture content of the soil decreases due to gravitational drainage and Pathogens or biocolloids mobi - lized in the vadose zone may consequently contaminate groundwater. We found that microspheres were mobilized from a fractured soil during intermittent rainfall and the mobilization was greater when the microsphere size was larger and when the soil had greater water permeability. S.K. Mohanty and A.B. Boehm, Dep. of Civil and Environmental Engineering, and Engineering Research Center (ERC) for Re-inventing the Nation’s Urban Water Infrastructure (ReNUWIt), Stanford Univ., Stanford, CA 94305; M.C.D. Bulicek and J.N. Ryan, Dep. of Civil, Environmental and Architec- tural Engineering, Univ. of Colorado, Boulder, CO 80309; and D.W. Metge and R.W. Harvey, US Geological Sur- vey, 3215 Marine St., Boulder, CO 80309. *Corresponding author ([email protected]). Vadose Zone J. doi:10.2136/vzj2014.05.0058 Received 30 May 2014. Accepted 18 Nov. 2014. Supplemental material online. Original Research © Soil Science Society of America 5585 Guilford Rd. Madison WI 53711 USA. All rights reserved. No part of this periodical may be reproduced or transmitted in any form or by any means electronic or mechanical including photocopying recording or any information sto- rage and retrieval system without permission in writing from the publisher. Published January 5, 2015
-
Upload
independent -
Category
Documents
-
view
3 -
download
0
Transcript of Mobilization of Microspheres from a Fractured Soil during Intermittent Infiltration Events
Vadose Zone Journal
Mobilization of Microspheres from a Fractured Soil during Intermittent Infiltration EventsSanjay K. Mohanty,* Mark C. D. Bulicek, David W. Metge, Ronald W. Harvey, Joseph N. Ryan, and Alexandria B. BoehmThe vadose zone filters pathogenic microbes from infiltrating water and con-sequently protects the groundwater from possible contamination. In some cases, however, the deposited microbes may be mobilized during rainfall and migrate into the groundwater. We examined the mobilization of micro-spheres, surrogates for microbes, in an intact core of a fractured soil by intermittent simulated rainfall. Fluorescent polystyrene microspheres of two sizes (0.5 and 1.8 µm) and Br− were first applied to the core to deposit the microspheres, and then the core was subjected to three intermittent infil-tration events to mobilize the deposited microspheres. Collecting effluent samples through a 19-port sampler at the base of the core, we found that water flowed through only five ports, and the flow rates varied among the ports by a factor of 12. These results suggest that flow paths leading to the ports had different permeabilities, partly due to macropores. Although 40 to 69% of injected microspheres were retained in the core during their appli-cation, 12 to 30% of the retained microspheres were mobilized during three intermittent infiltration events. The extent of microsphere mobilization was greater in flow paths with greater permeability, which indicates that mac-ropores could enhance colloid mobilization during intermittent infiltration events. In all ports, the 1.8-µm microspheres were mobilized to a greater extent than the 0.5-µm microspheres, suggesting that larger colloids are more likely to mobilize. These results are useful in assessing the potential of pathogen mobilization and colloid-facilitated transport of contaminants in the subsurface under natural infiltration events.
The vadose zone plays a critical role in filtering chemicals and colloids such asviruses, bacteria, and protozoa from infiltrating water. However, if trapped colloids are mobilized from the vadose zone, they may contaminate the groundwater (Macler and Merkle, 2000). Natural soil colloids mobilized from the subsurface may also carry patho-gens and chemical contaminants to the groundwater (McCarthy and Zachara, 1989). Contaminated groundwater potentially causes disease outbreaks (Craun et al., 2010), as more than a quarter of the world’s population depends on the groundwater for drinking water (Clarke and King, 2004). Therefore, understanding the subsurface processes that either enhance or inhibit the mobility of colloids in the vadose zone can help assess and mitigate the risk of groundwater contamination.
Although there are numerous colloid transport studies (listed by Bradford and Torkzaban, 2008), very few have considered colloid mobilization in soil during intermittent recharge events—a series of rainfalls punctuated by a rainless period when the soil dries (DeNovio et al., 2004). During rainfall, which can be intermittent in nature, colloids are mobilized from the soil by several processes: an increase in shear forces (El-Farhan et al., 2000) or hydrodynamic drag during increases in flow velocity (Li et al., 2005), scouring of colloids by moving air–water interfaces (Aramrak et al., 2011; Saiers et al., 2003), and a reduc-tion in surface tension or capillary forces during rewetting (Wan and Tokunaga, 1997). After rainfall, the moisture content of the soil decreases due to gravitational drainage and
Pathogens or biocolloids mobi-l ized in the vadose zone may consequent l y contaminate groundwater. We found that microspheres were mobilized from a fractured soil during intermittent rainfall and the mobilization was greater when the microsphere size was larger and when the soil had greater water permeability.
S.K. Mohanty and A.B. Boehm, Dep. of Civil and Environmental Engineering, and Engineering Research Center (ERC) for Re-inventing the Nation’s Urban Water Infrastructure (ReNUWIt), Stanford Univ., Stanford, CA 94305; M.C.D. Bulicek and J.N. Ryan, Dep. of Civil, Environmental and Architec-tural Engineering, Univ. of Colorado, Boulder, CO 80309; and D.W. Metge and R.W. Harvey, US Geological Sur-vey, 3215 Marine St., Boulder, CO 80309. *Corresponding author ([email protected]).
Vadose Zone J. doi:10.2136/vzj2014.05.0058Received 30 May 2014.Accepted 18 Nov. 2014.Supplemental material online.
Original Research
© Soil Science Society of America5585 Guilford Rd. Madison WI 53711 USA.
All rights reserved. No part of this periodical may be reproduced or transmitted in any form or by any means electronic or mechanical including photocopying recording or any information sto-rage and retrieval system without permission in writing from the publisher.
Published January 5, 2015

Vadose Zone Journal p. 2 of 10
evaporation of pore water. Soil drying could enhance the mobiliza-tion of colloids by collapsing dry macropore walls under capillary pressure (Majdalani et al., 2008). Because colloid mobilization during a dry–wet cycle occur at air–water or soil–water interfaces, the configuration of these interfaces affects colloid mobilization during intermittent flow (Bradford and Torkzaban, 2008). Among several factors that affect water and air distribution in the soil, soil physical heterogeneity and the characteristics of intermittent infil-tration events are the most critical factors (Hillel, 2004).
In general, most soils are physically heterogeneous because of the presence of macropores, including bedding planes, fractures, and root channels, which could affect the transport and mobilization of colloids. Macropores are known to facilitate the transport of sus-pended colloids (Jacobsen et al., 1997), but the role of macropores in the mobilization of deposited colloids is poorly understood. For instance, soil macroporosity—the amount of macropores or their distribution in soil—could affect the water permeability of the soil; the permeability affects the air–water distribution in the soil after a rainfall or during soil drying (Lehmann et al., 2008), which in turn could affect colloid mobilization (Majdalani et al., 2008; Schelde et al., 2002). Weisbrod et al. (2002) found that natural colloids from the subsurface could accumulate in the soil fractures and mobilize into the groundwater during intermittent flow. However, only a few studies have examined the mobilization of colloids in a het-erogeneous soil core (Jacobsen et al., 1997; Kjaergaard et al., 2004; Majdalani et al., 2008; Schelde et al., 2002). Furthermore, these studies collected a composite water sample from the entire soil core; thus, they did not examine the effects of intra-core variations in soil permeability on the transport and mobilization of colloids.
We examined the mobilization of microspheres through an intact core of a fractured soil during intermittent infiltration of artificial rainwater. Microspheres were used as readily traceable surrogates for microbes. The soil contains macropores such as bedding planes, fractures, and microfractures, which have been shown to increase water permeability (Wilson and Luxmoore, 1988) and facilitate the transport of dissolved contaminants (Jardine et al., 1993). We hypothesized that intermittent flow would mobilize deposited colloids, and the mobilization would depend on the colloid size and soil permeability. To test these hypotheses, we applied micro-spheres of two sizes to an intact soil core and subjected the core to three intermittent infiltration events. The water samples were collected at the base of the core through a 19-port zero-tension sampling grid to evaluate the effect of the intra-core variability in soil permeability on microsphere mobilization.
6MethodsIntact Soil Core SamplingWe collected the soil core on 9 June 2009 from the bottom of a hillslope in the Melton Branch watershed in the Oak Ridge
Reservation, Tennessee (35°55.43¢ N, 84°17.81¢ W). The proper-ties of the soil were described by Jardine et al. (1993). Briefly, the soil consists of shale saprolite with macropores including bedding planes and fractures (Supplementary Fig. S1). These macropores vary in size and conduct nearly all of water during a typical rainfall (Watson and Luxmoore, 1986). The clay fraction is composed of illite, and the clay minerals, particularly on fracture surfaces, are coated with a large quantity of amorphous Fe and Mn oxides. The pH of the soil ranges from 4 5 to 6, and its cation exchange capacity varies between 7 and 16 cmolc kg−1 (Jardine et al., 1993).
Intact soil cores were collected following a hand-sculpting method (Jardine et al., 1993). The vegetation and O-layer soil were removed, and a soil block within the A horizon was isolated by excavating a trench around it and trimming it to fit inside polyvinylchloride (PVC) pipes of 30 5-cm height and 25.4-cm diameter. The gap between the PVC pipe and the soil (approximately 1.2 cm) was filled with polyurethane expandable foam (US Composites). In preliminary rainfall experiments with full-height (30.5-cm) soil cores, we observed that bedding plane fractures, which dipped at an angle of 30°, carried 40 to 65% of the infiltrating water to the foam wall on one side of the column because the bedding planes terminated at the foam walls. To minimize this problem, the soil cores were cut to a height of 15 cm so most of the bedding planes did not extend to the foam wall. We also injected dye to visually identify the macropore heterogeneity at different depths of the soil core (see the Supplemental Material).
Experimental SetupThe experimental setup consisted of a simulated rainfall reservoir, the soil core, a sampling grid, and sample collection tubes (Fig. 1). The rainfall reservoir contained 85 needles (25 gauge) to simulate uniform rainfall on top of the soil core. The soil core was placed under the rainfall reservoir and on a 19-port sampling grid where each port with a 11.4-cm2 cross-sectional area captured water that was transmitted through a section of soil core and delivered the water samples to discrete sample collection tubes (glass, 2.5-cm diameter by 25-cm length). The total base area covered by the 19 ports was 216.6 cm2. Any water that flowed around the column or perimeter of the soil core was collected in a channel (1.3-cm width) surrounding the sample ports and was discarded. Water flowed to each port from the bottom surface of the soil under zero tension. A soil moisture probe (Theta Probe MLX2, Delta-T Devices) was inserted 6 cm into the soil through the side of the core at 7.5 cm below the soil surface and connected to a datalogger (DI 710, DATAQ Instruments) to record and store core saturation at the 7.5-cm depth at 1-min intervals. During steady state, saturation measurements were averaged over time. During multiple rainfall events, saturation measurements at the end of rainfall or an inter-mediate drying period were averaged. The core saturation at the 7.5-cm depth may not represent the entire core saturation (volume of water/volume of pores) because of the physical heterogeneity of the soil core. However, a change in moisture content at the core

Vadose Zone Journal p. 3 of 10
center indicates a change in the soil-moisture pattern within the core at different stages of intermittent infil-tration events. Steady moisture content at the core center before injection of the microspheres was also used as an indicator for equilibrium in flow and moisture content.
MicrospheresWe used fluorescent carboxylate-modified polystyrene microspheres of two diameters: 0.5 ± 0.01 mm (Type
“multif luorescent”) and 1.8 ± 0.04 mm (Type BB, Brilliant blue) (Polysciences Inc.). The zeta potential of the microspheres and fine soil particles (<75 mm) was measured by laser Doppler microelectrophoresis at four pH values between 2 and 9 in 1 mmol L−1 NaCl at a concentration of about 5 ´ 107 microspheres mL−1 (Supplemental Material).
SolutionsTwo solutions were used: (i) the deposition solution con-taining microspheres and Br− to deposit microspheres in the soil core; and (ii) the mobilization solution to exam-ine the mobilization of microspheres during intermittent infiltration events. To prepare the deposition solution, we dissolved 1 mmol L−1 of NaBr in deionized water and suspended stock microspheres to achieve a microsphere concentration of 8.5 (± 1.5) ´ 107 mL−1. A high ionic strength was used to promote the attachment of the microspheres to the soil (McCarthy et al., 2002) so that the core contained deposited microspheres. The mobiliza-tion solution was prepared by adding 0.1 mmol L−1 NaCl to deionized water. To simulate infiltrating rainwater (Chandra Mouli et al., 2005), the ionic strength (I = 0.1 mmol L−1) of the mobilization solution was lower than that of the deposition solution (I = 1 mmol L−1). The pH of both solutions was 5.8 ± 0.1 and was not adjusted during the experiments.
Experimental ProcedureExperiments were conducted in three phases (Table 1): condi-tioning, deposition, and mobilization. During the conditioning phase, a steady-state flow was achieved by injecting a 0.01 mmol L−1 NaCl solution for 24 h. During the deposition phase, a micro-sphere and 1 mmol L−1 NaBr suspension was applied for 3.1 h and a 0.1 mmol L−1 NaCl solution was applied for 3.1 h. Injection of the 0.1 mmol L−1 NaCl solution with an ionic strength lower than that of the deposition solution (1 mmol L−1) may have caused a detachment of loosely bound microspheres. Nevertheless, this step was necessary to distinguish the microspheres mobilized by a chemical process (a decrease in ionic strength) from that mobilized by a physical processes during subsequent intermittent infiltration events. During the mobiliza-tion phase, a 0.1 mmol L−1 NaCl solution was applied as three 4-h wetting cycles separated by 20-h drying cycles.
The objective of the mobilization phase was to estimate the fraction of deposited microspheres mobilized by intermittent f low. During the mobilization phase, the soil core was subjected to three intermittent infiltration events. In each of the infiltra-tion events, the wet soil core was first drained by gravity and left at room temperature (22 ± 2°C) to dry for 20 h, and then the mobilization solution was applied at 1.8 cm h−1 for 4 h to simulate a wetting cycle. Water samples were collected only during wetting cycles because no water f lowed during the 20-h drying period.
Fig. 1. Column setup to examine the mobilization of colloids from an intact core of a fractured soil. The 19 ports (3.81 cm diameter) were arranged in two concentric hexagons around a center port. The 85 needles of the rainfall reservoir were arranged in a hexagonal pattern, with the closest distance between two needles of 2.2 cm.
Table 1. Experimental phases subjected to the soil core.
Phase Feed solution and duration Purpose
Conditioning phase 0.01 mmol L−1 NaCl, 24 h to equilibrate moisture content and flow rate
Deposition phase 1 mmol L−1 NaBr and microspheres, 3.1 h
to deposit microspheres
0.1 mmol L−1 NaCl, 3.1 h to remove microspheres from pore water
Mobilization phase 0.1 mmol L−1 NaCl, 20-h pause (drying cycle) followed by 4-h wetting cycle; repeated three times over 3 d
to mobilize previously deposited microspheres from the soil core

Vadose Zone Journal p. 4 of 10
Analyses of Water SamplesEffluent water samples were analyzed for turbidity (Hach 2100N turbidity meter), Br− (Accumet 13-620-524 ion-selective elec-trode), pH (Orion 8102BNU combination electrode), and microspheres (Nikon Eclipse 2000i epifluorescent microscope, 1000´ magnification). The pH was monitored randomly during injection and mobilization of the microspheres. The measured turbidities were converted to an equivalent concentration of soil colloids (mg L−1) following a method outlined by Mohanty et al. (2014). In this study, effluent turbidity accounted for both soil colloids and microspheres, but the contribution of the micro-spheres to the effluent turbidity during the mobilization phase was negligible. Briefly, 20 mL of turbid sample was dried in an oven at 104°C to estimate the mass of the suspended colloids, which was converted to concentration using the initial sample volume. Microsphere concentration was determined as follows. One milliliter of sample was filtered through black polycarbon-ate membranes (0.2-mm pore diameter, Osmonics). A drop of immersion oil (Type FF, Cargille Laboratories) was applied to the membrane, and the microspheres were counted under the micro-scope. The 0 5-mm-diameter microspheres were enumerated at an excitation wavelength of 535 nm and an emission wavelength of 590 nm. The 1.8-mm microspheres were enumerated at an excita-tion wavelength of 355 nm and an emission wavelength of 420 nm. Under an epif luorescence microscope, smaller microspheres appeared orange and large microspheres appeared blue. Because the two microspheres fluorescence at different wavelengths, their concentrations could be quantified in the same sample without interference. Microspheres in all samples were counted in at least 10 random fields or a total of 400 microspheres, with estimated values reported as the mean and standard deviation (Harvey et al., 1993). The average microsphere counts per field were converted to concentration using the effective filter area, microscope ocular field area, and sample volume (Searcy et al., 2005).
Data AnalysisThe average water flux through a port was estimated as the flow rate through a port divided by the area of the port using the flow rate measurements during the deposition and mobilization phases. During a wetting cycle, flux was measured only after water started to drip at the bottom of the core; flux was not measured during drying period. During the 3.1-h application of the deposition solution (3300 mL), flow paths corresponding to a port received a fraction of microspheres or Br− injected with the deposition solu-tion (Eq. [1]). This fraction was calculated as
0 ,1
0 totalFraction injected
ni pi
pC V
C V==
å [1]
where C0 is the concentration of microspheres or Br− in the appliedvolume (Vtotal) of deposition solution, Vi,p is volume of the ithsample collected at port p, and n is the number of samples collected during application of the deposition solution (the first 3.1 h of the
6.2-h deposition phase). Because microspheres were injected after 24-h flow equilibrium, we assumed that outflow volume accounted for the total volume of water injected in the core. In other words, Vtotal is the sum of the volume of water (about 3230 mL) collected at all ports. The fraction injected (estimated in Eq. [1]) accounts for the minimum amount of water (or microspheres) that entered the flow paths leading to each port because it is likely that some water may enter into the dry soil matrix and be trapped within the core. Based on a water mass balance, the volume trapped within the matrix (about 70 mL) during the injection of microspheres was only 2% of the total water passed through the core. Only the first 3.1 h was considered because the solution injected in the second 3.1 h of the deposition phase did not contain any microspheres or Br−.
Of the microspheres infiltrated into the flow paths associated with different active ports, some fraction was transported through the flow paths and collected at the port and the remaining fraction was deposited within the flow paths. The fraction of the injected microspheres transported through the flow paths associated with each active port during the deposition phase was calculated as the ratio of the number of microspheres transported through the port during the deposition phase (6.2 h) to total the number injected into those flow paths:
, ,1
0 ,1
Fraction transportedN
i p i pip n
i pi
C V
C V=
=
=å
å[2]
where Ci,p is the microsphere concentration in the ith effluentsample from port p, and N is number of sample fractions collected during the entire deposition phase, including the application of the mobilization solution before the mobilization phase (6.2 h). The fraction deposited within the flow paths feeding active port p was calculated by subtracting the transported fraction from 1. The percentage of deposited microspheres mobilized through each port and its associated flow paths during intermittent flow was estimated by multiplying the ratio of the number of microspheres mobilized during intermittent flow to the number deposited during the deposi-tion phase by 100. This calculation assumes that flow paths during the deposition phase and mobilization phase remained consistent. Because pore water did not drain through any of the previously inactive ports during intermittent infiltration events, we assumed that flow paths during the deposition and mobilization phases were constrained within the same soil section above each port.
Unlike microspheres, which are expected to deposit and mobilize within macropores (Cumbie and McKay, 1999), Br− is transported in the soil by a combination of advection along the macropores and diffusion between macropores and the matrix (Reedy et al., 1996). Bromide recovery (the ratio of Br− transported to Br− injected in the flow paths feeding each active port) during the entire experi-ment was calculated using Eq. [2], but N in the summation was the total number of samples collected during deposition and all mobilization phases.
Vadose Zone Journal p. 5 of 10
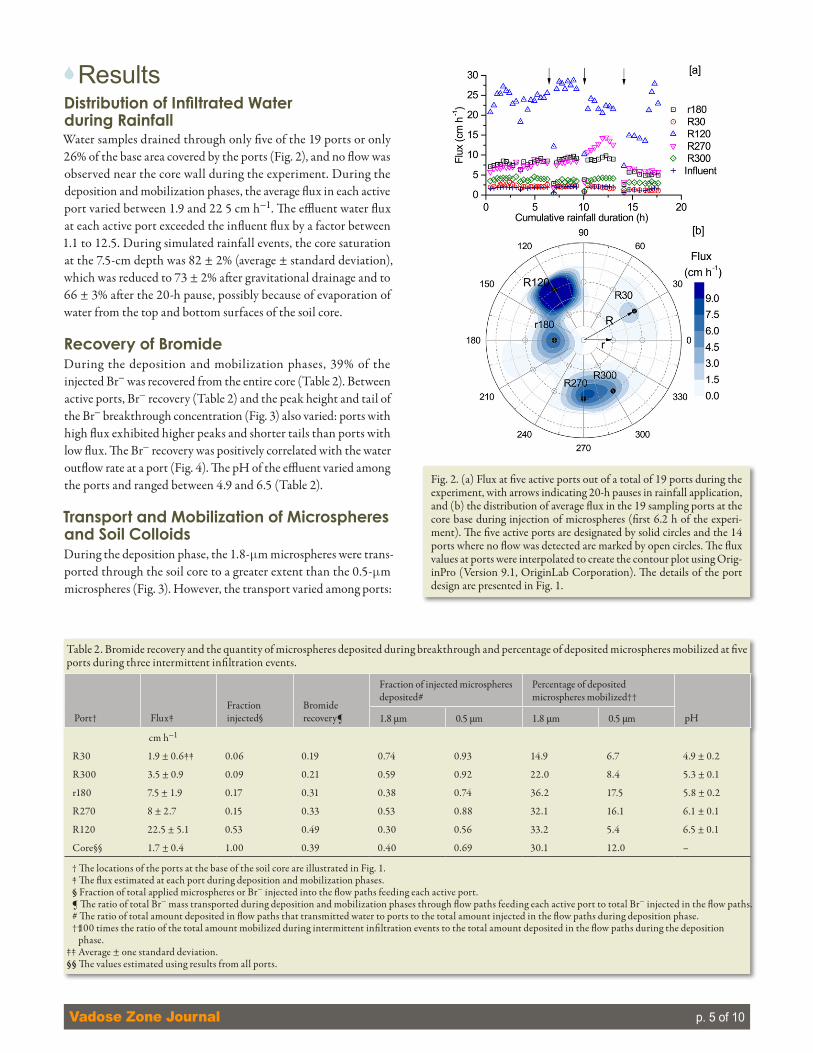
6ResultsDistribution of Infiltrated Water during RainfallWater samples drained through only five of the 19 ports or only 26% of the base area covered by the ports (Fig. 2), and no flow was observed near the core wall during the experiment. During the deposition and mobilization phases, the average flux in each active port varied between 1.9 and 22 5 cm h−1. The effluent water flux at each active port exceeded the influent flux by a factor between 1.1 to 12.5. During simulated rainfall events, the core saturation at the 7.5-cm depth was 82 ± 2% (average ± standard deviation), which was reduced to 73 ± 2% after gravitational drainage and to 66 ± 3% after the 20-h pause, possibly because of evaporation of water from the top and bottom surfaces of the soil core.
Recovery of BromideDuring the deposition and mobilization phases, 39% of the injected Br− was recovered from the entire core (Table 2). Between active ports, Br− recovery (Table 2) and the peak height and tail of the Br− breakthrough concentration (Fig. 3) also varied: ports with high flux exhibited higher peaks and shorter tails than ports with low flux. The Br− recovery was positively correlated with the water outflow rate at a port (Fig. 4). The pH of the effluent varied among the ports and ranged between 4.9 and 6.5 (Table 2).
Transport and Mobilization of Microspheres and Soil ColloidsDuring the deposition phase, the 1.8-mm microspheres were trans-ported through the soil core to a greater extent than the 0.5-mm microspheres (Fig. 3). However, the transport varied among ports:
Fig. 2. (a) Flux at five active ports out of a total of 19 ports during the experiment, with arrows indicating 20-h pauses in rainfall application, and (b) the distribution of average flux in the 19 sampling ports at the core base during injection of microspheres (first 6.2 h of the experi-ment). The five active ports are designated by solid circles and the 14 ports where no flow was detected are marked by open circles. The flux values at ports were interpolated to create the contour plot using Orig-inPro (Version 9.1, OriginLab Corporation). The details of the port design are presented in Fig. 1.
Table 2. Bromide recovery and the quantity of microspheres deposited during breakthrough and percentage of deposited microspheres mobilized at five ports during three intermittent infiltration events.
Port† Flux‡Fraction injected§
Bromide recovery¶
Fraction of injected microspheres deposited#
Percentage of deposited microspheres mobilized††
pH1.8 µm 0.5 µm 1.8 µm 0.5 µm
cm h−1
R30 1.9 ± 0.6‡‡ 0.06 0.19 0.74 0.93 14.9 6.7 4.9 ± 0.2
R300 3.5 ± 0.9 0.09 0.21 0.59 0.92 22.0 8.4 5.3 ± 0.1
r180 7.5 ± 1.9 0.17 0.31 0.38 0.74 36.2 17.5 5.8 ± 0.2
R270 8 ± 2.7 0.15 0.33 0.53 0.88 32.1 16.1 6.1 ± 0.1
R120 22.5 ± 5.1 0.53 0.49 0.30 0.56 33.2 5.4 6.5 ± 0.1
Core§§ 1.7 ± 0.4 1.00 0.39 0.40 0.69 30.1 12.0 –
† The locations of the ports at the base of the soil core are illustrated in Fig. 1.‡ The flux estimated at each port during deposition and mobilization phases.§ Fraction of total applied microspheres or Br− injected into the flow paths feeding each active port.¶ The ratio of total Br− mass transported during deposition and mobilization phases through flow paths feeding each active port to total Br− injected in the flow paths.# The ratio of total amount deposited in flow paths that transmitted water to ports to the total amount injected in the flow paths during deposition phase.†† 100 times the ratio of the total amount mobilized during intermittent infiltration events to the total amount deposited in the flow paths during the deposition
phase.‡‡ Average ± one standard deviation.§§ The values estimated using results from all ports.

Vadose Zone Journal p. 6 of 10
the peaks of the microsphere breakthrough concentra-tion were higher in the ports with greater flux.
During the mobilization phase, 5 to 36% of the depos-ited microspheres were subsequently recovered in the effluents during intermittent infiltration events (Table 2). The extent of microsphere mobilization varied among ports, and greater mobilization occurred from ports with higher flux (Fig. 4). Nevertheless, the mobilization patterns for all ports were similar; microsphere concentration peaked at the start of rain-fall and decreased as rainfall continued, and the height of the peak in microsphere concentration decreased during successive intermittent infiltration events (Fig. 3). In all active ports, the percentage of depos-ited microspheres that were subsequently remobilized was greater for the 1.8-mm microspheres than for the 0.5-mm microspheres (Table 2). The effluent turbidity, contributed predominantly by soil colloids, followed a similar trend as that of microsphere mobilization.
6DiscussionEffect of Preferred Flow-Path Structure on Transport of Water and BromidePrevious research on the Melton Branch soil revealed the importance of bedding planes and fractures in water flow and solute transport (Jardine et al., 1993; Watson and Luxmoore, 1986; Wilson and Luxmoore, 1988). The flow and solute transport in our soil core were similar to those described in the previous studies. That is, water predominately infiltrated through bedding plane fractures and the infiltration rate varied with the soil physical heterogeneity. The simulated rainwater percolated through only 26% of the column base area (five of 19 ports), which indicates that some of the infiltrating water followed preferential flow paths or macropores such as bed-ding planes, fractures, and microfractures, whereas the remaining water infiltrated into the soil matrix. Effluent flux at each port, which ranged between 1.9 and 22.5 cm h−1, exceeded the rainfall application rate (1.8 cm h−1). This result suggests that most of the applied water converged into macropores. Water applied at the top of the soil core flowed through a small area at the core base, thereby causing the effective flux at the active ports to exceed the rainfall application rate. By applying dye to a different soil core in the preliminary experiment, we confirmed the convergence of flow through macropores (Supplementary Fig. S2). Using tension-infiltration measurements at the field site where the soil core in our study was sampled, Watson and Luxmoore (1986) estimated that 96% of the water flux was transmitted through only 0.32% of the soil volume, and the contribution of macro-pores to the total water flux was greater when the flux was larger.
Because macropores increase water permeability in soil (Beven and Germann, 1982), we surmise that the ports with higher flux received water from soil sections with greater water permeability caused by macropores.
Water in macropores can infiltrate into the soil matrix, which can affect the transport of solute and colloids in heterogeneous soil (Nielsen et al., 2011). Interaction between macropores and the sur-rounding matrix was confirmed by a low Br− recovery in our study. Only 39% of the applied Br− was recovered from the soil core during the entire experiment. Because the matrix porosity was much greater than the macroporosity in this soil (McKay et al., 2000; Wilson and Luxmoore, 1988), a large fraction of the applied Br− entered into the soil matrix. For complete Br− recovery, the Br− inside the soil matrix must diffuse to the nearest active flow paths or macro-pores (Luxmoore et al., 1990; McCarthy et al., 2002). Assuming a Br− diffusion coefficient of 10−5 cm2 s−1 and an average matrix path a few centimeters long, complete Br− recovery would take several weeks (Jardine et al., 1999). Thus, the duration of our experiment was insufficient to drain all the Br− from the matrix. The recovery of Br− from different sections of the soil core also varied, which further confirms that the soil fraction that contributed water to each port differed in macro- and matrix porosity. Greater Br− recovery at a
Fig. 3. Transport and mobilization of (a) colloids, and (b–f ) microspheres of two sizes and Br− through the five active ports. Microspheres and Br− with concentration C0 were applied for 3.1 h followed by application of 0.1 mmol L−1 NaCl for another 3.1 h. Vertical dashed lines indicate pauses in rainfall application and the start of the drainage of pore water for 20 h. The error bars indicate one standard deviation of multiple micro-sphere counts of a representative sample.

Vadose Zone Journal p. 7 of 10
port indicates that Br− in that port was transported through a soil section containing more macropores or less matrix.
Mobilization of Natural ColloidsDuring a wetting cycle following soil drying, the eff luent tur-bidity increased because of mobilization of natural colloids and microspheres, but the contribution of the microspheres, based on microspheres mass, to the effluent turbidity was negligible. An increase in colloid mobilization at the start of a wetting cycle in our study agrees with the result from the previous studies (Aramrak et al., 2014; El-Farhan et al., 2000; Majdalani et al., 2008; Schelde et al., 2002). Some of the soil colloids mobilized in our study may carry microspheres, thereby facilitating mobilization of micro-spheres during intermittent infiltration events (Mohanty et al., 2014). However, the microscopic method used in this study to quantify microspheres did not distinguish colloid-associated microspheres from “free” microspheres.
Transport of MicrospheresHigher flux resulted in lower retention of microspheres, possibly because of reduced interactions with fracture walls or less diffusion into fine pores (Zhang et al., 2012). This result is consistent with the findings of a previous study on a similar soil core, where water samples from the entire core were collected at one outlet (McKay et al., 2002). Collecting water samples from a 19-port grid, we found that microsphere transport was greater through the soil section with greater permeability caused by macropores. This supports
the finding of a field experiment, where microsphere transport was found to be limited to macropores and did not occur in the soil matrix (Cey et al., 2009).
Compared with the 1.8-mm microspheres, the reten-tion of 0.5-mm microspheres during the deposition phase was expected to be greater, probably due to their diffusion into the soil matrix or more frequent collisions with fracture walls (Oswald and Ibaraki, 2001; Zvikelsky and Weisbrod, 2006). This matched our observations, where 0.5-mm microspheres were retained more efficiently than the 1.8-mm micro-spheres. Furthermore, 1.8-mm microspheres can be excluded from small pores and travel faster through macropores (Sirivithayapakorn and Keller, 2003). However, using saturated cores with similar soil physi-cal properties, previous studies showed a different result: 0.5-mm microspheres were preferentially trans-ported compared with larger microspheres (Cumbie and McKay, 1999; McCarthy et al., 2002). In another study (Zvikelsky and Weisbrod, 2006), the recovery of 0.2-mm microspheres was greater than the recovery of microspheres of smaller or larger size. This differ-ence in optimum size for transport has been attributed to a difference in the size of fracture apertures in the tested soils (Vilks and Bachinski, 1996; Zhuang et al.,
2005), the average saturation of the soil (Chen et al., 2009), or both of these factors (Mishurov et al., 2008). In our study, the degree of size exclusion within the matrix porosity was unknown because the pore size distribution or fracture size distribution was unknown.
Mobilization of MicrospheresMicrospheres deposited in the first phase of the experiment were mobilized during subsequent intermittent infiltration events. An increase in colloid mobilization during intermittent flow has been observed in other laboratory studies with packed sand (Mohanty et al., 2013; Zhuang et al., 2007) and an intact soil core (Majdalani et al., 2008). In addition to corroborating the findings from pre-vious studies, we showed that the mobilization by intermittent flow increased with colloid size and water permeability of the soil. Among the active ports, mobilization was greater through ports that received water from flow paths with greater water permeabil-ity. Because a high permeability could be caused by macropores in this soil (Watson and Luxmoore, 1986), we surmise that macro-pores could increase the mobilization of colloids. An increase in colloid mobilization with an increase in permeability is attributed to several processes that may occur during intermittent infiltra-tion events. In unsaturated soils, colloids are mobilized by shear caused by increased flow, expansion of water films during wetting, and air–water interface scouring during drainage and wetting (DeNovio et al., 2004). Additionally, microspheres are less likely to be redeposited in large macropores than in narrower pores because
Fig. 4. Average flux at ports—an indicator of water permeability in soil—affects (a) the recovery of Br−, the fraction of microspheres (b) transported and (c) deposited during the deposition phase, and (d) the fraction of deposited microspheres mobilized during intermittent flow. The error bars indicate one standard deviation of flux at the ports during the deposition and mobilization phases. Bromide and microsphere fractions are single values estimated for each port during the entire experiment, thus these fractions do not include error bars.

Vadose Zone Journal p. 8 of 10
collision efficiency and straining increase with decreasing pore width (Bradford et al., 2002). All these processes are more likely to occur in highly permeable soils with macropores than in the fine-grained soil matrix, which may not drain completely; thus, the soil matrix could remain relatively saturated during intermittent flow (Lehmann et al., 2008). Also, a flow velocity increase within the macropores in highly permeable soil is expected to be greater than the flow velocity increase in the soil matrix, where water is relatively immobile (Luxmoore et al., 1990).
The variation in microsphere mobilization among the ports could also be attributed to geochemical heterogeneity of the soil core (Bradford et al., 2012). In our study, a pH variation among the ports indicated that the flow path to each port may differ geochem-ically. Geochemical heterogeneity of the soil is expected because of preferential weathering of the soil near macropore channels and relocation of Fe and Mn oxides within bedding planes and frac-tures (Jardine et al., 1993). Pore water pH could directly affect the surface charge and electrostatic repulsion between microspheres and soil surfaces. However, a small variation in zeta potentials (Supplementary Fig. S3) within the measured pH range suggests that the pH variation among ports may not explain the large dif-ferences in microsphere mobilization among ports.
We showed a size-dependent mobilization of colloids during inter-mittent flow. The mobilization of 1.8-mm microspheres was greater than the mobilization of 0.5-mm microspheres in all ports, which suggests that a larger colloid is more likely to remobilize. Several processes could explain the size-dependent mobilization of micro-spheres during intermittent flow. First, larger microspheres can experience greater shear forces than smaller microspheres (Johnson et al., 2010). Second, smaller microspheres are more likely to dif-fuse into the soil matrix (Cumbie and McKay, 1999) and become unavailable for mobilization during intermittent flow. Third, the extent of mobilization also depends on the strength of microsphere attachment on the soil grain, in particular on whether or not the microsphere is attached within the primary or secondary minima (Sang et al., 2013). Smaller microspheres are more likely to attach at primary minima at grain surfaces characterized by higher sur-face roughness, where mobilization would be less likely (Saiers and Ryan, 2005; Torkzaban et al., 2010), and larger microspheres are more likely to attach at secondary minima, where they can detach more easily in response to increases in flow velocity (Shen et al., 2007; Tong and Johnson, 2006). It is not clear whether micro-sphere mobilization would increase for colloids sizes beyond 1.8 mm. Further increases in colloid size could cause the larger colloids to settle on pore walls by gravity, which could limit their trans-port (Cumbie and McKay, 1999). Therefore, further study should examine the mobilization of particles with a wide range in size in heterogeneous soils.
The peak in initial microsphere concentration decreased in suc-cessive wetting cycles, possibly because of a diminished supply of
attached microspheres in the macropores or because of aging of the bonds between microspheres and soil surfaces. Each wetting cycle removed a fraction of the microspheres from the pool of micro-spheres within the core. Some microspheres could also diffuse from the macropores into the soil matrix (Schelde et al., 2002), where they would become unavailable for mobilization. Both of these processes could deplete the available pool of microspheres. Bond aging has been attributed to movement of attached microspheres to positions of greater attachment affinity (Weiss et al., 1998).
Environmental ImplicationsWe showed that intermittent rainfall can mobilize microspheres, and the mobilization could be particularly high in soil with greater permeability because of the presence of macropores. However, the transport and mobilization of actual pathogens can vary from that of microspheres (Harvey et al., 1989), possibly due to differences in contact points (Harvey et al., 2011), shape (Aramrak et al., 2013), density (Zvikelsky et al., 2008), and surface properties (Weisbrod et al., 2013). Furthermore, pathogens could lose their virulence and, perhaps, their viability during desiccation; both factors could either decrease or increase the mobilization of viable, infec-tious pathogens. Future study should explore the mobilization of actual pathogens in soil by intermittent flow. Most of the previous studies on pathogen mobilization did not account for the effect of intermittent infiltration events on enhanced mobilization of pathogens. Thus, the risk of groundwater contamination could be higher under natural conditions when a contaminated subsurface is subjected to many intermittent infiltration events instead of a steady wetting condition. The effect of intermittent infiltration events should be incorporated into colloid mobilization models (Michel et al., 2014). Because the advance of the air–water inter-face during intermittent infiltration events enhances colloid mobilization, engineering design such as a saturated layer at the bottom of a stormwater infiltration system—a potential contami-nation source for groundwater— could decrease the mobilization of pathogenic microbes and minimize groundwater contamina-tion (Mohanty et al., 2013). The transport behavior of colloids and pathogens could vary with scale, possibly because of changes in hydrodynamic and chemical conditions (Santamaria et al., 2011). Additionally, colloid mobilization in other soils could vary due to a difference in soil physical heterogeneity. Thus, further studies are needed to repeat these experiments in different types of soil and at varying length scales. Additionally, the degree of dryness in the natural environment could be greater because of an increase in the duration of drying. Drying duration could affect the total amount microspheres or colloids mobilized from the soil (Majdalani et al., 2008). Thus, the extent of mobilization estimated in our study could differ when the drying duration is different.
6ConclusionsThis study evaluated the mobilization of microspheres from a physi-cally heterogeneous soil containing bedding planes and fractures.

Vadose Zone Journal p. 9 of 10
Collecting water samples through a 19-port grid at the base of a soil core, we characterized the soil fraction that contributed water flow at each port and correlated the soil characteristics to microsphere mobilization during intermittent infiltration events. Variations in flux and Br− recovery at five active ports indicated that the soil section that transmitted water to each port differed in permeabil-ity. Permeability varied within different sections of the soil core, possibly because of a heterogeneous distribution of macropores. Comparing the transport and mobilization of colloids among ports, we conclude the following:
• Intermittent flow can effectively mobilize colloids from soilcharacterized by a fine matrix and macropore structure.
• The extent of mobilization increases with soil permeability.
• Larger (micrometer size) colloids are more likely to mobilizeduring intermittent flow.
AcknowledgmentsWe thank the U.S. Department of Energy Environmental Science and Management Program for supporting this research under Grant DOE-FG02-08ER64639. This work is also partially supported by the UPS Foundation, Stanford University, and Re-inventing Nations Urban Wa-ter Infrastructure (ReNUWIt), an Engineering Research Center (ERC) funded by the U.S. Na-tional Science Foundation (Grant no. EEC-1028968). We thank Timothy Dittrich and Mark Serravezza at the University of Colorado at Boulder and Tonia Melhorn and Philip Jardine at the Oak Ridge National Laboratory for assistance during sampling of the soil cores. Any use of trade, firm, or product names is for descriptive purposes only and does not imply endorsement by the U.S. Government.
ReferencesAramrak S. M. Flury and J.B. Harsh. 2011. Detachment of deposited
colloids by advancing and receding air–water interfaces. Langmuir 27:9985–9993. doi:10.1021/la201840q
Aramrak S. M. Flury J.B. Harsh and R.L. Zollars. 2014. Colloid mobilization and transport during capillary fringe fluctuations. Environ. Sci. Technol. 48:7272–7279. doi:10.1021/es501797y
Aramrak S. M. Flury J.B. Harsh R.L. Zollars and H.P. Davis. 2013. Does colloid shape affect detachment of colloids by a moving air–water interface? Langmuir 29:5770–5780. doi:10.1021/la400252q
Beven K. and P. Germann. 1982. Macropores and water flow in soils. Wa-ter Resour. Res. 18:1311–1325. doi:10.1029/WR018i005p01311
Bradford S.A. and S. Torkzaban. 2008. Colloid transport and retention in unsaturated porous media: A review of interface- collector- and pore-scale processes and models. Vadose Zone J. 7:667–681. doi:10 2136/vzj2007.0092
Bradford S.A. S. Torkzaban H. Kim and J. Šimůnek. 2012. Modeling colloid and microorganism transport and release with transients in solution ion-ic strength. Water Resour. Res. 48:W09509. doi:10.1029/2012WR012468
Bradford S.A. S.R. Yates M. Bettahar and J. Šimůnek 2002. Physical fac-tors affecting the transport and fate of colloids in saturated porous media. Water Resour. Res. 38(12):1327. doi:10.1029/2002WR001340
Cey E.E. D.L. Rudolph and J. Passmore. 2009. Influence of macroporosity on preferential solute and colloid transport in unsaturated field soils. J. Contam. Hydrol. 107:45–57. doi:10.1016/j.jconhyd.2009.03.004
Chandra Mouli P. S. Venkata Mohan and S.J. Reddy. 2005. Rainwater chemistry at a regional representative urban site: Influence of ter-restrial sources on ionic composition. Atmos. Environ. 39:999–1008. doi:10.1016/j.atmosenv.2004.10.036
Chen G. J.L. Liu K. Tawfiq K. Yang and C. Banks. 2009. Colloid retention in unsaturated porous media as impacted by colloid size. Part. Sci. Technol. 27:35–49. doi:10.1080/02726350802611754
Clarke R.T. and J. King. 2004. The water atlas. New Press New York.
Craun G.F. J.M. Brunkard J.S. Yoder V.A. Roberts J. Carpenter T. Wade et al. 2010. Causes of outbreaks associated with drinking water in
the United States from 1971 to 2006. Clin. Microbiol. Rev. 23:507–528. doi:10.1128/CMR.00077-09
Cumbie D.H. and L.D. McKay. 1999. Influence of diameter on particle transport in a fractured shale saprolite. J. Contam. Hydrol. 37:139–157. doi:10.1016/S0169-7722(98)00156-9
DeNovio N.M. J.E. Saiers and J.N. Ryan. 2004. Colloid movement in un-saturated porous media: Recent advances and future directions. Va-dose Zone J. 3:338–351. doi:10 2136/vzj2004.0338
El-Farhan Y.H. N.M. DeNovio J.S. Herman and G.M. Hornberger. 2000. Mobilization and transport of soil particles during infiltration experi-ments in an agricultural field Shenandoah Valley Virginia. Environ. Sci. Technol. 34:3555–3559. doi:10.1021/es991099g
Harvey R.W. L.H. George R.L. Smith and D.R. LeBlanc. 1989. Transport of microspheres and indigenous bacteria through a sandy aquifer: Results of natural- and forced-gradient tracer experiments. Environ. Sci. Technol. 23:51–56. doi:10.1021/es00178a005
Harvey R.W. N.E. Kinner D. MacDonald D.W. Metge and A. Bunn. 1993. Role of physical heterogeneity in the interpretation of small-scale laboratory and field observations of bacteria microbial-sized micro-sphere and bromide transport through aquifer sediments. Water Re-sour. Res. 29:2713–2721. doi:10.1029/93WR00963
Harvey R.W. D.W. Metge A. Mohanram X. Gao and J. Chorover. 2011. Differential effects of dissolved organic carbon upon re-entrainment and surface properties of groundwater bacteria and bacteria-sized microspheres during transport through a contaminated sandy aqui-fer. Environ. Sci. Technol. 45:3252–3259. doi:10.1021/es102989x
Hillel D. 2004. Introduction to environmental soil physics. Elsevier Amsterdam.
Jacobsen O.H. P. Moldrup C. Larsen L. Konnerup and L.W. Petersen. 1997. Particle transport in macropores of undisturbed soil columns. J. Hydrol. 196:185–203. doi:10.1016/S0022-1694(96)03291-X
Jardine P.M. G.K. Jacobs and G.V. Wilson. 1993. Unsaturated transport processes in undisturbed heterogeneous porous me-dia: I. Inorganic contaminants. Soil Sci. Soc. Am. J. 57:945–953. doi:10 2136/sssaj1993.03615995005700040012x
Jardine P.M. W.E. Sanford J.P. Gwo O.C. Reedy D.S. Hicks J.S. Riggs and W.B. Bailey. 1999. Quantifying diffusive mass transfer in fractured shale bedrock. Water Resour. Res. 35:2015–2030. doi:10.1029/1999WR900043
Johnson W.P. E. Pazmino and H. Ma. 2010. Direct observations of colloid retention in granular media in the presence of energy barriers and implications for inferred mechanisms from indirect observations. Wa-ter Res. 44:1158–1169. doi:10.1016/j.watres.2009.12.014
Kjaergaard C. P. Moldrup L.W. de Jonge and O.H. Jacobsen. 2004. Col-loid mobilization and transport in undisturbed soil columns: II. The role of colloid dispersibility and preferential flow. Vadose Zone J. 3:424–433. doi:10 2136/vzj2004.0424
Lehmann P. S. Assouline and D. Or. 2008. Characteristic lengths af-fecting evaporative drying of porous media. Phys. Rev. E 77:056309. doi:10.1103/PhysRevE.77.056309
Li X.Q. P.F. Zhang C.L. Lin and W.P. Johnson. 2005. Role of hydrodynam-ic drag on microsphere deposition and re-entrainment in porous me-dia under unfavorable conditions. Environ. Sci. Technol. 39:4012–4020. doi:10.1021/es048814t
Luxmoore R.J. P.M. Jardine G.V. Wilson J.R. Jones and L.W. Zelazny. 1990. Physical and chemical controls of preferred path flow through a forest-ed hillslope. Geoderma 46:139–154. doi:10.1016/0016-7061(90)90012-X
Macler B.A. and J.C. Merkle. 2000. Current knowledge on groundwa-ter microbial pathogens and their control. Hydrogeol. J. 8:29–40. doi:10.1007/PL00010972
Majdalani S. E. Michel L. Di-Pietro and R. Angulo-Jaramillo. 2008. Effects of wetting and drying cycles on in situ soil particle mobilization. Eur. J. Soil Sci. 59:147–155. doi:10.1111/j.1365-2389.2007.00964.x
McCarthy J.F. L.D. McKay and D.D. Bruner. 2002. Influence of ion-ic strength and cation charge on transport of colloidal particles in fractured shale saprolite. Environ. Sci. Technol. 36:3735–3743. doi:10.1021/es025522o
McCarthy J.F. and J.M. Zachara. 1989. Subsurface transport of contami-nants: Mobile colloids in the subsurface environment may alter the transport of contaminants. Environ. Sci. Technol. 23:496–502.
McKay L. A. Harton and G. Wilson. 2002. Influence of flow rate on trans-port of bacteriophage in shale saprolite. J. Environ. Qual. 31:1095–1105. doi:10.2134/jeq2002.1095
McKay L.D. W.E. Sanford and J.M. Strong. 2000. Field-scale migration of colloidal tracers in a fractured shale saprolite. Ground Water 38:139–147. doi:10.1111/j.1745-6584.2000.tb00211 x
Vadose Zone Journal p. 10 of 10
Michel E. S. Majdalani and L. Di-Pietro. 2014. A novel conceptual frame-work for long-term leaching of autochthonous soil particles during transient flow. Eur. J. Soil Sci. 65:336–347. doi:10.1111/ejss.12135
Mishurov M. A. Yakirevich and N. Weisbrod. 2008. Colloid transport in a heterogeneous partially saturated sand column. Environ. Sci. Technol. 42:1066–1071. doi:10.1021/es071780f
Mohanty S.K. J.E. Saiers and J.N. Ryan. 2014. Colloid-facilitated mobiliza-tion of metals by freeze–thaw cycles. Environ. Sci. Technol. 48:977–984. doi:10.1021/es403698u
Mohanty S.K. A.A. Torkelson H. Dodd K.L. Nelson and A.B. Boehm. 2013. Engineering solutions to improve the removal of fecal indicator bac-teria by bioinfiltration systems during intermittent flow of stormwater. Environ. Sci. Technol. 47:10791–10798. doi:10.1021/es305136b
Nielsen M.H. M. Styczen V. Ernstsen C.T. Petersen and S. Hansen. 2011. Distribution of bromide and microspheres along macro-pores in and between drain trenches. Vadose Zone J. 10:345–353. doi:10 2136/vzj2010.0078
Oswald J.G. and M. Ibaraki. 2001. Migration of colloids in discretely frac-tured porous media: Effect of colloidal matrix diffusion. J. Contam. Hy-drol. 52:213–244. doi:10.1016/S0169-7722(01)00159-0
Reedy O. P. Jardine G. Wilson and H. Selim. 1996. Quantifying the dif-fusive mass transfer of nonreactive solutes in columns of fractured saprolite using flow interruption. Soil Sci. Soc. Am. J. 60:1376–1384. doi:10 2136/sssaj1996.03615995006000050012x
Saiers J.E. G.M. Hornberger D.B. Gower and J.S. Herman. 2003. The role of moving air–water interfaces in colloid mobilization within the va-dose zone. Geophys. Res. Lett. 30:2083. doi:10.1029/2003GL018418
Saiers J.E. and J.N. Ryan. 2005. Colloid deposition on non-ideal po-rous media: The influences of collector shape and roughness on the single-collector efficiency. Geophys. Res. Lett. 32:L21406. doi:10.1029/2005GL024343
Sang W. V.L. Morales W. Zhang C.R. Stoof B. Gao A.L. Schatz et al. 2013. Quantification of colloid retention and release by straining and energy minima in variably saturated porous media. Environ. Sci. Tech-nol. 47:8256–8264. doi:10.1021/es400288c
Santamaria J. M.J. Quinonez-Diaz L. LeMond R.G. Arnold D. Quanrud C. Gerba and M.L. Brusseau. 2011. Transport of Cryptosporidium par-vum oocysts in sandy soil: Impact of length scale. J. Environ. Monit. 13:3481–3484. doi:10.1039/c1em10390c
Schelde K. P. Moldrup O.H. Jacobsen H. de Jonge L.W. de Jonge and T. Komatsu. 2002. Diffusion-limited mobilization and transport of natural colloids in macroporous soil. Vadose Zone J. 1:125–136. doi:10 2113/1.1.125
Searcy K.E. A.I. Packman E.R. Atwill and T. Harter. 2005. Associa-tion of Cryptosporidium parvum with suspended particles: Impact on oocyst sedimentation. Appl. Environ. Microbiol. 71:1072–1078. doi:10.1128/AEM.71.2.1072-1078.2005
Shen C. B. Li Y. Huang and Y. Jin. 2007. Kinetics of coupled prima-ry- and secondary-minimum deposition of colloids under unfa-vorable chemical conditions. Environ. Sci. Technol. 41:6976–6982. doi:10.1021/es070210c
Sirivithayapakorn S. and A. Keller. 2003. Transport of colloids in unsatu-rated porous media: A pore-scale observation of processes during the dissolution of air–water interface. Water Resour. Res. 39:1346. doi:10.1029/2003WR002487
Tong M. and W.P. Johnson. 2006. Excess colloid retention in porous me-dia as a function of colloid size fluid velocity and grain angularity. Environ. Sci. Technol. 40:7725–7731. doi:10.1021/es061201r
Torkzaban S. H.N. Kim J. Šimůnek and S.A. Bradford. 2010. Hysteresis of colloid retention and release in saturated porous media during transients in solution chemistry. Environ. Sci. Technol. 44:1662–1669. doi:10.1021/es903277p
Vilks P. and D.B. Bachinski. 1996. Colloid and suspended particle migra-tion experiments in a granite fracture. J. Contam. Hydrol. 21:269–279. doi:10.1016/0169-7722(95)00053-4
Wan J.M. and T.K. Tokunaga. 1997. Film straining of colloids in unsatu-rated porous media: Conceptual model and experimental testing. Environ. Sci. Technol. 31:2413–2420. doi:10.1021/es970017q
Watson K.W. and R.J. Luxmoore. 1986. Estimating macroporosity in a for-est watershed by use of a tension infiltrometer. Soil Sci. Soc. Am. J. 50:578–582. doi:10.2136/sssaj1986.03615995005000030007x
Weisbrod N. O. Dahan and E.M. Adar. 2002. Particle transport in un-saturated fractured chalk under arid conditions. J. Contam. Hydrol. 56:117–136. doi:10.1016/S0169-7722(01)00199-1
Weisbrod N. H. Meron S. Walker and V. Gitis. 2013. Virus transport in a discrete fracture. Water Res. 47:1888–1898. doi:10.1016/j.watres.2013.01.009
Weiss M. Y. Luthi J. Ricka T. Jorg and H. Bebie. 1998. Colloidal particles at solid–liquid interfaces: Mechanisms of desorption kinetics. J. Colloid Interface Sci. 206:322–331. doi:10.1006/jcis.1998.5636
Wilson G.V. and R.J. Luxmoore. 1988. Infiltration macroporosity and mesoporosity distributions on two forested watersheds. Soil Sci. Soc. Am. J. 52:329–335. doi:10.2136/sssaj1988.03615995005200020005x
Zhang W. X. Tang N. Weisbrod and Z. Guan. 2012. A review of colloid transport in fractured rocks. J. Mt. Sci. 9:770–787. doi:10.1007/s11629-012-2443-1
Zhuang J. J.F. McCarthy J.S. Tyner E. Perfect and M. Flury. 2007. In situ colloid mobilization in Hanford sediments under unsaturated tran-sient flow conditions: Effect of irrigation pattern. Environ. Sci. Technol. 41:3199–3204. doi:10.1021/es062757h
Zhuang J. J. Qi and Y. Jin. 2005. Retention and transport of amphi-philic colloids under unsaturated flow conditions: Effect of par-ticle size and surface property. Environ. Sci. Technol. 39:7853–7859. doi:10.1021/es050265j
Zvikelsky O. and N. Weisbrod. 2006. Impact of particle size on col-loid transport in discrete fractures. Water Resour. Res. 42:W12S08. doi:10.1029/2006WR004873
Zvikelsky O. N. Weisbrod and A. Dody. 2008. A comparison of clay col-loid and artificial microsphere transport in natural discrete fractures. J. Colloid Interface Sci. 323:286–292. doi:10.1016/j.jcis.2008.04.035