Mobile Broadband Prices in Europe 2018 - Money.it
85
Digital Single Market Mobile Broadband Prices in Europe 2018 FINAL REPORT and EXECUTIVE SUMMARY A study prepared for the European Commission DG Communications Networks, Content & Technology by:
-
Upload
khangminh22 -
Category
Documents
-
view
0 -
download
0
Transcript of Mobile Broadband Prices in Europe 2018 - Money.it

Digital Single Market
Mobile Broadband Prices in Europe
2018
FINAL REPORT and EXECUTIVE SUMMARY A study prepared for the European Commission DG Communications Networks, Content & Technology by:

This study was carried out for the European Commission by
empirica Gesellschaft für Kommunikations- und Technologieforschung mbH
in cooperation with TÜV Rheinland
Internal identification
Contract number 30-CE-0832069/00-15 SMART number 2016/0045
DISCLAIMER by the European Commission, Directorate-General of Communications Networks, Content & Technology:
The information and views set out in this publication are those of the author(s) and do not necessarily reflect the official opinion of the Commission. The Commission does not guarantee the accuracy of the data included in this study. Neither the Commission nor any person acting on the Commission’s behalf may be held responsible for the use which may be made of the information contained therein.
ISBN 978-92-79-81308-5
doi:10.2759/137481
© European Union, 2018. All rights reserved. Certain parts are licensed under conditions to the EU.
Reproduction is authorised provided the source is acknowledged.

Mobile Broadband Prices in Europe 2018

4
Table of contents Abstract ................................................................................................................................................... 6
0.1 English...................................................................................................................................... 6
0.2 Français .................................................................................................................................... 7
1. Executive Summary ......................................................................................................................... 8
1.1 English...................................................................................................................................... 8
1.1.1 Introduction ..................................................................................................................... 8
1.1.2 Results: Average and least expensive price per OECD usage basket and development of prices 8
1.1.3 Analysis of the results: Least expensive countries in Europe .......................................... 9
1.1.4 Results: The EU compared with selected non-EU countries ......................................... 12
1.2 Français .................................................................................................................................. 12
1.2.1 Résultats: Prix moyen et prix le moins cher par paquet d’usage de l’OCDE et tendance des prix 12
1.2.2 Analyse de résultats: Pays les moins chers de l’UE28 ................................................... 13
1.2.3 Résultats: L’UE28 en comparaison avec des pays non-européens ............................... 16
A note on limitations of the study ......................................................................................................... 17
2. Introduction ................................................................................................................................... 18
2.1 Overall study objectives ........................................................................................................ 18
2.2 Methodology ......................................................................................................................... 18
2.3 OECD price baskets for wireless broadband, voice and messaging services ........................ 18
2.3.1 Introduction ................................................................................................................... 18
2.3.2 Methodology components ............................................................................................ 19
2.3.3 Product inclusion criteria............................................................................................... 20
2.3.4 Price baskets .................................................................................................................. 20
2.3.5 Normalisation of prices for telephony services (OECD 2010) ....................................... 21
2.4 The study methodology ......................................................................................................... 24
2.4.1 Introduction ................................................................................................................... 24
2.4.2 Provider (MNO) and product sampling ......................................................................... 25
2.4.3 Data collection and product inclusion ........................................................................... 25
2.4.4 Extended set of price baskets ........................................................................................ 28
2.4.5 Price normalisation ........................................................................................................ 30
2.4.6 Data collected and cheapest offer ................................................................................ 33

5
2.4.7 Quality assurance .......................................................................................................... 34
3. Key findings ................................................................................................................................... 35
3.1 Mobile prices at a glance ....................................................................................................... 35
3.1.1 Who is best in class? ...................................................................................................... 37
3.1.2 Basket H1 - 100 MB data, 30 calls, 100 SMS ................................................................. 37
3.1.3 Basket H2 - 500 MB data, 100 calls, 140 SMS ............................................................... 37
3.1.4 Basket H3 - 1 GB data, 300 calls, 225 SMS .................................................................... 38
3.1.5 Basket H4 – 2 GB data, 900 calls, 350 SMS ................................................................... 39
3.1.6 Basket H5 - 2 GB data, 100 calls, 140 SMS .................................................................... 40
3.1.7 Basket H6 – 5 GB data, 100 calls, 140 SMS ................................................................... 40
3.1.8 Additional basket H7 – 10 GB data, 100 calls, 140 SMS ................................................ 41
3.1.9 Basket L1, 256 MB ......................................................................................................... 42
3.1.10 Basket L2, 500 MB ......................................................................................................... 43
3.1.11 Basket L3, 1GB ............................................................................................................... 43
3.1.12 Basket L4, 2 GB .............................................................................................................. 44
3.1.13 Basket L5, 5 GB .............................................................................................................. 45
3.1.14 Basket L6, 10 GB ............................................................................................................ 45
3.1.15 Basket L7, 20 GB ............................................................................................................ 46
3.2 Are performances similar between handset-only and data-only usage baskets? ................ 47
3.2.1 Is more mobile data more expensive? .......................................................................... 47
3.2.2 How do prices on different devices compare? .............................................................. 48
3.2.3 What is the impact of equipment on prices? ................................................................ 48
3.3 Price trends............................................................................................................................ 49
3.3.1 Has mobile broadband got cheaper since last year? .................................................... 49
3.4 The bigger picture: the EU in the world ................................................................................ 50
4. ANNEX II – Country Reports .......................................................................................................... 55

6
Abstract
0.1 English The current study provides comprehensive data on 2018 retail prices of mobile broadband offers for consumers in the EU28, Iceland, Norway, Turkey, Japan, South Korea, and the USA. The largest Mobile Network Operators (MNOs) in each country were included. In February 2018, data was collected from provider websites.
Offers were analysed to determine the least expensive offer in each country for each of the standard mobile internet usage baskets defined by the OECD.
To support valid cross-national comparison of retail prices of mobile broadband offers in respect of a usage basket, consistent price normalisation procedures were applied. These take full account of contractual features affecting usage costs such as one-off fees, discounts, contract duration, and limits for telephony call time, numbers of SMS, and data volumes.
Comparing normalised prices in Euro, the inexpensive countries for mobile broadband in the EU are Italy, Poland, Austria, France, the United Kingdom, Luxembourg, and Finland. Prices differ considerably between the least and most expensive countries in the EU. The four most high-priced countries are Cyprus, the Czech Republic, Slovakia, and Greece.
Prices for broadband mobile internet usage in Europe have fallen significantly since 2017.
Comparison of EU28 prices with prices in selected non-EU countries (Iceland, Norway, Turkey, Japan, South Korea, and the USA) in 2018 showed that, on average, mobile broadband in the EU28 is about as expensive as or is more expensive than in the non-European countries, for most of the OECD usage baskets. No offers adapted to the lowest OECD usage levels were found in South Korea and the United States.

7
0.2 Français Cette étude vise à analyser le coût du débit mobile à large bande pour les pays de l’UE28, l’Islande, la Norvège, la Turquie, le Japon, la Corée du Sud, et les Etats-Unis d'Amérique. Pour obtenir des résultats représentatifs, les plus grands opérateurs de réseau mobile (ORM) étaient inclus dans l’échantillon. La collecte de données était effectuée en ligne directement sur les sites web des ORMs en Février 2018.
Les offres ont été analysées pour déterminer l'offre la moins coûteuse par pays et paquet d'utilisation de l'OCDE.
Afin d'analyser systématiquement les données recueillies et de permettre une comparaison transnationale sur le coût due débit mobile à large bande, des procédures de normalisation ont été appliqué. Donc, des détails des forfaits différents, telles que des redevances unique, des réductions, des durées contractuelles différentes ou des différences de téléphonie, messagerie, etc. pouvant être pris en compte.
L’analyse de données a révélé les résultats suivants: En moyenne, les pays le moins cher de l'UE28 concernant le débit mobile à large bande, ce sont l’Italie, la Pologne, l’Autriche, la France, le Royaume-Uni, le Luxembourg et la Finlande. Les prix varient considérablement, indiquant ainsi un large éventail de valeurs. Les quatre pays le plus cher, ce sont la Chypre, la République thèque, la Slovaquie et la Grèce.
En outre, en comparaison avec le jeu de données de 2017, les prix ont baissé de manière significative.
Enfin, comparé aux pays non-européen, le coût de débit mobile à large bande est, en moyenne dans l’UE, aussi ou même plus cher pour la plupart de paquet d’utilisation de l’OCDE. Les plus petits paquets font une exception, car il n’y a pas des offres adaptés aux profiles d’utilisation faible en États-Unis et en Corée du Sud.

8
1. Executive Summary
1.1 English
1.1.1 Introduction
The current study provides comprehensive data on 2018 retail prices of mobile broadband offers for consumers in the EU28, Iceland, Norway, Turkey, Japan, South Korea, and the USA. The two or three largest Mobile Network Operators (MNOs) in each country were included. In February 2018, data was collected from provider websites.
These offers were analysed to determine the least expensive offer per country and OECD usage basket.
To support valid cross-national comparison of retail prices of mobile broadband offers in each usage basket, consistent price normalisation procedures were applied. These take full account of contractual features varying between offers which impact on consumer usage costs, such as one-off fees, discounts, contract duration and limits for telephony call time, numbers of SMS and data volumes uploaded or downloaded.
1.1.2 Results: Average and least expensive price per OECD usage basket and development of prices
Figure 1 shows the average across EU28 Member States of the lowest price found in each Member State, and the lowest price overall, for each of the handset-based OECD usage baskets. Figure 2 displays the EU28 averages and lowest EU28 prices for data-only baskets. In this report, these EU average figures are used in international comparison and as reference when describing the market in an EU Member State.
Figure 1 – EU28 average and least expensive prices for handset-based baskets, VAT included
Basket Least expensive [EUR/PPP]
EU28 average 2018 [EUR/PPP]
EU28 average 2017 [EUR/PPP]
Variation 2017/18
100MB, 30 calls 4.10 12.20 14.11 -14%
500 MB, 100 calls 7.08 16.64 17.62 -6%
1 GB, 300 calls 8.32 22.32 23.62 -6%
2 GB, 900 calls 9.36 29.87 31.39 -5%
2 GB, 100 calls 7.08 20.06 23.93 -16%
5 GB, 100 calls 7.08 25.48 31.80 -20%

9
Figure 2 - EU28 average and least expensive prices for data-only baskets, VAT included
Basket Least expensive [EUR/PPP]
EU28 average 2018 [EUR/PPP]
EU28 average 2017 [EUR/PPP]
Variation 2017/18
250 MB 1.47 7.40 8.18 -10%
500 MB 2.15 7.75 8.97 -14%
1 GB 2.15 9.20 9.65 -5%
2 GB 2.15 11.15 12.66 -12%
5 GB 2.15 16.02 16.74 -4%
10 GB 4.17 20.56 21.77 -6%
20 GB 8.34 27.76 33.12 -16%
Mobile broadband was significantly cheaper in 2018 than in 2017 in all OECD usage baskets.
1.1.3 Analysis of the results: Least expensive countries in Europe
Applying the normalised prices in Euro, measured in PPP, it was discovered that the least expensive countries for mobile broadband in the EU in 2018 were Italy, Poland, Austria, France, the United Kingdom, Luxembourg, and Finland. Prices differ considerably between the least and most expensive countries in the EU.
In the following table (Figure 3), green symbols indicate the cluster1 of countries with the least expensive offers for the usage basket in question and red the cluster with the most expensive offers. Blue and orange are used for the cluster of countries with relatively inexpensive and relatively expensive offers, respectively. When looking at the cluster ratio2, some general observations can be made.
1 k-means clustering was used with k=4; observations (offer categories) are assigned to clusters so as to
minimise the average squared Euclidean distance of observations to each cluster centroid
2 The cluster ratio represents the average of a country's membership in a cluster over all OECD usage baskets. The minimum value is 1, which means that the country is in the cheapest cluster each time; the maximum value is 4, which means that the country is in the most expensive country cluster for each bundle of use.

10
Figure 3 - Clusters of countries by price level over all usage baskets
• Italy, Poland, Austria, France, the United Kingdom, Luxembourg, and Finland have the most attractive prices overall, with a cluster ratio of 1.67 or less.
• Slovenia, Latvia, Estonia, Lithuania, Romania, Sweden, Denmark, Bulgaria, Germany, Spain, Belgium, and the Netherlands follow with a cluster ratio of 2.61 or less. Apart from Bulgaria, Germany, Belgium, Spain, and the Netherlands, these countries have at least two offers belonging to the cheapest cluster
• The next group has very heterogeneous members, with a ratio of 2.9 or less. It includes Ireland, Croatia, Malta, Portugal, Hungary, Greece, Slovakia, and Croatia.
• Spain, Belgium, Ireland, Hungary, Portugal, Hungary, Greece, Slovakia, the Czech Republic, and Cyprus have no offer belonging to the inexpensive cluster.
• No country is in the inexpensive or expensive cluster for all the OECD usage-baskets.

11
Averaging across all OECD usage baskets and distinguishing the four major clusters reveals the pattern shown in the map (Figure 4) below.
• The inexpensive countries are: Italy, Poland, Austria, France, the United Kingdom, Luxembourg, and Finland.
• The relatively inexpensive countries are: Slovenia, Latvia, Estonia, Lithuania, Romania, Sweden, Denmark, Bulgaria, Germany, and Spain.
• The relatively expensive countries are: Belgium, the Netherlands, Ireland, Croatia, Malta, Portugal, Hungary, Greece, and Slovakia.
• The expensive countries are: the Czech Republic and Cyprus.
• No country is in the inexpensive or expensive cluster for all the OECD usage-baskets.
• Spain, Belgium, Ireland, Hungary, Portugal, Hungary, Greece, Slovakia, the Czech Republic, and Cyprus have no offer belonging to the inexpensive cluster.
Figure 4 – Map of country clusters

12
1.1.4 Results: The EU compared with selected non-EU countries
Comparison of EU28 prices with prices in selected non-EU countries in 2018 yielded the following picture:
On average, mobile broadband in the EU28 is about as or more expensive than in the non-EU countries for most of the OECD usage baskets. No offers adapted to the lowest OECD usage levels were found in South Korea and the United States.
1.2 Français Cette étude vise à analyser le coût du débit mobile à large bande pour les pays de l’UE28, l’Islande, la Norvège, la Turquie, le Japon, la Corée du Sud, et les Etats-Unis d'Amérique. Pour obtenir des résultats représentatifs, les deux ou trois plus grands opérateurs de réseau mobile (ORM) étaient incluses dans l’échantillon. La collecte de données était effectuée en ligne directement sur les sites web des ORMs en Février 2018.
Les offres ont été analysées pour déterminer l'offre la moins coûteuse par pays et paquet d'utilisation de l'OCDE.
Afin d'analyser systématiquement les données recueillies et de permettre une comparaison transnationale sur le coût due débit mobile à large bande, des procédures de normalisation ont été appliqué. Donc, des détails des forfaits différents, telles que des redevances unique, des réductions, des durées contractuelles différentes ou des différences de téléphonie, messagerie, etc. pouvant être pris en compte.
1.2.1 Résultats: Prix moyen et prix le moins cher par paquet d’usage de l’OCDE et tendance des prix
La Figure 5 montre les prix moyennes dans l’UE28 et les prix les plus bas observé dans un État membre pour chacun des forfaits combinés ; la Figure 6 montre le même pour les forfaits de données. Ces chiffres moyens de l'UE28 fournissent un point de référence pour la comparaison internationale et, dans une certaine mesure, pour la comparaison des caractéristiques du marché national au sein de l'UE.
Figure 5 – Prix moyens UE28 et les moins chers pour les paniers de combinés, TVA incluse
Paquet Forfait moins cher [EUR/PPP]
Moyenne UE28 2017 [EUR/PPP]
Moyenne UE28 2016 [EUR/PPP]
Variation 2017/18
100 Mo, 30 appels 4.10 12.20 14.11 -14%
500 Mo, 100 appels 7.08 16.64 17.62 -6%
1 Go, 300 appels 8.32 22.32 23.62 -6%
2 Go, 900 appels 9.36 29.87 31.39 -5%
2 Go, 100 appels 7.08 20.06 23.93 -16%
5 Go, 100 appels 7.08 25.48 31.80 -20%

13
Figure 6 - EU28 Prix moyens UE28 et les moins chers pour les paniers de données, TVA incluse
Paquet Forfait moins cher [EUR/PPP]
Moyenne UE28 2017 [EUR/PPP]
Moyenne UE28 2016 [EUR/PPP]
Variation 2017/18
250 Mo 1.47 7.40 8.18 -10%
500 Mo 2.15 7.75 8.97 -14%
1 Go 2.15 9.20 9.65 -5%
2 Go 2.15 11.15 12.66 -12%
5 Go 2.15 16.02 16.74 -4%
10 Go 4.17 20.56 21.77 -6%
20 Go 8.34 27.76 33.12 -16%
Le haut débit mobile était significativement moins cher en 2018 qu’au temps de la dernière exécution de l’étude dans tous les paquets d’utilisation de l’OCDE, sauf le plus petit paquet de données. Toutefois, cette augmentation est principalement attribuable au fait que les marchés développés ne sont pas bien adaptés à ces quotas faibles de données; il a donc fallu accepter des forfaits avec des quotas de données plus élevés pour cette comparaison.
1.2.2 Analyse de résultats: Pays les moins chers de l’UE28
Après la normalisation des prix en euros, mesurés en PPP, il a été conclu que les pays les moins chers pour le haut débit mobile dans l'UE en 2018 étaient l’Italie, la Pologne, l’Autriche, le Royaume-Uni, la Finlande, la France et le Luxembourg. Les prix varient considérablement d'un pays de l'UE à l'autre.
Pour présenter un tableau plus complet, 4 clusters3 de pays ont été identifiés dans chaque paquet d'utilisation, en se basant sur les prix de l'offre la moins chère du paquet d'utilisation OCDE dans chaque pays.
La Figure 7 montre les résultats. Une balle verte dans un paquet d'utilisation indique les pays du cluster avec les offres les moins chères pour cette catégorie, une balle rouge les pays du groupe d'offres le plus cher dans un paquet. Des balles bleues et oranges ont été utilisées pour les groupes de niveaux de prix intermédiaires.
3 L'agrégation k-means a été utilisée avec k=4; les observations (paquets d’utilisation) sont attribuées aux
clusters afin de minimiser la distance Euclidienne moyenne quadratique des observations à chaque centroïde de cluster.

14
Figure 7 - Variations de prix par catégorie d'offre dans l'UE, clusters pays
Les groupes de pays suivants peuvent être observés:

15
• L'Italie, la Pologne, l'Autriche, la France, le Royaume-Uni, le Luxembourg et la Finlande et ont les prix les plus attractifs dans l'ensemble, avec un ratio cluster4 de 1,67 ou moins.
• La Slovénie, la Lettonie, l'Estonie, la Lituanie, la Roumanie, la Suède, le Danemark, la Bulgarie, l’Allemagne et l'Espagne, la Belgique et les Pays-Bas suivent avec un ratio cluster de 2,61 ou moins. À part la Bulgarie, l’Allemagne, la Belgique, l’Espagne et les Pays-Bas, ces pays ont au moins deux offres appartenant au cluster le moins cher
• Le groupe suivant a des membres très hétérogènes, avec un ratio de 2,9 ou moins. Il comprend l’Irlande, la Croatie, le Malte, le Portugal, l’Hongrie, la Grèce, et la Slovaquie.
• L’Espagne, la Belgique, l’Irlande, la Croatie, le Portugal, l’Hongrie, la Grèce, la Slovaquie, la République tchèque et la Chypre n'ont pas d'offre dans le cluster le moins cher.
Moyenner de tous les paniers d'utilisation de l'OCDE et distinguer les quatre clusters révèle la tendance illustrée sur la carte (Figure 8) ci-dessous.
• Les pays peu chers le sont : l’Italie, la Pologne, l’Autriche, la France, le Royaume-Uni, le Luxembourg et la Finlande.
• Les pays relativement peu chers sont: la Slovénie, la Lettonie, l’Estonie, la Lituanie, la Roumanie, la Suède, le Danemark, la Bulgarie, l’Allemagne et l’Espagne.
• Les pays relativement chers le sont: la Belgique, les Pays-Bas, l’Irlande, la Croatie, le Malte, le Portugal, l’Hongrie, la Grèce et la Slovaquie.
• Les pays chers sont: la République tchèque et Chypre.
4 Le ratio cluster représente la moyenne de l'appartenance d'un pays à un cluster sur tous les paquets
d'utilisation de l'OCDE. La valeur minimale est de 1, ce qui signifie que le pays est dans le cluster le moins cher chaque fois; la valeur maximale est de 4, ce qui signifie que le pays est dans le cluster des pays les plus chers pour chaque bundle d'utilisation.

16
Figure 8 - Carte des clusters de pays
1.2.3 Résultats: L’UE28 en comparaison avec des pays non-européens
Comparé aux pays non-UE, le coût de débit mobile à large bande est, en moyenne dans l’UE, aussi ou même plus cher pour la plupart de paquet d’utilisation de l’OCDE. Les plus petits paquets font une exception, car il n’y a pas des offres adaptés aux profiles d’utilisation faible en États-Unis et en Corée du Sud.

A note on limitations of the study
Readers are advised to note some limitations of the information presented in this report:
• Only the two or three largest Mobile Network Operators (MNO) in a country have been included. Although those MNOs combined have a market share of at least 70%, it remains possible that a smaller MNO or Mobile Virtual Network Operator (MVNO) has a less expensive offer for one or more OECD usage baskets.
• The data represents a snapshot of prices at one point in the field-work phase - two weeks in February 2018.
• The usage baskets defined by the OECD may or may not be a good reflection of the actual usage patterns in a country.
• Up to three add-ons/top-ups were included for each tariff. In some markets, consumers willing to research an optimal, larger number of add-ons/top-ups may be able to save a little more.
• This study does not include aspects of quality of service.
• This study only reflects European spectrum prices to the extent that these affect the prices of offers on a national market.
• To match the standard contract duration of 36 months, it is assumed that contracts of 24 months will be extended. To calculate the price of the extension, no discount is applied, as it is not clear today what discount might be offered at that time.

18
2. Introduction
2.1 Overall study objectives The overall objective of the study was to investigate the level of pricing for standardised offers of mobile broadband services in Europe, Norway and Iceland, Turkey, South Korea and Japan, as well as three states of the United States of America (USA) - California, Colorado and New York.
The price of mobile broadband services in any country represents an informative indicator of key developments in electronic communications in the retail market. As such, mobile broadband prices are part of European Commission monitoring exercise in the context of the Digital Single Market strategy, launched in 2015. The monitoring activity is of great relevance to steering policy in this area, providing key resources for an evidence-based approach to policy-making.
The methods applied to investigate mobile broadband prices are aligned to rules set by the OECD, in order to maximise comparability with other sources also following OECD methodology. The OECD approach is based on a defined set of mobile broadband pricing baskets. The method of application of the OECD methodology is detailed in the sections below.
2.2 Methodology This chapter describes the methods applied for the data collection and analysis of retail mobile broadband prices.
The applied methods in this study in order to investigate and compare mobile broadband prices are closely aligned to rules set by the OECD. The OECD approach is based on a defined set of price baskets with a distinct usage pattern of mobile broadband and telephony.
The key methodological reference for collecting, validating and presenting data on offer prices is a 2012 publication by the OECD, which details the construction wireless broadband price baskets. Also, for calculations applying to voice telephony, the 2009 / 2010 revision of OECD baskets is also of some importance. The documents jointly provide clear guidance on normalising prices to ensure comparability.
Though the OECD methodology has been carefully followed, methods, definitions and criteria have been augmented in part to better reflect certain market developments. Methodology additions and adjustments are documented in the section "study methodology" below.
2.3 OECD price baskets for wireless broadband, voice and messaging services
2.3.1 Introduction
The approach taken in this study applies a complementary set of price comparison methodologies published by the OECD.
Each of these methodologies is based on a price basket approach, such that each OECD basket relates to a distinct consumption pattern or type of user. Given a consumption or usage pattern, the prices of corresponding services from a provider can be used to calculate the resulting cost for that

19
type of user. The OECD baskets are reviewed and revised periodically, e.g. for telecommunication services in 2000, 2002, 2005 and 2009 / 2010.
The consumption patterns set for baskets are based on traffic and consumption data collected by the OECD from operators and regulators. The OECD had analysis performed on this data by trusted third parties.
In 2012, the OECD first published a methodology, key to the approach taken in this study, for the price monitoring of wireless broadband across countries and across operators within a country. The approach defines a number of service price baskets for mobile broadband.
Such an approach had been recommended by the Working Party on Communication Infrastructures and Services Policy (CISP)5. Previously, the OECD had published a revised methodology for telecommunication price baskets, which introduced a new set of baskets for fixed broadband services. CISP then recommended that a wireless/mobile version of the broadband baskets be developed to compare wireless broadband prices across countries.
For the telephony component of wireless broadband offers, the 2012 OECD paper referred back to previous work on telephony pricing. In 2010, the OECD published a revision of a set of methodologies designed to compare retail prices of "telecommunication services"6. These services included "mobile services", i.e. mobile telephony and messaging. Similar to the internet methodologies, the comparison should reflect the views of consumers and companies in OECD member countries with their different patterns of use.
Along with detailed data on timing, destination and duration of calls in telephony baskets, the 2010 methodology provided improved realism of price comparisons of telephony offers through:
• a new approach to normalisation of billing units greater than one second and • a new and detailed approach to the effect of discounts applying to customer-selected
numbers, "selective discounts".
2.3.2 Methodology components
The OECD methodology for monitoring and comparing retail mobile broadband prices comprises inclusion criteria for building samples of Mobile Network Operators (MNOs) and their products, for the sources of data to be considered, a set of typical usage patterns defining 15 price baskets and calculation rules for normalising prices across different tariff structures.
In respect of sampling MNOs, the OECD (2012) inclusion criteria are that at least the two largest MNOs be included for each country. Operator size is based on the number of mobile broadband subscriptions an operator reports. If the combined market share of the two largest operators is less than 70%, the third largest operator is also to be included. In 2010, the OECD set slightly different rules for determining the lowest mobile telephony prices in a market, in that the set of two operators should be extended if these have less than 50% of the market share between them.
5 OECD (2012), "Methodology for Constructing Wireless Broadband Price Baskets", OECD Digital Economy
Papers, No. 205, OECD Publishing. http://dx.doi.org/10.1787/5k92wd5kw0nw-en 6 DSTI/ICCP/CISP(2009)14/FINAL

20
2.3.3 Product inclusion criteria
For product selection, the OECD 2012 inclusion criteria are the following:
• Each offer, whatever it may be bundled with, is to include mobile wireless broadband services based on UMTS, HSPA/HSPA+, CDMA2000, IEEE 802.16e or LTE technology. The current leading technology is referred to as "LTE advanced".
• Neither wireless access for fixed use (e.g. LTE at home) nor Wi-Fi hotspot access are considered to be mobile wireless broadband.
• An offer must provide access to the greater Internet via HTTP. Therefore offers are to be excluded which are a "walled garden", provide email-only services or where access to websites, content, and applications is limited to those "offered directly by the MNO and customised for that operator's network and devices".
• Only offers advertised on the operator's website are to be included.
• Any discount brands offered by MNOs are only to be included when the MNO’s website contains a clear link to the discount brand.
• Packages which degrade or stop internet access when the usage allowance is exceeded are to be included only in baskets whose average user requires a volume/time covered by the allowance. Packages which allow extension with a new price or overage charge are to be included for baskets whose average user requirements exceed the allowance.
• Both prepaid and post-paid tariffs are to be included.
• The price for an offer may not include the provision of a laptop, netbook, notebook or tablet device.
• Packages are taken into account in which the price for the service includes an up-front or integrated charge for a modem, e.g. as stick or dongle, provided the customer cannot receive the same service without the device.
• No offers are included which limit time of use in any way: "The methodology will exclude those offers with time-based limitations, for example by the number of monthly hours of use, or daily or weekly offers. Only those offers where the allowance can be freely used over a whole month will be considered. Therefore, the number of hours or days of use per month are not parameters in the methodology."
The approach for mobile telephony (OECD 2010) is similar, requiring that a range of relevant price packages is to be covered, allowing the lowest cost package to be selected for each operator. Here, too, only the price presented clearly as current on the Operator web pages is to be considered. Again, discount brands offered by the MNOs are only to be included when clearly linked with the network operator's website and brand. This publication further specified that offers were to be "typical 2G and 3G services" with the main focus (sic) on voice.
2.3.4 Price baskets
The OECD methodology (OECD 2012) contains the parameters for defining 15 price baskets: 5 baskets for each of three types of devices. The link of baskets to devices resulted from the distinct patterns of use associated with the devices at the time of research; also, unlike smartphones and tablets, broadband access for laptops was mainly by USB key or dongle bundled in offers. Hence, each price basket was linked to one of these devices.

21
All baskets are defined first and foremost by a monthly volume of uploaded or downloaded data considered typical for users. Reflecting usage patterns of the time, handset-based baskets have an allowance of a half to one fifth of the corresponding laptop-based basket.
The OECD makes it clear that, unlike for fixed broadband internet, advertised speed should not be used in the definition of mobile broadband baskets. Instead, the methodology includes simple flagging of offers providing LTE or advertised speeds greater than 20 Mbps.
2.3.5 Normalisation of prices for telephony services (OECD 2010)
Introduction The following sections deal with normalisation of the prices developed for mobile telephony services, subsequently applied where telephony is bundled with mobile broadband data in the "handset-based" price baskets of the mobile broadband methodology.
The OECD provides for normalisation due to variations in plans providing telephony:
• with minute interval billing e.g. a call of 110 seconds costs the same as 115 seconds but 125 seconds costs more;
• offering one or two user-selected numbers which are cheap or free to “family and friends”, i.e. user- selected numbers or "selective discounts";
• charge differently at different times of day or week; • charge differently between calls remaining on the provider’s network - on-net - or
not - off-net; • charge differently for calls to voice box compared to on-net charges; • charge by the number of SMS sent or restrict the number of SMS sent.
The OECD provided the data per user profile basket to weight each of the offer price components, enabling an analysis to arrive consistently at the expected monthly charge for the typical consumer in each handset-based basket.
The calculation of a normalised offer price in mobile telephony baskets, as defined in OECD (2010), proceeds by deducting the value of call and message allowances included in the package from the usage element of the basket, up to the value of actual usage.
Allowances are to be deducted in the following order:
• selective discounts • most restricted minute allowance • least restricted minute allowance • message allowance • value allowance.
Finally, specific volume discounts are deducted.
Telephony usage statistics The data required to normalise offers are provided in the following tables, respectively:
• Voice call destination distribution • Message (SMS) time and destination distributions • Voice call destination distribution • Voice call timing distribution

22
Figure 9 – Voice call destination distribution per basket
Basket No. Calls / month Fixed On-net Off-net Voicemail
1 30 16% 55% 25% 4%
2 100 17% 52% 28% 3%
3 300 14% 46% 37% 3%
4 900 14% 55% 28% 3%
5 40 14% 64% 18% 4%
6 8 8% 55% 25% 12%
Figure 10 – Voice call timing distribution for each basket
Basket No. Day Evening Weekend
1 46% 29% 25%
2 51% 26% 23%
3 49% 32% 19%
4 49% 32% 19%
5 46% 29% 25%
6 46% 29% 25%
Figure 11 – Message (SMS) volume, time and destination distributions for each basket
Basket No. SMS / Month Peak Off-peak On-net Off-net
1 100 66% 34% 53% 47%
2 140 66% 34% 51% 49%
3 225 66% 34% 50% 50%
4 350 66% 34% 50% 50%
5 60 66% 34% 53% 47%
6 400 66% 34% 50% 50%

23
Figure 12 – Voice call duration by destination network / service in minutes per call
Basket No. Fixed On-net Off-net Voicemail
1 2.0 1.6 1.7 0.9
2 2.1 1.9 1.8 1.0
3 2.0 2.0 1.8 1.0
4 1.9 2.1 1.9 1.1
5 1.9 1.9 2.0 0.9
6 1.6 2.2 1.6 1.1
Correcting for long billing units In the 2010 OECD paper revising the methodology for comparing retail prices of telecommunication services, a new method of accounting was introduced for different call billing units (e.g. seconds or minutes) for both PSTN services and calls in mobile baskets.
Previous to the 2009 / 2010 revision, calls of various durations were simply rounded up to the next billing increment. An average call duration of 75 seconds was costed at 2 units (120 seconds) for tariffs with per-minute billing and as 75 units (75 seconds) only for tariffs with per-second billing.
This previous approach introduced distortions in comparisons. A basket defined with an average call duration just over the billing increment of a tariff would incur a larger rounding up to reach the next increment, while a call just under the billing increment of a particular tariff would attract a correspondingly small addition to call cost. As the OECD authors note, "the effect was somewhat arbitrary".
The improved accounting introduced in 2009 provided a method to calculate the average overcharge over all customers with the same average duration.
In this new method, a price per second is the basis of the calculation in all cases, regardless of the billing increments (billing unit duration). For a tariff with 60 second billing increments the price per second is simply the price per unit divided by 60. Given a flat distribution of call duration, the average overrun is half the billing increment less one second, that is for a 1 minute increment, (60-1)/2 seconds.
This means that an average call duration of 75 seconds in a tariff with 60 second billing is costed at 75 + (60-1)/2 seconds times the fictitious per-second price - unit price/60.
The general rule for costing a call basket is:
(average basket call duration + (billing increment -1) / 2 ) * unit price / billing increment
Call duration and billing increment (N in OECD notation) are measured in seconds; unit price is the price for exceeding the next billing increment.

24
Thus the 2009 revision changes the calculation to use the average duration defined by the basket, and then add an element related to the billing method and distribution.
Measuring the cost impact of selective discounts In the 2010 OECD paper, a new method was also introduced to account for the impact of selective discount plans on consumer costs.
Selective discounts allow users to specify a certain number of destination telephone numbers to which calls and/or messages will be free or discounted. There are many brand names for the plans the OECD refers to as selective discounts, such as "Friends and Family" or simply "Preferred numbers".
The OECD, working with operators, developed an empirical function for estimating the impact of selective discount plans, based on data on the distribution of calls between numbers in some consumer populations.
The increase in traffic to such numbers that selective discounts trigger is not taken into account in basket calculations.
The empirical function is presented here in two parts. The first provides a proportion, A, "that resembles the amount of calls going to nominated numbers in the data received from operators" in the 2009 OECD basket review, and the second delivers V2, the number of minutes going to the nominated numbers, that is, the amount that will be deducted because of the selective discount:
A = Log(10 x N1.5 ) / Log(10 x V)
V2= V1 x A x D
Where
V is the total number of minutes for all calls in the basket
N is the number of target telephone numbers the discount applies to
D (0...100%) is the discount D in percent applying to a call to a discounted target number with D=100% being a free call
V1 is the total number of minutes defined by the basket
2.4 The study methodology
2.4.1 Introduction
The methods applied in the study closely follow the methods proposed by OECD (2012). MNO sampling and product inclusion criteria were applied to generate a full database of mobile broadband service offers for each of the countries covered. The price-basket approach and price normalisation rules, including telephony price normalisation OECD (2010), were then applied to making offer prices comparable within and across countries. Some extensions and modifications to the OECD proposals were made, as documented in the following sections.

25
2.4.2 Provider (MNO) and product sampling
In line with the OECD specification, at least the two largest MNOs were included for each country, based on the number of mobile broadband subscriptions. As specified in OECD (2012), if the combined market share of the two largest operators was less than 70%, the third largest operator was also included.
A list of MNOs following these rules was drawn up by the European Commission, and National Regulatory Authorities (NRAs) were given the opportunity to verify the entries for their Member State.
For each of the MNOs selected, data on all relevant mobile broadband products offered to residential consumers was collected. Relevant products are those meeting the (modified) OECD inclusion criteria included both stand-alone broadband and offers also permitting mobile voice telephony and mobile messaging.
2.4.3 Data collection and product inclusion
Data was gathered and collected online in a period of two weeks in February 2018. Only offers advertised and purchasable on the websites of the respective MNOs were included in the sample. Also and more specifically, only prices clearly presented as current on the Operator web pages were considered.
The OECD product inclusion criteria were applied.
The following extensions or modifications were made to the OECD methodology for product inclusion:
• All offers were to be at least 3G (3G, 4G, LTE and LTE advanced). • Handset-based offers were taken to be such permitting voice telephony, regardless of
whether a smartphone or other device was bundled into the offer or only a SIM card provided.
• For all packages, tariffs included were exclusively residential, single user offers. Business offers were not considered.
• Offers with multiple SIM cards were included only if no extra charge was made for the additional SIM cards.
For each mobile broadband product, information was collected on all the data items required to apply the adapted OECD rules, in particular to be able to allocate each such offer to the correct mobile broadband basket and to carry out calculation of the normalised monthly price.
The data was collected from the websites of the MNOs.
Electronic copies of the web pages (screenshots) were kept from which tariff information is collected.
Discounts or other commercial advantages visible on the MNO websites were taken into account both
• in determining the way to calculate the normalised monthly price and • to apply OECD rules (as detailed / modified above) whether to include an offer in the
comparison. The table below lists the items which were documented for every offer.

26
Table 13 – List of data items captured for each offer
Characteristic of offered service Categories, units and remarks
Country Data set comprising: Country abbreviation; EU, non-EU; currency; (integer) Euro exchange rate; VAT rate (integer) percent.
MNO Data set comprising: Name (free text); incumbent (yes/no)
Name Name on web presentation (free text)
Geographical coverage Categories: national, regional, some cities, one city, other
Bundled devices Categories: Handset, 2 or more SIMs, modem as USB stick or dongle, other
Handset name Manufacturer and model of bundled handset, selected from a set list of 3-5 advanced or 3-5 basic models.
Advanced: Samsung Galaxy S8, Sony Xperia XZ, Huawei Mate 10, HTC 10, other.
Basic: Samsung Galaxy A3, Huawei P10 lite, other.
Handset price bracket Categories: basic and advanced
Technology Categories: UMTS, HSPA (+), CDMA 2000, IEEE 802.16e, LTE standard, LTE advanced, Other
Speed Speed of offer (up to 12, 12 - 50, more than 50 Mbps).
Top speed available Speed of highest speed offer otherwise identical to the offer recorded (price is not recorded).
Volume cap Volume in GB (integer).
Extension offered Whether the cap can be exceeded at full speed with a surcharge or not (yes/no).
Unavoidable degradation "Fair use" policy such that exceeding the volume cap leads to unavoidable service quality degradation (yes/no). If yes, baskets of higher volume than the cap are not eligible offers.
Price of volume over cap Price in local currency per GB over cap volume

27
Characteristic of offered service Categories, units and remarks
(overage) at normal service quality (integer).
Maximum volume surcharge The maximum charge levied through the price of volume over cap, if applicable, local currency (integer).
Contract duration Duration in months (integer).
Recurring charges (time-dependent charges)
Charge in local currency per month7 (integer).
Non-recurring charges (up-front charges)
Charge in local currency including all one-off charges imposed at the outset of a contract, if any, e.g. for a modem device or SIM (integer).
Time-based discounts Discount in local currency per month (integer). Only discounts are recorded which apply to all customers on the first day of the fieldwork.
Up-front discounts Discount in local currency applicable to all customers on the first day of the fieldwork (integer).
Bundled web / cloud space Web or cloud space provided without additional charge in GB (integer).
Mobile telephony Data set comprising for each price category the number of free call minutes and SMS, the charge per additional minute/second and SMS, and the call billing unit in seconds. Tariff price categories are destination (on-net, off-net, fixed), time (day, evening, weekend, voicemail) for calls and for SMS peak hours (peak/ off-peak).
Hotspot (wifi) access Hotspot provision at any scale (yes/no)
VOIP permitted/supported (yes/no)
Zero rated services Audio/video streaming, social media
EU roaming included (yes/no)
7 These include any charge which the service customer necessarily incurs to receive the offered service,
which increases in proportion to the time period the offered service is provided (not one-off charges), and is paid at regular intervals, including in particular rental charges for required equipment, if any and any repeated base ISP charge. The most easily and publicly accessible, time-dependent price for the service is applied, regardless of which payment or billing method is linked to this price. Charges for periods other than a month are converted proportionately to the charge for one month. Irregular charges are treated as a mixture of regular recurring charge and non-recurring charge.

28
Characteristic of offered service Categories, units and remarks
Roaming limitations Countries (yes/no), volume (yes/no), days (yes/no)
Selective discounts Data set comprising for each price category in the mobile phone plan the number of numbers to which calls are discounted and the discount applied.
Other items included which are of significant value to consumers
(free text)
2.4.4 Extended set of price baskets
Given developments in the market since 2012, towards higher volume usage levels, the number of baskets was extended by 2 for each device, to enable comparison of offers at significantly higher volumes.8
In line with the OECD, advertised download speeds were not taken into account. In many cases there is no advertised speed or users experience different, typically lower, actual speeds. As recommended, the use of LTE and offers advertising speeds greater than 20 Mbps are flagged.
The volume requirements for the resulting 21 baskets are given in the following table.
Figure 14 – Volume requirements of the 21 (15) mobile broadband baskets
Basket numbers
Laptop use Tablet use Handset use
L1, T1, H1 0.5 GB 0.25 GB 0.1 GB
L2, T2, H2 1 GB 0.5 GB 0.5 GB
L3, T3, H3 2 GB 1 GB 1 GB
L4, T4, H4 5 GB 2 GB 2 GB
L5, T5, H5 10 GB 5 GB 2 GB
L6, T6, H6 20 GB 10 GB 5 GB
L7, T7, H7 50 GB 20 GB 10 GB
8 New OECD baskets were published in late December 2017, these may be taken into account in the 2019 price
monitoring

29
In respect of handset baskets, baskets are additionally specified in terms of numbers of mobile calls and use of SMS. The following table shows the number of calls in the user profile for each basket for handset use:
Figure 15 – Number of mobile calls in handset-based baskets
Basket numbers
Handset volume Handset calls
H1 0.1 GB 30 calls
H2 0.5 GB 100 calls
H3 1 GB 300 calls
H4 2 GB 900 calls
H5 2 GB 100 calls
H6 5 GB 100 calls
H7 10 GB 100 calls
Application of the OECD approach also assigns monthly quantities of SMS to each basket, as shown below9. The basket containing no SMS is intended to reflect users having moved away from this service to (instant) messaging apps.
Figure 16 – Number of SMS in handset-based baskets
Basket numbers
Handset volume Handset messages
H1 0.1 GB 100 SMS
H2 0.5 GB 140 SMS
H3 1 GB 225 SMS
H4 2 GB 350 SMS
H5 2 GB 140 SMS
9 It is assumed that both the "100 call" baskets, with 0.5 GB and 2 GB of volume, refer to the same basket of
mobile voice calls and SMS numbers in the 2009/2010 basket definition.

30
H6 5 GB 140 SMS
H7 10 GB 0 SMS
2.4.5 Price normalisation
Overall approach To arrive at comparable prices despite complex and varying tariffs, the OECD (2012) requirements were followed, in particular:
• inclusion of a number of charge elements, specifically "connection (one-off) charge, monthly rental charge, usage allowance (time or volume) and overage charges (i.e. charges above the subscriber's monthly limit)" and
• depreciation of non-recurring price elements over three years.
On completion of the data collection, the dataset was analysed to adjust or normalise the prices calculated, following these and further rules, and according to the detail of offer conditions. This allowed a standard monthly price to be determined for each offer which takes fully into account both non-recurring and recurring / monthly charges, and usage charges, adjusted or normalised for mode of capping, contract duration, pre-paid model, billing unit duration, discounts and other commercial characteristics. Non-recurring charges include initial cost elements, such as activation, installation, sending costs, buying or renting of material (smartphone, modem, software), etc.
For offers with the option to either buy or rent the required equipment, the cheaper of the two options was used.
To make offers with a shorter contract duration comparable, the calculation was carried out based on the customer keeping the broadband service for a duration of at least 36 months. Any charge levied for the extension of a contract, e.g. from 24 to 36 months, was not taken into account, whether or not a new device are provided on contract renewal.
Offers which are limited in volume for internet access or time for telephony or both must be normalised to reflect the additional costs to consumers of regularly exceeding the threshold. A surcharge on the monthly charge was calculated. For broadband services, overage costs cover additional volume and for telephony services, the surcharge was for the additional costs charged for exceeding call time thresholds.
In some cases, a maximal charge was advertised for additional time or download volume, or the total invoice was limited to some maximum. If this maximum charge was lower than the normalised charge, the maximum charge was taken.
The calculation of a normalised offer price in mobile telephony baskets closely follows OECD (2010). Allowances were deducted in the prescribed order:
• selective discounts • most restricted minute allowance • least restricted minute allowance • message allowance

31
• value allowance • specific volume discounts.
Selective discounts were calculated as described above. Compensation for longer billing unit lengths was applied, using OECD data on call distributions. Off-net mobile-to-mobile charges were weighted according to subscriber numbers for each country, where relevant for the pricing of calls.
Further details of price normalisation are provided in the following section.
Long billing units The OECD (2010) approach to normalising tariffs with long billing units is a considerable improvement over previous work. The assumption of a flat distribution of call durations diverges from the real distribution, however, compared to the previous method, this technique certainly comes closer to what groups of consumers are actually charged and was applied for tariffs with a fixed billing unit longer than one second.
An additional rule applied for adjusted call durations shorter than the billing unit, where the full price of one billing unit was considered as the cost of the call.
Any call set up charge was also added to the cost per call.
Minimum call length A new normalisation technique was developed for the now-common pricing practice of setting a long first billing unit or minimum call length, typically one minute. These tariffs have a cost impact on bundles of calls, as some of these will be shorter than the minimum length charged.
The method applies an exponential distribution of call lengths. For a minimum billed call length of 1 minute, followed by one-second increments, the proportionate increase in billed duration compared to per-second billing is then given by
1𝜇
- ( 1 - 𝑒−1𝜇 )
where 𝜇 is the average duration of calls in a basket.
Selective discounts The method to compensate for selective discounts designed by the OECD was applied. Using the formula V2= V1 x A x D described above, mapping information was used to indicate which call types were affected by the discount. V2 was then used to calculate the number of minutes to be deducted from the basket minutes according to the call type mapping. V2 was distributed to the specific call types according to the selective discount mapping, so that each call type had between zero and V2 minutes to be deducted. The cost of remaining minutes was then calculated as usual. The selective discount was taken before any minute, message and value allowances included in the package.
Where discounted SMS were offered as part of the discount they were deducted using the same value A from the formula, and the relevant discount applicable to the SMS.
Bundled handsets and other equipment For each service available with a bundled handset, where possible, the offer prices were captured for both a basic handset and a high-price handset. For this purpose, a list of manufacturers' models

32
assigned to the basic and high-price handset categories was generated in advance of fieldwork. Where the same service was available without a handset ("SIM only"), this price was captured in the database.
Volume capping and fair use policies Excess usage beyond the data allowance of an offer may result in disconnection, throttling of speed and/or overage charges. The OECD methodology considers excess usage, i.e. beyond data allowances included in the offer, in one of two ways:
• "If throttling is used the tariff is excluded from the results if the basket volume exceeds the allowance. This will also apply if both throttling and overage charges are applied to a given offer. In this regard, throttling practices specified by acceptable use policies (AUPs) will also be considered.
• If excess usage results in overage charges the additional cost is added to the total as a usage element to pick the level of usage specified in a basket."
Following this, packages which degrade or stop internet access when the usage allowance is exceeded were included only in baskets whose average user requires a volume/time covered by the allowance.
Packages which allow extension with a new price or overage charge were included for baskets whose average user requirements exceed the allowance, with normalisation of the price to include the additional price. Where an offer provided the option of extending use at the original speed with an overage charge, overage charges were added to the price, to properly reflect the cost of using the basket data volume under the tariff rules of the offer.
Non-recurring charges Non-recurring (one-off) charges include initial cost elements, such as activation, packaging and postal costs, buying or renting of material (modem, handset, software), etc.
The stipulation of a standard contract duration (SCD) enables the consistent translation of one-off costs into monthly amounts and vice versa.
Using the SCD and the discount rate, non-recurring charges were converted to a "spread charge", a constant monthly amount over the SCD, such that the net present value of the spread charge equals the total of non-recurring charges incurred at the beginning of the contract.
Given the expected economic climate of 2018, and following previous practice, a discount rate of zero was applied. This is also in line with the OECD distribution rule, which is implicitly zero percent discounting - distributing fixed costs proportionately over 36 months.
Contract duration Based on the previous study and the guidance provided by the OECD, the standard contract duration (SCD) for 2016 was set at 36 months. Thus, normalisation was required for contracts being longer or shorter than SCD.
Short contracts: For offers with a shorter contract duration than 36 months, normalisation was carried out based on the precondition that a customer would renew the contract to maintain the service for at least 36 months. The normalised price for contracts of duration shorter than 36 months was calculated in the same way in principle as for a contract of 36 months. Finally, any non-recurring

33
charges made on extension of a short contract were discounted back to the beginning of the first contract before being added to the non-recurring charges and spread over the full 36 months.
Long contracts: If a contract could only be extended for a fixed period, then exceeding SCD, charges for the period after SCD were discounted back to the start of the first contract.
Other discounts and charges Discounts are given by providers on up-front (non-recurring) charges, e.g. equipment, activation and/or installation charges, and / or on the recurring charges, monthly fee or other time-based charge. All types were taken into account. The rules for taking discounts into account are intended to provide an unbiased estimate of the tariff prices an average new customer would have agreed to, when purchasing a mobile broadband service in the fieldwork period. The rules applied were:
• For promotional discounts, that is, only valid for a limited period, the full value of a discount was applied regardless of any opinion as to whether the discount was one-off or likely to be repeated.
• Discounts for ordering online were applied in full. • Where discounts were offered or extra charges applied for billing and payment
method (e-invoicing, electronic payment, direct debit, paper billing, cash, credit card, cheque, etc.), the most easily publicly accessible price for the service was recorded and applied, regardless of which payment or billing method was linked to this price.
• All charges a customer cannot avoid, including contributions to Universal Service provision or TV contributions for settling author rights and local taxes or fees, etc. were taken fully into account as part of the tariff for the mobile broadband service.
• Where options were given to either buy or rent required equipment, the less expensive variant was taken into account. Usually, due to the extrapolation on the SCD of 36 months, buying the required equipment was less expensive than renting it.
• Targeted discounts applicable only to certain types of customers such as students or disabled people, and discounts for grouped subscriptions were not included.
• All commercial advantages (e.g. with promotional intent) which directly affected the price or the basket classification, including but not limited to free call minutes, increased download limits, or increased download speeds, were taken into account. Commercial advantages which had no effect on price or basket classification, such as access to Wi-Fi hotspots, were recorded, but not included in price normalisation.
• Finally, discounts only applicable in the first period after contract conclusion, e.g. in the first month of a contract, were taken into account but averaged over the SCD of 36 months.
2.4.6 Data collected and cheapest offer
The cheapest offer per price basket and country was determined based on the normalised price for each offer in all the baskets for which it was eligible.
The least expensive offer recorded for a price basket in a country was allowed to be an offer providing a greater data volume, call number and/or SMS volume than that specified in the basket, if such an offer was cheaper than all offers providing only the basket amounts.

34
2.4.7 Quality assurance
In order to obtain solid results, the gathered data was thoroughly checked and subsequently prepared for the statistical analysis, beginning with normalisation procedures.
The following table summarises techniques applied to ensure high quality of all statistical data:
Figure 17 – Summary of automated and manual checks on statistical data
Across data sets (EU-wide) Within one data set (Member State)
Automated • Outlier analysis o Highlighting if certain
values differ significantly from expected values
• Checks on plausibility of data within one Member State data set
o Highlighting of duplicates
o Highlighting of non-numeric values
o Highlighting of higher volumes at lower prices at same MNO
Manual • Checking data completeness o Coverage of all
Member States o Coverage of
necessary MNOs o Coverage of market
share
• Cross check of collected 2018 products with data from last collection (Mobile Broadband Prices 2017)
o for each Member State
o for each MNO

35
3. Key findings
3.1 Mobile prices at a glance In the following table, green symbols indicate the cluster10 of countries with the least expensive offers for the usage basket in question and red the cluster with the most expensive offers. Blue and orange are used for the cluster of countries with relatively inexpensive and relatively expensive offers, respectively.
Figure 18 - Major clusters of countries by price level in each usage basket
10 k-means clustering was used with k=4; observations (offer categories) are assigned to clusters so as to
minimise the average squared Euclidean distance of observations to each cluster centroid

36
Figure 19 - Major clusters of countries by price level over all usage baskets
Averaging across all OECD usage baskets and distinguishing the four major clusters reveals the pattern shown in the map (Figure 19) above.
• The inexpensive countries are: Italy, Poland, Austria, France, the United Kingdom, Luxembourg, and Finland.
• The relatively inexpensive countries are: Slovenia, Latvia, Estonia, Lithuania, Romania, Sweden, Denmark, Bulgaria, Germany, and Spain.
• The relatively expensive countries are: Belgium, the Netherlands, Ireland, Croatia, Malta, Portugal, Hungary, Greece, and Slovakia.
• The expensive countries are: the Czech Republic and Cyprus.
• No country is in the least expensive or most expensive cluster for all the OECD usage-baskets.

37
The averaging technique applied here may be seen as giving prices for low-end usage baskets too great a weight. If, in contrast, only the higher-end usage baskets are taken into account, some countries change position. In particular, Denmark and Sweden move up the table. Here, MNOs offer reasonably-priced tariffs for unlimited data, messaging and telephony, but do not offer lower tariffs for capped usage, as do MNOs in many countries.
3.1.1 Who is best in class?
The subsequent sections show graphs comparing the prices of least expensive offers in each country found for each OECD price / usage basket. An additional basket for pricing data volume usage of 5 GB was added to the OECD baskets to better reflect growing customer data requirements.
3.1.2 Basket H1 - 100 MB data, 30 calls, 100 SMS
Prices of least expensive offers by country for the usage basket containing 0.1 GB data, 30 calls, and 100 SMS, shown in the chart below, range between 4.10 EUR/PPP in France and 28.91 EUR/PPP in Bulgaria. The EU average is 12.20 EUR/PPP. Prices in 25 of the countries are between 5 and 20 EUR/PPP, with only France being below this range (4.10 EUR/PPP). The most expensive countries are the Czech Republic at 22.12 EUR/PPP, Hungary at 27.43 EUR/PPP, and, finally, Bulgaria with 28.91 EUR/PPP for the cheapest offer. The five largest Member States (France, Germany, Italy, Spain, and the United Kingdom) are below the EU average for this usage basket.
3.1.3 Basket H2 - 500 MB data, 100 calls, 140 SMS
The price distribution chart for the usage basket with 0.5 GB data, 100 calls, and 140 SMS displays the EU average at 16.64 EUR/PPP.11 The prices for the least expensive offers in this basket range
11 The offer from Greece is quite complex in the sense that it requires the combination of several
packages/add-ons

38
from 7.08 EUR/PPP in Italy to 38.76 EUR/PPP – more than five times as much – in Bulgaria. The distribution shows a steady incremental increase in prices from the lowest price found up to and including Ireland at 19.60 EUR/PPP. The remaining five countries, with notably higher prices in this basket, start with Slovakia, Malta, and Hungary. These countries, exhibiting prices between 30.45 and 33.73 EUR/PPP, are cheaper only in comparison with the Czech Republic and Bulgaria at 37.48 EUR/PPP and 38.76 EUR/PPP respectively. The prices found for this usage basket in the five largest Member States (France, Germany, Italy, Spain, and the United Kingdom) are below the EU average.
3.1.4 Basket H3 - 1 GB data, 300 calls, 225 SMS
The chart for the least expensive offers in the usage basket containing 1.0 GB data, 300 calls, and 225 SMS, below, illustrates the EU average at 22.32 EUR/PPP. Starting at the lower price end, five countries (Luxembourg, Italy, Slovenia, Austria, and France) have prices below 10 EUR/PPP. 17 countries show prices between 10 EUR/PPP and 30 EUR/PPP. At the high-end section of the chart, five countries (the Czech Republic, Slovakia, Hungary, Greece12, and Bulgaria) have prices between 40 EUR/PPP and 60 EUR/PPP. As in baskets for lower usage, prices in the five largest Member States (France, Germany, Italy, Spain, and the United Kingdom) are all below the EU average.
12 See above

39
3.1.5 Basket H4 – 2 GB data, 900 calls, 350 SMS
The chart for the usage basket with 2.0 GB data, 900 calls, and 350 SMS shows the EU average at 29.87 EUR/PPP. At the most expensive end of the table, two countries stand out: Greece at 111.02 EUR/PPP followed by Bulgaria13 at 87.48 EUR/PPP, followed in turn by Hungary at 60.25 EUR/PPP. 22 of the 28 MS in the EU have a least expensive offer for this basket lying between 9 EUR/PPP and 40 EUR/PPP. Half of the EU Member States (14/28) have least expensive offers below 20 EUR/PPP.
13 According to the national regulator, the use of SMS is rather uncommon in Bulgaria, so that few if any
consumers in Bulgaria would be subject to these prices.

40
3.1.6 Basket H5 - 2 GB data, 100 calls, 140 SMS
The prices for the least expensive offers in the usage basket containing 2.0 GB data, 100 calls, and 140 SMS are between 7.08 EUR/PPP in Italy and 44.19 EUR/PPP in the Czech Republic with the EU average at 20.06 EUR/PPP.14 22 of the 28 Member States have least expensive offers between 7 EUR/PPP and 30 EUR/PPP, while Cyprus at 30.40 EUR/PPP connects with the top five countries above 40 EUR/PPP. These are led by the Czech Republic at 44.19 EUR/PPP, Slovakia at 42.47 EUR/PPP and Hungary at 39.75 EUR/PPP. As in most other baskets, the five largest EU Member States (France, Germany, Italy, Spain, and the United Kingdom) are situated below the EU28 average.
3.1.7 Basket H6 – 5 GB data, 100 calls, 140 SMS
The lowest price in the usage basket with 5.0 GB data, 100 calls, and 140 SMS is found in Italy: 7.08 EUR/PPP. The most expensive price is in Slovakia at 54.49 EUR/PPP. 20 countries offer options below 30 EUR/PPP and 13 countries have offers that cost less than 20 EUR/PPP. Italy, Slovenia, and France show the cheapest offers, all below 10 EUR/PPP. The EU average in this basket is 25.48 EUR/PPP.15
14 The offer from Greece is quite complex in the sense that it requires the combination of several
packages/add-ons.
15 The offer from Greece is quite complex in the sense that it requires the combination of several packages/add-ons.

41
3.1.8 Additional basket H7 – 10 GB data, 100 calls, 140 SMS
The chart for the usage basket with 10 GB data, 100 calls, and 140 SMS shows the EU average at 34.75 EUR/PPP16. The nine countries above the EU average are above 40 EUR/PPP. Of these nine more expensive countries, prices in Spain and Portugal remain below 45 EUR/PPP while prices in Bulgaria, Malta, the Czech Republic, and Hungary fall below 65 EUR/PPP. The two most expensive countries in this basket are Cyprus at 91.21 EUR/PPP followed by Slovakia at 90.55 EUR/PPP. On the other end of the spectrum, ten countries were found to have offers below 20 EUR/PPP available on the market, France and Italy even below 10 EUR/PPP - the cheapest in the EU28.
16 The offer from Greece is quite complex in the sense that it requires the combination of several
packages/add-ons.

42
3.1.9 Basket L1, 256 MB
In the smallest data-only usage basket, the least expensive offer comes from Finland at 1.47 EUR/PPP, followed by Italy (2.15 EUR/PPP), Luxembourg, and Poland (both 4.17 EUR/PPP). The EU28 average is 7.40 EUR. Croatia (11.49 EUR/PPP), Malta (12.18 EUR/PPP), and Ireland (14.47 EUR/PPP) are the countries with the most expensive offers in this basket. However, these high figures are mostly due to the fact that offers adapted to such small data volumes are not offered by the largest MNOs in certain countries, so that customers with this low usage profile must accept the price of offers providing more data volume.

43
3.1.10 Basket L2, 500 MB
The least expensive offer in the 500 MB data-only basket comes from Italy (2.15 EUR/PPP), followed by Finland (2.80 EUR/PPP), Poland (4.17 EUR/PPP), and Hungary (4.87 EUR/PPP). The EU28 average reaches 7.75 EUR. As in the 256 MB basket, no special low-usage offers were found from MNOs in the most expensive countries, so that the least expensive offers in those countries include a larger data allowance (usually 1GB) than required by a consumer with this OECD user profile.
3.1.11 Basket L3, 1GB
Again, the least expensive offer comes from Italy (2.15 EUR/PPP) followed by Poland (4.17 EUR/PPP), Austria (5.35 EUR/PPP), and Finland (5.47 EUR/PPP). The EU28 average is 9.20 EUR.17
17 The offer from Greece was not actively promoted on the website at the time of the data collection but it
was available as confirmed by the Greek NRA.

44
3.1.12 Basket L4, 2 GB
Italy leads this basket with 2.15 EUR/PPP, followed by Poland (4.17 EUR/PPP), and Bulgaria (6.46 EUR/PPP). Prices for the least expensive offer from the next twelve countries are very close, ranging from 7.38 EUR/PPP in the United Kingdom to 9.62 EUR/PPP in Finland. The EU28 average is 11.15 EUR, the premium for doubling data from 1 GB to 2 GB is just under two EUR.18
18 The offer from Greece was not actively promoted on the website at the time of the data collection but it
was available as confirmed by the Greek NRA.

45
3.1.13 Basket L5, 5 GB
The lowest-price lead in this usage basket is, again, Italy (2.15 EUR/PPP), followed by Poland (4.17 EUR/PPP) and Sweden (8.06 EUR/PPP). Six more countries (Slovenia, Latvia, Austria, France, Estonia, and Finland) have prices below 10 EUR/PPP. The EU28 average is 16.02 EUR/PPP. Almost all countries except one exhibit prices under 30 EUR/PPP. The most expensive market is Cyprus, where the price of the least expensive offer is 43.29 EUR/PPP.
3.1.14 Basket L6, 10 GB
Poland is the cheapest country in this basket, with an MNO offering 10 GB mobile data for 4.17 EUR/PPP. Poland is followed by Italy (5.06 EUR/PPP), Slovenia (8.88 EUR/PPP), and Latvia (8.90 EUR/PPP). Seventeen countries are below 20.00 EUR/PPP; ten countries exhibit prices between 20.00 EUR/PP and 40.00 EUR/PPP. The most expensive market here is Cyprus (63.05 EUR/PPP).
MAEMBE Emoke (CNECT)
Please do not mention, how many countries are above or below EU average.

46
3.1.15 Basket L7, 20 GB
Cyprus, Slovakia and the Czech Republic are more than four times more expensive than Poland, France, Italy, Latvia, and Lithuania, which offer 20 GB mobile data for 15 EUR/PPP or less. The EU28 average is 27.76 EUR/PPP. Prices include surcharges for exceeding the data limit of an offer providing less than 20GB, typically in markets like the Czech Republic, Slovakia, and Cyprus where there is no offer providing up to 20 GB.

47
3.2 Are performances similar between handset-only and data-only usage baskets?
The figure below indicates the relationship between a Member State’s average rank-order in the EU28 regarding the least expensive offer in handset-based baskets on the one hand, and on the other hand, data-only baskets.
The overall correlation between the rank-order in terms of handset-based and data-only prices is relatively moderate. Only two countries, Luxembourg (6|6) and Spain (17|17), have exactly the same rank-order position in both handset and data-only based offers. For most of the other countries, also in line with the overall correlation, the position does not change significantly. However, there are some notable exceptions:
• Croatia (19|27), Slovenia (4|11), France (1|7), Romania (9|15), Belgium (13|19), the Netherlands (14|20), and Cyprus (22|28) have much less expensive offers for handset-based baskets, but are ranked eight, seven, and six positions behind for data-only baskets, respectively.
• Bulgaria (28|8), Finland (15|3), Sweden (18|10), and Hungary (25|18) have less expensive offers for data-only baskets than handset-based baskets.
3.2.1 Is more mobile data more expensive?
Comparing the prices of cheapest offers per country and usage basket for different data volumes, the answer is a clear yes: there is a steady rise in prices towards higher data allowances.
As might be expected, in most markets, the rise in gross price is not proportional to the increase in data allowance, so that the price per GB falls as the package selected gets larger. Thus there is a clear and continuous fall of the EUR(PPP)/GB ratio of the EU28 average, from 14.47 (500 MB basket) to 2.99 (5 GB basket) and to 1.30 (20GB basket). However, this is not the case in all markets. In the Czech Republic, Malta, and Slovenia the price per GB is found to be smallest in the 10 GB basket.

48
The spread of prices per GB across Europe in the different usage baskets is immense.
3.2.2 How do prices on different devices compare?
As in 2017, when comparing laptop-based offers with tablet-based offers, there were no apparent differences in the least expensive prices. The least expensive offer in every country can be used with both tablet and notebook.
3.2.3 What is the impact of equipment on prices?
As described in chapter 2.3, only the least expensive way of adding a smartphone was included in the database, i.e. if monthly instalments were more expensive than a one-off payment, the one-off payment was included, and vice versa.
Adding an advanced smartphone (in most cases a Samsung Galaxy S8) costs between 21.12€ in the frequent caller basket (2 GB, 900 calls, 350 SMS) and 25.73€ in the 2 GB, 100 calls, 140 SMS basket, averaging at 23.68€. The premium tends to be smaller in the largest baskets.
Adding a basic smartphone is least expensive in the high data basket (10GB, 100 calls, 140 SMS) at 9.73€, averaging at slightly below 11.50€.

49
Basket Advanced Smartphone19 Premium [EUR(PPP)/month]
Basic Smartphone20 Premium [EUR(PPP)/month]
100 MB, 30 calls, 100 SMS 25.41 12.90
500 MB, 100 calls, 140 SMS 24.58 12.38
1 GB, 300 calls, 225 SMS 23.24 12.45
2 GB, 900 calls, 350 SMS 21.12 9.87
2 GB, 100 calls, 140 SMS 25.73 12.75
5 GB, 100 calls, 140 SMS 22.18 9.87
10 GB, 100 calls, 140 SMS 23.51 9.73
3.3 Price trends Using mobile data on smartphones in the EU is now less expensive than last year. Baskets with data allowances of 20 GB per month saw the most significant decrease in prices.
3.3.1 Has mobile broadband got cheaper since last year?
Mobile broadband was found to be significantly cheaper than a year ago, in all usage baskets.
Basket Least expensive [EUR/PPP]
EU28 average 2018 [EUR/PPP]
EU28 average 2017 [EUR/PPP]
Variation 2017/18
250 MB 1.47 7.40 8.18 -10%
500 MB 2.15 7.75 8.97 -14%
1 GB 2.15 9.20 9.65 -5%
2 GB 2.15 11.15 12.66 -12%
5 GB 2.15 16.02 16.74 -4%
10 GB 4.17 20.56 21.77 -6%
20 GB 8.34 27.76 33.12 -16%
19 E.g. Samsung Galaxy S8, Sony Xperia XZ, Huawei Mate 10, HTC 10.
20 E.g. Samsung Galaxy A3 2017/2018, Huawei P10 lite

50
Comparing the EU28 average in the handset baskets reveals a similar trend. Especially prices for higher-end baskets decreased considerably by up to 20%.
Basket Least expensive [EUR/PPP]
EU28 average 2018 [EUR/PPP]
EU28 average 2017 [EUR/PPP]
Variation 2017/18
100 MB, 30 calls 4.10 12.20 14.11 -14%
500 MB, 100 calls 7.08 16.64 17.62 -6%
1 GB, 300 calls 8.32 22.32 23.62 -6%
2 GB, 900 calls 9.36 29.87 31.39 -5%
2 GB, 100 calls 7.08 20.06 23.93 -16%
5 GB, 100 calls 7.08 25.48 31.80 -20%
3.4 The bigger picture: the EU in the world The following charts illustrate how the EU28 compare with South Korea, the United States, Turkey, Iceland, and Norway. In South Korea and the United States, no offers adapted to the lower usage OECD-baskets were on the market, which is why those two countries might seem overpriced. The least expensive data-only offer in the United States allows up to 23 GB of data, but the maximum download speed is only 2 Mbps.
At 12.20 EUR/PPP, the EU28 is less expensive than Korea, the US and Norway in this basket, which includes 100MB of data, 30 calls, and 100 SMS. Iceland and Turkey are significantly cheaper. For South Korea, the US, and Norway no offer fitting only this basket was found. The offer in South Korea includes 5 GB of data; the offers from the US and Norway both include 1 GB and flatrates for calls and messages.

51
Turkey and Iceland are significantly less expensive than the EU28; Norway has similar prices.
For South Korea, the US, and Norway no offer fitting only this basket was found. The offer in South Korea includes 5 GB of data; the offers from the US and Norway both include 1 GB and flatrates for calls and messages.
The EU28 average is significantly higher than prices found in Turkey, Norway, and Iceland.
For South Korea, no offer fitting only this basket was found. The offer in South Korea includes 5 GB of data and flatrates for calls and messages.
This basket is significantly less expensive in Iceland and Turkey compared to the EU28 average.
For South Korea, no offer fitting only this basket was found: the offer in South Korea includes 5 GB of data.
This frequent caller basket is most expensive in South Korea, though it should be noted that the cheapest Korean offer includes 5 GB of data and flatrates for calls and SMS. The EU28 average - over Member States' lowest prices - is significantly more expensive than the lowest prices found in Norway and Turkey.

52
The most expensive country for this basket is the South Korea, followed by the US and Norway. The EU28 (25.48 EUR/PPP) can be found in mid-field, and Turkey has the cheapest offer (3.65 EUR/PPP).
The EU28 (7.40 EUR/PPP) is cheaper than the US, Norway, and Korea in this low usage, data-only basket. However, the EU28 has higher prices than Iceland and Turkey.
It should be considered though that the offer from the US includes a data volume of 10 GB, the offer from Norway includes 5 GB, and the one from South-Korea 0.5 GB, meaning that no less expensive offer was found in these countries including only 0.25 GB.
The EU28 (7.75 EUR/PPP) is less expensive than the US, Norway, and Korea in this 500 MB data-only basket; however, it is more expensive than Iceland and Turkey.
It should be considered though that the offer from the US includes a data volume of 10 GB; the offer from Norway includes 5 GB, meaning that no less expensive offer was found in these countries including only 0.5 GB.

53
In this basket, the EU28 (9.20 EUR/PPP) is less expensive than the US, South Korea, and Norway. However, prices are higher than in Iceland and Turkey.
It should be considered though that the offer from the US includes a data volume of 10 GB; the offer from Norway includes 5 GB, meaning that no less expensive offer was found in these countries including only 1 GB.
Iceland and Turkey are less expensive in this 2GB data-only basket than the EU28 (11.15 EUR/PPP).
The offer from the US include a data volume of 10 GB, the offer from Norway include 5GB, meaning that no cheaper offer was found there including only 2 GB.
While the EU28 (16.02 EUR/PPP) and South Korea display similar prices for this basket, they are more expensive than Norway, Iceland, and Turkey. However, the EU28 is cheaper than the US and South Korea.
The offer from the US includes not just 5 GB but 10 GB of data.
Compared to the EU28 average, only in Norway and the US is the 10 GB data-only basket more expensive. The EU28 average price (20.56 EUR/PPP) is higher than the lowest prices in Korea, Iceland and Turkey.

54
The EU28 average price (27.76 EUR/PPP) is higher than prices for this 20 GB data-only basket in Iceland, South-Korea, and Turkey. Norway and the US show higher prices.

55
4. ANNEX II – Country Reports

Austria
A1 Telekom Austria AG | T-Mobile Austria GmbH | Hutchison 3 Austria
Austria in the EU
Compared to all EU28 countries, prices for mobile
broadband and telephony in Austria are, across the offers studied, much less expensive
than on EU average. No offers were found to be
more expensive than the EU average.
Usage basket Provider and Offer EUR/PPP
EU
average
0.1 GB, 30 CALLS, 100 SMS T-Mobile Austria GmbH |MY KLAX FLEX 5000 9.17 12.20
0.5 GB, 100 CALLS, 140 SMS T-Mobile Austria GmbH |MY KLAX FLEX 5000 9.17 16.64
1 GB, 300 CALLS, 225 SMS T-Mobile Austria GmbH |MY KLAX FLEX 5000 9.17 22.32
2 GB, 900 CALLS, 350 SMS T-Mobile Austria GmbH |MY KLAX FLEX 15000 13.76 29.87
2 GB, 100 CALLS, 140 SMS T-Mobile Austria GmbH |MY KLAX FLEX 5000 9.17 20.06
5 GB, 100 CALLS, 140 SMS A1 Telekom Austria AG | b.free L 11.18 25.48
5 GB (DATA ONLY) T-Mobile Austria GmbH |MY KLAX FLEX 5000 9.17 16.02
10 GB (DATA ONLY) Hutchison 3 Austria | Nimm3 Internet 10 GB 9.43 20.56
20 GB (DATA ONLY) Hutchison 3 Austria | Nimm3 Internet 10 GB 18.60 27.76
Price TrendsRelative to 2017, averaging over the usage baskets shown, prices in Austria
fell noticeably. The most different trend was for 5 GB data and no calls or SMS, where prices fell somewhat (by 3%).
AustriaWhat came after the mill. by Simon Matzinger, flickr.com. CC BY 2.0
Offer research:February 2018
The full list of baskets per country is annexed to this report

Belgium
Proximus | Base | Orange
Belgium in the EU
Prices for mobile broadband and telephony in Belgium
show a different pattern compared to EU28 countries overall. Whereas consumers
requiring 0.1 GB data and 30 calls with 100 SMS find offers much less expensive than on EU average, those seeking 10 GB data and no
calls or SMS find prices much more expensive than on EU
average.
Usage basket Provider and Offer EUR/PPP
EU
average
0.1 GB, 30 CALLS, 100 SMS Orange | Colibri 7.00 12.20
0.5 GB, 100 CALLS, 140 SMS Base | 15 13.70 16.64
1 GB, 300 CALLS, 225 SMS Base | 15 20.56 22.32
2 GB, 900 CALLS, 350 SMS Orange | Panthère Promo Edition 24.11 29.87
2 GB, 100 CALLS, 140 SMS Base | 15 15.89 20.06
5 GB, 100 CALLS, 140 SMS Orange | Panthère Promo Edition 24.11 25.48
5 GB (DATA ONLY) Base | 15 only data use 22.46 16.02
10 GB (DATA ONLY) Base | 35 only data use 31.96 20.56
20 GB (DATA ONLY) Base | 45 only data use 41.09 27.76
Price TrendsRelative to 2017, averaging over the usage baskets shown, prices in Belgium
fell noticeably. In contrast, for consumers requiring 5 GB data and no calls or SMS, prices rose strongly (by 23%).
BelgiumAtom by Carlos ZGZ, flickr.com. CC BY 2.0
Offer research:February 2018
The full list of baskets per country is annexed to this report

Bulgaria
Vivacom | Telenor | Mobiltel
Bulgaria in the EU
Compared to all EU28 countries, prices for mobile
broadband and telephony in Bulgaria are, across
the offers studied, much more expensive than on
EU average. However, the lowest price of offers for consumers requiring 20 GB data and no calls or
SMS is less expensive than on EU average. SMS are
particularly high priced in Bulgaria, but rarely used.
Usage basket Provider and Offer EUR/PPP
EU
average
0.1 GB, 30 CALLS, 100 SMS Mobiltel | Prima Familia 28.91 12.20
0.5 GB, 100 CALLS, 140 SMS Mobiltel | Mega Prima 38.76 16.64
1 GB, 300 CALLS, 225 SMS Mobiltel | Mega Prima 58.54 22.32
2 GB, 900 CALLS, 350 SMS Mobiltel | Mega Prima 87.48 29.87
2 GB, 100 CALLS, 140 SMS Mobiltel | Mega Prima 38.76 20.065 GB, 100 CALLS, 140 SMS Vivacom | SMART L 53.26 25.48
5 GB (DATA ONLY) Telenor | Internet 15,99 17.22 16.02
10 GB (DATA ONLY) Telenor | Internet+ 16,99 18.29 20.5620 GB (DATA ONLY) Telenor | Internet+ 16,99 18.29 27.76
Price TrendsRelative to 2017, averaging over the usage baskets shown, prices in Bulgaria
rose strongly. The most different trend was for 5 GB data and no calls or SMS, where prices remained nearly unchanged.
BulgariaAlexander-Newski Kathedrale by RedLens Media, flickr.com. CC BY 2.0
Offer research:February 2018
The full list of baskets per
country is annexed to this report

Cyprus
Cyta | MTN
Cyprus in the EU
Compared to all EU28 countries, prices for mobile
broadband and telephony in Cyprus are, across the
offers studied, much more expensive than on EU average. However, the
lowest price of offers for consumers requiring 0.1 GB
data and 30 calls with 100 SMS is less expensive than
on EU average.
Usage basket Provider and Offer EUR/PPP
EU
average
0.1 GB, 30 CALLS, 100 SMS Cyta | So Easy 500MB 7.95 12.20
0.5 GB, 100 CALLS, 140 SMS MTN | 4G Smart Medium 17.38 16.64
1 GB, 300 CALLS, 225 SMS MTN | 4G Smart Large 29.47 22.32
2 GB, 900 CALLS, 350 SMS MTN | 4G Smart Unlimited 47.13 29.87
2 GB, 100 CALLS, 140 SMS Cyta | So Easy 1GB + 1GB 30.40 20.06
5 GB, 100 CALLS, 140 SMS MTN | 4G Smart Unlimited Plus 53.49 25.48
5 GB (DATA ONLY) Cyta | VMB 5GB 43.92 16.02
10 GB (DATA ONLY) MTN | Internet Everywhere 4 63.05 20.56
20 GB (DATA ONLY) MTN | Internet Everywhere 4 63.05 27.76
Price TrendsPrices for mobile broadband and telephony in Cyprus show no clear trend
compared to the previous year (2017). Customers seeking 0.1 GB data and 30 calls with 100 SMS find prices fell strongly.
CyprusLarnaka by Sergey Galyonkin, flickr.com. CC BY SA 2.0
Offer research:February 2018
The full list of baskets per
country is annexed to this report
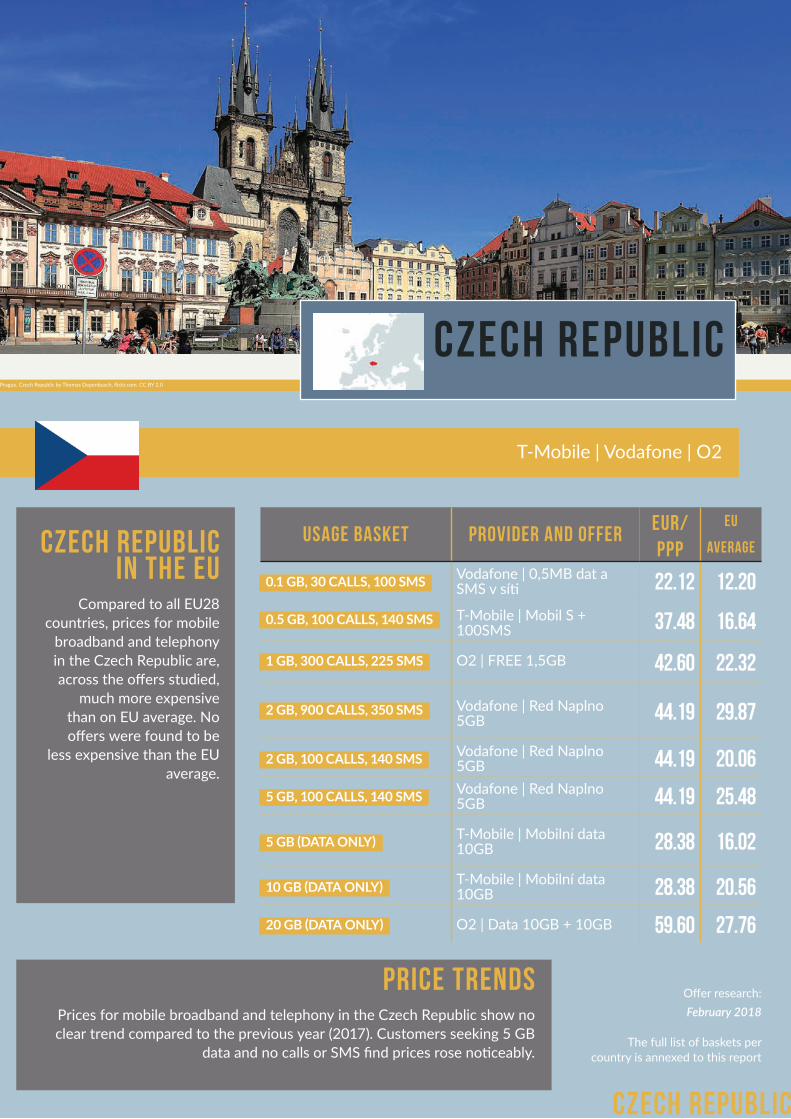
Czech Republic
T-Mobile | Vodafone | O2
Czech Republic in the EU
Compared to all EU28 countries, prices for mobile
broadband and telephony in the Czech Republic are, across the offers studied,
much more expensive than on EU average. No offers were found to be
less expensive than the EU average.
Usage basket Provider and Offer EUR/PPP
EU
average
0.1 GB, 30 CALLS, 100 SMS Vodafone | 0,5MB dat a SMS v síti 22.12 12.20
0.5 GB, 100 CALLS, 140 SMS T-Mobile | Mobil S + 100SMS 37.48 16.64
1 GB, 300 CALLS, 225 SMS O2 | FREE 1,5GB 42.60 22.32
2 GB, 900 CALLS, 350 SMS Vodafone | Red Naplno 5GB 44.19 29.87
2 GB, 100 CALLS, 140 SMS Vodafone | Red Naplno 5GB 44.19 20.06
5 GB, 100 CALLS, 140 SMS Vodafone | Red Naplno 5GB 44.19 25.48
5 GB (DATA ONLY) T-Mobile | Mobilní data 10GB 28.38 16.02
10 GB (DATA ONLY) T-Mobile | Mobilní data 10GB 28.38 20.56
20 GB (DATA ONLY) O2 | Data 10GB + 10GB 59.60 27.76
Price TrendsPrices for mobile broadband and telephony in the Czech Republic show no clear trend compared to the previous year (2017). Customers seeking 5 GB
data and no calls or SMS find prices rose noticeably.
Czech RepublicPrague, Czech Republic by Thomas Depenbusch, flickr.com. CC BY 2.0
Offer research:February 2018
The full list of baskets per
country is annexed to this report

Germany
Telekom | Vodafone | O2
Germany in the EU
Prices for mobile broadband and telephony in Germany
show a different pattern compared to EU28 countries overall. Whereas consumers
requiring 0.5 GB data and 100 calls with 140 SMS find
offers less expensive than on EU average, those seeking 10 GB data and no calls or SMS find prices somewhat
more expensive than on EU average.
Usage basket Provider and Offer EUR/PPP
EU
average
0.1 GB, 30 CALLS, 100 SMS Vodafone | CallYa Flex 8.14 12.20
0.5 GB, 100 CALLS, 140 SMS O2 | Smart 300 10.15 16.64
1 GB, 300 CALLS, 225 SMS O2 | Smart 600 15.24 22.32
2 GB, 900 CALLS, 350 SMS Vodafone | Easy S 18.27 29.87
2 GB, 100 CALLS, 140 SMS Vodafone | Easy S 18.27 20.065 GB, 100 CALLS, 140 SMS Vodafone | CallYa Flex 23.14 25.48
5 GB (DATA ONLY) Vodafone | CallYa Flex 19.56 16.02
10 GB (DATA ONLY) O2 | Free M 28.98 20.5620 GB (DATA ONLY) O2 | Free L 38.38 27.76
Price TrendsRelative to 2017, averaging over the usage baskets shown, prices in Germany fell noticeably. In contrast, for consumers requiring 5 GB data and no calls or
SMS, prices rose somewhat (by 8%).
GermanyBrandenburger Tor, Berlin by Jeanne Menjoulet, flickr.com. CC BY SA 2.0
Offer research:February 2018
The full list of baskets per
country is annexed to this report

Denmark
TDC | Telenor | TeliaSonera
Denmark in the EU
Compared to all EU28 countries, prices for mobile
broadband and telephony in Denmark are, across the
offers studied, less expensive than on EU average.
However, the lowest price of offers for consumers
requiring 0.1 GB data and 30 calls with 100 SMS is
somewhat more expensive than on EU average.
Usage basket Provider and Offer EUR/PPP
EU
average
0.1 GB, 30 CALLS, 100 SMS Telenor | Telenor 20 15.06 12.20
0.5 GB, 100 CALLS, 140 SMS Telenor | Telenor 20 15.06 16.64
1 GB, 300 CALLS, 225 SMS Telenor | Telenor 20 15.06 22.32
2 GB, 900 CALLS, 350 SMS TDC | youSee 5GB 15.34 29.87
2 GB, 100 CALLS, 140 SMS Telenor | Telenor 20 15.06 20.065 GB, 100 CALLS, 140 SMS Telenor | Telenor 20 15.06 25.48
5 GB (DATA ONLY) Telenor | Internet To Go 8 11.02 16.02
10 GB (DATA ONLY) TDC | Data 10GB 12.31 20.5620 GB (DATA ONLY) Telenor | Telenor 20 15.06 27.76
Price TrendsPrices for mobile broadband and telephony in Denmark show no clear
trend compared to the previous year (2017). The most different trend was for 0.1 GB data and 30 calls with 100 SMS, where prices remained nearly
unchanged.
DenmarkNyhavn by Angel Torres, flickr.com. CC BY 2.0
Offer research:February 2018
The full list of baskets per
country is annexed to this report

Estonia
Telia (EMT) | Tele2
Estonia in the EU
Compared to all EU28 countries, prices for mobile
broadband and telephony in Estonia are, across the offers studied, less expensive than
on EU average. No offers were found to be more expensive than the EU
average.
Usage basket Provider and Offer EUR/PPP
EU
average
0.1 GB, 30 CALLS, 100 SMS Tele2 | Multi 1.0 9.45 12.20
0.5 GB, 100 CALLS, 140 SMS Tele2 | Multi 1.0 9.45 16.64
1 GB, 300 CALLS, 225 SMS Tele2 | Snapp 5GB | Piiramatud 12.17 22.32
2 GB, 900 CALLS, 350 SMS Tele2 | Snapp 5GB | Piiramatud 13.74 29.87
2 GB, 100 CALLS, 140 SMS Tele2 | Snapp 5GB | Piiramatud 12.17 20.06
5 GB, 100 CALLS, 140 SMS Tele2 | Snapp 5GB | Piiramatud 12.17 25.48
5 GB (DATA ONLY) Tele2 | Snapp 5GB | 200minutit 9.46 16.02
10 GB (DATA ONLY) Tele2 | Snapp 15GB | 200minutit 13.52 20.56
20 GB (DATA ONLY) Tele2 | Snapp Piiramatu | 200minutit 20.28 27.76
Price TrendsPrices for mobile broadband and telephony in Estonia show no clear trend
compared to the previous year (2017). Customers seeking 5 GB data and 100 calls with 140 SMS find prices fell very strongly.
EstoniaEstonia_1536 - Town Hall Square by Dennis Jarvis, flickr.com. CC BY SA 2.0
Offer research:February 2018
The full list of baskets per
country is annexed to this report

Spain
Movistar | Vodafone | Orange
Spain in the EUPrices for mobile broadband
and telephony in Spain show a different pattern
compared to EU28 countries overall. Whereas consumers
requiring 5 GB data and no calls or SMS find offers much
more expensive than on EU average, those seeking 0.1 GB data and 30 calls with
100 SMS find prices much less expensive than on EU
average.
Usage basket Provider and Offer EUR/PPP
EU
average
0.1 GB, 30 CALLS, 100 SMS Movistar | Tuenti LOL 6.97 12.20
0.5 GB, 100 CALLS, 140 SMS Movistar | Tuenti LOL 10.93 16.64
1 GB, 300 CALLS, 225 SMS Movistar | Tuenti LOL 20.04 22.32
2 GB, 900 CALLS, 350 SMS Orange | Go Up + SMS illimitados 37.60 29.87
2 GB, 100 CALLS, 140 SMS Movistar | Tuenti LOL 17.58 20.065 GB, 100 CALLS, 140 SMS Movistar | Tuenti LOL 37.51 25.48
5 GB (DATA ONLY) Orange | Internet Móvil 2GB + Bono Internet 5GB 28.62 16.02
10 GB (DATA ONLY) Orange | Go play 28.74 20.56
20 GB (DATA ONLY) Movistar | Tarifa #1,5 + 30GB 48.73 27.76
Price TrendsPrices for mobile broadband and telephony in Spain show no clear trend
compared to the previous year (2017). Customers seeking 5 GB data and 100 calls with 140 SMS find prices rose strongly (by 35%).
SpainPalacio real, Madrid by Konstantinos Dafalias, flickr.com. CC0 1.0
Offer research:February 2018
The full list of baskets per
country is annexed to this report

Finland
Elisa | Sonera
Finland in the EU
Compared to all EU28 countries, prices for mobile
broadband and telephony in Finland are, across the offers studied, less expensive than
on EU average. However, the lowest price of offers
for consumers requiring 0.5 GB data and 100 calls
with 140 SMS is slightly more expensive than on EU
average.
Usage basket Provider and Offer EUR/PPP
EU
average
0.1 GB, 30 CALLS, 100 SMS Elisa | Saunalahti Prepaid 9.06 12.20
0.5 GB, 100 CALLS, 140 SMS Sonera | M 19.32 16.64
1 GB, 300 CALLS, 225 SMS Sonera | M 19.32 22.32
2 GB, 900 CALLS, 350 SMS Sonera | M 19.32 29.87
2 GB, 100 CALLS, 140 SMS Sonera | M 19.32 20.065 GB, 100 CALLS, 140 SMS Sonera | M 19.32 25.48
5 GB (DATA ONLY) Sonera | S 9.62 16.02
10 GB (DATA ONLY) Elisa | Nettikuukausi 4G 16.22 20.5620 GB (DATA ONLY) Elisa | Nettikuukausi 4G 16.22 27.76
Price TrendsPrices for mobile broadband and telephony in Finland show no clear trend compared to the previous year (2017). Customers seeking 0.5 GB data and
100 calls with 140 SMS find prices rose strongly (by 29%).
FinlandHelsinki_2013 05 28_0848 by Harvey Barrison, flickr.com. CC BY SA 2.0
Offer research:February 2018
The full list of baskets per
country is annexed to this report

France
Orange | SFR | Free
France in the EU
Compared to all EU28 countries, prices for mobile
broadband and telephony in France are, across the offers
studied, less than half as expensive as on EU average. No offers were found to be
more expensive than the EU average.
Usage basket Provider and Offer EUR/PPP
EU
average
0.1 GB, 30 CALLS, 100 SMS Free | Le Forfait 2 4.10 12.20
0.5 GB, 100 CALLS, 140 SMS SFR | RED by SFR - Illimité 9.36 16.64
1 GB, 300 CALLS, 225 SMS SFR | RED by SFR - Illimité 9.36 22.32
2 GB, 900 CALLS, 350 SMS SFR | RED by SFR - Illimité 9.36 29.87
2 GB, 100 CALLS, 140 SMS SFR | RED by SFR - Illimité 9.36 20.065 GB, 100 CALLS, 140 SMS SFR | RED by SFR - Illimité 9.36 25.48
5 GB (DATA ONLY) SFR | RED by SFR - Illimité 9.36 16.02
10 GB (DATA ONLY) SFR | RED by SFR - Illimité 9.36 20.56
20 GB (DATA ONLY) SFR | RED by SFR - Illimité 9.36 27.76
Price TrendsRelative to 2017, averaging over the usage baskets shown, prices in France fell strongly. In contrast, for consumers requiring 0.5 GB data and 100 calls
with 140 SMS, prices rose somewhat (by 3%).
FranceIMG_2238 by Jonathan Kotta, flickr.com. CC BY SA 2.0
Offer research:February 2018
The full list of baskets per
country is annexed to this report

Greece
Cosmote | Vodafone
Greece in the EU
Compared to all EU28 countries, prices for mobile
broadband and telephony in Greece are, across the
offers studied, much more expensive than on EU average. However, the
lowest price of offers for consumers requiring 0.1 GB
data and 30 calls with 100 SMS is slightly less expensive
than on EU average.
Usage basket Provider and Offer EUR/PPP
EU
average
0.1 GB, 30 CALLS, 100 SMS Cosmote | What’s up + Combo Call Them All PLUSi 11.40 12.20
0.5 GB, 100 CALLS, 140 SMS Vodafone | CU-Combo 600 + several add-ons 18.77 16.64
1 GB, 300 CALLS, 225 SMS Vodafone | Prepaid 300 + several add-ons 56.43 22.32
2 GB, 900 CALLS, 350 SMS Cosmote | Mobile Gold 111.02 29.87
2 GB, 100 CALLS, 140 SMS Cosmote | What’s up, + several add-ons 23.94 20.06
5 GB, 100 CALLS, 140 SMS Cosmote | What"s up + several add-ons 40.22 25.48
5 GB (DATA ONLY) Cosmote | Mobile Internet 6GB 26.21 16.02
10 GB (DATA ONLY) Cosmote | Mobile Internet 12GB 38.18 20.56
20 GB (DATA ONLY) Vodafone | Mobile Broadband 20 44.29 27.76
Price TrendsPrices for mobile broadband and telephony in Greece show no clear trend
compared to the previous year (2017). Customers seeking 0.1 GB data and 30 calls with 100 SMS find prices fell to much less than half.
GreeceThe age of man by Pedro, flickr.com. CC BY 2.0
Offer research:February 2018
The full list of baskets per
country is annexed to this report

Croatia
HT | VIPnet
Croatia in the EU
Prices for mobile broadband and telephony in Croatia show a different pattern
compared to EU28 countries overall. Whereas consumers
requiring 10 GB data and no calls or SMS find offers somewhat more expensive than on EU average, those
seeking 5 GB data and 100 calls with 140 SMS find
prices less expensive than on EU average.
Usage basket Provider and Offer EUR/PPP
EU
average
0.1 GB, 30 CALLS, 100 SMS VIPnet | Za Chill 15.67 12.20
0.5 GB, 100 CALLS, 140 SMS VIPnet | Za Chill 15.67 16.64
1 GB, 300 CALLS, 225 SMS HT | Hibrid 4GB 22.78 22.32
2 GB, 900 CALLS, 350 SMS VIPnet | Mobilna M 35.32 29.87
2 GB, 100 CALLS, 140 SMS VIPnet | Za Chill 15.67 20.065 GB, 100 CALLS, 140 SMS VIPnet | Za Zen 19.85 25.48
5 GB (DATA ONLY) VIPnet | Mobilni Net S 16.52 16.02
10 GB (DATA ONLY) VIPnet | Mobilni Net M 26.96 20.5620 GB (DATA ONLY) VIPnet | Mobilni Net M 26.96 27.76
Price TrendsPrices for mobile broadband and telephony in Croatia show no clear trend
compared to the previous year (2017). Customers seeking 0.1 GB data and 30 calls with 100 SMS find prices rose very strongly (by 80%).
CroatiaZagreb - Vue sur la ville haute by Nicolas Vollmer, flickr.com. CC BY 2.0
Offer research:February 2018
The full list of baskets per
country is annexed to this report

Hungary
T-Mobile Hungary | Telenor
Hungary in the EU
Compared to all EU28 countries, prices for mobile
broadband and telephony in Hungary are, across the offers studied, much more
expensive than on EU average. No offers were
found to be less expensive than the EU average.
Usage basket Provider and Offer EUR/PPP
EU
average
0.1 GB, 30 CALLS, 100 SMS T-Mobile Hungary | Mobile S 500Mb + 80Flexiunits 27.43 12.20
0.5 GB, 100 CALLS, 140 SMS T-Mobile Hungary | Mobile L 500Mb 33.73 16.64
1 GB, 300 CALLS, 225 SMS T-Mobile Hungary | Mobile L 2Gb 47.35 22.32
2 GB, 900 CALLS, 350 SMS T-Mobile Hungary | Mobile L 2Gb 60.25 29.87
2 GB, 100 CALLS, 140 SMS T-Mobile Hungary | Mobile L 2Gb 39.75 20.06
5 GB, 100 CALLS, 140 SMS T-Mobile Hungary | Mobile L 6Gb 50.15 25.48
5 GB (DATA ONLY) T-Mobile Hungary | Net 6Gb 21.84 16.02
10 GB (DATA ONLY) Telenor | Hello Data Start 30.21 20.56
20 GB (DATA ONLY) Telenor | Hello Data Start 30.21 27.76
Price TrendsRelative to 2017, averaging over the usage baskets shown, prices in Hungary fell strongly. In contrast, for consumers requiring 10 GB data and no calls or
SMS, prices rose noticeably (by 12%).
HungaryBudapest by ddqhu, flickr.com. CC BY SA 2.0
Offer research:February 2018
The full list of baskets per
country is annexed to this report

Ireland
Vodafone | Three
Ireland in the EU
Prices for mobile broadband and telephony in Ireland show a different pattern
compared to EU28 countries overall. Whereas consumers
requiring 0.1 GB data and 30 calls with 100 SMS find
offers much more expensive than on EU average, those
seeking 20 GB data and no calls or SMS find prices less expensive than on EU
average.
Usage basket Provider and Offer EUR/PPP
EU
average
0.1 GB, 30 CALLS, 100 SMS Vodafone | Chat Extra 19.60 12.20
0.5 GB, 100 CALLS, 140 SMS Vodafone | Chat Extra 19.60 16.64
1 GB, 300 CALLS, 225 SMS Vodafone | Chat Extra 19.60 22.32
2 GB, 900 CALLS, 350 SMS Vodafone | Red 30 Day 27.14 29.87
2 GB, 100 CALLS, 140 SMS Vodafone | Red 30 Day 27.14 20.065 GB, 100 CALLS, 140 SMS Vodafone | Red 30 Day 27.14 25.48
5 GB (DATA ONLY) Vodafone | Smart Extra 19.60 16.02
10 GB (DATA ONLY) Three | Prepaid 20 Top-Up 19.60 20.5620 GB (DATA ONLY) Three | Prepaid 20 Top-Up 19.60 27.76
Price TrendsPrices for mobile broadband and telephony in Ireland show no clear trend
compared to the previous year (2017). Customers seeking 10 GB data and no calls or SMS find prices fell noticeably (by 15%).
IrelandThe Ha’penny Bridge [...] by William Murhpy, flickr.com. CC BY-SA 2.0
Offer research:February 2018
The full list of baskets per
country is annexed to this report

Italy
Vodafone | Telecom Italia (TIM) | WindTre
Italy in the EUCompared to all EU28
countries, prices for mobile broadband and telephony
in Italy are, across the offers studied, very much
less expensive than on EU average. No offers were
found to be more expensive than the EU average.
Usage basket Provider and Offer EUR/PPP
EU
average
0.1 GB, 30 CALLS, 100 SMS WindTre | ALL-IN Start 7.08 12.20
0.5 GB, 100 CALLS, 140 SMS WindTre | ALL-IN Start 7.08 16.64
1 GB, 300 CALLS, 225 SMS WindTre | Play + 300SMS 8.60 22.32
2 GB, 900 CALLS, 350 SMS WindTre | All inclusive unlimited Online Edition 10.37 29.87
2 GB, 100 CALLS, 140 SMS WindTre | ALL-IN Start 7.08 20.065 GB, 100 CALLS, 140 SMS WindTre | ALL-IN Start 7.08 25.48
5 GB (DATA ONLY) Vodafone | 19 2.15 16.02
10 GB (DATA ONLY) WindTre | SuperWeb + 10GB 5.06 20.56
20 GB (DATA ONLY) WindTre | SuperWeb + 30GB 10.11 27.76
Price TrendsRelative to 2017, averaging over the usage baskets shown, prices in Italy fell
very strongly. The most different trend was for 10 GB data and no calls or SMS, where prices fell somewhat (by 10%).
ItalyRome by Sean MacEntee, flickr.com. CC BY 2.0
Offer research:February 2018
The full list of baskets per
country is annexed to this report

Lithuania
Tele2 | Bite Lietuva | Telia
Lithuania in the EU
Compared to all EU28 countries, prices for mobile
broadband and telephony in Lithuania are, across
the offers studied, much less expensive than on EU
average. No offers were found to be more expensive
than the EU average.
Usage basket Provider and Offer EUR/PPP
EU
average
0.1 GB, 30 CALLS, 100 SMS Tele2 | 100MB | 150Min | Unlimited SMS 4.71 12.20
0.5 GB, 100 CALLS, 140 SMS Tele2 | 2GB | 150Min | Unlimited SMS 13.26 16.64
1 GB, 300 CALLS, 225 SMS Tele2 | 2GB | Unlimited 14.56 22.32
2 GB, 900 CALLS, 350 SMS Tele2 | 2GB | Unlimited 14.56 29.87
2 GB, 100 CALLS, 140 SMS Tele2 | 2GB | 150Min | Unlimited SMS 13.26 20.06
5 GB, 100 CALLS, 140 SMS Tele2 | 8GB | Unlimited 17.26 25.48
5 GB (DATA ONLY) Telia | Connect 12 14.50 16.02
10 GB (DATA ONLY) Telia | Connect 12 14.50 20.5620 GB (DATA ONLY) Telia | Connect 12 14.50 27.76
Price TrendsPrices for mobile broadband and telephony in Lithuania show no clear trend
compared to the previous year (2017). Customers seeking 0.1 GB data and 30 calls with 100 SMS find prices fell very strongly.
Lithuania2011-0825_Vilnius_32 by Peter Collins, flickr.com. CC BY SA 2.0
Offer research:February 2018
The full list of baskets per
country is annexed to this report

Luxembourg
Post Télécom | Tango
Luxembourg in the EU
Compared to all EU28 countries, prices for mobile
broadband and telephony in Luxembourg are, across
the offers studied, much less expensive than on EU
average. No offers were found to be more expensive
than the EU average.
Usage basket Provider and Offer EUR/PPP
EU
average
0.1 GB, 30 CALLS, 100 SMS Post Télécom | Scoubido Mini 8.32 12.20
0.5 GB, 100 CALLS, 140 SMS Post Télécom | Scoubido Mini 8.32 16.64
1 GB, 300 CALLS, 225 SMS Post Télécom | Scoubido Mini 8.32 22.32
2 GB, 900 CALLS, 350 SMS Tango | Smart LU M 12.50 29.87
2 GB, 100 CALLS, 140 SMS Tango | Smart LU M 12.50 20.065 GB, 100 CALLS, 140 SMS Tango | Smart LU M 12.50 25.48
5 GB (DATA ONLY) Post Télécom | Scoubido Internet XXS 12.50 16.02
10 GB (DATA ONLY) Post Télécom | Scoubido Internet L 15.00 20.56
20 GB (DATA ONLY) Tango | Internet Mobile LU XXL 21.16 27.76
Price TrendsPrices for mobile broadband and telephony in Luxembourg show no clear
trend compared to the previous year (2017). Customers seeking 1 GB data and 300 calls with 225 SMS find prices fell to less than 50%.
LuxembourgLuxembourg-5106 - Chemin de la Corniche by Dennis Jarvis. flickr.com. CC BY SA 2.0
Offer research:February 2018
The full list of baskets per
country is annexed to this report

Latvia
Tele2 | LMT | Bite Latvia
Latvia in the EUCompared to all EU28
countries, prices for mobile broadband and telephony in Latvia are, across the offers
studied, much less expensive than on EU average. No offers were found to be
more expensive than the EU average.
Usage basket Provider and Offer EUR/PPP
EU
average
0.1 GB, 30 CALLS, 100 SMS Bite Latvia | Priekapmaksa 7.06 12.20
0.5 GB, 100 CALLS, 140 SMS Tele2 | 500MB 12.62 16.64
1 GB, 300 CALLS, 225 SMS Bite Latvia | 2GB 17.09 22.32
2 GB, 900 CALLS, 350 SMS Bite Latvia | 2GB 17.09 29.87
2 GB, 100 CALLS, 140 SMS Bite Latvia | 2GB 17.09 20.065 GB, 100 CALLS, 140 SMS Bite Latvia | 5GB 21.55 25.48
5 GB (DATA ONLY) Tele2 | Data 10GB 8.90 16.02
10 GB (DATA ONLY) Tele2 | Data 10GB 8.90 20.5620 GB (DATA ONLY) Bite Latvia | Data 25GB 14.12 27.76
Price TrendsRelative to 2017, averaging over the usage baskets shown, prices in Latvia
rose noticeably. In contrast, for consumers requiring 0.1 GB data and 30 calls with 100 SMS, prices fell strongly (by 21%).
LatviaRiga Town Hall Square by Bernt Rostad, flickr.com. CC BY 2.0
Offer research:February 2018
The full list of baskets per
country is annexed to this report

Malta
Vodafone | GO Mobile | Melita
Malta in the EUCompared to all EU28
countries, prices for mobile broadband and telephony
in Malta are, across the offers studied, somewhat
more expensive than on EU average. However, the
lowest price of offers for consumers requiring 10 GB data and no calls or SMS is
much less expensive than on EU average.
Usage basket Provider and Offer EUR/PPP
EU
average
0.1 GB, 30 CALLS, 100 SMS Melita | Starter 18.28 12.20
0.5 GB, 100 CALLS, 140 SMS Melita | Unlimited 2GB 32.52 16.64
1 GB, 300 CALLS, 225 SMS Melita | Unlimited 2GB 32.52 22.32
2 GB, 900 CALLS, 350 SMS Melita | Unlimited 2GB 32.52 29.87
2 GB, 100 CALLS, 140 SMS Melita | Unlimited 2GB 32.52 20.065 GB, 100 CALLS, 140 SMS Melita | Unlimited 2GB 44.71 25.48
5 GB (DATA ONLY) GO Mobile | 5GB postpaid 12.18 16.02
10 GB (DATA ONLY) Melita | Total Connect without Dongle 12.19 20.56
20 GB (DATA ONLY) GO Mobile | 20GB postpaid 30.48 27.76
Price TrendsRelative to 2017, averaging over the usage baskets shown, prices in Malta
rose noticeably. In contrast, for consumers requiring 2 GB data and 900 calls with 350 SMS, prices fell by 11%.
MaltaMalta by Sergey Galyonkin. flickr.com. CC BY SA 2.0
Offer research:February 2018
The full list of baskets per
country is annexed to this report

Netherlands
KPN | Vodafone | T-Mobile
Netherlands in the EU
Prices for mobile broadband and telephony in the
Netherlands show a different pattern compared to EU28 countries overall. Whereas
handset-based offers are less expensive than on EU
average, prices for data only offers are somewhat
more expensive than on EU average.
Usage basket Provider and Offer EUR/PPP
EU
average
0.1 GB, 30 CALLS, 100 SMS T-Mobile | Basis 500MB|150min|100SMS 10.29 12.20
0.5 GB, 100 CALLS, 140 SMS T-Mobile | Basis 500MB|300min|all SMS 12.65 16.64
1 GB, 300 CALLS, 225 SMS T-Mobile | Go Sim Only 1GB 17.91 22.32
2 GB, 900 CALLS, 350 SMS T-Mobile | Go Sim Only 5GB 20.63 29.87
2 GB, 100 CALLS, 140 SMS T-Mobile | Basis 2GB|300min|all SMS 18.11 20.06
5 GB, 100 CALLS, 140 SMS T-Mobile | Go Sim Only 5GB 20.63 25.48
5 GB (DATA ONLY) T-Mobile | Go Sim Only 5GB 20.63 16.02
10 GB (DATA ONLY) KPN | Mobiel internet standaard 23.36 20.56
20 GB (DATA ONLY) T-Mobile | Go Sim Only Unlimited NL 32.45 27.76
Price TrendsRelative to 2017, averaging over the usage baskets shown, prices in the
Netherlands fell noticeably. In contrast, for consumers requiring 5 GB data and no calls or SMS, prices rose somewhat (by 3%).
NetherlandsPlac Zamkowy w Warszawie by Marcin Polak, flickr.com. CC BY 2.0
Offer research:February 2018
The full list of baskets per
country is annexed to this report

Poland
Orange | T-Mobile | Polkomtel
Poland in the EU
Compared to all EU28 countries, prices for mobile
broadband and telephony in Poland are, across the offers
studied, less than half as expensive as on EU average. No offers were found to be
more expensive than the EU average.
Usage basket Provider and Offer EUR/PPP
EU
average
0.1 GB, 30 CALLS, 100 SMS T-Mobile | Na karte 10.43 12.20
0.5 GB, 100 CALLS, 140 SMS T-Mobile | Na karte 10.43 16.64
1 GB, 300 CALLS, 225 SMS T-Mobile | Na karte 10.43 22.32
2 GB, 900 CALLS, 350 SMS T-Mobile | Na karte 10.43 29.87
2 GB, 100 CALLS, 140 SMS T-Mobile | Na karte 10.43 20.065 GB, 100 CALLS, 140 SMS T-Mobile | Na karte 10.43 25.48
5 GB (DATA ONLY) T-Mobile | Internet Mobilny Start 4.17 16.02
10 GB (DATA ONLY) T-Mobile | Internet Mobilny Start 4.17 20.56
20 GB (DATA ONLY) T-Mobile | Internet Mobilny Start 8.34 27.76
Price TrendsRelative to 2017, averaging over the usage baskets shown, prices in Poland
fell noticeably. The most different trend was for 0.1 GB data and 30 calls with 100 SMS, where prices fell somewhat (by 2%).
PolandPlac Zamkowy w Warszawie by Marcin Polak, flickr.com. CC BY 2.0
Offer research:February 2018
The full list of baskets per
country is annexed to this report

Portugal
MEO | Vodafone | NOS
Portugal in the EU
Compared to all EU28 countries, prices for mobile
broadband and telephony in Portugal are, across
the offers studied, slightly more expensive than on
EU average. No offers were found to be less expensive
than the EU average.
Usage basket Provider and Offer EUR/PPP
EU
average
0.1 GB, 30 CALLS, 100 SMS NOS | Tudo 200MB 14.99 12.20
0.5 GB, 100 CALLS, 140 SMS NOS | Tudo 1GB 17.50 16.64
1 GB, 300 CALLS, 225 SMS Vodafone | You 1GB|2000MIN 25.74 22.32
2 GB, 900 CALLS, 350 SMS Vodafone | You 3GB|5000MIN 32.51 29.87
2 GB, 100 CALLS, 140 SMS MEO | TOP TOTAL - 3GB 21.67 20.06
5 GB, 100 CALLS, 140 SMS Vodafone | You 5GB|500MIN 27.10 25.48
5 GB (DATA ONLY) Vodafone | On 5GB 18.76 16.02
10 GB (DATA ONLY) Vodafone | On 10GB 25.01 20.56
20 GB (DATA ONLY) Vodafone | On 30GB 31.26 27.76
Price TrendsRelative to 2017, averaging over the usage baskets shown, prices in Portugal fell somewhat. In contrast, for consumers requiring 5 GB data and 100 calls
with 140 SMS, prices fell strongly (by 40%).
PortugalLes nuages sont dans la place by Yann Cœuru, flickr.com. CC BY 2.0
Offer research:February 2018
The full list of baskets per
country is annexed to this report

Romania
Orange | Telekom Romania Mobile | Vodafone
Romania in the EU
Compared to all EU28 countries, prices for mobile
broadband and telephony in Romania are, across the
offers studied, less expensive than on EU average.
However, the lowest price of offers for consumers
requiring 20 GB data and no calls or SMS is slightly
more expensive than on EU average.
Usage basket Provider and Offer EUR/PPP
EU
average
0.1 GB, 30 CALLS, 100 SMS Orange | Cartela PrePay 5 10.23 12.20
0.5 GB, 100 CALLS, 140 SMS Orange | Cartela PrePay 5 10.23 16.64
1 GB, 300 CALLS, 225 SMS Orange | Cartela PrePay 5 10.23 22.32
2 GB, 900 CALLS, 350 SMS Telekom Romania Mobile | Optiunea 5 12.63 29.87
2 GB, 100 CALLS, 140 SMS Orange | Cartela PrePay 5 10.23 20.06
5 GB, 100 CALLS, 140 SMS Telekom Romania Mobile | Optiunea 5 12.63 25.48
5 GB (DATA ONLY) Orange | Cartela PrePay 6 Internet 12.27 16.02
10 GB (DATA ONLY) Orange | Cartela PrePay 8 Internet 16.37 20.56
20 GB (DATA ONLY) Vodafone | Smart Net 14 28.64 27.76
Price TrendsRelative to 2017, averaging over the usage baskets shown, prices in Romania
fell strongly. In contrast, for consumers requiring 5 GB data and no calls or SMS, prices rose strongly (by 20%).
RomaniaRomania-1181 - Palace of Parliament by Dennis Jarvis, flickr.com. CC BY SA 2.0
Offer research:February 2018
The full list of baskets per
country is annexed to this report

Sweden
TeliaSonera | Tele2 | Telenor
Sweden in the EU
Compared to all EU28 countries, prices for mobile
broadband and telephony in Sweden are, across the
offers studied, slightly less expensive than on
EU average. However, the lowest price of offers for consumers requiring 0.1
GB data and 30 calls with 100 SMS is somewhat
more expensive than on EU average.
Usage basket Provider and Offer EUR/PPP
EU
average
0.1 GB, 30 CALLS, 100 SMS TeliaSonera | Mobil Komplett 1GB 16.20 12.20
0.5 GB, 100 CALLS, 140 SMS TeliaSonera | Mobil Komplett 1GB 16.20 16.64
1 GB, 300 CALLS, 225 SMS TeliaSonera | Mobil Komplett 1GB 16.20 22.32
2 GB, 900 CALLS, 350 SMS Tele2 | Fast pris 5GB 20.27 29.87
2 GB, 100 CALLS, 140 SMS Tele2 | Fast pris 5GB 20.27 20.065 GB, 100 CALLS, 140 SMS Tele2 | Fast pris 5GB 20.27 25.48
5 GB (DATA ONLY) TeliaSonera | Mobilt Bredband 6GB 8.06 16.02
10 GB (DATA ONLY) TeliaSonera | Mobilt Bredband 20GB 16.20 20.56
20 GB (DATA ONLY) TeliaSonera | Mobilt Bredband 20GB 16.20 27.76
Price TrendsRelative to 2017, averaging over the usage baskets shown, prices in Sweden rose strongly. In contrast, for consumers requiring 5 GB data and no calls or
SMS, prices fell somewhat (by 7%).
SwedenT810_0605 by Bengt Nyman, flickr.com. CC BY 2.0
Offer research:February 2018
The full list of baskets per
country is annexed to this report

Slovakia
Orange | Slovak Telekom
Slovakia in the EU
Compared to all EU28 countries, prices for mobile
broadband and telephony in Slovakia are, across the
offers studied, much more expensive than on EU
average. No offers were found to be less expensive
than the EU average.
Usage basket Provider and Offer EUR/PPP
EU
average
0.1 GB, 30 CALLS, 100 SMS Orange | Go Europe 10 + 100SMS 18.30 12.20
0.5 GB, 100 CALLS, 140 SMS Slovak Telekom | Happy M 30.45 16.64
1 GB, 300 CALLS, 225 SMS Orange | Go Europe 25 + Unlimited SMS 46.30 22.32
2 GB, 900 CALLS, 350 SMS Orange | Go Europe 30 + Unlimited SMS 59.70 29.87
2 GB, 100 CALLS, 140 SMS Slovak Telekom | Happy L 42.47 20.065 GB, 100 CALLS, 140 SMS Slovak Telekom | Happy XL 54.49 25.48
5 GB (DATA ONLY) Slovak Telekom | Mobilný Internet M 22.10 16.02
10 GB (DATA ONLY) Slovak Telekom | Mobilný Internet L 37.13 20.56
20 GB (DATA ONLY) Orange | Go Data 30 60.10 27.76
Price TrendsPrices for mobile broadband and telephony in Slovakia show no clear trend
compared to the previous year (2017). Customers seeking 0.1 GB data and 30 calls with 100 SMS find prices fell strongly.
SlovakiaBratislava by Aapo Haapanen, flickr.com. CC BY 2.0
Offer research:February 2018
The full list of baskets per
country is annexed to this report

Slovenia
Telekom Slovenije | Telemach | Si.mobil
Slovenia in the EU
Compared to all EU28 countries, prices for mobile
broadband and telephony in Slovenia are, across the offers studied, much less
expensive than on EU average. No offers were
found to be more expensive than the EU average.
Usage basket Provider and Offer EUR/PPP
EU
average
0.1 GB, 30 CALLS, 100 SMS Telemach | VE 8.50 12.20
0.5 GB, 100 CALLS, 140 SMS Telemach | VE 8.50 16.64
1 GB, 300 CALLS, 225 SMS Telemach | Free2Go Revolucija 9GB 8.88 22.32
2 GB, 900 CALLS, 350 SMS Telemach | Free2Go Revolucija 9GB 18.54 29.87
2 GB, 100 CALLS, 140 SMS Telemach | Free2Go Revolucija 9GB 8.88 20.06
5 GB, 100 CALLS, 140 SMS Telemach | Free2Go Revolucija 9GB 8.88 25.48
5 GB (DATA ONLY) Telemach | Free2Go Revolucija 10GB 8.88 16.02
10 GB (DATA ONLY) Telemach | Free2Go Revolucija 10GB 8.88 20.56
20 GB (DATA ONLY) Telekom Slovenije | Dostopni A 24.30 27.76
Price TrendsPrices for mobile broadband and telephony in Slovenia show no clear trend
compared to the previous year (2017). Customers seeking 5 GB data and 100 calls with 140 SMS find prices fell very strongly.
SloveniaLjubljana_castle_from_Preseren_square by Rok, flickr.com. CC BY SA 2.0
Offer research:February 2018
The full list of baskets per
country is annexed to this report

The UK
Vodafone | Three | EE | Telefonica
The UK in the EUCompared to all EU28
countries, prices for mobile broadband and telephony in the UK are, across the offers studied, much less expensive
than on EU average. No offers were found to be
more expensive than the EU average.
Usage basket Provider and Offer EUR/PPP
EU
average
0.1 GB, 30 CALLS, 100 SMS Three | SIM only 0,5GB Essential 5.27 12.20
0.5 GB, 100 CALLS, 140 SMS Three | SIM only 0,5GB Essential 7.58 16.64
1 GB, 300 CALLS, 225 SMS Three | SIM only 4GB Essential 10.55 22.32
2 GB, 900 CALLS, 350 SMS Three | SIM only 4GB Essential 10.55 29.87
2 GB, 100 CALLS, 140 SMS Three | SIM only 4GB Essential 10.55 20.06
5 GB, 100 CALLS, 140 SMS Three | SIM only 12GB 15.82 25.48
5 GB (DATA ONLY) Three | Mobile Data 5GB 10.55 16.02
10 GB (DATA ONLY) Three | Mobile Data 10GB 13.71 20.5620 GB (DATA ONLY) Three | Mobile Data 20GB 15.82 27.76
Price TrendsRelative to 2017, averaging over the usage baskets shown, prices in the UK
fell strongly. In contrast, for consumers requiring 20 GB data and no calls or SMS, prices remained nearly unchanged.
The UKThames by Pierre-Selim, flickr.com. CC BY SA 2.0
Offer research:February 2018
The full list of baskets per
country is annexed to this report

European Commission
Mobile Broadband Prices in Europe 2018 Luxembourg, Publications Office of the European Union
2018 – 84 pages
ISBN 978-92-79-81308-5 doi:10.2759/137481

KK
-04
-18
-31
1-EN
-N
doi:10.2759/137481 ISBN 978-92-79-81308-5