Mitochondrial Pathway Mediates the Antileukemic Effects of Hemidesmus Indicus, a Promising Botanical...
15
Mitochondrial Pathway Mediates the Antileukemic Effects of Hemidesmus Indicus, a Promising Botanical Drug Carmela Fimognari 1 *, Monia Lenzi 1 , Lorenzo Ferruzzi 1 , Eleonora Turrini 1 , Paolo Scartezzini 2 , Ferruccio Poli 2 , Roberto Gotti 3 , Alessandra Guerrini 4 , Giovanni Carulli 5 , Virginia Ottaviano 5 , Giorgio Cantelli- Forti 1 , Patrizia Hrelia 1 1 Department of Pharmacology, Alma Mater Studiorum, University of Bologna, Bologna, Italy, 2 Department of Evolutionary and Experimental Biology, Alma Mater Studiorum, University of Bologna, Bologna, Italy, 3 Department of Pharmaceutical Sciences, Alma Mater Studiorum, University of Bologna, Bologna, Italy, 4 Department of Biology and Evolution, Agro-Technological and Pharmaceutical Resources (Agri-Unife), University of Ferrara, Ferrara, Italy, 5 Division of Hematology, Department of Oncology, Transplants and New Technologies in Medicine, University of Pisa, Pisa, Italy Abstract Background: Although cancers are characterized by the deregulation of multiple signalling pathways, most current anticancer therapies involve the modulation of a single target. Because of the enormous biological diversity of cancer, strategic combination of agents targeted against the most critical of those alterations is needed. Due to their complex nature, plant products interact with numerous targets and influence several biochemical and molecular cascades. The interest in further development of botanical drugs has been increasing steadily and the FDA recently approved the first new botanical prescription drug. The present study is designed to explore the potential antileukemic properties of Hemidesmus indicus with a view to contributing to further development of botanical drugs. Hemidesmus was submitted to an extensive in vitro preclinical evaluation. Methodology/Principal Findings: A variety of cellular assays and flow cytometry, as well as a phytochemical screening, were performed on different leukemic cell lines. We have demonstrated that Hemidesmus modulated many components of intracellular signaling pathways involved in cell viability and proliferation and altered the protein expression, eventually leading to tumor cell death, mediated by a loss of mitochondrial transmembrane potential and increased Bax/Bcl-2 ratio. ADP, adenine nucleotide translocator and mitochondrial permeability transition pore inhibitors did not reverse Hemidesmus- induced mitochondrial depolarization. Hemidesmus induced a significant [Ca 2+ ] i raise through the mobilization of intracellular Ca 2+ stores. Moreover, Hemidesmus significantly enhanced the antitumor activity of three commonly used chemotherapeutic drugs (methotrexate, 6-thioguanine, cytarabine). A clinically relevant observation is that its cytotoxic activity was also recorded in primary cells from acute myeloid leukemic patients. Conclusions/Significance: These results indicate the molecular basis of the antileukemic effects of Hemidesmus and identify the mitochondrial pathways and [Ca 2+ ] i as crucial actors in its anticancer activity. On these bases, we conclude that Hemidesmus can represent a valuable tool in the anticancer pharmacology, and should be considered for further investigations. Citation: Fimognari C, Lenzi M, Ferruzzi L, Turrini E, Scartezzini P, et al. (2011) Mitochondrial Pathway Mediates the Antileukemic Effects of Hemidesmus Indicus,a Promising Botanical Drug. PLoS ONE 6(6): e21544. doi:10.1371/journal.pone.0021544 Editor: Rakesh K. Srivastava, The University of Kansas Medical Center, United States of America Received March 14, 2011; Accepted May 31, 2011; Published June 28, 2011 Copyright: ß 2011 Fimognari et al. This is an open-access article distributed under the terms of the Creative Commons Attribution License, which permits unrestricted use, distribution, and reproduction in any medium, provided the original author and source are credited. Funding: This work was supported by Ministero dell’Istruzione dell’Universita ` e della Ricerca (http://sitouniversitario.cineca.it; grant number: 2007SSZMPK) and FIRB Piattaforme/Reti 2006 (http://sitofirb.cineca.it; grant number: RBPR05NWWC_002). The funders had no role in study design, data collection and analysis, decision to publish, or preparation of the manuscript. Competing Interests: The authors have declared that no competing interests exist. * E-mail: [email protected] Introduction Cancer is a complex disease characterized by multiple genetic and molecular alterations involving transformation, deregula- tion of apoptosis, proliferation, invasion, angiogenesis and metastasis [1]. It now appears that, for many cancers, multiple, redundant aberrant signaling pathways are at play as a result of genetic perturbations at different levels. Recent studies observe that in any given type of cancer 300–500 normal genes have been modified to result in the cancerous phenotype [2]. Although cancers are characterized by the deregulation of multiple signalling pathways at multiple steps, most current anticancer therapies involve the modulation of a single target. Because of the enormous biological diversity of cancer, strategic combination of agents targeted against the most critical of those alterations is needed. In addition, due to mutation in the target, treatment of cancer cells with a mono-targeted agent may induce adaptive resistance to a mono-targeted agent, but resistance is less likely if there are multiple targets [2,3]. Various cell signalling network models indicate that partial inhibition of PLoS ONE | www.plosone.org 1 June 2011 | Volume 6 | Issue 6 | e21544
-
Upload
independent -
Category
Documents
-
view
0 -
download
0
Transcript of Mitochondrial Pathway Mediates the Antileukemic Effects of Hemidesmus Indicus, a Promising Botanical...

Mitochondrial Pathway Mediates the AntileukemicEffects of Hemidesmus Indicus, a Promising BotanicalDrugCarmela Fimognari1*, Monia Lenzi1, Lorenzo Ferruzzi1, Eleonora Turrini1, Paolo Scartezzini2, Ferruccio
Poli2, Roberto Gotti3, Alessandra Guerrini4, Giovanni Carulli5, Virginia Ottaviano5, Giorgio Cantelli-
Forti1, Patrizia Hrelia1
1 Department of Pharmacology, Alma Mater Studiorum, University of Bologna, Bologna, Italy, 2 Department of Evolutionary and Experimental Biology, Alma Mater
Studiorum, University of Bologna, Bologna, Italy, 3 Department of Pharmaceutical Sciences, Alma Mater Studiorum, University of Bologna, Bologna, Italy, 4 Department of
Biology and Evolution, Agro-Technological and Pharmaceutical Resources (Agri-Unife), University of Ferrara, Ferrara, Italy, 5 Division of Hematology, Department of
Oncology, Transplants and New Technologies in Medicine, University of Pisa, Pisa, Italy
Abstract
Background: Although cancers are characterized by the deregulation of multiple signalling pathways, most currentanticancer therapies involve the modulation of a single target. Because of the enormous biological diversity of cancer,strategic combination of agents targeted against the most critical of those alterations is needed. Due to their complexnature, plant products interact with numerous targets and influence several biochemical and molecular cascades. Theinterest in further development of botanical drugs has been increasing steadily and the FDA recently approved the first newbotanical prescription drug. The present study is designed to explore the potential antileukemic properties of Hemidesmusindicus with a view to contributing to further development of botanical drugs. Hemidesmus was submitted to an extensivein vitro preclinical evaluation.
Methodology/Principal Findings: A variety of cellular assays and flow cytometry, as well as a phytochemical screening,were performed on different leukemic cell lines. We have demonstrated that Hemidesmus modulated many components ofintracellular signaling pathways involved in cell viability and proliferation and altered the protein expression, eventuallyleading to tumor cell death, mediated by a loss of mitochondrial transmembrane potential and increased Bax/Bcl-2 ratio.ADP, adenine nucleotide translocator and mitochondrial permeability transition pore inhibitors did not reverse Hemidesmus-induced mitochondrial depolarization. Hemidesmus induced a significant [Ca2+]i raise through the mobilization ofintracellular Ca2+ stores. Moreover, Hemidesmus significantly enhanced the antitumor activity of three commonly usedchemotherapeutic drugs (methotrexate, 6-thioguanine, cytarabine). A clinically relevant observation is that its cytotoxicactivity was also recorded in primary cells from acute myeloid leukemic patients.
Conclusions/Significance: These results indicate the molecular basis of the antileukemic effects of Hemidesmus and identifythe mitochondrial pathways and [Ca2+]i as crucial actors in its anticancer activity. On these bases, we conclude thatHemidesmus can represent a valuable tool in the anticancer pharmacology, and should be considered for furtherinvestigations.
Citation: Fimognari C, Lenzi M, Ferruzzi L, Turrini E, Scartezzini P, et al. (2011) Mitochondrial Pathway Mediates the Antileukemic Effects of Hemidesmus Indicus, aPromising Botanical Drug. PLoS ONE 6(6): e21544. doi:10.1371/journal.pone.0021544
Editor: Rakesh K. Srivastava, The University of Kansas Medical Center, United States of America
Received March 14, 2011; Accepted May 31, 2011; Published June 28, 2011
Copyright: � 2011 Fimognari et al. This is an open-access article distributed under the terms of the Creative Commons Attribution License, which permitsunrestricted use, distribution, and reproduction in any medium, provided the original author and source are credited.
Funding: This work was supported by Ministero dell’Istruzione dell’Universita e della Ricerca (http://sitouniversitario.cineca.it; grant number: 2007SSZMPK) andFIRB Piattaforme/Reti 2006 (http://sitofirb.cineca.it; grant number: RBPR05NWWC_002). The funders had no role in study design, data collection and analysis,decision to publish, or preparation of the manuscript.
Competing Interests: The authors have declared that no competing interests exist.
* E-mail: [email protected]
Introduction
Cancer is a complex disease characterized by multiple genetic
and molecular alterations involving transformation, deregula-
tion of apoptosis, proliferation, invasion, angiogenesis and
metastasis [1]. It now appears that, for many cancers, multiple,
redundant aberrant signaling pathways are at play as a result of
genetic perturbations at different levels. Recent studies observe
that in any given type of cancer 300–500 normal genes have
been modified to result in the cancerous phenotype [2].
Although cancers are characterized by the deregulation of
multiple signalling pathways at multiple steps, most current
anticancer therapies involve the modulation of a single target.
Because of the enormous biological diversity of cancer, strategic
combination of agents targeted against the most critical of those
alterations is needed. In addition, due to mutation in the target,
treatment of cancer cells with a mono-targeted agent may
induce adaptive resistance to a mono-targeted agent, but
resistance is less likely if there are multiple targets [2,3]. Various
cell signalling network models indicate that partial inhibition of
PLoS ONE | www.plosone.org 1 June 2011 | Volume 6 | Issue 6 | e21544
a number of targets is more effective than the complete
inhibition of a single target [2]. Multi-targeted drugs hit
multiple targets. An example of multi-targeted drug is sunitinib
as it targets c-KIT, but it also has activity against receptors for
vascular endothelial growth factor, platelet-derived growth
factor and the FMS-like tyrosine kinase 3 (FTLT3). In addition
to multi-targeted therapeutics, multicomponent therapeutics is
also proposed [4].
Due to their complex nature, accumulating evidence suggests
that plant products interact with numerous recent targets, which
strengthens the view that they influence numerous biochemical
and molecular cascades [5]. They are also relatively safe and
affordable in most cases.
In recent years, the interest in further development of botanical
drug products has been increasing steadily. Recently, the FDA
approved the first botanical drug, a water extract of green tea
leaves for perianal and genital condyloma. Unlike most small-
molecule drugs that are comprised of a single chemical compound,
the FDA-approved drug contains a mixture of known and possibly
active compounds [6]. It is the first new botanical prescription
drug approved by the FDA since the publication of the FDA’s
industry guidelines for botanical drug products in June 2004. Of
note, as specified in the FDA’s guidelines, the term botanicals does
not include highly purified substances derived from botanical
sources [7]. However, the approval of the first botanical drug
shows that new therapies from natural complex mixtures can be
developed to meet current FDA standards of quality control and
clinical testing.
In the last few years, interest in developing botanical drugs
escalated. The number of submissions increased rapidly from 5–10
per year in 1990–1998 to an average of 22 per year in 1999–2002
and nearly 40 per year in 2003–2007 [6]. In the United States,
there are about 10 to 20 botanical drugs that are going through
serious clinical development [8]. Among the therapeutic areas,
the number of botanical products submitted to the FDA was
particularly high for cancer and related conditions. These data
indicate a growing interest in several therapeutic areas towards a
rigorous clinical evaluation of botanical drugs, with a focus on
indications where there is a clear medical need for new treatments
(e.g., cancer) [6].
Hemidesmus indicus Linn. R. Br. (Family Asclepiadaceae) has been
found to exhibit many biological activities, such as antitumor, anti-
inflammatory, antioxidant, antimicrobial, hepatoprotective, ne-
phroprotective, otoprotective [9–13]. Despite its different biolog-
ical effects, the extensive phytochemical investigations and its past
admittance in the British Pharmacopoeia [14–18], Hemidesmus
lacks systematic scientific evaluation and its anticancer mecha-
nisms remain elusive.
The present study was designed to explore the potential
antileukemic properties of Hemidesmus indicus with a view to
contributing to further development of herbal or botanical drug
products derived from traditional preparations. Hemidesmus was
submitted to an extensive in vitro preclinical evaluation. In
particular, we tested the decoction of the plant roots, which
represents the most used form in the traditional medicine. First of
all, we performed a phytochemical screening of the decoction. We
then investigated its antileukemic effects, also in association with
some conventional anticancer drugs, and assessed the molecular
mechanisms involved in its cytostatic and cytotoxic effects through
an extensive flow cytometric investigation. Since a key event in the
antileukemic activity of Hemidesmus was [Ca2+]i rises, we explored
the underlying mechanisms through the use of different inhibitors.
Finally, we tested Hemidesmus on cells isolated from acute myeloid
leukemia (AML) patients.
Methods
Ethics statementThe described study was approved by the Comitato Etico e
Sperimentazione del Farmaco dell’Azienda Ospedaliero-Universi-
taria Pisana and written informed consent was obtained from the
patients. All clinical investigation was conducted according to the
principles expressed in the Declaration of Helsinki.
Plant decoction preparationHemidesmus indicus (voucher #MAPL/20/178) was collected
from Ram Bagh (Rajasthan, India), and authenticated by Dr. MR
Uniyal, Maharishi Ayurveda Product Ltd., Noida, India. The
plant decoction was prepared according to the method described
in the Ayurvedic Pharmacopoeia of India [19]. Briefly, 10 g of
grinded roots of Hemidesmus were mixed with 300 mL of boiling
water, allowing the volume of water to reach 75 mL. The
decoction was filtered, lyophilized, aliquoted and stored at room
temperature. Immediately before the assays, the samples were
resuspended in water and centrifuged at 2000 rpm to discard any
insoluble material. Eventually, samples were sterile-filtered when
necessary.
HPLC analysis of plant decoctionHPLC analysis was performed to quantify the main phytomar-
kers of Hemidesmus samples, namely 2-hydroxy-4-methoxybenzal-
dehyde, 3-hydroxy-4-methoxybenzaldehyde and 2-hydroxy-4-
methoxybenzoic acid. The reference compounds (all obtained
from Sigma, St. Louis, MO, USA) were used as external standards
to set up and calculate appropriate calibration curves. The
experimental conditions were performed using a Jasco modular
HPLC (Tokyo, Japan, model PU 2089) coupled to a diode array
apparatus (MD 2010 Plus) linked to an injection valve with a
20 mL sampler loop. The column used was a Tracer Extrasil
ODS2 (2560.46 cm, i.d., 5 mm) with a flow rate of 1.0 mL/min.
The mobile phase consisted of solvent solution B (methanol) and A
(water/formic acid = 95:5). The gradient system adopted was
characterized by five steps: 1, isocratic, B/30 for 15 min; 2, B
raised progressively from 30% to 40% at 20 min; 3, B then raised
to 60% at 50 min; 4, B achieved 80% at 55 min and 5, 100% at
60 min. Injection volume was 40.0 mL. Chromatograms were
recorded, and peaks from Hemidesmus samples were identified by
comparing their UV spectra and retention time with those from
the pure standards. The identity was also confirmed by 1H NMR
on the enriched fraction of the compounds obtained by soxhlet
extraction in CHCl3/EtOH 1:1.
Peak area was calculated by integration using dedicated Borwin
software (Borwin ver. 1.22, JMBS Developments, Grenoble,
France).
Standard solution and calibration procedureIndividual stock solutions of 2-hydroxy-4-methoxybenzalde-
hyde, 3-hydroxy-4-methoxybenzaldehyde and 2-hydroxy-4-meth-
oxybenzoic acid were prepared in water. Six different calibration
levels were prepared within the following range: 2.0–20.0 mg/mL
for 2-hydroxy-4-methoxybenzaldehyde, 1.5–40.0 mg/mL for 3-
hydroxy-4-methoxybenzaldehyde, and 1.0–100.0 mg/mL for 2-
hydroxy-4-methoxybenzoic acid. Each calibration solution was
injected into HPLC in triplicate. Regression analysis of peak area
of the analytes versus the related concentrations provided the
calibration graphs.
The analysis of the decoction (31 mg/mL) was carried out
under the same experimental conditions and the concentration of
Antileukemic Effect of Hemidesmus Indicus
PLoS ONE | www.plosone.org 2 June 2011 | Volume 6 | Issue 6 | e21544
the three components was determined by the obtained calibration
graphs. At least three different batches of Hemidesmus were tested.
Leukemic cell linesHuman leukemia Jurkat (acute T lymphoblastic leukemia),
CEM (acute T lymphoblastic leukemia), HL-60 (acute promyelo-
cytic leukemia), REH (non-T, non-B lymphoblastic leukemia) and
KU812F (chronic myeloblastic leukemia) cell lines were grown in
suspension and propagated in RPMI 1640 supplemented with
10% (Jurkat, CEM, REH, KU812F) or 20% (HL-60) heat-
inactivated bovine serum, 1% antibiotics (all obtained from
Sigma). To maintain exponential growth, the cultures were
divided every third day by dilution to a concentration of 16105
cells/mL. Cells were treated with different concentrations of
Hemidesmus (0.0–3.1 mg/mL) (prepared from a stock solution of
31 mg/mL) for different times at 37uC.
PatientsThe characteristics of the patients studied are given in Table 1.
The diagnosis of leukemia was established by combination of
morphological, immunological, cytogenetic and molecular meth-
ods, which were applied to peripheral blood samples. The
immunological assays were made by fluorochrome-conjugated
monoclonal antibodies and analysis by a three-laser (488, 633,
405 nm)-equipped flow cytometer (FacsCanto II, Becton Dick-
inson, San Jose, CA, USA). A six-color method was applied;
therefore the following fluorochrome combination was used:
fluorescein isothiocyanate, phycoerythrin, peridinin chlorophyll
protein complex, phycoerythrin-cyanine 7, allophycocyanin,
allophycocyanin-cyanine 7. A wide panel of monoclonal antibod-
ies was used that always included: CD45, CD13, CD33, CD34,
CD117, HLA-DR, CD4, CD14, CD64, CD38, MPO, CD11b,
CD16, CD15, CD56, CD7, CD19 (all from Becton Dickinson).
Cytogenetic analysis was made by standard banding methods and
by fluorescence in situ hybridization methods. The molecular
methods, carried out by PCR, included the following fusion genes:
AML1/ETO, CBFb/MYH11, and BCR-ABL. In addition,
FLT3/internal tandem duplication (ITD) was also investigated.
According to current prognostic criteria, four risk groups (low,
intermediate, intermediate-high, high) were defined. Patients were
studied at the time of diagnosis; one patient was studied during
him first relapse.
Preparation of leukemic cellsPeripheral blood samples of patients were collected in tubes
containing preservative-free heparin. Leukemic cells were ob-
tained by Ficoll-Histopaque density gradient centrifugation.
Interphase mononuclear cells were recovered, washed twice with
phosphate-buffered saline and then resuspended in RPMI 1640
medium (Sigma) containing 15% heat-inactivated bovine serum.
The samples always contained .95% blasts.
Flow cytometryAll flow cytometric procedures were performed with a Guava
EasyCyte Mini flow cytometer (Guava Technologies-Millipore,
Hayward, CA, USA). Approximately 5,000 events (cells) were
evaluated for each sample. In all cytofluorimetric determinations,
cell debris and clumps were excluded from the analysis by gating.
Cell viabilityCells were treated with different concentrations of Hemidesmus
for one cell cycle. Viability was determined immediately after the
end of treatment by flow cytometry. Briefly, cells were mixed with
an adequate volume of Guava ViaCount Reagent (containing
propidium iodide, Guava Technologies) and allowed to stain
5 min at room temperature. IC50 (inhibitory concentration
causing cell toxicity by 50% following one cell-cycle exposure)
was calculated by interpolation from dose-response curve.
Detection of apoptosisAfter 24 h of treatment with different concentrations of
Hemidesmus alone or in combination with methotrexate (0.05–
0.25 mM, Sigma), 6-thioguanine (3.75–30 mM, Sigma) or cytara-
bine (0.10–1.25 mM, Sigma), aliquots of 2.06104 cells were stained
with 100 mL of Guava Nexin Reagent (containing ANNEXIN-V-
phycoerythrin and 7-amino-actinomycin D) and incubated for
20 min at room temperature in the dark. Samples were then
analyzed by flow cytometry. Camptothecin 2 mM was used as
positive control.
The analysis was also performed on Jurkat cells treated with
2-hydroxy-4-methoxybenzaldehyde (2.5 mg/mL), 3-hydroxy-4-
methoxybenzaldehyde (18.5 mg/mL) or 2-hydroxy-4-methoxyben-
zoic acid (22.0 mg/mL).
Detection of caspase-8 and caspase-3 activity by flowcytometry
Active caspases’ detection employed an affinity label method-
ology, using the caspase-8-preferred substrate leucine-glutamic
acid-threonine-aspartic acid (LETD) or the caspase-3-preferred
substrate amino acid sequence aspartic acid-glutamic acid-valine-
aspartic acid (DEVD) linked to a fluoromethylketone (FMK)
Table 1. Clinical features of patients.
Diagnosis Sex Age FAB classification WBCa Immunophenotype Karyotype Molecular biology Risk
AML-1 M 78 M5 15 000 CD33+, CD13+, CD38+, CD15+ 46,XY 20%;47,XY;+8 80%
Negative Intermediate-high
AML-2 F 66 M4 37 000 HLA-DR+, CD13+/2, CD33+, CD64+,CD14+/2, CD4+, CD11b+, CD15+,CD38+
46,XX FLT3 positive Intermediate
AML-3 M 85 M5 38 000 CD13+, CD33+, CD14+, CD64+,CD56+, CD15+, CD11b+
46,XY Negative Intermediate
AML-4 M 62 M4 30 000 CD34+, CD33+, CD13+,CD117+/2, CD7+, CD38+, CD15 +/2
46,XY FLT3 positive/ITDb High
aWBC: number of cells/mm3 whole blood;binternal tandem duplication.doi:10.1371/journal.pone.0021544.t001
Antileukemic Effect of Hemidesmus Indicus
PLoS ONE | www.plosone.org 3 June 2011 | Volume 6 | Issue 6 | e21544

moiety, which reacts covalently with the catalytic cysteine residue
in the active enzymatic center. A 6-carboxyfluorescein (FAM)
group linked to LETD- or DEVD-FMK was used as a reporter.
After 24 h of treatment with Hemidesmus 0.93 mg/mL, cells were
stained with 10 mL of freshly prepared 10X working dilution
FAM-LETD-FMK (Guava Technologies) or 10 mL of freshly
prepared 30X working dilution FAM-DEVD-FMK solution
(CHEMICON International, Temecula, CA, USA) and incubated
for 1 h at 37uC, protecting tubes from light. After washing, cells
were resuspended in 150 mL of 7-aminoactinomycin D diluted
1:200 in 1X working dilution wash buffer (Guava Technologies),
incubated for 5 min at room temperature in the dark, and
analyzed via flow cytometry. Camptothecin 2 mM was used as
positive control.
Measurement of mitochondrial potentialMitochondrial potential was assessed by using JC-1 (5,59,6,69-
tetrachloro-1,19,3,39-tetraethylbenzimidazol-carbocyanine iodide).
After 24 h of treatment with Hemidesmus 0.93 mg/mL, 200 mL of
cell suspension were treated with 4 mL of 50X staining solution
(Guava Technologies), containing JC-1 and 7-amino-actinomycin
D. Cells were incubated for 30 min at 37uC and analyzed via flow
cytometry. Valinomycin 0.09 mM was used as positive control.
The experiments were also performed in the presence of
bongkrekic acid (BA, 20 mM, Sigma) for 2 h, carboxyatractyloside
(CATR, 20 mmol/L, Sigma) for 90 min, ADP (500 mM) plus
oligomycin (20 mg) for 1 h, or cyclosporine A (Cyc A, 1 mM,
Sigma) for 1 h. The cultures were preincubated with the above
reported compounds for the indicated times then cultured with
and without Hemidesmus.
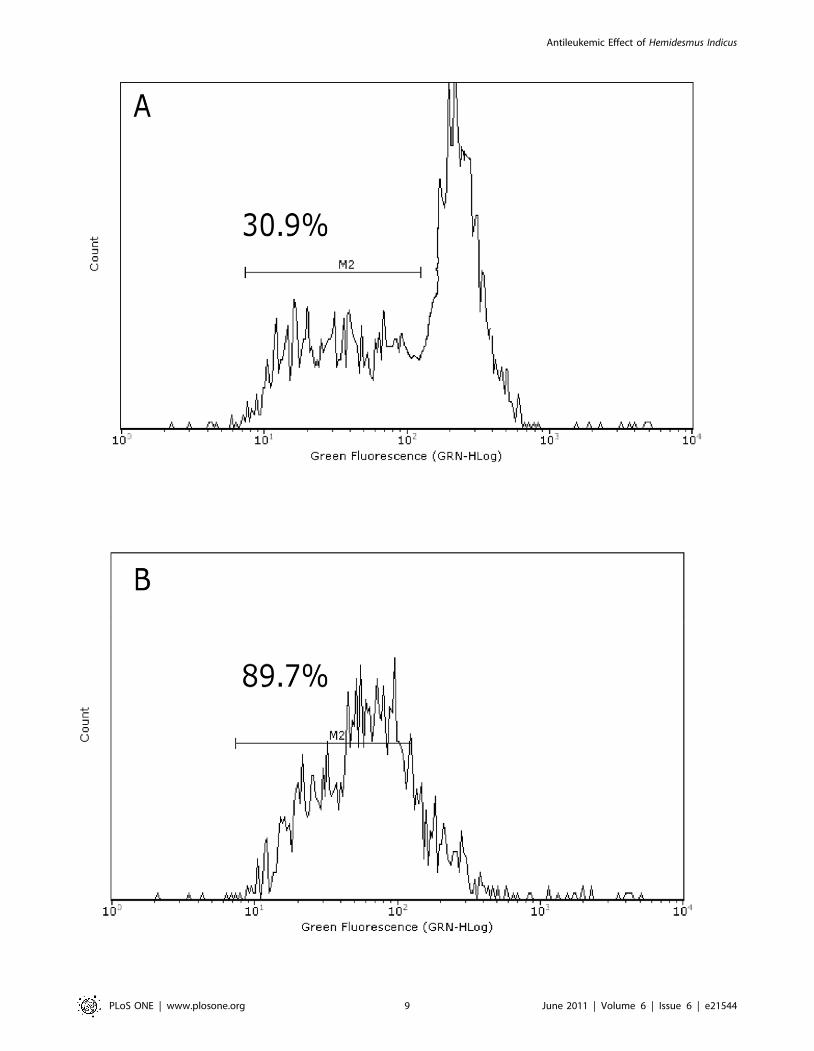
Analysis of cytochrome c releaseMitochondrial cytochrome c release was monitored during cell
death of digitonin-permeabilized cells immunolabeled for cyto-
chrome c. After triggering of apoptosis by Hemidesmus treatment,
we determined the fraction of cells that have not yet released their
mitochondrial cytochrome c and were still highly fluorescent, as
well as the fraction of apoptotic cells that have already released
their mitochondrial cytochrome c and, therefore, were much less
fluorescent.
Cells (16106) were harvested and treated with 1 mL digitonin
(100 mg/mL, Sigma) for 5 min on ice. Cells were fixed in
formaldehyde 4% for 20 min at room temperature, washed three
times in PBS 1x and incubated in incubation buffer (0.5 g BSA in
100 mL PBS 1x) for 1 h. The cells were incubated overnight at
4uC with 1:200 anti-cytochrome c monoclonal antibody (clone
7H8.2C12, BD Pharmingen, San Diego, CA, USA) in incubation
buffer, washed three times and incubated for 1 h at room
temperature with fluorescein isothiocyanate-labeled secondary
antibody (1:100, Sigma). The cells were then analyzed to quantify
fluorescein isothiocyanate binding by flow cytometry. Mean
fluorescence intensity values were calculated. Non-specific binding
was excluded by gating around those cells which were labeled by
the fluorescein isothiocyanate-conjugate isotype control.
Measurement of intracellular Ca2+ ([Ca2+]i)[Ca2+]i was measured using the cell-permeable Ca2+-sensitive
fluorescent dye Fluo-3 acetoxymethyl ester. This dye freely
permeates the surface membrane but, following hydrolysis by
intracellular esterases, is trapped in cells as Fluo-3. The
fluorescence intensity of Fluo-3 is enhanced after it binds to
[Ca2+]i and depends on the free calcium concentration [20]. Cells
were incubated for 20 min at room temperature with 4 mM Fluo-3
acetoxymethyl ester diluted in Krebs-Ringer buffer [10 mM D-
glucose, 120 mM NaCl, 4.5 mM KCl, 0.7 mM Na2HPO4,
1.5 mM NaH2PO4, and 0.5 mM MgCl2 (pH 7.4 at 37uC);
Sigma]. After washing, the cultures were treated with the indicated
concentration of Hemidesmus. At the end of incubation, cells were
washed in 5 ml of Ca2+-free PBS at 37uC, resuspended in 1 ml of
Ca2+-free PBS at 37uC and analyzed immediately by flow
cytometry.
The experiments were also performed in the presence of
nifedipine (10 mmol/L, Sigma), econazole (3 mM, Sigma), thapsi-
gargin (1 mM, Sigma), aristolochic acid (50 mM, Sigma). The
cultures were preincubated with the above reported compounds
for 10 min then cultured with and without Hemidesmus for 10 min.
The experiments were performed in Ca2+-containing medium
(RPMI 1640).
Cell proliferationCarboxyfluorescein diacetate succinimidyl ester diffuses freely
into cells where intracellular esterases cleave off the acetate
groups, converting it to a fluorescent, membrane-impermeant
dye. The dye is equally distributed between daughter cells due to
covalent crosslinking to proteins through its succinimidyl groups.
The stain is long lived, allowing the resolution of at least three or
four cycles of cell division. Propidium iodide is then added to
distinguish the live from the dead cells. Through the use of
differential staining by the two fluorescent dyes, live and dead
proliferated and unproliferated cells can be distinguished. 256106
cells were incubated with carboxyfluorescein diacetate succini-
midyl ester for 15 min at 37uC. After three washes, cell
concentration was adjusted to 16106/mL with complete
medium. Cells were treated with different concentrations of
Hemidesmus for 24 h. After incubation, cells were treated with
5 mL of cell growth propidium iodide reagent (Guava Technol-
ogies), incubated in the dark at room temperature for 5 min, and
analyzed via flow cytometry.
Cell-cycle distributionCells were treated with different concentrations of Hemidesmus
for 8, 24 and 48 h, and then fixed with ice-cold 70% ethanol. After
washing, cultures were resuspended in 200 mL Guava Cell Cycle
Reagent (containing propidium iodide), incubated at room
temperature for 30 min, shielded from light, and analyzed via
flow cytometry.
Analysis of cell-cycle and apoptotic proteinsAfter treatment with Hemidesmus indicus 0.93 mg/mL for 24 h,
16106 cells were fixed and permeabilized by 2% of paraformal-
dehyde in PBS 1X and 90% of cold methanol. They were then
incubated with fluorescein isothiocyanate cyclin A (10:100,
Beckman Coulter, Brea, CA, USA), p21 (2:100, Abcam, San
Francisco, CA, USA), cyclin E (1:100, Abcam), CDK2 (0.6:100,
Abcam), Bax (1:100, Santa Cruz Biotechnology, Santa Cruz, CA,
USA), Bcl-2 (1:100, Santa Cruz Biotechnology), fluorescein
isothiocyanate 85 kDa fragment of cleaved poly ADP-ribose
polymerase (1:100, PARP, Invitrogen), or isotype-matched
negative control (1:100, e-Bioscience, San Diego, CA, USA)
antibodies. The cells (except those stained with cyclin A and
PARP) were washed and incubated with fluorescein isothiocya-
nate-labeled secondary antibody (1:100, Sigma). The cells were
then analyzed to quantify fluorescein isothiocyanate binding by
flow cytometry. Mean fluorescence intensity values were calculat-
ed. Non-specific binding was excluded by gating around those cells
which were labeled by the fluorescein isothiocyanate-conjugate
isotype control.
Antileukemic Effect of Hemidesmus Indicus
PLoS ONE | www.plosone.org 4 June 2011 | Volume 6 | Issue 6 | e21544
Statistical analysisAll results are expressed as the mean 6 SEM. Differences
among treatments were evaluated by one-way or two-way
ANOVA, followed by Dunnett or Bonferroni post-test, using
GraphPad InStat version 4.00 for Windows 95 (Graphpad Prism,
San Diego, CA, USA). P,0.05 was considered significant.
Interactions between Hemidesmus and anticancer drugs were
classified using the combination index (CI). CI analysis provides
qualitative information on the nature of drug interaction, and
CI, a numerical value calculated as described in the following
equation, also provides a quantitative measure of the extent of
drug interaction [21].
CI~CA,x
ICx,Az
CB,x
ICx,B
CA,x and CB,x are the concentrations of drug A and drug B used
in combination to achieve6% drug effect. ICx,A and ICx,B are the
concentrations for single agents to achieve the same effect. A CI of
less than, equal to, and more than 1 indicates synergy, additivity,
and antagonism, respectively.
Results
Decoction of Hemidesmus indicus contains 2-hydroxy-4-methoxybenzaldehyde, 3-hydroxy-4-methoxybenzaldehyde and 2-hydroxy-4-methoxybenzoic acid
The real sample represented by a decoction of Hemidesmus indicus
analysed by the applied HPLC method was found to contain 2-
hydroxy-4-methoxybenzaldehyde, 3-hydroxy-4-methoxybenzalde-
hyde and 2-hydroxy-4-methoxybenzoic acid. Linearity, limit of
detection (LOD), limit of quantification (LOQ) and recovery were
excellent. In particular, the correlation coefficients (r2) were found
to be .0.999 for the three considered analytes. The sensitivity
was estimated by dilution of standard solutions. The LOQ was
reasonably assumed as the lowest calibration point for each of the
considered phytomarkers. The LODs were found to be 0.53 mg/
mL, 0.80 mg/mL and 0.30 mg/mL for 3-hydroxy-4-methoxyben-
zaldehyde, 2-hydroxy-4-methoxybenzaldehyde and 2-hydroxy-4-
methoxybenzoic acid, respectively.
The recovery was estimated by spiking at 10 mg/mL level of
concentration of each of the compounds and resulted to be within
96 – 101%.
The amounts found in the decoction (31 mg/mL) were:
2.560.1 mg/mL for 2-hydroxy-4-methoxybenzaldehyde, 18.56
0.3 mg/mL for 3-hydroxy-4-methoxybenzaldehyde, 22.260.5 mg/
mL for 2-hydroxy-4-methoxybenzoic acid. The analyses were
performed on the decoction obtained from three different batches
and the difference among the batches in the phytomarker content
resulted not significant (data not shown).
Hemidesmus indicus decreases cell viabilityHemidesmus reduced cell viability in all tested cell lines (data not
shown). Based on the cytotoxicity results, cells were treated with
concentrations of Hemidesmus indicus similar or smaller than the
IC50 (0.62, 0.93 and 1.90 mg/mL) for 24 h. Hemidesmus treatment
induced apoptosis at all the concentrations tested and in all tested
cell lines (Figure 1A). For example, after treatment of Jurkat cells
with 0.62 mg/mL of Hemidesmus, the incidence of apoptotic cells
was 36% (versus 6% in the control). They increased to 44% after
treatment with the highest doses studied (Figure 1B). However,
1.90 mg/mL of Hemidesmus induced a significant increase of
necrotic cells (Figure 1B). Similar results were recorded for the
other cell lines (Figure 1A). Since the highest increase in apoptotic
cells with respect to the control was seen in Jurkat cells, the
following analyses were conducted in this cell line. For excluding
necrotic events, concentrations of up to 0.93 mg/mL were used.
No induction of apoptosis was observed in Jurkat cells following
treatment with 2-hydroxy-4-methoxybenzaldehyde, 3-hydroxy-4-
methoxybenzaldehyde or 2-hydroxy-4-methoxybenzoic acid (data
not shown).
Hemidesmus indicus affects caspase-3 but not caspase-8activity and activates PARP
Caspase-3 activity was significantly increased in cells treated
with Hemidesmus (0.93 mg/mL). The percentage of activated
caspase-3 cells in non treated cultures was about 3% which was
increased to 9% in cells treated with Hemidesmus (P,0.01) (data
not shown). An important reporter for caspase-3 activation is
PARP. Hemidesmus (0.93 mg/mL) induced PARP cleavage in
about 55% of treated cells (Figure 1C). Figure 1D shows a
representative cytogram where two well-defined cell popula-
tions are distinguishable in Hemidesmus-treated cells after
labeling with fluorescein isothiocyanate 85 kDa fragment of
cleaved PARP. Only one population characterized by a lower
fluorescence intensity (white histogram) was recorded in
untreated cells.
Unstimulated Jurkat T cells incubated with FAM-LETD-FMK
generated a low detectable fluorescence signal, indicating that
levels of active caspase-8 were low in these cells. Caspase-8 activity
increased after treatment with the positive control camptothecin
but remained at basal levels after treatment with 0.93 mg/mL of
Hemidesmus (Figure 1E).
Hemidesmus indicus disrupts mitochondrialtransmembrane potential
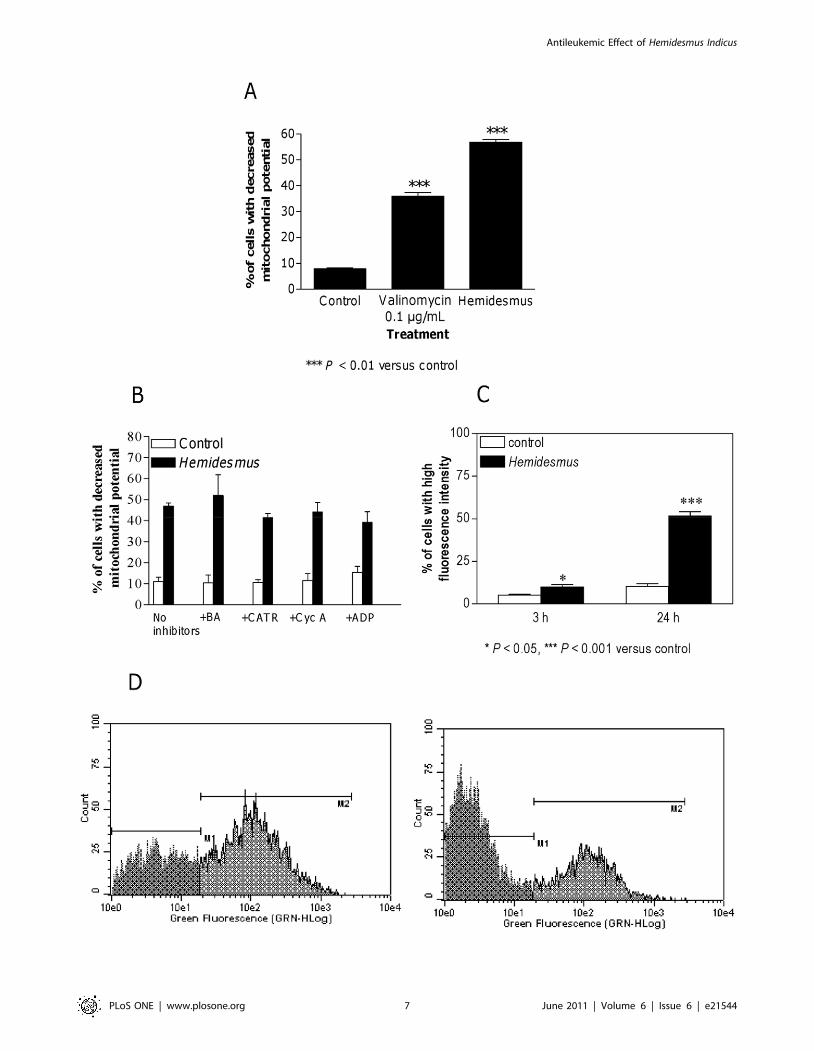
Treatment of Jurkat cells with 0.93 mg/mL of Hemidesmus indicus
resulted in a significant break-down of the mitochondrial mem-
brane potential. The effect of Hemidesmus resulted even greater
than that observed for valinomycin, used as positive control
(Figure 2A).
Cytochrome c release from mitochondria to cytosol is a
hallmark of apoptosis and is used to characterize the mitochon-
dria-dependent pathway of this type of cell death. After treatment
with Hemidesmus (0.93 mg/mL), the fraction of cells that retained
their mitochondrial cytochrome c, or the highly fluorescent cells,
gradually decreased and emerged as a population of low
fluorescent cells (Figure 3).
Since the mitochondrial pathway resulted clearly involved in the
proapoptotic activity of Hemidesmus, we investigated whether classic
adenine nucleotide translocator modulators, such as CATR and
BA, or Cyc, which targets cyclophilin D in the matrix, could
interfere with the action of Hemidesmus on mitochondrial
depolarization. Mitochondrial depolarization induced by Hemi-
desmus was not specifically inhibited by BA, CATR or Cyc A
(Figure 2B). The adenine nucleotide translocator could not be
involved in the activity of Hemidesmus. To demonstrate the
opposite, the next set of experiments involved the use of ADP
plus oligomycin, which acts on the adenine nucleotide translocator
to inhibit pore opening. Oligomycin was added to avoid
mitochondrial ADP conversion into ATP. ADP did not reduce
the mitochondrial depolarization induced by Hemidesmus
(Figure 2B). The mitochondrial depolarization of valinomycin,
used as positive control, was significantly attenuated by all the
Antileukemic Effect of Hemidesmus Indicus
PLoS ONE | www.plosone.org 5 June 2011 | Volume 6 | Issue 6 | e21544

Figure 1. Induction of apoptosis by Hemidesmus indicus. Fraction of viable, apoptotic and necrotic cells in different leukemic cell lines (A), inJurkat cells (B), cleavage of PARP (C–D) and activation of caspase-8 (E) following treatment with Hemidesmus for 24 h. Data are means 6 SEM of fourindependent experiments.doi:10.1371/journal.pone.0021544.g001
Antileukemic Effect of Hemidesmus Indicus
PLoS ONE | www.plosone.org 6 June 2011 | Volume 6 | Issue 6 | e21544
Antileukemic Effect of Hemidesmus Indicus
PLoS ONE | www.plosone.org 7 June 2011 | Volume 6 | Issue 6 | e21544

inhibitors. The effect was particularly marked following treatment
with ADP (data not shown).
Hemidesmus indicus increases [Ca2+]i
Elevation of cytosolic Ca2+ is sufficient to induce mitochondrial
permeability transition pore opening and brings to apoptosis in
different cell systems [22]. We therefore studied the ability of
Hemidesmus to modulate [Ca2+]i. Following 24 h-treatment with
Hemidesmus, [Ca2+]i was found to be about 5 times higher than
that of the controls (Figure 2C). Short times of exposure (3 h)
induced a smaller but still significant increase in [Ca2+]i
(Figure 2C). The recorded mean fluorescence intensity values
clearly indicated two defined cell populations with different
intracellular calcium levels (Figure 2D). In Hemidesmus-treated
cells, the mean fluorescence values were 162.88 and 6.49
(P,0.01), respectively (Figure 2D).
Experiments were performed to explore the pathway of
Hemidesmus-induced [Ca2+]i raise. The removal of extracellular
Ca2+ did not abolish the [Ca2+]i raise induced by Hemidesmus (data
not shown). Some Ca2+ influx inhibitors, such as nifedipine and
econazole, failed to affect Hemidesmus-induced [Ca2+]i rise in Ca2+-
containing medium (Figures 4A and B). In contrast, aristolochic
acid and thapsigargin significantly increased Hemidesmus-induced
[Ca2+]i rise (Figures 4C and D).
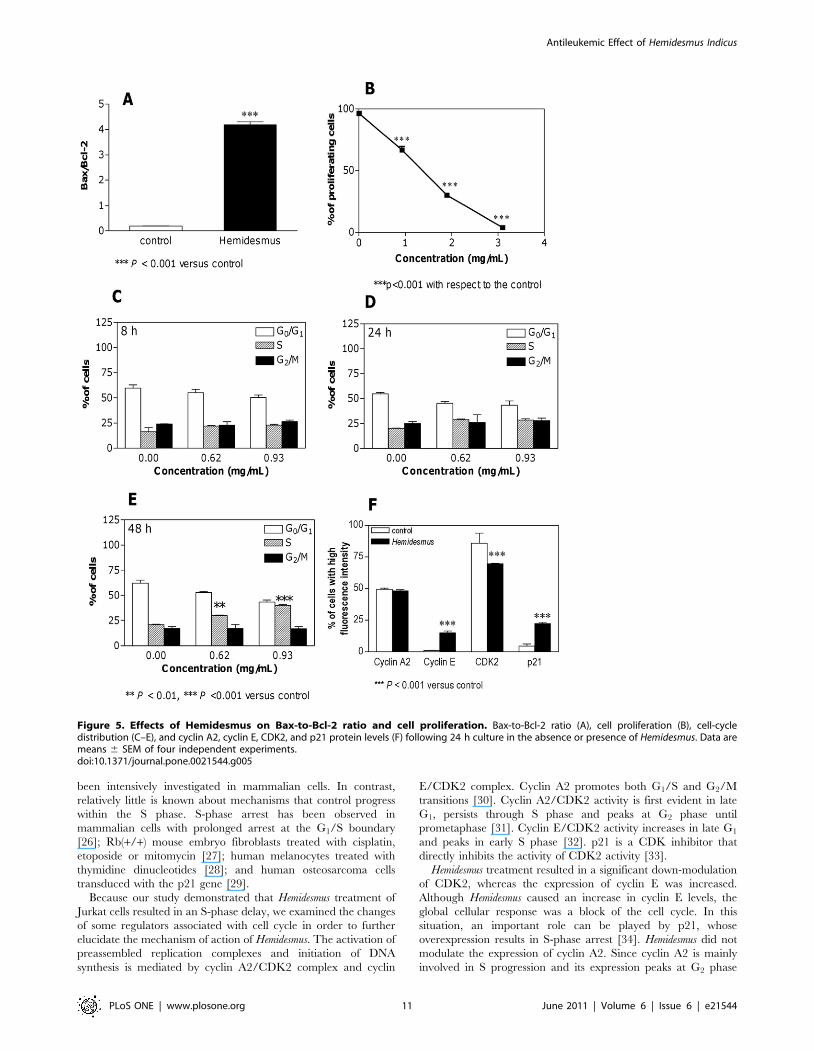
Hemidesmus indicus affects the expression of Bax andBcl-2 protein levels
To quantify Bax and Bcl-2 expression, the mean fluorescence
intensity values were used. Both Bcl-2 and Bax expression were
found to be significantly increased in treated cells relative to
untreated cells (data not shown). Bax-to-Bcl-2 ratio was deter-
mined by using the mean fluorescence intensity value of
Hemidesmus-treated cells that was normalized to the mean
fluorescence intensity of untreated (control) samples within each
group (Figure 5A). The Bax-to-Bcl-2 ratio was significantly higher
than the control group (P,0.001).
Hemidesmus indicus perturbs Jurkat cell proliferationHemidesmus significantly suppressed the progression of cells into
the cell cycle (Figure 5B). At 0.93 mg/mL, Hemidesmus suppressed
Jurkat proliferation by 30% and at 1.90 mg/mL by 66%. At
3.10 mg/mL, cell-cycle progression was almost completely
suppressed. By looking at the fraction of live and dead
proliferated and unproliferated cells, we observed that more
than 90% of the cells were proliferated and dead (propidium
iodide-positive) at the highest concentration of Hemidesmus tested
(data not shown). These results indicate that the cytotoxicity of
Hemidesmus against Jurkat cells was attributable to both the
cytostatic effect causing the prevention of cell proliferation and
the apoptotic and/or necrotic effect causing the loss of cell
viability. Furthermore, these results confirm that low doses of
Hemidesmus (0.93 mg/mL) could induce apoptotic cell death, but
not necrosis. Since cell death represents the prevalent effect at the
highest doses of Hemidesmus tested, the following analyses were
limited to concentrations of up to 0.93 mg/mL.
Hemidesmus indicus alters cell-cycle residenceAt all concentrations, addition of Hemidesmus caused a dose-
related accumulation of cells in the S phase (Figure 5C-E). The
immediate effects (8 h) appeared primarily as an increase in the
proportion of cells in the S phase of the cell cycle (from about 16%
to 22%) accompanied by a slight compensatory decrease in G1
phase cells. Longer exposure (24 h) led to a further decrease in the
proportion of G1 cells, while the percentage of cells in S phase
increased from 20% to 29%. Prolonged (48 h) exposure appeared
as a decrease in G1 phase cells (from 62% to 43%), an unaffected
fraction of G2/M phase cells and a marked increase in the
proportion of S cells (from 20 to 40%).
Hemidesmus indicus affects the expression of cell-cycleregulatory proteins
Since Hemidesmus was found to selectively alter the distribution
of Jurkat cells in the cell cycle, we evaluated its effects on the
expression of cell regulatory proteins including cyclins A2 and E,
CDK2 and p21. As shown in Figure 5F, the proteins specific for
CDK2, cyclin A2, cyclin E, and p21 were easily detectable in
continuously growing Jurkat cells. Among the protein levels, those
of cyclin A2 remained relatively constant, whereas those of both
cyclin E and p21 significantly increased after treatment with
Hemidesmus indicus for 24 h (Figure 5F). Moreover, treatment with
Hemidesmus greatly decreased the expression of CDK2 (Figure 5F).
Hemidesmus indicus increases the antitumor efficacy of6-thioguanine, cytarabine and methotrexate
To investigate whether Hemidesmus could increase the cytotox-
icity of some anticancer drugs, cells were treated with a
combination of 6-thioguanine, cytarabine or methotrexate plus
Hemidesmus. We measured the proapoptotic effect of the combi-
nation using doses of Hemidesmus that induced submaximal toxicity
(0.31 mg/mL). This can allow observing potential additive or
synergistic effects. Combination of Hemidesmus with 6-thioguanine,
cytarabine or methotrexate had a synergistic or additive
proapoptotic effect compared with each drug present alone (data
summarized in Figure 6A-C). For instance, when 6-thioguanine
was used alone, a 33% of apoptotic cells (versus 5% in the untreated
cultures, P,0.001) was observed at the highest concentration
tested. When it was used together with 0.31 mg/mL of Hemidesmus,
a 51% of apoptotic cells was induced (Figure 6A). Similarly,
cytarabine alone at 1.25 mM induced a 35% of apoptotic cells
(versus 4% in the untreated culture, P,0.001), but co-presence of
Hemidesmus produced a 48% of apoptosis (Figure 6B). The CI was
found to be 0.6 for 6-thioguanine and 0.38 for cytarabine.
The effect of Hemidesmus was also observed on cells treated with
methotrexate. Treatment with methotrexate alone slightly affected
cell viability. The % of apoptotic cells observed following
treatment with methotrexate was similar to that of untreated
cultures (Figure 6C). Because of the relative insensitivity of Jurkat
cells to methotrexate, we could not calculate a CI. In this case, the
interaction between Hemidesmus and methotrexate was classified
using the fractional inhibition method as follows: when expressed
as the fractional inhibition of cell viability, additive inhibition
produced by both inhibitors (i) occurs when i1,2 = i1 + i2;
Figure 2. Fraction of cells with decreased mitochondrial potential and increased [Ca2+]i after Hemidesmus treatment. Alterations inmitochondrial membrane permeability in absence (A) and presence (B) of inhibitors following treatment with Hemidesmus 0.93 mg/mL. Fraction ofcells with increased [Ca2+]i following 3 or 24 h culture in the absence or presence of Hemidesmus (0.93 mg/mL) (C), flow cytometric analysis of [Ca2+]i
following 24 h culture in the absence or presence of Hemidesmus (0.93 mg/mL) (D). M1 and M2 indicate the two different populations characterizedby a different mean fluorescence intensity values. Data are means 6 SEM of four independent experiments.doi:10.1371/journal.pone.0021544.g002
Antileukemic Effect of Hemidesmus Indicus
PLoS ONE | www.plosone.org 8 June 2011 | Volume 6 | Issue 6 | e21544
Antileukemic Effect of Hemidesmus Indicus
PLoS ONE | www.plosone.org 9 June 2011 | Volume 6 | Issue 6 | e21544

synergism when i1,2 . i1 + i2; antagonism when i1,2 , i1 + i2 [23].
Using this method, the interaction between Hemidesmus and
methotrexate was additive.
Hemidesmus indicus induces cytotoxic effects onmononuclear cells isolated from AML patients
We first estimated the effect of Hemidesmus on the viability of
AML cells. Hemidesmus produced a cytotoxic effect in all samples
tested. Viability of cells treated with Hemidesmus during 24 h
decreased from 97.5% 61.2 in the control to 55.0% 63.1 in the
cells treated with Hemidesmus (P,0.001). To assess whether cell
death induced by Hemidesmus was due to apoptosis, we measured
the exposure of membrane phosphatidylserine by flow cytom-
etry. As shown in Figure 6D, Hemidesmus at 0.93 mg/mL
induced a 3-fold increase in apoptotic cell fraction in patients
AML-1, AML-2 and AML-3, and a 4-fold increase in AML-4
patient. Interestingly, the response to Hemidesmus was more
pronounced on blasts obtained from a recidivant patient
(AML4).
Discussion
In this study, we show that Hemidesmus indicus, a traditionally-
used medicinal plant, exerts potent antileukemic effects through
the modulation of different critical targets. Hemidesmus was
subjected to an HPLC analysis to quantify its main phytomarkers,
namely 2-hydroxy-4-methoxybenzaldehyde, 3-hydroxy-4-methox-
ybenzaldehyde and 2-hydroxy-4-methoxybenzoic acid. We then
examined its effect on human T-leukemia cell proliferation by
focusing on cell-cycle regulation. According to our flow cytometry
data, treatment of Jurkat cells with Hemidesmus resulted in a potent
inhibition of cell growth, due to the block of cells in the S phase.
Many stimuli can induce cell arrest at different phases. Agents
that cause damage to DNA or spindle apparatus will cause either
apoptosis or cell-cycle arrest, which usually occurs at the G1/S or
G2/M boundaries [24]. Moreover, certain taxanes and vinca
alkaloids that cause G2/M arrest by damaging microtubules have
proven clinically successful for cancer treatment [25]. Conse-
quently, cell-cycle arrest at the G1/S and G2/M transitions has
Figure 3. Fluorescence histograms of immunolabeled cytochrome c in cells untreated (A) or treated (B) with Hemidesmus (0.93 mg/mL). Note the decrease of the highly fluorescent cell population in region 1 (M1) and the progressive increase of the nonfluorescent cell populationin region 2 (M2). M1 and M2, regions arbitrarily defined to limit the population of cells with high and low fluorescence, respectively. Numbers at topof M1 and M2 regions are percentages of cells in each region. Histograms are representatives of three independent experiments.doi:10.1371/journal.pone.0021544.g003
Figure 4. Effect of different inhibitors on Hemidesmus-induced [Ca2+]i raise. Effects of nifedipine (A), econazole (B), aristolochic acid (C) andthapsigargin (D) on Hemidesmus-induced [Ca2+]i raise. Data are means 6 SEM of three independent experiments.doi:10.1371/journal.pone.0021544.g004
Antileukemic Effect of Hemidesmus Indicus
PLoS ONE | www.plosone.org 10 June 2011 | Volume 6 | Issue 6 | e21544
been intensively investigated in mammalian cells. In contrast,
relatively little is known about mechanisms that control progress
within the S phase. S-phase arrest has been observed in
mammalian cells with prolonged arrest at the G1/S boundary
[26]; Rb(+/+) mouse embryo fibroblasts treated with cisplatin,
etoposide or mitomycin [27]; human melanocytes treated with
thymidine dinucleotides [28]; and human osteosarcoma cells
transduced with the p21 gene [29].
Because our study demonstrated that Hemidesmus treatment of
Jurkat cells resulted in an S-phase delay, we examined the changes
of some regulators associated with cell cycle in order to further
elucidate the mechanism of action of Hemidesmus. The activation of
preassembled replication complexes and initiation of DNA
synthesis is mediated by cyclin A2/CDK2 complex and cyclin
E/CDK2 complex. Cyclin A2 promotes both G1/S and G2/M
transitions [30]. Cyclin A2/CDK2 activity is first evident in late
G1, persists through S phase and peaks at G2 phase until
prometaphase [31]. Cyclin E/CDK2 activity increases in late G1
and peaks in early S phase [32]. p21 is a CDK inhibitor that
directly inhibits the activity of CDK2 activity [33].
Hemidesmus treatment resulted in a significant down-modulation
of CDK2, whereas the expression of cyclin E was increased.
Although Hemidesmus caused an increase in cyclin E levels, the
global cellular response was a block of the cell cycle. In this
situation, an important role can be played by p21, whose
overexpression results in S-phase arrest [34]. Hemidesmus did not
modulate the expression of cyclin A2. Since cyclin A2 is mainly
involved in S progression and its expression peaks at G2 phase
Figure 5. Effects of Hemidesmus on Bax-to-Bcl-2 ratio and cell proliferation. Bax-to-Bcl-2 ratio (A), cell proliferation (B), cell-cycledistribution (C–E), and cyclin A2, cyclin E, CDK2, and p21 protein levels (F) following 24 h culture in the absence or presence of Hemidesmus. Data aremeans 6 SEM of four independent experiments.doi:10.1371/journal.pone.0021544.g005
Antileukemic Effect of Hemidesmus Indicus
PLoS ONE | www.plosone.org 11 June 2011 | Volume 6 | Issue 6 | e21544

[30], this differential regulation suggests that the effect of
Hemidesmus resides in early S phase.
Hemidesmus-treated cultures revealed a dose-dependent in-
crease in the percentage of apoptotic cells. Apoptosis is
primarily mediated through two pathways: the death receptor
pathway and the mitochondrial pathway. In the death receptor
pathway, a death receptor ligand, such as Fas ligand, binds to
its receptor, such as Fas, triggering aggregation of the death
receptor, recruitment of an adaptor molecule, such as FADD,
as well as pro-caspase-8 or -10 forming a complex named the
death inducing signaling complex. This results in the autocat-
alytic cleavage and activation of caspase-8 or caspase-10,
leading to activation of caspase-3 or -7 and induction of
apoptosis [35]. In the mitochondrial pathway, multidomain
proapoptotic proteins, excessive mitochondrial calcium and
reactive oxygen species induce the opening of the mitochon-
drial pore, with loss of mitochondrial integrity and transmem-
brane potential (DYm) [36]. Cytochrome c is released from the
mitochondria to form the apoptosome. The apoptosome then
activates caspase-9, which in turn activates caspase-3, thereby
inducing apoptosis. Many protein targets of active caspases are
biologically important apoptotic indicators of morphological
and biochemical changes associated with apoptosis [35]. One of
the essential substrates cleaved by caspase-3 is PARP, an
abundant DNA-binding enzyme that detects and signals DNA
strand breaks [37].
In our system, Hemidesmus activated caspase-3 and induced
PARP cleavage and cytochrome c release. The death receptor
pathway was not induced by Hemidesmus, as indicated by the lack of
activation of caspase-8. Thus, for the specific measurement of
DYm, Jurkat cells were loaded with the fluorochrome JC-1, a
cationic probe that distributes passively between media, the cytosol
and the mitochondria according to the Nernst’s equation, where
the final distribution of the fluorochrome depends mainly on the
transmembrane potential [38]. Compared to control cells,
Hemidesmus-treated cells had drop in DYm.
Figure 6. Induction of apoptosis by a combination of Hemidesmus and different anticancer drugs in Jurkat cells (A–C) and byHemidesmus on primary cells (D). Fraction of apoptotic cells induced by 6-thioguanine (A), cytarabine (B) or methotrexate (C) following 24 hculture in the absence or presence of Hemidesmus (0.31 mg/mL) and fraction of apoptotic cells induced by Hemidesmus on mononuclear cellsisolated from AML patients (D). Data on Jurkat cells are means 6 SEM of six independent experiments.doi:10.1371/journal.pone.0021544.g006
Antileukemic Effect of Hemidesmus Indicus
PLoS ONE | www.plosone.org 12 June 2011 | Volume 6 | Issue 6 | e21544
During the effector phase of mitochondria-dependent apoptosis,
the inner transmembrane potential of the mitochondria collapses,
indicating the opening of mitochondrial permeability transition
pores. Mitochondrial permeability transition activation compro-
mises the normal integrity of the mitochondrial inner membrane
resulting into uncoupled oxidative phosphorylation, ATP decay,
mitochondrial swelling and release of apoptogenic factors. The
structure and composition of the transition pore includes inner
membrane proteins, such as adenine nucleotide translocator, outer
membrane proteins, such as the voltage-dependent anion channel,
and cyclophilin D at contact sites between the mitochondrial outer
and inner membranes [22]. The inner and outer membrane
proteins operate in concert to create the conductance channels
[35]. The adenine nucleotide translocator is an ADP-ATP
antiporter that imports ADP to the matrix and exports ATP to
the cytosol [39]. The adenine nucleotide translocator alternates
between two distinct conformations in which adenine nucleotides
are either bound to the cytosolic side (c-state) or to the matrix side
(m-state) of the inner mitochondrial membrane [39]. CATR binds
to adenine nucleotide translocator in the c-state. CATR binding
occurs at a site similar to the ADP-binding site, thus preventing
ADP/ATP transport. BA binds to adenine nucleotide translocator
in the m-state. The two ligands are known to be adenine
nucleotide translocator specific inhibitors [39]. The third putative
component of the mitochondrial permeability transition is
cyclophilin D, which binds to complexes of voltage-dependent
anion channel and adenine nucleotide translocator in order to
form the mitochondrial permeability transition complex. Cyc A
was shown to block the binding of cyclophilin D [40].
To further elucidate the significance of mitochondria in
Hemidesmus-induced Jurkat cell death, we investigated the effects
of different inhibitors. Hemidesmus did not interact with adenine
nucleotide translocator and did not disturb the effect of BA,
CATR and Cyc A. The effect of Hemidesmus on mitochondrial
depolarization was not even modulated by ADP. Because ADP
is a potent ligand of the adenine nucleotide translocator [41],
the results confirm that Hemidesmus does not stimulate the
mitochondrial permeability transition through an interaction
with the adenine nucleotide translocator but to an unrelated
mechanism.
Numerous data have shown the pro-apoptotic effects of elevated
concentrations of intracellular calcium [42] and, accordingly,
many calcium ionophores are also apoptotic inductors in some cell
types [38]. Since Hemidesmus possesses a strong proapoptotic effect
in Jurkat cells, we were interested in studying its calcium
mobilization activity. The major pathways of [Ca2+]i increase
are Ca2+ influx from extracellular space and Ca2+ release from
internal Ca2+ stores. Numerous studies have demonstrated that
both pathways appear to be involved in the [Ca2+]i increase
associated with apoptosis [43]. Our study demonstrated that
Hemidesmus induced [Ca2+]i rise and explored the underlying
mechanisms.
Removal of extracellular Ca2+ did not abolish the [Ca2+]i raise
induced by Hemidesmus. Moreover, our results suggest that
Hemidesmus did not cause Ca2+ influx via stimulating store-
operated Ca2+ entry or voltage-gated Ca2+ channels because
nifedipine (a blocker of L-type voltage-gated Ca2+ channels) [44]
and econazole (an inhibitor of store-operated Ca2+ channels) [45]
failed to inhibit the [Ca2+]i raise. Aristolochic acid, a phospholi-
pase A2 inhibitor, increased Hemidesmus-induced [Ca2+]i raise.
These findings indicate that phospholipase A2 could be not
required for Hemidesmus-induced Ca2+ signal in our experimental
model. However, aristolochic acid is able to induce a rapid rise in
[Ca2+]i through both release of endoplasmic reticulum stores and
influx of extracellular Ca2+ [46]. To better understand the
mechanism of Hemidesmus, we used thapsigargin, a compound
that induces the release of intracellular endoplasmic reticulum
Ca2+ stores and prevents refilling by inhibition of the endoplasmic
reticulum Ca2+-ATPase [47]. Thapsigargin significantly increased
Hemidesmus-induced [Ca2+]i raise. On the whole, our results
suggest that Hemidesmus may cause [Ca2+]i raise through the
mobilization of intracellular Ca2+ stores.
The integrity of the mitochondrial outer membrane is regulated
by the Bcl-2 family. It has been shown that the Bcl-2 protein
physically interacts with several of its homologous proteins. The
most important interactions are considered to lie in Bcl-2/Bax
dimerization. Thus, we studied the profile of Bcl-2 and Bax gene
products in terms of protein expression. Our results showed that
Bax gene expression was markedly induced, suggesting that Bax
was upregulated and played an important role in the induction of
apoptosis after Hemidesmus exposure. However, in contrast to the
Bcl-2 inhibiting apoptotic cell death, the present study found that
Bcl-2 expression was also increased after Hemidesmus exposure
compared to control. The increase in anti-apoptotic Bcl-2 protein
may serve as a compensatory protection of the leukemia cells upon
Hemidesmus insult. Although the expressions of Bcl-2 and Bax, both
of them, were increased, the ratio of Bax/Bcl-2 (pro- to anti-
apoptotic proteins) was also increased after Hemidesmus treatment.
The findings support the notion that the relative concentrations of
pro-apoptotic and anti-apoptotic genes may act as a rheostat for
the cell death program [48].
Altogether, our results suggest that the growth inhibition of
Jurkat cells produced by Hemidesmus results from a combination of
apoptosis and of cell-cycle derangements in which S accumulation
is a key event. The Hemidesmus-induced S accumulation could have
potentially important clinical implications. This factor made
evaluation of the proapoptotic effects of Hemidesmus together with
anticancer agents an important focus of our pre-clinical experi-
ments. Cells which are synthesizing DNA usually display increased
susceptibility to most anticancer drugs (e.g. antimetabolites or
intercalating agents) [49]. The anticancer agents tested in this
study included 6-thioguanine, cytarabine and methotrexate. Their
inclusion was advantageous to determine whether Hemidesmus has
the potential to be used as an adjunct to beneficially enhance the
anticancer actions of certain clinically useful chemotherapeutic
agents. Accordingly, the ability of Hemidesmus to increase the
fraction of cells engaged in the S-phase of the cell division cycle
was useful in potentiating the efficacy of 6-thioguanine, cytarabine
and methotrexate.
In the last part of our study, we preliminarily explored the
capacity of Hemidesmus to induce apoptosis in fresh AML cells in
culture. Individualized tumor response testing in vitro of cells from
patients with malignancies has been undertaken over the last 50
years [50–52]. These results have consistently shown that patients
treated with drugs to which their cells were sensitive in vitro do
significantly better clinically in terms of probability of response
[53,54], progression-free survival and overall survival [55]. We
observed that Hemidesmus was a potent inducer of apoptosis in
AML cells. Its proapoptotic activity was particularly marked on
blasts obtained from a recidivant patient (AML4), characterized by
a genomic alteration of the FLT3 gene, including FLT3/ITD.
This observation is particularly interesting when we know that
FLT3/ITDs are predictive of relapse and poor outcome in the
chemotherapy setting [56].
Taken together, our results indicate that the traditional
preparation of Hemidesmus indicus could be a promising botanical
drug in the oncologic area. Since selective targeting and low
toxicity for normal host tissues are fundamental requisites for
Antileukemic Effect of Hemidesmus Indicus
PLoS ONE | www.plosone.org 13 June 2011 | Volume 6 | Issue 6 | e21544
anticancer drugs, it is interesting to note that our preliminary
results indicated that the cytotoxic activity of Hemidesmus on non-
transformed cells was significantly lower than that observed in
cancer cells (unpublished work). This could allow the definition of
a range of concentrations potentially active only on cancer cells.
Hemidesmus contains a mixture of known and possibly active
compounds and this aspect poses many challenging issues.
However, it is a relatively simple botanical product (single part
of single plant). As a naturally occurring mixture from a single part
of a single plant, it is not considered a combination product [6].
Of note, FDA determined that therapeutic consistency of the
commercial batches of simple botanical preparations (single part of
single plant) can be assured. Although the chemical constituents of
a botanical drug are not always well defined and in many cases the
active constituent is not identified nor is its biological activity
characterized [7], variations in raw material quality can be
minimized by restricting the cultivars and the composition of the
preparation can be equivalent by robust chemistry, manufacturing
and control measures, ‘fingerprinting’, conducting chromato-
graphic analyses of marker compounds [6]. Our HPLC phyto-
chemical analysis of Hemidesmus indicus demonstrated the presence
of 2-hydroxy-4-methoxybenzoic acid, 2-hydroxy-4-methoxyben-
zaldehyde and 3-hydroxy-4-methoxybenzaldehyde, which can be
used as fingerprint. Of note in this context, the phytochemical
analysis performed on different batches of Hemidesmus demonstrat-
ed that the levels of the above reported phytomarkers were not
statistically different among batches. The above reported phyto-
markers lacked proapoptotic activities. Although relatively high
doses of single bioactive agents may show potent anticarcinogenic
effects, the antitumor properties of interactions among various
ingredients that potentiate the activities of any single constituent
may better explain the observed pharmacological effect of whole
plant, as evidenced for other plants in many in vitro and in vivo
studies [57-59].
On these bases, we conclude that the present plant can
represent a valuable tool in the anticancer pharmacology, and
should be considered for further investigations.
Author Contributions
Conceived and designed the experiments: CF. Performed the experiments:
ML LF ET PS FP RG AG GC VO. Analyzed the data: CF ML RG AG
GC VO. Contributed reagents/materials/analysis tools: RG AG GC VO
PS FP. Wrote the paper: CF GC-F PH.
References
1. Hanahan D, Weinberg RA (2000) The hallmarks of cancer. Cell 100: 57–70.
2. Aggarwal BB, Danda D, Gupta S, Gehlot P (2009) Models for prevention and
treatment of cancer: problems vs promises. Biochem Pharmacol 78: 1083–1094.
3. Zimmermann GR, Lehar J, Keith CT (2007) Multi-target therapeutics: when
the whole is greater than the sum of the parts. Drug Discov Today 12: 34–42.
4. Keith CT, Borisy AA, Stockwell BR (2005) Multicomponent therapeutics fornetworked systems. Nat Rev Drug Discov 4: 71–78.
5. Anand P, Sundaram C, Jhurani S, Kunnumakkara AB, Aggarwal BB (2008)
Curcumin and cancer: an ‘‘old-age’’ disease with an ‘‘age-old’’ solution. CancerLett 267: 133–164.
6. Chen ST, Dou J, Temple R, Agarwal R, Wu KM, et al. (2008) New therapies
from old medicines. Nat Biotechnol 26: 1077–1083.
7. US Department of Health and Human Services FaDACfDEaR (2004) Guidance
for Industry. Botanical Drug Products.
8. Ichikawa H, Nakamura Y, Kashiwada Y, Aggarwal BB (2007) Anticancer drugs
designed by mother nature: ancient drugs but modern targets. Curr Pharm Des13: 3400–3416.
9. Kotnis MS, Patel P, Menon SN, Sane RT (2004) Renoprotective effect of
Hemidesmus indicus, a herbal drug used in gentamicin-induced renal toxicity.
Nephrology (Carlton) 9: 142–152.
10. Lampronti I, Khan MT, Bianchi N, Ather A, Borgatti M, et al. (2005)Bangladeshi medicinal plant extracts inhibiting molecular interactions between
nuclear factors and target DNA sequences mimicking NF-kappaB binding sites.Med Chem 1: 327–333.
11. Prabakan M, Anandan R, Devaki T (2000) Protective effect of Hemidesmus
indicus against rifampicin and isoniazid-induced hepatotoxicity in rats.Fitoterapia 71: 55–59.
12. Previati M, Corbacella E, Astolfi L, Catozzi M, Khan MT, et al. (2007)
Ethanolic extract from Hemidesmus indicus (Linn) displays otoprotectantactivities on organotypic cultures without interfering on gentamicin uptake.
J Chem Neuroanat 34: 128–133.
13. Qureshi S, Rai MK, Agrawal SC (1997) In vitro evaluation of inhibitory nature
of extracts of 18-plant species of Chhindwara against 3-keratinophilic fungi.Hindustan Antibiot Bull 39: 56–60.
14. Austin A (2008) A review on Indian sarsaparilla, Hemidesmus indicus (L.) R. Br.
J Biol Sci 8: 1–12.
15. Das S, Devaraj SN (2006) Glycosides derived from Hemidesmus indicus R. Br.root inhibit adherence of Salmonella typhimurium to host cells: receptor
mimicry. Phytother Res 20: 784–793.
16. Deepak D, Srivastava S, Khare A (1997) Pregnane glycosides from Hemidesmusindicus. Phytochemistry 44: 145–151.
17. Roy SK, Ali M, Sharma MP, Ramachandram R (2001) New pentacyclic
triterpenes from the roots of Hemidesmus indicus. Pharmazie 56: 244–246.
18. Sircar D, Dey G, Mitra A (2007) A validated HPLC method for simultaneousdetermination of 2-hydroxy-4-methoxybenzaldehyde and 2-hydroxy-4-methoxy-
benzoic acid in root organs of Hemidesmus indicus. Chromatographia 65: 349–353.
19. Government of India, Ministry of Health & Family Welfare, Department ofHealth (1989) The Ayurvedic Pharmacopoeia of India. 107 p.
20. Macho A, Calzado MA, Munoz-Blanco J, Gomez-Diaz C, Gajate C, et al.
(1999) Selective induction of apoptosis by capsaicin in transformed cells: the role
of reactive oxygen species and calcium. Cell Death Differ 6: 155–165.
21. Zhao L, Wientjes MG, Au JL (2004) Evaluation of combination chemotherapy:
integration of nonlinear regression, curve shift, isobologram, and combination
index analyses. Clin Cancer Res 10: 7994–8004.
22. Macho A, Blanco-Molina M, Spagliardi P, Appendino G, Bremner P, et al.
(2004) Calcium ionophoretic and apoptotic effects of ferutinin in the human
Jurkat T-cell line. Biochem Pharmacol 68: 875–883.
23. Cuello M, Ettenberg SA, Nau MM, Lipkowitz S (2001) Synergistic induction of
apoptosis by the combination of trail and chemotherapy in chemoresistant
ovarian cancer cells. Gynecol Oncol 81: 380–390.
24. Shapiro GI, Harper JW (1999) Anticancer drug targets: cell cycle and
checkpoint control. J Clin Invest 104: 1645–1653.
25. Toogood PL (2002) Progress toward the development of agents to modulate the
cell cycle. Curr Opin Chem Biol 6: 472–478.
26. Borel F, Lacroix FB, Margolis RL (2002) Prolonged arrest of mammalian cells at
the G1/S boundary results in permanent S phase stasis. J Cell Sci 115:
2829–2838.
27. Knudsen KE, Booth D, Naderi S, Sever-Chroneos Z, Fribourg AF, et al. (2000)
RB-dependent S-phase response to DNA damage. Mol Cell Biol 20: 7751–7763.
28. Pedeux R, Al-Irani N, Marteau C, Pellicier F, Branche R, et al. (1998)
Thymidine dinucleotides induce S phase cell cycle arrest in addition to increased
melanogenesis in human melanocytes. J Invest Dermatol 111: 472–477.
29. Ogryzko VV, Wong P, Howard BH (1997) WAF1 retards S-phase progression
primarily by inhibition of cyclin-dependent kinases. Mol Cell Biol 17:
4877–4882.
30. Tsang WY, Wang L, Chen Z, Sanchez I, Dynlacht BD (2007) SCAPER, a novel
cyclin A-interacting protein that regulates cell cycle progression. J Cell Biol 178:
621–633.
31. Geley S, Kramer E, Gieffers C, Gannon J, Peters JM, et al. (2001) Anaphase-
promoting complex/cyclosome-dependent proteolysis of human cyclin A starts
at the beginning of mitosis and is not subject to the spindle assembly checkpoint.
J Cell Biol 153: 137–148.
32. Koff A, Giordano A, Desai D, Yamashita K, Harper JW, et al. (1992) Formation
and activation of a cyclin E-cdk2 complex during the G1 phase of the human cell
cycle. Science 257: 1689–1694.
33. Gartel AL, Radhakrishnan SK (2005) Lost in transcription: p21 repression,
mechanisms, and consequences. Cancer Res 65: 3980–3985.
34. Radhakrishnan SK, Feliciano CS, Najmabadi F, Haegebarth A, Kandel ES,
et al. (2004) Constitutive expression of E2F-1 leads to p21-dependent cell cycle
arrest in S phase of the cell cycle. Oncogene 23: 4173–4176.
35. Khan N, Afaq F, Mukhtar H (2007) Apoptosis by dietary factors: the suicide
solution for delaying cancer growth. Carcinogenesis 28: 233–239.
36. Moncada S (2010) Mitochondria as pharmacological targets. Br J Pharmacol
160: 217–219.
37. Koh DW, Dawson TM, Dawson VL (2005) Mediation of cell death by
poly(ADP-ribose) polymerase-1. Pharmacol Res 52: 5–14.
38. Salvioli S, Ardizzoni A, Franceschi C, Cossarizza A (1997) JC-1, but not
DiOC6(3) or rhodamine 123, is a reliable fluorescent probe to assess delta psi
changes in intact cells: implications for studies on mitochondrial functionality
during apoptosis. FEBS Lett 411: 77–82.
39. Armstrong JS (2006) The role of the mitochondrial permeability transition in cell
death. Mitochondrion 6: 225–234.
Antileukemic Effect of Hemidesmus Indicus
PLoS ONE | www.plosone.org 14 June 2011 | Volume 6 | Issue 6 | e21544
40. Qanungo S, Das M, Haldar S, Basu A (2005) Epigallocatechin-3-gallate induces
mitochondrial membrane depolarization and caspase-dependent apoptosis inpancreatic cancer cells. Carcinogenesis 26: 958–967.
41. Crompton M (1999) The mitochondrial permeability transition pore and its role
in cell death. Biochem J 341(Pt 2): 233–249.42. Nicotera P, Orrenius S (1998) The role of calcium in apoptosis. Cell Calcium 23:
173–180.43. Choi JH, Lee HW, Park HJ, Kim SH, Lee KT (2008) Kalopanaxsaponin A
induces apoptosis in human leukemia U937 cells through extracellular Ca2+influx and caspase-8 dependent pathways. Food Chem Toxicol 46: 3486–3492.
44. Harper JL, Camerini-Otero CS, Li AH, Kim SA, Jacobson KA, et al. (2003)
Dihydropyridines as inhibitors of capacitative calcium entry in leukemic HL-60cells. Biochem Pharmacol 65: 329–338.
45. Jiang N, Zhang ZM, Liu L, Zhang C, Zhang YL, et al. (2006) Effects of Ca2+channel blockers on store-operated Ca2+ channel currents of Kupffer cells after
hepatic ischemia/reperfusion injury in rats. World J Gastroenterol 12:
4694–4698.46. Hsin YH, Cheng CH, Tzen JT, Wu MJ, Shu KH, et al. (2006) Effect of
aristolochic acid on intracellular calcium concentration and its links withapoptosis in renal tubular cells. Apoptosis 11: 2167–2177.
47. Thastrup O, Cullen PJ, Drobak BK, Hanley MR, Dawson AP (1990)
Thapsigargin, a tumor promoter, discharges intracellular Ca2+ stores by specificinhibition of the endoplasmic reticulum Ca2(+)-ATPase. Proc Natl Acad
Sci U S A 87: 2466–2470.48. Adams JM, Cory S (1998) The Bcl-2 protein family: arbiters of cell survival.
Science 281: 1322–1326.49. Levi F, Focan C, Karaboue A, de La Valette V, Focan-Henrard D, et al. (2007)
Implications of circadian clocks for the rhythmic delivery of cancer therapeutics.
Adv Drug Deliv Rev 59: 1015–1035.
50. Cree IA (2009) Chemosensitivity and chemoresistance testing in ovarian cancer.
Curr Opin Obstet Gynecol 21: 39–43.
51. Nagourney RA (2006) Ex vivo programmed cell death and the prediction of
response to chemotherapy. Curr Treat Options Oncol 7: 103–110.
52. Nygren P, Larsson R (2008) Predictive tests for individualization of
pharmacological cancer treatment. Expert Opinion on Medical Diagnostics 2:
1–12.
53. Bosanquet AG, Bell PB (2004) Ex vivo therapeutic index by drug sensitivity assay
using fresh human normal and tumor cells. J Exp Ther Oncol 4: 145–154.
54. Bosanquet AG, Nygren P, Weisenthal LM (2008) Individualized tumor response
testing in leukemia and lymphoma. In: Kaspers GJ, Coiffier B, Heinrich MC,
Estey EH, eds. Innovative leukemia and lymphoma therapy. New York: Informa
Healthcare. pp 23–44.
55. Bosanquet AG (1994) Short-term in vitro drug sensitivity tests for cancer
chemotherapy. A summary of correlations of test result with both patient
response and survival. Forum Trends in Experimental and Clinical Medicine 4:
179–198.
56. Meshinchi S, Appelbaum FR (2009) Structural and functional alterations of
FLT3 in acute myeloid leukemia. Clin Cancer Res 15: 4263–4269.
57. Zhou JR, Yu L, Zhong Y, Blackburn GL (2003) Soy phytochemicals and tea
bioactive components synergistically inhibit androgen-sensitive human prostate
tumors in mice. J Nutr 133: 516–521.
58. Williams SN, Shih H, Guenette DK, Brackney W, Denison MS, et al. (2000)
Comparative studies on the effects of green tea extracts and individual tea
catechins on human CYP1A gene expression. Chem Biol Interact 128: 211–229.
59. de Kok TM, van Breda SG, Manson MM (2008) Mechanisms of combined
action of different chemopreventive dietary compounds. Eur J Nutr 47(Suppl 2):
51–59.
Antileukemic Effect of Hemidesmus Indicus
PLoS ONE | www.plosone.org 15 June 2011 | Volume 6 | Issue 6 | e21544