Mitochondrial mutations and ageing: Can mitochondrial deletion mutants accumulate via a size based...
8
Mitochondrial mutations and ageing: Can mitochondrial deletion mutants accumulate via a size based replication advantage? Axel Kowald a,n , Marcus Dawson a,b , Thomas B.L. Kirkwood a a Centre for Integrated Systems Biology of Ageing and Nutrition, Institute for Ageing and Health, Newcastle University, Newcastle upon Tyne NE4 5PL, United Kingdom b University of Manchester, Manchester M13 9PT, United Kingdom HIGHLIGHTS We modelled the accumulation of mitochondrial deletion mutants during ageing. Can the reduced size provide a selection advantage via a shorter replication time? We developed a delay differential equation model and a stochastic simulation. The simulations show that the idea only works for very long lived species. article info Article history: Received 21 February 2013 Received in revised form 22 August 2013 Accepted 9 September 2013 Available online 17 September 2013 Keywords: Mitochondrial mutation Mathematical model Ageing abstract The mitochondrial theory of ageing is one of the main contenders to explain the biochemical basis of the ageing process. An important line of support comes from the observation that mtDNA deletions accumulate over the life course in post-mitotic cells of many species. A single mutant expands clonally and finally replaces the wild-type population of a whole cell. One proposal to explain the driving force behind this accumulation states that the reduced size leads to a shorter replication time, which provides a selection advantage. However, this idea has been questioned on the grounds that the mitochondrial half-life is much longer than the replication time, so that the latter cannot be a rate limiting step. To clarify this question, we modelled this process mathematically and performed extensive deterministic and stochastic computer simulations to study the effects of replication time, mitochondrial half-life and deletion size. Our study shows that the shorter size does in principle provide a selection advantage, which can lead to an accumulation of the deletion mutant. However, this selection advantage diminishes the shorter is the replication time of wt mtDNA in relation to its half-life. Using generally accepted literature values, the resulting time frame for the accumulation of mutant mtDNAs is only compatible with the ageing process in very long lived species like humans, but could not reasonably explain ageing in short lived species like mice and rats. & 2013 Elsevier Ltd. All rights reserved. 1. Introduction Ageing is an intrinsic deterioration of the homoeostatic cap- abilities of an organism, leading to a constantly increasing risk of death. Although evolutionary considerations suggest that the ageing process is in principle multifactorial (Kirkwood, 1996), a few main mechanisms have been proposed. Among these the mitochondrial theory of ageing is one of the most popular (Harman, 1972, 1983; Miquel et al., 1980; Richter, 1988; Linnane et al., 1989). The theory suggests that the accumulation of defective mitochondria is a major contributor to the ageing process. Reactive oxygen species (ROS) generated during respiration have the potential to damage all kinds of biologically relevant macromolecules such as lipids, proteins and mitochondrial DNA (mtDNA). Damage to mtDNA is quite different from damage to other macromolecules, since mitochondrial DNA represents the ultimate blueprint from which everything else fol- lows. Point mutations and deletions could impair mitochondrial ATP production with negative consequences for all aspects of cellular homoeostasis. And indeed, many studies have shown that mitochondrial deletion mutants accumulate with age in various mammalian species such as rats, monkeys and humans (Brierley et al., 1998; Khrapko et al., 1999; Cao et al., 2001; Gokey et al., 2004; Herbst et al., 2007). These single cell studies have shown that the mitochondrial population of a cell is overtaken by a single deletion mutant type via clonal expansion. Contents lists available at ScienceDirect journal homepage: www.elsevier.com/locate/yjtbi Journal of Theoretical Biology 0022-5193/$ - see front matter & 2013 Elsevier Ltd. All rights reserved. http://dx.doi.org/10.1016/j.jtbi.2013.09.009 n Corresponding author. Tel.: þ49 179 3427522. E-mail addresses: [email protected] (A. Kowald), Marcus.Dawson@student. manchester.ac.uk (M. Dawson), [email protected] (T.B.L. Kirkwood). Journal of Theoretical Biology 340 (2014) 111–118
Transcript of Mitochondrial mutations and ageing: Can mitochondrial deletion mutants accumulate via a size based...

Mitochondrial mutations and ageing: Can mitochondrial deletionmutants accumulate via a size based replication advantage?
Axel Kowald a,n, Marcus Dawson a,b, Thomas B.L. Kirkwood a
a Centre for Integrated Systems Biology of Ageing and Nutrition, Institute for Ageing and Health, Newcastle University, Newcastle upon Tyne NE4 5PL,United Kingdomb University of Manchester, Manchester M13 9PT, United Kingdom
H I G H L I G H T S
! We modelled the accumulation of mitochondrial deletion mutants during ageing.! Can the reduced size provide a selection advantage via a shorter replication time?! We developed a delay differential equation model and a stochastic simulation.! The simulations show that the idea only works for very long lived species.
a r t i c l e i n f o
Article history:Received 21 February 2013Received in revised form22 August 2013Accepted 9 September 2013Available online 17 September 2013
Keywords:Mitochondrial mutationMathematical modelAgeing
a b s t r a c t
The mitochondrial theory of ageing is one of the main contenders to explain the biochemical basis of theageing process. An important line of support comes from the observation that mtDNA deletionsaccumulate over the life course in post-mitotic cells of many species. A single mutant expands clonallyand finally replaces the wild-type population of a whole cell. One proposal to explain the driving forcebehind this accumulation states that the reduced size leads to a shorter replication time, which providesa selection advantage. However, this idea has been questioned on the grounds that the mitochondrialhalf-life is much longer than the replication time, so that the latter cannot be a rate limiting step. Toclarify this question, we modelled this process mathematically and performed extensive deterministicand stochastic computer simulations to study the effects of replication time, mitochondrial half-life anddeletion size. Our study shows that the shorter size does in principle provide a selection advantage,which can lead to an accumulation of the deletion mutant. However, this selection advantage diminishesthe shorter is the replication time of wt mtDNA in relation to its half-life. Using generally acceptedliterature values, the resulting time frame for the accumulation of mutant mtDNAs is only compatiblewith the ageing process in very long lived species like humans, but could not reasonably explain ageingin short lived species like mice and rats.
& 2013 Elsevier Ltd. All rights reserved.
1. Introduction
Ageing is an intrinsic deterioration of the homoeostatic cap-abilities of an organism, leading to a constantly increasing risk ofdeath. Although evolutionary considerations suggest that the ageingprocess is in principle multifactorial (Kirkwood, 1996), a few mainmechanisms have been proposed. Among these the mitochondrialtheory of ageing is one of the most popular (Harman, 1972, 1983;Miquel et al., 1980; Richter, 1988; Linnane et al., 1989). The theorysuggests that the accumulation of defective mitochondria is a major
contributor to the ageing process. Reactive oxygen species (ROS)generated during respiration have the potential to damage all kindsof biologically relevant macromolecules such as lipids, proteins andmitochondrial DNA (mtDNA). Damage to mtDNA is quite differentfrom damage to other macromolecules, since mitochondrial DNArepresents the ultimate blueprint from which everything else fol-lows. Point mutations and deletions could impair mitochondrialATP production with negative consequences for all aspects ofcellular homoeostasis. And indeed, many studies have shown thatmitochondrial deletion mutants accumulate with age in variousmammalian species such as rats, monkeys and humans (Brierley et al.,1998; Khrapko et al., 1999; Cao et al., 2001; Gokey et al., 2004;Herbst et al., 2007). These single cell studies have shown that themitochondrial population of a cell is overtaken by a single deletionmutant type via clonal expansion.
Contents lists available at ScienceDirect
journal homepage: www.elsevier.com/locate/yjtbi
Journal of Theoretical Biology
0022-5193/$ - see front matter & 2013 Elsevier Ltd. All rights reserved.http://dx.doi.org/10.1016/j.jtbi.2013.09.009
n Corresponding author. Tel.: þ49 179 3427522.E-mail addresses: [email protected] (A. Kowald), Marcus.Dawson@student.
manchester.ac.uk (M. Dawson), [email protected] (T.B.L. Kirkwood).
Journal of Theoretical Biology 340 (2014) 111–118

The mechanism behind the accumulation of defective mito-chondria is obviously an important aspect of the theory, but iscurrently unknown. The “vicious cycle” hypothesis suggests that,because defective mitochondria generate more radicals thanintact ones, the cellular radical level progressively rises, leadingin turn to an increased production of mitochondrial mutants(Bandy and Davison, 1990; Arnheim and Cortopassi, 1992). In thisscenario the individual mutant mitochondria do not need to havea selection advantage; they accumulate because they are con-stantly generated. However, such a mechanism also implies thatone should see a plethora of different mtDNA mutants in a singlecell, quite the contrary of what has been observed. It has alsobeen proposed that pure random drift might be sufficient toexplain clonal expansion (Chinnery and Samuels, 1999; Elsonet al., 2001). Although these authors show that such a processmight work for long lived species like humans, we have recentlyperformed computer simulations, which demonstrate that such aprocess is unsuitable for short lived animals like rodents (Kowaldand Kirkwood, 2013), which show a similar pattern of accumula-tion as in humans but on a twenty times accelerated timescale(Cao et al., 2001). An idea that does identify a selection advantageof deletion mutants is called survival of the slowest (SOS) (Grey,1997). It notes that the fate of a mitochondrion depends not onlyon its growth rate, but also on its rate of degradation andproposes that defective mitochondria are degraded less fre-quently than wild-type organelles. However, this hypothesishas problems with mitochondrial dynamics, since fission andfusion break the required link between genotype and phenotype(Kowald and Kirkwood, 2011). Furthermore, it has been shown thatdysfunctional mitochondria are preferentially degraded (Twig et al.,2008; Kim and Lemasters, 2011), instead of being spared.
Finally, it has been proposed that the selection advantagesimply stems from the reduced genome size of the deletionmutant (Wallace, 1992; Lee et al., 1998). Deletions encompassingmore than half of the mitochondrial genome have been observed(Cao et al., 2001), which could result in a 50% reduced replicationtime. However, this idea has been criticised because early studieshave shown that the time required for the replication of the mtDNA isonly 1–2 h (Berk and Clayton, 1974; Clayton, 1982), while the half-lifeof mtDNA is in the order of 1–3 weeks (Gross et al., 1969; Huemeret al., 1971; Korr et al., 1998). Therefore it has been argued that it isdifficult to see howmtDNA replication could be a rate limiting step formitochondrial growth (Grey, 1999; Elson et al., 2001).
To put these verbal arguments on more solid grounds wedeveloped in this study a detailed mathematical model that
describes the fate of a population of wild-type and mutant mtDNAmolecules that undergo replication and degradation. Using delaydifferential equations as well as stochastic simulations we studiedthe effects of replication time, mitochondrial half-life and deletionsize on the outcome of the competition between mutant and wild-type. In recent years it became clear that mitochondria undergo aconstant and rapid process of fusion and fission (Duvezin-Caubetet al., 2006; Twig et al., 2008), the evolutionary and functionalsignificance of which we have considered elsewhere (Kowald andKirkwood, 2011). As a consequence all mtDNAs, wild-type andmutant, effectively exist in a single common mitochondrial com-partment. The competing entities are therefore not completeorganelles, but individual mtDNA molecules. Our simulationsreflect this situation.
2. Model development
Although a reduced size has often been proposed as giving aselection advantage to deleted mtDNAs, the exact molecularmechanism has never been spelled out explicitly. Fig. 1 showsthe mechanism that we propose and which we used as the basis todevelop the mathematical model. The idea is that mtDNAs can bein a “free”, non-replicating, state or in a “busy”, replicating, state.We assume that only mtDNAs from the “free” pool can respond toa replication signal, begin replication, and thus enter the “busy”pool. The replicating molecule remains in the busy state for acertain time, Δt, after which replication is finished and twomolecules are returned into the free pool. Wild-type and mutantmtDNAs in the free pool have equal probabilities to respond to areplication signal, but deletion mutants will spend a shorter timein the busy pool and return earlier into the free pool than wild-type molecules. This should result in an overall selection advan-tage, leading to the accumulation of deleted mtDNAs. In oursimulation study all types of mtDNAs (wild type, mutant, busyand free) are degraded at the same rate, leading to an identicalhalf-life for wild type and mutant. Replication and degradationtogether also ensure that the population of mtDNA moleculesreaches a stable steady state.
The system contains four variables:
wtF: number of wild type mtDNAs in the free pool.wtB: number of wild type mtDNAs in the busy pool.mtF: number of mutant mtDNAs in the free pool.mtB: number of mutant mtDNAs in the busy pool.
Fig. 1. Model overview. The system consists of a pool of free mtDNAs that can respond to a replication signal and from which a mtDNA molecule can enter the busy state inwhich replication takes place. After a certain replication time, Δt, two mtDNA molecules return into the free pool. All mtDNAs are degraded at the same rate, resulting in thesame half-life for wild type and mutant forms.
A. Kowald et al. / Journal of Theoretical Biology 340 (2014) 111–118112
It also contains the following five parameters:
mutS: size of the mutant given as fraction of the wild type size.Default¼0.5.halfL: half-life of mtDNAs. Default¼10 days.replT: the replication time of a wild type mtDNAs. Default¼2 h.replS: parameter controlling the replication probability asfunction of the total number of mtDNAs. If there are only veryfew mtDNAs, the replication probability is equal to replS.carryC: parameter controlling the replication probability asfunction of the total number of mtDNAs. If the number ofmtDNAs is equal to carryC, the replication probability drops to1/2*replS.
Based on the above description, the following list provides asummary of the reactions included in the model. Parameters andvariables that influence the reaction are shown on top of thereaction arrows. The next sections describe in detail how thesequantities enter into the kinetics of the different models, but ingeneral we assumed that the replication probability declineswith the total amount of existing mtDNAs. The idea is that someform of negative feedback exists that limits the production ofnew mtDNAs if already plenty exist. The mathematical expres-sion that we used to model this behaviour is of the formðreplS=ððΣmtDNAsÞ=carry CÞþ1ÞÞ. This construct has the propertythat the replication probability is equal to replS if only very fewmtDNAs are present and drops to replS/2 when the number ofmolecules has reached carryC.
wtF ⟹carryC; replS; wtF ; wtB; mtF ; mtB
wtB
wtB ⟹carryC; replS; wtF ; wtB; mtF ; mtB; half L; replT
2 wtF
mtF ⟹carryC; replS; wtF ; wtB; mtF ; mtB
mtB
mtB ⟹carryC; replS; wtF ; wtB; mtF ; mtB; half L; replT ; mutS
2mtF
wtF⟹half L
removal
wtB⟹half L
removal
mtF⟹half L
removal
mtB⟹half L
removal
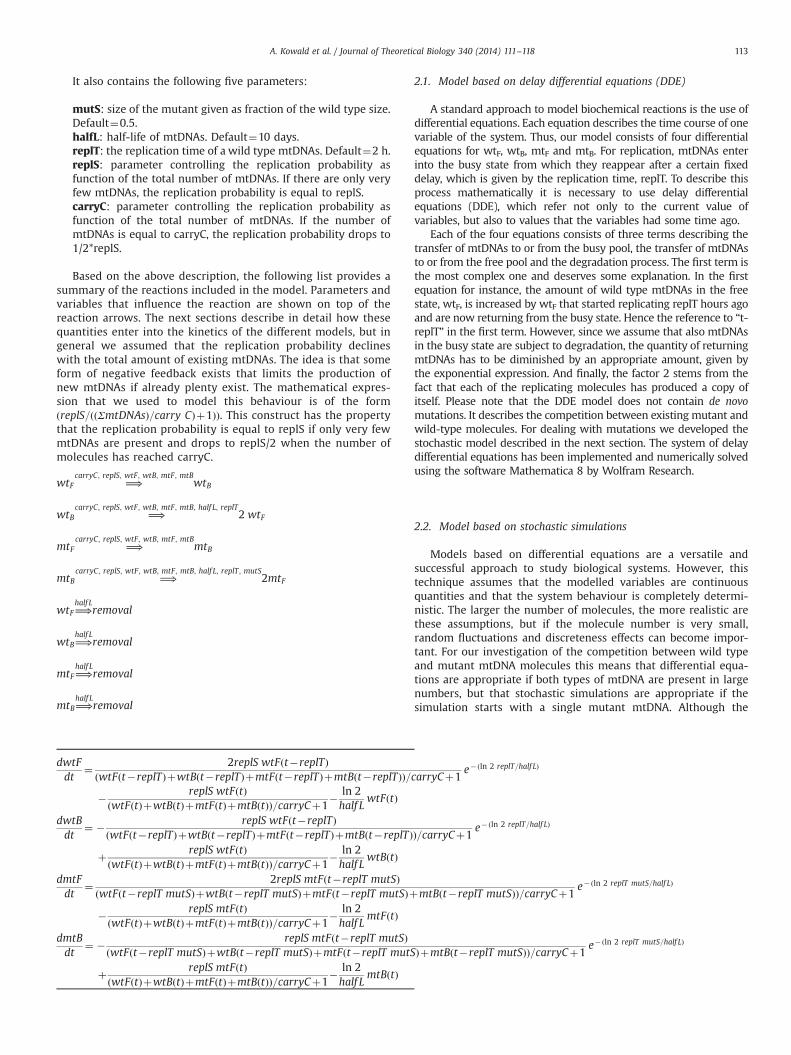
2.1. Model based on delay differential equations (DDE)
A standard approach to model biochemical reactions is the use ofdifferential equations. Each equation describes the time course of onevariable of the system. Thus, our model consists of four differentialequations for wtF, wtB, mtF and mtB. For replication, mtDNAs enterinto the busy state from which they reappear after a certain fixeddelay, which is given by the replication time, replT. To describe thisprocess mathematically it is necessary to use delay differentialequations (DDE), which refer not only to the current value ofvariables, but also to values that the variables had some time ago.
Each of the four equations consists of three terms describing thetransfer of mtDNAs to or from the busy pool, the transfer of mtDNAsto or from the free pool and the degradation process. The first term isthe most complex one and deserves some explanation. In the firstequation for instance, the amount of wild type mtDNAs in the freestate, wtF, is increased by wtF that started replicating replT hours agoand are now returning from the busy state. Hence the reference to “t-replT” in the first term. However, since we assume that also mtDNAsin the busy state are subject to degradation, the quantity of returningmtDNAs has to be diminished by an appropriate amount, given bythe exponential expression. And finally, the factor 2 stems from thefact that each of the replicating molecules has produced a copy ofitself. Please note that the DDE model does not contain de novomutations. It describes the competition between existing mutant andwild-type molecules. For dealing with mutations we developed thestochastic model described in the next section. The system of delaydifferential equations has been implemented and numerically solvedusing the software Mathematica 8 by Wolfram Research.
2.2. Model based on stochastic simulations
Models based on differential equations are a versatile andsuccessful approach to study biological systems. However, thistechnique assumes that the modelled variables are continuousquantities and that the system behaviour is completely determi-nistic. The larger the number of molecules, the more realistic arethese assumptions, but if the molecule number is very small,random fluctuations and discreteness effects can become impor-tant. For our investigation of the competition between wild typeand mutant mtDNA molecules this means that differential equa-tions are appropriate if both types of mtDNA are present in largenumbers, but that stochastic simulations are appropriate if thesimulation starts with a single mutant mtDNA. Although the
dwtFdt
¼2replS wtFðt&replTÞ
ðwtFðt&replTÞþwtBðt&replTÞþmtFðt&replTÞþmtBðt&replTÞÞ=carryCþ1e&ðln 2 replT=half LÞ
&replS wtFðtÞ
ðwtFðtÞþwtBðtÞþmtFðtÞþmtBðtÞÞ=carryCþ1&
ln 2half L
wtFðtÞ
dwtBdt
¼ &replS wtFðt&replTÞ
ðwtFðt&replTÞþwtBðt&replTÞþmtFðt&replTÞþmtBðt&replTÞÞ=carryCþ1e&ðln 2 replT=half LÞ
þreplS wtFðtÞ
ðwtFðtÞþwtBðtÞþmtFðtÞþmtBðtÞÞ=carryCþ1&
ln 2half L
wtBðtÞ
dmtFdt
¼2replS mtFðt&replT mutSÞ
ðwtFðt&replT mutSÞþwtBðt&replT mutSÞþmtFðt&replT mutSÞþmtBðt&replT mutSÞÞ=carryCþ1e&ðln 2 replT mutS=half LÞ
&replS mtFðtÞ
ðwtFðtÞþwtBðtÞþmtFðtÞþmtBðtÞÞ=carryCþ1&
ln 2half L
mtFðtÞ
dmtBdt
¼ &replS mtFðt&replT mutSÞ
ðwtFðt&replT mutSÞþwtBðt&replT mutSÞþmtFðt&replT mutSÞþmtBðt&replT mutSÞÞ=carryCþ1e&ðln 2 replT mutS=half LÞ
þreplS mtFðtÞ
ðwtFðtÞþwtBðtÞþmtFðtÞþmtBðtÞÞ=carryCþ1&
ln 2half L
mtBðtÞ
A. Kowald et al. / Journal of Theoretical Biology 340 (2014) 111–118 113

mutant might have a selection advantage, random effects couldlead to its degradation before it can spread.
We therefore developed a computer programme that explicitlymodels the fate of a population of 1000 mtDNA molecules bymaintaining a list of molecules in the free state and a list of moleculesin the busy state. While the DDE model describes the competitionbetween existing mtDNA molecules, we designed the simulationprogramme to also handle de novo mutations. We assumed thatmitochondrial deletions happen via slippage replication at perfectand imperfect direct repeats (Shoffner et al., 1989; Guo et al., 2010)and therefore each replication event leads with a certain probability,Pmut, to a deletion and thus a new, unique, mtDNA mutant. Allprobabilistic decisions (mutation, degradation, replication) are rea-lised by generating a uniformly distributed random number between0 and 1 and testing if the number is smaller than the respectiveprobability value. A stochastic simulation starts with a pure popula-tion of wild-type mtDNAs and calculates a single trajectory of thesystem until the end of the specified simulation time. The pro-gramme loops through time in intervals of 1 h and performs withineach time step the following tasks:
! Check if the replication time of any of the mtDNAs in the busylist is over. If yes, move that molecule into the free list. Check ifa deletion mutation happened during the replication by testingif a random number is below the mutation probability, Pmut. Ifyes, add a new unique mutant into the free list, if not add acopy of the replicating mtDNA into the free list.
! Check if any of the mtDNAs in the free or busy list should bedegraded by testing for each molecule if a random number isbelow the degradation probability (ln 2/halfL). If yes, removethose molecules from the list.
! Check if any of the mtDNAs in the free list starts replicating bytesting if a random number is below the replication probability.If yes, move those molecules into the busy list and record thetime the replication started.
Like the system of delay differential equations, this stochasticsimulation has also been implemented in Mathematica 8 of WolframResearch.
3. Results
The aim of the deterministic simulations is to show how theoutcome of the competition between existing mutant and wildtype mtDNAs is influenced by the three parameters, half-life,
replication time and mutant size. Stochastic simulations are thenused to study the consequences of de novo mutations and thesystem behaviour at the tissue level. The primary outcome of theDDE simulation is the “extinction time”, the time it takes until themutant has replaced the wild type. To make these times compar-able between simulations it is important that the steady state levelof the total mtDNA population remains the same, since it can beexpected that extinction times also depend on population size. Ofcourse, the steady state level also depends on the parameters wewant to study and thus the free parameter carryC, which controlsthe replication probability, is adjusted appropriately so that thedesired population size is maintained. The relationship betweenthe mtDNA steady state level, Mss, and the model parameters canbe obtained by setting the left hand side of the DDE system to zeroand then solving it for the steady state values of mtDNAs in thefree and busy state. The sum of these values is Mss and given bythe following expression:
Mss ¼ &carryCðhalf LðreplSð1&21& replT=half LÞÞþ ln 2Þ
ln 2
For our simulations we chose Mss to be equal to 1000 andadjusted carryC correspondingly. Fig. 2 shows a typical simulationresult of the system. Using generally accepted literature values forreplication time and half-life, the simulation was started with 999molecules of wild-type mtDNA and a single mutant mtDNA (thestandard starting conditions for all DDE simulations). Under theseconditions the wild-type went extinct after ca. 95 years. The exactextinction time was defined as the time it takes until the amountof wild-type drops below 1. For the simulation in Fig. 2 the mutantsize was set to 50% of the wild type, replication time was 2 h andmtDNA half-life was assumed to be 10 days. The diagram on theright side provides information about the fraction of replicatingmutant (fracReplMt) and wild type mtDNAs (fracReplWt) in thetotal mtDNA population as well as the fraction of mutant mole-cules in the free pool (fracMtFree). The system is started with allmtDNAs in the non-replicating state but very quickly the wild-type molecules reach a semi equilibrium with ca. 0.58% of themtDNAs in the replicating state. After this initial phase the fractionof replicating wild type, fracReplWt, drops continuously sincewild type is constantly displaced from the population. As aconsequence the fraction of mutant in the free pool, fracMtFree,increased from an initial 0.1% to finally 100%. During the displace-ment process also the total fraction of replicating mtDNAs declinesfrom 0.58% to 0.29%. The reason is that the mutant mtDNAs onlyhave half the size of the wild-type and therefore also only spendhalf of the time in the replicating state.
Fig. 2. Numerical solutions of the set of delay differential equations, showing the time course of wild type (wt), mutant (mt) and total mtDNA (left). The right panel showsadditional information such as the fraction of replicating wild type molecules (fracReplWt), the fraction of replicating mutant molecules (fracReplMt), the total fraction ofreplicating mtDNAs (totalFracRepl) and the fraction of mutant molecules in the free pool (fracMtFree).
A. Kowald et al. / Journal of Theoretical Biology 340 (2014) 111–118114
3.1. Influence of mtDNA half-life
To test the effect of mtDNA half-life on extinction times, weperformed a series of simulations with a replication time of 2 hoursand half-lives ranging from 2 to 10 days. Fig. 3 shows a summary ofthe results. Increasing the half-life leads to an exponential increasein the time it takes for the mutant to displace the wild-type. Thisis accompanied by an exponential decline in the total fractionof replicating mtDNAs. This decline is a logical consequence ofincreasing the half-life while the replication time remains constant.More time is now available for the mtDNA population to be doubledand consequently the fraction of mtDNAs that have to be in thereplicating state to achieve this, is smaller. But shorter deletionmutants have a selection advantage against wild type moleculesonly in the replicating state, since they can return from this pool aftera shorter time. Thus, increasing the ratio of half-life to replicationtime, decreases the selection advantage and increases the time forthe mutant to win. With a half-life of 2 days the wild type mtDNAwent extinct after approx. 3.9 years, while the extinction timeincreased to 95 years for a half-life of 10 days.
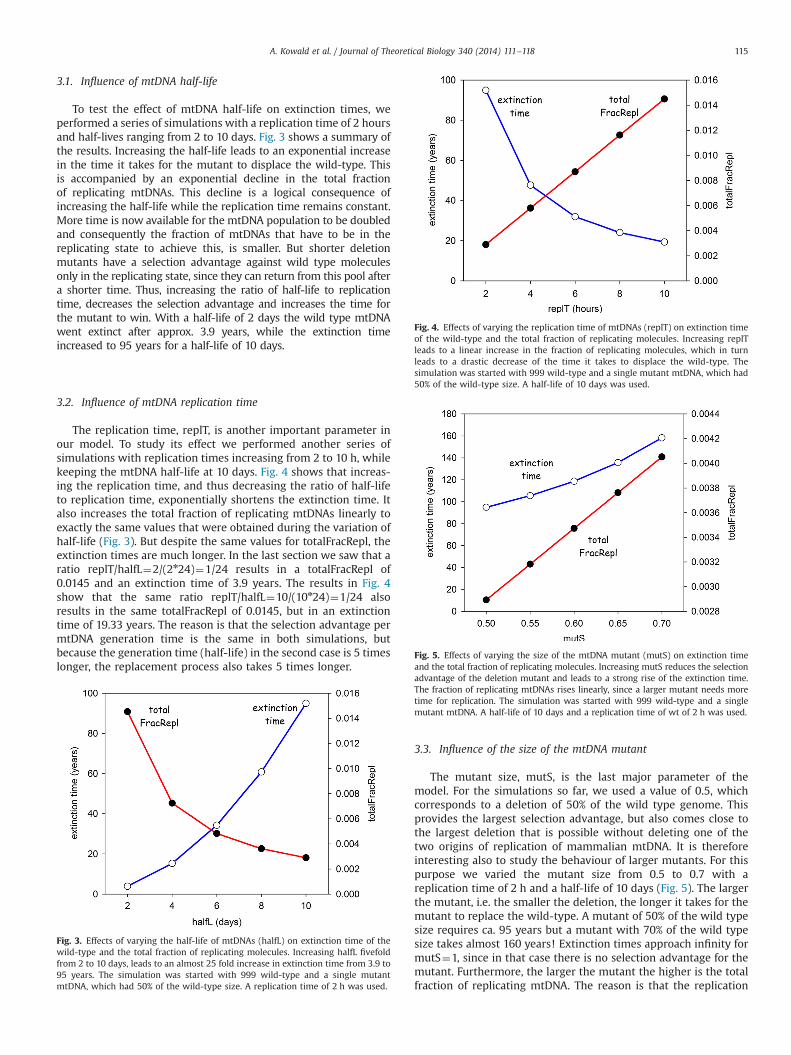
3.2. Influence of mtDNA replication time
The replication time, replT, is another important parameter inour model. To study its effect we performed another series ofsimulations with replication times increasing from 2 to 10 h, whilekeeping the mtDNA half-life at 10 days. Fig. 4 shows that increas-ing the replication time, and thus decreasing the ratio of half-lifeto replication time, exponentially shortens the extinction time. Italso increases the total fraction of replicating mtDNAs linearly toexactly the same values that were obtained during the variation ofhalf-life (Fig. 3). But despite the same values for totalFracRepl, theextinction times are much longer. In the last section we saw that aratio replT/halfL¼2/(2n24)¼1/24 results in a totalFracRepl of0.0145 and an extinction time of 3.9 years. The results in Fig. 4show that the same ratio replT/halfL¼10/(10n24)¼1/24 alsoresults in the same totalFracRepl of 0.0145, but in an extinctiontime of 19.33 years. The reason is that the selection advantage permtDNA generation time is the same in both simulations, butbecause the generation time (half-life) in the second case is 5 timeslonger, the replacement process also takes 5 times longer.
3.3. Influence of the size of the mtDNA mutant
The mutant size, mutS, is the last major parameter of themodel. For the simulations so far, we used a value of 0.5, whichcorresponds to a deletion of 50% of the wild type genome. Thisprovides the largest selection advantage, but also comes close tothe largest deletion that is possible without deleting one of thetwo origins of replication of mammalian mtDNA. It is thereforeinteresting also to study the behaviour of larger mutants. For thispurpose we varied the mutant size from 0.5 to 0.7 with areplication time of 2 h and a half-life of 10 days (Fig. 5). The largerthe mutant, i.e. the smaller the deletion, the longer it takes for themutant to replace the wild-type. A mutant of 50% of the wild typesize requires ca. 95 years but a mutant with 70% of the wild typesize takes almost 160 years! Extinction times approach infinity formutS¼1, since in that case there is no selection advantage for themutant. Furthermore, the larger the mutant the higher is the totalfraction of replicating mtDNA. The reason is that the replication
Fig. 3. Effects of varying the half-life of mtDNAs (halfL) on extinction time of thewild-type and the total fraction of replicating molecules. Increasing halfL fivefoldfrom 2 to 10 days, leads to an almost 25 fold increase in extinction time from 3.9 to95 years. The simulation was started with 999 wild-type and a single mutantmtDNA, which had 50% of the wild-type size. A replication time of 2 h was used.
Fig. 4. Effects of varying the replication time of mtDNAs (replT) on extinction timeof the wild-type and the total fraction of replicating molecules. Increasing replTleads to a linear increase in the fraction of replicating molecules, which in turnleads to a drastic decrease of the time it takes to displace the wild-type. Thesimulation was started with 999 wild-type and a single mutant mtDNA, which had50% of the wild-type size. A half-life of 10 days was used.
Fig. 5. Effects of varying the size of the mtDNA mutant (mutS) on extinction timeand the total fraction of replicating molecules. Increasing mutS reduces the selectionadvantage of the deletion mutant and leads to a strong rise of the extinction time.The fraction of replicating mtDNAs rises linearly, since a larger mutant needs moretime for replication. The simulation was started with 999 wild-type and a singlemutant mtDNA. A half-life of 10 days and a replication time of wt of 2 h was used.
A. Kowald et al. / Journal of Theoretical Biology 340 (2014) 111–118 115

time (time spent in the busy state) increases proportionally to themutant size and hence the total fraction of mtDNAs in the busystate increases linearly.
3.4. Stochastic tissue simulations
Next we used our stochastic model to study the effects ofmutant accumulation at the tissue level in animals of variouslifespans. A cytochrome c oxidase (COX) deficient phenotype hasbeen observed in post mitotic cells of old animals and is generallyregarded as consequence of a non-functional oxidative phosphor-ylation (Cao et al., 2001). As in other studies (Elson et al., 2001;Kowald and Kirkwood, 2013), we regard a cell as COX-deficient if itcontains at least 60% mutant mtDNAs at the end of the simulationtime. Clonally expanded deletion mutants have been found inshort and long lived animals (from rat to man) and we thereforeperformed tissue simulations for 3, 10, 40 and 80 years with a half-life of 10 days, replication time of 2 h and a mutant size of 0.5. Forthis purpose we performed 1000 repetitions for each lifespan andcounted the fraction of simulations that resulted in a COX deficientphenotype. Then mutation rates were adjusted in such a way, thatat the end of the simulation 1070.5% of the cells were COXdeficient. Fig. 6A shows that there is a roughly 500 fold differencein mutation rate that is required to achieve the same percentage ofCOX deficient cells in animals with a lifespan of 3 years compared
to 80 years. Especially intriguing is the low degree of heteroplasmythat has been observed experimentally, i.e. it is in most cases asingle type of mutant that has displaced the wild-type mtDNA. Inthe stochastic model we assume that each new deletion results ina new, unique, mutation type and Fig. 6B presents the number ofdifferent mtDNAs per COX deficient cell as a measure for thedegree of heteroplasmy. As can be seen, heteroplasmy dramaticallyincreases for short lifespans, leading on average to almost 30different types of mtDNA per cell for a lifespan of 3 years. Theseresults can hardly be reconciled with experimental findings.
In Fig. 3 it was shown that the extinction time is drasticallyshortened if the mtDNA half-life is reduced, presumably becausethis increases the ratio of replication time to half-life. Whatinfluence has this for stochastic simulations at the tissue level?We studied this by performing a number of simulations for alifespan of 3 years with different half-lives, but the standard valuesfor replication time (2 h) and mutant size (0.5). Fig. 7A shows thatthe mutation rate required to achieve 10% COX negative cells after3 years, strongly decreases with a decreasing half-life. Similarly,also the degree of heteroplasmy decreases to only 1.16 differentmtDNAs for a half-life of 2 days (Fig. 7B). These simulationsconfirm the DDE calculations shown in Fig. 3 and emphasisethe relevance of the ratio of replication time to half-life for thestrength of the selection advantage that a shorter genome canconfer in the replication process.
Fig. 6. Stochastic simulation of a population of 1000 mtDNAs for 3, 10, 40 and 80 years. The left diagram shows the mutation rate required to result in 1070.5% of COXdeficient cells (defined as harbouring 460% mutant mtDNAs) after the indicated time with replT¼2 h, halfL¼10 d and mutSize¼0.5. Each point is calculated from 1000simulation runs. The right diagram shows the degree of mtDNA heteroplasmy in COX deficient cells, measured by the number of different types of mtDNA mutants per cell.
Fig. 7. Stochastic simulation of a population of 1000 mtDNAs for 3 years (replT¼2 h, mutSize¼0.5) and different values for the half-life. The left diagram shows the mutationrate required to result in 1070.5% of COX negative cells (defined as harbouring 460% mutant mtDNAs) and the right diagram shows the degree of mtDNA heteroplasmy inCOX negative cells, measured by the number of different types of mtDNA mutants.
A. Kowald et al. / Journal of Theoretical Biology 340 (2014) 111–118116

4. Discussion
In this work we studied the question of whether a shorterreplication time of mitochondrial deletion mutants can providethem with a selection advantage, so that they can accumulate andreplace the wild type. This idea had been put forward to explainthe experimentally observed clonal expansion of deletion mutants(Wallace, 1992; Lee et al., 1998). We proposed a specific molecularmechanism of how a shorter replication time can result in aselection advantage by assuming that currently replicating mole-cules are not available to respond to further replication signals,since they are in a busy state until they finish their current roundof replication. We used models based on delay differential equa-tions as well as stochastic simulations to investigate this questionby varying (i) replication time of mtDNA, (ii) half-life of mtDNA,and (iii) the size of the mutant and by calculating the degree ofheteroplasmy observable at the tissue level.
The simulations confirm that the half-life of mtDNA has a majorinfluence on the extinction time, i.e. the time required for themutant to replace the wild type population (Fig. 3). Using para-meter values that are compatible with accepted literature values(replication time 2 h, half-life 10 days), it takes approximately 95years until the wild type is replaced by a deletion mutant that hasonly 50% of the wild type size. Our simulations also show why theselection advantage dwindles away with increasing half-life. Aftera period of time equivalent to the half-life, 50% of the populationof mtDNA molecules has been degraded and consequently thepopulation has to double in this time to maintain a steady state.If half-life increases, there is more time for the population to doubleand consequently at any given time there will be a smaller fractionof mtDNAs in the replicating state. This decline of the total fractionof replicating molecules is also shown in Fig. 3. However, thesmaller size of the mutant is only an advantage in this busy state(via a faster exit time) and consequently the selection advantagedecreases with increasing half-life.
How reliable and comprehensive are the experimental dataregarding mtDNA half-life and replication time? Unfortunately theexperimental basis is not very satisfactory. To our knowledgemtDNA half-life has only been measured in mice or rats, but neverin humans. Furthermore, studies are both sparse and old (Grosset al., 1969; Huemer et al., 1971; Korr et al., 1998), or gave resultscompletely incompatible with other studies (Collins et al., 2003).The situation regarding measurements of the mtDNA replicationtime is even worse. Clayton (1982) and Davis and Clayton (1996)are often cited as reference for a 1–2 h timespan for the mitochon-drial replication time, but those articles seem to refer back to asingle article by Berk and Clayton (1974). Given this uncertaintywe regarded it appropriate also to perform simulations coveringlonger replication times. As expected, increasing replication timesalso increased the fraction of replicating mtDNAs and conse-quently reduced extinction times (Fig. 4). But even with a replica-tion time of 10 h (and 10 days half-life), a newly emerging singlemutant still requires 19 years before the wild type has beenreplaced. These time frames are evidently incompatible forexplaining the ageing process in short lived animals. This becomeseven clearer if the simulations are extended to mtDNAs withsmaller deletions (Fig. 5). Using standard parameters a mutant thatis 30% shorter than the wild-type takes almost 150 years to takeover the mitochondrial population. If the parameters used for half-life and replication time are reliable, these numbers clearly ruleout that deletion mutants accumulate based on a reduced genomesize within a time frame that is compatible with mammalianlifespans.
We also performed stochastic simulations to take randomfluctuations into account and model the appearance of de novomutations for species with lifespans ranging from 3 to 80 years.
The simulations show that short lifespans require high mutationrates to generate a level of COX negative cells that is compatiblewith experimental findings (Fig. 6A). Even more important, thecalculated degree of heteroplasmy also rises strongly for shortlifespans (Fig. 6B). On average almost 30 different types of mtDNAsare present in COX negative cells after a 3 year simulation. Alsothese results disagree strongly with experimental observations.The results of the deterministic model have already indicated thatthe ratio between replication time and mtDNA half-life is criticalfor the selection advantage of the mutant. To further corroboratethis finding we also performed stochastic simulations for a lifespanof 3 years with a variation of the half-life from 2–10 days (Fig. 7).A reduction of the half-life strongly reduced the necessary muta-tions rate as well as the degree of heteroplasmy. These effects arecaused by the increasing selection advantage that accompanies theparameter change.
In summary, our modelling investigation shows that despite allthe uncertainty regarding experimental measurements of mtDNAhalf-life and replication time, it is highly unlikely that mitochon-drial deletion mutants gain a selection advantage from a fasterreplication time based on the reduced size. Our simulations showthat the large differences between replication time and half-lifewould lead to such extremely long extinction times (490 years),that such a process cannot serve as general mechanism to explainthe clonal expansion of mitochondrial deletion mutants in longand short lived animal species.
Acknowledgements
This work was funded by a Glenn Foundation award to T.K.The research was also supported by the National Institute for HealthResearch (NIHR) Newcastle Biomedical Research Centre based atNewcastle upon Tyne Hospitals NHS Foundation Trust and NewcastleUniversity. The views expressed are those of the authors and notnecessarily those of the NHS, the NIHR or the Department of Health.
References
Arnheim, N., Cortopassi, G., 1992. Deleterious mitochondrial DNA mutationsaccumulate in aging human tissues. Mutation Research 275, 157–167.
Bandy, B., Davison, A.J., 1990. Mitochondrial mutations may increase oxidativestress: implications for carcinogenesis and aging? Free Radical Biology andMedicine 8, 523–539.
Berk, A.J., Clayton, D.A., 1974. Mechanism of mitochondrial DNA replication inmouse L-cells: asynchronous replication of strands, segregation of circulardaughter molecules, aspects of topology and turnover of an initiation sequence.Journal of Molecular Biology 86, 801–824.
Brierley, E.J., Johnson, M.A., Lightowlers, R.N., James, O.F., Turnbull, D.M., 1998. Roleof mitochondrial DNA mutations in human aging: implications for the centralnervous system and muscle. Annals of Neurology 43, 217–223.
Cao, Z., Wanagat, J., McKiernan, S.H., Aiken, J.M., 2001. Mitochondrial DNA deletionmutations are concomitant with ragged red regions of individual, aged musclefibers: analysis by laser-capture microdissection. Nucleic Acids Research 29,4502–4508.
Chinnery, P.F., Samuels, D.C., 1999. Relaxed replication of mtDNA: A model withimplications for the expression of disease. American Journal of Human Genetics64, 1158–1165.
Clayton, D.A., 1982. Replication of animal mitochondrial DNA. Cell 28, 693–705.Collins, M.L., Eng, S., Hoh, R., Hellerstein, M.K., 2003. Measurement of mitochondrial
DNA synthesis in vivo using a stable isotope–mass spectrometric technique.Journal of Applied Physiology 94, 2203–2211.
Davis, A.F., Clayton, D.A., 1996. In situ localization of mitochondrial DNA replicationin intact mammalian cells. Journal of Cell Biology 135, 883–893.
de Grey, A.D.N.J., 1997. A proposed refinement of the mitochondrial free radicaltheory of aging. BioEssays 19, 161–166.
de Grey, A.D.N.J., 1999. The Mitochondrial Free Radical Theory of Aging, Austin. R.G.Landes Company.
Duvezin-Caubet, S., Jagasia, R., Wagener, J., Hofmann, S., Trifunovic, A., Hansson, A.,Chomyn, A., Bauer, M.F., Attardi, G., Larsson, N.G., Neupert, W., Reichert, A.S.,2006. Proteolytic processing of OPA1 links mitochondrial dysfunction toalterations in mitochondrial morphology. Journal of Biological Chemistry 281,37972–37979.
A. Kowald et al. / Journal of Theoretical Biology 340 (2014) 111–118 117

Elson, J.L., Samuels, D.C., Turnbull, D.M., Chinnery, P.F., 2001. Random intracellulardrift explains the clonal expansion of mitochondrial DNA mutations with age.American Journal of Human Genetics 68, 802–806.
Gokey, N.G., Cao, Z., Pak, J.W., Lee, D., McKiernan, S.H., McKenzie, D., Weindruch, R.,Aiken, J.M., 2004. Molecular analyses of mtDNA deletion mutations in micro-dissected skeletal muscle fibers from aged rhesus monkeys. Aging Cell 3,319–326.
Gross, N.J., Getz, G.S., Rabinowitz, M., 1969. Apparent turnover of mitochondrialdeoxyribonucleic acid and mitochondrial phospholipids in the tissues of therat. Journal of Biological Chemistry 244, 1552–1562.
Guo, X., Popadin, K.Y., Markuzon, N., Orlov, Y.L., Kraytsberg, Y., Krishnan, K.J., Zsurka,G., Turnbull, D.M., Kunz, W.S., Khrapko, K., 2010. Repeats, longevity and thesources of mtDNA deletions: evidence from “deletional spectra”. Trends inGenetics 26, 340–343.
Harman, D., 1972. The biologic clock: the mitochondria? Journal of the AmericanGeriatrics Society 20, 145–147.
Harman, D., 1983. Free radical theory of aging: consequences of mitochondrialaging. Age 6, 86–94.
Herbst, A., Pak, J.W., McKenzie, D., Bua, E., Bassiouni, M., Aiken, J.M., 2007.Accumulation of mitochondrial DNA deletion mutations in aged muscle fibers:evidence for a causal role in muscle fiber loss. Journals of Gerontology Series A:Biological Sciences and Medical Sciences 62, 235–245.
Huemer, R.P., Lee, K.D., Reeves, A.E., Bickert, C., 1971. Mitochondrial studies insenescent mice – II. Specific activity, bouyant density, and turnover ofmitochondrial DNA. Experimental Gerontology 6, 327–334.
Khrapko, K., Bodyak, N., Thilly, W.G., van Orsouw, N.J., Zhang, X., Coller, H.A., Perls, T.T.,Upton, M., Vijg, J., Wei, J.Y., 1999. Cell by cell scanning of whole mitochondrialgenomes in aged human heart reveals a significant fraction of myocytes withclonally expanded deletions. Nucleic Acids Research 27, 2434–2441.
Kirkwood, T.B.L., 1996. Human senescence. BioEssays 18, 1009–1016.Kim, I., Lemasters, J.J., 2011. Mitophagy selectively degrades individual damaged
mitochondria after photoirradiation. Antioxidants and Redox Signaling 14,1919–1928.
Korr, H., Kurz, C., Seidler, T.O., Sommer, D., Schmitz, C., 1998. Mitochondrial DNAsynthesis studied autoradiographically in various cell types in vivo. BrazilianJournal of Medical and Biological Research 31, 289–298.
Kowald, A., Kirkwood, T.B., 2011. Evolution of the mitochondrial fusion-fission cycleand its role in aging. Proceedings of the National Academy of Sciences USA 108,10237–10242.
Kowald, A., Kirkwood, T.B.L., 2013. Mitochondrial mutations and aging: randomdrift is insufficient to explain the accumulation of mitochondrial deletionmutants in short-lived animals. Aging Cell.
Lee, C.M., Lopez, M.E., Weindruch, R., Aiken, J.M., 1998. Association of age-relatedmitochondrial abnormalities with skeletal muscle fiber atrophy. Free RadicalBiology and Medicine 25, 964–972.
Linnane, A.W., Marzuki, S., Ozawa, T., Tanaka, M., 1989. Mitochondrial DNAmutations as an important contributor to ageing and degenerative diseases.Lancet 1, 642–645.
Miquel, J., Economos, A.C., Fleming, J., Johnson Jr., J.E., 1980. Mitochondrial role incell aging. Experimental Gerontology 15, 575–591.
Richter, C., 1988. Do mitochondrial DNA fragments promote cancer and aging? FEBSLetters 241, 1–5.
Shoffner, J.M., Lott, M.T., Voljavec, A.S., Soueidan, S.A., Costigan, D.A., Wallace, D.C.,1989. Spontaneous Kearns-Sayre/chronic external ophthalmoplegia plus syn-drome associated with a mitochondrial DNA deletion: a slip-replication modeland metabolic therapy. Proceedings of the National Academy of Sciences USA86, 7952–7956.
Twig, G., Elorza, A., Molina, A.J., Mohamed, H., Wikstrom, J.D., Walzer, G., Stiles, L.,Haigh, S.E., Katz, S., Las, G., Alroy, J., Wu, M., Py, B.F., Yuan, J., Deeney, J.T.,Corkey, B.E., Shirihai, O.S., 2008. Fission and selective fusion govern mitochon-drial segregation and elimination by autophagy. EMBO Journal 27, 433–446.
Wallace, D.C., 1992. Mitochondrial genetics: a paradigm for aging and degenerativediseases? Science 256, 628–632.
A. Kowald et al. / Journal of Theoretical Biology 340 (2014) 111–118118