MIP1(CCL3) is a downstream target of FGFR3 and RAS-MAPK signaling in multiple myeloma
32
doi:10.1182/blood-2006-04-017087 Prepublished online July 18, 2006; Wei, David Roodman, Jaimie Claudio, Leif Bergsagel and A Keith Stewart Esther Masih-Khan, Suzanne Trudel, Carla Heise, ZhiHua Li, Joshua Paterson, Vincent Nadeem, Ellen in Multiple Myeloma (CCL3) is a Downstream Target of FGFR3 and RAS/MAPK Signaling α MIP-1 (1930 articles) Signal Transduction (4217 articles) Neoplasia (564 articles) Chemokines, Cytokines, and Interleukins Articles on similar topics can be found in the following Blood collections http://bloodjournal.hematologylibrary.org/site/misc/rights.xhtml#repub_requests Information about reproducing this article in parts or in its entirety may be found online at: http://bloodjournal.hematologylibrary.org/site/misc/rights.xhtml#reprints Information about ordering reprints may be found online at: http://bloodjournal.hematologylibrary.org/site/subscriptions/index.xhtml Information about subscriptions and ASH membership may be found online at: digital object identifier (DOIs) and date of initial publication. the indexed by PubMed from initial publication. Citations to Advance online articles must include final publication). Advance online articles are citable and establish publication priority; they are appeared in the paper journal (edited, typeset versions may be posted when available prior to Advance online articles have been peer reviewed and accepted for publication but have not yet Copyright 2011 by The American Society of Hematology; all rights reserved. 20036. the American Society of Hematology, 2021 L St, NW, Suite 900, Washington DC Blood (print ISSN 0006-4971, online ISSN 1528-0020), is published weekly by For personal use only. by guest on June 5, 2013. bloodjournal.hematologylibrary.org From
-
Upload
independent -
Category
Documents
-
view
1 -
download
0
Transcript of MIP1(CCL3) is a downstream target of FGFR3 and RAS-MAPK signaling in multiple myeloma
doi:10.1182/blood-2006-04-017087Prepublished online July 18, 2006;
Wei, David Roodman, Jaimie Claudio, Leif Bergsagel and A Keith StewartEsther Masih-Khan, Suzanne Trudel, Carla Heise, ZhiHua Li, Joshua Paterson, Vincent Nadeem, Ellen in Multiple Myeloma
(CCL3) is a Downstream Target of FGFR3 and RAS/MAPK SignalingαMIP-1
(1930 articles)Signal Transduction � (4217 articles)Neoplasia �
(564 articles)Chemokines, Cytokines, and Interleukins �Articles on similar topics can be found in the following Blood collections
http://bloodjournal.hematologylibrary.org/site/misc/rights.xhtml#repub_requestsInformation about reproducing this article in parts or in its entirety may be found online at:
http://bloodjournal.hematologylibrary.org/site/misc/rights.xhtml#reprintsInformation about ordering reprints may be found online at:
http://bloodjournal.hematologylibrary.org/site/subscriptions/index.xhtmlInformation about subscriptions and ASH membership may be found online at:
digital object identifier (DOIs) and date of initial publication. theindexed by PubMed from initial publication. Citations to Advance online articles must include
final publication). Advance online articles are citable and establish publication priority; they areappeared in the paper journal (edited, typeset versions may be posted when available prior to Advance online articles have been peer reviewed and accepted for publication but have not yet
Copyright 2011 by The American Society of Hematology; all rights reserved.20036.the American Society of Hematology, 2021 L St, NW, Suite 900, Washington DC Blood (print ISSN 0006-4971, online ISSN 1528-0020), is published weekly by
For personal use only. by guest on June 5, 2013. bloodjournal.hematologylibrary.orgFrom
MIP-1α (CCL3) is a Downstream Target of FGFR3 and RAS/MAPK Signaling in Multiple Myeloma
Esther Masih-Khan1*, Suzanne Trudel1*, Carla Heise2, Zhihua Li1, Joshua
Paterson1, Vincent Nadeem1, Ellen Wei1, David Roodman3, Jaime O. Claudio1, P. Leif Bergsagel4, and A. Keith Stewart1,4
[1] Department of Medical Oncology, Princess Margaret Hospital, University Health Network, Toronto, ON M5G 2C1, Canada. [2] Chiron Corporation, Emoryville, CA. [3] University of Pittsburgh, [4] Mayo Clinic, Scottsdale, Arizona
Running Title: FGFR3 Signaling regulates MIP-1α Scientific heading: Neoplasia Key words: Multiple myeloma, Biomarkers, FGFR3, MIP-1α, CCL3, siRNA, FGFR3 inhibitors Word count: Abstract: 196 Main Text: 3109 Support: This work was supported by grants from the National Cancer Institute of Canada and the Canadian Institutes for Health Research (AKS) and by the ASH Scholar Award (ST), the Eli Lilly/CCO/CIHR Hollenberg Award (ST), and the Ontario Cancer Research Network through funding provided by the Province of Ontario (ST).
Correspondence: Keith Stewart CRB Room 3-008 Mayo Clinic 13208 East Shea Boulevard Scottsdale, Arizona. 85259 Tel: (480) 301 4411, Fax: (480) 301-8387 Email: [email protected]
Author AKS has a consulting contract with Chiron of less than $10,000 annual value. Author ST has received research support in excess of $10,000 from Chiron and author CH is an employee of Chiron Pharmaceuticals.
Blood First Edition Paper, prepublished online July 18, 2006; DOI 10.1182/blood-2006-04-017087
Copyright © 2006 American Society of Hematology
For personal use only. by guest on June 5, 2013. bloodjournal.hematologylibrary.orgFrom
1
Abstract
Over expression of fibroblast growth factor receptor 3 (FGFR3) is a hallmark of t(4;14)
Multiple Myeloma (MM). To dissect the mechanism of FGFR3 oncogenesis in MM we
employed three FGFR selective kinase inhibitors - CHIR-258, PD173074, SU5402 - and
FGFR3 specific siRNA to modulate FGFR3 activity. Conversely the ligand FGF was
used to stimulate FGFR3 function in human MM cells. The transcriptional response to
FGFR3 modification was recorded and gene expression changes common to all five
modifiers documented. Ten genes were commonly regulated. Macrophage Inflammatory
Protein-1 alpha (MIP-1-α) was the single most differentially altered gene. MIP-1α
promoter function, gene expression and protein secretion were each down-regulated
following inhibition of FGFR3 signaling. Down-regulation of MIP-1α was not however
observed following FGFR3 inhibition in MM cells with RAS mutations implicating
RAS-MAPK in MIP-1α regulation. As confirmation, inhibition of ERK1 also down
regulated MIP-1α in FGFR3 inhibitor resistant cells harboring RAS mutations. MIP-1α
is implicated in the survival and proliferation of MM cells and the pathogenesis of MM
bone disease. Our observation is the first to directly link an initiating IgH translocation
not only to MM cell growth and survival but also to the disease associated bone disease.
For personal use only. by guest on June 5, 2013. bloodjournal.hematologylibrary.orgFrom
2
Introduction
A primary t(4;14)(p16.3;q32.3) chromosomal translocation results in ectopic expression
of fibroblast growth factor receptor 3 (FGFR3) and immunoglobulin heavy chain-
MMSET transcripts in 15% of multiple myeloma (MM) patients1,2. This translocation is
not only present in MM but also in monoclonal gammopathy of unknown significance
(MGUS), a precursor for MM3.
FGFR3 is a transmembrane tyrosine kinase receptor that plays an important role in
normal chondrocyte and bone development4. Indeed, activating mutations of FGFR3
cause the most common forms of human dwarfism5-7. In MM, we have previously
demonstrated that FGFR3 functions as an oncogene8, that ectopic expression of FGFR3
promotes cytokine independence9 and that inhibition of FGFR3 kinase function promotes
cellular apoptosis10-12. Furthermore, we have demonstrated that the presence of a t(4;14)
in MM is associated with a poor clinical outcome13-15. Importantly then, the cellular
consequences of inappropriate FGFR3 kinase activity in MM are not fully understood or
characterized.
Both RAS-MAPK16,17 and STAT9,18 pathways are reported as mediating the oncogenic
effects of FGFR3. For example, in NIH3T3 cells TDII mutant FGFR3 (K650E) is
transforming and inhibition of RAS or RAF signaling pathway in the same cells by a
dominant negative form of RAS can reduce TDII FGFR3 transformation efficiency
demonstrating that MAPK activation is a consequence of FGFR3 signaling19. In support
of this we have shown potent pMAPK activation following FGF ligand stimulation of
For personal use only. by guest on June 5, 2013. bloodjournal.hematologylibrary.orgFrom
3
t(4;14) MM cell lines, down regulation of pERK following FGFR3 inhibition11 and
resistance of MM cells to FGFR3 inhibition in the presence of RAS mutation10-12.
Nevertheless, since information on FGFR3 signaling in MM cells is still limited, the aim
of our study was to expand understanding of the pathways regulated by FGFR3 over
expression. To this end we employed a series of known FGFR selective kinase inhibitors,
CHIR-25811, PD17307412, SU540210, FGFR3 specific RNAi and the ligand, acidic FGF
(aFGF), to treat genetically characterized MM cell lines. Changes in gene expression
profile in response to FGFR3 perturbation were then examined. The transcriptional
response to FGFR3 modification was then recorded and genes commonly regulated by all
5 modifiers documented. Of these, the most differentially altered gene was MIP-1α
(CCL3) a known trigger of survival and proliferation in MM20-26. Subsequent studies,
reported here, confirmed that MIP-1α promoter activity, as well as MIP-1α gene and
protein expression/secretion are regulated by FGFR3 through activation of the RAS-
MAPK pathway.
For personal use only. by guest on June 5, 2013. bloodjournal.hematologylibrary.orgFrom
4
Materials and Methods
Reagents
SU5402, a known FGFR inhibitor was provided by Sugen Inc. (San Francisco, CA,
USA). PD173074 was obtained as a gift from Pfizer. PD98059 was obtained from Cell
Signaling Technology, Inc. (Danvers, MA, USA). CHIR-258 was provided by Chiron,
Emeryville, CA, USA. Human recombinant acidic fibroblast growth factor (aFGF) was
obtained from R&D Systems Inc. (Minneapolis, MN, USA). Antibodies to FGFR3 (B-9,
C-15) were purchased from Santa Cruz Biotechnology, Inc. (Santa Cruz, CA, USA).
Antibodies to ERK1/2 and anti-rabbit/mouse IgG horseradish peroxidase were purchased
from Cell Signaling Technology. The MIP-1-promoter luciferase construct was a gift
from Dr. Choi, Sun J., Deparment of Medicine Hematology, University of Pittsburg, PA,
USA23.
Cell culture and Drug Treatment
Human MM cell lines (KMS11, KMS18, H929 and UTMC2) were grown in Iscove
modified Dulbecco medium (IMDM) supplemented with 5% fetal calf serum (FCS), 100
ug/mL penicillin, and 100 ug/mL streptomycin (Hyclone, Logan, UT). To determine
transcriptional changes associated with FGFR3 inhibition cells lines were washed and
plated in triplicate in IMDM plus 5% FCS and incubated for 48 hours with SU5402
(5uM), CHIR258 (500nM) or PD173074 (100nM). 48 hours was chosen as the effect of
these drugs on cell viability is delayed and cellular cytotoxicity is still limited at 48
hours10-12. For ligand stimulation assays cells were starved overnight and induced for
For personal use only. by guest on June 5, 2013. bloodjournal.hematologylibrary.orgFrom
5
eight hours with aFGF at 80ng/ml and 30µg/ml heparin before harvesting. Uninduced
cells served as a negative control. Cells were then harvested and RNA extracted for
subsequent expression profiling.
SiRNA Nucleofection
H929 and KMS11 cells were suspended in solution from nucleofector kit V
following the Amaxa manufacturers (Amaxa, Cologne, Germany) guidelines for
cell line transfection. Briefly, 100 ul containing 5 x10⁶ cells with 5nM of either
FGFR3, ERK1 and 2 or scrambled control siRNA oligonucleotides (Dharmacon,
Lafayette, Colorado) were transferred to the provided cuvette and nucleofected
with an Amaxa Nucleofector apparatus (Amaxa, Cologne, Germany). After
transfection cells were immediately transferred into wells containing 37°C pre-
warmed culture medium in 6 well plates.
MTT Assays
For viability assays, cells were washed and plated in triplicate in IMDM plus 5% FCS
and incubated for 72 hours with SU5402 (5uM), CHIR258 (500nM) or PD173074
(100nM) at concentrations of drug previously shown to inhibit FGFR3 function and to
maximally inhibit the viability of FGFR3 expressing myeloma cell lines10-12 Cells were
then analyzed by MTT [3-(4,5-dimethylthiazolyl-2)-2,5-diphenyltetrazolium bromide]
assay (Boehringer Mannheim, Mannheim, Germany) according to the manufacturer’s
protocol. Each experimental condition was performed in triplicate..
For personal use only. by guest on June 5, 2013. bloodjournal.hematologylibrary.orgFrom
6
Total cellular extracts and Western blots
Whole cell lysates were made from MM cell lines by re-suspending cell pellets in 2X
sample buffer. The whole extracts were boiled for 5 minutes and quick chilled before
loading onto a gel. Thirty microliters of the extract was resolved on SDS polyacrylamide
gels (10%) and transferred to a nitrocellulose membranes (Immobilon P, Millipore,
Billerica, MA, USA) using a semidry electroblotter. The membranes were probed with
antibodies against FGFR3 and ERK1/2. Signals were detected by secondary
horseradishperoxidase-conjugated antibody and enhanced chemiluminiscence, as
recommended by the manufacturer (Amersham Biosciences, Pittsburgh, PA). To
normalize the results, blots were re-probed with an antibody against actin (Santa Cruz
Biotechniology, Santa Cruz, CA).
Intracellular immunostaining for MIP-1α
Cells in 0.5ml media were peletted and re-suspended in PBS at a concentration of 2-
5x10⁵. 0.1 ml of 10% formaldehyde was added and incubated at 37oC for 10 min
followed by incubation on ice for 2 min, adding 5.4 ml of ice-cold methanol gradually
and incubating on ice for another 30 min. The cells were centrifuged and washed once
with PBS supplemented with 4% fetal bovine serum (FBS). Monoclonal anti-human
MIP-1a/CCL3 antibody (R & D systems, Minneapolis, MN) was then added to the cells
and incubated at room temperature for 15 min, followed by another wash with PBS and
4% FBS. Secondary antibody anti-mouse IgG-PE was added and incubated at room
temperature for 15 min. The cells were washed once with PBS+4% FBS and analyzed by
For personal use only. by guest on June 5, 2013. bloodjournal.hematologylibrary.orgFrom
7
FACS. Gating was performed on viable cells using forward and side scatter. Each
experimental condition was repeated twice.
CCL3 promoter assay
3T3 cells that endogenously express FGFR1 (wild type) were incubated for 24 hours in
the presence of PD173074 or DMSO vehicle alone and then transfected with a MIP-
1α promoter – luciferase construct23 and a control vector containing green fluorescent
protein (to determine transfection efficiency). Following transfection cells were cultured
for a further 48 hours with DMSO or PD173074. Luciferase activity was then measured
and corrected for transfection efficiency by GFP expression and protein concentration.
Normalized luciferase activity was expressed as (luciferase activity units/ (% transfection
efficiency x protein concentration). Each experimental condition was repeated four times.
ELISA quantitation of MIP-1α levels
KMS11 and H929 MM cells were plated with CHIR-258 or PD173074 or vehicle control
for 48 hours. Cells were then washed, harvested and viable cells quantitated by trypan
blue exclusion. Cells were then replated at 500,000 viable cells/ml, left for 8-10 hours
and then recounted. Supernatant was harvested and an ELISA performed using anti-
human MIP-1α/CCL3 antibody (R & D systems, Minneapolis, MN). Final MIP-1α
concentration was corrected for cell viability at the end of the full culture period. The
experiment was performed in triplicate.
For personal use only. by guest on June 5, 2013. bloodjournal.hematologylibrary.orgFrom
8
Gene Expression Profiling
Gene expression on MM cell lines was analyzed on Human U133_Plus2 arrays from
Affymetrix (Santa Clara, CA, USA). Syntheses of cDNA, biotinylated cRNA,
hybridizations and scanning were conducted according to the protocols provided by the
manufacturer. For patient analysis we accessed publicly available data from the
University of Arkansas on 231 patients with newly diagnosed MM, 30 with relapsed
MM, 12 with MGUS, 32 human myeloma cell lines (HMCLs), and 14 control subjects27.
Gene expression intensity values, measured with the use of MAS software, version 5.01
(Affymetrix, Santa Clara, CA), were log transformed, normalized to the median, and
analyzed using GeneSpring 7 (Silicon Genetics, Redwood City, CA).
For personal use only. by guest on June 5, 2013. bloodjournal.hematologylibrary.orgFrom
9
Results
Response of MM cell lines to FGFR3 inhibitors
Previously our lab and others have shown selective anti-FGFR3 activity for SU5402,
PD173074 and CHIR-258 in MM cells with t(4;14) IgH translocations. All three of these
small molecule receptor tyrosine kinase inhibitors compete with ATP for the specific
binding site within the catalytic domain of the receptor. We were interested in using this
resource to determine downstream targets of FGFR3. KMS11, H929 and KMS18
myeloma cells that harbor a t(4;14) translocation and as a result over-express FGFR3
were treated for 48 hours with SU5402 (5uM), CHIR258 (500nM) or PD173074
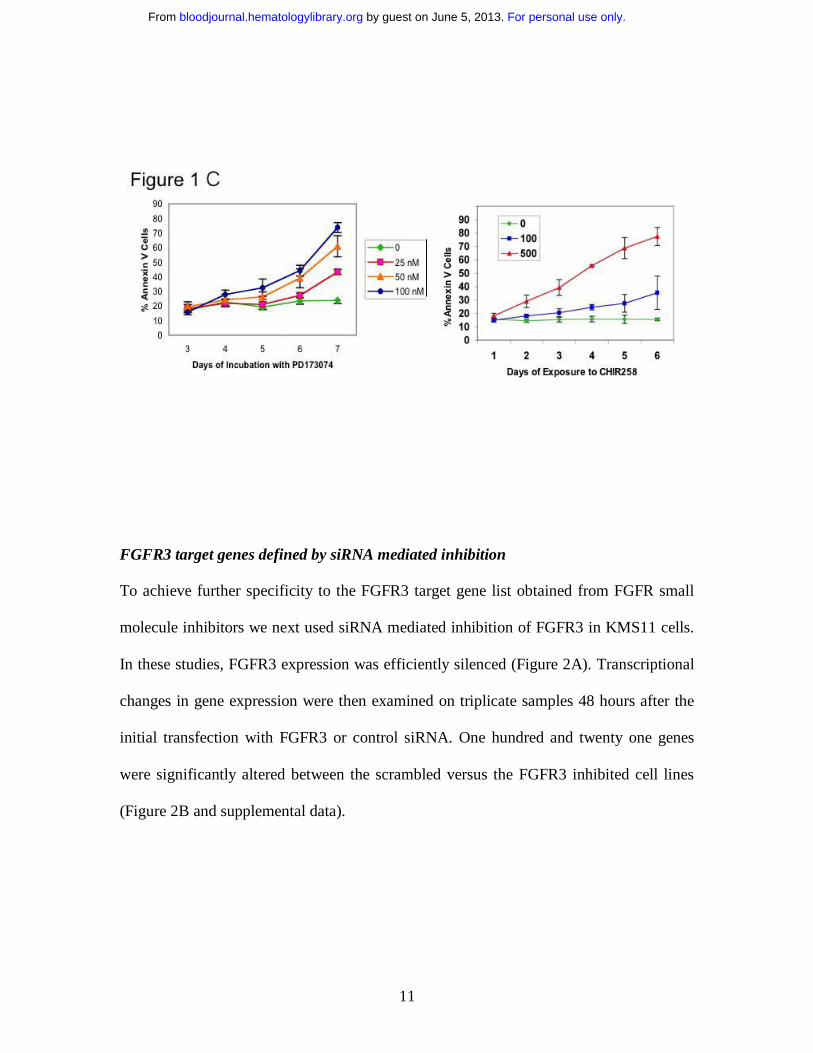
(100nM) at maximally effective dose concentrations. In figure 1 we demonstrate that
even at 72 hours PD173074 is not cytotoxic to myeloma cells and that cellular
cytotoxicity to CHIR258 is present at 48 hours but not yet marked. RNA was extracted
from drug or vehicle treated cells at the 48 hour time point and was analyzed on
Affymetrix human HG_U133_PLUS2 arrays. Vehicle treated KMS11, H929 and KMS18
cells as well as FGFR3 negative U266 myeloma cells served as controls.
A mean of duplicate samples of CHIR-258 treated versus DMSO control KMS11 cells
gave a list of 1618 differentially expressed genes when quality controlled data was set at
a cutoff of 2 fold change. Using the same normalization and filtering criteria SU5402
treatment gave a list of 1945 genes and PD173074 treatment a list of 1987 differentially
regulated genes. Since each kinase inhibitor is non-specific and has a broad range of
activity against a number of class III, IV and V tyrosine kinases we next sought to define
what gene expression signatures are shared between the three compounds. For this we
used venn diagrams to overlap the three differential expression gene lists and thus
For personal use only. by guest on June 5, 2013. bloodjournal.hematologylibrary.orgFrom
10
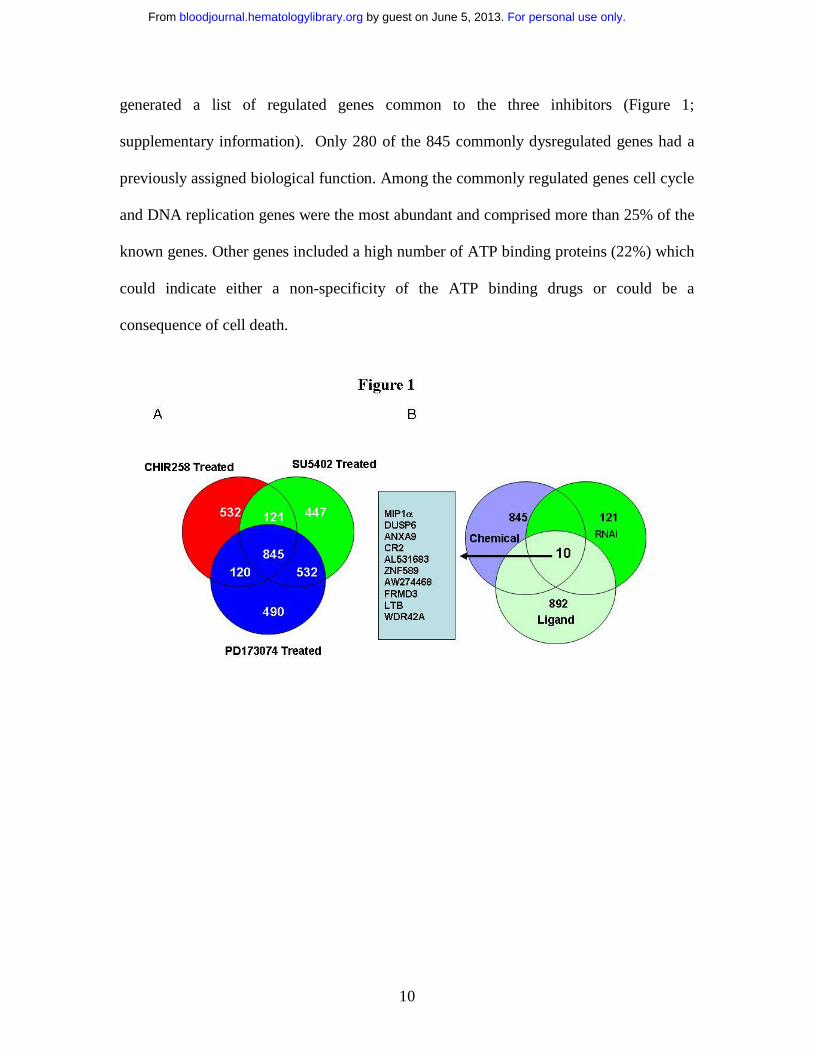
generated a list of regulated genes common to the three inhibitors (Figure 1;
supplementary information). Only 280 of the 845 commonly dysregulated genes had a
previously assigned biological function. Among the commonly regulated genes cell cycle
and DNA replication genes were the most abundant and comprised more than 25% of the
known genes. Other genes included a high number of ATP binding proteins (22%) which
could indicate either a non-specificity of the ATP binding drugs or could be a
consequence of cell death.
For personal use only. by guest on June 5, 2013. bloodjournal.hematologylibrary.orgFrom
11
FGFR3 target genes defined by siRNA mediated inhibition
To achieve further specificity to the FGFR3 target gene list obtained from FGFR small
molecule inhibitors we next used siRNA mediated inhibition of FGFR3 in KMS11 cells.
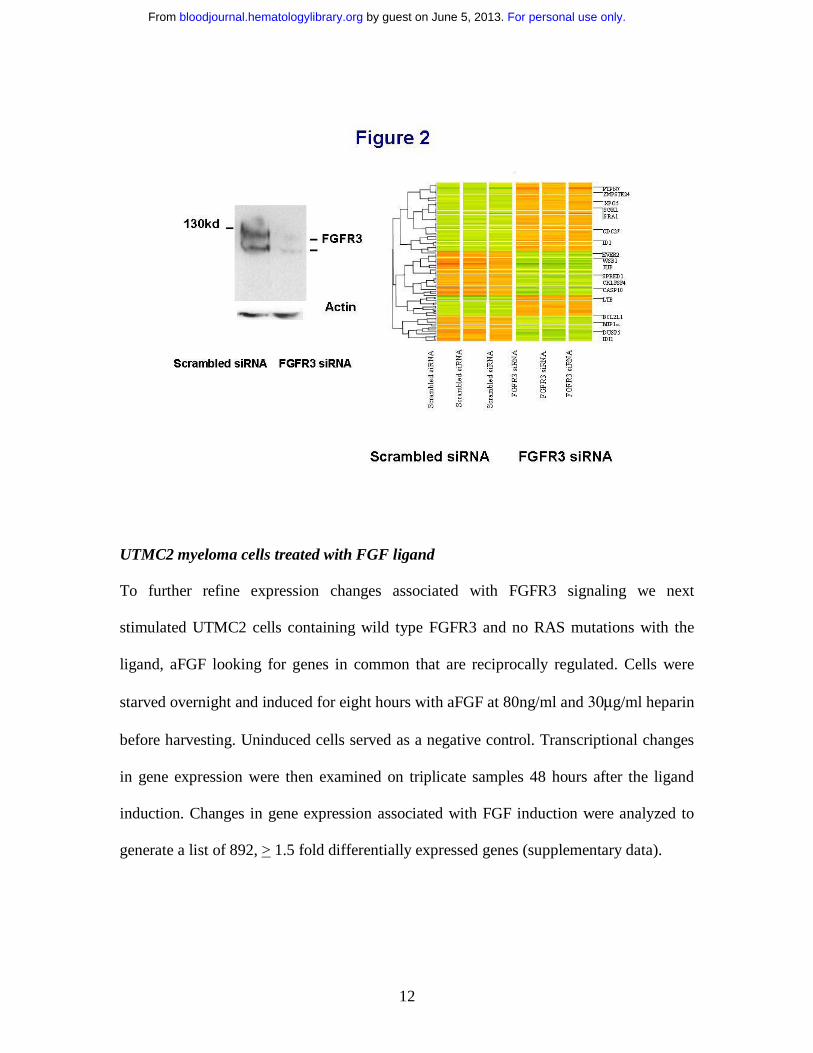
In these studies, FGFR3 expression was efficiently silenced (Figure 2A). Transcriptional
changes in gene expression were then examined on triplicate samples 48 hours after the
initial transfection with FGFR3 or control siRNA. One hundred and twenty one genes
were significantly altered between the scrambled versus the FGFR3 inhibited cell lines
(Figure 2B and supplemental data).
For personal use only. by guest on June 5, 2013. bloodjournal.hematologylibrary.orgFrom
12
UTMC2 myeloma cells treated with FGF ligand
To further refine expression changes associated with FGFR3 signaling we next
stimulated UTMC2 cells containing wild type FGFR3 and no RAS mutations with the
ligand, aFGF looking for genes in common that are reciprocally regulated. Cells were
starved overnight and induced for eight hours with aFGF at 80ng/ml and 30µg/ml heparin
before harvesting. Uninduced cells served as a negative control. Transcriptional changes
in gene expression were then examined on triplicate samples 48 hours after the ligand
induction. Changes in gene expression associated with FGF induction were analyzed to
generate a list of 892, > 1.5 fold differentially expressed genes (supplementary data).
For personal use only. by guest on June 5, 2013. bloodjournal.hematologylibrary.orgFrom
13
Genes differentially changed by FGFR inhibitors, siRNA and FGF induction
Changes in expressed gene profiles shared by all three FGFR small molecule inhibitors,
FGFR3 siRNA knockdown and reciprocally affected by FGF ligand induction were next
generated by overlapping lists of genes at least two fold differentially regulated from
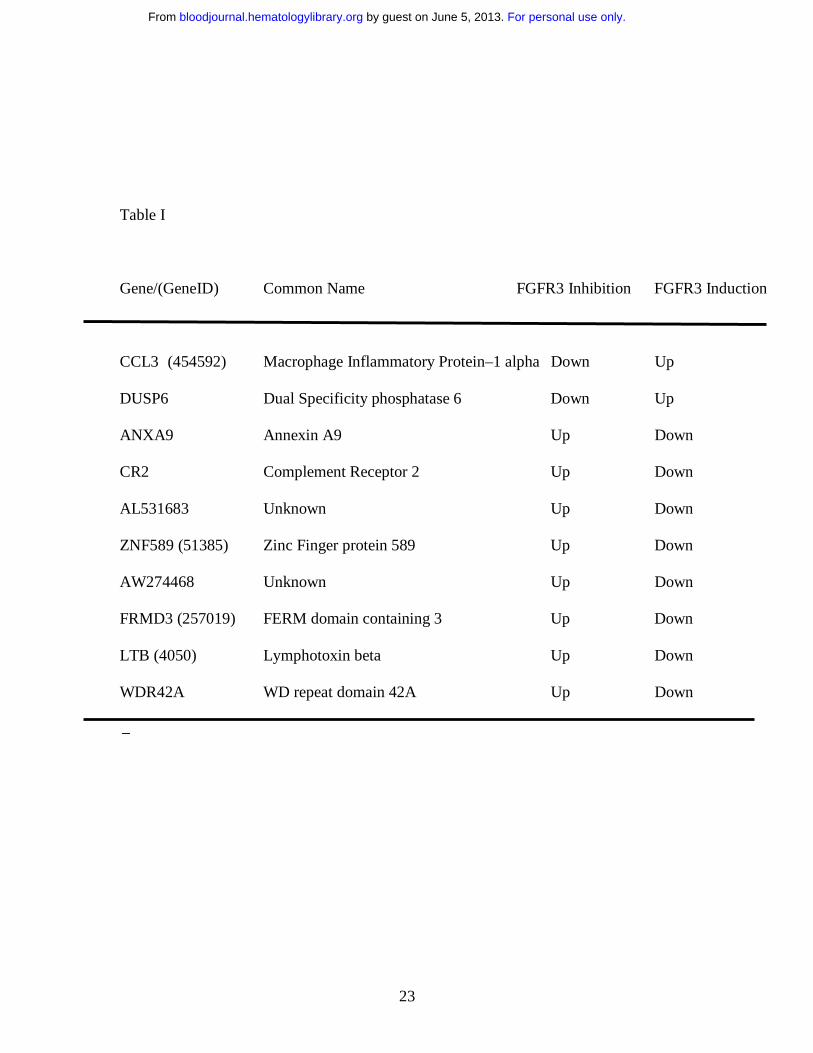
each grouping (1.5 fold in the case of FGF ligand) (Figure 1B). Only ten genes fulfilled
these strict criterion. Two of these genes, MIP-1α (CCL3) and DUSP6, were
downregulated by inhibition of FGFR3 and induced by FGF induction whereas eight
genes (ANXA9, CR2, AL531683, SZF1-1, AW274468, FRMD3, LTB and WDR42A)
showed an up regulation by inhibition of the FGFR3 receptor and down regulation on its
induction (Table I). Since MIP-1α was the single most differentially altered gene (12
fold change), had a known association with osteolytic bone destruction and had been
shown to mediate growth, survival and migration in MM cells we were interested in
exploring this observation further.
MIP-1α promoter activity is regulated by FGFR signaling
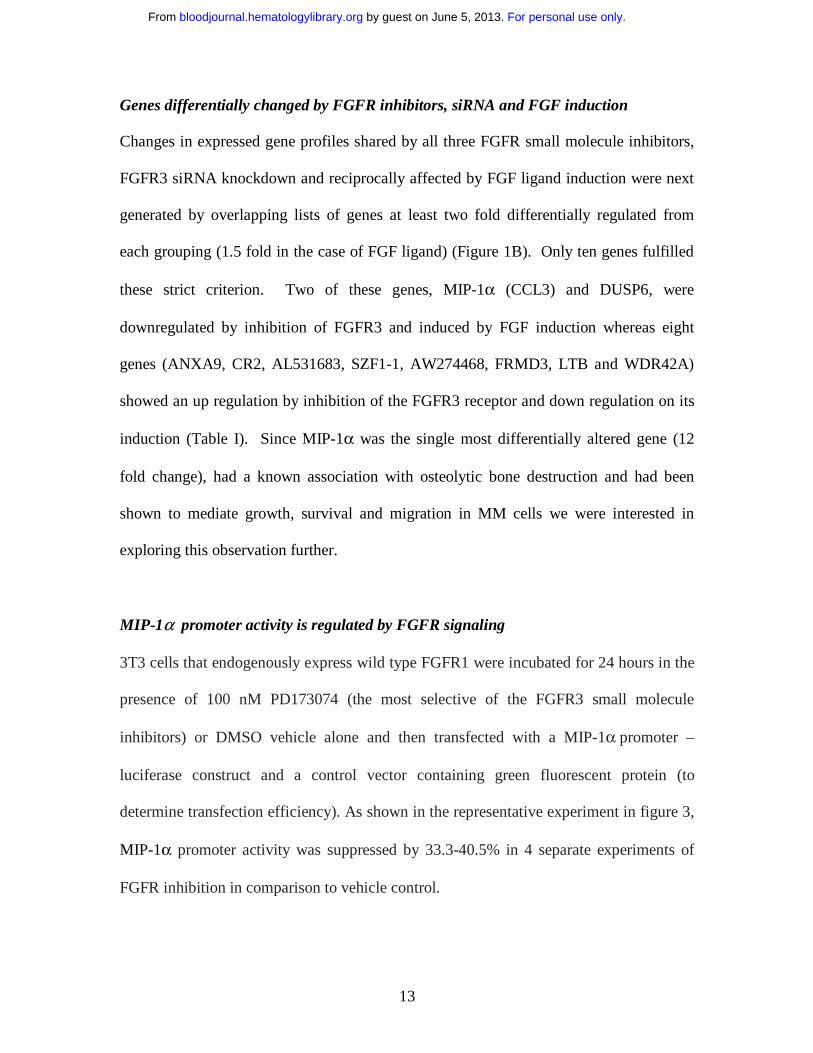
3T3 cells that endogenously express wild type FGFR1 were incubated for 24 hours in the
presence of 100 nM PD173074 (the most selective of the FGFR3 small molecule
inhibitors) or DMSO vehicle alone and then transfected with a MIP-1α promoter –
luciferase construct and a control vector containing green fluorescent protein (to
determine transfection efficiency). As shown in the representative experiment in figure 3,
MIP-1α promoter activity was suppressed by 33.3-40.5% in 4 separate experiments of
FGFR inhibition in comparison to vehicle control.
For personal use only. by guest on June 5, 2013. bloodjournal.hematologylibrary.orgFrom
14
MIP-1α protein decreases in response to FGFR3 Inhibition
MIP-1α protein levels were determined in two FGFR3 expressing cell lines, KMS11 and
H929. These two cell lines were selected on the basis of their differential sensitivity to
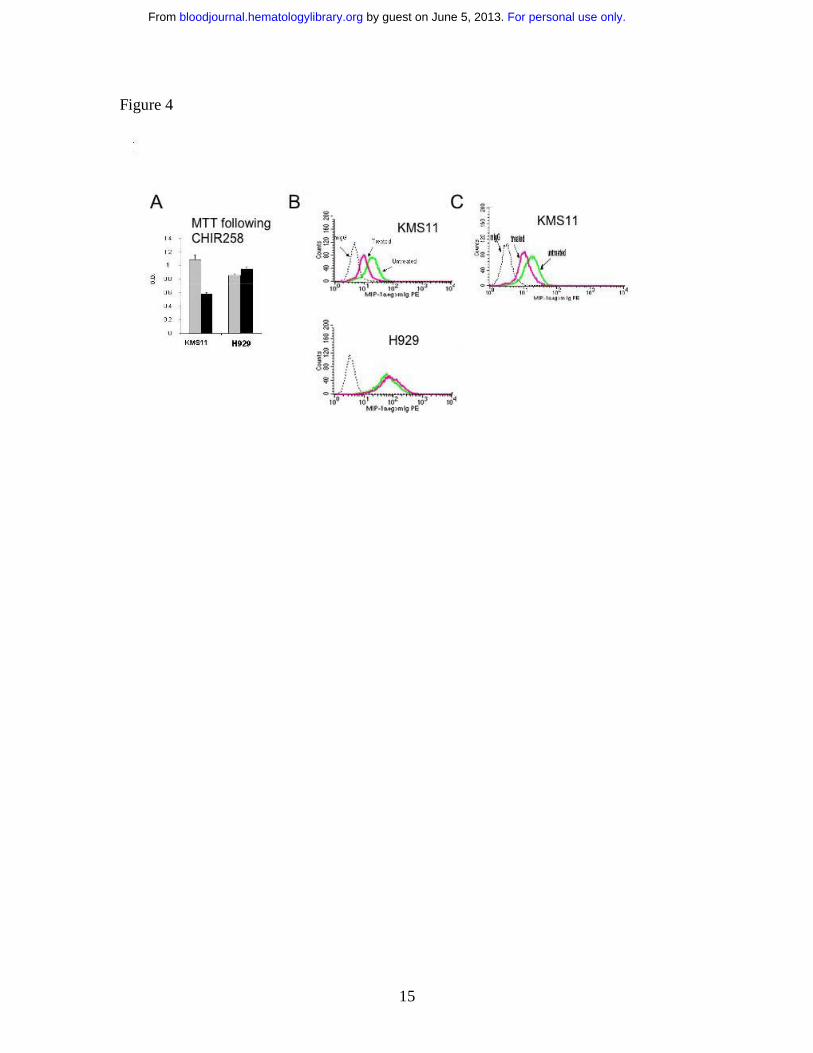
FGFR inhibitors in MTT assays (Figure 4A and references 11 and 12). The t(4;14)
KMS11 cell line was responsive whereas H929, which harbors a downstream ras
mutation in addition to expressing FGFR3, was resistant to FGFR3 inhibition in
accordance with previous reports10-12. Interestingly, when both cell lines were assessed
for intracellular MIP-1α protein expression by flow cytomtery (Figure 4B) KMS11 cells
had relatively lower baseline level of MIP-1α protein compared with the high levels of
protein present in H929 cells.
For personal use only. by guest on June 5, 2013. bloodjournal.hematologylibrary.orgFrom
15
Figure 4
For personal use only. by guest on June 5, 2013. bloodjournal.hematologylibrary.orgFrom
16
In response to CHIR-258 (500 nM) (figure 4B) or PD173074 (100nM) (figure 4C)
treatment of KMS11 cells lowered MIP-1α. protein levels paralleled the observed
decrease in RNA expression seen on arrays.
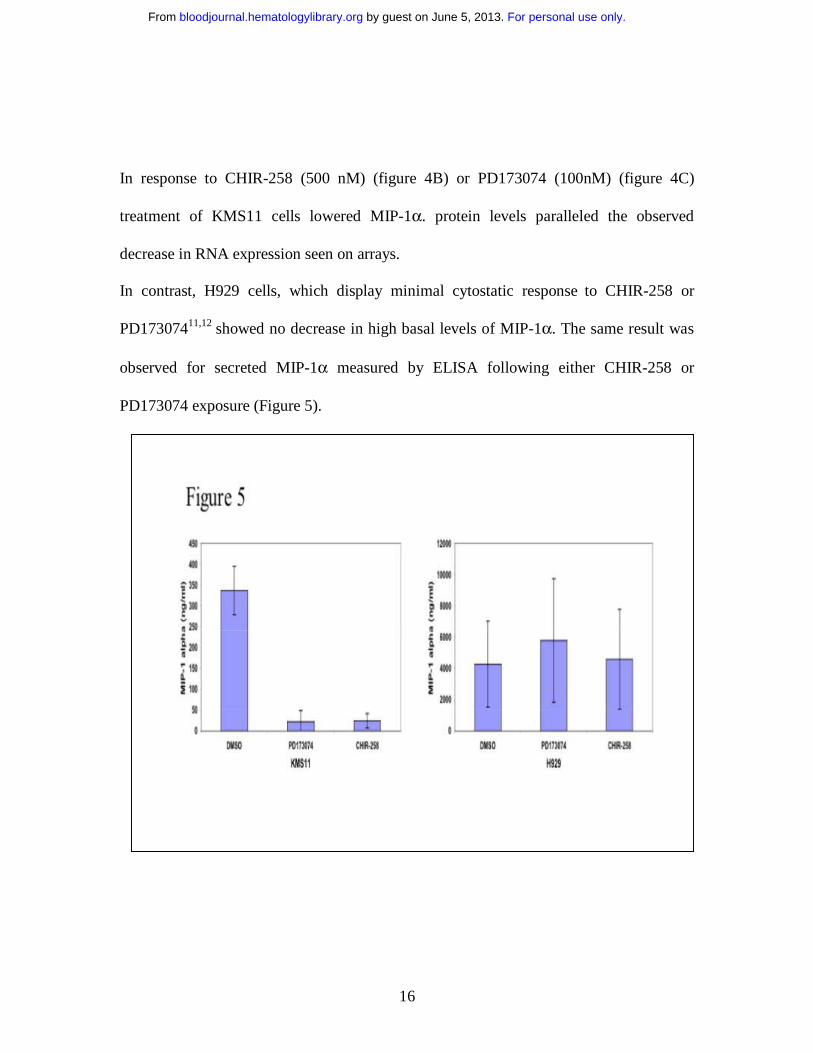
In contrast, H929 cells, which display minimal cytostatic response to CHIR-258 or
PD17307411,12 showed no decrease in high basal levels of MIP-1α. The same result was
observed for secreted MIP-1α measured by ELISA following either CHIR-258 or
PD173074 exposure (Figure 5).
For personal use only. by guest on June 5, 2013. bloodjournal.hematologylibrary.orgFrom
17
Since FGFRs signal in part via RAS/MAPK this finding suggested that MIP-1α is also
being regulated through the RAS/MAPK pathway and thus inhibition of FGFR3,
upstream of RAS does not affect MIP-1α levels in H929 cells. ERK1/2 has been
implicated in FGFR3 signaling in our lab and by others. In order to investigate this
possibility we next decided to inhibit ERK1/2, a downstream target of RAS in H929 cells
and determine changes in MIP-1α levels.
Inhibition of ERK1/2 in myeloma cells down-regulates MIP-1α expression
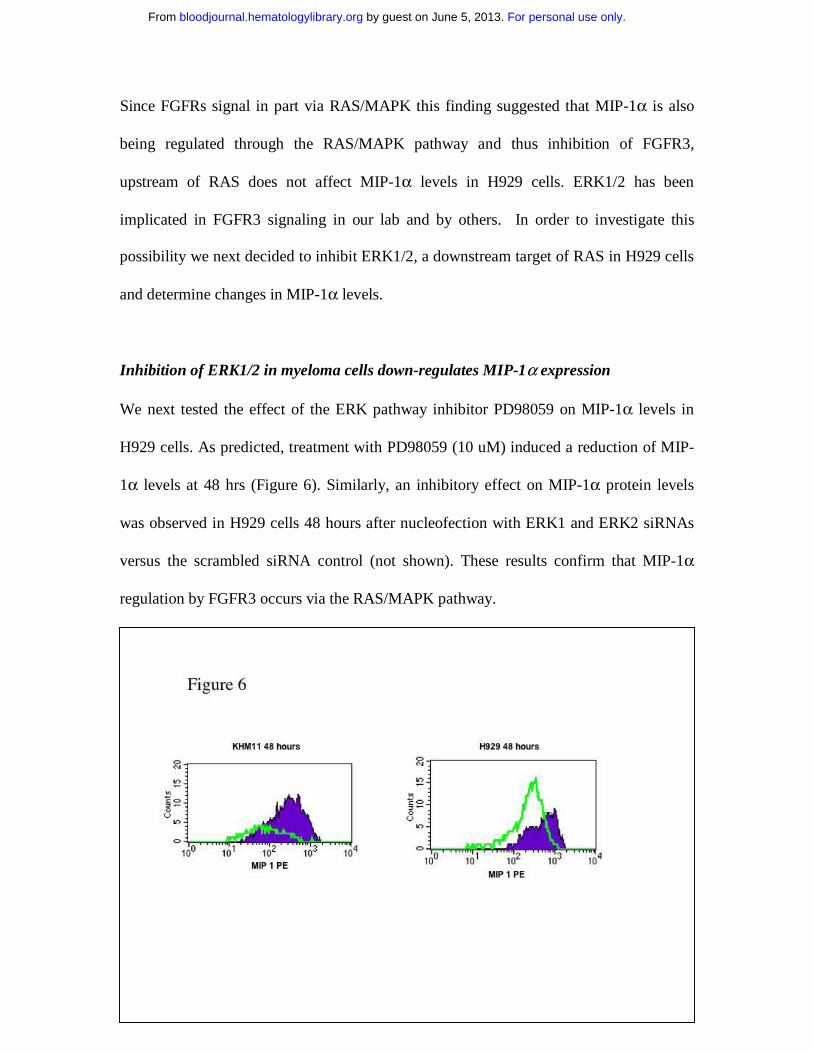
We next tested the effect of the ERK pathway inhibitor PD98059 on MIP-1α levels in
H929 cells. As predicted, treatment with PD98059 (10 uM) induced a reduction of MIP-
1α levels at 48 hrs (Figure 6). Similarly, an inhibitory effect on MIP-1α protein levels
was observed in H929 cells 48 hours after nucleofection with ERK1 and ERK2 siRNAs
versus the scrambled siRNA control (not shown). These results confirm that MIP-1α
regulation by FGFR3 occurs via the RAS/MAPK pathway.
For personal use only. by guest on June 5, 2013. bloodjournal.hematologylibrary.orgFrom
18
MIP1α in multiple myeloma patient samples
To determine whether these observations had clinical relevance we looked at a mined
expression profiling data set of 231 MM patient samples27. MIP-1α expression was
generally higher than in normal plasma cells in all MM subgroups except t(11;14) and
t(6;14) patients. It was generally also higher in human myeloma cell lines suggesting a
link with proliferation of the tumor sample (not shown). Patient samples were next
segregated by TC classification27(Figure 7A). Levels were universally high except in
except t(11;14) and t(6;14) patients p=0.03 (Figure 7B). Mechanisms unrelated to
FGFR3, but we speculate RAS/MAPK dependant, likely determine MIP-1α expression in
t(4;14) negative myeloma. Clearly however, additional studies are required to elucidate
the mechanisms of MIP-1α regulation in t(4;14) negative myeloma patients.
For personal use only. by guest on June 5, 2013. bloodjournal.hematologylibrary.orgFrom

19
For personal use only. by guest on June 5, 2013. bloodjournal.hematologylibrary.orgFrom
20
Discussion
MIP-1α is a low molecular weight monokine with inflammatory and
chemokinetic properties and has been characterized to be a potent osteoclast stimulatory
factor in MM28,29. It is elevated in bone marrow plasma of patients with active MM and
correlates with the presence of lytic lesions28. More recently, serum MIP-1α was reported
to correlate with survival and bone resorption markers suggesting that MIP-1α
contributes to the pathogenesis of bone disease in MM and possibly in tumor growth as
reflected by its impact on survival25,30. Blocking MIP-1α by neutralizing antibodies or
antisense oligonucleotides resulted in a reduction of bone disease as well as tumor burden
in MM animal models22. Also, MIP-1α is shown to stimulate proliferation, migration
and survival of plasma cells26,31.
In the current study we found that MIP-1α /CCL3 was one of only ten genes
whose expression was consistently and significantly decreased in t(4;14) myeloma cells
when constitutively active FGFR3 was inhibited by small molecule tyrosine kinase
inhibitors or more specifically with FGFR3 siRNA and which was reciprocally induced
by FGF ligand stimulation of the cells as analyzed by gene expression profiles.
Simultaneously, we found MIP-1α/CCL3 expression to be unchanged in cells expressing
wild type FGFR3 and associated constitutive RAS mutation. This led us to speculate that
MIP-1α/CCL3 is regulated by the RAS/MAPK pathway, downstream of FGFR3. We
tested this hypothesis by inhibiting ERK1/2, a downstream target of the RAS/MAPK
pathway and indeed were able to decrease MIP-1α levels. This data demonstrates that
ERK MAPK inhibition is sufficient to reduce MIP-1α levels in MM cells with
constitutive RAS mutations. Furthermore, these results confirm that the RAS/ERK
For personal use only. by guest on June 5, 2013. bloodjournal.hematologylibrary.orgFrom
21
pathway is relevant for FGFR3 mediated signaling and is involved in up regulation of a
number of critical genes that may be involved in disease severity. These findings are
further supported by gene expression profiling results of FGFR3 RNAi knockdown32 and
a comparison of t(4;14) positive versus negative cell lines33 in which activation of the
RAS/MAPK pathway is evident. Interestingly, levels of MIP-1α on gene expression
profiling have also been correlated with poor outcome in diffuse large B-cell lymphoma
suggesting a broader role for this gene in cellular proliferation34.
In our study, DUSP6 was another gene that was down regulated by FGFR3 inhibition and
induced by FGF. The protein encoded by this gene is a member of the dual specificity
protein phosphatase subfamily that inactivate their target kinases by dephosphorylating
both phosphoserine/threonine and phosphotyrosine residues35-37. The DUSP family
negatively regulates members of the mitogen-activated protein (MAP) kinase superfamily
(MAPK/ERK, SAPK/JNK, p38)38, which are associated with cellular proliferation and
differentiation. Further DUSP6 has been shown function as a feedback attenuator of the
FGF pathway in developing zebrafish embryos39. Of interest, another DUSP family
member (DUSP10) has been shown to be more highly expressed in t(4;14) MM versus
t(4;14) negative tumors33, while DUSP22 has been shown to be associated with FGFR3
knockdown; further implicating this family in FGFR3 signaling32.
In summary we have shown a strong association of MIP-1α/CCL3 with FGFR3 signaling
using three selective tyrosine kinase inhibitors and siRNA mediated knockdown of
FGFR3 expression in MM cells with a t(4;14) that express activated FGFR3. In FGFR3
For personal use only. by guest on June 5, 2013. bloodjournal.hematologylibrary.orgFrom
22
positive Ras mutated cells FGFR3 inhibition did not alter MIP-1α thus suggesting that
over-activation of RAS/MAPK indirectly via FGFR3 signaling or directly through
constitutive activation of RAS in MM can contribute to lytic lesions associated with the
pathogenesis of MM through the up-regulation of MIP-1α/CCL3. Furthermore, inhibition
of FGFR3 or the RAS/MAPK pathway in patients with Ras mutations may hold
therapeutic promise in controlling both MM growth and, through MIP-1α, myeloma bone
disease. Importantly these studies link for the first time an initiating oncogenic event –
the t(4;14) to the development of MM bone disease.
For personal use only. by guest on June 5, 2013. bloodjournal.hematologylibrary.orgFrom
23
Table I
Gene/(GeneID) Common Name FGFR3 Inhibition FGFR3 Induction
�
CCL3 (454592) Macrophage Inflammatory Protein–1 alpha Down Up
DUSP6 Dual Specificity phosphatase 6 Down Up
ANXA9 Annexin A9 Up Down
CR2 Complement Receptor 2 Up Down
AL531683 Unknown Up Down
ZNF589 (51385) Zinc Finger protein 589 Up Down
AW274468 Unknown Up Down
FRMD3 (257019) FERM domain containing 3 Up Down
LTB (4050) Lymphotoxin beta Up Down
WDR42A WD repeat domain 42A Up Down
�
For personal use only. by guest on June 5, 2013. bloodjournal.hematologylibrary.orgFrom
24
1. Chesi M, Nardini E, Lim RS, Smith KD, Kuehl WM, Bergsagel PL. The t(4;14) translocation in myeloma dysregulates both FGFR3 and a novel gene, MMSET, resulting in IgH/MMSET hybrid transcripts. Blood. 1998;92:3025-3034. 2. Onwuazor ON, Wen XY, Wang DY, et al. Mutation, SNP, and isoform analysis of fibroblast growth factor receptor 3 (FGFR3) in 150 newly diagnosed multiple myeloma patients. Blood. 2003;102:772-773. 3. Fonseca R, Barlogie B, Bataille R, et al. Genetics and cytogenetics of multiple myeloma: a workshop report. Cancer Res. 2004;64:1546-1558. 4. Wilkie AO. Bad bones, absent smell, selfish testes: the pleiotropic consequences of human FGF receptor mutations. Cytokine Growth Factor Rev. 2005;16:187-203. 5. Naski MC, Wang Q, Xu J, Ornitz DM. Graded activation of fibroblast growth factor receptor 3 by mutations causing achondroplasia and thanatophoric dysplasia. Nat Genet. 1996;13:233-237. 6. Rousseau F, Bonaventure J, Legeai-Mallet L, et al. Mutations in the gene encoding fibroblast growth factor receptor-3 in achondroplasia. Nature. 1994;371:252-254. 7. Shiang R, Thompson LM, Zhu YZ, et al. Mutations in the transmembrane domain of FGFR3 cause the most common genetic form of dwarfism, achondroplasia. Cell. 1994;78:335-342. 8. Li Z, Zhu YX, Plowright EE, et al. The myeloma-associated oncogene fibroblast growth factor receptor 3 is transforming in hematopoietic cells. Blood. 2001;97:2413-2419. 9. Plowright EE, Li Z, Bergsagel PL, et al. Ectopic expression of fibroblast growth factor receptor 3 promotes myeloma cell proliferation and prevents apoptosis. Blood. 2000;95:992-998. 10. Paterson JL, Li Z, Wen XY, et al. Preclinical studies of fibroblast growth factor receptor 3 as a therapeutic target in multiple myeloma. Br J Haematol. 2004;124:595-603. 11. Trudel S, Li ZH, Wei E, et al. CHIR-258, a novel, multitargeted tyrosine kinase inhibitor for the potential treatment of t(4;14) multiple myeloma. Blood. 2005;105:2941-2948. 12. Trudel S, Ely S, Farooqi Y, et al. Inhibition of fibroblast growth factor receptor 3 induces differentiation and apoptosis in t(4;14) myeloma. Blood. 2004;103:3521-3528. 13. Chang H, Stewart AK, Qi XY, Li ZH, Yi QL, Trudel S. Immunohistochemistry accurately predicts FGFR3 aberrant expression and t(4;14) in multiple myeloma. Blood. 2005;106:353-355. 14. Jaksic W, Trudel S, Chang H, et al. Clinical Outcomes in t(4;14) Multiple Myeloma: A Chemotherapy-Sensitive Disease Characterized by Rapid Relapse and Alkylating Agent Resistance. J Clin Oncol. 2005. 15. Chang H, Sloan S, Li D, et al. The t(4;14) is associated with poor prognosis in myeloma patients undergoing autologous stem cell transplant. Br J Haematol. 2004;125:64-68.
For personal use only. by guest on June 5, 2013. bloodjournal.hematologylibrary.orgFrom

25
16. Kang HB, Kim JS, Kwon HJ, et al. Basic fibroblast growth factor activates ERK and induces c-fos in human embryonic stem cell line MizhES1. Stem Cells Dev. 2005;14:395-401. 17. Nowroozi N, Raffioni S, Wang T, Apostol BL, Bradshaw RA, Thompson LM. Sustained ERK1/2 but not STAT1 or 3 activation is required for thanatophoric dysplasia phenotypes in PC12 cells. Hum Mol Genet. 2005;14:1529-1538. 18. Chen J, Lee BH, Williams IR, et al. FGFR3 as a therapeutic target of the small molecule inhibitor PKC412 in hematopoietic malignancies. Oncogene. 2005;24:8259-8267. 19. Choi DY, Toledo-Aral JJ, Lin HY, et al. Fibroblast growth factor receptor 3 induces gene expression primarily through Ras-independent signal transduction pathways. J Biol Chem. 2001;276:5116-5122. 20. Han JH, Choi SJ, Kurihara N, Koide M, Oba Y, Roodman GD. Macrophage inflammatory protein-1alpha is an osteoclastogenic factor in myeloma that is independent of receptor activator of nuclear factor kappaB ligand. Blood. 2001;97:3349-3353. 21. Choi SJ, Cruz JC, Craig F, et al. Macrophage inflammatory protein 1-alpha is a potential osteoclast stimulatory factor in multiple myeloma. Blood. 2000;96:671-675. 22. Choi SJ, Oba Y, Gazitt Y, et al. Antisense inhibition of macrophage inflammatory protein 1-alpha blocks bone destruction in a model of myeloma bone disease. J Clin Invest. 2001;108:1833-1841. 23. Choi SJ, Oba T, Callander NS, Jelinek DF, Roodman GD. AML-1A and AML-1B regulation of MIP-1alpha expression in multiple myeloma. Blood. 2003;101:3778-3783. 24. Hashimoto T, Abe M, Oshima T, et al. Ability of myeloma cells to secrete macrophage inflammatory protein (MIP)-1alpha and MIP-1beta correlates with lytic bone lesions in patients with multiple myeloma. Br J Haematol. 2004;125:38-41. 25. Hata H. Bone lesions and macrophage inflammatory protein-1 alpha (MIP-1a) in human multiple myeloma. Leuk Lymphoma. 2005;46:967-972. 26. Lentzsch S, Gries M, Janz M, Bargou R, Dorken B, Mapara MY. Macrophage inflammatory protein 1-alpha (MIP-1 alpha ) triggers migration and signaling cascades mediating survival and proliferation in multiple myeloma (MM) cells. Blood. 2003;101:3568-3573. 27. Bergsagel PL, Kuehl WM, Zhan F, Sawyer J, Barlogie B, Shaughnessy J, Jr. Cyclin D dysregulation: an early and unifying pathogenic event in multiple myeloma. Blood. 2005;106:296-303. 28. Roodman GD, Choi SJ. MIP-1 alpha and myeloma bone disease. Cancer Treat Res. 2004;118:83-100. 29. Terpos E, Politou M, Szydlo R, Goldman JM, Apperley JF, Rahemtulla A. Serum levels of macrophage inflammatory protein-1 alpha (MIP-1alpha) correlate with the extent of bone disease and survival in patients with multiple myeloma. Br J Haematol. 2003;123:106-109. 30. Lentzsch S, Chatterjee M, Gries M, et al. PI3-K/AKT/FKHR and MAPK signaling cascades are redundantly stimulated by a variety of cytokines and contribute independently to proliferation and survival of multiple myeloma cells. Leukemia. 2004;18:1883-1890.
For personal use only. by guest on June 5, 2013. bloodjournal.hematologylibrary.orgFrom
26
31. Heider U, Hofbauer LC, Zavrski I, Kaiser M, Jakob C, Sezer O. Novel aspects of osteoclast activation and osteoblast inhibition in myeloma bone disease. Biochem Biophys Res Commun. 2005;338:687-693. 32. Zhu L, Somlo G, Zhou B, et al. Fibroblast growth factor receptor 3 inhibition by short hairpin RNAs leads to apoptosis in multiple myeloma. Mol Cancer Ther. 2005;4:787-798. 33. Dring AM, Davies FE, Fenton JA, et al. A global expression-based analysis of the consequences of the t(4;14) translocation in myeloma. Clin Cancer Res. 2004;10:5692-5701. 34. Lossos IS, Czerwinski DK, Alizadeh AA, et al. Prediction of survival in diffuse large-B-cell lymphoma based on the expression of six genes. N Engl J Med. 2004;350:1828-1837. 35. Smith A, Price C, Cullen M, et al. Chromosomal localization of three human dual specificity phosphatase genes (DUSP4, DUSP6, and DUSP7). Genomics. 1997;42:524-527. 36. Furukawa T, Sunamura M, Motoi F, Matsuno S, Horii A. Potential tumor suppressive pathway involving DUSP6/MKP-3 in pancreatic cancer. Am J Pathol. 2003;162:1807-1815. 37. Bhaduri A, Sowdhamini R. A genome-wide survey of human tyrosine phosphatases. Protein Eng. 2003;16:881-888. 38. Hammer M, Mages J, Dietrich H, et al. Control of dual-specificity phosphatase-1 expression in activated macrophages by IL-10. Eur J Immunol. 2005;35:2991-3001. 39. Tsang M, Maegawa S, Kiang A, Habas R, Weinberg E, Dawid IB. A role for MKP3 in axial patterning of the zebrafish embryo. Development. 2004;131:2769-2779.
For personal use only. by guest on June 5, 2013. bloodjournal.hematologylibrary.orgFrom
27
Figure Legends
Figure 1
A. Venn diagram details genes differentially altered in KMS11 myeloma cells at least
two fold following treatment with an FGFR3 selective kinase inhibitor compared to
vehicle control. 845 genes were commonly dysregulated (supplementary data). B. Venn
diagram maps the 2 fold differentially altered genes using FGFR3 knockdown by siRNA
in KMS11 cells or chemical modulation and the 121 genes altered at least 1.5 fold
following FGF ligand stimulation in UTMC2 myeloma cells (containing wild type
FGFR3 and no RAS mutations). Ten genes were found to be differentially altered under
this model under all five experimental conditions. C. The apoptotic effect of PD173074
and CHIR258 on KMS11 cells is not marked at 48 hours – as shown here no increase in
annexin V positive cells is seen with PD173074 even at 72 hours compared with controls
while only early evidence of apoptosis is seen with CHIR258.
Figure 2
a) Western blot of FGFR3 protein expression in KMS11 cells at 48 hours following
FGFR3 specific or scrambled control siRNA oligonucleotide transfection demonstrate
successful knockdown of FGFR3. Nucleofections were done in KMS11 cells using the
AMAXA apparatus and solutions. Transfection efficiencies were quantified using a green
fluorescent protein (GFP) reporter construct provided by the supplier and flow cytometry.
Our optimized nucleofection parameters yielded survival rates >90% based on forward
For personal use only. by guest on June 5, 2013. bloodjournal.hematologylibrary.orgFrom
28
and side scatter parameters. Under these conditions, 70% of the surviving cells showed
transgene expression 48h after nucleofection. b) A heat map of triplicate experiments
demonstrates differences in gene expression following FGFR3 knockdown with
representative examples of the most significant known genes dysregulated highlighted. A
listing of 121 differentially regulated genes is provided as supplementary information.
Figure 3
MIP-1α promoter driven Luciferase was measured in transfected NIH3T3 cells.
Luciferase readings were corrected for transfection efficiency by GFP expression and
protein concentration. Normalized luciferase activity was expressed as (luciferase activity
units/ (% transfection efficiency x protein concentration). Promoter activity is reduced
following treatment with 100 nM PD173074. The experiment is representative of four
independent experiments with similar results, error bars are not applied because of large
variation in luciferase quantification however the range of suppression over four
independent experiments was 33.3- 40.5%.
Figure 4
a) An MTT assay performed at 72 hours following drug exposure shows inhibition of cell
proliferation in CHIR-258 treated cells. H929 cells harboring a t(4;14) and a RAS
mutation are resistant to treatment. The error bars show standard deviation in replicate of
three experiments. The grey bar is the DMSO control and the black bar is cells treated
with CHIR-258.
For personal use only. by guest on June 5, 2013. bloodjournal.hematologylibrary.orgFrom
29
b) Flow cytometry shows down regulation of intracellular MIP-1α in CHIR-258
sensitive KMS11 but not resistant H929 MM cells. Cells were examined at 48 hours after
drug exposure. The dotted line is isotype control, green line vehicle treated cells, pink
line CHIR-258 treated cells. Experiments were repeated twice with similar results.
c) Flow cytometry confirms down regulation of intracellular MIP-1α in PD173074
sensitive KMS11. Cells were examined at 48 hours after drug exposure. The dotted line is
isotype control, green line vehicle treated cells, pink line PD173074 treated cells.
Experiments were repeated twice with similar results.
Figure 5
An ELISA for secreted MIP-1α demonstrated a reduction in secreted MIP-1α from both
CHIR-258 (500 nM) and PD173074 (100 nM) treated KMS11 cells (left panel) but not in
inhibitor resistant H929 cells (right panel).
Figure 6
Treatment of RAS mutated H929 cells demonstrates down regulation of MIP-1α by flow
cytometric assessment following treatment with the ERK pathway inhibitor PD98059 (10
uM) at 48 hrs.. The dashed pink line is the isotype control, solid green line is drug treated
and the solid purple untreated cells stained for MIP-1alpha expression. Experiments
were performed twice with similar results a representative experiment is shown here.
Figure 7
For personal use only. by guest on June 5, 2013. bloodjournal.hematologylibrary.orgFrom
30
A) Gene expression profiling of 231 newly diagnosed MM samples- the newly described
TC classification is employed to group patients27
. The abbreviations 6 (represents
t(6;14)), 11 (represents t(11;14)), 4 (represents t(4;14)), maf (represents t(14;16) or other
maf “spiked” samples), D1 and D2 represent Cyclin D1 and Cyclin D2 expressing
samples. Samples were normalized to a median of 1 for examination of MIP-1α. B)
Ubiquitous expression of MIP-1α is noted except in patients with a t(11;14) or t(6;14)
where is expression is statistically lower. The error bars show standard deviation.
For personal use only. by guest on June 5, 2013. bloodjournal.hematologylibrary.orgFrom