Mining microarray data to identify transcription factors expressed in naïve resting but not...
10
Mining microarray data to identify transcription factors expressed in naı ¨ve resting but not activated T lymphocytes C Argyropoulos 1,2 , GC Nikiforidis 2 , M Theodoropoulou 1 , P Adamopoulos 1 , S Boubali 3 , TN Georgakopoulos 4 , F Paliogianni 3 , AG Papavassiliou 4 and A Mouzaki 1 1 Laboratory of Hematology & Transfusion Medicine, University of Patras, Patras, Greece; 2 Laboratory of Medical Physics, University of Patras, Patras, Greece; 3 Laboratory of Microbiology, University of Patras, Patras, Greece; 4 Laboratory of Biological Chemistry, Medical School, University of Patras, Patras, Greece Transcriptional repressors controlling the expression of cytokine genes have been implicated in a variety of physiological and pathological phenomena. An unknown repressor that binds to the distal NFAT element of the interleukin-2 (IL-2) gene promoter in naive T-helper lymphocytes has been implicated in autoimmune phenomena and has emerged as a potentially important factor controlling the latency of HIV-1. The aim of this paper was the identification of this repressor. We resorted to public microarray databases looking for DNA-binding proteins that are present in naı ¨ve resting T cells but are downregulated when the cells are activated. A Bayesian data mining statistical analysis uncovered 25 candidate factors. Of the 25, NFAT4 and the oncogene ets-2 bind to the common motif AAGGAG found in the HIV-1 LTR and IL-2 probes. Ets-2 binding site contains the three G’s that have been shown to be important for binding of the unknown factor; hence, we considered it the likeliest candidate. Electrophoretic mobility shift assays confirmed cross-reactivity between the unknown repressor and anti-ets-2 antibodies, and cotransfection experiments demonstrated the direct involvement of Ets-2 in silencing the IL-2 promoter. Designing experiments for transcription factor analysis using microarrays and Bayesian statistical methodologies provides a novel way toward elucidation of gene control networks. Genes and Immunity (2004) 5, 16–25. doi:10.1038/sj.gene.6364034 Keywords: IL-2 repressor; microarray; statistical data mining Introduction T-helper (CD4) cells are important for a healthy immune response and their role is central in the pathogenesis of autoimmune diseases. Modification of T-helper cell function by immunosuppressive drugs is important in organ replacement therapy through transplantation. On the other hand, depletion of T-helper lymphocytes during the course of HIV infection leads to immune system failure that manifests itself with opportunistic infections, malignancies and even autoimmune phenom- ena. Thus T-helper effector functions are important in both health and disease and these functions are evident when T cells are activated. The activation of T lymphocytes begins with the engagement of the T-cell receptor (TCR). 1 The naive CD4 T cell requires high-density, 2,3 sustained 4 TCR signaling involving crosslinking of the TCR to initiate any response. Post-receptor events after TCR engage- ment lead to the activation and nuclear translocation of a number of transcription factors (TFs) including nuclear factor of activated Tcells (NFAT); NFATactivity regulates the transactivation of a number of cytokine and other genes, including interleukin-2 (IL-2), 5–7 IL-3, 8 IL-4, 9–11 tumor necrosis factor-a 12,13 and granulocyte-macrophage colony stimulating factor 14,15 through consensus binding sites present in the promoter of the corresponding genes. The response of HIV-1 to host cell activation is strikingly similar to that of the IL-2 gene, which, in the T-cell leukemia Jurkat, is controlled by NFAT through the distal PRRE 7 element of the HIV-1 virus. For this reason, the HIV-1 PRRE (positions 279 to 250), and the adjacent NFAT motif (positions 252 to 216) are often considered as putative response elements to T-cell activation. Attempts to prove functionally the involve- ment of PRRE and NFATsites in HIV-1 activation gave contrasting results, 16,17 indicative of a dual negative and positive role. Transactivation studies of the IL-2 promoter in the Xenopus oocyte system 18 with protein extracts from ex vivo isolated T lymphocytes revealed several novel aspects of IL-2 regulation. The IL-2 promoter is repressed by proteins from resting naı ¨ve CD4 cells. This repressor acts through the distal IL-2 PRRE that is also the NFAT binding site. Following T-cell activation, the repressor disappears and an activator is de novo synthesized. 18–20 These findings prompted the reinvestigation 21 of HIV-1 LTR regulation by functional transactivation assays using proteins from primary T cells (isolated from cord blood Received 14 May 2003; revised 30 September 2003; accepted 01 October 2003 Correspondence: A Mouzaki, Laboratory of Hematology & Transfusion Medicine, Medical School, University of Patras, Patras GR-26110, Greece. E-mail: [email protected] Genes and Immunity (2004) 5, 16–25 & 2004 Nature Publishing Group All rights reserved 1466-4879/04 $25.00 www.nature.com/gene
Transcript of Mining microarray data to identify transcription factors expressed in naïve resting but not...

Mining microarray data to identify transcriptionfactors expressed in naı̈ve resting but not activatedT lymphocytes
C Argyropoulos1,2, GC Nikiforidis2, M Theodoropoulou1, P Adamopoulos1, S Boubali3,TN Georgakopoulos4, F Paliogianni3, AG Papavassiliou4 and A Mouzaki1
1Laboratory of Hematology & Transfusion Medicine, University of Patras, Patras, Greece; 2Laboratory of Medical Physics, University ofPatras, Patras, Greece; 3Laboratory of Microbiology, University of Patras, Patras, Greece; 4Laboratory of Biological Chemistry, MedicalSchool, University of Patras, Patras, Greece
Transcriptional repressors controlling the expression of cytokine genes have been implicated in a variety of physiological andpathological phenomena. An unknown repressor that binds to the distal NFAT element of the interleukin-2 (IL-2) gene promoterin naive T-helper lymphocytes has been implicated in autoimmune phenomena and has emerged as a potentially importantfactor controlling the latency of HIV-1. The aim of this paper was the identification of this repressor. We resorted to publicmicroarray databases looking for DNA-binding proteins that are present in naı̈ve resting T cells but are downregulated when thecells are activated. A Bayesian data mining statistical analysis uncovered 25 candidate factors. Of the 25, NFAT4 and theoncogene ets-2 bind to the common motif AAGGAG found in the HIV-1 LTR and IL-2 probes. Ets-2 binding site contains thethree G’s that have been shown to be important for binding of the unknown factor; hence, we considered it the likeliestcandidate. Electrophoretic mobility shift assays confirmed cross-reactivity between the unknown repressor and anti-ets-2antibodies, and cotransfection experiments demonstrated the direct involvement of Ets-2 in silencing the IL-2 promoter.Designing experiments for transcription factor analysis using microarrays and Bayesian statistical methodologies provides anovel way toward elucidation of gene control networks.Genes and Immunity (2004) 5, 16–25. doi:10.1038/sj.gene.6364034
Keywords: IL-2 repressor; microarray; statistical data mining
Introduction
T-helper (CD4) cells are important for a healthy immuneresponse and their role is central in the pathogenesis ofautoimmune diseases. Modification of T-helper cellfunction by immunosuppressive drugs is important inorgan replacement therapy through transplantation. Onthe other hand, depletion of T-helper lymphocytesduring the course of HIV infection leads to immunesystem failure that manifests itself with opportunisticinfections, malignancies and even autoimmune phenom-ena. Thus T-helper effector functions are important inboth health and disease and these functions are evidentwhen T cells are activated.
The activation of T lymphocytes begins with theengagement of the T-cell receptor (TCR).1 The naiveCD4 T cell requires high-density,2,3 sustained4 TCRsignaling involving crosslinking of the TCR to initiateany response. Post-receptor events after TCR engage-ment lead to the activation and nuclear translocation of anumber of transcription factors (TFs) including nuclear
factor of activated T cells (NFAT); NFAT activity regulatesthe transactivation of a number of cytokine and othergenes, including interleukin-2 (IL-2),5–7 IL-3,8 IL-4,9–11
tumor necrosis factor-a12,13 and granulocyte-macrophagecolony stimulating factor14,15 through consensus bindingsites present in the promoter of the corresponding genes.
The response of HIV-1 to host cell activation isstrikingly similar to that of the IL-2 gene, which, in theT-cell leukemia Jurkat, is controlled by NFAT through thedistal PRRE7 element of the HIV-1 virus. For this reason,the HIV-1 PRRE (positions �279 to �250), and theadjacent NFAT motif (positions �252 to �216) are oftenconsidered as putative response elements to T-cellactivation. Attempts to prove functionally the involve-ment of PRRE and NFAT sites in HIV-1 activation gavecontrasting results,16,17 indicative of a dual negative andpositive role. Transactivation studies of the IL-2 promoterin the Xenopus oocyte system18 with protein extracts fromex vivo isolated T lymphocytes revealed several novelaspects of IL-2 regulation. The IL-2 promoter is repressedby proteins from resting naı̈ve CD4 cells. This repressoracts through the distal IL-2 PRRE that is also the NFATbinding site. Following T-cell activation, the repressordisappears and an activator is de novo synthesized.18–20
These findings prompted the reinvestigation21 of HIV-1LTR regulation by functional transactivation assays usingproteins from primary T cells (isolated from cord blood
Received 14 May 2003; revised 30 September 2003; accepted 01October 2003
Correspondence: A Mouzaki, Laboratory of Hematology & TransfusionMedicine, Medical School, University of Patras, Patras GR-26110, Greece.E-mail: [email protected]
Genes and Immunity (2004) 5, 16–25& 2004 Nature Publishing Group All rights reserved 1466-4879/04 $25.00
www.nature.com/gene
or peripheral blood) proving that the HIV-1 LTR isregulated in a similar manner to the IL-2 promoter. Sincethe protein binding to the aforementioned repressorsequence exists only in CD4 resting naive T cells of bothhuman and mouse origin, it is probably a key moleculefor the immune system, and one potentially importantfor the pathogenesis of certain autoimmune diseases.
Given these findings, we opted to identify theunknown repressor by resorting to public gene expres-sion databases looking for DNA-binding proteins thatquantitatively behaved similar to the unknown molecule.From an experimental perspective, the problem we aretrying to solve is a well posed one: we are looking forDNA-binding proteins that are present in naı̈ve T cellsbut are downregulated when the cells are activated. Inaddition to this functional requirement, such proteinsshould bind to the PRRE of the IL-2 promoter and theHIV-1 LTR and also to ‘mutant’ probes, in accordancewith previous findings. Hence the available backgroundinformation suggests a two-step experimental design: (1)candidates are identified in gene expression (ie micro-array) databases, (2) antibodies against the correspond-ing proteins are tested in properly controlledelectrophoretic mobility shift assays (EMSA), and (3)the functional role of the protein(s) identified isestablished through cotransfection experiments.
A statistically rigorous treatment of available publicgene expression databases on T lymphocytes wasundertaken to avoid many of the methodological dataanalysis caveats that seem to plague microarray dataanalysis in general. The usual simple k-fold-likeapproach, which dominates the literature, is fraughtwith theoretical and practical problems. At very lowexpression levels, the expression ratio can becomeundefined due to low signal to noise ratio; at the otherend of the range, saturation phenomena are prominent.Hence the k-fold approach misses important differences,while leading to unacceptably high false-positive ratescompared to statistical techniques involving hypothesistesting.22–24 The Bayesian solution (see Appendix at theend of this paper) to this problem is applied for the firsttime in the microarray literature and shown to possessdesirable properties in this application domain. Suchfeatures include but are not limited to: (a) completesummary of available information on the basis of a singlenumerical measure for each gene of interest, the posteriorodds ratio (POR), (b) differential support for hypothesistesting (also known as ‘not all significant findings areequally significant’), and (c) explicit and consistenttreatment of sample size limitations and measurement(ie fluorescent channel) error heteroscedasticity. Thesefeatures enabled us to sort potential candidate genes thatare downregulated upon T-cell activation in descendingorder according to their POR and then give prioritytesting to those with binding sites closest to the commonmotif AGGAAG contained in the HIV-1 LTR and IL-2probes.
The functional involvement of this repressor proteinin autoimmunity is suggested by its absence from thenuclei of resting T cells isolated from autoimmunepatients.25 De-repression of the HIV-1 LTR and theIL-2 gene could provide an additional trigger for viralactivation and at the same time explain the multitudeof autoimmune phenomena observed during diseaseprogression.
Results
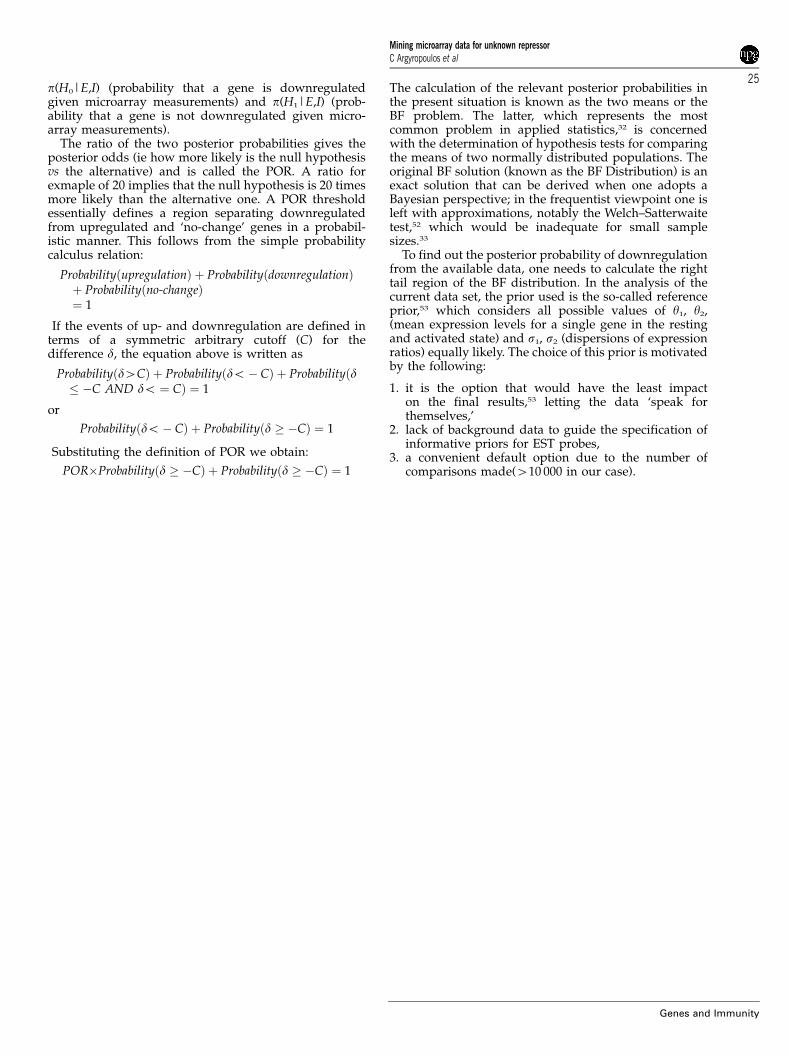
Differential gene expression assessed by BayesianmethodsBayesian analysis of differential gene expression pro-ceeded as detailed in materials and methods. By settingan (arbitrary) cutoff POR (cf Materials and methods)equal to 20 for differential gene expression, we cangraphically portrait the results of the statistical analysisusing a scatterplot (Figure 1). Genes considered to bedownregulated (POR420) are shown in green, whereasgenes considered to be up-regulated are marked with redspots. Note that a great number of genes that would becalled differentially expressed on the basis of a two-foldchange difference in expression (ie those falling belowthe dotted lines in Figure 1), are not considered to be so,when viewed from a statistical perspective. On the otherhand, subtle changes were detected (the majority of‘significant’ calls fall between the dotted lines that markthe two-fold change region). This finding is especiallynoteworthy considering that the gene expression profilewas generated after only 3 h of mitogenic stimulation,before the new steady-state expression profile has beenattained.
Identification of transcription factors downregulatedupon T-cell activationTo identify potential candidates for further EMSAexperiments, we sorted the ‘significant’ calls from theprevious step in order of descending POR. Scanningthrough the list of downregulated genes in order ofdescending POR, we selected those that corresponded toknown TFs. The results are tabulated in Table 1 (identityof TFs with associated POR) and 2 (TF and consensusbinding motifs determined from the TRANSFAC Data-base Public Release 5.0 and PubMed literature searches).We used the POR as a semiquantitative measure of thelikelihood of a TF being the repressor we are looking for.
Figure 1 Graphical representation of the results of Bayesianstatistical analysis on the T-cell activation data set. X-axis, geneexpression in naı̈ve CD4 T cells (CD4þ naı̈ve); Y-axis, geneexpression in CD4 T cells activated with the mitogens PMA andionomycin (CD4þ IþP). Expression levels measured in log scaleafter median normalization. The two dotted lines correspond to atwo-fold repression (lower line) or induction (upper line). Greendots, genes that are 420 times more likely to be downregulatedthan upregulated; red dots, genes that are more likely to beupregulated; black dots, genes that are neither upregulated nordownregulated.
Mining microarray data for unknown repressorC Argyropoulos et al
17
Genes and Immunity

We selected the factors to be used for the experiments onthe basis of (a) high PORs and (b) similarity of theirbinding sites to the common motifs in the IL-2 and HIV-1PRRE.
In Table 1, we summarize the factors found to bedownregulated during T-cell activation, presented indescending POR order. We also tabulated the averagebaseline expression prior to activation, and the corre-sponding fold change in linear and log space. Note thateven small changes are detected irrespective of thebaseline expression level. Table 2 lists available informa-tion apropos the binding site of the identified TFs(downloaded from TRANSFAC PR 5.0 Database). Factorsthat bind to elements with high structural similarity tothe target sequences (HIV-1, IL-2 PRRE) are highlightedin bold (ie NFAT4, ets-2), whereas another three factors(Ikaros, STAT1, interferon-stimulated transcription factor 3)bind to sequences that are less similar to the aforemen-tioned target sequences. The rest of the factors eitherbind to irrelevant or unknown sequences.
Tentative identification of the IL-2 repressor bydepletion EMSA experimentsTo identify the unknown repressor, we designed deple-tion EMSA experiments, based on the findings of theBayesian data analysis and the TRANSFAC databasesearch. We focused on the two factors that had a highlikelihood of being the repressor on the basis offunctional (ie microarrays) and molecular recognition(ie binding site) data. Since the repressor has been shownto be a relatively small protein (ca 50–60 kDa), and theets-2 binding site contains the three G’s that are
important for the binding of the repressor, we chose totest ets-2 first, rather than NFAT4 which has a muchlarger molecular weight. A variety of antibodies againstother TFs were used as controls to assess specificity ofdepletion. The corresponding TFs (c-fos p62, fos-B, fra-1,fra-2 p46, c-jun p 49, jun-B p 39, jun-D p 39, NFkB p65,NFkB p50, c-rel p 75, p53 tumor suppressor proteins)have been shown either not to interact with theoligonucleotide probe or to be absent from unstimulatedT cells. Depletion of all these factors failed to cause asignificant reduction in the intensity of the band in theEMSA experiment (Figure 2). On the other hand, use ofanti-ets-1 and even more so anti-ets-1/2 antibodiesresulted in a decrease of the migrating complex ofrepressor–oligonucleotide, suggesting that the relevantprotein shares extensive structural similarity to theprotein ets-2.
Repression of IL-20-promoter-derived elements byETS-2To further establish the functional role of the ETS-2 genein the function of IL-2-promoter-derived elements, wecotransfected an ets-2 expression vector, with reportergenes driven by elements of the IL-2 promoter; a CMVpromoter construct was used as control (Figure 3a–d).The first experiment (utilizing the �326 to þ 45 region ofthe IL-2 promoter) demonstrated a dose-dependentreduction of a reporter gene (luciferace) when varyingamounts of ETS-2 plasmid were cotransfected. Absolutereduction in luciferace activity, expressed as a percentageof the activity of IL-2/control plasmid (vector alone) co-transfection, ranged from 25 to 45% as the amount of
Table 1 Downregulated TFs upon T-cell activation
Description (from Unigene) D Fold (Log) D Fold Baseline POR
Nuclear factor of activated T cells 4 0.2758 1.32 1.3540 191.9ID2 inhibitor of DNA binding 2 0.3728 1.45 2.1930 85.35MAZ—Myc-associated zinc-finger protein 0.6108 1.84 0.7148 85.08I52969 programmed cell death 2 0.8764 2.40 �0.4210 72.23Myocyte-specific enhancer factor human Mef2 0.6634 1.94 0.8250 70.82Glucocorticoid receptor, alpha splice form 0.4030 1.50 2.2130 61.59Evi zinc-finger protein 0.3018 1.35 1.5430 57.91Interferon-stimulated transcription factor 3 0.5290 1.70 1.4160 48.21Ets-2 0.8222 2.28 1.0290 47.50ZFP161 zinc-finger protein 161 0.4574 1.58 0.9405 47.48MAF 96% similar to mouse MAF2 0.6966 2.01 0.7073 47.15Zinc-finger protein, subfamily 1A, 1 (Ikaros) 0.3630 1.44 2.3090 36.93Far upstream element binding protein 3 0.6177 1.85 0.1068 35.90Host cell factor C1 (HCF) 0.6081 1.84 0.6696 35.50Max-interacting transcriptional repressor Mad4 0.5164 1.68 1.1560 29.00Mad1¼MAD¼MAX-binding protein 0.4276 1.53 1.1340 25.99Signal transducer activator of transcription 1 0.4084 1.50 1.9080 25.86BHLHB2 (Dec-1) 0.4872 1.63 0.9080 25.22Zinc-finger protein ZNF131 with POZ domain 0.4330 1.54 1.1170 23.49Histone acetyltransferase associated with MOZ 0.5693 1.77 0.1876 23.27Bcl-6 zinc-finger protein (ZFP51) 0.6552 1.93 0.5631 21.32Madh1 Mad 0.6431 1.90 0.9082 21.19Egra, TGF-b early inducible protein 0.5897 1.80 1.3210 21.08Cyclin D binding Myb-like transcription factor 1 0.5976 1.82 0.2317 21.05Mybl1. 100% similarity F human A-Myb 0.7820 2.19 �0.3559 21.02
POR, posterior odds ratio. In case of multiple probes interrogating the same factor (eg Id2), the posterior probabilities were averaged and thenconverted to a POR. Baseline, baseline expression in log scale (negative values correspond to genes with expression less than the medianvalue in the data set). D Fold (Log), difference in expression expressed in log scale; D Fold, difference in expression expressed as a before/afterstimulation ratio.
Mining microarray data for unknown repressorC Argyropoulos et al
18
Genes and Immunity

ETS-2 plasmid was increased from 5 to 20 mg per 8� 106
cells transected (cf Figure 3a). Similar reduction percen-tages were acheived when a different construct featuring
the IL-2 PRRE (three copies of the distal NFAT bindingsite containing 50 IL-2 sequences �285 to �255) drivingthe expression of CAT (chloramphenicol acetyl transfer-ase) was utilized. Absolute reduction in CAT activity(measured as % conversion of chloramphenicol to theacetylated forms) ranged from 25 to 89% (cf Figures 3band d). Repetition of the experiments using a differenttarget (the CMV promoter driving the expression ofCAT) failed to show a similar dose-dependent reduction;actually, cotransfection of ETS-2 with CMV-CAT en-hanced the expression of the latter (cf Figure 3c).
Discussion
DNA gene expression microarrays allow biologists tostudy genome-wide patterns of gene expression. Micro-array expression analysis offers an opportunity togenerate functional data on a genome-wide scale andconsequently, should provide much-needed data for thebiological interpretation of genes and their functions.26
A common task is to compare the expression levels ofgenes in samples drawn from two different tissues or attwo different time points or conditions. Specifically, it isof interest to detect genes with differential expressionunder the two conditions. In early days, the simplemethod of fold changes was used, but it is now known tobe unreliable27 because statistical variability was nottaken into account. Since then, many more sophisticatedstatistical methods have been proposed.23,27–29 Criticalissues that the aforementioned attempts try to address,with variable success, include the small sample typical of
Table 2 Binding sites of TFs downregulated upon T-cell activation
Description (from Unigene) Binding site
NFAT4 (¼NFATx¼NFATc3) IL-2 PRREID2 inhibitor Of DNA binding 2 Inhibits other BHLH TFsMAZ—Myc associated zinc-finger protein GGGAGGGI52969 programmed cell death 2 Unknown binding siteMyocyte-specific enhancer factor human Mef2 KCTAWAAATAGMGlucocorticoid receptor, alpha splice form GRE ELEMENTEvi zinc-finger protein ACAAGATAAInterferon-stimulated transcription factor 3 GGGAAACCGAAACEts-2 GGGAAG, GGAGGAAZFP161 zinc-finger protein 161 RNRNRCGCGCWMAF 96% similar to mouse MAF2 CTCATTTTCCCTTGGTTTCAGCAACTTTAACTZinc-finger protein, subfamily 1A, 1 (Ikaros) NNNTGGGAATRCCFar upstream element binding protein 3 TTGTTTTTCATGCCGTGGAATAACACAAAATAAAAAATCCCGAGGGAATATACHost cell factor C1 (HCF) ATGCAAATTranscriptional repressor Mad4 MYC SITE REPRESSORMad1¼MAD¼MAX-binding protein MYC SITE REPRESSORSignal transducer activator of transcription 1 ANTTCCGGGAANTGNSNBHLHB2 (Dec-1) Unknown binding siteZinc-finger protein ZNF131 with POZ domain Unknown binding siteHistone acetyltransferase associated with MOZ TGT/CGGTBcl-6 zinc-finger protein (ZFP51) GAAAATTCCTAGAAAGCATAMadh1 mad MYC SITE REPRESSOREgra, TGF-b early inducible protein Unknown binding siteCyclin D binding Myb-like TF 1 CCCG(G/T)ATGTMybl1. 100% similarity F human A-Myb YAACNGHH
Binding sites were determined from matrix entries in the TRANSFAC database of TFs (Release 5.0 Public) and literature searches for thefactors that did not have any corresponding entries in the database. The common motif found in the HIV-1/IL2 PRRE probes, that is,AAGGAG, is also present in the binding site of the factors in bold. ETS-2 binding site contains the three G’s that had been shown to beimportant for binding of the unknown factor, hence it is the most likely candidate. Factors in italics contain a significant portion of theAAGGAG in their recognition motif and thus are also likely candidates. Binding sites are given in IUPAC code.
Figure 2 Depletion EMSA experiments with antibodies against c-fos p62, fos-B, fra-1, fra-2 p46, c-jun p49, jun-B p39, jun-D p39, NFkBp65, NFkB p50, c-rel p75, ets-1 p54, polyclonal anti-ets1/ets-2 andp53 tumor suppressor proteins. Nuclear extracts from PBMCs(unstimulated) were depleted from the corresponding TFs andsubsequently used in EMSA experiments against the oligonucleo-tide HIV-1 PRRE. The antibodies against factors ETS1 and ETS 1/2seem to deplete the unknown factor, whereas none of the otherantibodies employed led to a significant decrease the bandradioactivity. Since the polyclonal anti-ETS1/2 was more effectivethan the pure anti-ETS1 antibody, we interpret the EMSA findingsas consistent with the hypothesis that the unknown repressor sharesextensive immunoreactivity and should be tentatively identifiedwith the protein ETS-2.
Mining microarray data for unknown repressorC Argyropoulos et al
19
Genes and Immunity

microarray experiments and the very large number ofcomparisons involved. Typically one is forced to manip-ulate the significance level (ie Bonferroni corrections)30
and subsequently validate a fraction of these (reduced)hits by some other method. Although various ad hoc havebeen proposed for the former, no roadmap exists as tohow many and which findings one should indepen-dently validate.31
Bayesian theory uniquely addresses these three issuesby providing a formal quantitative framework to coherentreasoning and decision-making in situations of uncer-tainty. Within this theory, the problem of comparing twosamples has a well-defined solution, and this solutionholds even when the only available information comesfrom extremely small samples.32,33 Evaluating the prob-ability that a given hypothesis is correct produces anumerical measure (POR) that can be used to design anexperiment to corroborate or refute the original hypoth-esis. A question that naturally suggests itself, is howsensitive the results are to the assumptions of the Bayesiananalysis. The assumptions made in the current analysisare that of normality of microarray measurements and thesetting of cutoff for the POR; the prior used (Appendix)does not make any assumptions on the relationshipamong the parameters (ie average expression levels, andtheir dispersions) for the resting and the activated state,which is precisely the reason it is advocated when suchassumptions would be questionable. In the statisticalliterature it is established that a test based on the Behrens–Fisher (BF) distribution is robust with respect to depar-tures from normality.32,34,35 Violations of normality canimpact subsequent analysis by leading to false-positiveresults or false-negative ones; the conservative nature ofthe BF test guards against the former, whereas judicialselection of the POR threshold can help minimize thelatter. In situations involving comparisons between smallsamples, typical of current microarray research, thenormality assumption is a reasonable compromise sinceany other (nonparametric) approach would be of limitedpower to detect differences and other parametric ap-proaches would require larger data sets and extensivenumerical experimentations. Our analysis does notdepend on the absolute value of the POR for the genesexamined; we used the POR only to sort genes andalthough we would expect PORs to be different under anon-normal statistical model, the relative order of the‘true’ POR would probably be not much different fromthe one obtained assuming normality.
Maximizing the expected utility of the experimentalvalidation step involves the combination of the POR
Figure 3 Inhibitory role of ETS-2 on IL-2-promoter-derivedelements driving reporter gene expression. A leukemic T-cell line(Jurkat) was cotransfected with DNA clones containing the ETS-2coding region and IL-2-promoter-derived elements driving theexpression of reporter genes. Subsequently, the cells were activatedand the activity of the reporter gene was measured as a function ofthe quantity of ETS-2 construct utilized. All the experiments wereperformed in triplicates and reported as meanþ s.e.m. activity. (a)Dose-dependent reduction in the activity of luciferase (expressed as% of control vector expression) when varying amounts of ETS-2constructs were cotransfected with IL-2-promoter-driven LU ex-pression. CM: baseline activity of LU in unstimulated Jurkat cells.(b) Dose-dependent reduction in IL-2 PRRE-driven CAT activity(expressed as % conversion of chloramphenicol to the acetylatedforms) by ETS-2. (c) Control cotransfection experiments using theCMV promoter. The inset (d) shows a typical TLC film correspond-ing to (b). Numbers below chromatography lanes correspond to mgof ETS-2 construct per 8� 106 cells.
Mining microarray data for unknown repressorC Argyropoulos et al
20
Genes and Immunity

measure with a similarity score between binding motifsof the candidate TFs. These features enabled us to sortpotential candidates in descending order of significance,cutting down on the number of experiments that had tobe performed prior to putative identification of therepressor protein. The similarity score can be a semi-quantitative assessment as in the present study, or canbe generated by any of the biological sequencescoring algorithms (ie profile HMMs). Note that theproposed methodology to transcriptional repressoridentification is rather general and not limited to thespecific locus examined. Turning to the ‘most significant’findings of Table 1 (ie Id2 and NFAT4), we note thatboth of these factors have been shown to have aninhibitory role in the immune system of knockouttransgenic animal models.36–38 Our results from thedepletion EMSA experiments and the transfection assaysdemonstrate a significant inhibitory potential for theets-2 protein that binds to the distal NFAT elementand represses the expression of IL-2-promoter elements.The fact that silencing could be experimentally demon-strated by transfection experiments carried out inmitogenically stimulated Jurkat cells, that is, a T-cellleukemia, attests to the repressing potential of ets-2 onthe IL-2 promoter.
The TFs of the ets family control the expression and thedifferentiation of a wide variety of genes in hemopoieticcells. It is a rather ancient family of transcriptionalregulators and tens of members from organisms asdiverse as sponges and humans have been isolated.39 Allfactors share a common DNA-binding motif, the etsdomain, which has been shown to be a variation of thewinged helix–turn–helix motif.40 Ets-1 and other mem-bers of the same family make contacts with a 20 bpcontaining a central GGA motif (note that the IL-2 andHIV PRRE do contain such a motif). Ets-like proteins areexpressed during development of the immune system; acomprehensive analysis of the expression of membersof this family revealed striking dynamic patterns in allcells tested.41
The functional involvement of this repressor inauto-immune phenomena is also suggested by EMSAexperiments using nuclear extracts of lymphocytesfrom children with ITP, an autoimmune bleedingdisorder characterized by immunologically mediatedreduction in circulating platelet numbers.25 In theaforementioned publication, a probe featuring theets-2 consensus sequence AAGGAG was used to searchfor migrating complexes similar to the ones demon-strated in the present paper. No such complexes werefound in patients with ITP compared to normal controls.The absence of the repressor during both diseaseactivity and remission, suggests that this abnormalityis primary, rather than an epiphenomenon. Duringlymphocyte maturation, a failure in the acquisition ofthe repressor by some otherwise mature thymocytescould result in an increased number of peripheralnaive T cells, which are more prone to develop intoautoreactive clones upon antigenic stimulation. Furtherstudies should establish the exact involvement ofets-2 or other members of the ets family in the widespectrum of autoimmune phenomena and, besides,investigate the role that all the 25 candidate TFs thatwere revealed from this analysis may play in auto-immune diseases.
Materials and methods
Data sources—the ‘lymphochip’ data setThe most comprehensive gene expression profilingstudies of lymphocytes was generated by Alizadehet al42 during an attempt to characterize molecularprognostic markers for immune-related malignancies(non-Hodgkin’s lymphomas). The data set comprisedmeasurements of 17 853 gene probes constructed fromvarious B-cell and T-cell cDNA libraries, and a variety ofgenes (mainly TFs) that had been shown to be expressedin cells of the immune system. The probe sequences hadbeen deposited in GENBANK and were also available asplasmids – bacterial clones through the IMAGE con-sortium.43 Pertinent to our work, a small part of the dataset had assessed the gene profile changes due to T-cellactivation using a common mRNA source as a referencefor all experiments.
The raw data were downloaded from the StanfordMicroarray Database44 (genome-www.Stanford.edu/mi-croarray) and stored in a relational database created inthe freely available open source database managementserver MySQL (www.mysql.com).
The gene to probe mapping was not known for themajority of the probes at the time the data weregenerated by the original authors. Only 5161 probeshad been unequivocally assigned to a known gene or aUniGene cluster when the data were deposited in theStanford Microarray Database. To deal with this pro-blem, we used the GenBank accession numbers presentin the raw data to update this information. Briefly, a webagent (written in the freely available scripting languagePERL www.perl.com) used the gene accession numbersto query UniGene over the internet. In essence, the webagent automated the task of retrieving web pages fromUniGene (built in November 2001). The description lineof the web page was captured by the agent and storedlocally along with the corresponding accession number.This updated information was then loaded into thedatabase. Eventually, we were able to resolve the probeto gene mapping for 10 521 genes.
Microarray data preprocessingA two-step statistical analysis methodology wasadopted: an initial preprocessing phase, followed by aformal Bayesian comparison of gene expression profilesof CD4 resting naive vs CD4 activated T lymphocytesfrom the ‘Lymphochip’ data set (three hybridizations pergroup). During the initial phase, the local background ofany given spot in the microarray image was estimated byaveraging the values of the background of neighboringspots; if the median spot intensity was greater than the 99percentile of the local background, then that spot wasconsidered well-measured. To ensure that measurementsfrom poor quality probes did not contaminate analysis,we imposed an extra criterion: we censored those probesthat failed to give a reliable signal (any signal greaterthan the local background) in Z80% of all samples in theLymphochip database. Since experimental variation(after statistical filtering, log-transform and globalmedian normalization) from the reference channel wassmall (average CV less than 10%), we did not use awithin-channel normalization scheme; the median ex-pression level of the ‘lymphocyte channel’ was sub-tracted in log space, without any further processing.
Mining microarray data for unknown repressorC Argyropoulos et al
21
Genes and Immunity

Statistical data analysisThe second formal phase analyzed the gene expressionprofiles by adopting a Bayesian perspective. For the twosample case the problem is formally defined as acomparison between a control (resting naive CD4) andtreatment (phorbol 12-myristate 13-acetate (PMA) andionomycin-activated CD4 lymphocytes) group for differ-ences in gene expression after activation. Such compar-ison takes place after we calculate the quantity:45
T ¼ d� ðmc � mtÞffiffiffiffiffiffiffiffiffiffiffiffis2
c
ncþ s2
t
nt
q
with d equal to the difference of the population means,mc�mt the difference in sample means, nt, nc the size ofthe corresponding samples and sc, st the sample standarddeviations. We explicitly tested the directional nullhypothesis that for every gene in the data set, thephysiological change of cell activation resulted in areduction in gene expression. The statistical inferenceproceeds as follows:
Null Hypothesis (H0): The mean expression level of eachgene decreased with cell activation.
Alternative Hypothesis (H1): The mean expression levelof each gene did not decrease with cell activation
Statistical test: The BF distribution with nc¼nt¼2degrees of freedom and gene-specific angle(cf Appendix).
Bayesian hypothesis testing: The POR is given by:
Probability ðdownregulationÞ1 � Probability ðdownregulationÞ
¼
Probabilityd�ðmc�mtÞffiffiffiffiffiffiffiffi
s2c
ncþ
s2t
nt
q o� ðmc�mtÞffiffiffiffiffiffiffiffis2c
ncþ
s2t
nt
q0B@
1CA
1 � Probabilityd�ðmc�mtÞffiffiffiffiffiffiffiffi
s2c
ncþ
s2t
nt
q o� ðmc�mtÞffiffiffiffiffiffiffiffis2c
ncþ
s2t
nt
q0B@
1CA
where Probability (downregulation) is the right tail area forthe BF distribution (Appendix) for a given gene.
Bayesian inference: It is based on the POR for everygene. The POR is a numerical measure, which sum-marizes the support the data lend in favor of the nullhypothesis; the higher the POR measure, the more likelythe corresponding gene to be downregulated than not(Appendix). A POR threshold essentially defines aregion separating downregulated from upregulated and‘no-change’ genes in a probabilistic manner (Appendix).POR calculations involve the evaluation of integrals ofthe BF distribution, and are accomplished using themixed symbolic-numerical computer algebra systemMathematica.46
Post-analytic validationAfter Bayesian data analysis, a list of genes wasgenerated; the ones corresponding to known TFs ormapping to a UniGene cluster containing potentialDNA-binding motifs were extracted for further proces-sing. To further reduce the list, we tried to establishwhether the DNA-binding proteins we had access to areknown to bind to sequences similar to IL-2 PRRE/HIV-PRRE. The TRANSFAC Database Public Release
5.047 was queried over the web and the DNA-bindingmotifs of the proteins were determined. In addition,targeted literature searches were undertaken to deter-mine (1) whether the factors we pinpointed had beenindependently proposed to act as transcriptional repres-sors and (2) the structural basis of their DNA-bindingfunction. The factor that seemed to be the repressor weare seeking on the basis of the extended biologicalinformation was selected for EMSA experiments. Aformal presentation of the quantitative aspects of theselection process is given in Appendix.
CellsCord blood of healthy neonates was collected inheparinized tubes (Maternity Clinic, University Hospitalof Patras and Maternity Clinic of St Andrew Hospital,Patras, Greece). Peripheral blood mononuclear cells(PBMCs) were prepared by centrifugation over aFicoll–Paque gradient (Pharmacia, Upsalla, Sweden).The cells (106 PBMCs/group) were washed 4� withRPMI1640 culture medium (Gibco BRL, Gaithersburg,MD, USA), pelleted and stored as ‘dry’ pellet at �801Ctill further processing. Cells were used without furherpurification since it had been previously established thatthe repressor is contained only in the naı̈ve CD4 subset ofPBMCs and that cord blood contains only naı̈ve CD4cells. For the transfection experiments, the T leukemiaJurkat was used.
Protein extraction from T cellsExtracts were prepared from total cell lysates asdescribed previously.18 Briefly, cells were swollen in ahypotonic buffer, briefly sonicated, and salt was adjustedto 300 mM KCl to extract proteins from chromatin. After20 min on ice, the lysate was spun (100 000 g for 1 h at41C) and the supernatant collected on a buffer containing20 mM HEPES, 0.02 mM EDTA, pH 7.6, 0.5 mM 1,4 dithio-DL-theitol (KIB). Protein concentration was determinedwith the Bradford Assay. Prior to EMSA, the proteinextracts were precipitated in 10% w/v POLYETHELE-NEGLYCOL (PEG8000) with constant stirring for 20 minat 41C. The proteins were then centrifuged at 10 000 g for20 min and the pellet was redisolved in KIB buffer.25
EMSA depletion experimentsProtein A sepharose (Amersham Biosciences, Buckin-ghamshire, UK) was prepared in 1:1 v/v in KIB buffer asinitial step (PAS-KIB). In all, 10ml of PAS-KIB was mixedwith 10 ml of protein extract and incubated at 41C for 1 h.Subsequently, the reaction mix was centrifuged at27 000 g and the supernatant was preincubated with1mg of TF-specific antibody at 41C for 1 h. Antibodiesagainst the following TFs were used: c-fos p62, fos-B, fra-1, fra-2 p46, c-jun p 49, jun-B p 39, jun-D p 39, NFkB p65,NFkB p50, c-rel p 75, ets-1 p54, polyclonal anti-ets1/ets-2, p53 tumor suppressor proteins. All the antibodieswere from Santa Cruz biotechnology Inc (Santa Cruz,CA, USA). The TF-depleted supernatants were usedin EMSA experiments against the HIV-1/IL-2 PRREprobe: AGGCCAATGAAGGAGAGAACAACAGCTTT.The gels were scanned after overnight exposure usingPhosphoImager plates. Corel Photo Paint (www.corel.-com) was used to add labels to the scanned images.
Mining microarray data for unknown repressorC Argyropoulos et al
22
Genes and Immunity

DNA clonesAn ets-2 expression vector, the pcDNA3-ETS2, wasgenerated by inserting a PCR-derived HindIII/BamHIfragment of a human ets-2 cDNA into a HindIII/BamHI-digested pcDNA3 plasmid (a gift from I Talianidis,IMBB, Crete, Greece). The primers for the ets-2 PCRwere 50-CCCAAGCTTGGCAGGATGAATGATTTCGG and50-CGGGATCCTCAGTCCTCCGTGTCG. The target geneswere: (1) a reporter plasmid IL-2-LUC containing thehuman IL-2 promoter (base pairs �326 to þ 45) directingthe transcription of the luciferase gene; (2) a plasmidNFAT-CAT with three copies of the NFAT binding sitecontaining 50 IL-2 sequences �285 to �255 linked toIL-2-promoter sequences from �72 to þ 47 linked to theCAT gene;48 and (3) plasmid CMV-CAT49 was usedas control.
TransfectionsJurkat cells were transfected by electroporation with aGene Pulser (ECM399, BTX, San Diego, CA, USA) at260 V/28 ms. In all, 8� 106 cells/point were mixed with10mg target DNA with or without 5, 10, 20 or 50 mgpcDNA3-ETS2, in 0.35 ml plain RPMI1640 in 0.4-cm-gapcuvettes. Following transfection, the cells were allowedto recover in RPMI1640 medium supplemented with 5%FCS, penicillin and streptomycin for 24 h in an incubator(371C, 5% CO2, humidified atmosphere) and were thenstimulated with the mitogens ionomycin (1 mg/ml) andphorbol myristate acetate (PMA, 25 ng/ml) and wereincubated for a further 24 h. Alternatively, 5� 106 Jurkatcells/point were transfected using 70 ml of a liposomalreagent (LipoTAXI, Stratagene, Cedar Creek, TX, USA)premixed with 25mg of target DNA with or without 5, 10,20 or 50 mg pcDNA3-ETS2 in 1 ml RPMI1640, incubatedfor 2 h, allowed to recover for a further 22 h in completeculture medium in an incubator, stimulated as abovewith mitogens and incubated for another 12 h.
Luciferase and CAT assaysLuciferase activity was determined in 30 ml cell lysates asrelative light units using the TD 20/20 Luminometer. Tomonitor and control transfection efficiency, cells werecotransfected with 1mg pRL-TK, which contains theherpes simplex virus thymidine kinase promoter regionupstream of Renilla luciferase. Expression of Renillaluciferase was detected using the Dual-Luciferase re-porter assay system (Promega, Madison, WI, USA). CATassays were performed as described50 using 40ml celllysates.
References
1 Shores EW, Love PE. TCR zeta chain in T cell developmentand selection. Curr Opin Immunol 1997; 9: 380–389.
2 Valitutti S, Muller S, Cella M, Padovan E, Lanzavecchia A.Serial triggering of many T-cell receptors by a few peptide–MHC complexes. Nature 1995; 375: 148–151.
3 Rogers PR, Huston G, Swain SL. High antigen density and IL-2 are required for generation of CD4 effectors secreting Th1rather than Th0 cytokines. J Immunol 1998; 161: 3844–3852.
4 Iezzi G, Karjalainen K, Lanzavecchia A. The duration ofantigenic stimulation determines the fate of naive and effectorT cells. Immunity 1998; 8: 89–95.
5 Rao A. NF-ATp: a transcription factor required for the co-ordinate induction of several cytokine genes. Immunol Today1994; 15: 274–281.
6 Jain J, Loh C, Rao A. Transcriptional regulation of the IL-2gene. Curr Opin Immunol 1995; 7: 333–342.
7 Rao A, Luo C, Hogan PG. Transcription factors of the NFATfamily: regulation and function. Annu Rev Immunol 1997; 15:707–747.
8 Serfling E, Berberich-Siebelt F, Chuvpilo S et al. The role of NF-AT transcription factors in T cell activation and differentiation.Biochim Biophys Acta 2000; 1498: 1–18.
9 Chuvpilo S, Schomberg C, Gerwig R et al. Multiple closely-linked NFAT/octamer and HMG I(Y) binding sites are partof the interleukin-4 promoter. Nucleic Acids Res 1993; 21:5694–5704.
10 Szabo SJ, Gold JS, Murphy TL, Murphy KM. Identification ofcis-acting regulatory elements controlling interleukin-4 geneexpression in T cells: roles for NF-Y and NF-ATc. Mol Cell Biol1993; 13: 4793–4805.
11 Rooney JW, Hoey T, Glimcher LH. Coordinate and cooperativeroles for NF-AT and AP-1 in the regulation of the murine IL-4gene. Immunity 1995; 2: 473–483.
12 Goldfeld AE, McCaffrey PG, Strominger JL, Rao A. Identifica-tion of a novel cyclosporin-sensitive element in the humantumor necrosis factor alpha gene promoter. J Exp Med 1993;178: 1365–1379.
13 McCaffrey PG, Goldfeld AE, Rao A. The role of NFATp incyclosporin A-sensitive tumor necrosis factor-alpha genetranscription. J Biol Chem 1994; 269: 30445–30450.
14 Cockerill PN, Bert AG, Jenkins F et al. Human granulocyte-–macrophage colony-stimulating factor enhancer function isassociated with cooperative interactions between AP-1 andNFATp/c. Mol Cell Biol 1995; 15: 2071–2079.
15 Masuda ES, Tokumitsu H, Tsuboi A et al. The granulocyte–macrophage colony-stimulating factor promoter cis-actingelement CLE0 mediates induction signals in T cells and isrecognized by factors related to AP1 and NFAT. Mol Cell Biol1993; 13: 7399–7407.
16 Sikder SK, Mitra D, Laurence J. Identification of a novel cell-type and context specific enhancer within the negativeregulatory element of the human immunodeficiency virustype 1 long terminal repeat. Arch Virol 1994; 137: 139–147.
17 Luo C, Copeland NG, Jenkins NA et al. Normal function of thetranscription factor NFAT1 in wasted mice. Chromosomelocalization of NFAT1 gene. Gene 1996; 180: 29–36.
18 Mouzaki A, Weil R, Muster L, Rungger D. Silencing and trans-activation of the mouse IL-2 gene in Xenopus oocytes byproteins from resting and mitogen-induced primaryT-lymphocytes. EMBO J 1991; 10: 1399–1406.
19 Mouzaki A, Rungger D, Tucci A, Doucet A, Zubler RH.Occurrence of a silencer of the interleukin-2 gene in naive butnot in memory resting T helper lymphocytes. Eur J Immunol1993; 23: 1469–1474.
20 Mouzaki A, Rungger D. Properties of transcription factorsregulating interleukin-2 gene transcription through the NFATbinding site in untreated or drug-treated naive and memoryT-helper cells. Blood 1994; 84: 2612–2621.
21 Mouzaki A, Doucet A, Mavroidis E, Muster L, Rungger D. Arepression–derepression mechanism regulating the transcrip-tion of human immunodeficiency virus type 1 in primaryT cells. Mol Med 2000; 6: 377–390.
22 Yang YH, Dudoit S, Luu P et al. Normalization for cDNAmicroarray data: a robust composite method addressing singleand multiple slide systematic variation. Nucleic Acids Res 2002;30: e15.
23 Newton MA, Kendziorski CM, Richmond CS, Blattner FR,Tsui KW. On differential variability of expression ratios:improving statistical inference about gene expression changesfrom microarray data. J Comput Biol 2001; 8: 37–52.
24 Baldi P, Long AD. A Bayesian framework for the analysisof microarray expression data: regularized t-test and
Mining microarray data for unknown repressorC Argyropoulos et al
23
Genes and Immunity
statistical inferences of gene changes. Bioinformatics 2001; 17:509–519.
25 Mouzaki A, Theodoropoulou M, Gianakopoulos I et al.Expression patterns of Th1 and Th2 cytokine genes inchildhood idiopathic thrombocytopenic purpura (ITP) atpresentation and their modulation by intravenous immuno-globulin G (IVIg) treatment: their role in prognosis. Blood 2002;100: 1774–1779.
26 Quackenbush J. Computational analysis of microarray data.Nat Rev Genet 2001; 2: 418–427.
27 Chen Y, Dougherty ER, Bittner ML. Ratio-based decisions andthe quantitative analysis of cDNA microarray images. J BiomedOpt 1997; 2: 364–374.
28 Ideker T, Thorsson V, Siegel AF, Hood LE. Testing fordifferentially-expressed genes by maximum-likelihood analy-sis of microarray data. J Comput Biol 2000; 7: 805–817.
29 Tusher VG, Tibshirani R, Chu G. Significance analysis ofmicroarrays applied to the ionizing radiation response. ProcNatl Acad Sci USA 2001; 98: 5116–5121.
30 Perneger TV. What’s wrong with Bonferroni adjustments. BMJ1998; 316: 1236–1238.
31 Greenfield A. Applications of DNA microarrays to thetranscriptional analysis of mammalian genomes. MammGenome 2000; 11: 609–613.
32 Scheffe H. Practical solutions of the Behens–Fisher problems.J Am Stat Assoc 1970; 65: 1501–1508.
33 Ebenhardt K, Guthie W. Should (X1–X2) have larger un-certainty than X1?. OnlinePublications, Statistical EngineeringDivision, National Institutes of Standards and Technology,2001, 10-5-2003.
34 Robinson GK. Properties of the Student’s t and the Behrens–Fisher solution to the two means problem. Ann Stat 1976; 4:963–971.
35 Barnard GA. Comparing the means of independent samples.Appl Stat 1984; 33: 266–271.
36 Oukka M, Ho IC, de la Brousse FC et al. The transcriptionfactor NFAT4 is involved in the generation and survival ofT cells. Immunity 1998; 9: 295–304.
37 Morrow MA, Mayer EW, Perez CA, Adlam M, Siu G.Overexpression of the helix–loop–helix protein Id2 blocksT cell development at multiple stages. Mol Immunol 1999; 36:491–503.
38 Rengarajan J, Tang B, Glimcher LH. NFATc2 and NFATc3regulate T(H)2 differentiation and modulate TCR-responsive-ness of naive T(H)cells. Nat Immunol 2002; 3: 48–54.
39 Degnan BM, Degnan SM, Naganuma T, Morse DE. The etsmultigene family is conserved throughout the Metazoa.Nucleic Acids Res 1993; 21: 3479–3484.
40 Shore P, Whitmarsh AJ, Bhaskaran R et al. Determinants ofDNA-binding specificity of ETS-domain transcription factors.Mol Cell Biol 1996; 16: 3338–3349.
41 Anderson MK, Hernandez-Hoyos G, Diamond RA, Rothen-berg EV. Precise developmental regulation of Ets familytranscription factors during specification and commitment tothe T cell lineage. Development 1999; 126: 3131–3148.
42 Alizadeh AA, Eisen MB, Davis RE et al. Distinct types ofdiffuse large B-cell lymphoma identified by gene expressionprofiling. Nature 2000; 403: 503–511.
43 Lennon G, Auffray C, Polymeropoulos M, Soares MB. TheI.M.A.G.E. Consortium: an integrated molecular analysis ofgenomes and their expression. Genomics 1996; 33: 151–152.
44 Sherlock G, Hernandez-Boussard T, Kasarskis A et al. TheStanford Microarray Database. Nucleic Acids Res. 2001; 29:152–155.
45 Lee PM. Bayesian Statistics: An Introduction. Arnold: London,199, pp 117–138.
46 Maeder R. Programming in Mathematica. Addision Wesley:Reading, MA, 1997.
47 Wingender E, Chen X, Hehl R et al. TRANSFAC: an integratedsystem for gene expression regulation. Nucleic Acids Res 2000;28: 316–319.
48 Clipstone NA, Crabtree GR. Identification of calcineurin as akey signalling enzyme in T-lymphocyte activation. Nature1992; 357: 695–697.
49 Foecking MK, Hofstetter H. Powerful and versatile enhancer–promoter unit for mammalian expression vectors. Gene 1986;45: 101–105.
50 Gorman CM, Moffat LF, Howard BH. Recombinant genomeswhich express chloramphenicol acetyltransferase in mamma-lian cells. Mol Cell Biol 1982; 2: 1044–1051.
51 Loredo T. From Laplace to supernova SN 1987a: Bayesianinference in astrophysics. In: Fougere F (ed). Maximum Entropyand Bayesian Methods. Kluwer Academic Publishers: Dor-drecht, 1990, pp 81–142.
52 Duong Q, Shorrock R. On Behrens–Fisher solutions. Statisti-cian 1996; 45: 57–63.
53 Bernardo JM, Smith AFM. Bayesian Theory. Wiley: New York, 1994.
Appendix
The Bayesian interpretation of probability and theBehrens–Fisher problemTraditionally, probability is identified with the long-runrelative frequency of occurrence of an event, either in asequence of repeated experiments or in an ensemble of‘identical’ systems. This view of probability is known asthe ‘frequentist’ view; it is also called the ‘classical,’‘orthodox’ or ‘sampling theory’ view. It is the basis formany of the textbook statistical procedures currently inuse. Bayesian probability theory (BPT) is founded on amuch more general definition of probability. In BPT,probability is regarded as a real-number-valued measureof the plausibility of a proposition when incompleteknowledge does not allow us to establish its truth orfalsehood with certainty. The measure is taken on a scalewhere 1 represents certainty of the truth of the proposi-tion and 0 represents certainty of its falsehood. In theBayesian framework probability theory is just commonsense reduced to numbers, and probability represents theobserver’s belief that a certain event is true.51
The tool for updating one’s beliefs about the plausi-bility of a hypothesis (H) given available data (E) andbackground information (ie context I) is given by Bayestheorem
pðHjE; IÞ ¼ PðHjIÞPðEjH; IÞPðEjIÞ
The left-hand term, p(H|E, I), is called the posteriorprobability, and it gives the probability of the hypothesisH after considering the effect of evidence E in context I.The P(H|I) term is just the prior probability of H given Ialone, that is, the belief in H before the evidence E isconsidered. The term P(E|H,I) is called the likelihood,and it gives the probability of the evidence assuming thehypothesis H and background information I are true. Thedenominator is independent of H, and can be regardedas a normalizing or scaling constant. The information I isa conjunction of (at least) all of the other statements(background knowledge) relevant to determining P(H|I)and P(E|I). For notational reasons and when the contextis understood, I is dropped from the expressions.
The posterior distribution is the fundamental object ofBayesian analysis and contains the relevant informationneeded to reason further about a hypothesis.
Turning to our example of gene downregulation, wecalculate the two posterior probabilities (which sum toone, since they represent mutually exclusive events):
Mining microarray data for unknown repressorC Argyropoulos et al
24
Genes and Immunity
p(H0|E,I) (probability that a gene is downregulatedgiven microarray measurements) and p(H1|E,I) (prob-ability that a gene is not downregulated given micro-array measurements).
The ratio of the two posterior probabilities gives theposterior odds (ie how more likely is the null hypothesisvs the alternative) and is called the POR. A ratio forexmaple of 20 implies that the null hypothesis is 20 timesmore likely than the alternative one. A POR thresholdessentially defines a region separating downregulatedfrom upregulated and ‘no-change’ genes in a probabil-istic manner. This follows from the simple probabilitycalculus relation:
ProbabilityðupregulationÞ þ ProbabilityðdownregulationÞþ Probabilityðno-changeÞ¼ 1
If the events of up- and downregulation are defined interms of a symmetric arbitrary cutoff (C) for thedifference d, the equation above is written as
Probabilityðd4CÞ þ Probabilityðdo� CÞ þ Probabilityðd �C AND do ¼ CÞ ¼ 1
or
Probabilityðdo� CÞ þ Probabilityðd �CÞ ¼ 1
Substituting the definition of POR we obtain:
POR�Probabilityðd �CÞ þ Probabilityðd �CÞ ¼ 1
The calculation of the relevant posterior probabilities inthe present situation is known as the two means or theBF problem. The latter, which represents the mostcommon problem in applied statistics,32 is concernedwith the determination of hypothesis tests for comparingthe means of two normally distributed populations. Theoriginal BF solution (known as the BF Distribution) is anexact solution that can be derived when one adopts aBayesian perspective; in the frequentist viewpoint one isleft with approximations, notably the Welch–Satterwaitetest,52 which would be inadequate for small samplesizes.33
To find out the posterior probability of downregulationfrom the available data, one needs to calculate the righttail region of the BF distribution. In the analysis of thecurrent data set, the prior used is the so-called referenceprior,53 which considers all possible values of y1, y2,(mean expression levels for a single gene in the restingand activated state) and s1, s2 (dispersions of expressionratios) equally likely. The choice of this prior is motivatedby the following:
1. it is the option that would have the least impacton the final results,53 letting the data ‘speak forthemselves,’
2. lack of background data to guide the specification ofinformative priors for EST probes,
3. a convenient default option due to the number ofcomparisons made(410 000 in our case).
Mining microarray data for unknown repressorC Argyropoulos et al
25
Genes and Immunity