
Large Margin Linear Discriminative Visualization by Matrix Relevance Learning
Upload
independentCategory
view
3download
0
Mining Low-Support Discriminative Patterns from Dense and High-Dimensional Data
Technical Report
Department of Computer Science
and Engineering
University of Minnesota
4-192 EECS Building
200 Union Street SE
Minneapolis, MN 55455-0159 USA
TR 09-011
Mining Low-Support Discriminative Patterns from Dense and
High-Dimensional Data
Gang Fang, Gaurav Pandey, Wen Wang, Manish Gupta,
Michael Steinbach, and Vipin Kumar
April 02, 2009


1
Mining Low-Support Discriminative Patterns
from Dense and High-dimensional Data
Gang Fang, Gaurav Pandey, Wen Wang, Manish Gupta, Michael
Steinbach,Member, IEEE,Vipin Kumar, Fellow, IEEE
Gang Fang, Wen Wang, Michael Steinbach and Vipin Kumar are with the Department of Computer
Science and Engineering, University of Minnesota, 200 Union Steet SE,Minneapolis, MN 55455. E-mail:
{gangfang, wwang, steinbac, kumar}@cs.umn.edu; Gaurav Pandey is with the Department of Plant and Microbial
Biology, University of California, Berkeley. E-mail:[email protected]; Manish Gupta is with Oracle India
Private Ltd. E-mail:[email protected]
August 19, 2010 DRAFT

2
Abstract
Discriminative patterns can provide valuable insights into datasets with class labels, that may not
be available from the individual features or the predictivemodels built using them. Most existing
approaches work efficiently for sparse or low-dimensional datasets. However, for dense and high-
dimensional datasets, they have to use high thresholds to produce the complete results within limited
time, and thus, may miss interesting low-support patterns.In this paper, we address the necessity of
trading off the completeness of discriminative pattern discovery with the efficient discovery of low-
support discriminative patterns from such datasets. We propose a family of anti-monotonic measures
namedSupMaxK that organize the set of discriminative patterns into nested layers of subsets, which are
progressively more complete in their coverage, but requireincreasingly more computation. In particular,
the member ofSupMaxK with K = 2, namedSupMaxPair , is suitable for dense and high-dimensional
datasets. Experiments on both synthetic datasets and a cancer gene expression dataset demonstrate
that there are low-support patterns that can be discovered using SupMaxPair but not by existing
approaches. Furthermore, we show that the low-support discriminative patterns that are only discovered
usingSupMaxPair from the cancer gene expression dataset are statistically significant and biologically
relevant. This illustrates the complementarity ofSupMaxPair to existing approaches for discriminative
pattern discovery. The codes and dataset for this paper are available at http://vk.cs.umn.edu/SMP/.
Index Terms
Association analysis, Discriminative pattern mining, Biomarker discovery, Permutation test
I. I NTRODUCTION
For data sets with class labels, association patterns [2], [43] that occur with disproportionate
frequency in some classes versus others can be of considerable value in many applications. Such
applications include census data analysis that aims at identifying differences among demographic
groups [14], [5] and biomarker discovery, which searches for groups of genes or related entities,
that are associated with diseases [8], [39], [1]. We will refer to these patterns as discriminative
patterns1 in this paper, although they have also been investigated under other names [35], such
as emerging patterns [14] and contrast sets [5]. In this paper, we focus on 2-class problems,
which can be generalized to multi-class problems as described in [5].
Discriminative patterns have been shown to be useful for improving the classification per-
formance for data sets where combinations of features have better discriminative power than
1The terms ”pattern” and ”itemset” are used interchangeably in this paper.
August 19, 2010 DRAFT
3
the individual features [9], [13], [47], [10], [15], [30]. More importantly, as discussed in [5],
discriminative pattern mining can provide insights beyondclassification models. For example,
for biomarker discovery from case-control data (e.g. disease vs. normal samples), it is important
to identify groups of biological entities, such as genes andsingle-nucleotide polymorphisms
(SNPs), that are collectively associated with a certain disease or other phenotypes [1], [50],
[38]. Algorithms that can discover a comprehensive set of discriminative patterns are especially
useful for domains like biomarker discovery, and such algorithms are the focus of this paper.
The algorithms for finding discriminative patterns usuallyemploy a measure for the discrim-
inative power of a pattern. Such measures are generally defined as a function of the pattern’s
relative support2 in the two classes, and can be defined either simply as the ratio [14] or difference
[5] of the two supports, or other variations, such as its information gain [9], Gini index, odds
ratio [43] etc. In this paper, we use the measure that is defined as the difference of the supports
of an itemset in the two classes (originally proposed in [5] and used by its extensions [24], [25]).
We will refer to this measure asDiffSup (formally discussed in Section II). Given a dataset with
0-1 class labels and aDiffSup thresholdr, the patterns withDiffSup ≥ r can be considered as
valid discriminative patterns.
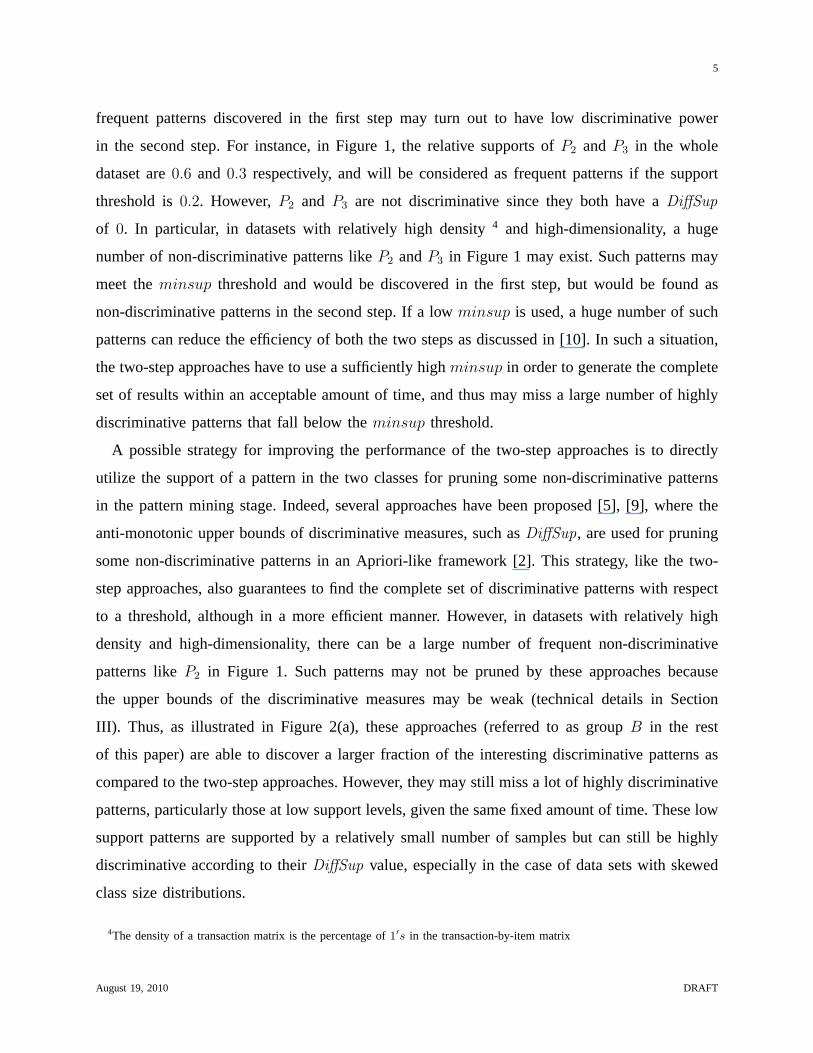
To introduce some key ideas about discriminative patterns and make the following discussion
easier to follow, consider Figure 1, which displays a sampledataset3 containing 15 items
(columns) and two classes, each with 10 instances (rows). Inthe figure, four patterns (sets
of binary variables) can be observed:P1 = {i1, i2, i3}, P2 = {i5, i6, i7}, P3 = {i9, i10} and
P4 = {i12, i13, i14}. P1 and P4 are interesting discriminative patterns that occur with different
frequencies in the two classes, whoseDiffSup is 0.6 and0.7 respectively. In contrast,P2 andP3
are uninteresting patterns with a relatively uniform occurrence across the classes, both having a
DiffSup of 0. Furthermore,P4 is a discriminative pattern whose individual items are alsohighly
discriminative, while those ofP1 are not. Based on support in the whole dataset,P2 is a frequent
non-discriminative pattern, whileP3 is a relatively infrequent non-discriminative pattern.
2Note that, in this paper, unless specified, the support of a pattern in a classis relative to the number of transactions (instances)
in that class, i.e. a ratio between 0 and 1, which can help handle the case ofskewed class distributions.
3The discussion in this paper assumes that the data is binary.Nominal categorical data can be converted to binary
data without loss of information, while ordinal categorical data and continuous data can be binarized, although with
some loss of magnitude and order information.
August 19, 2010 DRAFT

4
Fig. 1. A sample data set with interesting discriminative patterns(P1, P4) and uninteresting patterns (P2, P3)
Note that the discriminative measures discussed above are generally not anti-monotonic as
shown by [14], [5], [9]. TakeDiffSup for instance (while other measures like support ratio,
information gain and odds ratio are not anti-monotonic either): although theDiffSup of the
three items inP1 are0, 0 and0.2 respectively,P1 has aDiffSup of 0.6 as an itemset. Due to the
lack of anti-monotonicity, these measures can not be directly used in an Apriori framework [2]
for exhaustive and efficient pattern mining as can be done formeasures like support[2], h-
confidence [53] etc. To address this issue, many approaches [29], [28], [55], [11], [9] adopt a
two-step strategy (denoted as Group A), where first, a frequent pattern mining algorithm is used
to find all (closed) frequent patterns that satisfy a certainsupport thresholdminsup either from
the whole dataset or from only one of the classes. The patterns found can be further refined
using other interestingness measures (e.g. [7], [23], [44]). Then, as post-processing,DiffSup is
computed for each of these patterns, based on which discriminative patterns are selected. Note
that, in general, these two-step approaches can work even with a very lowminsup threshold
[49], [9] on relatively sparse or low-dimensional datasets.
However, since these approaches ignore class label information in the mining process, many
August 19, 2010 DRAFT
5
frequent patterns discovered in the first step may turn out tohave low discriminative power
in the second step. For instance, in Figure 1, the relative supports ofP2 and P3 in the whole
dataset are0.6 and 0.3 respectively, and will be considered as frequent patterns if the support
threshold is0.2. However,P2 and P3 are not discriminative since they both have aDiffSup
of 0. In particular, in datasets with relatively high density4 and high-dimensionality, a huge
number of non-discriminative patterns likeP2 andP3 in Figure 1 may exist. Such patterns may
meet theminsup threshold and would be discovered in the first step, but wouldbe found as
non-discriminative patterns in the second step. If a lowminsup is used, a huge number of such
patterns can reduce the efficiency of both the two steps as discussed in [10]. In such a situation,
the two-step approaches have to use a sufficiently highminsup in order to generate the complete
set of results within an acceptable amount of time, and thus may miss a large number of highly
discriminative patterns that fall below theminsup threshold.
A possible strategy for improving the performance of the two-step approaches is to directly
utilize the support of a pattern in the two classes for pruning some non-discriminative patterns
in the pattern mining stage. Indeed, several approaches have been proposed [5], [9], where the
anti-monotonic upper bounds of discriminative measures, such asDiffSup, are used for pruning
some non-discriminative patterns in an Apriori-like framework [2]. This strategy, like the two-
step approaches, also guarantees to find the complete set of discriminative patterns with respect
to a threshold, although in a more efficient manner. However,in datasets with relatively high
density and high-dimensionality, there can be a large number of frequent non-discriminative
patterns likeP2 in Figure 1. Such patterns may not be pruned by these approaches because
the upper bounds of the discriminative measures may be weak (technical details in Section
III). Thus, as illustrated in Figure 2(a), these approaches(referred to as groupB in the rest
of this paper) are able to discover a larger fraction of the interesting discriminative patterns as
compared to the two-step approaches. However, they may still miss a lot of highly discriminative
patterns, particularly those at low support levels, given the same fixed amount of time. These low
support patterns are supported by a relatively small numberof samples but can still be highly
discriminative according to theirDiffSup value, especially in the case of data sets with skewed
class size distributions.
4The density of a transaction matrix is the percentage of1′s in the transaction-by-item matrix
August 19, 2010 DRAFT

6
Yet another strategy for discovering a significant subset ofthe discriminative patterns is to
directly use a measure of discriminative power for pruning non-discriminative patterns [56]. As
an instance of such an approach,DiffSup can be computed for each candidate patternα, and
if DiffSup(α) < r, thenα and all its supersets can be pruned in an Apriori-like algorithm [2].
This strategy is computationally more efficient than the two-step approaches, because no patterns
with DiffSup(α) < r are generated during the mining process. However, this improved efficiency
comes at the cost of not discovering the complete set of discriminative patterns, sinceDiffSup
is not anti-monotonic [5]. More specifically, the algorithms in this group (referred to as group
C in the rest of this paper), may miss interesting discriminative patterns whose individual items
are not discriminative (e.g.P1 in Fig. 1). With respect to the coverage of the set of interesting
discriminative patterns, the approaches in this group may be able to discover low-support patterns
at the expense of missing a large number of interesting patterns, as illustrated by the stars not
included in box C in Figure 2(a). This observation is also reflected in our experimental results
(section VI-B.2).
As can be seen from the discussion above, which is summarizedin Figure 2(a), the current
approaches face an inherent trade-off when discovering discriminative patterns from a dense and
high-dimensional data set. The approaches in groupsA andB face challenges with discovering
low-support patterns due to their focus on the complete discovery of discriminative patterns
satisfying the corresponding thresholds. On the other hand, the approaches in groupC sacrifice
completeness for the ability of discovering low-support discriminative patterns. This trade-off is
expected to be faced by any algorithm for this complex problem, particularly due to the restriction
of fixed computational time. In such a scenario, an appropriate approach to discover some of
the interesting discriminative patterns missed by the current approaches, is to formulate new
measures for discriminative power and corresponding algorithms that can progressively explore
lower support thresholds for discovering patterns, while trading off completeness to some extent.
Such a design is illustrated in Figure 2(b), where boxesX, Y andZ represent three approaches,
which can discover patterns with progressively lower thresholds (tx > ty > tz). However, the
cost associated with this ability is that of potentially missing some patterns that are at higher
support levels. Still,X, Y andZ can all discover several patterns that are exclusive to onlyone
of them, and can thus play a complementary role to the existing approaches by expanding the
coverage of the set of interesting discriminative patterns.
August 19, 2010 DRAFT

7
(a) The limitation of existing approaches (b) The motivation of the proposed work
Fig. 2. An illustration of the coverage of the space of discriminative patterns by different approaches given the
same amount of time. Thet’s on the y-axis represent the lowest support of the patternsthat are respectively covered
by the corresponding approaches (represented by boxes), given the same and fixed amount of time. (a) BoxA, B
andC represent the set of patterns discovered by the corresponding approaches in groupA, B andC respectively.
(b) Illustration of the tradeoff between the capability to search low-support discriminative patterns in dense and
high-dimensional data and the completeness of the pattern discovery. BoxesX, Y andZ represent three conceptual
low-support discriminative pattern mining approaches that discover patterns not found by the approaches in groups
A, B and C. Note that, in this figure, the set of interesting discriminative patterns is the same as that in (a), but
the corresponding∗’s are not shown for the sake of clarity.
Corresponding to the motivation discussed above, we proposea family of anti-monotonic
measures of discriminative power namedSupMaxK . These measures conceptually organize the
set of discriminative patterns into nested layers of subsets, which are progressively complete
in their coverage, but require increasingly more computation for their discovery. Essentially,
SupMaxK estimates theDiffSup of an itemset by calculating the difference of its support in
one class and the maximal support among all of its size-K subsets in the other class. The
smaller the value ofK, the more effectiveSupMaxK is for finding low-support discriminative
patterns by effectively pruning frequent non-discriminative patterns. Notably, due to the anti-
monotonicity property of all the members ofSupMaxK , each of them can be used in an Apriori-
like framework [2] to guarantee the discovery of all the discriminative patterns withSupMaxK
≥ r, wherer is a user-specified threshold. Given the same (limited) amount of time, the members
of this family provide a tradeoff between the ability to search for low-support discriminative
patterns and the coverage of the space of valid discriminative patterns for the corresponding
August 19, 2010 DRAFT
8
threshold, as illustrated by the three conceptual approaches X, Y and Z in Figure 2(b). In
particular, we find that a special member withK = 2 namedSupMaxPair , is suitable for
dense and high-dimensional data. We have designed a framework, named SMP, which uses
SupMaxPair for discovering discriminative patterns. Carefully designed experiments with both
synthetic datasets and a cancer gene expression dataset areused to demonstrate that SMP can
serve a complementary role to the existing approaches by discovering low-support yet highly
discriminative patterns from dense and high-dimensional data, when the latter fail to discover
them within an acceptable amount of time.
A. Contributions of this paper
The contributions of this paper can be summarized as follows:
1) We address the necessity of trading off the completeness of discriminative pattern discovery
with the ability to discover low-support discriminative patterns from dense and high-
dimensional data within an acceptable amount of time. For this, We propose a family
of anti-monotonic measures namedSupMaxK that conceptually organize the set of dis-
criminative patterns into nested layers of subsets, which are progressively more complete
in their coverage, but require increasingly more computation for their discovery.
2) In particular,SupMaxK with K = 2, namedSupMaxPair , is a special member of this
family that is suitable for dense and high-dimensional data, and can serve a complementary
role to the existing approaches by helping to discover low-support discriminative patterns,
when the latter fail to discover them within an acceptable amount of time. We designed a
framework, named SMP, which usesSupMaxPair for discovering discriminative patterns.
3) A variety of experiments with both synthetic datasets anda cancer gene expression dataset
are presented to demonstrate that there are many patterns with relatively low support
that can be discovered by SMP but not by the existing approaches. In particular, these
experiments rigorously demonstrate that the low-support discriminative patterns discovered
only by SMP from the cancer gene expression dataset are statistically significant (via
permutation test [18], [42]) and biologically relevant (via comparison with a list of cancer-
related genes [21] and a collection of biological gene sets [42] (e.g. pathways)). These are
the recognized methods for evaluating the utility of such patterns for applications such as
biomarker discovery [42], [8], [22].
August 19, 2010 DRAFT

9
The source codes and dataset used in this paper are availableat http://vk.cs.umn.edu/SMP/.
II. BASIC TERMINOLOGY AND PROBLEM DEFINITION
Let D be a dataset with a set ofm items, I = {i1, i2, ..., im}, two class labelsS1 and S2,
and a set ofn labeled instances (itemsets),D = {(xi, yi)}n
i=1, wherexi ⊆ I is a set of items
and yi ∈ {S1, S2} is the class label forxi. The two sets of instances that respectively belong
to the classS1 and S2 are denoted byD1 and D2, and we have|D| = |D1| + |D2|. For an
itemsetα = {α1, α2, ..., αl} whereα ⊆ I, the set of instances inD1 and D2 that containα
are respectively denoted byD1α and D2
α. The relative supports ofα in classesS1 and S2 are
RelSup1(α) = |D1α|
|D1|and RelSup2(α) = |D2
α||D2|
, respectively.RelSup is anti-monotonic since the
denominator is fixed and the numerator is support of the itemset, which is anti-monotonic.
The absolute difference of the relative supports ofα in D1 andD2 is defined originally in [5]
and denoted in this paper asDiffSup:
DiffSup(α) = |RelSup1(α) − RelSup2(α)|. (1)
An itemsetα is r − discriminative if DiffSup(α) ≥ r. The problem addressed by discrimi-
native pattern mining algorithms is to discover all patterns in a dataset withDiffSup≥ r.
Without loss of generality, we only consider discriminative patterns for the binary-class prob-
lem. Our work can be extended to multiple classes as described in [5].
III. C OMPUTATIONAL L IMITATIONS OF CURRENT APPROACHES
As discussed in Section I, in dense and high-dimensional data, the approaches in groupsA
andB have to use a relatively high threshold in order to provide the complete result within an
acceptable amount of time. In this section, we will show thatthis limitation is essentially due to
the ineffective pruning of frequent non-discriminative patterns (e.g.P2 in Figure 1). Generally,
the approaches in groupB is relatively more efficient than those in groupA, as discussed in
Section I. We use the measure originally proposed in CSET [5] as a representative of groupB
for this discussion, while a similar discussion also holds for other approaches in groupB [9],
[34]. In CSET, an upper bound ofDiffSup is defined as the bigger of the relative supports of a
patternα in D1 andD2. In this paper, we denote it asBiggerSup:
August 19, 2010 DRAFT
10
BiggerSup(α) = max(RelSup1(α),RelSup2(α)). (2)
Lemma 1. BiggerSup is anti-monotonic
Proof. Follows from the anti-monotonicity ofRelSup and the property of themax function.
SinceBiggerSup is an upper bound ofDiffSup [5], and it is also anti-monotonic (Lemma 1),
CSET [5] usesBiggerSup as a pruning measure in a Apriori-like framework, and can discover,
given sufficient time and computing resources, the completeset of discriminative patterns (w.r.t
a BiggerSup threshold). However, by using the bigger one to estimate thedifference of the
two supports,BiggerSup is a weak upper bound ofDiffSup. For instance, if we want to use
CSET to search for0.4 − discriminative patterns in Figure 1,P3 can be pruned, because it
has aBiggerSup of 0.3. However,P2 can not be pruned (BiggerSup(P2) = 0.6), even though
it is not discriminative (DiffSup(P2) = 0). More generally,BiggerSup-based pruning can only
prune infrequent non-discriminative patterns with relatively low support, but not frequent non-
discriminative patterns. Therefore, in dense and high-dimensional data, where a large number of
frequent non-discriminative patterns are expected to exist, CSET with a relatively lowBiggerSup
threshold can often fail to produce the complete results in areasonable amount of time. Thus,
CSET has to set theBiggerSup threshold high and may not discover discriminative patterns
at lower support that may be of interest. Similar discussionon the limited ability of pruning
frequent non-discriminative patterns also holds for otherapproaches in groupsA andB, i.e., all
the two-step approaches, and those based on the informationgain upper bound [9], and other
statistical metric-based pruning [5], [34].
IV. PROPOSEDAPPROACH
As shown above, the limitation of existing approaches is essentially the ineffectiveness of
pruning frequent non-discriminative patterns. Conceptually, to prune frequent non-discriminative
patterns, a new measure should be designed such that a pattern’s support in one class can be
effectively limited to a relatively smaller number compared to its support in the other class. In this
section, we start with such a measureSupMax1 in Definition 1, and then extend it to a family of
measuresSupMaxK . Then, we will discuss the relationships betweenDiffSup, BiggerSup and
SupMaxK . Finally, we will focus on a special member of this familySupMaxPair that is suitable
August 19, 2010 DRAFT

11
for high-dimensional data. Note that, for an itemsetα two cases can happen:RelSup1(α) ≥
RelSup2(α) or RelSup1(α) < RelSup2(α). In the following discussion, without loss of generality,
we assumeRelSup1(α) ≥ RelSup2(α) for simplicity.
A. SupMax1: A Simple Measure to Start with
Definition 1. TheSupMax1 of an itemsetα in D1 and D2 is defined as
SupMax1(α) = RelSup1(α) − maxa∈α(RelSup2({a})).
SupMax1 of an itemsetα is computed as the difference between the support ofα in D1,
and the maximal individual support of the items inα in D2. SupMax1 approximatesDiffSup
by using the maximal individual support inD2 to estimateRelSup2(α). Clearly, the maximal
individual support is quite a rough estimator forRelSup2(α), because a pattern can have very
low support in classS2 but the items in it can still have very high individual supports in this
class. However, an alternative way to interpretSupMax1 is that, a pattern with largeSupMax1
has relatively high support in one class and all the items in it have relatively low support in
the other class.P4 is such an example whoseSupMax1 is 0.9 − max(0.3, 0.3, 0.3) = 0.6 as
shown in Figure 1. Thus, given aSupMax1 threshold, say 0.4,SupMax1 discovers a subset of
0.4 − discriminative patterns but not all, e.g. it will miss patterns likeP1 in Figure 1, which
has relatively highDiffSup (0.6) but zeroSupMax1 .
B. SupMaxK
Following the rationale ofSupMax1 , the maximal support of size-k subsets of a pattern in
D2 can be used to estimateRelSup2(α) instead of using maximal individual support in classS2
to estimateRelSup2(α). This can provide a better estimation ofRelSup2(α). In such a manner,
SupMax1 can be generalized into a family of measuresSupMaxK , which is formally defined
in Definition 2. Note that in the following discussion,SupMaxK will be used to refer to this
family as well as one of its general members, for the clarity of presentation.
Definition 2. TheSupMaxK of an itemsetα in D1 and D2 is defined as
SupMaxK(α) = RelSup1(α) − maxβ⊆α(RelSup2(β)), where|β| = K
August 19, 2010 DRAFT

12
So, SupMaxK of an itemsetα is computed as the difference between the support ofα in
D1, and the maximal support among all the size-K subsets ofα in D2. Note that, in this paper,
SupMaxK is defined with respect toDiffSup, while similar concept can also be applied to other
discriminative measures such as the ratio-based measure [14].
C. Properties of theSupMaxK Family
In the following subsections, we discuss three properties of the SupMaxK family.
1) The subset-superset relationship among SupMaxK members: Based on the definition of
SupMaxK , the following two Lemmas show the relationship amongSupMaxK members.
Lemma 2. If we useMaxSup(α,K ) to denote the second component ofSupMaxK (α), i.e.
maxβ⊆α(RelSup(β)) with |β| = K, thenMaxSup(α,K ) is a lower bound ofMaxSup(α,K − 1 )
for integerK ∈ [2, |α|]
Proof. For every size-(K − 1) subset ofα (sayβ, |β| = K − 1), there exists a size-K subset of
α (sayβ′, |β′| = K) such thatβ ⊂ β′, e.g. by adding anyi to β, wherei ∈ α and i /∈ β. Based
on the anti-monotonicity property ofRelSup, it is guaranteed thatRelSup(β′) ≤ RelSup(β).
Then, from the properties of themax function, maxβ′⊆α(RelSup(β′)) ≤ maxβ⊆α(RelSup(β)).
Thus,MaxSup(α,K ) is a lower bound ofMaxSup(α,K − 1 ).
Lemma 3. SupMax (K − 1 ) of an itemsetα is a lower bound of itsSupMaxK , or alternatively
SupMaxK of an itemsetα is an upper bound of itsSupMax (K − 1 ), for integerK ∈ [2, |α|]
Proof. Follows directly from Definition 2, Lemma 2.
From Lemma 3, we know that, given the same thresholdr and sufficient time, the set
of patterns discovered withSupMax (K − 1 ) in an Apriori framework is a subset of the set
of patterns discovered withSupMaxK . This means thatSupMaxK can find more and more
discriminative patterns asK increases from1 (SupMax1 ), to 2 (SupMax2), to 3 (SupMax3) and
so on. The patterns that are discovered bySupMaxK but not bySupMax (K − 1 ) are those with
SupMaxK≥ r, but with SupMax (K − 1 ) < r. Figure 3 shows an extended version of the data
set shown in Figure 1 containing fifteen addition items (i16 − i30) and two patternsP5 andP6,
the rest being identical to Figure 1. In this data set, given the same thresholdr = 0.4, SupMax1
August 19, 2010 DRAFT

13
Fig. 3. An extended version of the data set shown in Figure 1 containing fifteen addition items (i16 − i30) and two
patternsP5 andP6, the rest being identical to Figure 1.
can findP4, but notP1 andP5, both of which haveDiffSup= 0.6, but zeroSupMax1 ; SupMax2
can findP1 in addition toP4; furthermore,SupMax3 can findP5 in addition toP4 andP1. This
illustrates thatSupMax3 can find all the patterns found usingSupMax1 andSupMax2 , but not
vice versa, as discussed above. Furthermore,SupMax10will be able to discover patternP6 in
addition to the patterns found usingSupMax1 , SupMax2 andSupMax3 .
2) The Exactness of theSupMaxK Family: Lemmas 2 and 3 lead to Theorem 1, which shows
the relationship betweenSupMaxK andDiffSup.
Theorem 1. SupMaxK is a lower bound ofDiffSup, for integerK ∈ [1, |α| − 1].
Proof. SinceDiffSup(α) is equivalent toSupMaxK(α) with K = |α| (We assumedRelSup1(α) ≥
RelSup2(α) for simplicity earlier this Section), this theorem followsfrom Lemma 3.
Theorem 1 guarantees that the patterns discovered by anySupMaxK members with threshold
r also haveDiffSup≥ r. Therefore,SupMaxK members with thresholdr discover onlyr −
discriminative patterns.
3) The Increasing Completeness of theSupMaxK Family: The max function together with
the anti-monotonicity ofRelSup yields the following result about the anti-monotonicity ofeach
member ofSupMaxK .
August 19, 2010 DRAFT

14
Theorem 2. Each member ofSupMaxK is anti-monotonic.
Proof. Let α ⊆ I be an itemset, andα′ ⊆ I be a superset ofα, such thatα′ = α ∪ {i},
wherei ∈ I and i /∈ α. Firstly, from the anti-monotonicity ofRelSup, we haveRelSup1(α′) ≤
RelSup1(α). Then, based on the property of themax function, maxβ′⊆α′(RelSup2(β′)) ≥
maxβ⊆α(RelSup2(β)), where|β| = K and |β′| = K. Finally, we have the following:
SupMaxK (α′) = RelSup1(α′) − maxβ′⊆α′(RelSup2(β′))
≤ RelSup1(α) − maxβ⊆α(RelSup2(β))
= SupMaxK (α).
Based on Theorem 2, given a thresholdr, any member of theSupMaxK family can be used
within an Apriori-like framework [2] to discover the complete set of patterns withSupMaxK ≥ r.
Note thatSupMaxK could be alternatively defined using themin function, thus providing a better
estimation ofDiffSup. However, this version ofSupMaxK will not be anti-monotonic and thus
can not be used in the Apriori framework for the systematic search of discriminative patterns.
Since there are a finite number of discriminative patterns ina dataset given aDiffSup threshold,
andSupMaxK finds more and more discriminative patterns asK increases (Lemma 3), the set
of patterns discovered withSupMaxK and thresholdr within an Apriori-like framework is
increasingly more complete with respect to the complete setof r − discriminative patterns.
4) Summary of the three properties of the SupMaxK Family:From the subset-superset re-
lationship amongSupMaxK members, and the exactness and increasing completeness of the
SupMaxK family, SupMaxK members conceptually organize the complete set of discriminative
patterns into nested subsets of patterns that are increasingly more complete in their coverage with
respect tor − discriminative patterns. This yields interesting relationships betweenDiffSup,
BiggerSup and theSupMaxK family, which are discussed below.
D. Relationship between DiffSup, BiggerSup and the SupMaxK Family
To understand relationship amongDiffSup, BiggerSup and SupMaxK , Figure 4 displays
the nested structure of theSupMaxK family together withDiffSup and BiggerSup from the
perspective of the search space of discriminative patternsin a dataset.LAll is the complete set
of r−discriminative patterns given aDiffSup thresholdr. LCSET is the search space explored
August 19, 2010 DRAFT
15
by CSET in order to find all the patterns inLAll. Note thatLCSET is a superset ofLAll, because
BiggerSup is an upper bound ofDiffSup. Note that,LCSET can be much larger thanLAll for
dense and high-dimensional data sets, especially when a relatively low BiggerSup threshold is
used. In such cases, CSET may not be able to generate complete results within an acceptable
amount of time. For instance, on the cancer gene expression data set used in our experiments, the
lowest BiggerSup threshold for which CSET can produce the complete results within 4 hours
is 0.6. With a lower threshold0.4, CSET can not produce the complete results within 24 hours.
Members of theSupMaxK family help address this problem withBiggerSup by stratifying
all ther−discriminative patterns into subsets that are increasingly more complete (SetL1, L2,
. . ., Lk, Lk+1, . . ., LAll), as shown in Lemma 3 and the subsequent discussion, and illustrated in
Figure 4. However, note that these superset-subset relationships amongSupMaxK members and
betweenSupMaxK andBiggerSup (used by CSET) hold only when the same threshold is used
for BiggerSup and all theSupMaxK members, and unlimited computation time is available. In
practice, given the same fixed amount of time, progressivelylower thresholds can be used for
SupMaxK members asK decreases. This tradeoff was illustrated earlier in Figure2(b).
Since the focus of this paper is on dense and high-dimensional data, another practical factor
should be considered, that is, the computational efficiencyof the SupMaxK members. In the
next section, we will introduce a special member of theSupMaxK family that is computationally
suitable for dense and high-dimensional data.
E. SupMaxPair: A Special Member Suitable for High-Dimensional Data
In the previous discussion, we showed that asK increases, the set of patterns discovered
with SupMaxK and thresholdr in an Apriori framework is increasingly more complete with
respect to the complete set ofr − discriminative patterns. Thus, in order to discover as
many r − discriminative patterns as possible, an as large as possible value ofK should be
used given the time limit. However, it is worth noting that the time and space complexity to
compute and store the second component in the definition ofSupMaxK , i.e. MaxSup(α,K ) =
maxβ∈α(RelSup2(β)) with |β| = K are bothO(mK) (The exact times of calculation is(
M
K
)
),
whereM is the number of items in the dataset. In high-dimensional data set (largeM ), K > 2
is usually infeasible. For instance, if there are 10000 items in the data set (M = 10000), even
SupMaxK with K = 3 will require the computation of the support of all(
10000
3
)
≈ 1.6 × 10¹¹
August 19, 2010 DRAFT

16
Fig. 4. Nested layers (L1, L2, L3, . . . , Lk, Lk+1, . . . , LAll, LCSET ) of patterns defined bySupMaxK , and
relationship with the complete set of discriminative patterns (layerLAll), and the search space ofBiggerSup
used by CSET (layerLCSET ). (PDb stands for ”Patterns Discovered by”.)PDbSupMaxK is a subset of
PDbSupMax(K + 1). Note that this figure only shows the subset-superset relationship, while the size of each
rectangle does not the imply number of patterns in each set.
size-3 patterns. Therefore, due to our emphasis on dense andhigh-dimensional data, we will
focus on SupMaxK with K = 2, i.e., SupMaxPair , to balance the accurate estimation of
DiffSup and computational efficiency. Note that, based on the definition of SupMaxPair , the
computational complexity of the second component ofSupMaxPair (maximal pair-wise support
in classS2) for an itemsetα = {α1, α2, ..., αl} with size greater than2 is O(l2). However,
according to the Apriori framework [2],MaxSup(α, 2 ) only depends on three terms that will have
been computed before the computation ofMaxSup(α, 2 ) itself: MaxSup({α1, α2, ..., αl−1} , 2)
and MaxSup({α1, α2, ..., αl−2, αl} , 2), andMaxSup({αl−1, αl} , 2), and thus the computational
complexity forMaxSup(α, 2 ) is O(1) per itemsetα.
As shown in Figure 4,SupMaxPair can perform a complete search of ther−discriminative
patterns in the first two layers, even for a low value ofr. Indeed, we will demonstrate in our
experimental results on a cancer gene expression data set (Section VI) that searching these
August 19, 2010 DRAFT

17
two layers itself can enable SupMaxPair to discover many low-support patterns that may not
be discovered by CSET within an acceptable amount of time. Furthermore, these patterns are
statistically significant and biologically relevant.
Before we discuss these results, we lay out the complete framework that we use for discovering
discriminative patterns from dense and high-dimensional data.
V. FRAMEWORK FORDISCRIMINATIVE PATTERN M INING
In this section, we explain the major steps in the framework used for discriminative pattern
mining in our experiments:
• Step 1: This is an algorithm-specific step. For example, forSupMaxPair , all the item-pair
supports are computed and stored in a matrix, whose(i, j) entry is the item-pair support of item
i and j. The complexity of this step isO(nm2), wheren is the number of transactions, andm
is the number of unique items. No such pre-computation has tobe done for CSET.
• Step 2: The Apriori framework [2] is used in this step for discriminative pattern mining using
the anti-monotonic measuresBiggerSup andSupMaxPair . For SMP, discriminative patterns are
firstly mined from one class and then mined from the other, while CSET discovers patterns once
from the whole dataset.
• Step 3: To facilitate further pattern processing and pattern evaluation, we selected only the
closed itemsets [37] from the complete set of itemsets produced.
For clarity, we refer to the version of this framework whereBiggerSup is used for discovering
patterns asCSET, while the version usingSupMaxPair is referred to asSMP in the subsequent
discussion. Our analysis of the quality of the patterns and the computational time requirements
are presented with respect to the patterns produced by thesecomplete pipelines.
VI. EXPERIMENTAL RESULTS
In order to evaluate the efficacy of different discriminative pattern mining algorithms, par-
ticularly CSET (a representative of the approaches in groupB discussed in Section I) and our
proposed algorithm SMP, we designed two sets of experiments. The first set of experiments utilize
synthetic data sets with varying density and dimensionality to study the properties of CSET and
SMP. The second set of experiments involve the application of CSET and SMP to a breast
cancer gene expression data. The second set aims at a systematic evaluation of the statistical
August 19, 2010 DRAFT

18
significance and biological relevance of the resultant patterns, thus validating the effectiveness
of CSET and SMP for knowledge discovery from real data. All theexperiments presented here
were run on a Linux machine with 8 Intel(R) Xeon(R) CPUs (E5310 @ 1.60GHz) and 16GB
memory.
A. Experiments on Synthetic Data Sets with Varying Density and Dimensionality
In the first set of experiments, we study the performance of SMP and CSET on synthetic binary
data sets whose background can be fully controlled. Specifically, we created two collections of
synthetic datasets respectively with (i) varying density and fixed dimensionality, and (ii) varying
dimensionality and fixed density. We first describe the approach we used to create these two
collections of data sets and then present the performance ofSMP compared to CSET.
1) Methodology for Generating Synthetic Data Sets:Each synthetic data set have two ma-
jor components: discriminative and non-discriminative patterns. Discriminative patterns are the
target of the mining algorithms, while non-discriminativepatterns are obstacles. As discussed
in Section I, an effective discriminative pattern mining algorithm should be able to prune the
non-discriminative patterns at early stage while discovering discriminative patterns.
Ten discriminative patterns each of sizes 2, 4, 6, 8 and 10 were embedded in each synthetic
dataset, resulting in a total of 50 discriminative patternsper dataset. To reflect the distribution
of different types of discriminative patterns in real data,for each of the five sizes, we randomly
determined a number of patterns (out of ten) that can be discovered by CSET but not SMP (type-
I), and the remaining patterns that can be discovered by SMP but not CSET (type-II). Specifically,
type-I patterns are those that haveDiffSup greater than0.2, but SupMaxPair below 0.2. As
discussed in Section IV, SMP can not find type-I patterns due to the fact thatSupMaxPair is
an lower bound ofDiffSup. In contrast, type-II patterns are those that haveBiggerSup below
the lowest threshold (0.2) that CSET can finish within an acceptable amount of time (we use
4 hours as the representative acceptable amount of time). SMP can find these type-II patterns
if it can effectively prune non-discriminative patterns and can search at lower support levels
(0.1). Table I displays the number of type-I and type-II discriminative patterns of different sizes
embedded in each of the synthetic datasets. Note that these numbers are kept the same for all
the synthetic datasets to ensure that results across acrossdifferent datasets are comparable. Note
that in practice, there may be other types of patterns that can be discovered by both CSET and
August 19, 2010 DRAFT

19
size-2 size-4 size-6 size-8 size-10
type-I patterns 3 6 5 8 7
type-II patterns 7 4 5 2 3
Total patterns of each size 10 10 10 10 10
TABLE I
NUMBER OF TYPE-I AND TYPE-II DISCRIMINATIVE PATTERNS OF SIZE-2, 4, 6, 8AND 10.
SMP. In this analysis, we do not embed these other types of patterns and focus only on the
effectiveness of CSET and SMP for discovering different types of discriminative patterns.
For all the synthetic data sets, we fix the number of samples at700, in which half are of class
1 and the other half are of class2. Two collections of datasets were generated as follows.
Varying density with fixed dimensionality: For this collection of data sets, we fix the
dimensionality at4000. After we embed the 50 discriminative patterns, we have the first dataset
of density 10%. Next, we keep adding non-discriminative patterns of size 10 and support greater
than0.2, and create four more data sets with densities of0.13, 0.16, 0.19 and0.22 respectively.
Varying dimensionality with fixed density: For this collection of data sets, we fix the density
of the dataset at0.2. After we embed the 50 discriminative patterns (density 10%), we further
add non-discriminative patterns to make the density equal to 0.2 and use this dataset as the first
dataset (the dimensionality is350). Next, we further add non-discriminative patterns of size-10
and support greater than0.2 and simultaneously increase the dimensionality of the dataset to
maintain the density at0.2. In this way, we create another four data sets with dimensionalities
of 500, 2000, 4000 and6000.
Note that the supporting transactions of both the discriminative and non-discriminative patterns
are selected randomly to avoid their combination into patterns of larger sizes. To simulate
practical situations, for each data set generated in the above process, we add an additional
10% noise by flipping 10% of the 0’s to 1’s and 1’s to 0’s.
2) Performance of SMP and CSET on Synthetic Data Sets:For both the collections of datasets,
we use aBiggerSup threshold of0.2 for CSET and aSupMaxPair threshold of0.1 for SMP.
These thresholds agree with the definitions of type-I and type-II patterns for the following
experiments (Section VI-A.1). The questions we want to answer in these experiments are: Which
level of the itemset lattice can CSET and SMP reach when miningthese synthetic datasets given
the time limit of 4 hours, and correspondingly, how many of the discriminative patterns at each
August 19, 2010 DRAFT

20
level can be discovered by the two algorithms?
Figures 5(a) and 5(b) display the levels that CSET and SMP reach on each of the five synthetic
data sets of varying density and varying dimensionality respectively. Note that the highest level
is 10, which is the size of the largest discriminative and non-discriminative patterns. Several
observations can be made from Figure 5(a). First, when the density is 10%, both CSET and
SMP can reach all the 10 levels. Thus, CSET can discover all the29 type-I patterns (but none
of the type-II patterns) and SMP can discover all the 21 type-II patterns (but none of the type-I
patterns). Second, when the density increases to 13%, CSET only reaches level 3 and thus can
only discover its 3 type-I patterns of size-2. In contrast, SMP can complete all the 10 levels
and discovers all the 21 type-II patterns. Similar observation also holds for densities 0.16 and
0.19. This illustrates that even for reasonably high levelsof density, SMP can discover type-II
patterns with lower-support that can not be discovered by CSET, even though it can miss some
type-I patterns that can be discovered by CSET. Finally, whendensity increases to0.22, both
SMP and CSET only reach level-2, i.e. CSET discovers its3 type-I patterns and SMP discovers
its 7 type-II patterns. This indicates that for relatively very high levels of density, both CSET
and SMP can face challenges in discovering the embedded patterns that they are supposed to
discover (i.e. type I patterns for CSET and type II patterns for SMP). However it should be
noted that this deterioration in the performance of SMP is due to the expense of theO(N2)
time complexity in the generation of level-2 candidates. Indeed, even at this density (0.22), SMP
can again finish all the 10 levels in only an additional0.5 hour (total4.5 hrs). However, CSET
is still unable to generate all the level-3 candidates even in another 4 hours (total more than8
hours). In summary, these results show that SMP is more effective for searching for low-support
discriminative patterns on dense datasets.
Similar observations can also be made from Figure 5(b). First, at the dimensionality350, both
CSET and SMP can complete all the 10 levels and discover all thepatterns they are supposed
to find. Second, at dimensionality 500, 2000 and 4000, CSET canonly reach up to levels 6, 3
and 2 respectively, while SMP still reaches all the 10 levels. Finally, at dimensionality 6000,
both SMP and CSET can only complete level 2. Again, SMP can finish all the 10 levels in
another half an hour, but CSET is still generating level-3 candidates in another 4 hours. These
results show that SMP is more effective for searching for low-support discriminative patterns
from high-dimensional datasets.
August 19, 2010 DRAFT

21
0.1 0.12 0.14 0.16 0.18 0.2 0.220
2
4
6
8
10
Density
Com
puta
tion
Com
plet
ed (
Leve
l)
SMPCSET
(a) Datasets with varying density and fixed dimen-
sionality (4000)
0 1000 2000 3000 4000 5000 60000
2
4
6
8
10
Dimension
Com
puta
tion
Com
plet
ed (
Leve
l)
SMPCSET
(b) Datasets with varying dimensionality and fixed
density (0.2)
Fig. 5. Levels that can be reached by CSET and SMP in the two series of synthetic data sets (varying density and
varying dimensionality).
From the above experimental results on the two collections of synthetic datasets with varying
density and varying dimensionality, we demonstrated the efficacy of SMP for mining low-
support discriminative patterns from dense and high-dimensional data sets. Next, we will use a
real gene expression data set to study the practical utilityof SMP for discovering low-support
discriminative patterns.
B. Experiments on a Breast Cancer Gene Expression Data Set
In the second set of experiments, we used CSET and SMP to discover discriminative patterns
from a breast cancer gene expression data set. Only closed patterns are used in these experiments.
The details of this data set are provided in Section VI-B.1. Wefirst present a global analysis of
these patterns in Section VI-B.2. Subsequently, we perform an extensive statistical and biological
evaluation of these patterns, the results of which are presented in Sections VI-B.3 and VI-B.4.
In particular, we highlight the statistical significance and biological relevance of low-support
patterns discovered by SMP but not CSET, thus illustrating the complementarity that SMP can
provide to the existing approaches discussed in Section I.
1) Dataset description:A breast cancer gene expression data set [45] is used for evaluating
the efficacy of discriminative pattern mining algorithms oncomplex, real data sets. This data set
contains the expression profiles of about25000 genes in295 breast cancer patients, categorized
into two classes corresponding to whether the patient survive the disease (0) or not (1). Using
August 19, 2010 DRAFT
22
pre-processing methodologies suggested by the authors [46], we only considered5981 genes that
showed evidence of significant up- or down-regulation (at least a two-fold change), and whose
expression measurements were accurate (p-value≤ 0.01) for at least five patients. Furthermore,
to make the dataset usable for binary pattern mining algorithms, each column pertaining to the
expression of a single gene is split into two binary columns.Since the data has been properly
normalized to eliminate between-gene variations in the scale of their expression values, we adopt
a simple discretization method, as used in other studies [32], [12]: a 1 is stored in the first column
if the expression of the gene is less than−0.2, while a 1 is stored in the second column if the
expression of the gene is greater than0.2. Values between−0.2 and0.2 are not included, since
genes showing an expression around0 are not expected to be interesting, and may add substantial
noise to the data set. The resulting binary data set has11962 items and295 transactions, with
a density of16.62%.
For this data set, discriminative pattern mining can help uncover groups of genes that are
collectively associated with the progression or suppression of cancer, and our experiments are
designed to evaluate the effectiveness of different algorithms for this task.
2) General analysis of the patterns discovered:We ran CSET and SMP at the lowest pa-
rameter thresholds for which they would finish in about 4 hours5. Only closed patterns are used
in our experiments. Due to the weaker pruning ofBiggerSup and the resulting large number
of discriminative patterns, we were forced to use relatively higher thresholds for CSET and
restrict the computation to patterns of a limited size to obtain the patterns necessary for our
evaluation. Table II shows that the lowestBiggerSup threshold for which CSET can produce
the complete results within 4 hours is 0.6. The lowestBiggerSup threshold for which CSET can
discover size-2 and size-3 patterns within 4 hours is 0.55. At a lower threshold of 0.4, CSET
can only discover size-2 patterns before running out of time. In contrast, SMP is ableto run at
a much lowerSupMaxPair threshold of0.18 and finds patterns of size as high as 7 in about 40
minutes. See Table III for the details of the patterns found by SMP at different thresholds. For
the evaluation of pattern quality, we combine the patterns discovered by CSET at the0.4, 0.55,
and0.6 BiggerSup thresholds as the collection of all patterns that can be discovered by CSET,
5Some time period needed to be chosen for the experiments. Theduration of four hours is, although slightly
arbitrary, is generally reasonable for most data analysis operations.
August 19, 2010 DRAFT

23
BiggerSup Time # Closed Pattern Highest
Threshold (sec) Patterns Size(s) NegLogP
0.4* 617 64942 2 12.09
0.55* 1454 84840 2-3 9.65
0.6 1558 90637 2-10 8.78
TABLE II
DETAILS OF PATTERNS DISCOVERED BYCSETAT VARIOUS BiggerSup THRESHOLDS. (* EXPANSION OF THE SET OF PATTERNS TO
PATTERNS OF LARGER SIZES COULD NOT FINISH IN OVER12 HOURS, AND THUS, THEIR RESULTS ARE NOT INCLUDED HERE.)
SupMaxPair Time # Closed Pattern Highest
Threshold (sec) Patterns Size(s) NegLogP
0.18 2401 45982 2-7 12.09
0.2 1187 21285 2-5 12.09
0.25 332 3007 2-4 12.09
0.3 186 283 2-3 12.09
TABLE III
DETAILS OF PATTERNS DISCOVERED BYSMP AT VARIOUS SupMaxPair THRESHOLDS.
while for SMP, we only use the patterns discovered at the single SupMaxPair threshold0.18.
Indeed, even with this setup that is slightly biased towardsCSET, there are still high quality
low-support patterns that can only be discovered by SMP, thedetails of which are provided later.
In addition to analyzing the characteristics of the patterns discovered by SMP and CSET,
we also examined the value of DiffSup for each individual gene constituting these patterns.
Specifically, Figure 6 displays the distribution of theDiffSup of individual genes in the patterns
discovered only bySMPat a SupMaxPair threshold of0.18, but not by CSET. Among the332
genes covered by these patterns, almost 60% (198) of the genes haveDiffSup lower than the
0.18. Based on the discussion of approaches that directly utilizeDiffSup or other measures of
discriminative power for finding discriminative patterns (group C) in Section I, it can be seen
that these approaches can not discover any of these genes, and thus can not discover the patterns
that include them. Since one of our major foci is on algorithms that can discover patterns whose
individual genes may not be discriminative, we discuss onlythe results of CSET and SMP, which
can find such patterns, in the rest of this section.
3) Statistical Evaluation:There are various ways to evaluate the importance of discriminative
patterns. We are interested in patterns that occur disproportionately between the two classes.
August 19, 2010 DRAFT

24
0 0.1 0.2 0.3 0.40
20
40
60
80
100
DiffSup of Individual Genes in the Patterns
Fre
quen
cyThe geneswith individual DiffSup lower than thethrehold 0.18
Fig. 6. Histogram of theDiffSup of individual genes in the patterns discovered only by SMP, but not by CSET.
.
However, in real world data sets, particularly those with small number of instances in the two
classes, even patterns that occur with similar support across classes will show some deviation
from perfect balance in data sets with relatively small sample size. Thus, to ensure that the
patterns found are not just a result of random fluctuation, a statistical test is commonly used to
ensure that any deviation from equal support is statistically significant. In this section, we will
perform this type of evaluation for the patterns from CSET andSMP.
We use the Fisher exact test [16] for this evaluation, whose result is a p-value (probability). If
the p-value is below some user defined threshold, e.g., 0.05 or 0.01, then the pattern is regarded
as authentic. Note that p-values are often expressed as their negativelog10 value for convenience
(the higher this−log10 value (denoted asNegLogP), the more reliable the discriminative pattern
is expected to be). We will refer to this measure asNegLogP. If there are multiple patterns, the
NegLogP threshold needs to be adjusted. By using a randomization test, as discussed below, we
were able to determine that aNegLogP of 8 is unlikely to arise from a random pattern. We give
the technical details of this a bit later.
August 19, 2010 DRAFT

25
(a) NegLogP vs. global support for CSET patterns.
0 0.2 0.4 0.6 0.8 10
2
4
6
8
10
12
14
Pattern Support
Neg
LogP
SMP
(b) NegLogP vs. global support for SMP patterns
Fig. 7. Plot of NegLogP vs. global support for patterns from CSET and SMP, where the support is relative to the
whole data set.
In Figure 7, we show plots ofNegLogP vs. global support for the patterns discovered by
both CSET and SMP. For CSET, patterns discovered by usingBiggerSup thresholds0.4, 0.55,
and 0.6 were combined as described in Section VI-B.2, while for SMP, a0.18 threshold was
used. Several conclusions can be drawn from this figure. First, CSET finds more patterns than
SMP, particularly for patterns with higher support (the ones with support greater than0.4).
This is not surprising since SMP sacrifices completeness to find lower support patterns. Second,
CSET finds many patterns withNegLogP less than2, while all the patterns discovered by SMP
haveNegLogP higher than2. This demonstrates the exactness ofSupMaxPair (Theorem 1),
i.e. becauseSupMaxPair is an lower bound ofDiffSup, all the patterns discovered withr are
r − discriminative. Last and the most importantly, SMP finds many patterns at lowsupport
level that are not found by CSET, especially the ones withNegLogP higher than the significance
threshold8. Also, these patterns are constituted by many genes that arenot covered by the
patterns discovered by CSET, as will be discussed in Section VI-B.4.
We now come back to the details of how we determined a significance threshold forNegLogP ,
both for the completeness of the above discussion and to further illustrate the quality of the
patterns found by SMP but not found by CSET. Because of the issues of low sample size
and high-dimensionality for data sets used for problems such as biomarker discovery, many
patterns may be falsely associated with the class label. This raises the multiple-hypothesis testing
problem [40], [18], which are addressed by various approaches, such as Bonferroni correction
[33], false discovery rate control [48] and permutation test [33], [52], [18]. Permutation tests
August 19, 2010 DRAFT

26
based on row-wise, column-wise and swap randomization [18]have been used to assess the
statistical significance of the results of unsupervised pattern discovery and clustering algorithms.
While in the context of labeled transactions, class-label permutation tests [42], [50] are often an
effective option. In this approach, a reference distribution for evaluation measures likeNegLogP is
generated by randomly shuffling the class labels (permutations). Specifically, for each iteration,
the class labels are randomly shuffled and reassigned to patients, discriminative patterns are
found, and theNegLogP values are computed for these patterns using the same methodas for
the patterns discovered with the true labels. TheNegLogP values from the random runs can
be used to generate an empirical distribution for theNegLogP values, which can be displayed
as a histogram as in Figure 8. (Sometimes only the extreme (maximum) NegLogP values are
used as in this figure.) If aNegLogP of a pattern derived from the true labels falls outside the
main concentration ofNegLogP values from the random labels, then theNegLogP very likely
indicates a discriminative pattern with a ”more than random” variation from equal frequency
across classes.
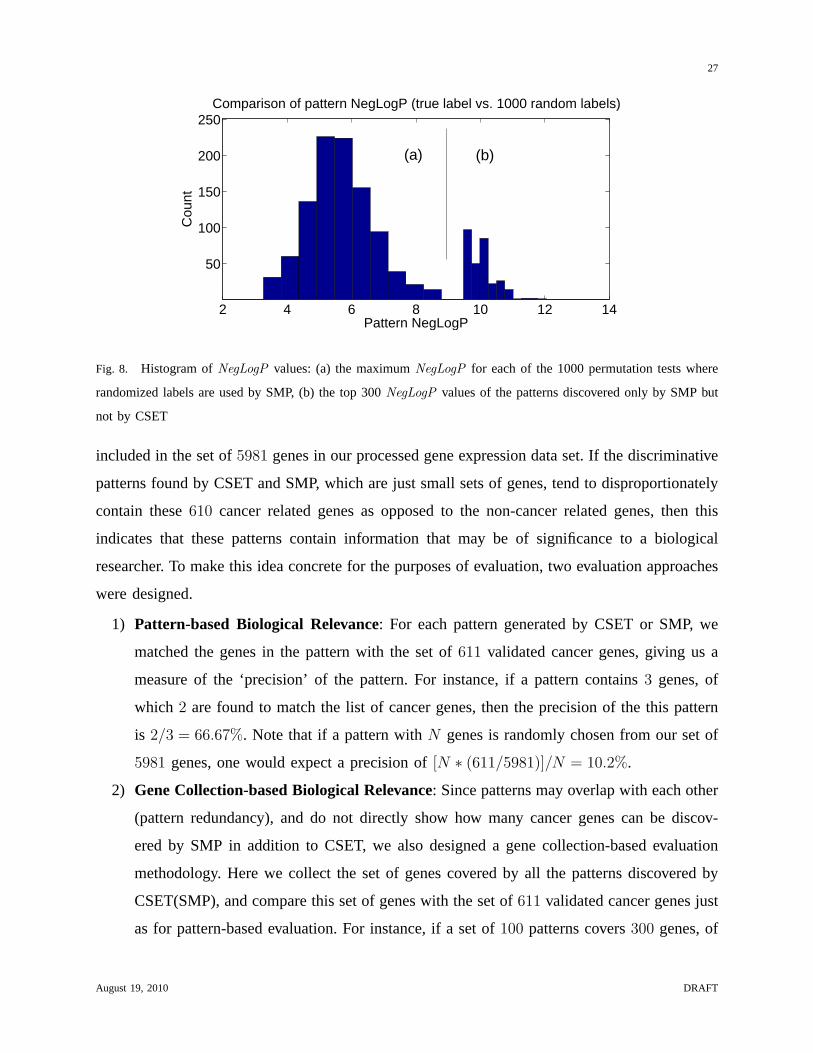
Figure 8 summarizes the results of such a permutation test for the dataset being used in these
experiments. The right hand side shows the top300 NegLogP of the patterns discovered only
by SMP but not by CSET, while the left hand side displays the maximum NegLogP for each
of the 1000 permutation tests where randomized labels are used for pattern mining. We observe
that theNegLogP values with random labels rarely exceed8 (less than8.72 in each of the1000
permutation tests). Thus, we can use 8 as a relaxed thresholdfor significance, since only a few
percent of the random patterns are above this value. TheNegLogP values of the top-300 patterns
discovered by SMP but not by CSET with true label are much higher (all larger than9.67). In
contrast, only 34 patterns discovered by CSET have aNegLogP greater than8. This shows that
SMP can discover additional statistically significant low-support patterns. In the next section,
we illustrate the biological significance of these patternsand how they can be used to discover
cancer-related genes.
4) Biological Relevance of Patterns based on a list of Cancer-related Genes:There are various
ways to determine the biological relevance of discriminative patterns. Since the application we
consider is that of discovering biomarkers for cancer, we measured the biological relevance of
the patterns using a list of about2400 human genes known to be involved in the induction,
progression and suppression of various types of cancers [21]. Of these2400 genes,611 were
August 19, 2010 DRAFT
27
2 4 6 8 10 12 14
50
100
150
200
250
Pattern NegLogP
Cou
nt
Comparison of pattern NegLogP (true label vs. 1000 random labels)
(a) (b)
Fig. 8. Histogram ofNegLogP values: (a) the maximumNegLogP for each of the 1000 permutation tests where
randomized labels are used by SMP, (b) the top 300NegLogP values of the patterns discovered only by SMP but
not by CSET
included in the set of5981 genes in our processed gene expression data set. If the discriminative
patterns found by CSET and SMP, which are just small sets of genes, tend to disproportionately
contain these610 cancer related genes as opposed to the non-cancer related genes, then this
indicates that these patterns contain information that maybe of significance to a biological
researcher. To make this idea concrete for the purposes of evaluation, two evaluation approaches
were designed.
1) Pattern-based Biological Relevance: For each pattern generated by CSET or SMP, we
matched the genes in the pattern with the set of611 validated cancer genes, giving us a
measure of the ‘precision’ of the pattern. For instance, if apattern contains3 genes, of
which 2 are found to match the list of cancer genes, then the precision of the this pattern
is 2/3 = 66.67%. Note that if a pattern withN genes is randomly chosen from our set of
5981 genes, one would expect a precision of[N ∗ (611/5981)]/N = 10.2%.
2) Gene Collection-based Biological Relevance: Since patterns may overlap with each other
(pattern redundancy), and do not directly show how many cancer genes can be discov-
ered by SMP in addition to CSET, we also designed a gene collection-based evaluation
methodology. Here we collect the set of genes covered by all the patterns discovered by
CSET(SMP), and compare this set of genes with the set of611 validated cancer genes just
as for pattern-based evaluation. For instance, if a set of100 patterns covers300 genes, of
August 19, 2010 DRAFT

28
which50 are found to match the list of cancer genes, then the precision of the set of patterns
is 50/300 = 16.67% and the recall is50/611 = 8.18%. To compare, if we select300 genes
randomly from the5981 genes, then the expected precision is[300 ∗ (611/5981)]/300 =
10.2%, and the expected recall is[300 ∗ (611/5981)]/611 = 5.02%.
This section details the results obtained from with these evaluation methodologies.
Brief Preview of Results: From the pattern-based biological relevance evaluation,we observed
that CSET can discover patterns with good precision at relatively high support level, while SMP
can further discover good quality patterns at relatively low support level, among which, there
are some patterns with 100% precision with respect to the cancer gene list. From the gene
collection-based biological relevance evaluation, we observed that both the techniques discovered
substantially more cancer genes than expected by random chance, especially among the higher
NegLogP patterns. In particular, SMP was able to discover more cancer genes as compared to
CSET due to its ability of discovering low-support patterns.This result further indicates the
potential usefulness of recovering low-support patterns and discovering biomarkers that may be
examined and utilized by the biology community. The following discussion provides additional
details of these results.
Results from Pattern-based Relevance: Figure 9(a) shows the distribution of pattern-based
precision of those patterns discovered only by SMP but not byCSET. For comparison, we
generated a sequence of size-k patterns exactly according to the sizes of the patterns corre-
sponding to Figure 9(a). The distribution of precision of these random patterns is shown in
Figure 9(b). We can make the following observations from a comparison of Figure 9(a) and 9(b):
(i) these patterns that are discovered exclusively by SMP include many that have a relatively
high precision. Specifically, about 200 patterns have precisions above0.6, among which there
are 18 with a precision of 100%; (ii) the pattern-based precision of randomly generated patterns
is mostly (about 1500 times)0, and sometimes (about 300 times) fall into the range of0.2 and
0.3, but rarely (less than 20) go beyond0.4, and never go beyond0.8. Interestingly, some of the
SMP patterns with 100% precision play similar roles in cancer processes.
Results from Gene collection-based Relevance: To investigate how many cancer genes can be
discovered using CSET and SMP, we summarized the gene collection-based evaluation results
for them in Tables IV and V respectively. These tables include the number of cancer genes
discovered, precision, recall, and expected recall for randomly selected group of genes of the
August 19, 2010 DRAFT

29
0 0.2 0.4 0.6 0.8 10
100
200
300
400
500
Per−pattern Precision
Cou
nt Patternswith 100% precision
(a) Distribution of pattern-based precision for pat-
terns discovered only by SMP but not by CSET
0 0.2 0.4 0.6 0.8 10
500
1000
1500Top: The Complete Distribution
0 0.2 0.4 0.6 0.8 10
50
100
150
Per−pattern Presicion
Bottom: The Distribution Excluding 0 precision
(b) Distribution of pattern-based precision of pat-
terns generated by randomly selection of genes.
Fig. 9. Comparison of the distributions of pattern-based precision between (a) the patterns discovered by SMP but
not CSET and (b) random generated patterns.
same size. Note that, the expected precision for a random collection of genes is10.2% as
calculated earlier, and thus we do not include this in these tables. The following observations
can be made from these tables.
1) Both CSET and SMP usually find very precise patterns for reasonably high levels of the
NegLogP measure, and this precision is much higher than that expected from a set of
randomly selected gene collection of the same size (10.2%).Similarly, the recall values
for the genes covered by these patterns are much higher than those expected from the
same type of randomly selectd gene collection, as shown by a comparison with the last
column of these tables.
2) For similar values of cancer gene discovery precision, SMP generally finds more cancer
genes than CSET. For instance, at a precision of about25%, the recall of CSET is only
0.5% (3 cancer genes), while SMP has a recall4.3% (26 cancer genes).
Note that the highlight of the second observation is not thatSMP discovers more cancer
genes, but that SMP can discover cancer genes from discriminative patterns with low-support
in addition to the ones discovered by CSET, thus indicating the complementarity of SMP to
existing approaches like CSET. Because of such complementarity, even if SMP discovered less
cancer genes than CSET, SMP still complement CSET as long as additional genes are exclusively
discovered by SMP. Indeed, from the specific example in the second observation, at least23
August 19, 2010 DRAFT

30
NegLogP # # Genes # Cancer Pre Rec ERec
Threshold Patterns Covered Genes (%) (%) (%)
12 2 3 2 66.7 0.3 0.052
11 2 3 2 66.7 0.3 0.052
10 2 3 2 66.7 0.3 0.052
9 10 12 3 25.0 0.5 0.21
8 34 31 7 22.6 1.1 0.54
TABLE IV
PRECISION-RECALL RESULTS OFCSETPATTERNS WITHBiggerSup≥ 0.4 (PRE: PRECISION, REC: RECALL , EXPECTEDPRECISION FOR
RANDOM GENE COLLECTIONS IS10.2%, EREC: EXPECTEDRECALL OF RANDOM GENE COLLECTIONS WITH THE SAME SIZE)
NegLogP # # Genes # Cancer Pre Rec ERec
Threshold Patterns Covered Genes (%) (%) (%)
12 2 4 2 50.0 0.3 0.067
11 6 7 3 42.9 0.5 0.12
10 200 36 11 30.6 1.8 0.60
9 541 57 17 29.8 2.8 0.95
8 1502 103 26 25.2 4.3 1.72
TABLE V
PRECISION-RECALL RESULTS OFSMP PATTERNS WITHSupMaxPair≥ 0.18 (PRE: PRECISION, REC: RECALL , EXPECTEDPRECISION FOR
RANDOM GENE COLLECTIONS IS10.2%, EREC: EXPECTEDRECALL OF RANDOM GENE COLLECTIONS WITH THE SAME SIZE)
cancer genes are discovered by SMP in addition to CSET.
5) Biological Relevance of Patterns based on Biological Gene Sets:An alternative way of
evaluating the biological relevance of the patterns discovered only by SMP but not by CSET
is to estimate how well they capture the 5452 known biological gene sets (e.g. pathways) in
the Molecular Signature database [42]6 (MSigDB). MSigDB is widely used collection of gene
groups containing genes with similar biological functions. The methodology we adopt for this
evaluation is one of calculating the enrichment of one pattern with these gene groups. This
enrichment is measured as the probability of a random pattern of the same size having the same
or better annotations by a given grne group by random chance,and the lower this probability
the more enriched a pattern is with a given gene group. Specifically, for a pattern of sizek
6Specifically, MSigDB (version 2.1, Feb 2007) contains 386 positional gene sets, 1892 curated gene sets, 837 motif gene sets,
883 computational gene sets, and 1454 annotations in Gene Ontology. http://www.broadinstitute.org/gsea/msigdb/
August 19, 2010 DRAFT

31
and a gene set of sizem which sharex common genes, we use the hypergeometric cumulative
distribution function7 to compute the probability that there are greater or equal tox common
genes between the pattern and the gene set by random chance given that the total number of
genes in the data set isN [3]. The −log value of this probability can be considered as an
enrichment score between a pattern and a gene set (denoted byNegLogEnrichP), and the larger
this score, the more significant the biological relevance ofthe pattern. For each pattern, we use
the bestNegLogEnrichPwith the 5452 gene sets as a measure of its biological relevance.
Instead of directly applying the above enrichment methodology to all the patterns that are
discovered only by SMP but not by CSET, we first select a subset in which no pairs of patterns
have greater than 25% overlap of genes. This selection helpsreduce the effect of the redundancy
between these patterns on the enrichment results. The resultant set has37 patterns. Figure 10
shows the distribution of the bestNegLogEnrichPvalues of these37 patterns with respect
to the gene sets in MSigDB. It can observed that more than half of the patterns (20) have
at least two genes overlapping with one or more gene sets, andsome patterns even have a
NegLogEnrichPvalue as high as8 (original p-value as low as10−8). Interestingly, some of
the patterns in this collection are enriched with several gene sets that are clearly related to
breast cancer such asBREAST-DUCTAL-CARCINOMA-GENES(NegLogEnrichP= 8.02) and
BREAST-CANCER-PROGNOSIS-NEG(NegLogEnrichP= 6.73), as well as several gene sets
that are related to general cancer-related biological processes such as the cell-growth-related
gene setIRITANI-ADPROX-LYMPH[42] (NegLogEnrichP= 6.67) and the proliferation-related
gene setHOFFMANN-BIVSBII-BI-TABLE2[42] (NegLogEnrichP= 6.15). These results further
support the biological relevance of the patterns discovered only by SMP but not by CSET, and
thus demonstrate the benefits of using SMP to search for low-support discriminative patterns in
addition to existing approaches.
6) Comparison of the scalability of the algorithms:In section VI-A, we compared the effec-
tiveness of CSET and SMP for discovering low-support patterns from synthetic datasets with
varying density and dimensionality. In this part of the study, we test the scalability of CSET
and SMP with varying thresholds on the real gene expression data. In addition, we also test the
FPClose (FPC) [19] algorithm (plus pattern selection) as the baseline as used by other studies
7p(x|k, m, N) = 1 −P
x−1
i=0
(N−i
k−i)(m
i)
(N
k)
August 19, 2010 DRAFT

32
−1 0 1 2 3 4 5 6 7 8 90
5
10
15
20
Best enrichment p−value (NegLogEnrichP) w.r.t. the gene sets in MSigDB
Num
ber
of P
atte
rns
−1 indicates the overlap is less than 2
Fig. 10. Histogram of the best enrichmentNegLogEnrichPvalues w.r.t. the gene sets in MSigDB, for the patterns
discovered by SMP but not by CSET. An enrichment p-value is computed only if a pattern and a gene set have at
least2 genes in common.
[10], [15]. Note that, as mentioned in Section VI-B, the gene expression data set was discretized
with ±0.2 as thresholds, into a binary matrix with density 16.62% and dimension11962, to
preserve most of the information in the data. This dataset isquite dense, due to which CSET
can only generate complete results at a threshold larger than 0.6. In order to obtain a more
complete picture of the scalabilities of FPC, CSET and SMP, we discretized the gene expression
dataset using±0.3 as the discretization threshold in this section, which yields a binary matrix
with density 8.71%.
Figure 11 shows the results of this comparisons. The X-axis in this plot is the threshold used
for discriminative pattern mining, while the Y-axis denotes the log10(run-time in seconds) value.
Note that run-times are recorded for any algorithm only if itcan produce output within four
hours. The relativeminsup threshold used in FPC is defined on the whole dataset (both classes),
while BiggerSupfor CSET andSupMaxPair for SMP take into account the support in each of
the classes individually. Therefore, for a fair comparison, FPC’s minsupis adjusted according
to the size ratio of the two classes (divided by the percentage of the majority class in the whole
dataset (0.74)) and then plotted together withBiggerSupandSupMaxPair .
Several observations can be made from these plots: (i) the FPC-based two-step approach can
search for discriminative patterns at high support levels (above0.55), (ii) by using BiggerSup,
CSET is able to search at slightly lower support levels (above0.5) compared to FPC; and for
the same threshold, CSET is more efficient than FPC, and (iii)SupMaxPair can explore pattern
August 19, 2010 DRAFT

33
0 0.1 0.2 0.3 0.4 0.5 0.6 0.7 0.8 0.9 11
1.5
2
2.5
3
3.5
4
4.5
BiggerSup threshold for CSET, SupMaxPair threshold for SMP, and adjusted threshold for FPC
Log 10
run
tim
e in
sec
onds
FPCCSETSMP
Fig. 11. Scalability of different discriminative pattern mining algorithms on the gene expression data
space with substantially lower support levels (0.1 − 0.3). Thus, FPC and CSET can be used to
discover patterns at higher thresholds, while SMP is able tofind lower support patterns missed
by the other approaches.
C. Summary of Results
Based on the experimental results on both the synthetic datasets and the cancer gene expression
data set presented in this section, we have demonstrated that on dense and high-dimensional
data, there are patterns with relatively low support that can only be discovered bySupMaxPair
but not by the existing approaches. Specifically, on the cancer gene expression data set, the
low-support discriminative patterns discovered only by SMP are statistically significant and
biologically relevant.
We also did another set of experiments for studying how well the members ofSupMaxK
approximateDiffSup as K increases. We selected several UCI datasets [4], on which allthe
discriminative patterns (given a relatively low DiffSup threshold) can be discovered and used
for the study. The experimental results show that: (i)SupMax1 generally provides very poor
approximation ofDiffSup; (ii), the approximation is improved substantially whenK goes to2,
i.e. SupMaxPair; (iii) whenK is increased further to3 and 4, the computation time increases
exponentially, but the approximation improves much slowercompared to the improvement ob-
tained whenK goes from1 to 2. These experimental results indicate thatSupMaxPair provides a
good balance between the approximation ofDiffSup and the computational expense. The detailed
August 19, 2010 DRAFT

34
results are discussed as a supplementary material (available at http://vk.cs.umn.edu/SMP/).
VII. R ELATED WORK
Over the past decade, many approaches have studied discriminative pattern mining and related
topics. Dong and Li [14] definedemerging patterns (EP)as itemsets with a sufficiently large
growth rate (support ratio) between two classes. A two-stepalgorithm is proposed to discover
EPs, which first finds frequent itemsets with the Max-Miner algorithm [6] for each of the two
classes, and then compares these itemsets to find EPs. Emerging pattern were the first formulation
of discriminative patterns and have been extended further to several special cases such as jumping
emerging patterns [26] and minimal emerging patterns[31],[27]. Here, the discriminative power
of a pattern is measured with support ratio [14], or simply with the two supports of the pattern in
the two classes and two corresponding thresholds [31]. As discussed in [5], these emerging pattern
mining algorithms must mine the data multiple times given a certain threshold for support ratio
(or two thresholds for the two supports). In [5], a new formulation of discriminative patterns,
contrast sets (CSETs), is proposed along with an algorithm tomine them. CSET is the first
technique that formulates discriminative pattern mining within an Apriori-like framework [2],
[6], in which different pruning measures can be used to perform a systematic search on the itemset
lattice [2]. In [51], contrast set mining is shown to be a special case of a more general task,
namely rule learning, where a contrast set can be consideredas an antecedent of a rule whose
consequent is a group. Notably, CSET has also be used in some biomedical applications [25].
The upper bounds of statistical discriminative measures have also been studied for discriminative
pattern mining e.g. information gain [9],χ2 − test [5] and several others [34].
Next, we also briefly discuss other research work related to discriminative pattern mining,
although they are not the focus of the paper. Many existing approaches have studied the use of
frequent patterns in classification. Associative classifiers [29], [28], [55], [11], [49] are a series
of approaches that focus on the mining of high-support, high-confidence rules that can be used
in a a rule-based classifier. Cheng et. al. [9] recently conducted a systematic evaluation of the
utility of frequent patterns in classification. Several pattern-based classification frameworks have
also been proposed, in which a small number of discriminative patterns are selected, which
can achieve comparable classification accuracy with respect to the whole set of discriminative
patterns [10], [15], [54], [30]. Discriminative pattern mining from multiple classes has been
August 19, 2010 DRAFT

35
studied in [5], [27], [25], while mining complex discriminative patterns has been studied in
[31]. Although traditional pattern summarization approaches [20] can be adopted to control the
redundancy among discriminative patterns, closeness and redundancy are specially studied for
in the context of discriminative patterns respectively in [17] and [41].
VIII. C ONCLUSIONS
In this paper, we addressed the necessity of trading off the completeness of discriminative
pattern discovery, with the ability to discover low-support discriminative patterns from dense and
high-dimensional data within an acceptable amount of time.For this, we proposed a family of
anti-monotonic measures of discriminative power namedSupMaxK that conceptually organize
the set of discriminative patterns into nested layers of subsets, and are progressively more
complete in their coverage, but require increasingly more computation for their discovery. Given
the same and fixed amount of time, theSupMaxK family provides a tradeoff between the
ability to search for low-support discriminative patternsand the coverage of the space of valid
discriminative patterns for the corresponding threshold.In particular,SupMaxK with K = 2
namedSupMaxPair , is a special member of this family that is suitable for denseand high-
dimensional data. We designed a framework, named SMP, whichusesSupMaxPair for discov-
ering discriminative patterns from dense and high-dimensional data. A variety of experiments on
both synthetic datasets and a breast cancer gene expressiondataset demonstrated that there
are patterns with relatively low support that can be discovered using SMP but not by the
existing approaches. In particular, the low-support discriminative patterns discovered only by
SMP from the gene expression dataset are statistically significant and biologically relevant. In
summary, SMP can complement existing algorithms for discovering discriminative patterns by
finding patterns with relatively low support from dense and high-dimensional data sets that
other approaches fail to discover within an acceptable amount of time. Thus, in practice, it is
recommended that CSET and other existing approaches should be used to discover medium-to-
high support patterns from such data sets within an acceptable amount of time, and then SMP
could be used to further discover low-support discriminative patterns that existing approaches
may not discover.
Our work can be extended in several directions. As discussedin Section IV-D, the members
of SupMaxK induce a hierarchy of subsets of the complete set of discriminative patterns. This
August 19, 2010 DRAFT
36
hierarchy motivates further research that focuses on the mining of discriminative patterns from
the other layers that are not covered bySupMaxPair . It is also interesting to study the quality of
the discriminative patterns in the different layers of thishierarchy, which may provide insights
into different priorities for discriminative pattern mining from these layers. Note that, the use of
measures from theSupMaxK family is only one possible method for trading off the completeness
of pattern discovery with the ability to discover low-support discriminative patterns from high-
dimensional data. Indeed, other approaches that adopt a different strategy for handling this
tradeoff are also possible and should be studied. Also, mostexisting discriminative pattern mining
algorithms (as well as SMP) are designed for binary data, andhave to rely on discretization for
continuous data. It will be useful to design approaches thatcan directly handle continuous data
for discriminative pattern mining, as has been done for discovering patterns in an unsupervised
manner[36].
IX. SUPPLEMENTARY MATERIAL : EXPERIMENTS TO SHOW HOW WELLSupMaxK
ESTIMATES DiffSup
In this set of experiments, we study how the members ofSupMaxKapproximateDiffSup as
K increases. There are two approaches for this purpose, i.e. analytical and empirical analysis.
In an analytical approach, some assumptions need to be made such as that the data comes from
independence model. Such assumptions generally do not holdfor real datasets. Therefore, we
selected several real datasets from UCI Data Repository [4] and designed an empirical study
on the approximation ofDiffSup by the members ofSupMaxK. The datasets we selected are
mushroom, hypo, hepatic and sonar, which have relatively low density or low dimensionality,
so that a lowDiffSup threshold (0.1) can be used to discover the complete set of discriminative
patterns for a comprehensive study on the approximation.
Given a dataset, for each discriminative pattern of size no less thanN , we compute the value
of its SupMax1, SupMax2, ... andSupMax(N-1), and compare this sequence of values with its
DiffSup, from which we can see howSupMaxKapproximatesDiffSupwith increasing value of
K. The results on these datasets are displayed in Figures 12. Several observations can be made:
• Firstly, asK increases,SupMaxKprovides a closer and closer approximation ofDiffSup.
Specifically in the left subfigures, all the patterns have non-decreasingSupMaxKvalues (shown
by the non-decreasing curves). This observation is guaranteed by Lemma3 and Theorem1.
August 19, 2010 DRAFT
37
• Secondly,SupMax1generally provides very poor approximation of DiffSup. Specifically,
although all the patterns discovered from the four datasetshaveDiffSupno less than0.1, most
of them have negativeSupMax1values.
• Thirdly, whenK goes from1 to 2, i.e. SupMaxPair, the approximation is improved sub-
stantially (shown by the jump of value fromSM1 to SM2). With this improvement, for many
discriminative patterns,SupMaxPair (K = 2) provides a reasonably good approximation of
DiffSup. Take the mushroom dataset as an example, for200 of the total285 patterns (70.2%),
SupMaxPairhas difference less than0.1 from DiffSup. There are also many patterns whose
SupMaxPairvalues have differences less than0.1 from DiffSup in the other three datasets: hypo
(about (70%)), sonar (about (20%)) and hepatic (about (20%)).
• Finally, whenK is increased further to3 and4, the computation time increases exponentially,
but the approximation improves relatively much less compared to the improvement obtained when
K goes from1 to 2. However, it is worthnoting that the differences betweenSupMaxPairand
DiffSup can also be large (ranging from0.1 to 0.4) for many discriminative patterns on all the
four datasets, e.g.30% in the mushroom dataset, about80% in the hepatic and sonar datasets. For
these discriminative patterns,SupMaxKwith largerK (≥ 3) is necessary to provide sufficiently
close approximation ofDiffSup.
These experimental results indicate thatSupMaixPairprovides a good balance between the
approximation ofDiffSup and the computational expense. However, we present the details of
this study in the supplementary material rather than in the main paper due to the space limits
(we are alrady at the maximal 36 pages allowed), and because the highlight ofSupMaxPairis
not its accurate approximation ofDiffSupbut the combination of the following three advantages:
(i) it is effective for pruning non-discriminative patterns as a lower bound ofDiffSup, compared
to BiggerSup(an upper bounds ofDiffSup) (ii) it is a tighter lower bound for DiffSup compared
to SupMax1(theoretically guaranteed by Lemma3 and Theorem1, and also shown in Figure
12) and (iii) it is the only one, among the members ofSupMaxK (K ≥ 2), that is feasible
for handling high dimensional datasets. These advantages enableSupMaxPairfor discovering
additional low-support discriminative patterns from dense and high-dimensional dataset when
existing techniques fail to, as extensively discussed in Sections I and IV and demonstrated in
Sections VI-A and VI-B.
August 19, 2010 DRAFT

38
SM1 SM2 SM3 SM4 DiffSup−1
−0.8
−0.6
−0.4
−0.2
0
0.2
0.4
0.6
0.8Dataset: mushroom; 285 patterns (size>=5)
Val
ue
0 0.1 0.2 0.3 0.4 0.50
20
40
60
80
100
120
140Histogram of (DiffSup−SM2)
(a) Mushroom dataset:285 discriminative patterns with size greater or equal
to 5 andDiffSupno less than0.1
SM1 SM2 SM3 DiffSup−0.8
−0.6
−0.4
−0.2
0
0.2
0.4
0.6
0.8Dataset: hypo; 45 patterns (size>=4)
Val
ue
0 0.1 0.2 0.3 0.4 0.50
5
10
15
20
25
30Histogram of (DiffSup−SM2)
(b) Hypo dataset:45 discriminative patterns with size greater or equal to4
(too few patterns with size≥ 5) andDiffSupno less than0.1
SM1 SM2 SM3 SM4 DiffSup−0.8
−0.6
−0.4
−0.2
0
0.2
0.4
0.6Dataset: sonar; 385 patterns (size>=5)
Val
ue
0 0.1 0.2 0.3 0.40
10
20
30
40
50
60
70
80
90Histogram of (DiffSup−SM2)
(c) Sonar dataset:385 discriminative patterns with size greater or equal to
5 andDiffSupno less than0.1
SM1 SM2 SM3 DiffSup−0.8
−0.6
−0.4
−0.2
0
0.2
0.4
0.6Dataset: hepatic; 164 patterns (size=4)
Val
ue
0 0.1 0.2 0.3 0.40
5
10
15
20
25
30Histogram of (DiffSup−SM2)
(d) Hepatic dataset:164 discriminative patterns with size greater or equal
to 4 (too few patterns with size≥ 5) andDiffSupno less than0.1
Fig. 12. The approximation ofDiffSupby the members ofSupMaxKwith increasing value ofK on the three UCI
data sets. In the left subfigures, the sequence of values for each pattern (SupMax1, SupMax2, SupMax3, SupMax4
andDiffSup) are plotted as a curve. The right subfigures are the distribution of the difference betweenDiffSupand
SupMax2, the value of which measures how closeSupMax2approximateDiffSup
August 19, 2010 DRAFT

39
ACKNOWLEDGMENT
The authors would like to thank the anonymous reviewers for the constructive comments. This
work was supported by NSF grants #IIS0916439, #CRI-0551551, aUniversity of Minnesota
Rochester Biomedical Informatics and Computational Biology Program Traineeship Award. Ac-
cess to computing facilities was provided by the Minnesota Supercomputing Institute.
REFERENCES
[1] Mental Health Services Administration (2006). The role of biomarkers in the treatment of alcohol use disorders.Substance
Abuse Treatment Advisory, 5(4):4206–4223.
[2] R. Agrawal and R. Srikant. Fast algorithms for mining association rules. In Proc. VLDB, pages 487–499, 1994.
[3] M. Ashburner, C. Ball, J. Blake, D. Botstein, H. Butler, J. Cherry,A. Davis, K. Dolinski, S. Dwight, J. Eppig, et al. Gene
Ontology: tool for the unification of biology.Nature genetics, 25(1):25–29, 2000.
[4] A. Asuncion and D. Newman. UCI machine learning repository, 2007.
[5] S. Bay and M. Pazzani. Detecting group differences: Mining contrast sets.DMKD, 5(3):213–246, 2001.
[6] R. J. Bayardo. Efficiently mining long patterns from databases. InProc. SIGMOD, pages 85–93, 1998.
[7] S. Brin, R. Motwani, and C. Silverstein. Beyond market baskets: Generalizing association rules to correlations. InProc.
SIGMOD, pages 265–276, 1997.
[8] C. Carlson et al. Mapping complex disease loci in whole-genome association studies.Nature, 429(6990):446–452, 2004.
[9] H. Cheng, X. Yan, J. Han, and C.-W. Hsu. Discriminative frequent pattern analysis for effective classification. InProc.
ICDE, pages 716–725, 2007.
[10] H. Cheng, X. Yan, J. Han, and P. Yu. Direct discriminative pattern mining for effective classification. InProc. ICDE,
pages 169–178, 2008.
[11] G. Cong, K. Tan, A. Tung, and X. Xu. Mining top-k covering rule groups for gene expression data. InProc. SIGMOD,
pages 670–681, 2005.
[12] C. Creighton and S. Hanash. Mining gene expression databases for association rules.Bioinformatics, 19(1):79–86, 2003.
[13] M. Deshpande, M. Kuramochi, N. Wale, and G. Karypis. Frequent sub-structure based approaches for classifying chemical
compounds.IEEE TKDE, 17(8):1036–1050, 2005.
[14] G. Dong and J. Li. Efficient mining of emerging paterns: Discovering trends and differences. InProc. SIGKDD, pages
43–52, 1999.
[15] W. Fan, K. Zhang, H. Cheng, J. Gao, X. Yan, J. Han, P. S. Yu,and O. Verscheure. Direct mining of discriminative and
essential graphical and itemset features via model-based search tree. In Proc. SIGKDD, pages 230–238, 2008.
[16] R. Fisher. On the interpretation ofχ2 from contingency tables, and the calculation of P.Journal of the Royal Statistical
Society, pages 87–94, 1922.
[17] G. Garriga, P. Kralj, and N. Lavrac. Closed sets for labeled data.JMLR, 9:559–580, 2008.
[18] A. Gionis et al. Assessing data mining results via swap randomization.ACM TKDD, 1(3), 2007.
[19] G. Grahne and J. Zhu. Efficiently using prefix-trees in mining frequent itemsets. InWorkshop on Frequent Itemset Mining
Implementations, 2003.
[20] J. Han et al. Frequent pattern mining: current status and future directions. DMKD, 15:55–86, 2007.
August 19, 2010 DRAFT

40
[21] M. E. Higgins, M. Claremont, J. E. Major, C. Sander, and A. E. Lash. CancerGenes: a gene selection resource for cancer
genome projects.Nucl. Acids Res., 35(supplement 1):D721–726, 2007.
[22] T. Hwang, H. Sicotte, Z. Tian, B. Wu, J. Kocher, D. Wigle, V. Kumar, and R. Kuang. Robust and efficient identification
of biomarkers by classifying features on graphs.Bioinformatics, 24(18):2023–2029, 2008.
[23] S. Jaroszewicz and D. A. Simovici. Pruning redundant association rules using maximum entropy principle. InProc.
PAKDD, pages 135–147, May 2002.
[24] P. Kralj, N. Lavrac, D. Gamberger, and A. Krstacic. Contrast set mining for distinguishing between similar diseases. In
AI in Medicine in Europe, pages 109–118, 2007.
[25] P. Kralj Novak, N. Lavrac, D. Gamberger, and A. Krstacic. CSM-SD: Methodology for contrast set mining through
subgroup discovery.Journal of Biomedical Informatics, 42(1):113–122, 2009.
[26] J. Li, G. Dong, and K. Ramamohanarao. Making use of the most expressive jumping emerging patterns for classification.
KAIS, 3(2):131–145, 2001.
[27] J. Li, G. Liu, and L. Wong. Mining statistically important equivalence classes and delta-discriminative emerging patterns.
In Proc. SIGKDD, pages 430–439. ACM New York, NY, USA, 2007.
[28] W. Li, J. Han, and J. Pei. CMAR: Accurate and efficient classification based on multiple class-association rules. InProc.
ICDM, pages 369–376, 2001.
[29] B. Liu, W. Hsu, and Y. Ma. Integrating classification and associationrule mining. InProc. SIGKDD, pages 80–86, 2001.
[30] D. Lo, H. Cheng, J. Han, S. Khoo, and C. Sun. Classification of software behaviors for failure detection: a discriminative
pattern mining approach. InProc. SIGKDD, pages 557–566, 2009.
[31] E. Loekito and J. Bailey. Fast mining of high dimensional expressive contrast patterns using zero-suppressed binary
decision diagrams. InProc. SIGKDD, pages 307–316. ACM New York, NY, USA, 2006.
[32] T. McIntosh and S. Chawla. High confidence rule mining for microarray analysis. IEEE/ACM Transactions on
Computational Biology and Bioinformatics, 4(4):611–623, 2007.
[33] R. Miller. Simultaneous Statistical Inference.Springer-Verlag Inc., New York, NY, 1981.
[34] S. Morishita and J. Sese. Transversing itemset lattices with statistical metric pruning. InProc. PODS, pages 226–236.
ACM New York, NY, USA, 2000.
[35] P. Novak, N. Lavrac, and G. Webb. Supervised Descriptive Rule Discovery: A Unifying Survey of Contrast Set, Emerging
Pattern and Subgroup Mining.JMLR, 10:377–403, 2009.
[36] G. Pandey, G. Atluri, M. Steinbach, C. L. Myers, and V. Kumar. An Association Analysis Approach to Biclustering. In
Proc. SIGKDD, pages 677–686, 2009.
[37] N. Pasquier, Y. Bastide, R. Taouil, , and L. Lakhal. Discovering frequent closed itemsets for association rules. InProc.
ICDT, pages 398–416, 1999.
[38] E. Segal, N. Friedman, N. Kaminski, A. Regev, and D. Koller. From signatures to models: understanding cancer using
microarrays.Nature Genetics, pages S38–S45, 2005.
[39] D. Segre et al. Modular epistasis in yeast metabolism.Nature Genetics, 37:77–83, 2004.
[40] J. Shaffer. Multiple hypothesis testing.Annual Review of Psychology, 46(1):561–584, 1995.
[41] A. Soulet et al. Condensed representation of emerging patterns.In Proc. PAKDD, pages 127–132, 2004.
[42] A. Subramanian, P. Tamayo, V. Mootha, et al. Gene set enrichment analysis: A knowledge-based approach for interpreting
genome-wide expression profiles.PNAS, 102(43):15545–15550, 2005.
[43] P.-N. Tan, M. Steinbach, and V. Kumar. Introduction to data mining. Addison-Wesley, 2005.
August 19, 2010 DRAFT

41
[44] N. Tatti. Maximum entropy based significance of itemsets.Knowledge and Information Systems, 17(1), Oct 2008.
[45] van de Vijver et al. A gene-expression signature as a predictor ofsurvival in breast cancer.New England Journal of
Medicine, 347:1999–2009, 2002.
[46] L. J. van ’t Veer et al. Gene expression profiling predicts clinicaloutcome of breast cancer.Nature, 415:530–536, 2002.
[47] M. van Vliet, C. Klijn, L. Wessels, and M. Reinders. Module-based outcome prediction using breast cancer compendia.
PLoS ONE, 2(10):1047, 2007.
[48] K. Verhoeven et al. Implementing false discovery rate control: increasing your power.Oikos, 108(3):643–647, 2005.
[49] J. Wang and G. Karypis. HARMONY:efficiently mining the best rules for classification. InProc. SDM, page 205, 2005.
[50] K. Wang et al. Pathway-based approaches for analysis of genomewide association studies.AJHG, 81(6):1278–1283, 2007.
[51] G. I. Webb et al. On detecting differences between groups.Proc. SIGKDD, pages 256–265, 2003.
[52] P. Westfall and S. Young. P value adjustments for multiple tests in multivariate binomial models.JASA, page 780, 1989.
[53] H. Xiong, P. Tan, and V. Kumar. Hyperclique pattern discovery.DMKD, 13(2):219–242, 2006.
[54] X. Yan, H. Cheng, et al. Mining significant graph patterns by leap search. InProc. SIGMOD, pages 433–444, 2008.
[55] X. Yin and J. Han. CPAR: Classification based on predictive association rules. InProc. SDM, pages 331–335, 2003.
[56] N. Yosef, Z. Yakhini, A. Tsalenko, V. Kristensen, A. Borresen-Dale, E. Ruppin, and R. Sharan. A supervised approach for
identifying discriminating genotype patterns and its application to breast cancer data.Bioinformatics, 23(2):91–98, 2007.
August 19, 2010 DRAFT
Copyright © 2022 FDOKUMEN