Women Mystics: Pain and Suffering - an Anthropological perspective

Qual QuantDOI 10.1007/s11135-014-0125-5
Mining critical least association rules from studentssuffering study anxiety datasets
Tutut Herawan · Haruna Chiroma · PrimaVitasari ·Zailani Abdullah · Maizatul Akmar Ismail ·Mohd Khalit Othman
© Springer Science+Business Media Dordrecht 2014
Abstract In data mining, association rules mining is one of the common and popular tech-niques used in various domain applications. The purpose of this study is to apply an enhancedassociation rules mining method, so called significant least pattern growth for capturinginteresting rules from students suffering from exam, family, presentation and library anxietydatasets. The datasets were taken from a survey among engineering students in UniversitiMalaysia Pahang. The results of this research will provide useful information for educatorsto make more accurate decisions concerning their students, and to adapt their teaching strate-gies accordingly. Moreover, it can also highlight the role of non-academic staff in supportinglearning environments for students. The obtained findings can be very helpful in assistingstudents to handle their fear and anxiety, and, finally, increasing the quality of the learningprocesses at the university.
T. Herawan · H. Chiroma (B) · M. A. Ismail · M. K. OthmanFaculty of Computer Science and Information Technology, University of Malaya,50603 Pantai Valley, Kuala Lumpur, Malaysiae-mail: [email protected]
T. Herawane-mail: [email protected]
M. A. Ismaile-mail: [email protected]
M. K. Othmane-mail: [email protected]
P. VitasariPostgraduate Program, Insititute Teknologi Nasional, Jalan Bendungan Sigura-gura Malang,Jawa Barat, Indonesiae-mail: [email protected]
Z. AbdullahDepartment of Computer Science, Universiti Malaysia Terengganu,21030 Kuala Terengganu, Malaysiae-mail: [email protected]
123

T. Herawan et al.
Keywords Evaluation methodologies · Simulations · Programming and programminglanguages · Computer-mediated communication
1 Introduction
Anxiety is a psychological and physical response to treat a self-concept characterized bysubjective, consciously perceived feelings of tension (Spielberger and Vagg 1995). Theroot meaning of the word anxiety is ‘to vex or trouble’; in either presence or absenceof psychological stress, anxiety can create feelings of fear, worry, uneasiness, and dread(Davison et al. 2008). It is also associated with feelings of restlessness, fatigue, concentra-tion problems, and muscle tension (Bouras and Holt 2007). Anxious students have experienceof cognitive deficits like misapprehension of information or blocking of memory and recall(Vitasari et al. 2010, 2011).
Many educators find themselves overwhelmed with data concerning students sufferinganxiety, but lack the information they need to make informed decisions. Currently, thereis an increasing interest in data mining and educational systems, making educational datamining a new growing research community (Romero and Ventura 2007). One of the populareducational data mining techniques is Association Rules Mining (ARM). Association rulesmining has been widely studied in the knowledge discovery community (Ceglar and Roddick2006). It aims to discover the interesting correlations, frequent patterns, associations orcausal structures among sets of items in the data repositories. The problem of associationrules mining was first introduced by Agrawal for market-basket analysis (Agrawal et al.1993a, b; Aggarwal and Srikant 1994). There are two main stages involved before producingthe association rules: first, find all frequent items from transactional database, and, second,generate the common association rules from the frequent items.
Generally, an item is said to be frequent if it appears more than the minimum supportthreshold. These frequent items are then used to produce the ARs. In addition, confidenceis another measure that is always used in tandem with the minimum support threshold. Bydefinition, the least item is an itemset that is rarely found in the database but may produceinteresting and useful ARs. These types of rule are very meaningful in discovering rarelyoccurring but significantly important, such as air pollution detection, critical fault detec-tions, and network intrusions, and their possible causes. For past developments, many seriesof ARs mining algorithms used the minimum support-confidence framework to avoid theoverloading of ARs. The challenge is that by increasing or decreasing the minimum supportor confidence values, the interesting rules might be missing or untraceable. Because of thecomplexity of study and difficulty in algorithms (Agrawal et al. 1993a) it may require exces-sive computational cost, and, furthermore, very limited attention has been given to discoverthe highly correlated least ARs. In terms of relationship, the frequent and least ARs havea different degree of correlation. Highly correlated least ARs refer to the itemsets the fre-quency of which does not satisfy a minimum support but are very highly correlated. ARs areclassified as highly correlated if there is positive correlation, and, at the same time, they fulfila minimum degree of predefined correlation. Until this moment, the statistical correlationtechnique has been successfully applied in the transaction databases (Agrawal et al. 1993b),to find a relationship among pairs of items and determine whether they are highly positiveor negatively correlated. As a matter of fact, it is not absolutely true that the frequent itemshave a positive correlation as compared to the least items. In previous papers, we address theproblem of mining least ARs with the objective of discovering significant least ARs, which,surprisingly, are highly correlated (Abdullah et al. 2010a, b). A new algorithm named sig-
123

Mining critical least association rules
nificant least pattern growth (SLP-Growth) to extract these ARs is proposed (Abdullah et al.2010a). The proposed algorithm imposes interval support to extract all least item set familiesfirst before continuing to construct a significant least pattern tree (SLP-tree). The correlationand critical relative support measures for finding the relationship between itemsets are alsoembedded into this algorithm (Abdullah et al. 2010a, b). In this paper, we explore the SLP-Growth algorithm for capturing interesting rules in students suffering anxiety from exams,family, presentation and library datasets. The datasets were taken from a survey on exploringseveral types of anxiety among engineering students in Universiti Malaysia Pahang (UMP).The results of this research will provide useful information for educators to make more accu-rate decisions concerning their students, and to adapt their teaching strategies accordingly.In addition, the good support from non-academic staff is also important in providing a betterlearning environment for the students. It can also be helpful in assisting students to handletheir anxiety and be useful in increasing the quality of learning.
The remainder of this paper is organized as follows. Section 2 describes the related workand the basic concepts and terminology of association rules mining. Section 3 describes theproposed association rules method, the so-called SLP-Growth algorithm. Section 4 describesthe scenario in mining information from the four types of anxiety datasets. This is followed byperformance analysis through the four types of anxiety datasets and the results are presentedin Sect. 3. Finally, the conclusions of this work are reported in Sect. 4.
2 Methodology
2.1 Association rules mining
For the past two decades, several attempts have been made to discover scalable and efficientmethods for mining frequent ARs. However, mining least ARs still lags behind. As a result,ARs that are rarely found in the database are pruned out by the minimum support-confidencethreshold. As a matter of fact, the rare ARs can also reveal useful information for detectingthe highly critical and exceptional situations. Zhou et al. (2007) suggested a method to minethe ARs by only considering infrequent itemsets. The drawback is that the matrix-basedscheme (MBS) and hash-based scheme (HBS) algorithms are very expensive in terms of hashcollision. Ding (2005) proposed the transactional co-occurrence matrix (TCOM) for miningassociation rule among rare items. However, implementation wise it is quite complex andcostly. Yun et al. (2003) introduced the relative support apriori algorithm (RSAA) to generaterare itemsets. The challenge is that it takes a similar time as performed by Apriori if theallowable minimum support is set very low. Koh and Rountree (2005) suggested the Apriori–Inverse algorithm to mine infrequent itemsets without generating any frequent rules. However,it suffers from candidate itemset generations and is costly in generating the rare ARs. Liu et al.(1999) proposed the multiple support apriori (MSApriori) algorithm to extract the rare ARs.In actual implementation, this algorithm faces the “rare item problem”. From the proposedapproaches (Zhou and Yau 2007; Yun et al. 2003; Ding 2005; Koh and Rountree 2005; Liu etal. 1999), many of them use the percentage-based approach to improve the performance asfaced by the single minimum support based approaches. In terms of measurement, Brin et al.(1997) introduced the objective measure called lift and chi-square as a correlation measurefor ARs. Lift compares the frequency of pattern against a baseline frequency computedunder the statistical independence assumption. Omiecinski (2003) proposed two interestingmeasures based on the downward closure property called all confidence and bond. Lee et al.(2003) suggested two algorithms for mining all confidence and bond correlation patterns by
123

T. Herawan et al.
extending the pattern-growth methodology Han et al. (2000). In terms of mining algorithms,Agrawal et al. (1993a) proposed the first ARs mining algorithm called Apriori. The mainbottleneck of Apriori is that it requires multiple scanning of the transaction database andalso generates a huge number of candidate itemsets. Han and Kamber (2006) suggestedthe FP-Growth algorithm, which, amazingly, can overcome the two limitations faced by theApriori series algorithms. Currently, FP-Growth is one of the fastest approaches and mostbenchmarked algorithms for frequent itemsets mining. It is derived based on a prefix treerepresentation of database transactions (called an FP-tree).
2.2 Association rules (ARs)
ARs were first proposed for market basket analysis to study customer purchasing patterns inretail stores (Agrawal et al. 1993a, b). Recently, ARs have been used in many applications ordisciplines, such as customer relationship management (Au and Chan 2003), image process-ing (Aggarwal and Yu 1998; Li et al. 2008), mining air pollution data (Mustafa et al. 2006),educational data mining (Abdullah et al. 2011a, b; Herawan et al. 2011), information visual-ization (Herawan et al. 2009; Abdullah et al. 2011c) and text mining. Typically, associationrule mining is the process of discovering associations or correlation among itemsets in trans-action databases, relational databases and data warehouses. There are two subtasks involvedin ARs mining: generating frequent itemsets that satisfy the minimum support threshold andgenerating strong rules from the frequent itemsets.
Throughout this section the set, I = {i1, i2, . . . , i|A|} for |A| > 0 refers to the set of literalscalled set of items and the set D = {t1, t2, . . . , t|U |}, for |U | > 0 refers to the data set oftransactions, where each transaction t ∈ D is a list of distinct items t = {i1, i2, . . . , i|M|}, 1 ≤|M | ≤ |A| and each transaction can be identified by a distinct identifier TID.
Definition 1 A set X ⊆ I is called an itemset. An itemset with k-items is called a k-itemset.
Definition 2 The support of an itemset X ⊆ I , denoted supp(X) is defined as a number oftransactions contain X.
Definition 3 Let X, Y ⊆ I be itemset. An association rule between sets X and Y is animplication of the form X ⇒ Y , where X ∩ Y = φ The sets X and Y are called antecedentand consequent, respectively.
Definition 4 The support for an association rule X ⇒ Y , denoted supp(X ⇒ Y ), is definedas a number of transactions in D contain X ∪ Y
Definition 5 The confidence for an association rule X ⇒ Y , denoted conf(X ⇒ Y ) isdefined as a ratio of the number of transactions in D containing X ∪ Y to the number oftransactions in D containing X. Thus
conf(X ⇒ Y ) = sup p(X ⇒ Y )
sup p(X).
An item is a set of items. A k− itemset is an itemset that contains k items. An itemset is saidto be frequent if the support count satisfies a minimum support count (minsupp). The set offrequent itemsets is denoted as Lk .The support of the ARs is the ratio of transaction in Dthat contain both X and Y (or X ∪ Y ). The support can also be considered as probabilityP(X ∪ Y ). The confidence of the ARs is the ratio of transactions in D containing X that alsocontains Y . The confidence can also be considered as conditional probability P(Y |X). ARsthat satisfy the minimum support and confidence thresholds are said to be strong.
123

Mining critical least association rules
2.3 Correlation analysis
After the introduction of ARs, many researches including Brin et al. (1997) had realized thelimitation of the confidence-support framework. When utilizing this framework alone it isquite impossible to discover the interesting ARs. Therefore, the correlation measure can beused as a complementary measure together with this framework. This leads to correlationrules as:
A ⇒ B(supp, conf, corr) (1)
The correlation rule is a measure based on the minimum support, minimum confidenceand correlation between itemsets A and B. There are many correlation measures applicablefor ARs. One of the simplest correlation measures is lift. The occurrence of itemset A isindependent of the occurrence of itemset B if P(A ∪ B) = P(A)P(B); otherwise itemset Aand B are dependent and correlated. The lift between occurrence of itemset A and B can bedefined as:
lift(A, B) = P(A ∩ B)
P(A)P(B)(2)
The equation of (4) can be derived to produce the following definition:
lift(A, B) = P(B|A)
P(B)(3)
or
lift(A, B) = conf(A ⇒ B)
supp(B)(4)
The strength of correlation is measured from the lift value. If lift(A, B) = 1 or P(B|A) =P(B)(or P(A|B) = P(B)) then B and A are independent and there is no correlation betweenthem. If lift(A, B) > 1 or P(B|A) > P(B)(or P(A|B) > P(B)), then A and B arepositively correlated, meaning the occurrence of one implies the occurrence of the other.If lift(A, B) < 1 or P(B|A) < P(B)(or P(A|B) < P(B)), then A and B are negativelycorrelated, meaning the occurrence of one discourages the occurrence of the other. Since thelift measure is not downward closed, it will definitely not suffer from the least item problem.Thus, least itemsets with low counts, which perchance occur a few times (or only once)together can produce enormous lift values.
2.4 Critical relative support
Definition 6 (Critical Relative Support). A critical relative support (CRS) is a formulationof maximizing relative frequency between itemset and their Jaccard similarity coefficient.
The value of Critical Relative Support denoted as CRS and
CRS(I ) = max
((supp(A)
supp(B)
),
(supp(B)
supp(A)
))×
(supp(A ⇒ B)
supp(A) + supp(B) − supp(A ⇒ B)
)
The CRS value is between 0 and 1, and is determined by multiplying the highest value, eithersupport of antecedent divide by consequence or alternatively with their Jaccard similaritycoefficient. This is a measurement to show the level of CRS between combinations of boththe least items and frequent items either as antecedent or consequence, respectively.
123

T. Herawan et al.
Table 1 A simple dataset oftransactions
TID Items
T1 a c m f p
T3 b f h j o
T4 b c k s p
T5 a f c e l p m n
2.5 FP-growth
Candidate set generation and tests are two major drawbacks in Apriori-like algorithms. There-fore, to deal with this problem, a new data structure called frequent pattern tree (FP-Tree)was introduced. FP-Growth was then developed based on this data structure, and, currently,is a benchmark and the fastest algorithm in mining frequent itemsets (Han et al. 2000). Theadvantages of FP-Growth are that it requires scanning the transaction database two times.Firstly, it scans the database to compute a list of frequent items sorted by descending orderand eliminates rare items. Secondly, it scans to compress the database into a FP-Tree structureand mines the FP-Tree recursively to build its conditional FP-Tree.
A simulation of data (Au and Chan 2003) is shown in Table 1. Firstly, the algorithmsorts the items in the transaction database with the infrequent items removed. Let us say aminimum support is set to 3, therefore alphabets f, c, a, b, m, p are only kept. The algorithmscans the entire transactions starting from T1 until T5. In T1, it prunes from {f, a, c, d, g,i, m, p} to {f, c, a, m, p, g}. Then, the algorithm compresses this transaction into the pre-fix tree in which f becomes the root. Each path on the tree represents a set of transactionswith the same prefix. This process will execute recursively until the end of the transac-tions. Once the complete tree has been built, then the next pattern mining can be easilyperformed.
2.6 SLP growth algorithm
2.6.1 Algorithm development
Determine interval support for least itemset Let I be a non-empty set such that I ={i1, i2, . . . , in}, and D is a database of transactions where each T is a set of items suchthat T ⊂ I An item is a set of items. A k-itemset is an itemset that contains k items. An item-set is said to be least if the support count satisfies in a range of threshold values called IntervalSupport (ISupp). The Interval Support is a form of ISupp (ISMin, ISMax) where ISMin is aminimum and ISMax is the maximum value, respectively, such that ISMin ≥ φ, ISMax>φandISMin ≤ ISMax. The set is denoted as Lk . Itemsets are said to be least significant if theysatisfy two conditions. First, support counts for all the items in the itemset that must begreater than ISMin. Second, those itemsets must consist of at least one of the least items. Inbrevity, the significant least itemset is a union between the least items and frequent items,and the existence of an intersection between them.
Construct significant least pattern tree A Significant Least Pattern Tree (SLP-Tree) is a com-pressed representation of significant least itemsets. This tree data structure is constructedby scanning the dataset of a single transaction at a time and then mapping onto a pathin the SLP-Tree. In the SLP-Tree construction, the algorithm constructs a SLP-Tree from
123

Mining critical least association rules
the database. The SLP-Tree is built with only the items that satisfy the ISupp. In the firststep, the algorithm scans all transactions to determine a list of least items, LItems and fre-quent items, FItems (least frequent item, LFItems). In the second step, all transactions aresorted in descending order and mapped against the LFItems. It is essential that the transac-tions consist of at least one of the least items, otherwise the transactions are disregarded.In the final step, a transaction is transformed into a new path or mapped into the exist-ing path. This final step continues until the end of the transactions. The problem of theexisting FP-Tree is that it may not fit into the memory and is expensive to build. The FP-Tree must be built completely from all the transactions before calculating the support foreach item. Therefore, the SLP-Tree is an alternative and more practical to overcome theselimitations.
Generate Least Pattern Growth ( LP-Growth) SLP-Growth is an algorithm that generatessignificant least itemsets from the SLP-Tree by exploring the tree based on a bottom-upstrategy. The ‘divide and conquer’ method is used to decompose the task into a smaller unitfor mining desired patterns in conditional databases, which can optimize the searching space.The algorithm will extract the prefix path sub-trees ending with any least item. In each of theprefix path sub-trees, the algorithm will recursively execute to extract all frequent itemsets,and, finally, build a conditional SLP-Tree. A list of least itemsets is then produced based onthe suffix sequence and also sequence in which they are found. The pruning process in theSLP-Growth is faster than in the FP-Growth since most of the unwanted patterns are alreadycut-off during the construction of the SLP-Tree data structure. The complete SLP-Growthalgorithm is shown in Fig. 1.
2.7 Weight assignment
Apply correlation The weighted ARs (ARs value) are derived from formula (4). This corre-lation formula is also known by lift. The processes of generating weighted ARs take placeafter all the patterns and ARs are completely produced.
Discovery of highly correlated least ARs From the list of weighted ARs, the algorithm willbegin to scan all of them. However, only those weighted ARs with a correlation value that ismore than one are captured and considered as highly correlated. ARs with a correlation lessthan one will be pruned and classified as low correlation.
2.8 Scenario on capturing rules
2.8.1 Dataset
The dataset was taken from a survey exploring four types of anxiety among engineeringstudents in Universiti Malaysia Pahang (Vitasari et al. 2010) . A total 770 students par-ticipated in this survey. The respondents were 770 students, consisting of 394 males and376 females. The respondents were undergraduate students from five engineering facultiesat Universiti Malaysia Pahang, i.e. 216 students from the Faculty of Chemical and NaturalResources Engineering (FCNRE), 105 students from the Faculty of Electrical and ElectronicEngineering (FEEE), 226 students from the Faculty of Mechanical Engineering (FME),178 students from the Faculty of Civil Engineering and Earth Resources (FCEER), and45 students from the Faculty of Manufacturing Engineering and Technology Management(FMETM).
123

T. Herawan et al.
1: Read dataset, D2: Set Interval Support (ISMin, ISMax)3: for items, I in transaction, T do4: Determine support count, ItemSupp5: end for loop6: Sort ItemSupp in descending order, ItemSuppDesc7: for ItemSuppDesc do8: Generate List of frequent items, FItems > ISMax9: end for loop10: for ItemSuppDesc do11: Generate List of least items, ISMin <= LItems < ISMax 12: end for loop13: Construct Frequent and Least Items, FLItems = FItems U LItems14: for all transactions,T do15: if (LItems I I in T > 0) then16: if (Items in T = FLItems) then17: Construct items in transaction in descending order, TItemsDesc18: end if19: end if20: end for loop21: for TItemsDesc do22: Construct SLP-Tree23: end for loop24: for all prefix SLP-Tree do25: Construct Conditional Items, CondItems26: end for loop27: for all CondItems do28: Construct Conditional SLP-Tree29: end for loop30: for all Conditional SLP-Tree do31: Construct Association Rules, AR32: end for loop33: for all AR do34: Calculate Support and Confidence35: Apply Correlation36: end for loop
Fig. 1 SLP-Growth algorithm
Table 2 Exam anxiety dataset Dataset Size (kb) # Transactions # Items
Exam anxiety 17 170 35
2.8.2 Exam anxiety
The survey’s findings indicate that exam anxiety among engineering students is manifestedthrough seven dimensions: (a) Lack of preparation, (b) Feel depressed after test, (c) Lostconcentration during exam, (d) Prepared for exam, (e) Do not understand the test question,(f) Important exam, and (g) Take a surprise test. For this, we have a dataset, which comprisesthe number of transactions (student), which is 770, and the number of items (attributes),which is 5 (refer to Table 2).
123

Mining critical least association rules
Table 3 Family anxiety dataset Dataset Size (kb) # Transactions # Items
Family anxiety 13 170 25
Table 4 Presentation anxietydataset
Dataset Size (kb) # Transactions # Items
Presentation anxiety 13 170 25
Table 5 Library anxiety dataset Dataset Size (kb) # Transactions # Items
Library anxiety 15 170 30
2.8.3 Family anxiety
Family anxiety among engineering students focuses on five dimensions: (a) Insufficientincome, (b) Childhood experiences, (c) Many members in family, (d) Parents disappointed,and (e) Family problems. For this, we have a dataset, which comprises the number of trans-actions (student), which is 770, and the number of items (attributes), which is 5 (refer toTable 3).
2.8.4 Presentation anxiety
Presentation anxiety among engineering students focuses on five dimensions: (a) Anxioustime presentation, (b) Lack of confidence, (c) Heart beating very fast, (d) Tongue tied, and(e) Felt that presentation did not contribute to your study. For this, we have a dataset, whichcomprises the number of transactions (student), which is 770, and the number of items(attributes), which is 5 (refer to Table 4).
2.8.5 Library anxiety
Library anxiety among engineering students focuses on six dimensions: (a) Unable to use thelibrary, (b) Lack of references, (c) Feel confused to find the references, (d) Feel uncomfortablein the library, (e) Library is unimportant, and (f) Library staff are unwilling to assist. For this,we have a dataset, which comprises the number of transactions (student), which is 770, andthe number of items (attributes), which is 5 (refer to Table 5).
2.8.6 Design
The design for capturing interesting rules on students suffering study anxiety is described inFig. 2 as follow.
In order to capture the interesting rules and make a decision, the experiment using SLP-Growth method was conducted on Intel� CoreTM 2 Quad CPU at 2.33 GHz speed with 4 GBmain memory, running on Microsoft Windows Vista. The algorithm was developed using C#as a programming language. The study anxiety datasets used and the SLP-Growth producedin this model were in a flat file format.
123
T. Herawan et al.
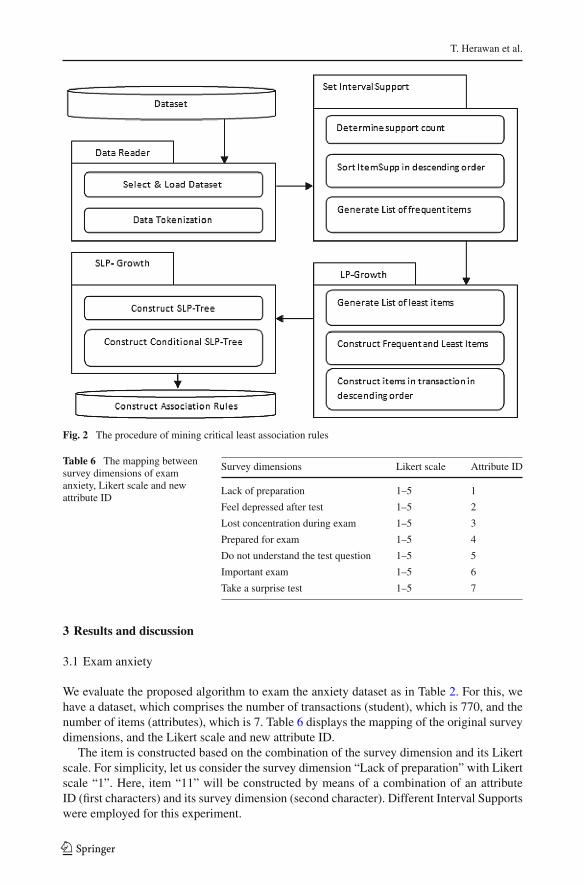
Fig. 2 The procedure of mining critical least association rules
Table 6 The mapping betweensurvey dimensions of examanxiety, Likert scale and newattribute ID
Survey dimensions Likert scale Attribute ID
Lack of preparation 1–5 1
Feel depressed after test 1–5 2
Lost concentration during exam 1–5 3
Prepared for exam 1–5 4
Do not understand the test question 1–5 5
Important exam 1–5 6
Take a surprise test 1–5 7
3 Results and discussion
3.1 Exam anxiety
We evaluate the proposed algorithm to exam the anxiety dataset as in Table 2. For this, wehave a dataset, which comprises the number of transactions (student), which is 770, and thenumber of items (attributes), which is 7. Table 6 displays the mapping of the original surveydimensions, and the Likert scale and new attribute ID.
The item is constructed based on the combination of the survey dimension and its Likertscale. For simplicity, let us consider the survey dimension “Lack of preparation” with Likertscale “1”. Here, item “11” will be constructed by means of a combination of an attributeID (first characters) and its survey dimension (second character). Different Interval Supportswere employed for this experiment.
123
Mining critical least association rules
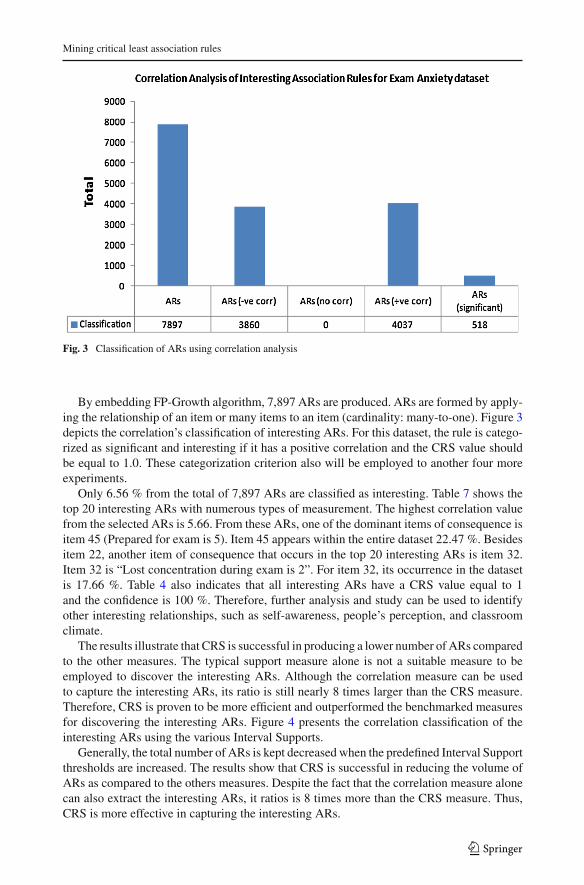
Fig. 3 Classification of ARs using correlation analysis
By embedding FP-Growth algorithm, 7,897 ARs are produced. ARs are formed by apply-ing the relationship of an item or many items to an item (cardinality: many-to-one). Figure 3depicts the correlation’s classification of interesting ARs. For this dataset, the rule is catego-rized as significant and interesting if it has a positive correlation and the CRS value shouldbe equal to 1.0. These categorization criterion also will be employed to another four moreexperiments.
Only 6.56 % from the total of 7,897 ARs are classified as interesting. Table 7 shows thetop 20 interesting ARs with numerous types of measurement. The highest correlation valuefrom the selected ARs is 5.66. From these ARs, one of the dominant items of consequence isitem 45 (Prepared for exam is 5). Item 45 appears within the entire dataset 22.47 %. Besidesitem 22, another item of consequence that occurs in the top 20 interesting ARs is item 32.Item 32 is “Lost concentration during exam is 2”. For item 32, its occurrence in the datasetis 17.66 %. Table 4 also indicates that all interesting ARs have a CRS value equal to 1and the confidence is 100 %. Therefore, further analysis and study can be used to identifyother interesting relationships, such as self-awareness, people’s perception, and classroomclimate.
The results illustrate that CRS is successful in producing a lower number of ARs comparedto the other measures. The typical support measure alone is not a suitable measure to beemployed to discover the interesting ARs. Although the correlation measure can be usedto capture the interesting ARs, its ratio is still nearly 8 times larger than the CRS measure.Therefore, CRS is proven to be more efficient and outperformed the benchmarked measuresfor discovering the interesting ARs. Figure 4 presents the correlation classification of theinteresting ARs using the various Interval Supports.
Generally, the total number of ARs is kept decreased when the predefined Interval Supportthresholds are increased. The results show that CRS is successful in reducing the volume ofARs as compared to the others measures. Despite the fact that the correlation measure alonecan also extract the interesting ARs, it ratios is 8 times more than the CRS measure. Thus,CRS is more effective in capturing the interesting ARs.
123

T. Herawan et al.
Table 7 Top 20 highest correlations of interesting association rules sorted in descending order of correlation
No. Association rules Supp Conf Corr CRS
1 44 54 23 15 → 63 0.13 100 3.91 1.00
2 44 34 23 15 → 63 0.26 100 3.91 1.00
3 54 33 15 75 → 65 0.91 100 4.05 1.00
4 33 43 15 75 → 65 0.26 100 4.05 1.00
5 54 23 73 15 → 65 0.13 100 4.05 1.00
6 23 43 63 75 → 13 0.13 100 4.30 1.00
7 54 33 63 75 → 13 0.13 100 4.30 1.00
8 34 53 73 65 → 13 0.13 100 4.30 1.00
9 34 23 73 15 → 45 0.13 100 4.45 1.00
10 14 34 23 75 → 45 0.26 100 4.45 1.00
11 33 53 75 13 → 45 0.13 100 4.45 1.00
12 33 23 73 65 → 45 0.13 100 4.45 1.00
13 74 34 65 13 → 45 0.13 100 4.45 1.00
14 53 75 65 13 → 45 0.26 100 4.45 1.00
15 34 53 23 65 → 45 0.13 100 4.45 1.00
16 23 65 13 45 → 32 0.13 100 5.66 1.00
17 53 23 43 65 → 32 0.26 100 5.66 1.00
18 14 23 43 75 → 32 0.39 100 5.66 1.00
19 44 54 23 15 → 32 0.13 100 5.66 1.00
20 54 23 73 15 → 32 0.13 100 5.66 1.00
Fig. 4 Correlation analysis of interesting ARs using a variety of Interval Supports
123

Mining critical least association rules
Table 8 The mapping betweensurvey dimensions of socialanxiety, Likert scale and newattribute ID
Survey dimensions Likert scale Attribute ID
Insufficient income 1–5 1
Childhood experiences 1–5 2
Many members in family 1–5 3
Parents disappointed 1–5 4
Family problems 1–5 7
Fig. 5 Classification of ARs using correlation analysis
3.2 Family anxiety
The second experiment was done to the family anxiety dataset as in Table 3. To this, wealso have the same number of transactions (student) and the number of items (attributes)is 5. Table 8 displays the mapping of the original survey dimensions, Likert scale and newattribute ID.
The construction of the item is similar to that performed on the exam anxiety dataset. Forthis experiment, different Interval Supports were used. By embedding FP-Growth algorithm,1,938 ARs are produced. Again, ARs are formed by applying the relationship of an item ormany items to an item (cardinality: many-to-one). Figure 5 shows the correlation’s classifi-cation of interesting ARs. For this dataset, the evaluation of the significance of the interestingrules is similar to the previous experiment.
Only 2.01 % from the total of 1,938 ARs are classified as interesting ARs. Table 9 shows thetop 20 interesting ARs with numerous types of measurement. The highest correlation valuefrom the selected ARs is 6.94. From these ARs, two dominant items of consequence are item21 (Childhood experiences is 1) and item 51 (Family problems is 1), respectively. From theentire dataset, item 21 only occurs about 1.43 % compared to item 51, which appears about14.29 %. Table 9 also shows that all interesting ARs have a CRS value equal to 1. Therefore,
123

T. Herawan et al.
Table 9 Top 20 highest correlations of interesting association rules sorted in descending order of correlation
No. Association rules Supp Conf Corr CRS
1 43 31 13 54 → 24 0.26 100 4.350282 1
2 43 31 54 14 → 24 0.26 100 4.350282 1
3 31 23 54 14 → 44 0.13 100 4.400000 1
4 43 31 23 54 → 12 0.13 100 4.502924 1
5 43 32 24 12 → 52 0.26 100 4.583333 1
6 43 31 24 12 → 52 0.13 100 4.583333 1
7 32 14 24 52 → 42 0.26 100 4.638554 1
8 31 53 24 12 → 42 0.13 100 4.638554 1
9 43 31 54 11 → 21 0.13 100 6.936937 1
10 43 53 32 11 → 21 0.13 100 6.936937 1
11 31 44 52 11 → 21 0.13 100 6.936937 1
12 31 14 44 52 → 21 0.13 100 6.936937 1
13 31 53 42 11 → 21 0.13 100 6.936937 1
14 32 52 42 11 → 21 0.13 100 6.936937 1
15 32 24 11 → 51 0.13 100 7.623762 1
16 31 13 22 42 → 51 0.13 100 7.623762 1
17 23 32 44 11 → 51 0.13 100 7.623762 1
18 43 31 22 11 → 51 0.52 100 7.623762 1
19 31 13 42 21 → 51 0.26 100 7.623762 1
20 32 24 42 11 → 51 0.13 100 7.623762 1
further analysis and study can be used to identify other interesting relationships, such asacademic performance, personality and attitude. Table 9 displays the correlation analysisbased on several Interval Supports (Fig. 6).
Generally, the total numbers of ARs are kept decreased when the predefined Interval Sup-port thresholds are increased. The results illustrate that CRS is also successful in extractinga lower number of ARs compared to the other measures. It also indicates that the singlemeasure alone is not a suitable measure to be used in mining interesting ARs. Although, cor-relation measure can be used to capture the interesting ARs, its ratio is still 28 times largerthan the CRS measure. Therefore, CRS is proven to be more appropriate for discovering theinteresting ARs.
3.3 Presentation anxiety
The third experiment was done to the presentation anxiety dataset, as in Table 10. To this,we also have the same number of transactions (student) and the number of items (attributes)is 5. Table 10 displays the mapping of the original survey dimensions, Likert scale and newattribute ID.
The construction of the item is similar to that performed to the exam and family anxietydatasets. In this experiment, different Interval Supports were also used. By embedding theFP-Growth algorithm, 1,422 ARs are captured. Again, ARs are formed by applying therelationship of an item or many items to an item (cardinality: many-to-one). Figure 7 showsthe correlation’s classification of interesting ARs using the several Interval Supports. For this
123

Mining critical least association rules
Fig. 6 Correlation analysis of interesting ARs using variety Interval Supports
Table 10 The mapping betweensurvey dimensions of socialanxiety, Likert scale and newattribute ID
Survey dimensions Likert scale Attribute ID
Anxious time presentation 1–5 1
Lack of confidence 1–5 2
Heart beating very fast 1–5 3
Tongue tied 1–5 4
Felt that presentation did notcontribute to your study
1–5 5
dataset, the evaluation of the significances of the interesting rules is similar to the previousexperiments.
From the total of 1,422 ARs, only 2.39 % are classified as interesting ARs. Table 11 showsthe top 20 interesting ARs with numerous measurements. The highest correlation value fromthe selected ARs is 8.95. From these ARs, one of the dominant items of consequence isitem 12 (Lack of confidence is 2). In fact, item 12 only appears 12.99 % in the entire dataset.Besides item 12, another item of consequence that occurs in the top 20 interesting ARs is item25. Item 25 is “Lack of confidence is 5”. For item 25, it appears around 13.25 %. Table 11 alsoshows that all interesting ARs have a CRS value equal to 1. Therefore, further analysis andstudy can be used to identify other interesting relationships, such as environmental, medical,and genetics. Figure 8 depicts the correlation analysis of ARs against a few Interval Supports,
Generally, the total number of ARs decreases when the predefined Interval Supportsthresholds are increased. The results also illustrate that CRS is successful in generatingfewer ARs compared to the others measures. Although the correlation measure can be usedto capture the interesting ARs, its ratio is still 19 times larger than the CRS measure. Therefore,CRS is proven to be more practical in extracting the interesting ARs.
123

T. Herawan et al.
Fig. 7 Classification of ARs using correlation analysis
Table 11 Top 20 highestcorrelations of interestingassociation rules sorted indescending order of correlation
No. Association rules Supp Conf Corr CRS
1 14 22 45 → 32 0.13 100 8.95 1
2 53 14 22 → 32 0.26 100 8.95 1
3 53 14 44 22 → 32 0.13 100 8.95 1
4 53 14 42 22 → 32 0.13 100 8.95 1
5 13 54 42 22 → 32 0.26 100 8.95 1
6 34 42 25 → 12 0.13 100 7.70 1
7 53 34 42 22 → 12 0.13 100 7.70 1
8 53 44 35 22 → 12 0.13 100 7.70 1
9 33 54 42 22 → 12 0.26 100 7.70 1
10 34 54 42 25 → 12 0.13 100 7.70 1
11 42 25 → 12 0.13 100 7.70 1
12 54 42 25 → 12 0.13 100 7.70 1
13 34 44 52 15 → 25 0.26 100 7.55 1
14 34 52 15 → 25 0.39 100 7.55 1
15 34 43 52 15 → 25 0.13 100 7.55 1
16 44 52 35 15 → 25 0.26 100 7.55 1
17 44 54 35 15 → 25 0.13 100 7.55 1
18 34 44 54 15 → 25 0.26 100 7.55 1
19 14 54 35 25 → 45 0.39 100 7.55 1
20 14 52 35 25 → 45 0.39 100 7.55 1
3.4 Library anxiety
The fourth experiment was done on the Library anxiety dataset, as in Table 12. For this, wealso have the same number of transactions (student) and the number of items (attributes) is 7.
123

Mining critical least association rules
Fig. 8 Correlation analysis of interesting ARs using variety Interval Supports
Table 12 The mapping betweensurvey dimensions of socialanxiety, Likert scale and newattribute ID
Survey dimensions Likert scale Attribute ID
Unable to use the library 1–5 1
Lack of references 1–5 2
Feel confused to find the references 1–5 3
Feel uncomfortable in the library 1–5 4
Library is unimportant 1–5 5
Library staff are unwilling to assist 1–5 6
Table 12 displays the mapping of the original survey dimensions, the Likert scale and newattribute ID.
The construction of the item is similar to that performed to previous datasets. For thisexperiment, different Interval Supports were also employed. By embedding the FP-Growthalgorithm, 4,933 ARs are extracted. Again, ARs are formed by applying the relationship ofan item or many items to an item (cardinality: many-to-one). Figure 9 shows the correlationclassification of interesting ARs. For this dataset, the evaluation of the significance of theinteresting rules is similar to the previous experiments.
Only 3.89 % from the total of 4,933 ARs are classified as interesting ARs. Table 13 showsthe top 20 interesting ARs with numerous types of measurement. The highest correlationvalue from the selected ARs is 9.51. From these ARs, there is only one dominant item ofconsequence, item 61 (Library staff is unwilling to assist is 1). In fact, item 61 only appears10.52 % from the entire dataset. Table 13 also shows that all interesting ARs have a CRSvalue equal to 1. Therefore, further analysis and study can be used to identify other interestingrelationships, such as hostel facilities, internet connectivity, and friendship. Figure 10 presentsthe correlation analysis of ARs according to variety of the Interval Supports.
123

T. Herawan et al.
Fig. 9 Classification of ARs using correlation analysis
Table 13 Top 20 highestcorrelations of interestingassociation rules sorted indescending order of correlation
No. Association rules Supp Conf Corr CRS
1 32 14 51 41 → 61 0.13 100 9.51 1.00
2 23 12 44 51 → 61 0.13 100 9.51 1.00
3 14 51 21 41 → 61 0.13 100 9.51 1.00
4 32 44 51 → 61 0.13 100 9.51 1.00
5 34 52 11 21 → 61 0.13 100 9.51 1.00
6 42 32 11 51 → 61 0.26 100 9.51 1.00
7 43 13 34 21 → 61 0.13 100 9.51 1.00
8 23 52 32 11 → 61 0.13 100 9.51 1.00
9 33 24 54 11 → 61 0.13 100 9.51 1.00
10 23 33 44 51 → 61 0.13 100 9.51 1.00
11 14 21 41 → 61 0.13 100 9.51 1.00
12 13 34 51 21 → 61 0.13 100 9.51 1.00
13 14 24 41 → 61 0.13 100 9.51 1.00
14 14 24 51 → 61 0.13 100 9.51 1.00
15 14 24 51 41 → 61 0.13 100 9.51 1.00
16 33 42 51 21 → 61 0.13 100 9.51 1.00
17 13 22 51 41 → 61 0.13 100 9.51 1.00
18 34 52 21 41 → 61 0.13 100 9.51 1.00
19 34 12 51 21 → 61 0.13 100 9.51 1.00
20 12 54 21 → 61 0.13 100 9.51 1.00
Generally, the total number of ARs decreases when the predefined Interval Supportsthresholds increase. The results also show that CRS successfully produced the lowest num-ber of ARs compared to the other measures. The support measure alone is not a suitablemeasure to be employed to discover the interesting ARs. Although, the correlation measure
123

Mining critical least association rules
Fig. 10 Correlation analysis of interesting ARs using variety Interval Supports
can be used to capture the interesting ARs, its ratio is still 13 times larger than the CRSmeasure. Therefore, CRS is proven to be more suitable and scalable in mining the interestingARs.
4 Conclusion
Many educators find themselves overwhelmed with students suffering anxiety data, but lackthe information they need to make informed decisions. Currently, there is an increasinginterest in data mining and educational systems, making educational data mining a newgrowing research community (Romero and Ventura 2007). One of the popular data miningmethods is Association Rules Mining (ARM). In this paper, we have successfully appliedan enhanced association rules mining method, the so called SLP-Growth (significant leastpattern growth) proposed by (Abdullah et al. 2010a), for capturing interesting rules in studentssuffering study anxiety datasets. The datasets were taken from a survey exploring anxietypertaining to exams, family, presentation and library among engineering students in UniversitiMalaysia Pahang (UMP). A total of 770 students participated in this survey. The respondentscomprise 394 males and 376 females. The respondents are undergraduate students from fiveengineering faculties at Universiti Malaysia Pahang. It is found that the SLP_Growth methodis suitable to mine the interesting rules that provide faster and accurate results. Based on theresults, educators can obtain recommendations from the rules captured. The results of thisresearch will provide useful information for educators to make a decision on their studentsmore accurately, and to adapt their teaching strategies accordingly. The obtained findingscan also be helpful in assisting students to handle their fear and anxiety, and in increasingthe quality of the learning.
Acknowledgments The authors would like to thank the University of Malaya for supporting this workthrough UMRG RP002F-13ICT.
123

T. Herawan et al.
References
Abdullah, Z., Herawan, T., Deris, M.M.: Mining Significant Least Association Rules using Fast SLP-GrowthAlgorithm. In: Kim, T.H., Adeli, H. (eds.) AST/UCMA/ISA/ACN 2010. Lecture Notes in ComputerScience, vol. 6059, pp. 324–336. Springer, New York (2010a)
Abdullah, Z., Herawan, T., Deris, M.M.: Scalable Model for Mining Critical Least Association Rules. In: Zhu,R. et al. ICICA 2010. Lecture Notes in Computer Science, vol. 6377, pp. 509–516. Springer, New York(2010b)
Abdullah, Z., Herawan, T., Deris, M.M.: Visualizing the Construction of Incremental Disorder Trie ItemsetData Structure (DOSTrieIT) for Frequent Pattern Tree (FP-Tree). In: Zaman, H.B. et al. (eds.) IVIC 2011.Lecture Notes in Computer Science, vol. 7066, pp. 183–195. Springer, Heidelberg (2011a)
Abdullah, Z., Herawan, T., Noraziah, A., Deris, M.M.: Extracting highly positive association rules fromstudents’ enrolment data. Proc. Soc. Behav. Sci. 28, 107–111 (2011b)
Abdullah, Z., Herawan, T., Noraziah, A., Deris, M.M.: Mining significant association rules from educationaldata using critical relative support approach. Proc. Soc. Behav. Sci. 28, 97–101 (2011c)
Aggarwal, C.C., Yu, P.S.: A New Framework for Item Set Generation. In: Proceedings of the SeventeenthACM SIGACT-SIGMOD-SIGART Symposium on Principles of Database Systems, pp. 18–24 (1998)
Agrawal, R., Srikant, R.: Fast Algorithms for Mining Association Rules. In: Proceedings of the 20th Interna-tional Conference on Very Large Data Bases (VLDB) 1994, pp. 487–499 (1994)
Agrawal, R., Imielinski, T., Swami, A.: Database mining: a performance perspective. IEEE Trans. Knowl.Data Eng. 5(6), 914–925 (1993a)
Agrawal, R., Imielinski, T., Swami, A.: Mining Association Rules Between Sets of Items in Large Databases.In: Proceedings of the ACM SIGMOD International Conference on the Management of Data, pp. 207–216(1993b)
Au, W.H., Chan, K.C.C.: Mining Fuzzy ARs in a bank-account database. IEEE Trans. Fuzzy Syst. 11(2),238–248 (2003)
Bouras, N., Holt, G.: Psychiatric and Behavioural Disorders in Intellectual and Developmental Disabilities,2nd edn. Cambridge University Press, Cambridge (2007)
Brin, S., Motwani, R., Silverstein, C.: Beyond Market Basket: Generalizing ARs to Correlations. In: Proceed-ings of the 1997 ACM-SIGMOD International Conference on the Management of Data (SIGMOD’97),pp. 265–276 (1997)
Ceglar, A.: Association mining. ACM Comput. Surv. 38(2), 1–42 (2006)Davison, C.G., Neale, J.M., Kring, A.M.: Abnormal Psychology. Veronica Visentin, Toronto (2008)Ding, J.: Efficient association rule mining among infrequent items. Ph.D Thesis, University of Illinois at
Chicago (2005)Han, J., Kamber, M.: Data Mining: Concepts and Techniques, 2nd edn. Morgan Kaufmann, San Mateo (2006)Han, J., Pei, H., Yin, Y.: Mining Frequent Patterns Without Candidate Generation. In: Proceedings of the 2000
ACM SIGMOD International Conference on Management of Data (SIGMOD’00), pp. 1–12 (2000)Herawan, T., Vitasari, P., Abdullah, Z.: Mining Interesting Association Rules of Student Suffering Mathematics
Anxiety. In: Zain, J.M. et al. (eds.) ICSECS 2011, Communication of Computer and Information Sciences,vol. 188, part II, pp. 495–508 (2011)
Herawan, T., Yanto, I.T.R., Deris, M.M.: SMARViz: Soft Maximal Association Rules Visualization. In: BadiozeZaman, H. et al. (eds.): IVIC 2009. Lecture Notes in Computer Science, vol. 5857, pp. 664–674. Springer-Verlag, New York (2009)
Koh, Y.S., Rountree, N.: Finding Sporadic Rules Using Apriori-Inverse. In: Ho et al. (eds) PAKDD 2005.Lecture Notes in Computer Science, vol. 3518, pp. 97–106. Springer-Verlag, Heidelberg (2005)
Lee, Y.-K., Kim, W.-Y., Cai, Y.D., Han, J.: CoMine: Efficient Mining of Correlated Patterns. In: Proceedingof 2003 International Conference on Data Mining (ICDM’03), pp. 581–584. IEEE Computer Society,Melbourne (2003)
Li, H., Wang, Y., Zhang, D., Zhang, M., Chang, E.Y.: Pfp: Parallel Fp-Growth for Query Recommendation.In: Proceedings of the 2008 ACM Conference on Recommender Systems (RecSys’08), pp. 107–114.Springer, New York (2008)
Liu, B., Hsu, W., Ma, Y.: Mining Association Rules with Multiple MinimumSupports. In: Proceedings of theFifth ACM SIGKDD International Conference on Knowledge Discovery and Data Mining, pp. 337–341.ACM Press, New York (1999)
Mustafa, M.D., Nabila, N.F., Evans, D.J., Saman, M.Y., Mamat, A.: Association rules on significant rare datausing second support. Int. J. Comput. Math. 83(1), 69–80 (2006)
Omniecinski, E.: Alternative interest measures for mining associations. IEEE Trans. Knowl. Data Eng. 15,57–69 (2003)
123
Mining critical least association rules
Romero, C., Ventura, S.: Educational data mining: a survey from 1995 to 2005. Expert Syst. Appl. 33, 135–146(2007)
Spielberger, C.D., Vagg, P.R.: Test anxiety: a transactional process model. In: Spielberger, et al. (eds.) TestAnxiety: Theory, Assessment, and Treatment, pp. 1–14. Taylor & Francis, Washington, DC (1995)
Vitasari, P., Wahab, M.N.A., Othman, A., Herawan, T., Sinnadurai, S.K.: The relationship between studyanxiety and academic performance among engineering students. Proc. Soc. Behav. Sci. 8, 490–497(2010)
Vitasari, P., Wahab, M.N.A., Othman, A., Herawan, T., Sinnadurai, S.K.: Representation of social anxietyamong engineering students. Proc. Soc. Behav. Sci. 30, 620–624 (2011)
Yun, H., Ha, D., Hwang, B., Ryu, K.H.: Mining association rules on significant rare data using relative support.J. Syst. Softw. 67(3), 181–191 (2003)
Zhou, L., Yau, S.: Association Rule and Quantitative Association Rule Mining Among Infrequent Items. In:Proceeding of the 8th International Workshop on Multimedia Data Mining (MDM) in Conjunction withACM SIGKDD’07 (2007)
123
Copyright © 2022 FDOKUMEN