Mid Year 2018 Full Report DRAFT v.2.xlsx - OC Health Care ...
22
-
Upload
khangminh22 -
Category
Documents
-
view
2 -
download
0
Transcript of Mid Year 2018 Full Report DRAFT v.2.xlsx - OC Health Care ...


SECTION 1.1
9-1-1 EMERGENCY AMBULANCEMid - Year Compliance Report
July - December 2018ALL REGIONS
2/26/20199:27 AM

Mid-Year Ambulance Contract Response Time Compliance - Contract Standard is 90%
REGION A REGION B REGION C REGION D REGION E90 194 280 103 175
$3,590.00 $5,195.00 $10,095.00 $2,585.00 $5,095.00
$758.75 $1,126.00 $2,329.50 $258.50 $704.50
91-92%92.01-93%93.01-94%94.01-95%95.01-96%96.01-97%97.01-98%
98.01+
20%
SECTION 1.2
$5,177.25
75%65%
Penalty Assessments
90%80%
Response Time Compliance & Penalty Assessments
Penalty Assessment TOTAL
842
$26,560.00
9-1-1 EMERGENCY AMBULANCE
ASSESSMENT DETAILS JULY-DECEMBERLATE RUNS
50%
10%% Compliance Credit
Performance Credits
Mid - Year Compliance Report
ALL REGIONSJuly - December 2018
$5,177.25PENALTIES ASSESSED
30%
FINAL ASSESSMENT
Performance Credit OffsetFor each designated EOA in which the CONTRACTOR'S compliance with the Response Time Standard exceeds ninety percent (90%) in eachcalendar month, performance credits shall be applied against the total penalties for Per Call Response Time Penalties. For the purpose of performancecredits, Response Time Compliance for each calendar month shall be based on the overall average of all Response Times for all code priorities andgeographical zones within EOAs for that month. Performance credits shall be allocated each calendar month. The table "Performance Credits" (below), foundin Exhibit A, Section IV., Table 5, demonstrates the performance credit earned for each percentage exceeding the ninety percent (90%) Response Time
July August September October November DecemberAverage of Region A 97.77% 97.58% 97.01% 97.08% 96.79% 97.34%Average of Region B 97.75% 97.42% 96.54% 97.91% 97.06% 96.19%Average of Region C 97.43% 96.83% 96.53% 96.96% 97.65% 97.59%Average of Region D 98.93% 98.59% 98.70% 98.81% 98.48% 98.97%Average of Region E 97.54% 98.00% 98.19% 98.34% 98.19% 98.11%All Region Combined Average 97.88% 97.69% 97.45% 97.88% 97.79% 97.75%
96.00%96.50%97.00%97.50%98.00%98.50%99.00%99.50%
* Penalty reflects penalty assessments after all exception and exemption requests have been processed. **Final Assessment reflects the assessments due after performance credit is calculated and applied. The performance credit is calculated based on compliance percentage. The table for the calculations is based on the agreed upon contract in Exhibit A, Section IV., Table 5 "Performance Credits".
Final Penalty AssessmentDuring the final assessment, all performance credits are applied to the original penalty amount. For example, if a total penalty assessment is equal to $2,500,and an ambulance service provider achieves a performance credit of 90%, the final assessment is $250. This final assessment is the invoiced amount labeled"Total Penalties Assessed" on the Penalty Assessment Invoice.
2/26/20199:23 AM
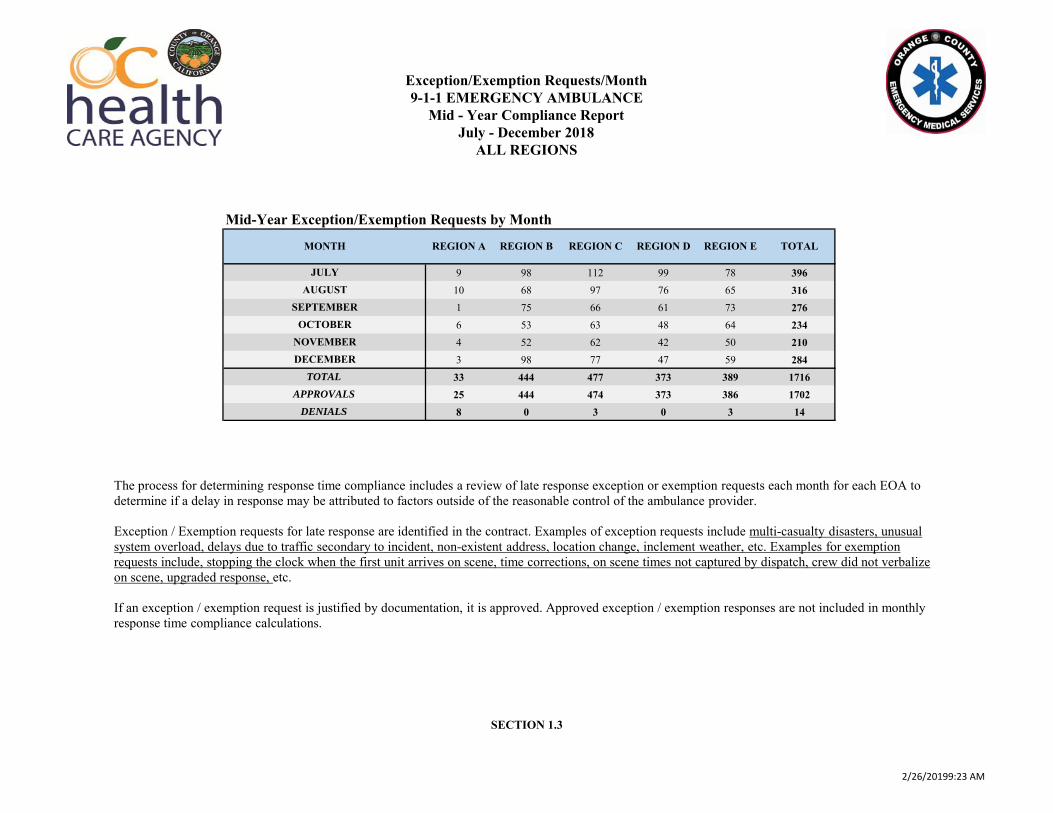
Mid-Year Exception/Exemption Requests by Month
9 98 112 99 78 39610 68 97 76 65 3161 75 66 61 73 2766 53 63 48 64 2344 52 62 42 50 2103 98 77 47 59 284
33 444 477 373 389 171625 444 474 373 386 17028 0 3 0 3 14
DECEMBER
APPROVALSDENIALS
TOTAL
9-1-1 EMERGENCY AMBULANCE
ALL REGIONS
REGION C
NOVEMBER
July - December 2018Mid - Year Compliance Report
Exception/Exemption Requests/Month
REGION AMONTH
JULY
SECTION 1.3
AUGUST
OCTOBER
REGION E TOTALREGION DREGION B
SEPTEMBER
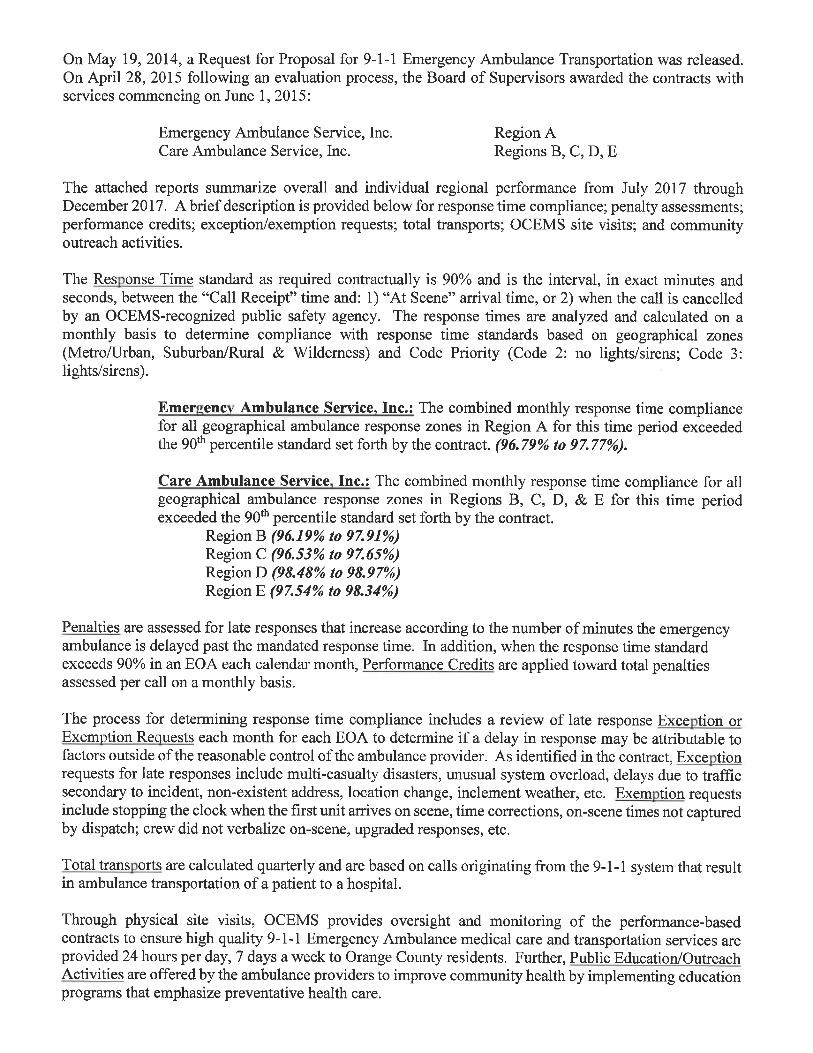
The process for determining response time compliance includes a review of late response exception or exemption requests each month for each EOA to determine if a delay in response may be attributed to factors outside of the reasonable control of the ambulance provider.
Exception / Exemption requests for late response are identified in the contract. Examples of exception requests include multi-casualty disasters, unusual system overload, delays due to traffic secondary to incident, non-existent address, location change, inclement weather, etc. Examples for exemption requests include, stopping the clock when the first unit arrives on scene, time corrections, on scene times not captured by dispatch, crew did not verbalize on scene, upgraded response, etc.
If an exception / exemption request is justified by documentation, it is approved. Approved exception / exemption responses are not included in monthly response time compliance calculations.
2/26/20199:23 AM
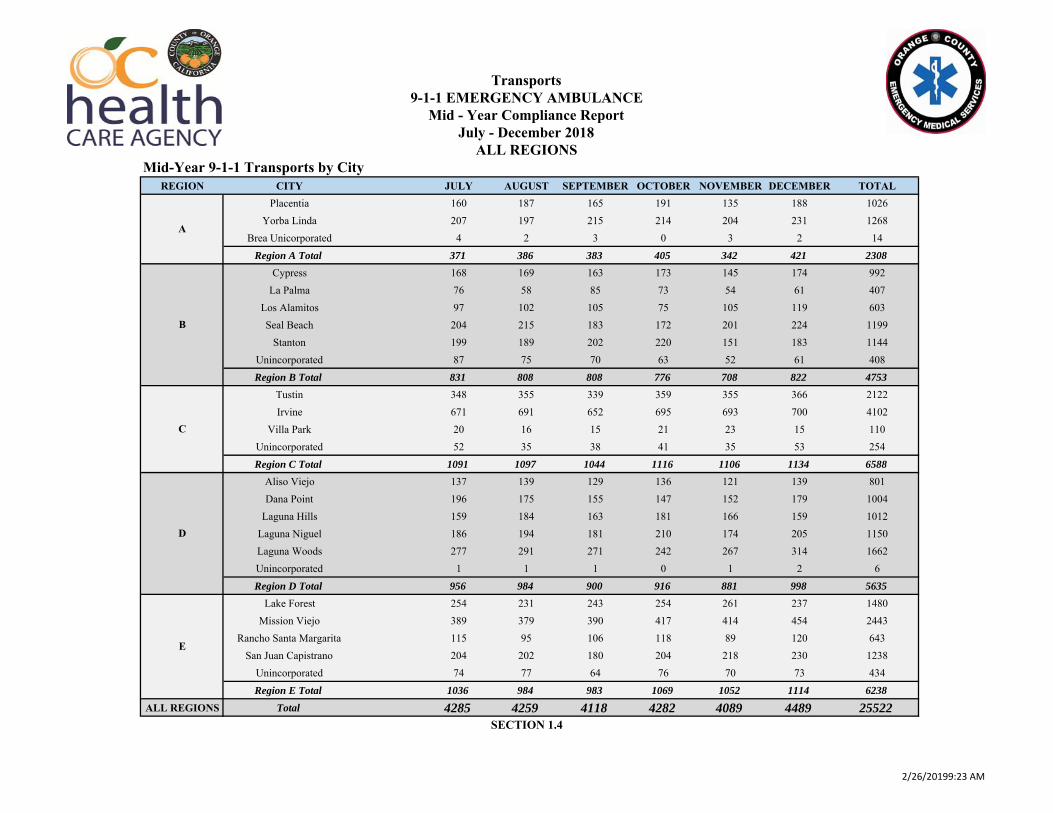
Mid-Year 9-1-1 Transports by CityREGION CITY JULY AUGUST SEPTEMBER OCTOBER NOVEMBER DECEMBER TOTAL
Placentia 160 187 165 191 135 188 1026Yorba Linda 207 197 215 214 204 231 1268
Brea Unicorporated 4 2 3 0 3 2 14
Region A Total 371 386 383 405 342 421 2308Cypress 168 169 163 173 145 174 992
La Palma 76 58 85 73 54 61 407Los Alamitos 97 102 105 75 105 119 603Seal Beach 204 215 183 172 201 224 1199
Stanton 199 189 202 220 151 183 1144Unincorporated 87 75 70 63 52 61 408
Region B Total 831 808 808 776 708 822 4753Tustin 348 355 339 359 355 366 2122Irvine 671 691 652 695 693 700 4102
Villa Park 20 16 15 21 23 15 110Unincorporated 52 35 38 41 35 53 254
Region C Total 1091 1097 1044 1116 1106 1134 6588Aliso Viejo 137 139 129 136 121 139 801Dana Point 196 175 155 147 152 179 1004
Laguna Hills 159 184 163 181 166 159 1012Laguna Niguel 186 194 181 210 174 205 1150Laguna Woods 277 291 271 242 267 314 1662Unincorporated 1 1 1 0 1 2 6
Region D Total 956 984 900 916 881 998 5635Lake Forest 254 231 243 254 261 237 1480
Mission Viejo 389 379 390 417 414 454 2443Rancho Santa Margarita 115 95 106 118 89 120 643
San Juan Capistrano 204 202 180 204 218 230 1238Unincorporated 74 77 64 76 70 73 434
Region E Total 1036 984 983 1069 1052 1114 6238ALL REGIONS Total 4285 4259 4118 4282 4089 4489 25522
9-1-1 EMERGENCY AMBULANCEMid - Year Compliance Report
Transports
SECTION 1.4
A
E
B
C
D
July - December 2018ALL REGIONS
2/26/20199:23 AM
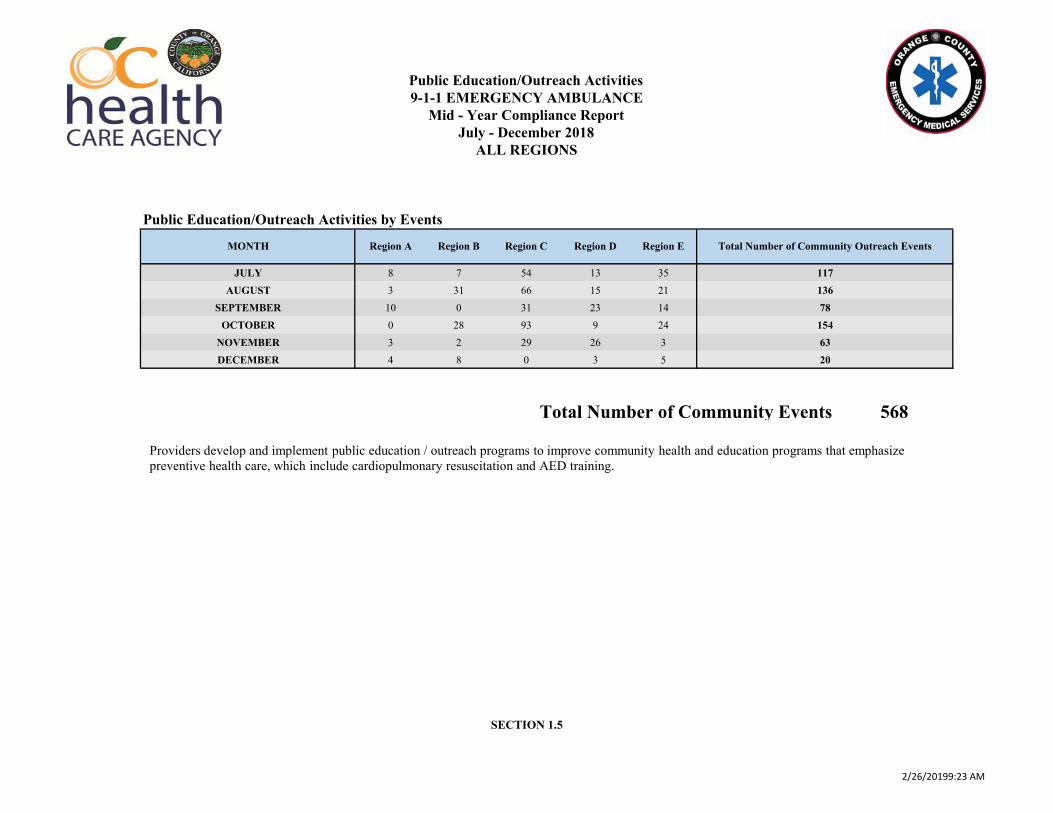
Public Education/Outreach Activities by Events
8 7 54 13 353 31 66 15 21
10 0 31 23 140 28 93 9 243 2 29 26 34 8 0 3 5
Public Education/Outreach Activities
ALL REGIONS
MONTH Region ERegion DRegion CRegion BRegion A
NOVEMBER
Total Number of Community Outreach Events
117
DECEMBER
Total Number of Community Events 568
136JULY
AUGUST
SECTION 1.5
July - December 2018Mid - Year Compliance Report
9-1-1 EMERGENCY AMBULANCE
SEPTEMBEROCTOBER
781546320
Providers develop and implement public education / outreach programs to improve community health and education programs that emphasize preventive health care, which include cardiopulmonary resuscitation and AED training.
2/26/20199:23 AM

REGION A
SECTION 2.1
9-1-1 EMERGENCY AMBULANCEMid - Year Compliance Report
July - December 2018
2/26/20199:27 AM
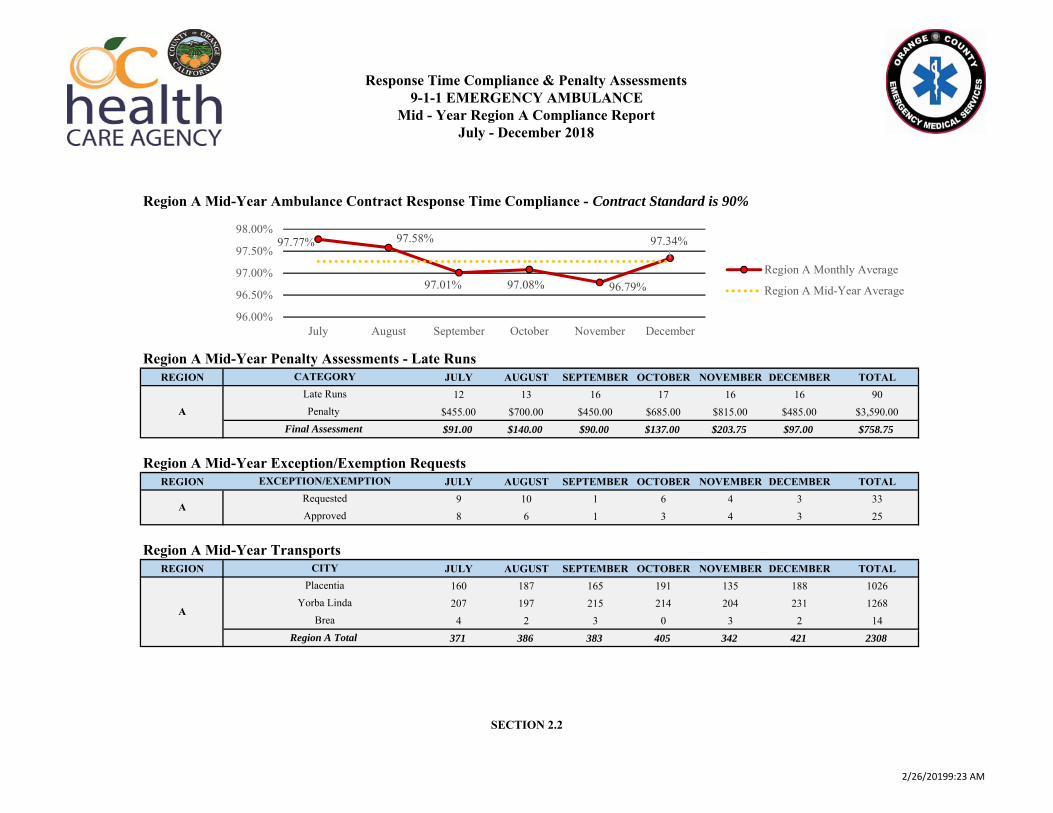
Region A Mid-Year Ambulance Contract Response Time Compliance - Contract Standard is 90%
Region A Mid-Year Penalty Assessments - Late RunsREGION JULY AUGUST SEPTEMBER OCTOBER NOVEMBER DECEMBER TOTAL
12 13 16 17 16 16 90$455.00 $700.00 $450.00 $685.00 $815.00 $485.00 $3,590.00
$91.00 $140.00 $90.00 $137.00 $203.75 $97.00 $758.75
Region A Mid-Year Exception/Exemption RequestsREGION JULY AUGUST SEPTEMBER OCTOBER NOVEMBER DECEMBER TOTAL
9 10 1 6 4 3 338 6 1 3 4 3 25
Region A Mid-Year TransportsREGION JULY AUGUST SEPTEMBER OCTOBER NOVEMBER DECEMBER TOTAL
160 187 165 191 135 188 1026207 197 215 214 204 231 1268
4 2 3 0 3 2 14
371 386 383 405 342 421 2308
ApprovedRequested
EXCEPTION/EXEMPTION
July - December 2018Mid - Year Region A Compliance Report
Late RunsCATEGORY
9-1-1 EMERGENCY AMBULANCEResponse Time Compliance & Penalty Assessments
Final Assessment
SECTION 2.2
CITYPlacentia
Yorba LindaBrea
A
Region A Total
A
Penalty A
97.77% 97.58%
97.01% 97.08% 96.79%
97.34%
96.00%
96.50%
97.00%
97.50%
98.00%
July August September October November December
Region A Monthly Average
Region A Mid-Year Average
2/26/20199:23 AM

Public Education/Outreach Events by type/hourJULY AUGUST SEPTEMBER OCTOBER NOVEMBER DECEMBER
8 - - - - -- 2 - - - -- 1 - - - -- - 10 - - -- - - - 3 -- - - - - 4
8 3 10 0 3 4
28
MOCK STEMI TRANSPORT WITH HCA HOSP
STATE PARKS SUMMER SAFETY EVENTAHA FIRST AID COURSE
9-1-1 EMERGENCY AMBULANCE
COMMUNITY EVENTHEARTSAVER CPR CLASS
YORBA LINDA NATIONAL NIGHT OUT/HANDS ONLY CPR
TOTAL HOURS
SECTION 2.3
Public Education/Outreach Activities
July - December 2018Mid - Year Region A Compliance Report
Total Community Events Hours
FRIENDS AND FAMILY CPR/WATER SAFETY CLASS
2/26/20199:23 AM

SECTION 3.1
9-1-1 EMERGENCY AMBULANCEMid - Year Compliance Report
July - December 2018REGION B
2/26/20199:27 AM
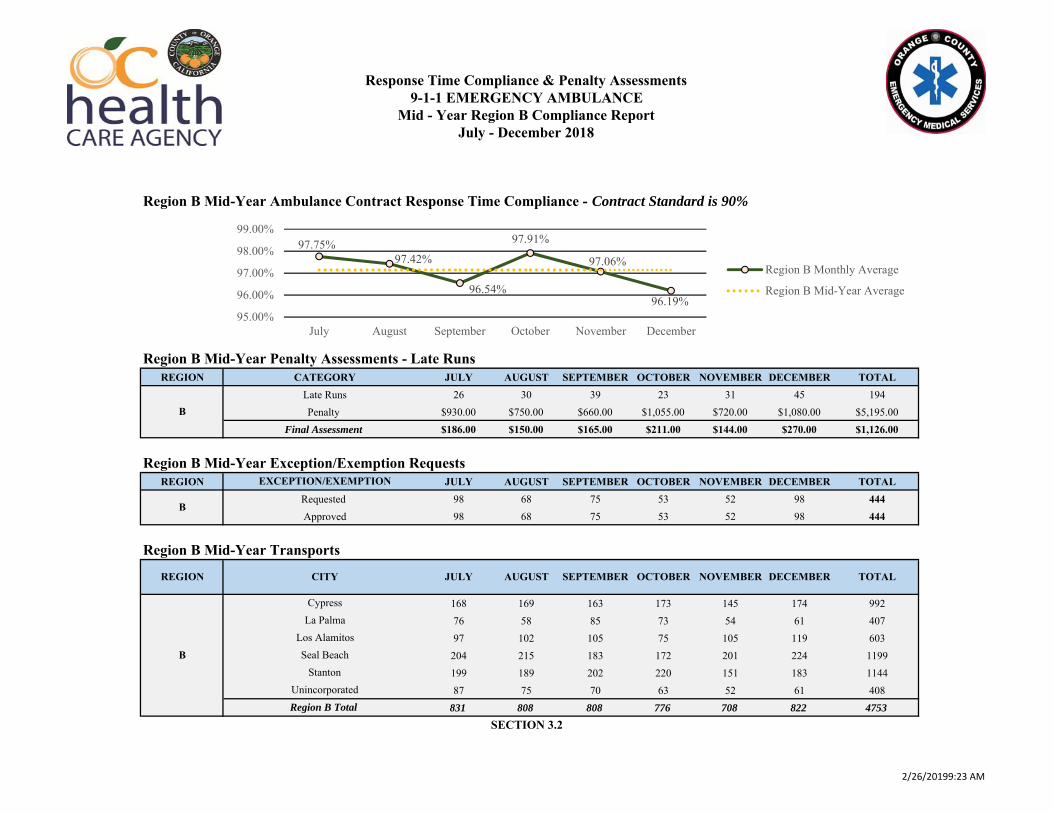
Region B Mid-Year Ambulance Contract Response Time Compliance - Contract Standard is 90%
Region B Mid-Year Penalty Assessments - Late RunsREGION JULY AUGUST SEPTEMBER OCTOBER NOVEMBER DECEMBER TOTAL
26 30 39 23 31 45 194$930.00 $750.00 $660.00 $1,055.00 $720.00 $1,080.00 $5,195.00$186.00 $150.00 $165.00 $211.00 $144.00 $270.00 $1,126.00
Region B Mid-Year Exception/Exemption RequestsREGION JULY AUGUST SEPTEMBER OCTOBER NOVEMBER DECEMBER TOTAL
98 68 75 53 52 98 44498 68 75 53 52 98 444
Region B Mid-Year Transports
168 169 163 173 145 174 99276 58 85 73 54 61 40797 102 105 75 105 119 603
204 215 183 172 201 224 1199199 189 202 220 151 183 114487 75 70 63 52 61 408
831 808 808 776 708 822 4753
Response Time Compliance & Penalty Assessments
SECTION 3.2
TOTALNOVEMBER DECEMBER
Late RunsCATEGORY
Penalty Final Assessment
EXCEPTION/EXEMPTION
Requested Approved
Region B Total
Stanton
SEPTEMBERAUGUST
Mid - Year Region B Compliance ReportJuly - December 2018
9-1-1 EMERGENCY AMBULANCE
REGION
B
OCTOBERJULY
Unincorporated
Seal BeachLos Alamitos
La PalmaCypress
CITY
B
B
97.75%97.42%
96.54%
97.91%
97.06%
96.19%95.00%
96.00%
97.00%
98.00%
99.00%
July August September October November December
Region B Monthly Average
Region B Mid-Year Average
2/26/20199:23 AM

Public Education/Outreach Events by type/hourJULY AUGUST SEPTEMBER OCTOBER NOVEMBER DECEMBER
7 - - - - -- 3 - - - -- 3 - - - -- 25 - - - -- - - 2 - -- - - 7 - -- - - 11 - -- - - 8 - -- - - - 2 -- - - - - 2- - - - - 6
7 31 0 28 2 8
LOS ALAMITOS CERT MEDICAL SKILLS TRAINING DAYROSSMOOR ELEMENTARY WALK TO SCHOOL DAY
HANDS ONLY CPR OXFORD ACADEMYCPK PINK PATCH PROJECT EVENTLOS ALAMITOS TRUNK OR TREAT
CYPRESS GIRLS SCOUTS HANDS ON CPRCYPRESS HS CAREER DAY
ROSSMOOR WINTER FESTIVAL
Public Education/Outreach Activities9-1-1 EMERGENCY AMBULANCE
Mid - Year Region B Compliance ReportJuly - December 2018
SECTION 3.3
TOTAL HOURS
LOS ALAMITOS 4TH JULYCOMMUNITY EVENT
Total Community Events Hours 76
LA PALMA NATIONAL NIGHT OUTTRI CITY NATIONAL NIGHT OUT
2/26/20199:23 AM
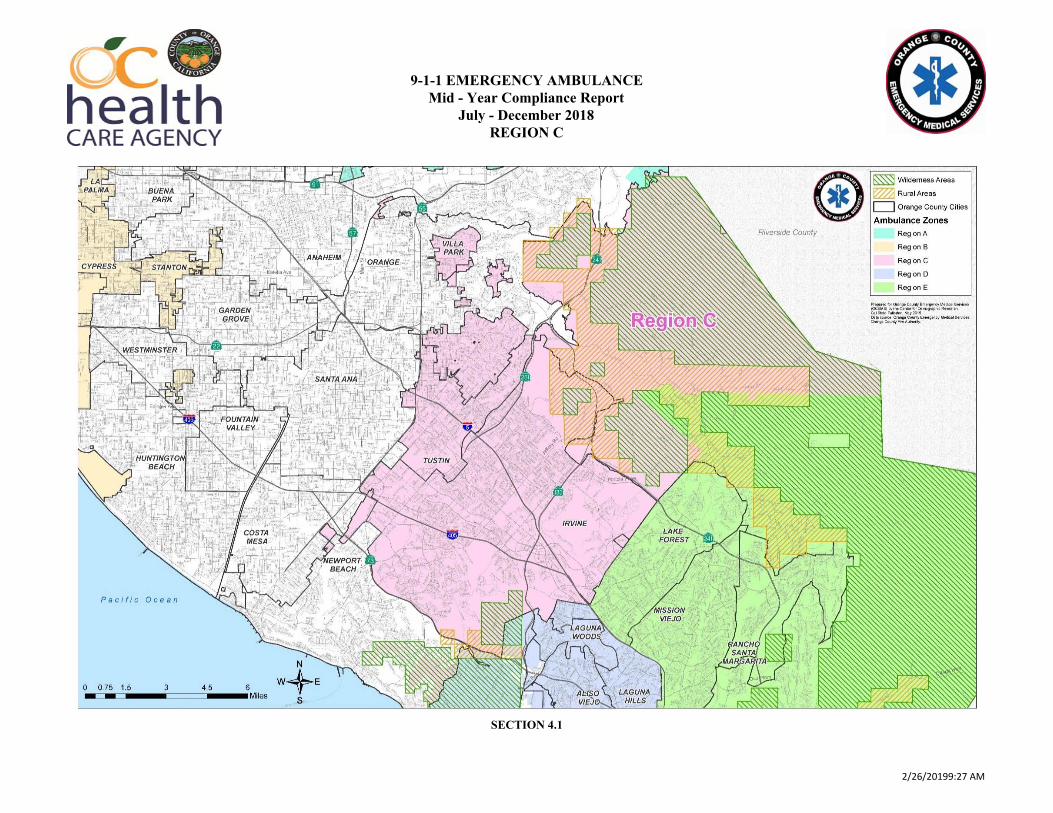
Mid - Year Compliance ReportJuly - December 2018
REGION C
SECTION 4.1
9-1-1 EMERGENCY AMBULANCE
2/26/20199:27 AM
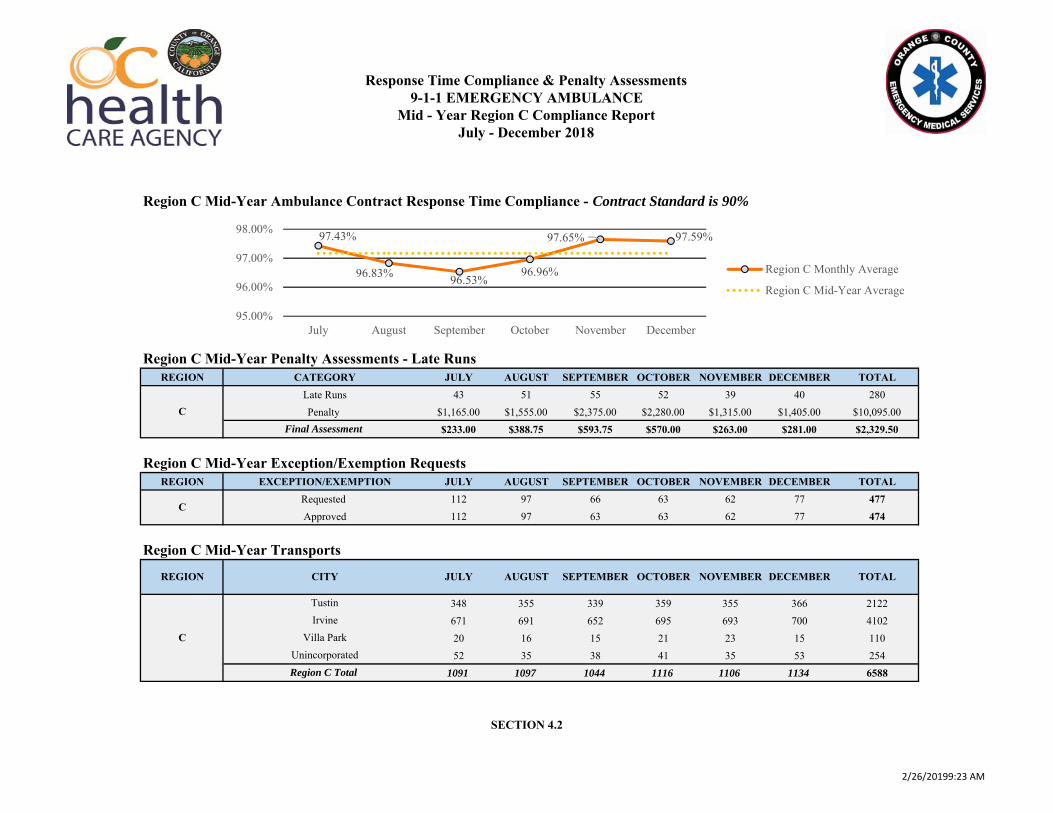
Region C Mid-Year Ambulance Contract Response Time Compliance - Contract Standard is 90%
Region C Mid-Year Penalty Assessments - Late RunsREGION JULY AUGUST SEPTEMBER OCTOBER NOVEMBER DECEMBER TOTAL
43 51 55 52 39 40 280$1,165.00 $1,555.00 $2,375.00 $2,280.00 $1,315.00 $1,405.00 $10,095.00$233.00 $388.75 $593.75 $570.00 $263.00 $281.00 $2,329.50
Region C Mid-Year Exception/Exemption RequestsREGION JULY AUGUST SEPTEMBER OCTOBER NOVEMBER DECEMBER TOTAL
112 97 66 63 62 77 477112 97 63 63 62 77 474
Region C Mid-Year Transports
348 355 339 359 355 366 2122671 691 652 695 693 700 410220 16 15 21 23 15 11052 35 38 41 35 53 254
1091 1097 1044 1116 1106 1134 6588
Response Time Compliance & Penalty Assessments
ApprovedRequested
C
AUGUST NOVEMBER
Tustin
CITY
Penalty
TOTALJULY OCTOBERSEPTEMBER
Late Runs
Irvine
EXCEPTION/EXEMPTION
CATEGORY
Final Assessment
REGION
C
C
9-1-1 EMERGENCY AMBULANCEMid - Year Region C Compliance Report
July - December 2018
SECTION 4.2
DECEMBER
Region C Total
UnincorporatedVilla Park
97.43%
96.83% 96.53%96.96%
97.65% 97.59%
95.00%
96.00%
97.00%
98.00%
July August September October November December
Region C Monthly Average
Region C Mid-Year Average
2/26/20199:23 AM
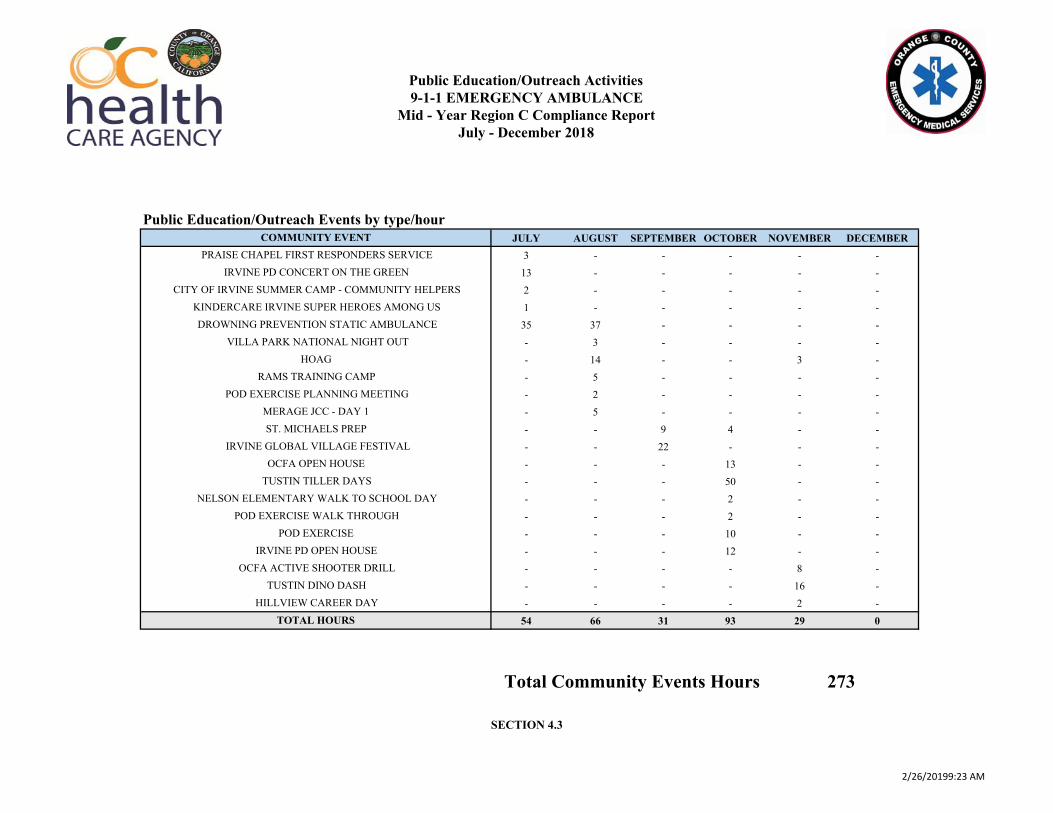
Public Education/Outreach Events by type/hourJULY AUGUST SEPTEMBER OCTOBER NOVEMBER DECEMBER
3 - - - - -13 - - - - -2 - - - - -1 - - - - -
35 37 - - - -- 3 - - - -- 14 - - 3 -- 5 - - - -- 2 - - - -- 5 - - - -- - 9 4 - -- - 22 - - -- - - 13 - -- - - 50 - -- - - 2 - -- - - 2 - -- - - 10 - -- - - 12 - -- - - - 8 -- - - - 16 -- - - - 2 -
54 66 31 93 29 0
SECTION 4.3
IRVINE PD CONCERT ON THE GREENPRAISE CHAPEL FIRST RESPONDERS SERVICE
COMMUNITY EVENT
DROWNING PREVENTION STATIC AMBULANCE
TOTAL HOURS
VILLA PARK NATIONAL NIGHT OUT
KINDERCARE IRVINE SUPER HEROES AMONG USCITY OF IRVINE SUMMER CAMP - COMMUNITY HELPERS
Public Education/Outreach Activities9-1-1 EMERGENCY AMBULANCE
Mid - Year Region C Compliance ReportJuly - December 2018
Total Community Events Hours 273
HOAGRAMS TRAINING CAMP
OCFA OPEN HOUSETUSTIN TILLER DAYS
NELSON ELEMENTARY WALK TO SCHOOL DAYPOD EXERCISE WALK THROUGH
POD EXERCISEIRVINE PD OPEN HOUSE
OCFA ACTIVE SHOOTER DRILLTUSTIN DINO DASH
HILLVIEW CAREER DAY
POD EXERCISE PLANNING MEETINGMERAGE JCC - DAY 1ST. MICHAELS PREP
IRVINE GLOBAL VILLAGE FESTIVAL
2/26/20199:23 AM

SECTION 5.1
9-1-1 EMERGENCY AMBULANCEMid - Year Compliance Report
July - December 2018REGION D
2/26/20199:27 AM

Region D Mid-Year Ambulance Contract Response Time Compliance - Contract Standard is 90%
Region D Mid-Year Penalty Assessments - Late RunsREGION JULY AUGUST SEPTEMBER OCTOBER NOVEMBER DECEMBER TOTAL
15 20 17 16 20 15 103$450.00 $565.00 $330.00 $495.00 $400.00 $345.00 $2,585.00$45.00 $56.50 $33.00 $49.50 $40.00 $34.50 $258.50
Region D Mid-Year Exception/Exemption RequestsREGION JULY AUGUST SEPTEMBER OCTOBER NOVEMBER DECEMBER TOTAL
99 76 61 48 42 47 37399 76 61 48 42 47 373
Region D Mid-Year Transports
137 139 129 136 121 139 801196 175 155 147 152 179 1004159 184 163 181 166 159 1012186 194 181 210 174 205 1150277 291 271 242 267 314 1662
1 1 1 0 1 2 6956 984 900 916 881 998 5635
Response Time Compliance & Penalty Assessments9-1-1 EMERGENCY AMBULANCE
Mid - Year Region D Compliance ReportJuly - December 2018
Region D Total
DLaguna WoodsUnincorporated
CITY
Approved
Laguna NiguelLaguna Hills
TOTALDECEMBEROCTOBERJULY AUGUST SEPTEMBER NOVEMBER
D
REGION
SECTION 5.2
DFinal Assessment
Penalty Late Runs
Aliso Viejo
Requested
CATEGORY
EXCEPTION/EXEMPTION
Dana Point
98.93%
98.59%
98.70% 98.81%
98.48%
98.97%
98.00%
98.50%
99.00%
July August September October November December
Region D Monthly Average
Region D Mid-Year Average
2/26/20199:23 AM
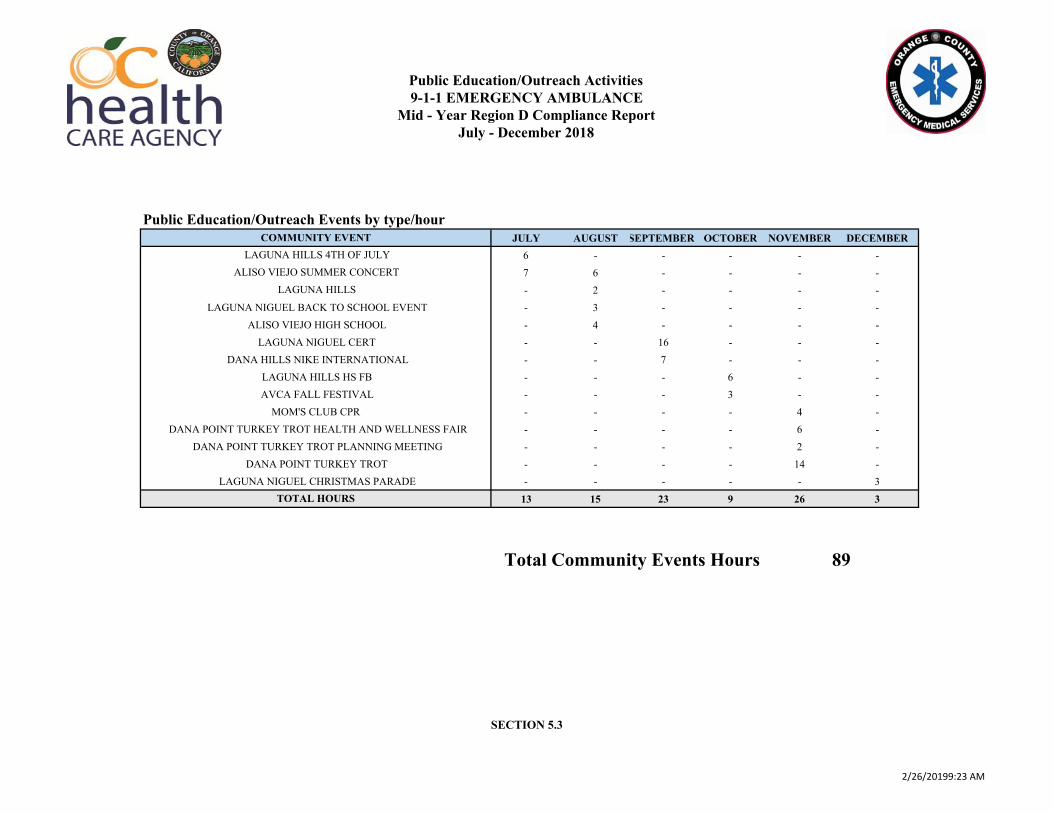
Public Education/Outreach Events by type/hourJULY AUGUST SEPTEMBER OCTOBER NOVEMBER DECEMBER
6 - - - - -7 6 - - - -- 2 - - - -- 3 - - - -- 4 - - - -- - 16 - - -- - 7 - - -- - - 6 - -- - - 3 - -- - - - 4 -- - - - 6 -- - - - 2 -- - - - 14 -- - - - - 3
13 15 23 9 26 3
Total Community Events Hours 89
Public Education/Outreach Activities9-1-1 EMERGENCY AMBULANCE
Mid - Year Region D Compliance ReportJuly - December 2018
SECTION 5.3
TOTAL HOURS
LAGUNA NIGUEL BACK TO SCHOOL EVENT
LAGUNA HILLSALISO VIEJO SUMMER CONCERT
COMMUNITY EVENTLAGUNA HILLS 4TH OF JULY
LAGUNA HILLS HS FBAVCA FALL FESTIVAL
MOM'S CLUB CPRDANA POINT TURKEY TROT HEALTH AND WELLNESS FAIR
DANA POINT TURKEY TROT PLANNING MEETINGDANA POINT TURKEY TROT
LAGUNA NIGUEL CHRISTMAS PARADE
ALISO VIEJO HIGH SCHOOLLAGUNA NIGUEL CERT
DANA HILLS NIKE INTERNATIONAL
2/26/20199:23 AM

REGION E
SECTION 6.1
9-1-1 EMERGENCY AMBULANCEMid - Year Compliance Report
July - December 2018
2/26/20199:27 AM
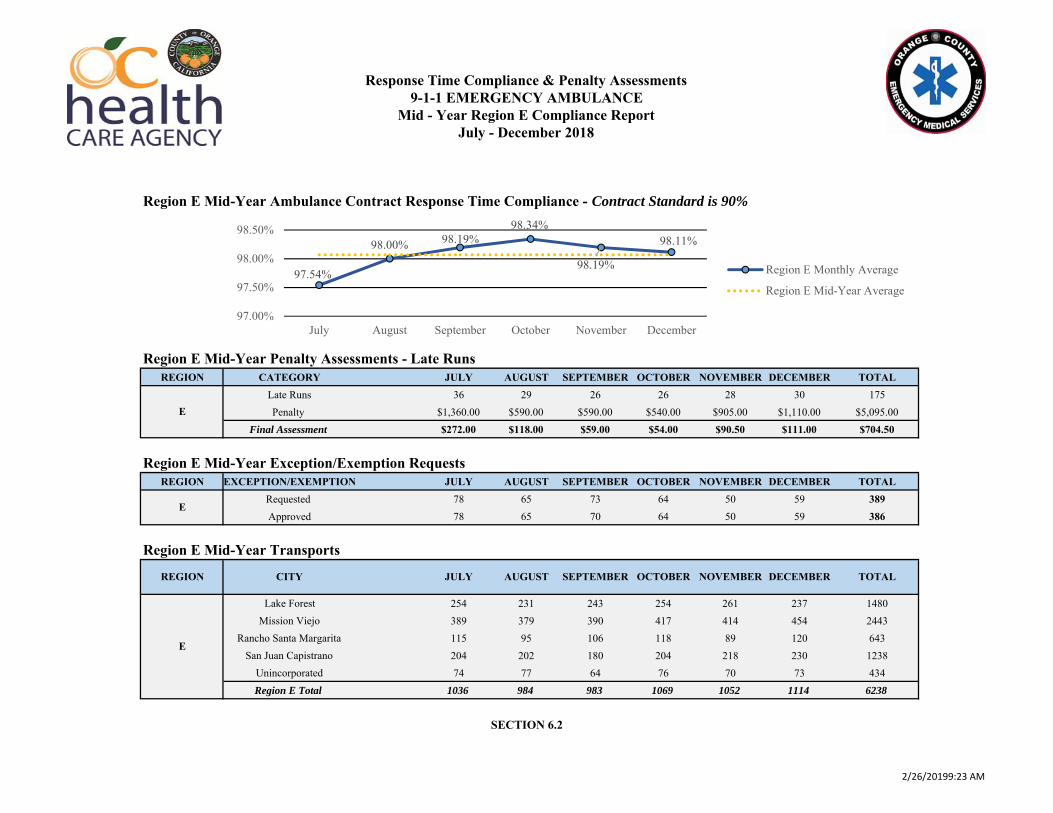
Region E Mid-Year Ambulance Contract Response Time Compliance - Contract Standard is 90%
Region E Mid-Year Penalty Assessments - Late RunsREGION CATEGORY JULY AUGUST SEPTEMBER OCTOBER NOVEMBER DECEMBER TOTAL
Late Runs 36 29 26 26 28 30 175Penalty $1,360.00 $590.00 $590.00 $540.00 $905.00 $1,110.00 $5,095.00
Final Assessment $272.00 $118.00 $59.00 $54.00 $90.50 $111.00 $704.50
Region E Mid-Year Exception/Exemption RequestsREGION EXCEPTION/EXEMPTION JULY AUGUST SEPTEMBER OCTOBER NOVEMBER DECEMBER TOTAL
Requested 78 65 73 64 50 59 389Approved 78 65 70 64 50 59 386
Region E Mid-Year Transports
Lake Forest 254 231 243 254 261 237 1480Mission Viejo 389 379 390 417 414 454 2443
Rancho Santa Margarita 115 95 106 118 89 120 643San Juan Capistrano 204 202 180 204 218 230 1238
Unincorporated 74 77 64 76 70 73 434Region E Total 1036 984 983 1069 1052 1114 6238
E
OCTOBER NOVEMBER
Response Time Compliance & Penalty Assessments9-1-1 EMERGENCY AMBULANCE
Mid - Year Region E Compliance ReportJuly - December 2018
SECTION 6.2
E
E
REGION CITY TOTALDECEMBERAUGUST SEPTEMBERJULY
97.54%
98.00% 98.19%98.34%
98.19%
98.11%
97.00%
97.50%
98.00%
98.50%
July August September October November December
Region E Monthly Average
Region E Mid-Year Average
2/26/20199:23 AM
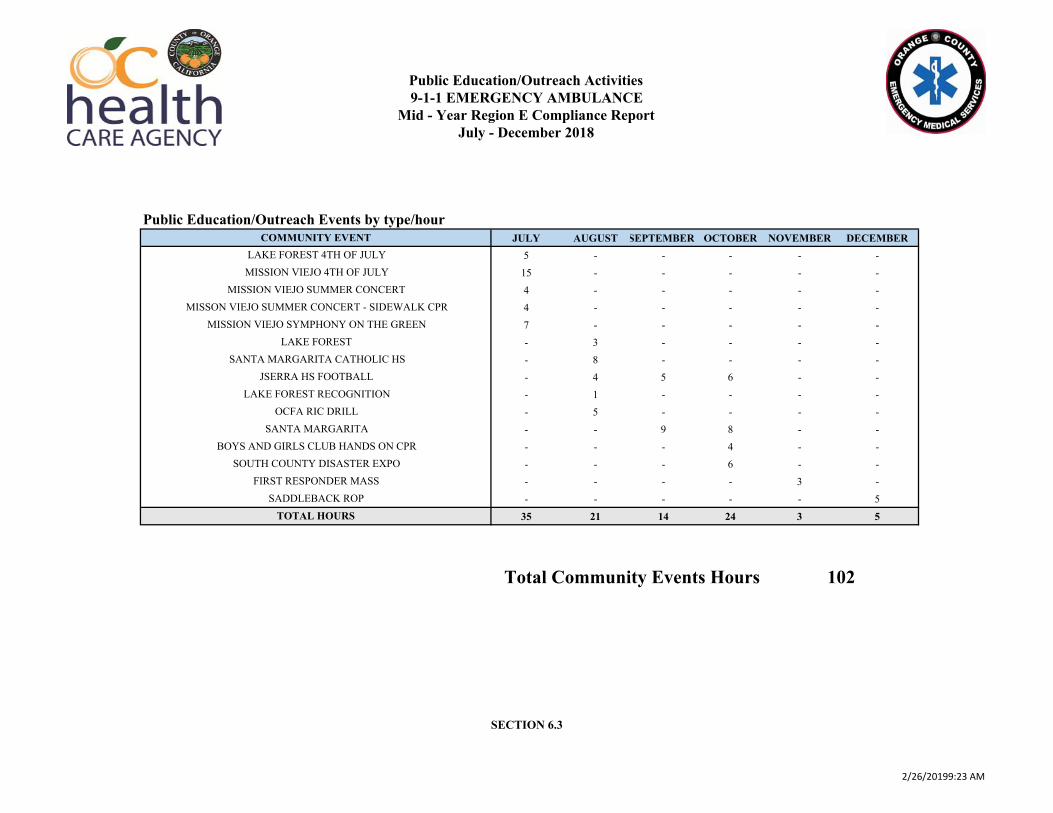
Public Education/Outreach Events by type/hourJULY AUGUST SEPTEMBER OCTOBER NOVEMBER DECEMBER
5 - - - - -15 - - - - -4 - - - - -4 - - - - -7 - - - - -- 3 - - - -- 8 - - - -- 4 5 6 - -- 1 - - - -- 5 - - - -- - 9 8 - -- - - 4 - -- - - 6 - -- - - - 3 -- - - - - 5
35 21 14 24 3 5
MISSION VIEJO 4TH OF JULY
TOTAL HOURS
LAKE FOREST 4TH OF JULYCOMMUNITY EVENT
Total Community Events Hours 102
Mid - Year Region E Compliance ReportJuly - December 2018
SECTION 6.3
Public Education/Outreach Activities9-1-1 EMERGENCY AMBULANCE
LAKE FORESTSANTA MARGARITA CATHOLIC HS
JSERRA HS FOOTBALLLAKE FOREST RECOGNITION
OCFA RIC DRILLSANTA MARGARITA
BOYS AND GIRLS CLUB HANDS ON CPRSOUTH COUNTY DISASTER EXPO
FIRST RESPONDER MASSSADDLEBACK ROP
MISSION VIEJO SUMMER CONCERTMISSON VIEJO SUMMER CONCERT - SIDEWALK CPR
MISSION VIEJO SYMPHONY ON THE GREEN
2/26/20199:23 AM