Microwaves-assisted demetallization and desulfurization of ...
212
POLYTECHNIQUE MONTRÉAL affiliée à l’Université de Montréal Microwaves-assisted demetallization and desulfurization of heavy petroleum oil using a developed demetallization agent MAI ABDELNABY ATTIA Département de génie chimique Thèse présentée en vue de l’obtention du diplôme de Philosophiæ Doctor Génie chimique Mai 2019 © Mai Abdelnaby Attia, 2019.
-
Upload
khangminh22 -
Category
Documents
-
view
5 -
download
0
Transcript of Microwaves-assisted demetallization and desulfurization of ...

POLYTECHNIQUE MONTRÉAL
affiliée à l’Université de Montréal
Microwaves-assisted demetallization and desulfurization of heavy petroleum
oil using a developed demetallization agent
MAI ABDELNABY ATTIA
Département de génie chimique
Thèse présentée en vue de l’obtention du diplôme de Philosophiæ Doctor
Génie chimique
Mai 2019
© Mai Abdelnaby Attia, 2019.

POLYTECHNIQUE MONTRÉAL
affiliée à l’Université de Montréal
Cette thèse intitulée :
Microwaves-assisted demetallization and desulfurization of heavy petroleum
oil using a developed demetallization agent
présentée par Mai Abdelnaby ATTIA
en vue de l’obtention du diplôme de Philosophiæ Doctor
a été dûment acceptée par le jury d’examen constitué de :
Louis FRADETTE, président
Jamal CHAOUKI, membre et directeur de recherche
Shaffiq JAFFER, membre et codirecteur de recherche
Oumarou SAVADOGO, membre
Jalal HAWARI, membre externe

iii
DEDICATION
To the souls of my beloved parents whom their hopes were behind what I have achieved.
To my beloved family without whom I could not reach anything.

iv
ACKNOWLEDGEMENTS
Thanks are to God for everything I have in my life.
I would like to sincerely thank my supervisor, Professor Jamal Chaouki for his guidance,
encouragement, understanding, and friendship during my Ph.D. For everything you have done for
me, Professor Jamal Chaouki, I thank you.
I would like to express my deep thanks to my co-supervisor, Professor. Shaffiq Jaffer for his
support, guidance, and encouragement. All the thanks and gratitude go to the co-leader of the
project Dr. Sherif Farag for his guidance, support, and encouragement that have significantly
enhanced the scientific outcomes of the project. I am also thankful to all my committee members
for agreeing to be a member of the jury.
I am very thankful to Dr. Cornelia Chilian, Dr. Joan Dupuy, and Mrs. Maryam Abdollahi for their
assistance in the analytical techniques. I would like to extend my thanks to all my colleagues in
Prof. Chaouki’s group. I am thankful to Mr. Luc Charbonneau, for translating the French section
of this dissertation.
I would never have accomplished this work without the lovely life that I have with my family: my
husband and my kids: Yara, Omer, Mohamed, and Eyad. I would like to express my profound
thanks for their understanding, encouragement, support, and patience in good times and bad.
Finally, and most important, I would like to express my fervent thanks, from the bottom of my
heart, to my beloved parents for their great effort that they spent during their life to make me
reaching this level of education, God places their souls in the paradise;
Special thanks to the soul of my brother-in-law, Mr. Nasser Farag for his continuous
encouragement and support during his life, God bless him too. Sincere thanks to my father and
mother-in-law for their prayers for me all the time. Deep thanks to my brothers, Hany, Amr, and
Sameh Attia, my brother-in-law, and sisters-in-law for everything they have done for me.
Mai Attia
École Polytechnique de Montréal
Winter 2019

v
RÉSUMÉ
Les scientifiques du XXIe siècle ont mis au point de nouveaux procédés pour la transformation de
l’énergie et ceux-ci ouvrent la voie à un avenir plus durable. Cependant, l’aspiration à atteindre les
objectifs de l’Accord de Paris est malheureusement encore très éloignée. De nouvelles technologies
permettant une production élevée d'énergie et une réduction des émissions de carbone sont
nécessaires pour atteindre cet objectif. Outre l'innovation dans les technologies pour la production
d'énergie renouvelable, l'innovation dans les secteurs d'utilisation finale est aujourd'hui l'un des
besoins les plus pressants. Les résultats d'une telle feuille de route comprennent l'intégration rapide
de l'électrification des secteurs d'utilisation finale et l'intégration d'une part élevée d'énergie
renouvelable dans les systèmes existants. L'industrie chimique et pétrochimique dépend du pétrole
pour plus de 50% de leur consommation totale en énergie. L’utilisation d’électricité propre ainsi
que des techniques de chauffage non conventionnelles ont ouvert la voie à une révolution dans les
industries ces dernières années. Les techniques de chauffage les plus courantes qui ont été mises
en œuvre comprennent le chauffage par induction, le chauffage au plasma, par ultrasons et par
micro-ondes.
Ce travail a mis l’emphase sur les applications de ces techniques et plus particulièrement sur le
chauffage par micro-ondes pour la démétallisation et la désulfuration du pétrole. Les raisons en
sont que les métaux et le soufre dans le pétrole posent des défis majeurs aux restrictions imposées
à la production de mazout. Les métaux de transition, plus particulièrement le vanadium et le nickel
ainsi que les composés soufrés sont encore présents dans l'huile sous forme de complexes stables.
Ces complexes sont solubles et ont un impact négatif sur les machines lors du processus du
raffinage et sur d’autres aspects du procédé.
Ce travail a permis d’extraire sélectivement le vanadium et le nickel grâce à cinq nouvelles
méthodologies inventées. En outre, il élimine les composés de thiophène qui sont aussi présents
avec les métaux en utilisant deux processus d'extraction différents dans les mêmes conditions de
réaction. Le processus développé sur la base des méthodologies inventées est écologique et
rentable, car aucune opération supplémentaire telle qu'un processus d'émulsification n'est requis et
aucun solvant n'est consommé pendant la réaction. L'extraction des métaux et du soufre contenu
dans le pétrole a été réalisée à l'aide d'un nouvel agent chimique. Les micro-ondes ont pu fournir

vi
l'énergie nécessaire à la séparation des contaminants présent dans le pétrole. Les conditions
optimales de réaction ont été déterminées et appliquées. Les résultats obtenus ont été comparés à
ceux du chauffage conventionnel. Cinq huiles différentes provenant de différentes régions du
monde ont été traitées pour valider le concept des méthodologies inventées. Les résultats obtenus
montrent une différence significative entre l'efficacité d'élimination d'éléments sélectionnés. Plus
de 95% de la teneur totale en vanadium présent dans le pétrole brut iranienne a été éliminée en
utilisation la conversion d'énergie en micro-ondes, contre 33% pour le transfert de chaleur
superficiel. Le rendement obtenu pour l’élimination du soufre par chauffage conventionnel a été
de 20% pour le pétrole iranien et de 60% pour le pétrole de Bassora. Toutefois, l’élimination du
soufre présent dans le pétrole a été de 99% lorsque le processus d’extraction a été effectué en
présence de micro-ondes.
L'interaction entre les micro-ondes et les métaux crée des points chauds locaux au niveau des
liaisons métalliques, ce qui entraîne par conséquent un affaiblissement de la liaison entre les
métaux et les quatre atomes d'azote dans le noyau de la porphyrine. Ceci, à son tour, améliore la
décomposition facile et rapide des liaisons métalliques et la libération des métaux du noyau du
cycle de la métalloporphyrine. En outre, la forte interaction des autres métaux sous forme de sels
polaires dans le pétrole stimule l'élimination de ces métaux du pétrole brut. Cela signifie que le
chauffage par micro-ondes améliore l'élimination sélective des métaux du réseau des huiles et
maintient le squelette principal de l'huile sans dégradation supplémentaire. En conséquence, le
rendement de l'huile traitée n'est pas affecté par rapport aux autres technologies de démétallisation.
Les résultats scientifiques de ce travail ont été documentés dans cinq demandes de brevet et six
publications scientifiques.

vii
ABSTRACT
Even though the current noticeable pace of energy transformation paves the way for a more
sustainable future, the aspirational goal to meet the Paris Agreement’s Policy is unfortunately still
far off. More innovative solutions for high energy and low carbon intensity processes are urgently
needed to support accelerated progress toward that goal. Along with the innovation in renewable
power generation technologies, innovation in the end-use sectors is nowadays among the most
pressing needs. The results of such a roadmap include the prompt embedding of the electrification
of end-use sectors and integrating high shares of renewable power into the existing systems.
The chemical and petrochemical industry depends on oils for more than 50% of the total energy
consumption. Employing clean electricity with unconventional heating mechanisms has initiated a
revolution in the industry during the last few years. The most common heating mechanisms that
are being implemented include induction heating, plasma, ultrasound, and microwave heating. This
work demonstrates the fundamentals and the application of microwave to upgrade petroleum oils
by removing sulfur and metals. The reason behind this election is that metals and sulfur in residual
oil are the significant challenges behind restrictions facing fuel oil production. Both metals,
particularly vanadium and nickel, and sulfur compounds reside in oil in complex stable forms yet
are soluble and have a negative impact on machinery during the refinery processes and other
aspects.
This work was successfully accomplished based on five invented processes capable of selectively
extracting almost all the minerals, especially vanadium and nickel. Additionally, it excludes the
thiophene compounds, which are alongside the metals, with two different extraction mechanisms
under the same reaction conditions. The invented processes are green and cost-effective since no
supplementary operations, such as emulsification, are required, and no solvents are consumed
during the reaction.
The extraction of metals and sulfur from petroleum oil was performed using a novel
demetallization-desulfurization agent. A microwave irradiation environment was created to
provide the required energy essential for separating the metals and sulfur from the chemical
network of the oil. A set of reaction conditions were applied, and the obtained results were

viii
compared against those of conventional heating. Five different oils received from different fields
around the world were processed to prove the concept of the invented processes.
The results obtained show a significant difference between the removal efficiencies of selected
elements. More than 95% of the vanadium concentration in the raw Iran oil was removed using the
energy conversion mechanism of the microwave compared to 33% for the superficial heat transfer
mechanism. The removal of sulfur showed a considerable deviation in the removal efficiency using
the microwave, 99% compared to 20% and 60%, for Iran and Basra oil, respectively, for the
traditional heat.
The interaction between microwave and metals creates local hotspots at the metal bonds, which
consequently leads to weakening the bond between the metals and the four nitrogen in the
porphyrin ring. This, in turn, enhances the easy and rapid breakdown of the metal bonds and the
liberation of metals from the core of the metalloporphyrin ring. Also, the high interaction of the
other metals in the form of polar salts exist in the oil boosts the removal of such metals from the
crude oil. This means that applying microwave heating enhances the selective removal of metals
from the network of the oils and keep the main skeleton of the oil without further degradation. As
a result, the yield of the treated oil is not affected compared to the other demetallization
technologies.
The scientific outcomes of this work have been documented in Five Patent Applications and Six
Peer-Reviewed Journal Publications.

ix
TABLE OF CONTENTS
DEDICATION .............................................................................................................................. III
ACKNOWLEDGEMENTS .......................................................................................................... IV
RÉSUMÉ ........................................................................................................................................ V
ABSTRACT .................................................................................................................................VII
TABLE OF CONTENTS .............................................................................................................. IX
LIST OF TABLES .......................................................................................................................XII
LIST OF FIGURES .................................................................................................................... XIII
LIST OF SYMBOLS AND ABBREVIATIONS...................................................................... XVII
LIST OF APPENDICES ............................................................................................................ XIX
INTRODUCTION ............................................................................................... 1
1.1 Methods of demetallization and desulfurization .............................................................. 7
1.1.1 Physical methods .......................................................................................................... 7
1.1.2 Chemical methods ........................................................................................................ 9
1.1.3 Hydrotreatment ........................................................................................................... 10
LITERATURE REVIEW .................................................................................. 12
3.1 Unconventional heating mechanisms ............................................................................. 21
3.1.1 Induction heating ........................................................................................................ 21
3.1.2 Ultrasound .................................................................................................................. 22
3.1.3 Plasma ........................................................................................................................ 23
3.2 Microwave heating ......................................................................................................... 24

x
3.2.1 Polarization mechanisms of microwaves ................................................................... 26
3.3 Microwave heating parameters ...................................................................................... 29
3.4 Dissipated power and penetration depth ........................................................................ 32
3.5 Microwave heating vs. conventional heating ................................................................. 33
3.6 Upgrading petroleum oil using microwaves .................................................................. 35
3.7 Microwave prospective applications .............................................................................. 44
OBJECTIVES AND METHODOLOGY.......................................................... 57
ARTICLE 2: METALS AND SULFUR REMOVAL FROM PETROLEUM OIL
USING A DEVELOPED DEMETALLIZATION- DESULFURIZATION AGENT .................. 58
5.1 Introduction .................................................................................................................... 59
5.2 Experimental work ......................................................................................................... 63
5.2.1 Materials ..................................................................................................................... 63
5.2.2 Experimental setup ..................................................................................................... 63
5.2.3 Experimental procedures ............................................................................................ 66
5.2.4 Principal reaction of the DM-DSA with oil ............................................................... 67
5.2.5 Oil and DM-DSA separation ...................................................................................... 67
5.2.6 Washing the separated oil .......................................................................................... 68
5.3 Analytical techniques ..................................................................................................... 68
5.3.1 FTIR technique ........................................................................................................... 69
5.3.2 Elemental analysis technique ..................................................................................... 69
5.3.3 Neutron activation analysis ........................................................................................ 69
5.3.4 Quantification method ................................................................................................ 70
5.4 Results and discussion .................................................................................................... 70
5.5 Conclusion ...................................................................................................................... 91

xi
ARTICLE 3: METALS AND SULFUR REMOVAL FROM PETROLEUM OIL
USING ELECTROMAGNETIC IRRADIATION ....................................................................... 92
6.1 Introduction .................................................................................................................... 93
6.2 Microwave heating mechanism ...................................................................................... 96
6.3 Experimental work ......................................................................................................... 98
6.3.1 Processed materials .................................................................................................... 98
6.3.2 Sample preparation for the NAA analysis .................................................................. 99
6.3.3 Dielectric properties of the processed materials ........................................................ 99
6.3.4 Experimental setup ..................................................................................................... 99
6.3.5 Experimental procedure ........................................................................................... 100
6.4 Results and discussion .................................................................................................. 103
6.5 Conclusion .................................................................................................................... 120
GENERAL DISCUSSION .............................................................................. 121
CONCLUSION AND RECOMMENDATION .............................................. 124
8.1 Conclusion .................................................................................................................... 124
8.2 Recommendations for future work ............................................................................... 125
REFERENCES ............................................................................................................................ 127

xii
LIST OF TABLES
Table 2.1 Various model compounds for the demetallization process (reprinted from reference [1])
................................................................................................................................................ 12
Table 2.2 Efficiency of metal removal of some significant chemical methods (reprinted from [1])
................................................................................................................................................ 18
Table 2.3 Advantages and disadvantages of some demetallization method [1] ............................. 18
Table 3.1 Dielectric constant, dielectric loss, and loss tangent of selected materials .................... 31
Table 3.2 Actual concentration of metals in the crude oil (adopted from reference [1]) ............... 36
Table 3.3 Penetration depth of selected metals at 2.45 GHz .......................................................... 41
Table 3.4 Selected literature on the demetallization of petroleum oil ........................................... 47
Table 5.1 Characteristic of the processed oils ................................................................................ 64
Table 5.2 NAA results of Pennsylvania oil treated with 2 vol.% DM-DSA .................................. 79
Table 5.3 NAA results of heavy aromatic naphthenic oil treated with 2 vol.% DM-DSA ........... 80
Table 5.4 NAA results of light naphthenic oil treated with 2 vol.% DM-DSA ............................ 81
Table 5.5 NAA results of Iran oil treated with 2 vol.% DM-DSA ................................................ 82
Table 5.6 NAA results of Basra oil treated with 2 vol.% DM-DSA .............................................. 83
Table 5.7 comparison between heavy aromatic naphthenic crude oil and treated oils with 2 vol.%
and 5 vol.% DM-DSA ............................................................................................................ 84
Table 5.8 NAA analysis of light naphthenic crude oil and treated oils with 2 vol.% and 5 vol.% of
DM-DSA ................................................................................................................................ 85
Table 6.1 Dielectric properties of the processed materials ............................................................ 99
Table 6.2 Penetration depth and heating rates of various metals exposed to microwaves (adapted
from reference [134] ............................................................................................................. 104

xiii
LIST OF FIGURES
Figure 1.1 Cumulative global energy-related carbon emission (Reproduced from data provided by
IRENA-2018 and IEA 2017) .................................................................................................... 2
Figure 1.2 Sharing-percentage of renewable energy in the total primary energy supply (Reproduced
from data provided by IRENA 2018 and IEA 2017) ............................................................... 3
Figure 1.3 Energy intensity improvement percentage (Reproduced from data published by IRENA
2018) ......................................................................................................................................... 3
Figure 1.4 World total primary energy demand (Mteo) (Reproduced from IEA report 2017) ........ 5
Figure 1.5 Industrial use of energy (reproduced from data published by IEA 2016) ...................... 5
Figure 3.1 Polarization mechanisms of microwaves ...................................................................... 27
Figure 3.2 Electromagnetic spectrum (Reprinted from reference [51]) ......................................... 28
Figure 3.3 (A) electric field penetration depth, and (B) power penetration depth ......................... 33
Figure 3.4 Composition of crude oil (reprinted from reference [78]) ............................................ 37
Figure 3.5 Different forms of metalloporphyrin rings (reprinted from reference [1]) ................... 38
Figure 3.6 Detected structures of different vanadium porphyrin species in Venezuela crude oil
(reprinted from reference [79]) .............................................................................................. 39
Figure 3.7 Penetration depth and heating rate of selected metals (Reprinted from (Gupta & Eugene,
2007) ....................................................................................................................................... 43
Figure 5.1 Different forms of sulfur in petroleum crude oil (reprinted from reference [9]) .......... 60
Figure 5.2 Experimental setup of the demetallization-desulfurization process by conventional
heating mechanism ................................................................................................................. 65
Figure 5.3 Flowchart of the invented process to remove metals and sulfur content in petroleum oil
................................................................................................................................................ 66
Figure 5.4 Mechanism of the aqueous phase, solvent, and DM-DSA separation .......................... 68

xiv
Figure 5.5 FTIR results of the raw heavy aromatic naphthenic crude oil (dotted line) and the treated
oil by 2 vol.% DM-DSA (continuous line) ............................................................................ 72
Figure 5.6 FTIR results of raw light naphthenic crude oil (dotted line) and treated oil by 2 vol.%
DM-DSA (continuous line) .................................................................................................... 72
Figure 5.7 Treated heavy aromatic naphthenic crude oil with 2 vol.% (continuous line) and 5 vol%
DM-DSA (dotted line) ........................................................................................................... 74
Figure 5.8 Treated light naphthenic crude oil with 2 vol.% (dotted line) and 5 vol.% DM-DSA
(continuous line) ..................................................................................................................... 74
Figure 5.9 Sulfur detection in the raw heavy aromatic naphthenic crude oil using elemental analysis
technique ................................................................................................................................ 75
Figure 5.10 Sulfur detection in the treated heavy aromatic naphthenic crude oil by 2 vol.% DM-
DSA using elemental analysis technique ............................................................................... 75
Figure 5.11 Sulfur detection in the raw light naphthenic crude oil using elemental analysis
technique ................................................................................................................................ 76
Figure 5.12 Sulfur detection in the treated light naphthenic crude oil by 2 vol.% DM-DSA using
elemental analysis technique .................................................................................................. 76
Figure 5.13 Removal efficiency of Pennsylvania oil treated with 2 vol.% DM-DSA ................... 79
Figure 5.14 Removal efficiency of heavy aromatic naphthenic oil treated with 2 vol.% DM-DSA
................................................................................................................................................ 80
Figure 5.15 Removal Efficiency of light naphthenic oil treated with 2 vol.% DM-DSA .............. 81
Figure 5.16 Removal Efficiency of Iran oil treated with 2 vol% DM-DSA .................................. 82
Figure 5.17 Removal efficiency of Basra oil treated with 2 vol.% DM-DSA ............................... 83
Figure 5.18 Removal Efficiency with 2 vol.% (black) and 5 vol.% (red) DM-DSA for heavy
aromatic naphthenic oil .......................................................................................................... 84
Figure 5.19 Removal Efficiency with 2 vol.% (black) and 5 vol.% (red) DM-DSA for light
naphthenic oil ......................................................................................................................... 85

xv
Figure 5.20 Removal efficiency of treated Iran oil with 2 vol.% DM-DSA (black color) against that
only washed with aqueous solution (red color) ...................................................................... 86
Figure 5.21 Mechanism of demetallization process ....................................................................... 88
Figure 5.22 Ionic liquid formation ................................................................................................. 89
Figure 5.23 Desulfurization mechanism by ionic liquid ................................................................ 90
Figure 6.1. Different forms of a metalloporphyrin ring ................................................................. 95
Figure 6.2 Microwave setup for metals and sulfur removal from oil .......................................... 102
Figure 6.3 FTIR of raw (dotted line) and microwave treated Iran oil (continuous line) ............. 105
Figure 6.4 FTIR of raw (dotted line) and microwave treated Basra oil (continuous line) ........... 105
Figure 6.5 Removal efficiency of treated Iran oil using conventional (blue) and microwave heating
(orange) ................................................................................................................................ 107
Figure 6.6 Removal efficiency of treated Basra oil using conventional (blue) and microwave
heating (orange) .................................................................................................................... 107
Figure 6.7 Concentrations of Ti in raw and treated Iran oil using conventional and microwave
heating at different powers and residence times (ppm) – P is the microwave nominal setting
power. P5 ≈ 500 W; P7 ≈ 700 W; P10 ≈ 1000 W; t1 = 1 min; t2 = 2 min; and t3 = 3 min .... 108
Figure 6.8 Concentrations of V in raw and treated Iran oil using conventional and microwave
heating. P5 ≈ 500 W; P7 ≈ 700 W; P10 ≈ 1000 W; t1 = 1 min; t2 = 2 min; and t3 = 3 min .. 108
Figure 6.9 Concentrations of Ni in raw and treated Iran oil using conventional and microwave
heating. P5 ≈ 500 W; P7 ≈ 700 W; P10 ≈ 1000 W; t1 = 1 min; t2 = 2 min; and t3 = 3 min .. 109
Figure 6.10 Concentrations of Mg in raw and treated Iran oil using conventional and microwave
heating. P5 ≈ 500 W; P7 ≈ 700 W; P10 ≈ 1000 W; t1 = 1 min; t2 = 2 min; and t3 = 3 min .. 109
Figure 6.11 Concentrations of Cl in raw and treated Iran oil using conventional and microwave
heating. P5 ≈ 500 W; P7 ≈ 700 W; P10 ≈ 1000 W; t1 = 1 min; t2 = 2 min; and t3 = 3 min .. 110
Figure 6.12 Concentrations of S in raw and treated Iran oil using conventional and microwave
heating. P5 ≈ 500 W; P7 ≈ 700 W; P10 ≈ 1000 W; t1 = 1 min; t2 = 2 min; and t3 = 3 min .. 110

xvi
Figure 6.13 Concentrations of Ti in raw and treated Basra oil using conventional and microwave
heating at different powers and residence times (ppm) – P is the microwave nominal setting
power. P5 ≈ 500 W; P7 ≈ 700 W; P10 ≈ 1000 W; t1 = 1 min; t2 = 2 min; and t3 = 3 min .... 112
Figure 6.14 Concentrations of V in raw and treated Basra oil using conventional and microwave
heating at different powers and residence times (ppm) ........................................................ 112
Figure 6.15 Concentrations of Mg in raw and treated Basra oil using conventional and microwave
heating at different powers and residence times (ppm) ........................................................ 113
Figure 6.16 Concentrations of Ni in raw and treated Basra oil using conventional and microwave
heating at different powers and residence times (ppm) ........................................................ 113
Figure 6.17 Concentrations of Cl in raw and treated Basra oil using conventional and microwave
heating at different powers and residence times (ppm) ........................................................ 114
Figure 6.18 Concentrations of S in raw and treated Basra oil using conventional and microwave
heating at different powers and residence times (ppm) ........................................................ 114
Figure 6.19 Removal efficiency of V in treated Basra oil at different microwave powers and
residence times (ppm) – P is the microwave nominal setting power. P5 ≈ 500 W; P7 ≈ 700 W;
P10 ≈ 1000 W; t1 = 1 min; t2 = 2 min; and t3 = 3 min .......................................................... 117
Figure 6.21 Removal efficiency of Ni treated Basra at different microwave powers and residence
times (ppm) .......................................................................................................................... 118
Figure 6.22 Removal efficiency of Mg in treated Basra at different microwave powers and
residence times (ppm) .......................................................................................................... 118

xvii
LIST OF SYMBOLS AND ABBREVIATIONS
A Instantaneous yield of the aliphatic compounds
C Specific heat
Dp Penetration depth
Erms Root mean square of the electrical field
Ea Activation energy
f Frequency
Hrms Root mean square of the magnetic field
K Thermal conductivity
k0 Pre-exponential factor
L Transient yield of the condensable gas product
m Mass
n Reaction rate
O Instantaneous yield of the oil product
P Power
R The universal gas constant
T Temperature
t Time
β Heating rate
휀∗ Complex permittivity
휀/ Dielectric constant
휀// Electric loss factor
휀0 Electric permittivity of free space
휀𝑒𝑓𝑓//
Effective dielectric loss factor

xviii
𝜇0 Magnetic permeability of free space
𝜇𝑒𝑓𝑓//
Effective magnetic loss factor
𝑡𝑎𝑛𝛿 Loss tangent
𝜔 Angular frequency
α Attenuation factor
ρ Density
DM-DSA Demetallization-desulfurization agent

xix
LIST OF APPENDICES
Appendix A US PAtent 1: REMOVAL OF METALS AND SULFUR FROM PETROLEUM OIL
USING A DEVELOPED DEMETALLIZATION DESULFURIZATION AGENT AND
RELATED TECHNIQUES.................................................................................................. 141
Appendix B US PATENT 2: MICROWAVE PROCESS FOR THE REMOVAL OF METALS
FROM PETROLEUM OIL USING A DEVELOPED DEMETALLIZATION AND
RELATED TECHNIQUES.................................................................................................. 142
Appendix C US PATENT 3: MICROWAVE PROCESS FOR THE REMOVAL OF SULFUR
FROM PETROLEUM OIL USING A DEVELOPED DESULFURIZATION AGENT AND
RELATED TECHNIQUES.................................................................................................. 143
Appendix D US PATENT 4: REMOVAL OF CADMIUM FROM PHOSPHATE USING A
DEVELOPED DECADMIATION AGENT AND RELATED TECHNIQUES ................. 144
Appendix E US PATENT 5: REMOVAL OF ZINC, SULFUR, AND OTHER METALS AND
IMPURITIES FROM PYROLYSIS CHAR USING AND RELATED TECHNIQUES .... 145
Appendix F ARTICLE 4: FAST PYROLYSIS OF LIGNOCELLULOSIC BIOMASS FOR THE
PRODUCTION OF ENERGY AND CHEMICALS: A CRITICAL REVIEW .................. 146
Appendix G MECHANISTIC LIGNIN PYROLYSIS MODEL TO PREDICT THE PRODUCT
YIELD AND COMPOSITION OF THE LIQUID PHASE ................................................. 192
Appendix H CALCIUM OXIDE CATALYSED MICROWAVE PYROLYSIS OF PAPER
CUPS: ANALYSIS OF OIL QUALITY ............................................................................. 193

1
INTRODUCTION
The continual decrease in the cost of renewable energy technologies in recent years positions
renewable energy generation in direct competition with fossil fuel-based energy. Expanding
affordable energy access through renewable resources to different sectors paves the way for a more
secure, cost-effective and sustainable future not only for us but the next generations as well. The
current trends of renewable energy, which include decentralization and digitalization, significantly
promote the growing electrification of industrial end-use sectors. Although the current pace of
energy transformation is noticeable, the goal to meet the Paris Agreement’s Policy, which aims to
limit the global temperature increase with 1.5 o C, is unfortunately still far away. According to
IRENA-2018 publications, the prominent efforts that have been made by several countries to
revise their policies of national emissions have reduced the projected energy-related carbon
emissions of 2015-2050 by 11% compared to the previous estimation. This decline manifests that
CO2 emission of the reference case, which is the scenario that considers the current and planned
policies, has dropped from 1380 Gt to 1230 Gt. Although the reduced amount limits the emission
rate to 34.8 Gt/y, an increase from 2.6 o C to 3.0 o C in the global temperature is expected by 2050.
To maintain global temperature increases at less than 2 oC, as depicted in Figure 1.1, cumulative
global emissions must be reduced by 470 Gt over the next 30 years. In other words, the energy-
related carbon emission must decrease from 1230 Gt to 760 Gt. This goal can only be achieved by
lowering the CO2 emission rate from 34.8 Gt/y to 9.7 Gt/y by that year, i.e., the generation rate
must drop by more than 70%.
Although the reference case has decreased by 11%, as aforementioned, the CO2 emission level
increased by 1.4% in 2017. This aspect demonstrates that the stated amount of the reference case
does not reflect the current level of energy-related emissions. Based on the present and planned
policies, as a result, the world will exhaust its energy-related carbon emissions budget in less than
20 years.
The aspirational goal of the Paris Agreement aims to limit the rise in global temperature to 1.5o C,
which means carbon-related emissions should reach “zero” by 2050, but only if negative emission
technologies are employed by the second half of the century. Unfortunately, the current and
planned policies are not keeping the emission trends on track to meet the goal. Though the

2
renewable energy sector has made significant achievements during the last few years, to reach the
objectives from the current situation progress across the entire power system must increase six-
fold. The total share of renewable energy must be increased from 15% of the total primary energy
supply (TPES), which was in 2015, to 66% of TPES by 2050. The current reference case, however,
would share only 27 % of the TPES, as presented in Figure 1.2. Besides, the TPES is projected to
remain flat despite the population and economy growth predicted by 2050. To reach this objective,
the rate of energy intensity must be reduced by 2.8 %. On the other hand, TPES in the reference
case is predicted to increase by 40% from 2015 levels, i.e., from 500 EJ/y to 700 EJ/y. This increase
will create obstacles to improving the energy intensity and keep the improvement in the energy
intensity at 1.8%, which is the same as the reference case of 2015, kindly refer to Figure 1.3. To
overcome this challenge, it is necessary to increase the rate of improvement of the energy intensity
by 1.5x to reach the renewable energy roadmap that maintains the increase in the global
temperature at less than 2 oC.
2015 2020 2025 2030 2035 2040 2045 2050
Year
0
300
600
900
1200
1500
Cu
mu
lati
ve
en
erg
y-r
ela
ted
ca
rbo
n e
mis
sio
ns
(G
t)
Reference case
Energy-related CO2 budget
Renewable energy roadmap
Figure 1.1 Cumulative global energy-related carbon emission (Reproduced from data provided
by IRENA-2018 and IEA 2017)

3
Figure 1.2 Sharing-percentage of renewable energy in the total primary energy supply
(Reproduced from data provided by IRENA 2018 and IEA 2017)
Figure 1.3 Energy intensity improvement percentage (Reproduced from data published by
IRENA 2018)
More technological and systemic innovative solutions are still urgently needed for high energy and
low carbon intensity processes to support accelerated progress. Continued research and
Renewable
Non-renewable0
25
50
75
100
2015
2050 - Refernce case
2050 - Renewable
energy roadmap
1527 66
Renewable Non-renewable
1.3
1.8
1.8
2.8
2000-2010
2010-2015
2015-2050 - Refernce Case
2015-2050 - Renewable energy
roadmap

4
development on renewable energy in both academia and industry would lead to further approaches
for more cost-effective and high-performance systems. Along with the innovation in renewable
power generation technologies, innovation in the end-use sectors is presently the most pressing
need. This objective can be achieved in two ways: (1) prompt embedding of electrification in end-
use sectors; and (2) integration of high shares of variable renewable power into the existing
systems.
This strategy provides the optimal pathway to deliver the bulk of the emission cuts needed at the
necessary speed. Figure 1.4 presents the world total primary energy demand (unit: million tons of
oil equivalent (Mteo)) in 2017 and the expected demand in 2040 in the case of existing energy
policies and sustainable development. As is evident, global energy demand grows 30% by 2040,
and it is planned to increase electrification transforming traditional ways to meet the demand. Solar
power is becoming the cheapest form of new electricity in many countries; consequently,
electricity based on solar energy will meet a significant portion of the energy demand.
To sum up, further efforts must be made to embed renewable energy and its conversion
mechanisms into the basic energy consumption sectors, e.g., building, transportation, district heat,
power, and the industry as well as for improving energy intensification. Beyond this strategy,
additional innovation is needed to affordably decarbonize industrial activities, such as iron and
steel making, cement production, and chemical and petrochemical production, along with freight
and maritime transportation and aviation.
Figure 1.5 demonstrates the percentage of energy and electricity consumption of different
industrial sectors. Chemical and petrochemical industries depend on oil for about 50% of the total
energy consumption. A considerable amount of such energy is consumed in the upgrading
processes – such as removal of hazard contamination from the oil composition. Such
contamination is caused by the existence of high levels of metals and sulfur that originally present
in the crude oil. Indeed, The presence of both metals and sulfur in crude oil has a jeopardy
influence throughout the refinery processes as a result of severe damage to the contact surfaces.
Furthermore, it gives rise to numerous environmental problems for both humanity and the
atmosphere.

5
Figure 1.4 World total primary energy demand (Mteo) (Reproduced from IEA report 2017)
Figure 1.5 Industrial use of energy (reproduced from data published by IEA 2016)
0 1000 2000 3000 4000 5000
Other renewables
Hydro
Nuclear
Bioenergy and waste
Natural gas
Coal
Oil
2017 2040 - Existing energy policies 2040 - Sustainable development scenario
0.0% 20.0% 40.0% 60.0% 80.0% 100.0%
Paper, pulp and print
Aluminium
Chemicals and petrochemical
Cement
Iron and steel
Other industries
Coal Oil Gas Commercial heat Biomass & Waste Electricty

6
It has been demonstrated that the concentration of various metals that exist in the heavy crude oil
is diversified from a few parts per million to higher than 1000 ppm. Some of the most prominent
elements that have been identified into the oil are cobalt (Co), nickel (Ni), copper (Cu), vanadium
(V), silver (Ag), sodium (Na), potassium (K), lithium (Li) ,calcium (Ca), strontium (Sr) and arsenic
,etc [1, 2]. Vanadium and nickel are the most prevalent metals in the oil composition; for example,
vanadium represents more than two-thirds of the entire metal impurities. Metals, in customary,
exist as an oil-soluble form of naphthenic acid or complex organometallic compounds, i.e., the
structure of metalloporphyrin ring [3, 4]. Other metals such as calcium, titanium, magnesium, and
zinc found in a combination of naphthenic acid as soaps. Indeed, an extensive inspection has been
conducted to the porphyrinic form due to the impact of the hazard metals that exist in such
chemical form [5]. The removal of metals in the form of metalloporphyrins is a challenge, due to
the high stability of the ring and the complete solubility in the oil. Also, the decomposition
temperature of porphyrin compounds is usually more than 250 °C. Presence of metals in the heavy
crude oil promotes several environmental issues. The most important ones include the emission to
the environment as a poisonous gas in the form of SOx and NOx. Vanadium oxide reacts with the
mucus into the human body, causing the body irritation. Nickel in the form of nickel carbonyl is a
carcinogenic matter resulting in numerous types of malignant neoplastic disease. During the
refinery processes, metals also play a hazard role in enhancing the corrosion problems to the
contacting surfaces. Calcium and magnesium chlorides get hydrolyzed when they subject to
temperatures of 170 °C. This leads to producing HCl, which is a highly corrosive agent. Metals
have an impediment influence on the efficiency of the catalyst during the refinery process. The
main reason behind this aspect is that the fast plugging the pores of the catalyst by minerals, which
results in rapid catalyst deactivation. Therefore, it elevates the rate of uptake of the catalyst during
the process, which puts up the monetary value of the technique. Also, accumulation of metals on
the surface of catalyst exhibits dehydrogenation activity as it boosts the dehydrogenation reactions
during the cracking operation. This issue enhances the production of increased amounts of coke
and dry gases at the expense of the liquid output. Additionally, if the product is used as a fuel, the
metals into the fuel oil will heighten the production of ash. This is because when the oil is exposed
to burning, the ash deposits on the engines, causing a significant abrasion of the moving parts [6,
7].

7
The concentration of sulfur in crude oil depends on many parameters; the most important one is
the origin place where it is extracted. In general, the percentage of sulfur concentration in crude
oil is ranged from 0.1 wt.% to 15 wt.% [8]. Sulfur exists in such oil in four different forms:
Mercaptans, sulfides, disulfides, and thiophenes [9]. The Presence of sulfur in crude oil has an
adverse influence during transportation and the upgrading processes of the intermediate and end-
products. It has several hazardous impacts on the environment and during the refinery operations.
Regarding the environmental hazards, as far as the sulfur content increases the boiling range raises
and the pollution climbs. During the refinery operations, sulfur promotes the catalyst deactivation
for its high ability to deposit on the pores of the catalyst. To sum up, the quantity of sulfur in crude
oil considerably affects the quality of the oil and, thus, leads to a significant reduction in the price
of the end-product.
1.1 Methods of demetallization and desulfurization
During the last few decades, various methods have been developed for refining crude oil through
the removal of metals and sulfur. The common techniques applied for such purposes include
physical, chemical, and biological methods. The central role of those methods is the conversion of
heavy contaminated oil into lighter products that can easily be employed to produce valuable end-
products. Most of the methods presented below have been proved and implemented in the lap-
scale, and only some of them were successfully performed on the industrial scale. The main
reasonbehind this aspect is the several issues that are associated with each technique which
obstacle their implementation in the industrial scale.
1.1.1 Physical methods
Distillation
Petroleum heavy oil is a complex matter consisting of a mixture of several hydrocarbons,
organometallic compounds, organosulfur compounds, and so forth. Distillation is the first method
that has been constructed for crude oil refining since long decades. The process is performed for
the separation of various components in the oil into fractions according to their boiling points. The
crude oil is primarily heated to an elevated temperature to transfer into the gas phase. Then, the oil

8
vapor passes into a fractional distillation column at which various components will be recovered
based on the variation in the boiling temperatures. Hydrotreating process in a fixed bed reactor is
applied after the distillation of the oil by employing a low activity catalyst to extract all the
metalloporphyrins. The main advantage of the distillation technique is the separation of adjacent
boiling point compounds.
In contrast, the technique suffers from several disadvantages such as the inability for selective
removal of metals from the oil. The process is merely adequate to eliminate the metalloporphyrin
fractions that include the metals; which declines the oil yield. Additionally, distillation, as a single
process, cannot effectively remove metals but it transfers them into heavy fractions.
Solvent extraction
A solvent extraction method is an ancient approach that has been applied for the removal of
vanadium and nickel metalloporphyrin compounds from the crude oil. The key concept of the
process is using various extracting solvents during the elimination process. Each solvent is
employed during the process should be able to extract one or more composite that contains the
metals from the complex composition of the oil. The solvent extraction method is performed at a
temperature range from 27 °C to 93 °C. The solvent regeneration process is done at a temperature
of less than 52 °C through exposure to a highly aromatic oil stream [2]. The solubility of the
solvents is a significant parameter that affects the solvent extraction process. It depends on some
characteristics such as dispersion forces, dipole-coupled forces, and H-bonding forces. Gamma-
butyrolactone found to be the most proper solvent for metalloporphyrins extraction with selective
removal of vanadium and nickel [10]. Applying a considerable volume of solvents is a significant
issue facing this process, as it gives a low oil yield. Additionally, such a technique is only suitable
for the oils containing high bitumen content. Also, the process is convenient for removing the
metalloporphyrin fraction which impacts negatively on the oil yield.
Filtration
Recently, an innovative technique has been performed in the field of demetallization of petroleum
oil by utilizing membrane technology. This novel technology helps in reducing the amount of
sulfur, metals, and asphaltene. Indeed, such a method was reported to be used for recovery of

9
solvents after first extraction, phase separation, or dilution step. The main disadvantage of this
approach is the long processing time that consumes too much time.
1.1.2 Chemical methods
Thermal cracking
Thermal cracking, it is also called visbreaking, is another technique for refining the crude oil
through reducing its kinematic viscosity and concentration of the metals exist in the oil. The
process is accomplished by applying a thermal cracking for the large hydrocarbons into a furnace
to minimize the viscosity and enhancing the production of light hydrocarbons [11]. The total
percentages of Ni, V, and S that the visbreaking method can remove are 12%, 13%, and 5%,
respectively. Some improvements have been addressed to this process for raising the percentage
of the metal removal, which is achieved by the addition of aqueous ammonium solution to the oil.
This modification increases the metal removal to 26%, 20% and 14% for Ni, V, and S, respectively.
Indeed, using the ammonium-water solution instead of water only limits the cock deposition from
0.61% to 0.27 % [12]. The main advantage of the process is to help dwindle the residual oil
production from the distillation process of crude oil. In contrary, there are several disadvantages
in this technique such as high process energy losses, low conversion efficiency, and deposition of
cock-forming olefins and asphaltene in the visbreaker, which can undergo a subsequent
transformation process forming tar and hardly recyclable residues [13].
Using a chemical agent
Handling the heavy crude oil through a demetallization process using acids is an efficient process
that has been applied since many years. The interaction between the acid and the oil containing
the metals can be explained by the following replacement reaction.
PM + HX→ PH + MX
The main objective of using acids is to remove the sulfur, nitrogen and metal content from the
crude oil. The process has been applied for the purification of animal and vegetable oils. Since
more than a hundred years the idea was to upgrade petroleum oil using sulfuric acid. Marcusson

10
and Eickmann in 1908 implemented the earliest work on the precipitation of asphaltenes by
employing the low boiling point naphtha. This process followed by fractionation of naphtha
soluble material with concentrated sulphuric acid [14]. Indeed, applying the sulphuric acid in the
demetallization process faces several challenges, because some of the acids transfer into sulfur
dioxide during the treatment process. Accordingly, the formed sulfur dioxide undergoes a further
reaction with the unsaturated hydrocarbons and goes in a side reaction forming bi-products. This,
in turn, increases the complexity of the oil and decrease the rate of the elimination process[2].
Also, sulfuric acid reacts with the hydrocarbons in the oil, which leads to increasing the acid’s
quantity that required for the process and declines the amount of oil produced.
1.1.3 Hydrotreatment
The conventional hydrotreatment, it is also called the hydrogenation process (HMD-HSD) is one
of the most effective methods for demetallization and desulfurization of crude oil. In such a
method, compounds comprising sulfur, nitrogen, oxygen and/or metals are extracted through a
hydrogenation process. Around 90% of metals in the feedstock can be withdrawn using a catalyst
containing Ni, Co, and Mn [14]. The size of the residual molecules is an essential parameter that
controls the process, and in general, it depends on the origin, nature, and the. chemical composition
of the feedstock. Additionally, the catalyst type, pore size, surface area, and residence time are
relevant parameters in HDM process.
Although hydrodemetallization and hydrodesulfurization are ones of the most efficient techniques
for metals and sulfur removal, they have several disadvantages. The most important ones include
catalyst deactivation in an extremely short time, due to the accumulation of metal oxides on the
pore of the catalyst[15]. This aspect, in turn, increases the amount of hydrogen necessary to
accomplish the process and lowers the yield production due to the carbon rejection [1]. Moreover,
the process has an adverse influence on the equipment during the refinery processes. Also, the
extremely high cost of the process due to the elevated pressure which reached up to 100 atm,
temperature up to 400 ℃, and higher hydrogen concentration are common drawbacks in such
method. Hydrodesulfurization process can not extract the high molecular weight sulfur compounds
such as 4,6-alkyl substituted dibenzothiophene, due to the steric hindrance adsorption of such

11
compounds on the surface of the catalyst. This issue significantly impacts negatively on the activity
of the catalyst and prevent the transformation of the compound into H2S.
To sum up, a significant portion of the percentage of energy consumption related to the chemical
and petrochemical industry is being replaced by electricity. As a result, chemical processes are
now undergoing radical changes to combine technological innovations and the urgent need to
tackle climate change. The Struggle between the clean electricity with un-conventional heating
mechanisms has revolutionized the industry in the last few decades. The most common heating
mechanisms include induction heating, plasma, ultrasound, and microwave heating. This work
demonstrates the fundamentals and the application of microwave to upgrade petroleum oils by
removing sulfur and metals.

12
LITERATURE REVIEW
In the scientific publications, several investigations have been documented for metals and sulfur
removal from heavy petroleum oil. The main two research groups in this field work on (1)
developing a novel technique for the extraction process, and (2) improving the understanding of
the removal mechanism. Most of the researchers of those groups have carried out their studies
using various model compounds instead of using the complex heavy oil. The reason behind this
strategy is to better understand the removal mechanism in an ideal way and avoid the complex
composition of the heavy crude oil. The most common model compounds that have been employed
in the previous studies are revealed in Table 2.1
Table 2.1 Various model compounds for the demetallization process (reprinted from reference
[1])
Model compound Reference
Nickel protoporphyrin disodium (NiPPDS) [6]
Vanadyle tetraphenyl porphyrin (VOTPP) [16-18]
Vanadyl octaethyl porphyrin (VOEP) [6, 19]
Nickel tetra-(3-methylphenyl) porphyrin (Ni T3MP) [20]
Nickel tetraphenyl porphyrin (NiTPP) [21]
Vanadyl oxide octaethyl porphyrin (VOOEP) [17]
Nickel etio porphyrin (NiEP) [19, 22]
Nickel octaethyl porphyrin (Ni OEP) [23]
Vanadyl etio porphyrin (V EP) [22]
Vanadyl mesotetraphenyl porphyrin ( VO MTPP) [24]
For better implementing the sulfur and metal removal process, determining the exact concentration
of such contamination before the removal process is a must. For this reason, several attempts have
been built at the expense of determining the amount of metals into the different origins of crude
oil. Ali et al. [25] have designated the quantities of various metals that exist in four market quality
Arabian crude oil. The authors have detected that the amount of vanadium and nickel were ranging
from 2.2 ppm to 57.9 ppm and from 0.55 ppm to 16.7 ppm respectively. They also determined the
amount of sulfur located in such oils and affirmed that it was ranging from 1.1 wt.% to 2.8 wt.%.
A patent has been implemented for metal extraction by Yamada et al. [26] who have invented a
novel technique for metals extraction from the waste oil.

13
In such a technique, the oil was heated to 177°C - 238 °C, then a reaction between the oil and an
organic solvent took place under a reflux condition. After the reaction had completed, The mixture
was exposed to centrifugation process, and the residual oil containing 154 ppm of V was heated to
182-216 °C for 1 hour under reflux with hexane. This process gave the oil with 0 ppm V soluble
in hexane after the centrifugation. Another method was conducted by Koseoglu, O.R., et al.[27]
for the demetallization of the heavy crude oil using solid adsorbent materials such as attapulgite
clay, alumina, silica gel, and activated carbon. The feed stream was contacting one or more solid
adsorbents inside a mixing vessel for a time adequate to achieve the complete absorption of almost
all the metals components present in the crude oil. Then, the mixture was exposed to atmospheric
flash distillation followed by a vacuum flash distillation process for assortment the low boiling
point fractions that including low concentrations of undesired metals. Both of the two distillation
processes were implemented to recover part of the adsorbent that was applied during the adsorption
method for the reusing again in the same process
A biological method using a microbial treatment for the demetallization process was enforced by
Salehizadeh, H., et al. [17]. Aspergillus sp that was isolated from the contaminated soil has the
capability of consumption of the vanadium oxide octaethyl porphyrin (VOOEP). Such fungi induce
a degradation process for about 55% of VOOEP along seven days under the optimum conditions
of temperature 30 ºC, PH of 5.5, and initial concentration of 20mg/l. It was noticed during the
process the existence of free vanadium with a high concentration in the aqueous phase; this
indicates that the fungi helped to liberate the vanadium from the porphyrin moiety. The main
drawbacks of this method are the long residence time reaches to several days. Additionally, the
method suffers from a lack of selectivity in removing the metals from the oil, but it can exclude all
the metalloporphyrin fraction which decline the oil yield [6, 7].
Kutowy, O., et al. [28] have applied a filtration technique for heavy molecular weight residues and
inorganic substances removal from the aliphatic hydrocarbon liquids. These liquids exemplified in
spent diesel lubrication oil, crude oil or pipeline blend crude oils and heavy oils, and bitumen. The
removal process was employed by passing the liquid oil through a membrane with a swelled outer
layer containing a microporous, polysulfone compound, an aliphatic liquid hydrocarbon
membrane. The viscosity of the liquid hydrocarbon should decrease either by heating or by using

14
solvents before contacting the membrane. This method was found to be convenient for N, S, Al,
Cr, Cu, Ni, V removal from the various types of oils that have mentioned above. Arod et al.
Arod et al. [29] have worked on the demetallization process using the ultrafiltration method of
vacuum residue at an elevated temperature about 330 °C. A ceramic membrane was employed in
such method with an average diameter of 10 nm, and the system was adjusted at a flow velocity of
5.6 m/s and trance- membrane pressure of 500 kPa. The authors have claimed that the process
declined the asphaltene content in the heavy oil from 6.3 wt.% to 4.1 wt%, and reduced the
vanadium from 195 ppm to 90 ppm.
Duong, A., et al. Also have applied the ultrafiltration process using an asymmetric, single-tube
ceramic membrane for the upgrading of cold lack heavy oil [30]. The membrane that has been
applied was of length 25 cm, o.d. 1 cm, average pore diameter 0.02pm - 0.1 pm, and the process
was implemented under mild conditions of a transmembrane pressure 600 kPa and temperature
about 110 °C. (T) in the range 80 °C - 160 °C and cross-flow velocities (tTcf) in the range 2 m s-1-
10 m s-1. The variation in both asphaltene content and the permeate flux as a function of time-on-
stream was detected during the process. There was a notable drop in the permeate flux in a short
period due to the fast fouling of the membrane. This issue results in raising the retention of
asphaltene from 1% to 80%. It was found that the reduction of the asphaltene content depends on
the density and viscosity of the permeate flux, in addition to the Ni and V content. Thus, both the
membrane pore diameter and the cross-flow velocity are critical parameters that control the
permeate flux and the asphaltene retention, and accordingly the membrane fouling. The main
conclusions of this study that were confirmed by the authors are the ultrafiltration able to remove
up to 90% of asphaltenes from the Cold Lake heavy oil under a permeate flux < 100kgm-*day-.
The ultrafiltration process has limited commercial applications because of the high cost of the
ceramic membrane which rapidly stains after a short time. So, to avoid the capital cost of the
process to be applied in large-scale operations, employing higher permeate fluxes is a must.
Osterhuber, E.J. [31] have incorporated both the solvent dissolution and ultra-filtration methods
under the effect of high pressure for the upgrading of heavy oil. The heavy oil in the first was
completely diluted by applying the suitable solvent, then, the mixture exposed to ultra-filtration
process through a proper membrane to separate the solvent from the oil. The most convenient

15
membranes that can be used are cellulose, polyvinylidene fluoride. It was demonstrated that The
process has a high tendency for removing the trace metals, specifically, V and Ni with reducing
the conrods on carbon residue of the resulting oil. The authors have tested the ultra-filtration
process of Arabian heavy vacuum residue mixed with toluene with 1:1 ratio and they found that
the amount of vanadium and nickel were decreased from 180 ppm and 43 ppm to 25.8 ppm and
7.1 ppm respectively.
Phosphoric acid was employed by Kukes, S.G. and D.R. Battiste for Ni and V removal from heavy
crude oil [32]. Phosphoric acid reacts with metals forming oil inexplicable compounds that can be
separated by any separation process. Kukes, S.G., and D.R. Battiste have investigated the removal
of Ni and V from the Venezuelan crude oil at various acid concentrations and temperature for one
hour in a stirred autoclave. After the reaction has completed, the product passed through a glass
filter for separation. The Ni and V contents were detected using the atomic absorption spectrometry
and the plasma emission spectrometry. It was found that H3PO3 is effectively excluded V and Ni
from the heavy oil more than H3PO4. In the range concentration of 2 wt.% - 4 wt.%, the H3PO3
have Superiority over H3PO4 in V and Ni removal.
Eidem, P.K.[33] has employed the H3PO4 in the demetallization process of petroleum oil. A 250
g of residual oil was mixed with 1wt% of H3PO4 then the mixture exposed to stirring and heating
to 150 °C under nitrogen gas blanket. The temperature increased gradually to 260 °C, after passing
44min the mixture was separated into maltenes fraction and asphaltenes. It was pronounced that
the concentrations of Fe, Ni, and V in the original residual declined from 64, 101, and 63.3 to 0.06,
14.5, and 9.70 respectively.
Ni and V contaminants have also been removed by using SO2 or SO2 precursors at 93-232 °C and
for 0.01h - 5h. The mixture is then exposed to a vacuum distillation process for separation into a
distillate with boiling point 271°C and low metals content, and a residue with high metals
concentration. The treatment of the heavy oil by the SO2 or SO2 precursors has successfully
reduced the vanadium contamination from 1.70 wt.ppm to 1.36 wt.ppm[34].
Michlmayr demonstrated Another novel chemical method for the upgrading of metal-
contaminated oil using ferric or stannic salt, M.J.,[35]. In this process, the oil stream exposed to an

16
extraction process using ferric or stannic chloride soluble in acidified water. The solution should
be kept in acidic medium to prevent the precipitation of ferric or stannic in the form of hydroxide
or a basic salt. It was confirmed that the ferric and stannic salts have a high ability for metal removal
especially ferric nitrate in nitric acid recorded the greater effectiveness of removal. The main
disadvantage of the process is the increase in the viscosity of the oil after the treatment because it
might enhance the oxidation and/or the polymerization of the unsaturated components in the oil.
Garwood Eric P[36] has implemented a process for sulfur removal using H2SO4 and vanadium
elimination by MgSO4. An electric generating plant containing the residual oil was used and the
oil mixed with 90 wt.% of H2SO4 by the ratio of 0.005-gallon acid/gallon of oil. The main findings
of such process were the reduction of sulfur content from 2.6 wt.% to 0.02 wt.%.
The further treatment took place for the desulphurized oil using 20 wt.% an aqueous solution of
MgSO4. Accordingly, the vanadium content was reduced from 395 ppm to 24 ppm, and sodium
was reduced from 21 ppm to 2 ppm. XU Zhen-hong et al. Have discovered a novel method for
removal of metal salts from crude petroleum and petroleum fractions using a demetallization agent
and demulsifying agent [37]. The metals in the feedstock are shifted to the aqueous phase by
emulsifying the feedstock at 30 °C -140 °C for 0.5 s to 10 min. The demetallization agent that has
been employed in this method is C1-4-fatty acid containing byproduct prepared by oxidation of
paraffin waxes.
Demetallization process has been reached by employing an aqueous base from group IA and IIA
hydroxides, carbonates, NH4OH and (NH4)2CO3, an oxygen-containing gas, and a phase-transfer
agent. Metals were eliminated from the oil at 180 °C and after sufficient time for conveying to the
aqueous phase. The authors have demonstrated that the process, fortunately, declined the amount
of both Ni and V and valorized the oil for applying in further operations [38]. Several investigations
have been performed for demetallization of petroleum oil by employing different acids such as
hydrochloric, hydrobromic, polyphosphoric and sulphonic acids. Such acids have a lack of causing
side reactions and product contamination. Hydrofluoric acid was found to be the best reagent that
can be utilized in the demetallization process. Such acid can extract roughly 90% of metals with a
high liquid yield of 85-90 wt.% [39].

17
Hurter, A.G. have used an aqueous solution of an anion for metal and ash removal from vacuum
residue or used lubricating oil [40]. The aqueous solution reacted with the metal from the oil
forming an aqueous salt such as NaCl and NH4Cl. The reaction took place at a high temperature
that equal or just below 100 °C and with a solution to oil ratio of 1:9. The process showed a notable
drop in the concentration of Fe, Al, Ca, and Na in the oil phase after ash separation by centrifuge
filter.
The oxidation process is a novel technique has applied by Gould, K. A. [41] for the demetallization
of cold lake asphaltenes, Arabian heavy asphaltene, and cold lake vacuum residuum. The method
has been implemented by using different oxidizing agents such as air, NaOH/air, sodium
hypochlorite, and peroxyacetic acid. The author declared that both sodium hypochlorite and
peroxyacetic acid have high performance towards the removal process, while, air and NaOH/air
are feeble oxidizing agents for demetallization. The major cons of the process are the ability of
both sodium hypochlorite and peroxyacetic acid to remove and destroy the porphyrin rings.
Additionally, sodium hypochlorite has the disadvantage of chlorine formation in the feed.
Moreover, the process is suffering from the unselective elimination of metals, porphyrin ring
removal, and consumption of the oxidant during the process which raise the cost.
Cumene hydroperoxide also was used in the demetallization process of the petroleum fraction at
80-250°C. The main disadvantage of such a process is the production of a high amount of
asphaltene with 93-96% metals contaminants. It was investigated that increasing the asphaltene
content is due to the polymerization, polycondensation, and oxidation by Cumene
hydroperoxide[42].

18
Table 2.3 Advantages and disadvantages of some demetallization method [1]
Method Advantage Disadvantage Reference
Ultrasonic radiations
with chemical
reactions
High-efficiency metal
removal
Can be applied only for mild and
noncatalytic operations [47]
Photochemical
method
Solvent recovery,
energy saving, safe
demetallization
method
Difficulty in removing bound-type
metalloporphyrins without solvent
addition
[44]
Micro-organisms Good potential for
metal removal Long time-consuming process [48]
Electrochemical MD The high metal
removal efficiency
High voltage required for high
metal removal efficiency [49]
Oxidation
By using the proper
oxidant, the process
has high metal
removal efficiency
with heavy feedstock
Consumption of the oxidant
during the removal process [41]
Nanosized catalyst High selectivity in
metal removal
The production of solid yield
depends on the time of
combustion, temp., and the
catalyst activity
[50]
Table 2.2 Efficiency of metal removal of some significant chemical methods (reprinted from
[1])
Method Removal efficiency % Reference
Red phosphorus 72 % Ni and 100% V [43]
Photochemical method for
atmospheric residue
98% Ni and 93% V [44]
Photochemical method for
vacuum residue
85 % Ni and 73% V [44]
Protonating agent 84 % VO-MTPP and 78% of VOOEP [24]
HF as protonating agent 90% metal removal and 85-90% oil recovered [45]
Peracetic acid as an oxidizing
agent
80%V and 74% Ni [41]
Organophosphate esters 99%V and 89.8% Ni [46]
Oxidation using NaClO 78%V and 37% Ni [41]

19
PROBLEM DEFINITION
Removal of metals and sulfur from the waste-derivative oil is indispensable since it would lead to
avoiding most of the issues and limitations that impede its uses in a wide range of commercial
applications. Although a considerable number of techniques have been developed and documented
regarding such objective, only some of them have industrially been established. The main reason
behind this aspect relates to the cons associated with each method. For instance, applying the
solvent extraction method leads to remove the whole fractions that contain the metals, which
declines the yield of the end-product. Distillation technique enhances the production of two grades
of oils: (1) Light oil, which is the primary product and contains a very low concentration of metals;
and (2) heavy oil, which contains a much higher concentration of contaminations that must go in a
further upgrading process for metals removal. Fast catalyst deactivation needs for an emulsification
process, high cost, and long processing time, among other factors, are additional aspects limit the
performing of the developed techniques. Ultrafiltration technique is a capital cost affected due to
the fast fouling of the membrane used in the process. So far, furthermore, no an industrial process
has been designed to remove sulfur and metal in a single step. Kindly refer to section 2 (methods
of demetallization) for further details.

20
ARTICLE 1: ELECTRIFICATION OF
DEMETALLIZATION AND DESULFURIZATION OIL PROCESSES:
FUNDAMENTALS AND PROSPECTIVE APPLICATIONS
Mai Attia, Sherif Farag, Shaffiq Jaffer, and Jamal Chaouki
Article submitted to: Journal of Energy & Environmental Science
Manuscript ID: EE-REV-05-2019-001490
Abstract
Even though the current noticeable pace of energy transformation paves the way for a more
sustainable future, the aspirational goal to meet the Paris Agreement’s Policy is unfortunately still
far off. More innovative solutions for high energy and low carbon intensity processes are urgently
needed to support accelerated progress toward that goal. Along with the innovation in renewable
power generation technologies, innovation in the end-use sectors is nowadays among the most
pressing needs. The results of such a roadmap include the prompt embedding of the electrification
of end-use sectors and integrating high shares of renewable power into the existing systems.
The case studied in this work is the chemical and petrochemical industry. This industrial sector
depends on oils for more than 50% of the total energy consumption, which must be electrified.
Employing clean electricity with unconventional heating mechanisms has initiated a revolution in
the industry during the last few years. The most common heating mechanisms that are being
implemented include induction heating, plasma, ultrasound, and microwave heating. Herein, the
fundamentals and applications of these techniques are demonstrated, and more attention is directed
to the microwave-assisted demetallization and desulfurization of petroleum oils by removing
sulfur and metals.
Keywords: Microwaves; demetallization; desulfurization; oil valorization; oil processing.

21
3.1 Unconventional heating mechanisms
The most common unconventional heating mechanisms are electromagnetic heating – including,
induction heating and microwave heating - plasma, and ultrasound.
3.1.1 Induction heating
Induction heating is a mechanism comprising a complex interaction of electromagnetism, heat
transfer, metallurgical phenomena, and circuit analysis. It is a non-linear heating mechanism since
the aforementioned physics depend on the applied electric and magnetic field intensities,
temperature, the microstructure of the target, and other factors. The theory of induction heating
relies on Faraday’s law of induction, which states that “circulating currents – also called eddy
currents – are induced in bulk pieces of metal moving through a magnetic field.” In the same
manner, an electromotive force (emf) is induced in a circuit by a changing magnetic flux. If an
alternating voltage is applied to an induction coil, an alternating current will flow in the coil circuit.
The alternating coil current produces a time-variable magnetic field in its surroundings. The
produced field has the same frequency as the coil current. If a workpiece is located inside or near
the coil, the produced magnetic field will induce eddy-currents inside the workpiece. The produced
eddy-currents have the same frequency as the coil current; however, they are in opposite directions.
The induced eddy-currents produce heat by the Joule effect, which is simply presented by “I2R,”
where “I” is the electric current and “R” is the electric resistance. The current distribution within
the inductor (coil current) and workpiece (induced eddy-currents) is not uniform because of the
acts of several electromagnetic phenomena. The most important include the following:
• Skin effect: also called penetration depth represents the non-uniformity of the electrical
current distribution within a conductor’s cross section carrying current. The high
concentration of eddy-current is located on the surface of the workpiece while zero is
measured in the center of the conductor;
• Proximity effect: expounds the interaction between the fields produced by the conductor
itself and the other nearby, which redistributes the induced current in the conductor; and
• Slot effect: explains the magnetic flux density in the gap between the inductor and the
conductor.

22
Other effects, such as the ring effect, end and edge effects, also impact the distribution of electric
current within the cross-section area of the conductor.
This heating mechanism leads the workpiece reaching a temperature of several hundred degrees
in less than a second, although it is impacted by the aspects mentioned above. Induction heating
has been well investigated at the lab-scale; however, it is still not in the commercialization track
due to scale-up issues and limitations.
3.1.2 Ultrasound
Ultrasound is propagated via a series of compression and rarefaction waves at frequencies of
around 20 kHz and continuing up to the order of MHz, induced at the molecule level in the
medium, which it passes in. Cavitation bubbles are formed because of the attractive forces of the
molecules at high power. The formed bubbles grow over a few cycles and take in some vapor from
the medium. The frequency of the formed bubbles matches that of the applied sound frequency.
At 20 kHz, the generated bubbles are relatively large, and their collapse results in strong
shockwaves that can be used in emulsification and other applications. In the frequency range of
100 kHz to 1000 kHz, the generated bubbles are much smaller, and their collapse induces a more
significant increase in temperature, which has been used in sonochemical applications. At
frequencies above 1 MHz, the cavitational effects are much weaker and, therefore, commonly used
for medical and industrial imaging purposes.
Under the effect of a sound field, the generated bubbles could trigger (1) coalescence – a bubble
combines with another to form a larger one; (2) rectified diffusion – individual bubbles grow over
several acoustic cycles at above a certain threshold pressure. Thereafter, degassing happens, which
means the bubbles leave the system entirely due to buoyancy if they grow large enough, then
collapse. Unstable bubbles at a certain point collapse, often violently. Bubbles below the threshold
pressure for rectified diffusion can dissolve into the solution.
Two competing theories exist to explain the chemical effects due to cavitation:
• The hot-spot theory: Localized hot spots are formed, which leads to reaching temperatures
and pressures in excess of 5000 K and 500 atm – when the bubbles cavitate.

23
• The electrical theory: On the surface of a cavitation bubble, an electrical charge is created
and forms enormous electrical field gradients across the bubble, which are capable of bond
breakage upon collapse.
A bubble grows until it reaches a critical size known as “resonance size,” which depends on the
applied frequency of the sound waves. At the resonance size bubbles (1) may become unstable and
collapse within a single or a small number of acoustic cycles (transient cavitation), and/or (2)
oscillate for many cycles at or near the linear resonance size (stable cavitation). The terms transient
and stable cavitation are used to define whether the bubbles are active in chemical reactions. The
chemical effects of ultrasound are attributed to the collapse of both stable and transient cavitational
events.
3.1.3 Plasma
Gaseous plasma contains a mixture of electrons, ions (which are the heavy particles), and neutral
particles. The heavy particles might partially be excited for the high energy of plasma. The exciting
part may return to its ordinary state by photon emission. Therefore, plasma consists of electrons,
ions, neutrals in the ground state, excited species, and photons. Such a mixture is only called
plasma if it is electrically in nature. The case of the positive and negative charges in balance is
called quasi-neutrality.
Plasmas occur over a wide range of pressures and temperatures and, therefore, are classified
according to the electron temperature and electron density, as follows:
• Extremely tenuous, such as solar corona, T ~ 106 K
• Ionosphere, similar electron density, T ~ 103 K.
• Flames show a bit higher electron densities and temperatures than ionosphere
• Glow discharges pressure, 10-4 to 1 kPa and T ~ 104 K
• Fluorescent lamp, Telectron ~ 2.5 X 10⁴ K, while Theavy-particle ~ 300 K
• Thermonuclear fusion, T ~ 106 K to 108 K.
• Thermal plasmas, T ~ 104 K

24
Generally speaking, thermal plasma is generated by applying an electric current through a gas.
Gases at room temperature are excellent insulators; thus, involving an electrical breakdown is
essential. This is usually achieved by generating a number of charges to make the gas electrically
conducting. Electrical breakdown creates a conducting path between a pair of electrodes. Passing
an electric current through an ionized gas leads to gaseous discharge. There are various ways to
produce plasmas, most commonly include Electrodeless RF discharges, Microwaves, Shock
waves, High-energy particle beams, Laser, and Heating gases in a high-temperature furnace.
Plasmas have been used in several industrial applications, such as coating and synthesis of ceramic
powders, such as carbides, nitrides, oxides, and other applications.
3.2 Microwave heating
In 1831 the electromagnetic induction was discovered by Michael Faraday, and thereafter
Faraday’s law was documented. James Clerk Maxwell worked on Faraday’s concept and in 1864
presented a mathematical framing of the combined impact of electric and magnetic fields. Later,
it was known as electromagnetic theory. In 1865, Maxwell displayed the electromagnetic theory
through 20 equations in his article “A Dynamic Theory of the Electromagnetic Field – 1865.”
Those 20 equations were thereafter simplified into the forms known today as “Maxwell’s four
equations,” which as fundamental to electromagnetic phenomena as Newton’s laws are for
mechanical phenomena. The equations are presented below.
1. Gauss’s law for an electric field
∮ 𝐸. 𝑑𝐴 = −𝑠
𝑞
휀0 (1)
The total electric flux through any closed surface (E) equals the net charge inside that surface (q)
divided by the permittivity of free space (휀0).
2. Gauss’s law for a magnetic field
∮ 𝐵. 𝑑𝐴 = 0𝑠
(2)

25
The net magnetic flux through a closed surface (B) is zero; this implies that magnetic field lines
cannot begin or terminate at whatever period.
3. Faraday’s law of induction
∮ 𝐸. 𝑑𝑠 = −𝑑∅𝐵
𝑑𝑡 (3)
The induced emf, which is the line integral of the electric field around any closed path, equals the
rate of alteration of magnetic flux through any open area bounded by that path.
4. Ampère–Maxwell law
∮ 𝐵. 𝑑𝑠 = 𝜇0 𝐼 + 휀0𝜇0
𝑑∅𝐸
𝑑𝑡 (4)
It describes the generation of a magnetic field by an electric field and electric currents. The line
integral of the magnetic field around any closed path is the sum of the magnetic permeability of
free space (𝜇0) times the net current through that path and 휀0 𝜇0 times the rate of change of electric
flux through any surface bounded by that path.
Electromagnetic radiation behaves like photons carrying radiated energy and waves moving at the
speed of light. As depicted in Figure 3.1A, electromagnetic waves are comprised of an alternating
electric field orthogonal to alternating magnetic field. The magnetic and electric fields propagate
in the direction of oscillation. The frequency of the electromagnetic spectrum covers a wide range
starting from 300 MHz and ending at 300 GHz. The corresponding wavelength of these
frequencies is from 1 m to 1 mm. This frequency range includes a number of electromagnetic
wave-based applications, such as radio waves, microwaves, infrared, visible light, ultraviolet
radiation, X-ray, and gamma-ray, as shown in Figure 3.2. It should be known that each of these
applications is restricted by a frequency range and corresponding wavelength to avoid overlapping
each other.
Throughout the 20th century, microwaves have been established in several applications, e.g.,
communications, navigation, radar detection, power transmission, and microwave heating. These

26
noticeable and solid establishments are the result of the rapid development of the electromagnetic
technology over the last few decades.
Recently, microwave heating (MWH) is being widely implemented in a number of industrial
sectors, which is a result of the increased attention on the field by scientific research and
development.
3.2.1 Polarization mechanisms of microwaves
Interaction between microwaves and target materials takes place at the molecular level, and is
classified into four main polarization mechanisms:
i. Electronic Polarization, which is a displacement of valence electrons around the nuclei, as
depicted in Figure 3.1B;
ii. Atomic or Ionic Polarization, which is a relative displacement of positive and negative ions
or atoms from their equilibrium position, refer to Figure 3.1C;
iii. Interfacial Polarization, which is an accumulation of charges at interfaces between
components in heterogeneous systems, as shown in Figure 3.1D; and
iv. Orientation or Dipolar Polarization, which is explained by the permanent dipole moments
in molecules that tend to re-orientate under the influence of an alternating electric field, as
demonstrated in Figure 3.1E.

27
(B)
(C)
(A)
(D)
(E)
Figure 3.1 Polarization mechanisms of microwaves
Electric
field
Magnetic
field
Propagatio
n direction

28
Figure 3.2 Electromagnetic spectrum (Reprinted from reference [51])
Dipolar polarization is the most dominant mechanism of microwave-induced heating. Materials
contain permanent dipole moments that have randomly oriented molecules in the absence of an
external alternating electric field. The reason is that there is no net dipole moment being presented.
Application of an external alternating electric field leads to aligning the molecules with the
oscillating field. This aligning (also known as reordination) results in permanent dipoles parallel
to the alternating field, which makes the aligned dipoles track the fluctuation of the electric field
[51-54].
The oscillation frequency of the applied electric fields is in the order of GHz. This huge oscillation
rate, fortunately, makes the agitated molecules unable to reorient themselves at that frequency rate.
This aspect creates a phase shift between the orientation of the dipoles and the applied field, which,
subsequently, creates random collisions between the re-oriented molecules. The created collisions
are responsible for releasing heat energy from the irradiated material.
Due to the conversion of electromagnetic energy to heat taking place within the entire volume of
the target material, respecting the penetration limits of the applied waves and the material,
microwave heating is defined as a volumetric energy conversion mechanism [55-58]. This
mechanism is fundamentally different from the superficial heat transfer of conventional heating

29
and, therefore, noticeable advantages of microwave heating have been highlighted during the last
few years.
3.3 Microwave heating parameters
The main parameters governing the level of heat generation within the irradiated material are
“complex permittivity” (ε) and “complex permeability” (µ). Complex permittivity is linked to the
alternating electric field component of the microwaves. It represents the ability of the heated
material to absorb and store electric potential energy, i.e., it defines the response of the payload to
the applied electric field. As well, complex permeability is linked to the alternating magnetic field
component of the microwaves. It represents the response of the heated material to the applied
alternating magnetic field component. Complex permittivity and complex permeability are
expressed by Equations (5) and (6), respectively.
ε = ε/˗ j ε// (5)
µ = µ/˗j µ// (6)
The real part of Equation (5) – ε/ – is called “dielectric constant” or “permittivity.” It measures the
ability of the target material to pass microwaves, more specifically, electric field, through it. The
imaginary part of the complex permittivity – ε// – is called “dielectric loss factor.” It indicates the
ability of the heated material to dissipate microwave energy; in other words, it measures the
amount of electric energy that can be stored within the exposed material. Primitivity
mathematically equals the product of the permittivity of free space, εo: 8.854×10⁻¹² F/m, and the
material relative permittivity (ε/r).
The ratio between permittivity and the dielectric loss factor is called loss tangent (tan δ), Equation
(7). Loss tangent represents the phase difference between the polarization of the target material
and the oscillating applied electric field. It measures the ability of the exposed material to convert
the absorbed microwave energy into heat energy.
tan δ= ε// / ε / (7)

30
where δ is the phase difference between the alternating applied electric field and the polarization
of the exposed material [59].
The real part of Equation (6) – µ/ – is called “magnetic permeability” and defines the amount of
magnetic energy that can be stored within the heated material. Magnetic permeability equals the
product of the permeability of free space (µo) – 4π×1-7 F/m – and the relative permeability of the
material (µ/r) [52, 53, 60].
The imaginary part of complex permeability, µ//, represents the magnetic energy that can be
converted into thermal energy. The fraction between µ// and µ/ is called “magnetic loss tangent,”
and can be expressed by Equation (8).
tan δµ= µ/// µ/ (8)
Most of the material processed in chemistry applications are non-magnetic materials, which means
the microwave effects that convert microwave energy to heat energy within the target material are
fundamentally due to the interaction with the electric field component of the applied microwaves.
It is important for the application to get full information about the dielectric properties of the
reactants. Typical values of ε/ and ε// for the selected materials are tabulated in Table 3.1. It is
critical to consider that the value of the dielectric properties is highly affected by the material
temperature and the frequency of the applied alternating waves [51, 53, 54, 57].

31
Table 3.1 Dielectric constant, dielectric loss, and loss tangent of selected materials
Material ε/ ε// tan δ T [oC] f [GHz]
Vacuum1 1.00 0 0 25 NA
Air1 1.0006 0 0 25 NA
Glass (Pyrex)1 4.82 0.026 0.0054 25 3
Fused quartz 4 0.001 0.00025 20 2.45
Styrofoam1 1.03 0.0001 0.0001 25 3
PTFE1 2.08 0.0008 0.0004 25 10
Titanium oxide1 50 0.25 0.0050 25 NA
Magnesium oxide1 9 0.0045 0.0005 25 NA
Aluminum oxide1 9 0.0063 0.0007 25 NA
Zinc oxide1 3 3 1.0000 25 NA
Water, ice2 0.003 0.001 0.3333 -12 2.45
Water, distilled2 78 12 0.1538 25 2.45
Apple2 57 12 0.2105 19 2.5
Beef, frozen2 4.4 0.53 0.1205 -20 2.45
Beef, cooked2 30.5 9.6 0.3148 30 2.45
Potato2 15.7 0.27 0.0172 25 2.45
Paper2 2.7 0.2 0.0741 NA 2.45
Paper2 2.8 0.2 0.0714 NA 0.915
Polyethylene2 2.26 0.002 0.0009 NA 0.915
Polyethylene2 2.3 0.001 0.0004 NA 2.45
Methanol1 32.6 21.48 0.6589 25 2.45
Ethanol1 24.3 22.86 0.9407 25 2.45
Zirconium oxide1 20 2 0.1000 25 NA
NA: Not available
Adapted from references [51, 52, 59, 61]

32
Based on the dielectric properties of the target material, the interaction of materials with
microwaves is classified into three main groups:
1. Absorbing materials, which are high-dielectric loss materials that highly absorb the applied
microwaves and convert them to heat energy, e.g., silicon carbide and carbon;
2. Transparent materials, which allow electromagnetic waves to pass through them with little
attenuation, e.g., ceramics, quartz, glass, and air; and
3. Impermeable materials, which reflect the applied electromagnetic waves, e.g., highly
conductive materials, such as metals.
In addition, magnetic materials interact with the magnetic component of the applied
electromagnetic field, e.g., typically ferrites.
3.4 Dissipated power and penetration depth
The rate of heat energy absorbed by the heated material (𝑃𝑎𝑣), which is also called the heat energy
generated or the microwave energy dissipated within the material, can be estimated using Equation
(9). This equation is comprised of two terms:
1. the absorbed electric energy term, which is a function of the applied alternating electric
field; and
2. the absorbed magnetic energy term, which relates to the oscillating magnetic field.
VHVEP rmsefformseffoav
2//2// += (9)
where 𝑃𝑎𝑣: average absorbed power [W]; ω: angular frequency [s-1] = 2πf; ε//eff: effective dielectric
loss factor [-] and equals the losses due to conduction (ε//cond) and polarization (ε//
polar), Equation
(10); Erms: root mean square of the electric field [V/m]; µ//eff: effective magnetic loss factor [-];
Hrms: root mean square of the magnetic field [A/m]; and V: volume of the target material [m3].
ε//eff = ε//
polar + ε//cond (10)
In most chemistry-based materials, the term that represents the conversion of magnetic energy into
heat energy is neglected since the materials are non-magnetic. In the case of such materials,

33
decaying the applied electric field along the heated material is measured using the “electric field
penetration depth” – also called “electric field skin depth” (Dp), Equation (11). It represents the
depth at which the magnitude of the applied electric field drops by a factor of 1/e (=1/2.7183) of
the surface’s value, Figure 3.3.
EDy
oeEE/−
= (11)
The same definition is used to represent the dissipated microwave power inside the target material,
which is called “power penetration depth” (Dp). It should be noted that Dp= DE/2.
(A) (B)
Figure 3.3 (A) electric field penetration depth, and (B) power penetration depth
3.5 Microwave heating vs. conventional heating
The unique advantages of MWH establish this heating mechanism as an alternative to conventional
heating (CH) in a number of applications. The mechanism of MWH relies on direct volumetric
energy conversion, i.e., direct conversion of electromagnetic energy to heat energy within the
volume of the heated material. This mechanism is fundamentally different from the superficial
heat transfer of CH and, thus, can avoid most of the issues and limitations associated with CH,
which most importantly include the temperature gradient inside and outside the heated material.
The interaction between microwaves and the heated material, which is mainly based on the
E
Eo
𝐸𝑜
𝑒
DE y
𝐸 = 𝐸0 𝑒−𝑦
𝐷𝐸
P
Po
𝑝𝑜
𝑒
Dp y
𝑃 = 𝑃0 𝑒−𝑦
𝐷𝐸

34
dielectric properties of the material, leads to selectively heating the target. This reduces the heat
energy required to achieve a particular end, which consequently results in decreasing the operating
costs as well as the potential of thermal hazards. In addition, it can restrict secondary reactions and
might lead to (1) producing material with a novel microstructure, (2) initiating reactions that cannot
be initiated when CH is applied, and (3) achieving the existing reactions under conditions that are
different from those of traditional processing. Furthermore, numerous investigations have reported
that MWH can save more in energy consumption and enhance product quantity and quality
compared to the conventional processed materials [62-68].
Chandra Shekara et al. have documented that MWH achieves a better conversion compared to CH
[62]. MWH modifies the porosity of the processed materials and leads to a faster reaction rate at
less energy consumption compared to CH as claimed by Paixão, Monteiro et al. [63]. Patil, Gude
et al. agree with Paixão, Monteiro et al. on the impacts of microwaves on the reaction rate [69].
A higher product yield in less reaction time has been reported by Zhang and Zhao [64]. Budarin,
Clark et al. have investigated the influences of microwaves on the product quality compared with
the conventional processes, which led to documenting that the obtained oil contains few impurities
and is rich in aromatics [66]. Guiotoku, Rambo et al. tend to believe that MWH increases the
carbonization yield [70]. MWH decreases catalyst loading and liquefaction according to Krzan
and Zagar [71]. Dogan and Hilmioglu found that MWH significantly shortens the reaction time
compared to the traditional methods [72]. Increasing the conversion that is compared was reported
by Sithambaram, Nyutu et al. [73]. Orozco, Ahmad et al. are in agreement with the above-
mentioned claims regarding the higher product yields, shorter reaction time, and higher reaction
rate at moderate temperature [74]. The same conclusion was reached by Lucchesi, Chemat et al.,
and Menéndez, Domínguez et al. 2004 [68, 75]. Karthikeyan, Balasubramanian et al. believe that
applying MWH leads to a faster extraction rate and produces different chemical components than
CH [67]. Zhu, Wu et al. and Farag, S et al. have reported the noticeable impacts of MWH on
enhancing product quality [57, 76]. Further details about the nature of MWH are demonstrated in
the references [56, 77].
In summary, it is believed that applying MWH impacts reaction kinetics in addition to the
noticeable effects on the product yield, product quality, and energy consumption. It should be

35
noted that these key conclusions highly depend on the dielectric properties of each component of
the target(s) and other aspects.
3.6 Upgrading petroleum oil using microwaves
During the past few decades, substantial attention has been directed to petroleum heavy oils for
use in several commercial applications. However, the demand for such oils is limited due to serious
concerns. One of the decisive issues that face heavy oils is the inadmissible level of metals
contamination. In fact, the problem places the refinery processes in jeopardy as a result of severe
damage to the contact surfaces. Furthermore, it gives rise to numerous environmental issues for
both humanity and the atmosphere. The most important include emissions into the environment as
a poisonous gas in the form of SOx and NOx. Vanadium oxide reacts with mucus into the human
body, causing irritation. Nickel in the form of nickel carbonyl is a carcinogenic matter resulting in
numerous types of malignant neoplastic diseases. During the refinery processes, metals also play
a hazardous role in enhancing the corrosion problems on the contact surfaces. Calcium and
magnesium chlorides become hydrolyzed when they are subjected to temperatures of 170 °C,
leading to the production of HCl, which is a highly corrosive agent. Furthermore, metals have an
impediment impact on the efficiency of the catalyst during the refinery process. The main reason
for this is due to the catalyst pores becoming rapidly plugged by minerals, which results in fast
catalyst deactivation. Consequently, it elevates the rate of uptake of the catalyst during the process,
which augments the monetary value of the technique. Also, the accumulation of metals on the
surface of catalysts exhibits dehydrogenation activity as it intensifies the dehydrogenation
reactions during the cracking operation. This issue raises the production of increased amounts of
coke and dry gases at the expense of the liquid output. Additionally, if the product is used as fuel,
the metals in the fuel oil will heighten the production of ash. When oil is burned, the ash deposits
on the engines, causing significant abrasion in the moving parts.
For a better understanding about the principal obstacle that challenges heavy oils, considerable
efforts have been made to specifically determine the main characteristics and the impurity content
of the oils, refer to Figure 3.4. It has been demonstrated that the concentration of various metals
existing in heavy oils varies from a few parts per million to higher than 1000 ppm, as shown in
Table 3.2

36
Table 3.2 Actual concentration of metals in the crude oil (adopted from reference [1])
Petroleum feedstock Concentration (ppm)
Extra light Less than 10
Light 10-200
Heavy 50-500
Extra heavy 200-1000
Some of the most distinct elements that have been identified in the oil include cobalt (Co), nickel
(Ni), copper (Cu), vanadium (V), silver (Ag), sodium (Na), potassium (K), lithium (Li) ,calcium
(Ca), and strontium (Sr) [1, 2].
Discovering the chemical structure of metals in heavy oil is essential for better estimating the
ultimate metals removal process from heavy oils. In general, metals exist in an oil-soluble form of
naphthenic acid or complex organometallic compounds, i.e., the structure of the metalloporphyrin
ring [3, 4]. Both V and Ni can be present in the form of a porphyrin and nonporphyrin structure.
Figure 3.5-A demonstrates the general form of a metalloporphyrin complex, Figure 3.5-B shows
the structure of Ni tetraphenyl porphyrin, Figure 3.5-C depicts the structure of vanadyl octaethyl
porphyrin, and Figure 3.5-D shows the general structure of nickel etioporphyrin [1]. Figure 3.6
displays the structures of different vanadium porphyrin species in Venezuela crude oil. Other
metals, such as calcium, titanium, magnesium, and zinc, are found in combination with naphthenic
acid, as in soaps. The porphyrinic form was in fact extensively investigated due to its hazardous
impact and the role of its geochemical markers [5]. Similarly, the metallic elements in the shape
of metalloporphyrins are difficult to withdraw due to the high stability of the ring. Moreover, the
decomposition temperature of porphyrin compounds is usually more than 250 °C. For further
literature about the processes that have been developed for the removal of metals from petroleum
oils using different DMA, refer to Table 3.4

37
Figure 3.4 Composition of crude oil (reprinted from reference [78])

38
Figure 3.5 Different forms of metalloporphyrin rings (reprinted from reference [1])

39
Figure 3.6 Detected structures of different vanadium porphyrin species in Venezuela crude oil (reprinted from reference [79])

40
In the case of dealing with heavy oil, which is a poor microwave-to heat convertor while metals
are not, employing the microwave would lead to removing metals at a relatively low bulk
temperature. Microwave metal interaction will lead to creating local hotspots at the metal bonds,
which would lead to a weakening in the bond between the metals and the four nitrogen in the
porphyrin ring. This, in turn, would enhance the easy and rapid breakdown of the metal bond and
liberation of metals from the four N bonds. So, applying microwave heating will enhance the
selective removal of metals from the network of the oils. As a result, the yield of the treated oil is
not affected.
Theoretically, metals are perfect microwave reflectors, but in reality, they are not. In the case of a
conductor, i.e., high loss medium, Equation (12) represents the penetration depth of the target.
𝐷𝐸 = √𝜌
𝜋 𝑓 𝜇/𝜇𝑜 (12)
where 𝜌 is the electric resistivity; it is a fundamental property that quantifies how strongly a given
material opposes the flow of electric current. Decreasing the electric resistance of the heated
material (decrease the resistivity or increase the conductivity) shortens the penetration depth of the
applied microwaves. In the case of a perfect conductor, i.e., resistivity equals zero – penetration
depth equals zero, refer to Equation (13). This means that the applied electromagnetic waves are
totally reflected on the surface of the metals.
𝐷𝐸 = √𝜌
𝜋 𝑓 𝜇/𝜇𝑜= 0 (13)
However, in reality, the total reflection of microwaves is not possible for the limited resistance of
the heated conductor materials due to defects and impurities. Furthermore, resistivity is directly
proportional to temperature, according to Equation (14).
𝜌= 𝜌𝑎𝑚𝑏 (1+ 𝛼𝑅 ∆𝑇) (14)
where 𝜌𝑎𝑚𝑏 is the resistivity at room temperature; 𝛼𝑅 is the temperature resistivity coefficient; and
∆T is the temperature change.

41
Temperature, impurities, defects, and other factors play a role in increasing the resistivity of a
material. Increasing resistivity leads to increasing the penetration depth of the microwave, which
promotes coupling with microwaves, as shown in the flowchart below.
Table 3.3 demonstrates the penetration depth of selected metals at 2.45 GHz. It is clear that
microwaves penetrate only a few micrometers of the material, which makes the interaction
between metals in the form of small particles, such as powder, have a much higher interaction with
microwaves than in the form of sheets.
Table 3.3 Penetration depth of selected metals at 2.45 GHz
Pure metal Penetration depth (µm)
Nickel 2.7
Iron 3.2
Mercury 10
Silver 1.3
Vanadium 4.6
Zinc 6.4
Zirconium 6.7
Better coupling between a metal and microwaves is achieved at a particle size equal to or less than
the penetration depth of the target at the applied microwave frequency. It should be noted that
exposing metals in the form of powder to the atmosphere forms a thin layer of metal oxide film,
which consequently increases the effective power and penetration depth of the composite. Metal
with increased power and a particle size in the order of microns could reach a penetration depth
Increase sensitivity
Temperature
impurities
defects
and others
Increase penetration
depth
Promote coupling with microwaves

42
during heating that is greater than the same size of the particle at ambient conditions. Charge
buildup at the ends of the particles may affect the induced currents, which subsequently leads to
noticeable changes in the scattering patterns. Irregularly shaped particles may cause changes to the
current flux or direction, and the space between particles allows for deeper penetration of
microwaves.
In summary, magnetic loss factor is the principal source leading to microwave absorption in most
metals and some oxides, and not the dielectric loss.
Several techniques for upgrading petroleum crude oil have been reported in the literature.
Depending on the nature of the process, the techniques are grouped into physical methods, which
are mainly based on distillation or solvent extraction, and chemical, which refers to the use of
demetallization agents, thermal processes, and hydrogenation. The above methods are the main
technologies applied to extract Ni and V from crude oils. Coupling microwave heating with the
demetallization technology would lead to taking advantage of this heating mechanism. Most
importantly, it includes most of the demetallization agents (DMA), such as acids (e.g., sulfuric,
hydrofluoric, hydrochloric, nitric, phosphorus acids, and/or their salts), aqueous base selected from
Group IA and IIA (e.g., hydroxides, carbonates, NH4OH and (NH4)2CO3), salts (e.g., boron
trifluoride), oxidative agents (e.g., sodium hypochlorite and peroxyacetic acid), and chlorine-
containing compounds (e.g., Cl2, SOCl2, FeCl2, SnCl2, ZnCl2, TiCl4, RuCl3, CrCl3, and COCl2),
and the metal compounds contained in the oil are polar materials. This would act as a strong
microwave-to-heat converter. On the other hand, petroleum oils have a relatively low interaction
with microwaves, while the metals inside the oil have a high interaction, which means the
generation of heat energy is performed locally where the reaction between DMA and metal bonds
takes place. V and Ni among other metals exist in petroleum oil and are strong microwave
receptors, as demonstrated in Figure 3.7.

43
Figure 3.7 Penetration depth and heating rate of selected metals (Reprinted from (Gupta &
Eugene, 2007)
Khan and Al-Shafei [80] have patented a hydrodesulfurization process that includes MW
irradiation of a mixture of heavy crude oil with a catalyst and in the presence of hydrogen. The
process is based on the conversion of sulfur compounds present in the crude oil into hydrogen
sulfides. The method has been implemented under mild conditions, as the hydrogen was
maintained in the microwave and the reaction was done at a pressure range from 1 atmosphere to
400 psi. The temperature of the reaction ranges from 80° C to 400° C, with the most preferable
being 200° C to 250 °C. In this process, crude oil was mixed with an iron powder catalyst, then
the mixture was exposed to microwave heating in the presence of hydrogen. Microwaves have
been used to increase the temperature of the crude oil to 200° C. The key findings of the process
are that when the temperature of the oil remained at 200° C for twenty minutes, the sulfur
concentration decreased in the treated oil by 25%. By increasing the temperature, the concentration
was reduced by 2% more and reached 27%. By changing the catalyst to palladium oxide
diethanolamine as a polar additive, and a sensitizer in the existence of hydrogen, the sulfur
concentration decreased by 16-39% of hydrogen.

44
Chamorro et al. [81] applied the MWH technique to reduce the concentration of both metals and
sulfur in a carbonaceous material. As the carbonaceous material was mixed with an acidic
compound or a mixture of acids, such as HNO3, H2 SO4, HCL, HCLO4, H3PO4, HF, the mixture
was then exposed to microwave irradiation. The process took place at a time between 10 s and 1
h, and at a pressure not exceeding 200 psi, in order to avoid the evaporation of the components of
the reaction. The removal ration for both Ni and V reached 80% and 99%, respectively, in 15 min.
Cationic starches have been tested as a demetallization agent for the removal of both Ni and V
from crude oils using the MWH technique [82]. It was demonstrated that increasing the degree of
cationic substitution of cationic starches, leads to increasing the removal efficiency of heavy
metals. The optimum reaction conditions for the removal of both Ni and V are 200 mg/L of cationic
starch 4 (CS4) with 300 W of microwave power for a residence time of 5 min. The removal
efficiency when applying the above conditions on nickel from Iran and Shengli crude oil were
55% and 60%, respectively, and in the case of V were 76% and 79%, respectively.
3.7 Microwave prospective applications
The significant advantages of the energy conversion mechanism of the microwave heating have
been underlined as volumetric, uniform – when the penetration and other limits of the applied
waves and the target are respected, and selective – mainly when the payload composes of multiple
components – heating technique; reduced energy consumption – the heated material must be a
strong microwave receptor; high reaction selectivity – especially in multiple reactants applications;
less heat transfer limitations – because it does not depend on the superficial heat transfer as the
conventional processes; equipment portability – mainly for small and medium powers; high power
density; process flexibility and robust; and instantaneous power control. Since microwave heating
is correlated with the structure characteristics – in other words, the physical properties – of the
target(s), the response of each heated material is different. This aspect leads to create a local
temperature that is totally different from the bulk temperature of the multiphase/multi-component
systems, which is exclusively associated with this heating mechanism.
In the oil industry, most common feedstocks – namely, crude oils and gaseous components – are
not active microwave receptors and, in turn, fail to establish substantial interaction with
electromagnetic microwaves. On the other hand, most metals, metal oxides and catalytic agents

45
are highly efficient microwave-to heat converters. This aspect, which is a rather complicated
matter in several applications, can make a revolution in the industry. Having a high local
temperature on the active site promotes the catalytic and non-catalytic reactions while the
relatively low temperature of the bulk material(s) restricts the undesirable secondary reactions
correspondingly. As a result, it is believed that the applications of the outstanding temperature
gradient of microwave heating ameliorate not only the productively but the selectivity of various
reactions in the oil processing.
For example, conversion of methane to ethylene and acetylene is an endothermic process. The rate
of product formation is much higher than that of the complete decomposition of the feedstock,
which leads to the creation of carbon soot. Applying conventional heating in such reaction needs
quenching or fast cooling of the products to avoid undesirable further decompositions. Taking
advantage of the high interaction between microwaves and active catalytic agent in this reaction
and the low response of the produced gases to the microwaves can noticeably enhance the reaction
selectively. Microwave generates hotspots where the catalyst exists, leading to the decomposition
of methane. Subsequently, once the products leave the catalytic material, they face much lower
temperature, which avoids most issues and limitations associated with the conventional processes.
Other methane conversion processes, such as steam reforming, partial oxidation, and CO2 dry
reforming processes as well as other gas, liquid and or solid reactions can take advantage of such
outstanding selective heating of microwaves.
Although the vast interaction between microwaves and metals is well known, unfortunately, a little
attention has been directed to upgrading petroleum oils through the removal of metals, specifically
Ni and V; and S using microwaves. Therefore, the author of this work has invented three processes
for the removal of V, Ni, and S in addition to the other metals by applying a novel DM-DSA and
using the microwave heating technique. The process is green as no solvents are needed and, at the
same time, cost-effective because no emulsification-processes are required for mixing the agent
with the crude oil and other reasons. The process can reduce the concentration of almost all the
contaminations, specifically Ni, V, and S by more than 90%.
The reason behind this outstanding result is because the invented processes take advantage of the
non-uniform temperature distribution within the payload to enhance the removal efficiency of
46
metals and sulfur. The microwave receptors are the metals exist in the chemical network of the
crude oils and the employed DM-DSA while the poor microwave-to-heat converter is the crude
oil itself. The interaction between microwave and metals creates local hotspots at the metal bonds,
which consequently leads to weakening the bond between the metals and the four nitrogen in the
porphyrin ring. This aspect, in turn, enhances the easy and rapid breakdown of the metal bonds
and the liberation of metals from the core of the metalloporphyrin ring. Also, the high interaction
of the other metals in the form of polar salts exist in the oil boosts the removal of such metals from
the crude oil significantly. The difference in the dielectric and magnetic properties of the heated
components enhances the selective removal of metals from the network of the oils and keeps the
main skeleton of the oil without further degradation. As a result, the yield of the treated oil is not
affected compared to the other demetallization technologies.

47
Table 3.4 Selected literature on the demetallization of petroleum oil
Reference (Author,
Date) DMA Method Key findings
Important notes
Eidem 1988 [33]
H3PO4
Stirring and heating under a
nitrogen gas blanket to 150 °C,
the temperature is gradually
raised to 260 °C, the reaction
time is 44 min.
Fe decreased from 64 to 0,06
ppm
V decreased from 63,3 to 9,7
ppm
Ni decreased from101 to
14,5 ppm
Michlmayr 1977 [35]
Ferric chloride
and hydrogen
chloride
Feedstock: Arabian crude oil
(50ppm V and Ni)
Rotary disk contactor (3 stages,
93 °C)
Settling (oil phase and water
phase)
The oil phase is withdrawn, dried
and freed of hydrogen chloride
metal content reduced by at
least 20%.
Aqueous solutions of
acid alone are not
effective.
pH must be acidic.
Kukes and Battiste
1985 [32]
Phosphorous acid
(H3PO3)
The reaction requires 2-4 wt.% of
acid, reaction time between 1-2h.
The process removes from
49% to 99% of V and Ni
respectively.
P 1972
[83]
H2SO4 for S
removal and
MgSO4 for V
removal
The residual oils treated with
sulfuric acid then each treated
with a 20 wt.% aqueous solution
of magnesium sulfate, the
reaction temperature of about
120 F
S decreased from 2,6 to 0,02
wt.%, V from 395 to 24 ppm,
and Na form 21 to 2 ppm.
Marcusson and
Eickmann 1917 [84]
Sulfuric acid Treatment of the asphaltic
materials with low boiling
naphtha, followed by
Many side reactions
with the hydrocarbons.

48
fractionation of the naphtha-
soluble material with
concentrated sulfuric acid.
Greaney and Polini
1999 [85]
NaOH, KOH,
ammonium
hydroxide and
carbonate
400 g of water, 193 g of sodium
hydroxide, 50 g of 40 wt.%
tetrabutylammonium hydroxide
(TBAOH) and 1 ml of Triton-X-
100 surfactant.
The temperature of the glass
reservoir was 100° C.
vanadium decreased form
29.6 to 2.9 ppm and nickel
from16.5 ppm to 6.3 ppm.
The residuum phase
was set apart by the
addition of toluene to
the sample followed
by centrifugation,
Gould 1980
[41]
Oxydizing agents
(air at 100 °C,
NaOH/air, sodium
hypochlorite and
peroxyacetic acid
These DMA were tested on Cold
Lake asphaltenes, Arabian Heavy
asphaltenes and Cold Lake
vacuum residuum.
Demetallization is
proportional to the amount
of oxidant used.
Air at 100 °C and
NaOH/air does not
have appreciable
demetallization
activity. Sodium
hypochlorite and
Peroxyacetic have
high demetallization
activity coupled with
the ability to remove or
destroy
petroporphyrins, cause
chlorine incorporation
into the feed.
Kashima oil Co., Ltd.
Japan. 1983
[86]
1,2,3,4-
tetrahydroquinoli
ne
A 20:60 g mixture of a vacuum-
distillation residue (288 ppm of
V) and 1,2,3,4-
tetrahydroquinoline was
autoclaved (5mL/min to 216 °C
for 60 min) then cooled and
filtered.
83% of V was removed

49
D.A. Young 1979
[87]
ZnCl2 and TiCl4
Hydrocarbon feedstocks were
blended with ZnCl2 and TiCl4
(2.0-4.5 lb/bbl oil). The resulting
mixtures are treated with
hydrogen at approximately 288-
482 °C
A heavy Iranian residue was
hydrogenated at 343 °C, 1034-
2500 kPa, for 2 h and 7000 rpm
stirring rate in the presence of
ZnCl2 (4.2 ppb)
70% of the Ni and V
contaminants were
converted to oil-insoluble
forms
Coke formation being
<3 wt.%
U.S. Patent Nos:
-Young 1979 [88]
- Siskin1977
[89]
- Michlmayr
1977[35]
- Nametkin, Gubin et
al. 1976[90]
-Gleim 1969)[91]
Chlorinating
compounds (Cl2,
SOCl2) or
inorganic salts
(FeCl2, SnCl2,
ZnCl2, TiCl4,
RuCl3, CrCl3,
COCl2) or their
aqueous solutions.
Temperature ranging from 40 to
300 °C. Metals were converted
into insoluble constituents and
removed by filtration.
.
Up to 70% of Ni and V are
reported to be removed.
Chlorine and metal
incorporate into the
production and
degrades the quality of
the oil
W. Baird, R. Bearden
1977
[92]
Sodamide +H2
On Safaniya atmospheric
residue, 9.9% sodamide at
pressure 3447.5 kPa and temp.
370 °C
Desulfurization reacheced to
68% and demetallization
reached to 77%.
The reaction between
heavy hydrocarbon
and sodamide at
elevated temperatures
produce salt. This salt
is separated by
filtration.
Bearden (1978)
[93]
Molten sodium+
H2
Hydrogen pressure between 1013
and 2026 kPa, with temp. Above
400 °C.
On Safaniya residue this
treatment reduced sulfur to
0.2% and Ni+V to less than
1 ppm.

50
Greaney et al. (1996)
[94]
toluene is added to
an aqueous
solution of 40
wt.% tetra-
butylammonium
hydroxide (20mL)
The applied potential was set at
2.5 V. for 18h stirring.
Removal of 53% of V, 50%
of Ni and 65% of Fe.
The demetallization
and desulfurization
were done by
ELectrolysis using
electrochemical cell a
commercially
available coulometry
cell consisting of a
mercury pool cathode,
a platinum wire anode,
a standard calomel
reference electrode
and a glass stirring
paddle.
S.R. Savel'ev,
G.K.Azerbaeva, Y.P.
Saltykov, N.F.
Noskova (1996)
[95]
TiCl4, FeCl3,
ZnCl2, CuCl2,
CuBr2, CuSO4 or
AlCl3
Temperature ranges from 30-90
°C for 5-60 min.
80-92% of vanadium was
removed.
It was found that there
was a correlation
between the redox
potentials of the
ligands and their
reactivities.
D.P. Mann, S.G.
Kukes, D.M.
Coombs (1985)
[46]
Organophosphate
esters + light
solvents
Hot extraction temp. 210 °C and
pressure 6205.5 kPa with n-
pentane containing di-methyl
phosphite.
Removal of 99.0% of V and
89.8% of Ni.
S.G. Kukes, A.W.
Aldag (1985)
[96]
P4S3
Monagas pipeline oil with 3%
P4S3 at 400 °C
Removal of 90% of V and
18% of Ni
Production of a variety
of side reactions
(element
incorporation,
cracking,
polymerization..)

51
Yan 1983
[97]
An aqueous
solution
containing
chelating agent
(EDTA, N-
(hydroxyethyl)eth
ylenediamine
triacetic acid, N-
[2-
(bi(carboxymethy
l)amino)-ethyl]-
N-(2-
hydroxyethyl)
glycine,
diethylenetriamin
e pentaacetic acid
or its salts.
A vacuum distillation residual oil
was treated with 27% EDTA
aqueous solution at pH 4.5
Removal percentages are
99% of Ca, 35% of Fe, 4% of
Ni, 3% of V.
Peifu, Zhang, T.
Zhang (1991)
[98]
An aqueous
solution of
chelating agent
+phosphate salts
such as
(NH4)3PO4)
Dosing the feed with an aqueous
solution of chelating agent
containing phosphate salt, an
emulsion breaker and solid
wetting agents.
Applying an electrical
field for liquid-liquid
separation.
Emulsification process
is a must.
H. Miyadera, Y.
Oguri, H. Ozaki, T.
Suzuka, K.
Nakamura, H.
Yoshikai (1975)
[99]
Sn or Sn alloys
650 g Sn was melted at 500°C in
a reactor and was sprayed, at
1.6mL oil/min with 106 ml
min/Ar (g) for 30min. The
residual oil containing 100 ppm
of V, 33ppm of Ni, 5ppm of S
The product was 8.7% gas,
14.8% coke, 76.5% oily
material. The oily material
contained 7ppm V, 3 ppm Ni
and the by-product coke
contained 177ppm V.
When Pb was used the
product was gas 8.4%, oily

52
material 78.4% and 12.9%
coke. The oily material
contained 27ppm V and
10ppm Ni, and the coke
contained V with 600 ppm.
J.G. Reynolds (2004)
[100]
Maleic acid in
dimethylformami
de,
montmorillonite
in 1-methyl
naphthalene,
CF3SO3H in 1-
MN and FSO3H
in 1-MN.
Petroporphyrin from heavy crude
oils were treated with chemicals
agents and then washed with
aqueous solutions to remove the
metal.
Wieckowska, E.
Zienkiewicz, T.
Lisik, T. Chrapek, J.
Tomusiak (1988)
[101]
SiO2 and/or
Al2O3 or silica
gel-adsorbent
activated with a
mineral acid
(H2SO4) +Fe
catalyst
Contacting the feed with SiO2
and/or Al2O3 or silica gel-
absorbent (pore size 100-1000A)
activated with a mineral acid
(H2SO4) followed by contacting
the feed with an Fe catalyst at
249-397°C with simultaneous
introduction of H2 at a flow rate
equal to that of the feed. The
contact time was 1.8x10³ s.
The product contained V, Ni,
and Fe at 8 ppm in the total
amount.
Aldridge, R.
Bearden, K. Riley
(1991)
[102]
Vanadium oxide
supported on
activated carbon.
Treatment of Arabian Heavy
vacuum resid at 5268 kPa and
290 °C.
The activity of vanadium
removal can be increased by
increasing the percentage of
vanadium on the activated
carbon support.
The reaction is highly
selective with minimal
occurrence of other
reactions.
Rankel, (1994)
[103]
Activated carbon
catalysts in the
An atmospheric reside
containing 4.2 wt.% sulfur, 104
ppm vanadium, and 32 ppm
Significant reductions in the
sulfur content, reduction of
Petrofarco A carbons
seem to be the most
efficient.

53
presence of
hydrogen
nickel was treated in a trickle bed
micro unit reactor. The trickle
bed was charged with different
types of commercially activated
carbon catalysts and operated at
400°C under hydrogen pressure.
23% of the original metal
content (Ni and V content).
J. Piskorz, D.
Radlein, P. Majerski,
D. Scott (1996)[104]
Supercritical
fluids and
activated carbon
as a catalyst.
The ration of a mass mixture of
bitumen and n-dodecane was 1:1.
The hydrogen feed ration was
1220 m3 hydrogen per m3 of
liquid feed.
Sulfur content was reduced
from 5.44 wt.% to 1.16%
with complete
demetallization.
K.L. Riley 1977
[105]
Hydrogen +
catalyst
containing CoO
4.5%, MoO3
16.0% and Al2O3
79.5%
First stage treatment with
hydrogen in the presence of a
catalyst with fine pores, and a
second stage in the presence of a
catalyst with larger pores and a
specified pore size distribution.
Removal of 60% of V with
the catalyst with pore
volume 0.525 mL/g and
average pore radius 84 A.
Removal of 40% for a
catalyst with pore volume
0.47 mL/g and average pore
radius 35 A.
Mobil Oil Corp.
1979
[106]
Catalyst contained
1-10 wt.% of an
Fe-group metal
(Co or Ni) and 5-
25 wt.% of a
group VIB metal
as the oxides or
sulfides on a
An atmospheric residuum
containing 235 ppm V and 2.12
wt.% S was treated over a
catalyst that calcinated at various
temperature ranges from 281 to
466 °C.
V removal was 56.6-71.1
wt.% and S removal 48.7-
55.9 wt.%
The hydrocarbons
were treated by
catalytic cracking,
hydrocracking or
coking.

54
calcined support
containing 85%
Al2O3 and 0.5-
7.0wt.% of a rare
earth.
Nippon Oil Co.
(1982)
[107]
Zeolite catalyst. The heavy petroleum oils
containing heavy metals and S
compounds were catalytically
hydrodesulfurized (300-450°C,
50-250 kg/cm2, 0.1-4.0 h/l liquid
space velocity, 200-1500:1 H-oil
vol. Ration in a fluidized bed of
zeolite catalyst and then
demetallized in a magnetic field.
80% of the S compounds and
45% of the Ni were
removed.
J. Devanneaux, D.
Laforgue, J.P.
Gallez, J.C.
Courcelle (1984)
[108]
Hydrodemetallize
d in a bed of
sulfurized Al2O3
catalyst
Hydrodemetallization of a
refining residue containing 5% of
S, 120 ppm of V and 55 ppm of
Ni at 410 °C.
The catalyst was prepared by
passing (CH3)2S2 at 250 °C with
1h/l space velocity, through a bed
of Al2O3 granules (surface area
188 m2/g, pore volume 0.77
cm3/g)
The removal of S, V and Ni
reached 15%, 85%, and 68%
respectively.
Hydrodemetallization
process
H.J. Chen, F.E.
Massoth 1988
[109]
sulfide cobalt-
molybdenum/alu
mina catalyst in a
batch stirred
autoclave
Hydrodemetallization of
vanadium and nickel porphyrin
model compounds over sulfide
cobalt-molybdenum/alumina
catalyst in a batch stirred
autoclave.
Both of reactants and
products were adsorbed ,
which inhibited the reaction.
The hydrodemetallization
rates increased with
temperature and hydrogen
pressure and were very low
The reaction was done
using model
compounds

55
without the catalyst of H
present.
The reaction order in
porphyrin was less than
unity at a lower temperature,
increasing to first order
above about >350°C.
Gomez 2005 [110]
sulfuric acid experiments were carried out in a
3L autoclave using sulfuric acid
in a nitrogen atmosphere at a
pressure of 8 bar.
Removal efficiency reaches
to 86% for S, Ni, and V.
Romano 2000
[81]
sulfuric and nitric
acids
Two Coke samples from crude
oil were applied: C1 with paricle
size 500 microns and C2 with 250
microns
Operating conditions :
HNO3-HCL 2:1, pressure 100
psig, the frequency of the
microwave 2450 MHz, and time
of irradiation 15 min
the removal ratios in C1 for
both Ni, V and S are 80, 99,
and 55 respectively. For C2
are 43%, 62%, and 32%
respectively.
. Wen et al. 2009
[111]
Sodium
dimethyldithiocar
ban in the
presence of water
Temperature range of 80–90 °C,
microwave power of 100–800 W,
and a treatment
time of 5–60 min.
Removal ratios of Ni in Iran
and Shengli crude oils are
45% and 49% respectively,
and for V are 70% and 87%
respectively.

56
Wang, Xu et al. 2011
[112]
carboxymethyl
chitosan (CT)
A reaction temperature of 60 °C,
a microwave power of 300 W, a
microwave time of 2 min, and a
CT-50 dose of 500 mg/L
Ni and V removal
efficiencies
reached up to 69.8% and
93.7%, respectively

57
OBJECTIVES AND METHODOLOGY
The main purpose of this work is to investigate the potential of implementing electromagnetic
waves at the frequency of microwaves for metal and sulfur removal from petroleum oil. In order
to accomplish this, the following steps are taken:
1- Select a DM-DSA that fulfills the chemical and dielectric properties and can extract both
metals and sulfur in a single step.
2- Develop a new process for the removal of metals and sulfur using the conventional heating
mechanism to prove the performance of the selected agent.
3- Investigate the removal mechanism to better understand the chemistry behind the reaction.
4- Introduce microwaves as the central heating mechanism in the removal process.
5- Investigate the influence of the basic process parameters, such as DM-DSA dosage,
irradiation power, residence time, and others on the removal efficiency of the developed
technique.
Chapter 5, Chapter 6, and Chapter 7 present the achievements and scientific findings of these
objectives. Chapter 5 first demonstrates the characteristic of the developed demetallization-
desulfurization agent and its effect on the removal efficiency of the process. The impact of the
process parameters in the case of conventional heating is then presented. Chapter 6 debates the
effects of the energy conversion mechanism in contrast to the superficial heating transfer
mechanism on the demetallization-desulfurization process. The invented methods in this work have
been proven using five different oil samples received from different fields around the world. The
processes invented in this work are listed in the appendices.Chapter 7 presents the conclusions of
this work and the recommendations for future investigations.

58
ARTICLE 2: METALS AND SULFUR REMOVAL FROM
PETROLEUM OIL USING A DEVELOPED DEMETALLIZATION-
DESULFURIZATION AGENT
Mai Attia, Sherif Farag, Shaffiq Jaffer, and Jamal Chaouki
This article is based on the US Provisional patent Application: 62753071 (Mai Attia, Sherif
Farag, Jamal Chaouki (2018). Method for the demetallization and desulphurization of heavy
petroleum oil).
Article submitted to: Journal of Energy & Environmental Science
Manuscript ID: EE-ART-05-2019-001488
Abstract
Metals and sulfur in residual fuel oil are the major challenges behind restrictions facing fuel oil
production. Both metals, particularly vanadium and nickel, and sulfur compounds reside in crude
oil in complex stable forms yet are soluble and have a negative impact on machinery during the
refinery processes and other aspects. This work was performed using an invented process capable
of selectively extracting almost all the minerals, especially vanadium and nickel. Additionally, it
eliminates the thiophene compounds, which are alongside the metals, with a different extraction
mechanism under the same reaction conditions. The removal efficiency of both vanadium and
nickel amounted to 90% and 79%, respectively, and reached up to 53% for S in the case of Basra
oil. The process is green and cost-effective since no additional operations, such as an emulsification
process, are required, and no solvents are consumed during the reaction.
Keywords: Demetallization; desulfurization; metalloporphyrin; upgrading of crude oil

59
5.1 Introduction
During the preceding few decades, considerable attention has been focused on petroleum heavy
crude oil for use in several applications. The demand for the oil, however, has declined due to
serious concerns, one of which is the unsatisfactory level of contamination by both metals and
sulfur. The issue has an adverse effect throughout the refinery operations as a result of severe
damage to the contact surfaces. Furthermore, it gives rise to diverse environmental issues that affect
the surrounding area and society. Therefore, refining heavy crude oil is required to avoid the
challenges facing crude oil and expand its commercial scale in various industrial applications.
Substantial numbers of metal contamination exist in oil, and their concentrations vary from a few
parts per million (ppm) to higher than 1000 ppm. Some of the most distinct elements that have
been identified in oil are cobalt (Co), nickel (Ni), copper (Cu), vanadium (V), silver (Ag), sodium
(Na), potassium (K), lithium (Li), calcium (Ca), strontium (Sr) and arsenic [1, 2]. Ni and V are the
most abundant, and they reside predominantly in residual fuel oil fractions in an oil soluble form.
The concentration of both Ni and V varied from a few ppm to 150 ppm and from less than 1 ppm
to 1200 ppm, respectively [1, 2, 7].
Recently, all the attention has been directed to study the extraction of both Ni and V from crude
oil. These elements exist in the core of stable organometallic compounds in the form of
metalloporphyrinic and nonporphyrinc structures [3, 4]. The high stability of these compounds
increases the difficulty of elimination of the above metals from heavy crude oil. The subsistence
of such elements in crude oil produces high volumes of coke and dry gases and decreases the liquid
output [7]. In addition, the two elements poison the catalyst in a short time, ranging from 10 years
for light oil to approximately one year for heavy crude oil [6, 7], which is mainly due to the
deposition of the two metal oxides formed on the pore of the catalyst and blocking the access site.
Thus, the removal of both Ni and V from heavy oil becomes a vital objective of the crude oil
industry.
Sulfur exists in crude oil as well in different forms, such as mercaptans, sulfides, disulfides, and
thiophenes, refer to Figure 5.1. The detected percentage of sulfur in petroleum oil ranges from 0.1
wt.% to 15 wt.% and depends on several parameters, most importantly the origin of the extracted
oil [8]. Sulfur is emitted to the atmosphere in the form of SOx, causing acid rain formation through

60
its reaction with water, oxygen, and other chemicals exist in the atmosphere. The presence of sulfur
in oil increases corrosion issues during the refinery process and helps in the deactivation of the
catalyst in minimal time. Removal of dibenzothiophene and its alky derivatives is a big challenge,
as the compounds can not be transferred into H2S due to the steric hindrance adsorption on the
surface of the catalyst. The existence of sulfur in various forms, specifically the thiophinic form, is
a considerable challenge due to the difficlte removal of the element from its complex structure.
Figure 5.1 Different forms of sulfur in petroleum crude oil (reprinted from reference [9])
Although a large number of techniques have been developed to lessen or remove the metals and
sulfur from crude oil, only a few of them have been industrially applied, the main reason being the
disadvantages associated with each method. For instance, the process relies on solvent extraction,
which leads to removing the whole fraction containing metals, thus reducing the yield of the end-
product. The distillation technique enhances the production of two grades of oils: (1) light oil,
which is the primary product and contains a shallow concentration of metals; and (2) heavy oil,
which includes a much higher level of contaminants that must undergo a further upgrading process.

61
The fast catalyst deactivation, the need for an emulsification process, the high cost and long
processing time are additional aspects that limit the performance of the developed demetallization
and desulfurization techniques.
Ultrafiltration is a costly, value-intensive technique due to the fast fouling of the membrane used
in the procedure. The bio-demetallization and bio-desulfurization processes are novel techniques
for metals and sulfur removal from crude oil by the action of certain microorganisms. The process
is applied directly after the burning of the fuel oil with keeping the calorific value without change.
The main disadvantages of the process are the degradation of the crude oil which destroy the main
skeleton of the oil. Also, the long processing time of the technique considers a big challenge. The
hydrotreatment process for both metals and sulfur removal (HDM-HDS) is the only process widely
used in the industrial sector. This technique can remove around 90% of the metals and sulfur
content from the oil. Although the HDM-HDS process effectively removes a large portion of the
metals and sulfur, it suffers from several issues. Most importantly, they include the fast catalyst
deactivation, high hydrogen consumption, which reaches H2/Oil, Scf/bbl 300-2000 for light oil and
2000-10,000 for heavy residual oil, an elevated temperature that ranges from 300 to 400 ℃ for
light distillate and from 340 to 425 ℃ for heavy residual, and elevated pressure, which ranges from
30 to130 atmosphere.
Several studies and efforts were performed on the removal of metals and sulfur from crude oil.
Gould et al. developed a method for the demetallization of cold lake asphaltenes, Arabian heavy
asphaltenes, and cold lake vacuum residuum [41]. Various oxidizing agents were tested to be
demetallization agents, such as air at 100 °C, NaOH/air, sodium hypochlorite, and peroxyacetic
acid. It was found that the demetallization process is proportional to the amount of oxidant used.
Air at 100 °C and NaOH/air do not show any visible demetallization activity. Sodium hypochlorite
and Peroxyacetic have high demetallization activity coupled with the ability to remove or destroy
petroporphyrins and cause chlorine incorporation into the feed. D.A. Young proposed a new
technique using ZnCl2 and TiCl4 for the demetallization of different hydrocarbon feedstocks [87].
The raw materials were blended with ZnCl2 and TiCl4 (2.0-4.5 lb/bbl oil), and the resulting mixtures
were treated with hydrogen at approximately 288-482 °C. A heavy Iranian residue was
hydrogenated at 343 °C, 1034-2500 kPa for 2h and a 7000 rpm stirring rate in the presence of ZnCl2
(4.2 ppb). Seventy percent of the Ni and V contaminants were converted to oil-insoluble forms

62
with coke formation of less than 3 wt.%. Young [88], Siskin [89], Michlmayr [35], Nametkin,
Gubin et al. [90], and Gleim [91] have patented techniques using different demetallization agents,
such as chlorinating compounds (Cl2, SOCl2), inorganic salts (FeCl2, SnCl2, ZnCl2, TiCl4, RuCl3,
CrCl3, COCl2) or their aqueous solutions. The reaction temperature ranged from 40 °C to 300 °C,
and metals were successfully converted into insoluble constituents and removed by filtration. It
was reported that the concentration of both Ni and V decreased by up to 70 wt.%. The main
disadvantage of this process is the incorporation of chlorine and metal into the production and the
degradation of the quality of the oil.
A novel technique has been applied by Greaney et al. [94] for demetallization and desulfurization
by electrolysis using an electrochemical cell. The commercially available coulometry cell
consisting of a mercury pool cathode, a platinum wire anode, a standard calomel reference
electrode and a glass stirring paddle. The applied potential was set at 2.5 V. for 18 h stirring. In the
process, toluene was added to an aqueous solution of 40 wt.% tetra-butylammonium hydroxide (20
mL). It was demonstrated that the removal percentages reached to 53% of V, 50% of Ni and 65%
of Fe. Yan [97] has reported a demetallization method using an aqueous solution containing a
chelating agent (EDTA, N-(hydroxyethyl) ethylenediamido triacetic acid, N-[2-
(bi(carboxymethyl)amino)-ethyl]-N-(2-hydroxyethyl) glycine, diethylenetriamine pentaacetic acid
or its salts as a demetallization agent. A vacuum distillation residual oil was treated with 27%
EDTA aqueous solution at pH 4.5. It was found that the removal percentages reached up to 99%
of Ca, 35% of Fe, 4% of Ni, and 3% of V. Aldridge, R. Bearden, K. Riley [102] used a vanadium
oxide supported by activated carbon for the demetallization of Arabian heavy vacuum residue. The
treatment process was done at 5268 kPa and 290 °C. It was noted that the activity of vanadium
removal could be increased by increasing the percentage of vanadium on the activated carbon
support. The reaction is highly selective with minimal occurrence of other reactions.
The removal of metals and sulfur from petroleum oil in a single step has received considerable
attention as is evident in the scientific literature. Several techniques have also been developed to
remove either sulfur or metals, but the scale-up limitation is a challenge for industrialization
purposes. In addition, it is essential to propose a chemistry mechanism for the removal of metals
and sulfur from crude oil, which would lead to deeper insights toward improving selective removal
efficiency. Therefore, this work demonstrates a technique to remove both metals and sulfur in a

63
single step using a demetallization-desulfurization agent (DM-DSA). This technique is based on
the authors invention “US Patent Pending Application: 62753071.” A removal mechanism was
proposed and exhibited based on the obtained results. It is worth mentioning that the invented
process is environmentally friendly, cost-effective and, moreover, successfully decreases the
concentration of both metals and sulfur in a single step.
5.2 Experimental work
5.2.1 Materials
The invented demetallization-desulfurization process has been implemented on a number of
petroleum crudes obtained from several countries. Iran and Basra oils were obtained directly from
the tanks of the TOTAL refinery station in France with a high concentration of V, Ni, and S. Heavy
aromatic naphthenic crude oil, light naphthenic crude oil, and Pennsylvania crude oil were
purchased from the ONTA company, in Ontario. The concentrations of V, Ni and S vary from low
to high in the ONTA samples, as it is indispensable to gain deeper insight into the removal
efficiency using the DM-DSA for the high and low metal concentrations. All the other chemical
agents, such as the DM-DSA and the solvents, were purchased from Sigma-Aldrich, Canada.
The concentration of metals and sulfur in all the oil samples has been determined by the neutron
activation analysis technique (NAA) using the SLOWPOKE reactor at Polytechnique Montréal,
QC, Canada. The other required information archived directly from the supplier, Iran and Basra
oils, are tabulated in Table 5.1.
5.2.2 Experimental setup
The experimental setup shown in Figure 5.2 was employed to carry out the experimental work. The
mixture of the raw oil and reactants was poured into a batch reactor equipped with a stirring
technique. The reactor is attached to a water-cooled Liebig or Vigreux condenser fitted onto the
top. The condensation system, in other words, reflux, works at a temperature of -5 oC and ambient
pressure. The central role of the reflux is to condense the lower molecular weight compounds that
might be vaporized during the reaction time due to increasing temperature. The reactor is heated
conventionally to a temperature lower than the boiling point of the DM-DSA yet enough to perform

64
the elimination reaction. The temperature was controlled not only based on the electric oven
temperature, but also as a direct measurement by using a thermometer immersed inside the oil. The
experiment was carried out utilizing the conventional heating mechanism to control the reaction
temperature and other aspects better.
Table 5.1 Characteristic of the processed oils
Property Unit Basra Oil Iran Heavy
Light naphtha Heavy
aromatic
naphtha
Density
(15°C) kg/m3 886.8 881.2 873.5 953.0
API - 27.98 28.99 30.0 16.4
Viscosity
(10°C) mm2/s 23.8 18.4
- -
Viscosity
(37,8°C) mm2/s 9.32 10.6
- -
Viscosity
(50°C) mm2/s 6.79 8.67
- -
Stotal mg/kg 26354 22795 33557 18385
Ni mg/kg 12 25 61.1 35.3
V mg/kg 40 85 331 383.1
CCR %W 7.845 6.88 H/C= 1.668 H/C= 1.558

65
Figure 5.2 Experimental setup of the demetallization-desulfurization process by conventional heating mechanism

66
5.2.3 Experimental procedures
The invented process consists of three main stages: (1) reaction, which is between the oil and the
DM-DSA; (2) washing the treated oil; (3) and separation, which is performed to separate the
aqueous phase from the oil phase, as shown in Figure 5.3. The subsections below debate the three
stages in full detail.
Petroleum Oil
Reaction with the
Demetallization and
Desulfurization Agent
Unreacted and
Regenerated Demetallization
and Desulfurization Agent
Treated Petroleum Oil +
Demetallization and Desulfurization
Agent (Reacted & Unreacted)
Aqueous Phase + Solvent Washing & Separation
Metal Salt of the Agent
Mostly Soluble in Water
+ Reacted Demetallization and
Desulfurization Agent +
Unreacted Chemical Agent (if any)
Soluble in Solvent
Treated Oil Petroleum
Figure 5.3 Flowchart of the invented process to remove metals and sulfur content in petroleum oil

67
5.2.4 Principal reaction of the DM-DSA with oil
A precise weight/volume of the untreated oil was mixed with a specific percentage of the DM-DSA
– 2 wt.% and 5 wt.%. The mixture was poured into the reactor as demonstrated in Figure 5.2. It is
worth mentioning that the described process does not need an emulsification process, which is
contrary to most of the existing chemical demetallization techniques. The principal reason for this
aspect is the complete miscibility of the employed DM-DSA with petroleum oil, which is a major
advantage in the application. The electric stirring applied during the reaction is essential for mixing
the reactants and to distribute the heat properly inside the oil better, which, in turn, enhances the
replacement reaction taking place between the processed oil and the DM-DSA. The mixture is
heated for a strategic residence time of about 1 hr at an actual temperature of up to 250 ℃ under
stirring conditions up to 700 rpm.
5.2.5 Oil and DM-DSA separation
Several attempts were made to separate the treated oil from the reacted one efficiently and
unreacted (if any) DM-DSA and its salts. This step is, in fact, critical because the processed oil
after the reaction remains in the same vessel with both the metal salt of the formed DM-DSA and
the unreacted DM-DSA (if any). The separation process was performed applying a mix of two
different organic solvents. The first solvent was used mainly to dissolve the unreacted DM-DSA
and separate it from the treated oil. The second solvent, an aqueous phase, was used to dilute the
metal salt of the formed DM-DSA after the reaction. The mixture of the two solvents and the treated
oil, which contains the DM-DSA and its salt, was then heated at a temperature of less than 100 oC
under stirring conditions up to 700 rpm for the residence time mentioned above. The separation is
always performed in a reflux system to avoid the evaporation of the solvent and precipitating the
dissolved compounds again into the oil. After the separation time, a mixture of three phases
appeared in the reactor; the upper phase was the treated oil while the lower phase contained both
the metal salt of the DM-DSA dissolved in the aqueous phase and the unreacted part of the DM-
DSA dissolved in ethanol. Eventually, the two obtained phases were separated by decantation and,
then, centrifugation. The organic solvent phase with the dissolved DM-DSA has separated again
from the aqueous phase to regenerate the unreacted DM-DSA. Figure 5.4 demonstrates a proposed

68
mechanism of the separation step, using – as an example – water as the aqueous phase and ethanol
as the solvent phase.
Figure 5.4 Mechanism of the aqueous phase, solvent, and DM-DSA separation
5.2.6 Washing the separated oil
After the first separation, washing the collected oil phase is recommended to ensure the complete
separation of all the metal salts of the formed DM-DSA and all the unreacted DM-DSA. Therefore,
about three washings were applied using the same mixture from the aqueous phase and the solvent
that was used in the separation step. This step was performed at room temperature with vigorous
stirring or shaking for approximately a few minutes. The mixture was then poured into a separation
system where it was left to stand until the complete detachment of the two phases. A centrifugal
separation system was eventually used for the aqueous phase/oil phase separation; then the treated
oil was sent for the analytical techniques.
5.3 Analytical techniques
Various analytical techniques were performed to validate the performance of the developed DM-
DSA as well as to gain a better understanding of the process efficiency. Therefore, three analytical
techniques were applied: (1) Fourier transform infrared (FTIR), (2) Neutron activation analysis
(NAA), and (3) Elemental analysis C, H, N, and S.

69
5.3.1 FTIR technique
Fourier transform infrared spectroscopy analysis was undertaken using a Perkin Elmer 65 FTIR-
ATR instrument (PerkinElmer, Woodbridge, ON, Canada). A sum of 128 scans was accumulated
for the signal averaging of each IR spectral measurement with a 4 cm−1 resolution. The spectra of
the samples were recorded over a wavenumber range of 4000-650 cm−1 to detect the transformation
of N-M bond to the N-H bond. FTIR can detect the characteristic vibration frequencies for each
bond, functional group, side chain, and cross-link inside the molecule. It is evident that the
demetallization reaction is primarily founded on the conversion of N-M bonds into the N-H bond.
Therefore, the FTIR technique is one of the best candidates to observe the changes taking place in
the N-M bond. Unfortunately, the FTIR instrument that is employed in the detection process cannot
detect the peaks lower than 600 cm-1; consequently, the peaks of N-M bonds at less than 400 cm-1
have not been recorded.
5.3.2 Elemental analysis technique
It is indispensable to detect the sulfur concentration in the crude oil to record the change that should
occur after the demetallization-desulfurization process. To observe the change, the elemental
analysis technique is applied to find out the variation in sulfur concentration before and after the
extraction process. The sulfur detection was performed using the Elemental Analyzer EA3000
(EuroVector) instrument. The data were processed using Callidus software interface version 5.1.
Callidus. The 5.1 software fully controls the device, integrates peaks, reprocesses sample data, and
reports result selecting one of the pre-arranged formats. The Callidus is based on the autorun
concept as the samples cannot analyze in isolation but must be in association with standards (for
calibration purposes), blanks (for the determination of potential trace contaminants) and bypasses
(for conditioning purposes).
5.3.3 Neutron activation analysis
Neutron activation analysis is a nuclear technique used to determine the compactness of each
element existing in vast numbers of chemical compounds. The analysis was performed in a
slowpoke lab at Polytechnique Montréal, QC, Canada. In this technique, a neutron source is
required for bombarding the sample with neutrons. Due to this bombardment, the element transfers

70
to its isotopic form. According to the radioactive emission and decay data known for each element,
the spectra of emission of gamma rays for all the elements can be easily studied. Quantifying
various metals in crude oil is indeed a challenge, due to the complex matrix of crude oil, which
includes vast numbers of metals and different elements. In addition, the depressed concentration
of each metal remains a considerable issue to be determined by most of the analytical techniques.
Many of the metals and elements are interfering as well, which affects the accuracy of the
measurements. The NAA technique is characterized by high accuracy in quantifying a wide
assortment of metal elements in the complex matrix of crude oil. Its proficiency is indirectly dealing
with the oil itself without any digestion process or dilution, such as the ICP-MS technique, which
has several factors for error production in the measurements. The drawbacks, the uncertainty, and
the limitations were precisely determined for the NAA measurements to heighten the accuracy of
the technique. The most optimum method that can be used for metals quantification using the NAA
technique is the k0-Neutron Activation analysis (k0-NAA). This method is a single-comparator
standardized method used for high accuracy quantification of elements in any type of materials.
By applying this method, the calibration of each element by changing the matrix or the detector is
not required.
5.3.4 Quantification method
For the quantification of the metals and sulfur in the crude and treated oil, the extraction efficiencies
in the case of each oil have been calculated. The extraction efficacy percentage has been determined
using the following equation.
Extraction efficacy (%) = ((C crude – C treated)
C crude∗ 100
Where the C crude is the concentration of an element in the crude oil before the treatment process,
C treated is the concentration of the element in the treated oil after the demetallization process.
5.4 Results and discussion
The DM-DSA applied in the study has the ability to form an ionic liquid while it is present in oil
at a lower temperature. The DM-DSA is not miscible with water, but it forms salts that are
completely soluble in water. Thus, the unreacted part of the DM-DSA can be easily recycled. The

71
reason behind the immiscibility of the agent with water is the existence of the long side chains in
the composition of the agent, which reduce its polarity.
The FTIR of the DM-DSA indicates that the DM-DSA has specific peaks appearing in regions that
are different than what appeared in the treated oil, in particular, between 4000cm-1 and 3000 cm-1,
which, in turn, can confirm that any peak appears in these regions after the elimination process was
related to the treatment process.
The FTIR shows a difference in the absorption frequencies between the treated and untreated oil.
It is supposed to transfer the metalloporphyrin ring into free based porphyrin; accordingly, new
frequencies for the N-H bonds should appear instead of the N-M bonds.
Figure 5.5 shows the deviation in the IR absorption frequencies between the untreated and treated
heavy aromatic naphthenic crude oil. There is a peak located at 3320 cm-1, which is attributed to
the N-H bond stretching frequency. The peak located around 1600 cm-1 is related to another
vibrational mode of N-H [113]. There are two other peaks appearing at around 1110 cm-1 and 740
cm-1 in the treated oil, which are relative to in-plane N−H and out-of plane bending N−H,
respectively [114]. It should be noted that these two peaks do not exist in the raw oil or the DM-
DSA. The bands around 2922 cm-1 were assigned to the C-H bond of the benzene ring and pyrrole
ring. Bands at ~1458 and ~1379 cm-1 are attributed to the C=C stretching mode and the C=N
stretching vibration, respectively. The bands at around 800 cm-1 and 750 cm-1 were respectively
assigned to the C-H bond bending vibration of the para-substituted and molecule ortho-substituted
phenyl ring.
Figure 5.6 shows precisely the same peaks appearing in Figure 5.5 but for light naphthenic crude
oil. The FTIR results confirm that new peaks appeared in the processed oil related to the N-H bond.
This key finding, in turn, confirms that the treatment process using the developed DM-DSA was
successfully implemented and the N-M bond transferred to N-H bond. Since the same results were
obtained in all processed oil samples and to minimize the number of figures in this manuscript, it
was decided not to add the FTIR results of the other oils.

72
Figure 5.5 FTIR results of the raw heavy aromatic naphthenic crude oil (dotted line) and the
treated oil by 2 vol.% DM-DSA (continuous line)
Figure 5.6 FTIR results of raw light naphthenic crude oil (dotted line) and treated oil by 2 vol.%
DM-DSA (continuous line)
65
75
85
95
105
700 1700 2700 3700
Tra
nsm
itta
ncy %
Wavenumber cm-1
Out of plane
N-Ht
65
75
85
95
105
700 1200 1700 2200 2700 3200 3700
Tra
nsm
itta
ncy
%
Wavenumber cm-1
N-H bond
stretchingAnother
vaibrational
mode of N-HIn-plane
N-HOut of-plane
N-H
N-H bond
stretching Another
vibrational
mode of N-H
In-plane
N−H

73
An increased concentration of DM-DSA, which reached to 5 vol.%, was also applied during the
treatment process of both heavy aromatic naphthenic crude oil and light naphthenic crude oil. This
experiment took place to detect the variation in the removal efficiency in the case of applying a
higher dose of the DM-DSA. This difference can be detected by comparing the intensity of the
peak for both 2 vol.% and 5 vol.% using the FTIR technique. It was found that there is no significant
increase in the removal efficiency by applying 5 vol.% of DM-DSA during the treatment process,
as presented in Figure 5.7 and Figure 5.8.
The elemental analysis was carried out to detect the variation in sulfur concentration before and
after the treatment process, and to record the effect of the DM-DSA on sulfur removal. Figure 5.9
depicts a clear peak for sulfur in the region between 144 and 180 cm-1 on the heavy aromatic
naphthenic crude oil and Figure 5.10 demonstrates the change performed for the sulfur peak after
the remediation process, as the strength of the peak was reduced, which indicates the decrease in
the concentration of sulfur in the treated oil.
This affirms that the DM-DSA successfully eliminated a portion of the sulfur compounds from the
crude oil during the demetallization-desulfurization process. The same decrease in the sulfur
content was obtained in the light naphthenic crude oil. Figure 5.11 and Figure 5.12 also confirms
the reduction in sulfur concentration that took place after the demetallization-desulfurization
process.

74
Figure 5.7 Treated heavy aromatic naphthenic crude oil with 2 vol.% (continuous line) and 5
vol% DM-DSA (dotted line)
Figure 5.8 Treated light naphthenic crude oil with 2 vol.% (dotted line) and 5 vol.% DM-DSA
(continuous line)
65
75
85
95
105
500 1000 1500 2000 2500 3000 3500 4000
Tra
nsm
itta
ncy
%
Wavenumber cm-1
65
75
85
95
105
700 1200 1700 2200 2700 3200 3700
Tra
nsm
itta
ncy
%
Wavenumber cm-1

75
Figure 5.9 Sulfur detection in the raw heavy aromatic naphthenic crude oil using elemental
analysis technique
Figure 5.10 Sulfur detection in the treated heavy aromatic naphthenic crude oil by 2 vol.% DM-
DSA using elemental analysis technique

76
Figure 5.11 Sulfur detection in the raw light naphthenic crude oil using elemental analysis
technique
Figure 5.12 Sulfur detection in the treated light naphthenic crude oil by 2 vol.% DM-DSA using
elemental analysis technique

77
To accurately determine the metal content in the oils, the NAA technique was performed. The
analysis was carried out along with the raw oil, treated oil, and the aqueous phase produced after
the rinsing step. A noticeable difference in the metal content between the raw oil and the treated
oil was detected. In addition, the analysis of the aqueous phase showed the presence of metals in
the aqueous phase after the washing step, which supports the validation of the invented process. It
is worth mentioning that almost all the metals concentrations have been reduced compared to the
virgin oils, specifically, V and Ni, which are difficult to eliminate. Pennsylvanian crude oil is a
light oil with low metals concentrations. Thus, it was used to test the removal efficiency of the
DM-DSA in the case of the lower levels of metals in crude oil. The NAA results are tabulated in
Table 5.2 and Figure 5.13 confirm that the DM-DSA has a high removal efficiency in the case of
Ti, I, Al, and Ca, which reaches more than 90 wt.%. The removal efficiency for both Br, Mg, V,
and Cl was detected at higher than 70 wt.%. The treatment process included partial removal of
sulfur alongside metals, which reached 27%.
The NAA results of the heavy aromatic naphthenic oil are tabulated in Table 5.3. Figure 5.14
displays the removal efficiency of the treated heavy aromatic naphthenic crude oil using 2 vol.%
DM-DSA. All three of Ti, Mg, and Na have a higher removal efficiency, which reached more than
80%, followed by Cl and Ca with more than 65%. The concentration of S decreased as well with a
removal efficiency of around 15%. Figure 5.15 and Table 5.4 demonstrate the results of the light
aromatic naphthenic oil
The NAA analysis shows a high removal efficiency of both Iran and Basra oils in spite of the high
complexity of the two oils. In the case of Iran oil, the removal efficiency presented in Figure 5.16
and Table 5.5. V, Ni, and S reached 33%, 73%, and 35%, respectively. For Basra oil, the removal
efficiency was more prominent than in Iran oil, as all of V, Ni and S have been eliminated with
90%, 79%, and 63% efficiency, respectively, kindly refer to Table 5.6 and Figure 5.17.
It is essential to distinguish the variation that could take place for the metals and sulfur
concentrations if the dosage of the DM-DSA rose to more than 2 vol.%. Therefore, another batch
of experiments was carried out on the heavy aromatic naphthenic crude oil and light naphthenic
crude oil applying 5vol.% DM-DSA, Figure 5.18, Table 5.7, Figure 5.19 and Table 5.8. It was
found from the NAA analysis that there is an adequate discrepancy in the removal efficiency of
some metals when raising the DM-DSA dosage, specifically Na and Mn. This reduction could be

78
due to the simple structure of the metals in the oil, which make them much smoother to attach to
the DM-DSA than the other metals complexes. Concerning the S, it is reasonable to enhance the
removal efficiency of S by increasing the DM-DSA dosage, because S compounds will encounter
more ionic liquids with which to connect.
It is interesting to confirm that the decrease in metals concentrations after the treatment process
was due to the reaction of the metals with the DM-DSA and not because of the washing step. A
comparison between the treated oil with the invented technique and the same oil exposed only to
the washing step was therefore carried out. Iran oil was used, and the results were analyzed by the
NAA technique. Figure 5.20 illustrates the comparison in removal efficiency between the treated
and washed Iran oil. It was noted that all the metals decreased due to the high removal efficiency
reaching up to 100% for some metals, whereas employing just the washing step did not show any
drop in the metals except those that can be extracted just by washing, such as Ca and Ba. This
confirmed that the treatment process is only responsible for the decline that took place for all the
metals concentrations.

79
Table 5.2 NAA results of Pennsylvania oil treated with 2 vol.% DM-DSA
Element Raw oil (ppm) Treated oil (ppm)
Ti 7 0.3
I 0.6 0.03
Br 0.5 0.06
Mn 0.02 0.01
Al 12 0.50
Mg 15 1.6
Na 6 2.6
V 0.03 0.01
Cl 12 3.2
Ca 44 2.7
S 839 612
Figure 5.13 Removal efficiency of Pennsylvania oil treated with 2 vol.% DM-DSA
0
20
40
60
80
100Ti
I
Br
Mn
Al
MgNa
V
Cl
Ca
S

80
Table 5.3 NAA results of heavy aromatic naphthenic oil treated with 2 vol.% DM-DSA
Element Raw oil (ppm) Treated oil (ppm)
Ti 20.4 2.05
Mn 0.23 0.15
Mg 41 3.37
Na 5.88 0.85
V 383.1 233.6
Cl 100.8 27.02
Ca 54.16 16.66
S 18385 15513.8
Figure 5.14 Removal efficiency of heavy aromatic naphthenic oil treated with 2 vol.% DM-DSA
0
20
40
60
80
100Ti
Mn
Mg
Na
V
Cl
Ca
S

81
Table 5.4 NAA results of light naphthenic oil treated with 2 vol.% DM-DSA
Element Raw oil (ppm) Treated oil (ppm)
Ti 34 3
Mn 0.2 0.1
Mg 74 10
Na 9 7
V 331 307
Cl 106 18
Ca 55 17
S 33557 23812
Figure 5.15 Removal Efficiency of light naphthenic oil treated with 2 vol.% DM-DSA
0
20
40
60
80
100Ti
Mn
Mg
Na
V
Cl
Ca
S

82
Table 5.5 NAA results of Iran oil treated with 2 vol.% DM-DSA
Figure 5.16 Removal Efficiency of Iran oil treated with 2 vol% DM-DSA
0
20
40
60
80
100Ti
Mn
Mg
Na
VNi
Cl
Ca
S
Metals Raw oil (ppm) Treated oil (ppm)
Ti 6 0.5
Mn 0.02 0.01
Mg 17 6
Na 13 0.1
V 88 59
Ni 30 8
Cl 22 17
Ca 5 0
S 22795 14816

83
Table 5.6 NAA results of Basra oil treated with 2 vol.% DM-DSA
Metals Raw oil (ppm) Treated oil (ppm)
Ti 4 0.6
Mn 0.05 0.008
Mg 5 1
Na 14 5.5
V 37 3.6
Ni 10 2
Cl 25 10
Ca 8 2.6
S 26354 9751
Figure 5.17 Removal efficiency of Basra oil treated with 2 vol.% DM-DSA
0
20
40
60
80
100Ti
Mn
Mg
Na
VNi
Cl
Ca
S

84
Table 5.7 comparison between heavy aromatic naphthenic crude oil and treated oils with 2 vol.%
and 5 vol.% DM-DSA
Metal Raw oil (ppm) Treated oil
2 vol.-% (ppm)
Treated oil
5 vol.-% (ppm)
Ti 20.4 2.05 3.06
Mn 0.23 0.15 0.1
Mg 41 3.37 2.5
Na 5.88 0.85 2.24
V 383.1 233.6 222.6
Cl 100.8 27.02 26.76
Ca 54.16 16.66 14.72
S 18385 15514 10090
Figure 5.18 Removal Efficiency with 2 vol.% (black) and 5 vol.% (red) DM-DSA for heavy
aromatic naphthenic oil
0
20
40
60
80
100Ti
Mn
Mg
Na
V
Cl
Ca
S

85
Table 5.8 NAA analysis of light naphthenic crude oil and treated oils with 2 vol.% and 5 vol.% of
DM-DSA
Metal Raw oil (ppm) Treated oil
2 vol.% (ppm)
Treated oil
5 vol.% (ppm)
Ti 33.66 2.7 1
Mn 0.169 0.105 0.03
Mg 73.99 10.33 0.45
Na 9.4 7.82 2.85
V 331 307.26 300.15
Cl 100.8 18.46 44.68
Ca 54.955 17.48 8.88
S 33557 23812.9 23602.6
Figure 5.19 Removal Efficiency with 2 vol.% (black) and 5 vol.% (red) DM-DSA for light
naphthenic oil
0
20
40
60
80
100Ti
Mn
Mg
Na
V
Cl
Ca
S

86
Figure 5.20 Removal efficiency of treated Iran oil with 2 vol.% DM-DSA (black color) against
that only washed with aqueous solution (red color)
0%
20%
40%
60%
80%
100%V
Ni
Cl
Mg
Na
Al
Zn
Cd
RbBaTi
Se
Ca
Cr
Sn
Cu
Ag
Cs
Co
0%
25%
50%
75%
100%
Hg
Mo
As
W
Hf
Br
U
ThI
La
Sb
Sc
Mn
Au
In

87
The employed DM-DSA in this study acts as a proton donor and, thus, provides the porphyrin ring
with the needed hydrogen ions to occupy the vacancies created during the metal extraction
reactions. The DM-DSA also helps to extract the metals from the porphyrin ring forming the metal
salt of the agent. Behind the demetallization and desulfurization processes, there are a set of
complex chemical reactions taking place. Significant effort has been made to better understand
them and be able to present them based on a scientific interpretation.
The main idea behind the demetallization reaction is the ion exchange mechanism that happens
very quickly in homogeneous solutions. In the reaction (cation exchanger), the agent acts as a
proton donor for the metalloporphyrin ring after the four nitrogen atoms extract the electron bonds
between the metals, due to the high electronegativity of the nitrogen atoms, which reaches up to
3.04 compared to 1.63 for the V atom. The high electronegativity of the four nitrogens plays an
essential role in leaving the metal atom as a positive metal ion after the electron bond extraction.
This, in turn, forms four negative nitrogen ions, which directly bond with the hydrogen protons
from the agent forming the pure porphyrin ring. At the same time, the negative side of the agent
robustly extracts the positive metal ion from the media creating the metal salt of the agent. The
reaction of the demetallization process can be explained through the following mechanism, the
arrows show the specific place of the reaction.

88
Figure 5.21 Mechanism of demetallization process
V4–
N
N
N
O
N R O H
CH4
CH4NH
NH NH
NH4+
Porphyrin pure
+ RO–
( )4V
+
OH
2
H
2
..
Vanadium porphyrin

89
The DM-DSA used for the demetallization process is one of the most famous cations that can form
ionic liquids with several anions. Both anion and cation species can interact forming an ionic liquid,
or the cation can interact with a chloride anion from the oil medium forming another ionic liquid.
The ionic liquid is formed by stirring both of the DM-DSA with the crude oil [115]. It was
demonstrated that there are some factors strongly affected by the melting point and the physical
state in general of the ionic liquid at room temperature, most importantly, the lengths of the alkyl
chain and the central atom of the cation [116]. Platzer et al. have claimed that larger side chain
cations tend to reduce the melting point of the ionic liquid [117]. This confirms that the ionic liquid
formed during the process is a liquid.
Figure 5.22 Ionic liquid formation
As soon as the ionic liquid formed, it bonded with the thiophen compounds [118] in the oil through
two different bonds: (1) through the H-bond between the S and the H from the agent, and (2) the
electrostatic force between the different charges of the high molecular weight part of both the agent
and the thiophen compounds. The desulfurization process can be explained by the following
mechanism.

90
Figure 5.23 Desulfurization mechanism by ionic liquid
a
SOCnHmO
O
A+
H
Na
.
.
a
O CnHmO
O
A
HS
S
.
.
.
.
.
Electrostatic bond
Hydrogen bond
Electrostatic bond
Hydrogen bond
Hydrogen bond
Electrostatic bond
Na Cl
Cl-
(DM-DSA)

91
5.5 Conclusion
A novel demetallization agent successfully achieved the demetallization and desulphurization
process of crude and petroleum oil. The invented technique is adequate in eliminating virtually all
the metals and specifically V and Ni, without destroying the porphyrin ring. The agent selectively
extracts the metals from the core of the porphyrin ring, forming the metal salts of the agent. The
process also delivers a high capability for reducing the sulfur concentration, which exists in the
form of thiophene compounds that are difficult to remove. This is a consequence of the ionic liquid
formation by the DM-DSA in the crude oil, which induces a high tendency to withdraw the
thiophene compounds through attaching to it by a hydrogen bond and electrostatic force. The
conventional heating mechanism was used during the demetallization-desulfurization process for
better controlling the reaction temperature, and thus far, a good removal efficiency for both V and
Ni, which reached to 90% and 79%, respectively, and for S, which reached up to 53%, has been
obtained in the case of Basra oil. Both Iran and Basra oils showed the highest removal efficiency
for almost all the metals and sulfur, especially for V and Ni. It was found that by increasing the
amount of DM-DSA, there was no efficient decrease observed in the metal contents, except for Ca
and Ba, and S in the heavy aromatic crude oil.

92
ARTICLE 3: METALS AND SULFUR REMOVAL FROM
PETROLEUM OIL USING ELECTROMAGNETIC IRRADIATION
Mai Attia, Sherif Farag, Shaffiq Jaffer, and Jamal Chaouki
This article is based on the US Provisional Patent Applications:
1- 62758227 - Mai Attia, Sherif Farag, Jamal Chaouki (2018). Microwave process for the
removal of metals from petroleum oil using a developed demetallization and related
techniques.
2- 62758251 - Mai Attia, Sherif Farag, Jamal Chaouki (2018). Microwave process for the
removal of sulfur from petroleum oil using a developed desulfurization agent and related
techniques.
Article Submitted to: Journal of Energy & Environmental Science
Manuscript ID: EE-ART-05-2019-001489
Abstract
This work investigates the extraction of metals and sulfur from petroleum oil using a novel
demetallization desulfurization agent. A microwave irradiation environment was created during
the reaction to provide the required energy essential for separating such contaminations from the
oil chemical network. Strategic reaction conditions were applied, and the obtained results were
compared against those of a conventional heat process. The comparison showed a significant
difference between the removal efficiencies of selected elements. More than 95% of the vanadium
concentration in the raw oil was removed using the energy conversion mechanism of the
microwave compared to 33% for the superficial heat transfer mechanism. The removal of sulfur
showed a considerable deviation in the removal efficiency using the microwave, 99% compared
to 60% for the traditional heat. The invented process is green and not costly and can thus compete
well with the existing demetallization and desulfurization processes.
Keywords: Demetallization; Desulfurization; Metalloporphyrin; Oil Upgrading; Microwaves

93
6.1 Introduction
Petroleum crude oil is experiencing a considerable challenge due to the presence of metals and
sulfur pollutants. Metals, especially vanadium (V) and nickel (Ni), are present in the oil in stable
sets of organometallic compounds, called metalloporphyrines. Refer to Figure 6.1. The porphyrins
exist in different patterns and are quite soluble in oil, which, in turn, augments the difficulty in
eliminating them from crude oil. The presence of these impurities causes several health issues if
the oil is used as fuel. One of the most harmful metals is V, which spreads to the surrounding area
in the form of vanadium oxide and reacts with the mucus of the body causing various types of
bodily irritations. Ni in the form of nickel carbonyl reacts in the body as well, causing numerous
types of neoplastic diseases. Similarly, sulfur (S) has a catastrophic ecological impact, as SOx is
emitted into the ecosystem, causing acid rain formation. Acid rain is mainly owing to the reaction
of SOx with water forming sulfuric acid, which is carried away by air. The acid subsequently falls
to earth in the form of rain, dust, snow, sleet, or hail. Minerals and sulfur compounds not only have
a negative impact on the environment but they also affect the contact surfaces during the refinery
processes, generating serious corrosion problems for the instruments and pipelines. Furthermore,
they reduce the lifetime of the catalyst during the hydrodemetallization and hydrodesulfurization
processes. Both metals and sulfur block the pores of the catalyst by the deposition of metal oxide,
which leads to reducing the activity of the catalyst in an incredibly short time. This issue raises the
cost of refining because using a fresh catalyst to obtain new active sites with high performance is
a must.
Serious attempts have been carried out to upgrade petroleum crudes by extracting both metals and
sulfur from the oil. Various approaches have been published in the literature, such as solvent
extraction, distillation, visbreaking and coking, applying a demetallization agent,
and hydrodemetallization/hydrodesulfurization. Indeed, each technique faces several issues that
can impede its objective in the industrial sector. For example, the solvent extraction process
demands an enormous amount of solvent and, on top of that, it discards the whole metalloporphyrin
ring, which reduces the treated oil yield at the end of the process. Distillation produces oil with a
lower concentration of impurties and another with a higher concentration. Most of the
demetallization agents that have been applied are acids and not capable of removing the metals
selectively. They remove the whole fraction containing the metals instead of only the metals.

94
Almost all the demetallization agents require an emulsification process to be blended well with the
oil, which raises the cost of the operation. Hydrodemetallization and hydrodesulfurization
techniques have been practiced in the industry. However, such processes are costly as extreme
temperature and pressure conditions are required. In addition, an excessive volume of hydrogen is
required for the reaction. The existence of the catalyst in this technique is a must, although it
rapidly deactivates in a minimal period.
Applying microwave heating in the metals and sulfur removal from crude oil was discovered
recently. It was noted that addressing the microwave heating techniques provided several
advances, such as reaction acceleration, higher yield, and various selectivities. Microwave can
also enforce some synthetic reactions that can not be achieved by superficial heating techniques
[119-122]. It was announced further on in the research that employing microwave heating during
the process demonstrates considerable superiority over the superficial heating technique, as it
enhances the metals removal from the crude oil at a relatively significantly low bulk temperature
compared to the superficial heating mechanism. Additionally, microwave heating reduces energy
consumption due to the high heating selectivity [123-125], avoids heat transfer limitations,
improves process flexibility and equipment portability, and is environmentally friendly, especially
when clean electricity is used.

95
N
N
N NMe
R1
R1
R1
R1
R1
R1
N
N
N NNi
N
N
N NNi
CH3
CH3
CH3CH3
CH3
CH3
CH3
CH3
N
N
N NV
CH3
CH3
CH3CH3
CH3
CH3
CH3
CH3
O
Figure 6.1. Different forms of a metalloporphyrin ring

96
6.2 Microwave heating mechanism
Electromagnetic waves are composed of both alternating electric and magnetic fields that are
orthogonal to each other. The propagation of these fields is in the path that is perpendicular to the
oscillation planes. Electromagnetic radiation behaves like waves, which flow at the velocity of
light, and photons, which carry the radiated energy [51, 54]. For non-magnetic objects, when an
external alternating electric field is employed, the molecules of the exposed material are aligned
with the alternating field. In other words, they reorient themselves to try to be in phase with the
externally applied alternating field. A phase shift is generated between the orientation of the
dipoles and the externally applied electric field because the agitated molecules do not possess the
ability to reorient themselves as swiftly as the reversing field. Random collisions between the
oriented molecules and each other are generated and, as a result, heat energy is released from the
irradiated material. Therefore, the mechanism of microwave heating is fundamentally
characterized as “a volumetric energy transformation” due to the conversion of electromagnetic
energy to heat energy within the exposed volume of the heated material [55, 58].
Based on the interaction between the exposed material and the applied electromagnetic waves, the
heated materials can be classified into three major groups: (1) absorbing materials, such as carbon
and silicon carbide; which absorb the applied microwaves and convert them into heat energy, (2)
transparent materials, such as ceramics and quartz; which allow microwaves to pass through them
without a noticeable interaction, and (3) impermeable materials, such as metals, which reflect
microwaves on their outer services.
To successfully introduce microwave heating in a process, at least one of the target materials must
be an excellent microwave receptor, i.e., it should be included in the first category, or under
controlled conditions, in the third category. Fortunately, most of the materials involved in this
study fall within these two groups, which should facilitate the use of technology in the
demetallization and desulfurizing applications [54]. For non-magnetic materials, the central
parameter that characterizes microwave propagation and the level of energy conversion inside the
irradiated target is “complex permittivity” (ε). It measures the ability of the material to absorb and
store electric potential energy and it is presented as:

97
ε = ε/˗ j ε//
The real part of Equation – ε/ – is called “dielectric constant” or “permittivity.” It measures the
ability of the target material to pass the electric field, through it. The imaginary part of the complex
permittivity – ε// – is called “dielectric loss factor.” It measures the amount of electric energy that
can be stored within the exposed material.
Various attempts have been made to introduce the microwave heating mechanism in the extraction
of metals from crude oil. Khan and Al-Shafei have patented a hydrodesulfurization process that
includes microwave irradiation of a mixture of heavy crude oil with a catalyst and in the presence
of hydrogen [80]. The process took place through the transformation of sulfur compounds into
hydrogen sulfides. The technique was operated under mild conditions as the hydrogen was
maintained in the microwave and the reaction was kept at pressure ranges from 1 atmosphere to
400psig. The temperature of the reaction ranged from 80° C to 400° C and the most desirable was
200°C to 250°C. Crude oil was mixed with an iron powder catalyst, then the mixture was exposed
to microwave heating in the presence of hydrogen. Microwave heating was applied to raise the
temperature of the crude oil to 200°C. The key finding of the process was the reduction of sulfur
concentration by 25% by maintaining the temperature of the oil at 200° C for 20 min. A further
increase in the microwave energy application for 30 minutes while maintaining the temperature at
200°C led to a 27% reduction in sulfur concentration. The irradiation of crude oil when mixed with
a palladium oxide catalyst and sensitizer resulted in a 16-39.4% reduction in sulfur concentration.
Chamorro et al. have used the microwave heating technique to reduce the concentration of both
metals and sulfur in a carbonaceous material [81]. The material was blended with an acidic
compound or a mixture of acids, such as HNO3, H2 SO4, HCL, HCLO4, H3 PO4, and HF, then
the mixture was exposed to microwave irradiation. The process took place at a time between 10
sec. and 1 hour, and at a pressure not exceeding 200 psig, to avoid the evaporation of the reaction
components. The removal ration for both Ni and V reached 80% and 99%, respectively, in 15 min.
Cationic starches have been tested as a demetallization agent for the removal of both Ni and V
from crude oil under the effect of the microwave heating technique. It was demonstrated that
increasing the degree of cationic substitution of cationic starches leads to enhancing the removal
efficiency of heavy metals. The optimum reaction conditions for the removal of both Ni and V are

98
200 mg/L of cationic starch 4 (CS4) with a microwave power of 300 W for a residence time of 5
min. The removal efficiency of Ni when applying the above conditions for Iran and Shengli crude
oil was 55% and 60%, respectively, and in the case of V, it was 76% and 79%, respectively.
In this study, the removal of approximately all the metals, particularly Ni and V, in addition to
sulfur took place using a novel demetallization-desulfurization agent (DM-DSA) under the effect
of the microwave heating mechanism. The technique is green since no consumption of solvents is
required. The process is cost-effective because no alternative emulsification processes are needed,
such as the emulsification process for mixing the agent with the crude oil, since the agent has an
amphiphilic nature.
6.3 Experimental work
6.3.1 Processed materials
Two different petroleum oils received from the company TOTAL in France were processed in this
work. The first oil is “Iran oil” with total V and Ni concentration of up to 110 ppm, and S
concentration of 22,000 ppm. The second oil is the Basra oil with 40 ppm of V+Ni and 27,000
ppm of S concentration. DM-DSA and the alternative chemicals were purchased from Sigma-
Aldrich.
The quantification of metals and sulfur in crude and treated oils is a challenge due to the excessive
complexity of the oil and the low concentration of contamination [126]. The most common
analytical techniques to precisely identify and measure low concentration elements include
Inductive Coupled Plasma Mass Spectrometry (ICP-MS), Inductive Coupled Plasma Atomic
Emission Spectroscopy (ICP-AES), Inductive Coupled Plasma Optical Emission Spectroscopy
(ICP-OES) and Neutron Activation Analysis (NAA) [127-129]. In this work, NAA was performed
to avoid the issues and limitations associated with the digestion and dilution of such complex
materials. NAA analyses were carried out in the SLOWPOKE lab of Polytechnique Montréal, in
Quebec, Canada, using the k0 NAA method [130]. The Fourier-transform infrared spectroscopy
(FTIR) was also applied to detect the transformation of the nitrogen-metal (N-M) bond to the
nitrogen-hydrogen (N-H) bond after the treatment process. The analysis was implemented using a
Perkin Elmer 65 FTIR-ATR instrument (PerkinElmer, Woodbridge, ON, Canada).
99
6.3.2 Sample preparation for the NAA analysis
The analyzed samples in NAA were prepared by injecting about 1g of oil into a 10 mm diameter
HDPE capsule. Consequently, the capsule is inserted into an 18 mm long polyethylene vial. The
capsule and the vial were then properly heat sealed to avoid discharging into the nuclear reactor in
case of leakage. Thereafter, the sample was inserted into the Slowpoke reactor for an irradiation
period between 20 to 30 min, which was selected based on the matrix of crude oil. After the
irradiation period, the radiation of the irradiated sample is counted on an HPGe detector with a
50% relative performance. All samples were counted at various distances of 1.6 mm (P1), 33 mm
(P2) and 100 mm (P3) with regards to the detector [131]. École Polytechnique Montreal Activation
Analysis (EPAA) software was, eventually, employed for processing the data and quantification
of various minerals.
6.3.3 Dielectric properties of the processed materials
To better understand the interaction between the processed materials – i.e., oil, aqueous, and DM-
DSA – the dielectric properties were measured and tabulated in Table 6.1. The measurements were
done in the electrical department at École Polytechnique de Montreal.
Table 6.1 Dielectric properties of the processed materials
Material Dialectic constant Dielectric loss factor
Crude oil 1.6 0.013
Aqueous 79.7 7.5
DM-DSA 76 11
6.3.4 Experimental setup
The experimental setup that was built to carry out the experimental work is demonstrated Figure
6.2. It comprises a microwave generator, a microwave cavity, a batch reactor made of a material
transparent to microwaves, an oil tank, an aqueous phase tank, a thermometer, a reflux to avoid
the evaporation of the heated materials, a stirrer, and a water cooler. The batch reactor, which
includes the heated materials, such as oil, DM-DSA, and/or the aqueous phase, was settled inside
the irradiation cavity. The stirrer was utilized inside the reactor to better mix the reactants together.

100
The reactor connected with a reflux system composed of a set of condensers fitted onto the top of
the reactor and linked with a water-cooler kept at -5 oC. Using the reflux is essential for condensing
the low molecular weight compounds that might evaporate from the heated materials.
6.3.5 Experimental procedure
The invented demetallization-desulfurization process implemented in this work comprises three
primary stages. The initial stage is the reaction between the DM-DSA and the oil in the presence
or absence of an aqueous phase. The primary task of the employed aqueous phase is to trap the
metal salt of DM-DSA as soon as it forms during the extraction process. The reaction was
performed under different microwave powers and irradiation times to investigate the effect of these
parameters on the elimination performance. The second and third stages involved washing the
treated oil and then separating the extracted metals from the washing mixture.
Different volumes of oil were mixed with a calculated percentage of DM-DSA in the reactor. There
was no emulsification needed in this step because the oil and the agent were perfectly miscible.
The employed agent is amphophilic liquid and, thus, can easily be mixed with oil. The aqueous
phase is then added to the mixture in the reactor. A stirrer is always essential for mixing the heated
materials as well as reaching the uniform distribution of temperature. Different stirring speeds,
microwave power, and various residence times were applied.
Once the desired temperature was reached and the irradiation time had passed, the mixture of oil,
DM-DSA, and/or the aqueous phase was further processed to separate the aqueous phase that
encompasses the soluble metal salts from the oil phase. This step was achieved using a setup
similar to a separating funnel, which allows the mixture to settle for few minutes to attain almost
a complete separation of the oil phase from the aqueous phase.
After the reaction step, both metals and sulfur were present in the oil in two different forms, the
metal salt of DM-DSA and the ionic liquid attached to the sulfur compounds. Since both were still
present in the oil phase, a specific number of washings were required to attain the most effective
extraction efficiency. The washing step was performed using a mixture of 50% aqueous phase
incorporated with few drops of organic solvent to dissolve and eliminate the metal salt of the agent
and the unreacted part (if any) from the DM-DSA. The mixture was added to the oil phase and

101
vigorously shaken for a few minutes before being heated for a short time at less than 100 ℃ under
reflux. The same separation setup mentioned above was used to separate the aqueous phase from
the oil phase after each washing step. Finally, the collected treated oil was sent for the analysis
purposes.

102
Figure 6.2 Microwave setup for metals and sulfur removal from oil

103
6.4 Results and discussion
The DM-DSA applied in this work exhibits the same behaviors as carboxylic acids in terms of the
reception of microwave energy. When a mixture of oil and DM-DSA is exposed to the
microwaves, the interaction of the mixture with the microwaves is improved compared to the oil
alone. According to the microwave heating mechanism, polar compounds can effectively absorb
microwave energy. On the other hand, nonpolar materials are not adequately able to convert the
energy of the electromagnetic waves into heat. Thus, the interaction of crude oil with microwaves
is almost negligible compared to that of the aqueous phase and the employed DM-DSA. This
aspect affirms that the inclusion of the DM-DSA with oil enhances the interaction with microwave
heating by creating hot spots in some specific sites [132, 133].
Petroleum oil contains a vast number of metals, the most abundant being V and Ni, which exist in
relatively higher concentrations in the oil. V and Ni have significant interactions with microwaves,
kindly refer to Table 6.2. The novelty of employing electromagnetic waves in such reactions is
to focus the interaction with microwaves where the metals exist and, as a result, enhance the heat
generation at the N-M bonds. This approach facilitates the dissociation or, in other words, break
down of the metal bond, which reinforces the liberation of the metal from the core of the
metalloporphyrin ring. The employed DM- DSA can then easily extract the metals from the
surrounding porphyrin ring and provide the ring with the required protons that are essential for
complete stability.
To sum up, DM-DSA plays several roles by interacting with microwaves, enhancing the heat
generation in the reaction site, extracting the metal ions from the core of the porphyrin ring,
providing the nitrogen ions by essential protons after the N-M bond dissociation, and extracting
sulfur compounds from crude oil.

104
Table 6.2 Penetration depth and heating rates of various metals exposed to microwaves (adapted
from reference [134]
Element Penetration depth (µm) Heating rate (℃/min)
V 11.2 240
Ni 7.8 120
Co 4.8 110
Zn 4 115
Mo 3.1 110
W 2.1 110
Fe 2.1 155
Hg 0.2 500
Analyzing the crude and treated oil with FTIR technique shows a significant variation in the
absorption frequencies between the processed and unprocessed oils. It is assumed that the
metalloporphyrin ring is transferred into the free base porphyrin. Accordingly, new frequencies
for the N-H bonds should appear instead of the N-M bonds. Figure 6.3 shows the deviation in the
IR absorption frequencies between the treated and untreated Iran oil, and Figure 6.4 shows the
same comparison for the Basra oil.
There is a weak band at 3430 cm-1, which is attributed to the N-H bond stretching frequency [135-
138]. There is also a peak located around 1600 cm-1 that is assigned to another vibrational mode
of N-H [113]. The peaks appeared at around 1110 cm-1 and 740 cm-1 in the treated oil relative to
in-plane N−H and out-of-plane bending N−H, respectively [114].
The bands around 2922 cm-1 referred to the C-H bond of the benzene ring and pyrrole ring. Bands
at ~1458 cm-1 and ~1379 cm-1 are attributed to the C=C stretching mode and the C=N stretching
vibration, respectively. The bands at around 800 cm-1 and 750 cm-1 were respectively appointed to
the C-H bond bending vibration of para-substituted and ortho-substituted phenyl rings.
It should be noted from the FTIR graphs that the magnitude of the peaks related to the N-H bond
increased compared to the oil treated with conventional heating. Due to the significant effect of
the microwaves on the reaction mechanism, it was demonstrated that applying the microwaves
enhances the removal efficiency. Accordingly, the elimination percentage of both metals and
sulfur should be efficiently developed, which will positively influence the intensity of the peak.

105
Figure 6.3 FTIR of raw (dotted line) and microwave treated Iran oil (continuous line)
Figure 6.4 FTIR of raw (dotted line) and microwave treated Basra oil (continuous line)
65
70
75
80
85
90
95
100
105
110
700 1000 1300 1600 1900 2200 2500 2800 3100 3400 3700
Tra
nsm
itta
ncy
%
Wavenumber cm-1
Another
vaibrational
mode of N-HIn-plane
N-H
Out of
plane N-Ht
65
70
75
80
85
90
95
100
105
110
700 1000 1300 1600 1900 2200 2500 2800 3100 3400 3700
Tra
nsm
itta
ncy
%
Wavenumber cm-1
In-plane
N-H
Another
vaibrational
mode of N-H
Out of plane
N-Ht
N-H bond
stretching
N-H bond
stretching

106
The NAA technique was performed to quantify the metals and sulfur concentrations present in the
raw and treated oils. The results of the microwave heating were contrasted against those of
conventional heating. Figure 6.5 illustrates the removal efficiency comparison of both heating
mechanisms in the case of Iran oil. The figure reveals a significant variation in approximately all
the metals compared to that of conventional heating.
It is evident from Figure 6.5 and Figure 6.6 that the concentration of Ti considerably dropped using
conventional heating only and the removal efficiency reached 92%. The concentration of V and
Ni presented in Figure 6.5, Figure 6.8, and Figure 6.9 decreased with small amounts and the
removal performance reached around 35% in the case of conventional heating. Although Ti, Ni,
and V remain in the oil in the same chemical forms, the elimination efficiency using traditional
heat is quite apparent in the results of Ti. The principal reason behind this attitude is linked to the
deviation in the electronegativity difference between the N atoms and each metal in the
metalloporphyrin ring. The electronegativity difference between N and Ti is more significant than
that of V and Ni. Thus the N-Ti bond has more ionic character than that of V and Ni. Accordingly,
N can withdraw the bond electrons easily, forming a negatively charged N and positively-charged
Ti, which dramatically boost the liberation of Ti from the porphyrin ring and enhance the removal
efficiency of Ni and V.
When using microwave heating, removal efficiency increased because microwaves generated
hotspots near or entirely within the area where the reaction took place thanks to the interaction of
the matter with microwaves. For this reason, the removal capability of both V and Ni is higher
than that of Ti when using microwave heating compared to the reference case.
Figure 6.5 also demonstrates that both Mg and Cl have high removal efficiencies, 100%, and 80%,
respectively, when applying microwave heating compared to 65% and 23% when using
conventional heating due to the elements remaining in the oil as inorganic salts, mainly in the form
of chloride or sulfate of Mg and other metals ions, such as Ca [24]. These salts are highly soluble
in water because they are characterized by high polarity and, in turn, significant interaction with
microwaves.

107
Figure 6.5 Removal efficiency of treated Iran oil using conventional (blue) and microwave heating
(orange)
Figure 6.6 Removal efficiency of treated Basra oil using conventional (blue) and microwave
heating (orange)
0%
20%
40%
60%
80%
100%Ti
Mg
V
Ni
Cl
S
0%
20%
40%
60%
80%
100%Ti
Mg
V
Ni
Cl
S

108
Figure 6.7 Concentrations of Ti in raw and treated Iran oil using conventional and microwave
heating at different powers and residence times (ppm) – P is the microwave nominal setting
power. P5 ≈ 500 W; P7 ≈ 700 W; P10 ≈ 1000 W; t1 = 1 min; t2 = 2 min; and t3 = 3 min
Figure 6.8 Concentrations of V in raw and treated Iran oil using conventional and microwave
heating. P5 ≈ 500 W; P7 ≈ 700 W; P10 ≈ 1000 W; t1 = 1 min; t2 = 2 min; and t3 = 3 min
6
0.5
1.4
0.2
0.8
1.4
0.90.5
Raw oil
CH
P5 & t1
P5 & t2
P5 & t3
P10 & t1
P10 & t2
P10 & t3
88
59
12.7 11.8 11.3 11.4 9.44.5
Raw oil
CH
P5 & t1
P5 & t2
P5 & t3
P10 & t1
P10 & t2
P10 & t3

109
Figure 6.9 Concentrations of Ni in raw and treated Iran oil using conventional and microwave
heating. P5 ≈ 500 W; P7 ≈ 700 W; P10 ≈ 1000 W; t1 = 1 min; t2 = 2 min; and t3 = 3 min
Figure 6.10 Concentrations of Mg in raw and treated Iran oil using conventional and microwave
heating. P5 ≈ 500 W; P7 ≈ 700 W; P10 ≈ 1000 W; t1 = 1 min; t2 = 2 min; and t3 = 3 min
30
19
30
27
17
27
19
15
Raw oil
CH
P5 & t1
P5 & t2
P5 & t3
P10 & t1
P10 & t2
P10 & t3
17
6
0.9 0.5 0.3
3.9
0 0
Mg
Raw oil
CH
P5 & t1
P5 & t2
P5 & t3
P10 & t1
P10 & t2
P10 & t3

110
Figure 6.11 Concentrations of Cl in raw and treated Iran oil using conventional and microwave
heating. P5 ≈ 500 W; P7 ≈ 700 W; P10 ≈ 1000 W; t1 = 1 min; t2 = 2 min; and t3 = 3 min
Figure 6.12 Concentrations of S in raw and treated Iran oil using conventional and microwave
heating. P5 ≈ 500 W; P7 ≈ 700 W; P10 ≈ 1000 W; t1 = 1 min; t2 = 2 min; and t3 = 3 min
22
17
6.87.9 7.8
6.76
4.5
Raw oil
CH
P5 & t1
P5 & t2
P5 & t3
P10 & t1
P10 & t2
P10 & t3
22795
14816
240 260 350 260 240 250
Raw oil
CH
P5 & t1
P5 & t2
P5 & t3
P10 & t1
P10 & t2
P10 & t3

111
The better results of Mg compared to Cl are mainly due to the greater interaction of Mg with
microwaves compared to that of Cl. Moreover, Mg is present in crude oil in another form, the
metalloporphyrin structure [139]. As previously explained, the liberation of Mg from the ring is
enhanced by applying microwave heating.
The removal efficiency of sulfur shows a high value, 99% when applying microwaves, compared
to 30% using conventional heating. The considerable variation can be explained by the fact that it
is essential to heat the entire oil until it reaches the local temperature of the reaction in the case of
conventional heating. This, in turn, influences several aspects, most importantly the ionic liquid
formed at a lower temperature. The ionic liquid might be exposed to decomposition at elevated
temperatures, leading to the re-separation of some sulfur compounds in the oil. On the other hand,
using microwaves generates a temperature much lower than the decomposition temperature of the
ionic liquid. The formed liquid is highly polar, i.e., high microwave receptor, providing a boost to
the chemistry between the ionic liquid and the sulfur compounds and, consequently, an excellent
opportunity for more sulfur compounds to connect with the DM-DSA, which raises the removal
efficiency of sulfur.
Basra oil was also processed to confirm the previous explanation for each metal as is evident in
Figure 6.6. All the elements in Basra oil agree with those of Iran oil except V, which has the same
removal efficiency for conventional and microwave heating possibly due to Basra oil being less
complex than Iran oil. The removal of V in the case of conventional heating is therefore easier.
However, other aspects, such as the lower bulk temperature of the payload and lower energy
consumption, should be considered in the comparison.

112
Figure 6.13 Concentrations of Ti in raw and treated Basra oil using conventional and microwave
heating at different powers and residence times (ppm) – P is the microwave nominal setting
power. P5 ≈ 500 W; P7 ≈ 700 W; P10 ≈ 1000 W; t1 = 1 min; t2 = 2 min; and t3 = 3 min
Figure 6.14 Concentrations of V in raw and treated Basra oil using conventional and microwave
heating at different powers and residence times (ppm)
3.4
0.6
3.1
1.6
0.5
1
1.6
0.07
1.6
0.1 0
Raw oil CH P5 & t1 P5 & t2 P5 & t3 P7 & t1
P7 & t2 P7 & t3 P10 & t1 P10 & t2 P10 & t3
36.9
3.6
9.410.7 10.6
4.1 3.8 3.3 3.6 4 3
Raw oil CH P5 & t1 P5 & t2 P5 & t3 P7 & t1
P7 & t2 P7 & t3 P10 & t1 P10 & t2 P10 & t3

113
Figure 6.15 Concentrations of Mg in raw and treated Basra oil using conventional and
microwave heating at different powers and residence times (ppm)
Figure 6.16 Concentrations of Ni in raw and treated Basra oil using conventional and microwave
heating at different powers and residence times (ppm)
4.9
1
4.6
2.7
2
4.7
2.3
1.82.1
0.60.43
Raw oil CH P5 & t1 P5 & t2 P5 & t3 P7 & t1
P7 & t2 P7 & t3 P10 & t1 P10 & t2 P10 & t3
9.6
4
7.58.3
6.3
9.1
5.8
3.8
7
4.7
2.8
Raw oil CH P5 & t1 P5 & t2 P5 & t3 P7 & t1
P7 & t2 P7 & t3 P10 & t1 P10 & t2 P10 & t3

114
Figure 6.17 Concentrations of Cl in raw and treated Basra oil using conventional and microwave
heating at different powers and residence times (ppm)
Figure 6.18 Concentrations of S in raw and treated Basra oil using conventional and microwave
heating at different powers and residence times (ppm)
25
107.5
6.3
8.9
5.7 5.3 4.8 5.5 5.7 5.1
Cl
Raw oil CH P5 & t1 P5 & t2 P5 & t3 P7 & t1
P7 & t2 P7 & t3 P10 & t1 P10 & t2 P10 & t3
26353
9750
290 310 240 180 210 210 200 230 240
Raw oil CH P5 & t1 P5 & t2 P5 & t3 P7 & t1
P7 & t2 P7 & t3 P10 & t1 P10 & t2 P10 & t3

115
It was essential to examine the influences of the other process parameters that could impact the
elimination performance of both metals and sulfur. There is significant interest in such an
investigation to determine the most efficient value of the parameters, among the ones applied, to
maximize removal efficiency. This step was implemented using different microwave powers: P5,
P7, and P10, and various residence times: t1, t2, and t3.
It was found from the obtained NAA results of the treated Iran and Basra oils that the elimination
capability of almost all the metals improved by raising the microwave power. For instance, at the
time of t3 Figure 6.7 and Figure 6.13 exhibit a decrease in the Ti concentration. It decreased from
0.8 ppm at P5 to 0.5 ppm at P10 in the case of Iran oil and from 0.5 ppm at P5 to 0.07 ppm at P7,
and then 0 ppm at P10 for Basra oil.
The concentration of V was recorded in Figure 6.8 for Iran oil and Figure 6.14 for Basra oil. It
decreased from 11.3 ppm at P5 to 4.5 ppm at P10 in the Iran oil. For Basra oil, the concentration
of V decreased from 10.6 ppm at P5 to 3.3 ppm at P7; then the concentration showed a further
decline to 3 ppm from increasing the P10. The other elements exist in Figure 6.9, Figure 6.10, and
Figure 6.11 for Iran oil and Figure 6.13 and Figure 6.14 for Basra oil show the same gradual drop
in the metals concentration.
The effect of advancing the microwave power and residence time together on the removal
efficiency of some metals has been investigated using a set of surface plots. Figure 6.19 shows that
at a higher residence time, a marginally inverse trend was observed as the removal efficiency
slightly dropped from 75% to 71% when increasing the time from t1 to t2 at P5. No further decline
in the removal efficiency was observed from t2 to t3. There is no appreciable boost in efficiency
recorded when increasing the residence time at P7 and P10. Therefore, the residence time does not
influence the removal efficiency of V; however, the removal efficiency was proportional to the
irradiation power of the applied microwave. To some extent, a considerable increase in removal
efficiency was noted passing from P5 to P10.
There is a gradual increase in the removal efficiency of Ti that is displayed in Error! Reference s
ource not found. as the residence time increases. The graph demonstrates that the irradiation
power affects the elimination of Ti, as an increase in efficiency was noted as the power increased.
The element was effectively 100% removed at maximum power and residence time. Although both

116
irradiation power and residence time affect the removal efficiency of Ti, power alone has a lower
impact compared to that of the residence time.
The removal efficiency of Ni presented in Figure 6.20 shows a modest drop from t1 to t2 before a
slight improvement was detected in the elimination of Ni after increasing the time from t2 to t3.
The same situation was noted when the irradiation power was increased. The removal
efficiency slightly dropped from P5 to P7 followed by a continuous increase with a reduced
percentage at time t1. At time t2 and t3 any increment in the power showed an increase in the
removal efficiency. It was evident from the graph that increasing both power and the irradiation
time dramatically improved the removal efficiency to the maximum amount at the applied
conditions.
Figure 6.21 shows that the removal efficiency of Mg gradually rose by increasing the irradiation
time. The efficiency did not show improvement when increasing the power from P5 to P7;
however, it climbed when increasing the power to P10. The whole graph illustrates that the
removal efficiency of Mg showed a significant improvement when increasing both irradiation
power and residence time together.

117
Figure 6.19 Removal efficiency of V in treated Basra oil at different microwave powers and
residence times (ppm) – P is the microwave nominal setting power. P5 ≈ 500 W; P7 ≈ 700 W;
P10 ≈ 1000 W; t1 = 1 min; t2 = 2 min; and t3 = 3 min
0

118
Figure 6.20 Removal efficiency of Ni treated Basra at different microwave powers and residence
times (ppm)
Figure 6.21 Removal efficiency of Mg in treated Basra at different microwave powers and
residence times (ppm)

119
It can be concluded from the above-debated results that both irradiation power and residence time
improve the removal efficiency of most metals. Increasing the microwave power improves the
strength of the electric field, resulting in a stronger interaction of the reacted materials with the
electromagnetic field. This interaction and the coupling of the elements with microwaves improved
a rapid, efficient, and instantaneous heat generation process [7, 140]. Therefore, by increasing the
microwave power, the interaction of each metal with microwaves improved, which in
turn increased the heat generation in the N-M bond. Subsequently, the bond weakened, and the
liberation of M from the porphyrin ring became much smoother, which intensified the removal
efficiency.
Regarding residence time, the increase in the removal performance is due to the absorption of more
microwave energy by the metals over a longer residence time, which leads to an increase in
temperature where the metals remain. The removal efficiency of the metals is improved through a
further weakness in the metal bond and greater liberation of metals. On the other hand, increasing
the irradiation time did not strongly affect the metals V, Cl, and S, because they absorbed the
maximum microwave energy in a shorter time. Therefore, increasing the residence time did not
appear to improve removal efficiency.

120
6.5 Conclusion
A new approach has been investigated in this study for applying the microwave heating technique
to remove metals and sulfur from Iran and Basra oils. The microwave heating mechanism
seriously affects the removal efficiency of almost all metals, particularly V and S compounds when
compared with conventional heating techniques. The removal efficiency of V using conventional
heating is 33%, while the removal efficiency of the same element using microwave heating at a
power 5 and after time t1, t2, and t3 reached 87, 90, 95%, respectively. Sulfur as well showed a
higher elimination efficiency when applying the microwave heating, which reached 99% compared
with 60% for conventional heating. Investigating the effect of process parameters, such as
microwave power and residence time, have been demonstrated as well and confirmed by a surface
plot for some metals. It was found that changing the microwave power and residence time actively
enforce the removal efficiency of almost all the metals, particularly Ni. Increasing the power and
residence time enhances the heat generation and focuses on where the reaction takes place.

121
GENERAL DISCUSSION
Removal of metals and sulfur from the waste-derivative oil is indispensable since it would lead to
avoiding most of the issues and limitations that impede its uses in a wide range of commercial
applications. Although a considerable number of techniques have been developed and documented
regarding such objective, only some of them have industrially been established. The main reason
behind this aspect relates to the cons associated with each method. For instance, applying the
solvent extraction method leads to remove the whole fractions that contain the metals, which
declines the yield of the end-product. Distillation technique enhances the production of two grades
of oils: (1) Light oil, which is the primary product and contains a very low concentration of metals;
and (2) heavy oil, which contains a much higher concentration of contaminations that must go in a
further upgrading process for metals removal. Fast catalyst deactivation needs for an emulsification
process, high cost, and long processing time, among other factors, are additional aspects limit the
performing of the developed techniques. Ultrafiltration technique is a capital cost affected due to
the fast fouling of the membrane used in the process. So far, furthermore, no an industrial process
has been designed to remove sulfur and metal in a single step. Kindly refer to section 2 (methods
of demetallization) for further details.
In the first stage of the project, a novel technique has been invented using a developed
demetallization desulfurization agent and by applying the conventional heating technique. The
process composed of three steps, the first step is the main reaction between the agent and the crude
oil under specific temperature, residence time and stirring power. The second step is the washing
step of the treated oil form the metal salt of the DM-DSA formed and the unreacted part of the
agent. The washing step has been applied three times under reflux and at specific temperature
stirring power and residence time. The third step is the separation of the treated oil from the other
components using the decantation and the centrifugation.
Three different analytical techniques have been used for analyzing the treated oil and untreated oil.
The process successfully declined the concentration of all the metals and sulfur in a single step
specifically V that exist in the porphyrinc form. The chemistry behind the elimination reaction of
both metals and sulfur has been studied. The agent acts as a proton donor for the metalloporphyrin
ring after the four nitrogen atoms extract the electron bonds between the metals, due to the high
electronegativity of the nitrogen atoms, which reaches up to 3.04 compared to 1.63 for the V atom.

122
The high electronegativity of the four nitrogens plays an essential role in leaving the metal atom as
a positive metal ion after the electron bond extraction. This, in turn, forms four negative nitrogen
ions, which directly bond with the hydrogen protons from the agent forming the pure porphyrin
ring. At the same time, the negative side of the agent robustly extracts the positive metal ion from
the media creating the metal salt of the agent.
In the second stage of the project, the microwave heating mechanism has been applied during the
demetallization-desulfurization process. The interaction between microwave and metals creates
local hotspots at the metal bonds, which consequently leads to weakening the bond between the
metals and the four nitrogen in the porphyrin ring. This, in turn, enhances the easy and rapid
breakdown of the metal bonds and the liberation of metals from the core of the metalloporphyrin
ring. Also, the high interaction of the other metals in the form of polar salts exist in the oil boosts
the removal of such metals from the crude oil. This means that applying microwave heating
enhances the selective removal of metals from the network of the oils and keep the main skeleton
of the oil without further degradation. As a result, the yield of the treated oil is not affected
compared to the other demetallization technologies.
The invented process is green because there is no solvent consumption during the process compared
with the other processes that require a significant amount of solvents for the extraction process.
Moreover, both of the agent and the washing solvent can be regenerated and reused in the process;
this will decline the waste production and decrease the cost dramatically. The invented technique
is cost-effective, because there is no elevated temperature and/or pressure is required during the
process. Also, there is no any other chemical additives or catalysts are a need for the elimination
process if compared with the HDM-HDS process that currently applied in industry and requires a
high hydrogen consumption, elevated temperature reaches up to 400 ℃, and pressure amounted
100 atm. Furthermore, applying a catalyst is a must in the HDM-HDS process which deactivates
in a short period, due to the deposition of the metal and sulfur oxides on the pore of the catalyst.
This issue raises the cost of the process and give the chance to new technologies with low cost to
replace the existing technology in industry. The invented technique does not require an
emulsification process, because the agent is miscible with oil. Further, applying such heating
mechanism improves the selective removal of the metals and sulfur compounds from the oil. The
interaction of both metals exists in crude oil, the DM-DSA, the ionic liquid formed, and the aqueous

123
phase enhance the generation of local hot spots in the place where such elements and materials
exist. Such hot spots significantly help in weakening the N-M bond and the liberation of the metal
from the metalloporphyrin ring. Also, embedding the microwave enhances the interaction of both
the DM-DSA and the ionic liquid formed with both metals and the sulfur compounds, which boosts
the elimination reactions. By applying the microwave heating technique, the temperature of the
whole oil increased by only one degree due to the low interaction of the oil with microwaves
compared with the conventional heating which increases the temperature of the whole oil up to 170
℃ to reach the reaction temperature. Further, Applying the microwave heating technique decreased
energy consumption by 99%.

124
CONCLUSION AND RECOMMENDATION
8.1 Conclusion
This work develops novel technology for the selective removal of metals and sulfur from petroleum
oil in a single step using a novel demetallization-desulfurization agent (DM-DSA) and microwave
heating technique. Conventional heating was applied as well and the results compared with that of
microwave heating.
The first objective of the project was to select a DM-DSA that fulfills the chemical and dielectric
properties and can extract both metals and sulfur in a single step. To achieve such goal, a set of
chemical agents from a wide range of chemical families were selected. It was essential to choose
an agent with specific characteristics, such as amphiphilicity, miscible with crude oil and does not
require emulsification. For this reason, the physical and chemical properties of each tested agent
were carefully studied.
The second objective was to develop a new process for the removal of metals and sulfur using a
conventional heating mechanism to prove the performance of the selected agent. The first work
was done by developing a technique for the removal of metals and sulfur using conventional
heating. This heating method was used at the beginning to better control the reaction temperature
and test the performance of the chosen DM-DSA. Five crude oils with different metals and sulfur
concentrations were used to begin the work. All the oils had been tested under the same reaction
conditions, such as temperature, pressure, residence time, stirring power, and DM-DSA dosage.
The processed oil was then analyzed using different analytical techniques, such as Neutron
activation analysis (NAA), Fourier transform infrared spectroscopy (FTIR), and elemental
analysis. The results were compared with those of the raw oil to calculate the removal efficiency
of each element. The comparison confirmed that almost all the metals and sulfur in the processed
oil were reduced by considerable amounts.
It was essential to investigate the removal mechanism to better understand the chemistry behind
the reaction and this was the third objective. Therefore, the chemistry of the reaction was well
studied to propose a mechanism for the elimination reaction and explain the way the DM-DSA
extracted the metals and sulfur from the composition of the crude oil. It was found that the agent
acted as a proton donor for the four N negative ions present in the metalloporphyrin ring and

125
extracted the metals as a metal salt of the agent. For sulfur extraction, the agent formed an ionic
liquid when mixed with the oil, and this liquid had a high tendency to extract the sulfur compounds
through a hydrogen bond and electrostatic force.
The principal objective – which includes the originality of the project – was the embedding of the
microwaves as the central heating mechanism in the removal process with the novel DM-DSA. this
objective was achieved by applying the electromagnetic irradiation during the removal process to
take the advantages of the interaction between DM-DSA and metals present in the oil with the
applied microwaves. The work was done using Iran and Basra oils received from TOTAL France
directly from their tanks. The removal efficiency of both metals and sulfur was compared for
conventional and microwave heating. A significant improvement in removal efficiency by applying
microwaves was noted. The concentrations of all the elements were reduced, specifically for V,
90% removal efficiency, which is difficult to eliminate from the metalloporphyrin ring. The
elimination efficiency of sulfur also dramatically increased and reached 99%.
The last objective was to investigate the influence of the basic process parameters, such as DM-
DSA dosage, irradiation power, residence time, and others on the removal efficiency of the
developed technique. To improve the removal efficiency of both metals and sulfur, we tested the
effects of different process parameters, such as microwave power and residence time. The test was
implemented at irradiation powers P5, P7, and P10 and at residence times t1, t2, and t3. The effect
of changing both the irradiation power and residence time on the removal efficiency of each
element was also studied. It was found that both parameters enhance the removal efficiency of
some elements, and the maximum removal efficiency of most elements at the applied conditions
was reached at P10 and time t3.
8.2 Recommendations for future work
It is recommended to develop a technique to regenerate the reacted DM-DSA. It may decrease the
cost of the process and help to recycle the agent and the aqueous phase consumed during the
removal process. Developing a synthesizing process for the DM-DSA and comparing the cost
against the market price is recommended as well. It is essential to create a kinetic model to predict
the metals, especially V & Ni, and sulfur concentration in the treated oil. Carrying out a full study
of the process design and simulation based on the invented techniques and considering the

126
economic aspects are recommended. Finally, a scale-up of the invented process using the lab-scale
results is also important to apply the designed technique on an industrial scale.

127
REFERENCES
[1] A. C. Jenifer, P. Sharon, A. Prakash, and P. C. Sande, "A Review of the Unconventional Methods Used for the Demetallization of Petroleum Fractions over the Past Decade," Energy & Fuels, vol. 29, no. 12, pp. 7743-7752, 2015/12/17 2015.
[2] M. F. Ali and S. Abbas, "A review of methods for the demetallization of residual fuel oils," Fuel Processing Technology, vol. 87, no. 7, pp. 573-584, 7// 2006.
[3] V. Valkovic, Trace elements in petroleum. 1978, p. Medium: X; Size: Pages: 279. [4] T. F. Yen, "Role of trace metals in petroleum," 1975. [5] M. F. Ali, H. Perzanowski, A. Bukhari, and A. A. Al-Haji, "Nickel and vanadyl porphyrins in Saudi
Arabian crude oils," Energy & fuels, vol. 7, no. 2, pp. 179-184, 1993. [6] G. R. Dedeles et al., "Microbial demetallization of crude oil: nickel protoporphyrin disodium as a
model organo-metallic substrate," Journal of bioscience and bioengineering, vol. 90, no. 5, pp. 515-521, 2000.
[7] H. Shang, Y. Liu, J.-C. Shi, Q. Shi, and W.-H. Zhang, "Microwave-assisted nickel and vanadium removal from crude oil," Fuel Processing Technology, vol. 142, pp. 250-257, 2016/02/01/ 2016.
[8] A. Miadonye, S. Snow, D. Irwin, M. R. Khan, and A. Britten, "Desulfurization of heavy crude oil by microwave irradiation," Computational Methods in Multiphase Flow V, vol. 63, p. 455, 2009.
[9] H. Hosseini and A. Hamidi, "Sulfur Removal of Crude Oil by Ultrasound-Assisted Oxidative Method," in International Conference on Biologi-cal, Civil and Environmental Engineering (BCEE-2014) March, 2014, pp. 17-18.
[10] R. E. Overfield, "Method for extracting nickel and vanadium compounds from oils," ed: Google Patents, 1986.
[11] J. G. Speight, "Visbreaking: A technology of the past and the future," Scientia Iranica, vol. 19, no. 3, pp. 569-573, 6// 2012.
[12] R. E. Brown, R. J. Hogan, D. M. Coombs, and S. G. Kukes, "Process for demetallizing and desulfurizing heavy crude oil," ed: Google Patents, 1989.
[13] R. Magomedov, A. Popova, T. Maryutina, K. M. Kadiev, and S. Khadzhiev, "Current status and prospects of demetallization of heavy petroleum feedstock (Review)," Petroleum Chemistry, vol. 55, no. 6, pp. 423-443, 2015.
[14] J. G. Speight, The chemistry and technology of petroleum. CRC press, 2014. [15] M. A. Rodríguez, I. Elizalde, and J. Ancheyta, "Modeling the performance of a bench-scale reactor
sustaining HDS and HDM of heavy crude oil at moderate conditions," Fuel, vol. 100, pp. 152-162, 2012.
[16] D.-I. S. Kim, Pin Tu; Teh, Fu Yen; , " Evaluation of Versatile Ultrasonic Effects on Degradation of Organometallics from Petroleum.," Environmental Engineering Research, vol. 8, no. 2, p. 59−71, 2003.
[17] H. Salehizadeh, M. Mousavi, S. Hatamipour, and K. Kermanshahi, "Microbial demetallization of crude oil using Aspergillus sp.: vanadium oxide octaethyl porphyrin (VOOEP) as a model of metallic petroporphyrins," Iranian Journal of Biotechnology, vol. 5, no. 4, pp. 226-231, 2007.
[18] L. Beach and J. Shewmaker, "The Nature of Vanadium in Petroleum. Extraction and Volatility Studies," Industrial & Engineering Chemistry, vol. 49, no. 7, pp. 1157-1164, 1957.
[19] P. C. Mandal, M. Sasaki, and M. Goto, "Non-catalytic vanadium removal from vanadyl etioporphyrin (VO-EP) using a mixed solvent of supercritical water and toluene: A kinetic study," Fuel, vol. 92, no. 1, pp. 288-294, 2012.
[20] L. Sombral, A. C. Pickler, J. R. Aires, and C. A. Riehl, "Study on nickel and vanadium removal in thermal conversion of oil sludge and oil shale sludge," in Journal de Physique IV (Proceedings), 2003, vol. 107, pp. 1255-1258: EDP sciences.

128
[21] K. N. Awokoya, B. A. Moronkola, S. Chigome, D. A. Ondigo, Z. Tshentu, and N. Torto, "Molecularly imprinted electrospun nanofibers for adsorption of nickel-5, 10, 15, 20-tetraphenylporphine (NTPP) in organic media," Journal of Polymer Research, vol. 20, no. 6, pp. 1-9, 2013.
[22] R. A. Ware and J. Wei, "Catalytic hydrodemetallation of nickel porphyrins: I. Porphyrin structure and reactivity," Journal of catalysis, vol. 93, no. 1, pp. 100-121, 1985.
[23] P. C. Mandal, M. Sasaki, and M. Goto, "Nickel removal from nickel-5, 10, 15, 20-tetraphenylporphine using supercritical water in absence of catalyst: A basic study," Journal of hazardous materials, vol. 187, no. 1, pp. 600-603, 2011.
[24] K. Welter, E. Salazar, Y. Balladores, O. Márquez, J. Márquez, and Y. Martínez, "Electrochemical removal of metals from crude oil samples," Fuel Processing Technology, vol. 90, no. 2, pp. 212-221, 2009.
[25] M. F. Ali, A. Bukhari, and M. Saleem, "Trace metals in crude oils from Saudi Arabia," Industrial & engineering chemistry product research and development, vol. 22, no. 4, pp. 691-694, 1983.
[26] S. M. Y. Yamada, H. Kakiyama, H. Honda,, Japan, 1979. [27] O. R. Koseoglu, A. Al-Hajji, and H. Muller, "Process for demetallization of whole crude oil," ed:
Google Patents, 2015. [28] O. Kutowy, T. A. Tweddle, and J. D. Hazlett, "Method for the molecular filtration of
predominantly aliphatic hydrocarbon liquids," ed: Google Patents, 1989. [29] J. Arod et al., "Process for the treatment of a hydrocarbon charge by high temperature
ultrafiltration," ed: Google Patents, 1983. [30] A. Duong, G. Chattopadhyaya, W. Y. Kwok, and K. J. Smith, "An experimental study of heavy oil
ultrafiltration using ceramic membranes," Fuel, vol. 76, no. 9, pp. 821-828, 1997. [31] E. J. Osterhuber, "Upgrading heavy oils by solvent dissolution and ultrafiltration," ed: Google
Patents, 1989. [32] S. G. Kukes and D. R. Battiste, "Demetallization of heavy oils with phosphorous acid," ed: Google
Patents, 1985. [33] P. K. Eidem, "Reducing the metals content of petroleum feedstocks," ed: Google Patents, 1988. [34] G. F. S. R. Bearden, USA, 1985. [35] M. J. Michlmayr, "Upgrading metal-contaminated petroleum oils containing vanadium and/or
nickel," ed: Google Patents, 1977. [36] "On-site purification of problem petrolic liquid fuels," ed: Google Patents, 1972. [37] "Method for removing metal from hydrocarbon oil by using by product generated in producing
fatty acid through oxidizing paraffin," ed: Google Patents, 2003. [38] P. J. P. M.A. Greaney, "Demetalation of petroleum streams," USA,
1999. [39] J. Maxwell, C. T. Pillinger, and G. Eglinton, "Organic geochemistry," Quarterly Reviews, Chemical
Society, vol. 25, no. 4, pp. 571-628, 1971. [40] A. G. Hurter, "Removal of metal contaminants from oil," ed: Google Patents, 1989. [41] K. A. Gould, "Oxidative demetallization of petroleum asphaltenes and residua," Fuel, vol. 59, no.
10, pp. 733-736, 1980/10/01/ 1980. [42] E. G. A. Bukowski, M. Gardzinski, K. Wawszczak, , "Removal
of’heavy metals from petroleum fractions," Poland, 1979. [43] F. Samedova, A. Kasumova, S. Y. Rashidova, and G. Bakhshesh, "Dehydration and desalination of
oils using supercritical carbon dioxide," Russian Journal of Physical Chemistry B, vol. 5, no. 7, pp. 1076-1079, 2011.

129
[44] Y. Shiraishi, T. Hirai, and I. Komasawa, "A novel demetalation process for vanadyl-and nickelporphyrins from petroleum residue by photochemical reaction and liquid-liquid extraction," Industrial & engineering chemistry research, vol. 39, no. 5, pp. 1345-1355, 2000.
[45] J. R. P. Maxwell, C. T.; Eglinton, G.. Q. , , . " Organic geochemistry," Rev., Chem. Soc., vol. 25, p. 571−628, 1971.
[46] D. P. Mann, S. G. Kukes, and D. M. Coombs, "Metals removal with a light hydrocarbon and an organophosphorous compound," ed: Google Patents, 1985.
[47] K. S. Suslick et al., "Acoustic cavitation and its chemical consequences," Philosophical Transactions of the Royal Society of London A: Mathematical, Physical and Engineering Sciences, vol. 357, no. 1751, pp. 335-353, 1999.
[48] S. Le Borgne and R. Quintero, "Biotechnological processes for the refining of petroleum," Fuel Processing Technology, vol. 81, no. 2, pp. 155-169, 2003.
[49] C. Ovalles et al., "Upgrading of Orinoco Belt crude oil and its fractions by an electrochemical system in the presence of protonating agents," Fuel processing technology, vol. 48, no. 2, pp. 159-172, 1996.
[50] S. M. Rao and M.-O. Coppens, "Increasing robustness of deactivating nanoporous catalysts by optimizing the pore network—application to Hydrodemetalation," diffusion-fundamentals. org, vol. 16, pp. 1-2, 2011.
[51] S. Farag and J. Chaouki, "Microwave Heating Assisted Biorefinery of Biomass," in Innovative Solutions in Fluid-Particle Systems and Renewable Energy Management, T. Katia, Ed. Hershey, PA, USA: IGI Global, 2015, pp. 131-166.
[52] S. Farag, "Production of Chemicals by Microwave Thermal Treatment of Lignin," Philosophiae Doctor Ph.D. Thesis, Chem. Eng., University of Montreal: École Polytechnique de Montréal, December 2013.
[53] S. Farag and J. Chaouki, "A modified microwave thermo-gravimetric-analyzer for kinetic purposes," Applied Thermal Engineering, vol. 75, pp. 65-72, 1/22/ 2015.
[54] S. Farag, A. Sobhy, C. Akyel, J. Doucet, and J. Chaouki, "Temperature profile prediction within selected materials heated by microwaves at 2.45GHz," Applied Thermal Engineering, vol. 36, no. 0, pp. 360-369, 4// 2012.
[55] S. Farag, D. Fu, P. G. Jessop, and J. Chaouki, "Detailed compositional analysis and structural investigation of a bio-oil from microwave pyrolysis of kraft lignin," Journal of Analytical and Applied Pyrolysis, vol. 109, no. 0, pp. 249-257, 9// 2014.
[56] S. Farag, L. Kouisni, and J. Chaouki, "Lumped Approach in Kinetic Modeling of Microwave Pyrolysis of Kraft Lignin," Energy & Fuels, vol. 28, no. 2, pp. 1406-1417, 2014/02/20 2014.
[57] S. Farag, B. P. Mudrabovina, P. G. Jessop, and J. Chaouki, "Impact of the Heating Mechanism on the Yield and Composition of Bio-oil from Pyrolysis of Kraft Lignin," Biomass and Bioenergy, 2016.
[58] S. Samih, M. Latifi, S. Farag, P. Leclerc, and J. Chaouki, "From complex feedstocks to new processes: the role of the newly developed micro-reactors," Chemical Engineering and Processing - Process Intensification, 2018/07/07/ 2018.
[59] T. Durka, T. Van Gerven, and A. Stankiewicz, "Microwaves in Heterogeneous Gas-Phase Catalysis: Experimental and Numerical Approaches," Chemical Engineering & Technology, vol. 32, no. 9, pp. 1301-1312, 2009.
[60] J. Doucet, J.-P. Laviolette, S. Farag, and J. Chaouki, "Distributed Microwave Pyrolysis of Domestic Waste," (in English), Waste and Biomass Valorization, vol. 5, no. 1, pp. 1-10, 2014/02/01 2014.
[61] M. Gupta and W. W. L. Eugene, Microwaves and metals. Singapore: John Wiley & sons (Asia) Pte Ltd 2007, p. 256.

130
[62] B. M. Chandra Shekara, B. S. Jai Prakash, and Y. S. Bhat, "Microwave-induced deactivation-free catalytic activity of BEA zeolite in acylation reactions," Journal of Catalysis, vol. 290, no. 0, pp. 101-107, 2012.
[63] V. Paixão et al., "Desilication of MOR zeolite: Conventional versus microwave assisted heating," Applied Catalysis A: General, vol. 402, no. 1–2, pp. 59-68, 2011.
[64] Z. Zhang and Z. K. Zhao, "Microwave-assisted conversion of lignocellulosic biomass into furans in ionic liquid," Bioresource Technology, vol. 101, no. 3, pp. 1111-1114, 2010.
[65] R. Pan, Y. Wu, Q. Wang, and Y. Hong, "Preparation and catalytic properties of platinum dioxide nanoparticles: A comparison between conventional heating and microwave-assisted method," Chemical Engineering Journal, vol. 153, no. 1–3, pp. 206-210, 2009.
[66] V. L. Budarin et al., "The preparation of high-grade bio-oils through the controlled, low temperature microwave activation of wheat straw," Bioresource Technology, vol. 100, no. 23, pp. 6064-6068, 2009.
[67] S. Karthikeyan, R. Balasubramanian, and S. W. See, "Optimization and validation of a low temperature microwave-assisted extraction method for analysis of polycyclic aromatic hydrocarbons in airborne particulate matter," Talanta, vol. 69, no. 1, pp. 79-86, 2006.
[68] M. E. Lucchesi, F. Chemat, and J. Smadja, "Solvent-free microwave extraction of essential oil from aromatic herbs: comparison with conventional hydro-distillation," Journal of Chromatography A, vol. 1043, no. 2, pp. 323-327, 2004.
[69] P. Patil, V. G. Gude, S. Pinappu, and S. Deng, "Transesterification kinetics of Camelina sativa oil on metal oxide catalysts under conventional and microwave heating conditions," Chemical Engineering Journal, vol. 168, no. 3, pp. 1296-1300, 2011.
[70] M. Guiotoku, C. R. Rambo, F. A. Hansel, W. L. E. Magalhães, and D. Hotza, "Microwave-assisted hydrothermal carbonization of lignocellulosic materials," Materials Letters, vol. 63, no. 30, pp. 2707-2709, 2009.
[71] A. Krzan and E. Zagar, "Microwave driven wood liquefaction with glycols," Bioresource Technology, vol. 100, no. 12, pp. 3143-3146, 2009.
[72] H. Dogan and N. D. Hilmioglu, "Dissolution of cellulose with NMMO by microwave heating," Carbohydrate Polymers, vol. 75, no. 1, pp. 90-94, 2009.
[73] S. Sithambaram, E. K. Nyutu, and S. L. Suib, "OMS-2 catalyzed oxidation of tetralin: A comparative study of microwave and conventional heating under open vessel conditions," Applied Catalysis A: General, vol. 348, no. 2, pp. 214-220, 2008.
[74] A. Orozco, M. Ahmad, D. Rooney, and G. Walker, "Dilute Acid Hydrolysis of Cellulose and Cellulosic Bio-Waste Using a Microwave Reactor System," Process Safety and Environmental Protection, vol. 85, no. 5, pp. 446-449, 2007.
[75] J. A. Menéndez, A. Domínguez, M. Inguanzo, and J. J. Pis, "Microwave pyrolysis of sewage sludge: analysis of the gas fraction," Journal of Analytical and Applied Pyrolysis, vol. 71, no. 2, pp. 657-667, 2004.
[76] S. Zhu, Y. Wu, Z. Yu, J. Liao, and Y. Zhang, "Pretreatment by microwave/alkali of rice straw and its enzymic hydrolysis," Process Biochemistry, vol. 40, no. 9, pp. 3082-3086, 2005.
[77] F. Motasemi and M. T. Afzal, "A review on the microwave-assisted pyrolysis technique," Renewable and Sustainable Energy Reviews, vol. 28, no. 0, pp. 317-330, 12// 2013.
[78] T. A. Dickneider. (2019). Petretec – Dupont’s Technology For Polyester Regeneration. Available: https://www.scranton.edu/faculty/cannm/green-chemistry/english/industrialchemistrymodule.shtml
[79] X. Zhao, Q. Shi, M. R. Gray, and C. Xu, "New vanadium compounds in venezuela heavy crude oil detected by positive-ion electrospray ionization fourier transform ion cyclotron resonance mass spectrometry," Scientific reports, vol. 4, 2014.

131
[80] R. M. Khan and E. N. Al-Shafei, "Microwave-promoted desulfurization of crude oil," ed: Google Patents, 2013.
[81] M. D. L. M. De Chamorro and M. C. Romano, "Simultaneous demetallization and desulphuration of carbonaceous materials via microwaves," ed: Google Patents, 2000.
[82] S. Wang, J. Yang, and X. Xu, "Effect of the cationic starch on removal of Ni and V from crude oils under microwave irradiation," Fuel, vol. 90, no. 3, pp. 987-991, 2011/03/01/ 2011.
[83] G. E. P, "On-site purification of problem petrolic liquid fuels," ed: Google Patents, 1972. [84] H. Loebell, J. Marcusson, R. Eickmann, A. Scheller, E. Pailler, and D. Holde, "Über die
Untersuchung von Asphalten Untersuchung von Asphalten," Zeitschrift für analytische Chemie, vol. 56, no. 3, pp. 157-159, 1917.
[85] M. A. Greaney and P. J. Polini, "Method for demetallating petroleum streams (LAW772)," ed: Google Patents, 1999.
[86] L. J. Kashima Oil Co., "Removal of heavy metals from heavy petroleum oil.," Japan, 1983. [87] D. A. Young, " Demetalization of petroleum feedstocks with zinc chloride and titanium
tetrachloride catalysts," United States, 1979. Available: https://patents.google.com/patent/US4148717A/en#patentCitations.
[88] D. A. Young, "Demetallization of petroleum feedstocks with zinc chloride and titanium tetrachloride catalysts," ed: Google Patents, 1979.
[89] M. Siskin, "Hydrodesulfurization with a metal halide-hydrogen halide catalyst," ed: Google Patents, 1977.
[90] N. S. Nametkin et al., "Method of purifying crude petroleum and primary refining products," ed: Google Patents, 1976.
[91] W. K. Gleim, "Hydrorefining of metal-containing black oils with a molten lewis acid and a molybdenum halide," ed: Google Patents, 1969.
[92] W. C. Baird Jr and R. Bearden Jr, "Combined desulfurization and hydroconversion with alkali metal oxides," ed: Google Patents, 1977.
[93] R. Bearden Jr, "Combined disulfurization and conversion with alkali metals," ed: Google Patents, 1978.
[94] M. A. Greaney, M. C. Kerby Jr, W. N. Olmstead, and I. A. Wiehe, "Method for demetallating refinery feedstreams," ed: Google Patents, 1996.
[95] S. Savel'ev, G. Azerbaeva, Y. Saltykov, and N. Noskova, "Binding of petroleum metals into insoluble complexes," Izvestia Ministerstva Nauki Akademii Nauk Respubliki Kazahstan, Seria Khimicheskaya, vol. 1, pp. 40-45, 1996.
[96] S. G. Kukes and T. Davis, "Demetallization of heavy oils," ed: Google Patents, 1983. [97] T. Y. Yan, "Demetalation of heavy hydrocarbon oils," ed: Google Patents, 1983. [98] Z. Peifu, T. Zhang, "Removal of metals from hydrocarbon raw material with chelating agent,,"
China, 1991. [99] Y. O. H. Miyadera, H. Ozaki, T. Suzuka, K. Nakamura, H. Yoshikai, " Removal of metal from waste
petroleum residual oils with molten tin," Japan, 1975. [100] J. G. Reynolds, Removal of nickel and vanadium from heavy crude oils by exchange reactions.
United States. Department of Energy, 2003. [101] E. Z. J. Wieckowska, T. Lisik, T. Chrapek, J. Tomusiak, "Method of removing metallic compounds
from petroleum and its fractions and distillation residues.," Polish 1988. [102] C. L. Aldridge, R. Bearden Jr, and K. L. Riley, "Removal of metallic contaminants from a
hydrocarbonaceous liquid," ed: Google Patents, 1991. [103] L. A. Rankel, "Process for treating heavy oil," ed: Google Patents, 1994. [104] J. Piskorz, D. S. A. Radlein, P. Majerski, and D. S. Scott, "Hydrotreating of heavy hydrocarbon oils
in supercritical fluids," ed: Google Patents, 1996.

132
[105] K. L. Riley, "Two-stage hydrodesulfurization of oil utilizing a narrow pore size distribution catalyst," ed: Google Patents, 1977.
[106] Mobil Oil Corp. USA, "Catalyst for demetalizing and desulfurizing hydrocarbons.," Netherland, 1979.
[107] L. Nippon Oil Co., "Heavy petroleum oil treatment," Japanese, 1982. [108] D. L. J. Devanneaux, J.P. Gallez, J.C. Courcelle, , "Catalyst and methods for hydrodemetallation of
hydrocarbon charges.," France, 1984. [109] H. J. Chen and F. Massoth, "Hydrodemetalation of vanadium and nickel porphyrins over sulfided
cobalt-molybdenum/alumina catalyst," Industrial & engineering chemistry research, vol. 27, no. 9, pp. 1629-1639, 1988.
[110] R. A. M. Gomez, "Treatment of crude oils," ed: Google Patents, 2005. [111] J. Y. Y. Z.C.Wen, X.R. Xu, B.C. Cao, J.S. Gao, "Microwave chemistry method removal
of nickel and vanadium in crude oil," 2009. [112] S. Wang, X. Xu, J. Yang, and J. Gao, "Effect of the carboxymethyl chitosan on removal of nickel
and vanadium from crude oil in the presence of microwave irradiation," Fuel Processing Technology, vol. 92, no. 3, pp. 486-492, 3// 2011.
[113] K. A. Castro et al., "Galactodendritic porphyrinic conjugates as new biomimetic catalysts for oxidation reactions," Inorganic chemistry, vol. 54, no. 9, pp. 4382-4393, 2015.
[114] P. Sen et al., "Fluorescence and FTIR Spectra Analysis of Trans-A (2) B (2)-Substituted Di-and Tetra-Phenyl Porphyrins," Materials, vol. 3, no. 8, pp. 4446-4475, 2010.
[115] D. Kogelnig et al., "Greener synthesis of new ammonium ionic liquids and their potential as extracting agents," Tetrahedron Letters, vol. 49, no. 17, pp. 2782-2785, 2008/04/21/ 2008.
[116] P. Pirkwieser, J. A. Lopez-Lopez, W. Kandioller, B. K. Keppler, C. Moreno, and F. Jirsa, "Novel 3-Hydroxy-2-Naphthoate-Based Task-Specific Ionic Liquids for an Efficient Extraction of Heavy Metals," (in eng), Front Chem, vol. 6, p. 172, 2018.
[117] S. Platzer et al., "Task-specific thioglycolate ionic liquids for heavy metal extraction: Synthesis, extraction efficacies and recycling properties," Journal of Hazardous Materials, vol. 324, pp. 241-249, 2017/02/15/ 2017.
[118] S. A. Dharaskar, K. L. Wasewar, M. N. Varma, D. Z. Shende, K. K. Tadi, and C. K. Yoo, "Synthesis, characterization, and application of novel trihexyl tetradecyl phosphonium bis (2,4,4-trimethylpentyl) phosphinate for extractive desulfurization of liquid fuel," Fuel Processing Technology, vol. 123, pp. 1-10, 2014/07/01/ 2014.
[119] B. L. Hayes, Microwave synthesis: chemistry at the speed of light. Cem Corporation, 2002. [120] C. O. Kappe, "Controlled microwave heating in modern organic synthesis," Angewandte Chemie
International Edition, vol. 43, no. 46, pp. 6250-6284, 2004. [121] C. O. Kappe, A. Stadler, and D. Dallinger, Microwaves in organic and medicinal chemistry. John
Wiley & Sons, 2012. [122] X. Jiaxi, "Microwave irradiation and selectivities in organic reactions," PROGRESS IN CHEMISTRY-
BEIJING-, vol. 19, no. 5, p. 700, 2007. [123] G. B. Dudley, R. Richert, and A. Stiegman, "On the existence of and mechanism for microwave-
specific reaction rate enhancement," Chemical science, vol. 6, no. 4, pp. 2144-2152, 2015. [124] P.-K. Chen, M. R. Rosana, G. B. Dudley, and A. Stiegman, "Parameters affecting the microwave-
specific acceleration of a chemical reaction," The Journal of organic chemistry, vol. 79, no. 16, pp. 7425-7436, 2014.
[125] M. R. Rosana et al., "Microwave-specific acceleration of a Friedel–Crafts reaction: Evidence for selective heating in homogeneous solution," The Journal of organic chemistry, vol. 79, no. 16, pp. 7437-7450, 2014.

133
[126] W. F. McDonough and S. s. Sun, "The composition of the Earth," Chemical Geology, vol. 120, no. 3, pp. 223-253, 1995/03/01/ 1995.
[127] E. Bulska et al., "Inductively coupled plasma mass spectrometry in comparison with neutron activation and ion chromatography with UV/VIS detection for the determination of lanthanides in plant materials," Talanta, vol. 97, pp. 303-311, 2012/08/15/ 2012.
[128] J. A. D'Angelo, L. D. Martinez, S. Resnizky, E. Perino, and E. J. Marchevsky, "DETERMINATION OF EIGHT LANTHANIDES IN APATITES BY ICP-AES, XRF, AND NAA," Journal of Trace and Microprobe Techniques, vol. 19, no. 1, pp. 79-90, 2001/03/28 2001.
[129] R. S. Dybczyński, E. Czerska, B. Danko, K. Kulisa, and Z. Samczyński, "Comparison of performance of INAA, RNAA and ion chromatography for the determination of individual lanthanides," Applied Radiation and Isotopes, vol. 68, no. 1, pp. 23-27, 2010/01/01/ 2010.
[130] C. Chilian and G. Kennedy, "The NAA method at Polytechnique Montreal: an efficient alternative way to use the k0 NAA models," Journal of Radioanalytical and Nuclear Chemistry, vol. 300, no. 2, pp. 533-538, 2014/05/01 2014.
[131] M. Abdollahi Neisiani, M. Latifi, J. Chaouki, and C. Chilian, "Novel approach in k0-NAA for highly concentrated REE Samples," Talanta, vol. 180, pp. 403-409, 2018/04/01/ 2018.
[132] S. Horikoshi and N. Serpone, "Role of microwaves in heterogeneous catalytic systems," Catalysis Science & Technology, vol. 4, no. 5, pp. 1197-1210, 2014.
[133] N. F. K. Kaiser, U. Bremberg, M. Larhed, C. Moberg, and A. Hallberg, "Fast, Convenient, and Efficient Molybdenum‐Catalyzed Asymmetric Allylic Alkylation under Noninert Conditions: An Example of Microwave‐Promoted Fast Chemistry," Angewandte Chemie International Edition, vol. 39, no. 20, pp. 3595-3598, 2000.
[134] M. Gupta and E. W. W. Leong, Microwaves and metals. John Wiley & Sons, 2008. [135] M. Asemani and A. R. Rabbani, "Oil-oil correlation by FTIR spectroscopy of asphaltene samples,"
Geosciences Journal, journal article vol. 20, no. 2, pp. 273-283, April 01 2016. [136] M. R. Derrick, D. Stulik, and J. M. Landry, Infrared spectroscopy in conservation science. Getty
Publications, 2000. [137] D. W. Mayo, F. A. Miller, and R. W. Hannah, Course notes on the interpretation of infrared and
Raman spectra. John Wiley & Sons, 2004. [138] D. L. Pavia, G. M. Lampman, G. S. Kriz, and J. A. Vyvyan, Introduction to spectroscopy. Cengage
Learning, 2008. [139] M. Khuhawar, M. A. Mirza, and T. Jahangir, "Determination of metal ions in crude oils," in Crude
oil emulsions-Composition stability and characterization: InTech, 2012. [140] X. Li and J. Xu, "Effects of the Microwave Power on the Microwave-assisted Esterification,"
Current Microwave Chemistry, vol. 4, no. 2, pp. 158-162, 2017. [141] B. Knight and A. Westwood, "World biomass review: Biomass as a global power source," Refocus,
vol. 5, no. 6, pp. 42-44, 2004. [142] G. Berndes, M. Hoogwijk, and R. van den Broek, "The contribution of biomass in the future global
energy supply: a review of 17 studies," Biomass and Bioenergy, vol. 25, no. 1, pp. 1-28, 2003. [143] F. Sherif and C. Jamal, "Energy and chemicals from biomass & waste: the state of the art,"
Submitted for publication. [144] J. S. Tumuluru, S. Sokhansanj, C. T. Wright, R. D. Boardman, and N. A. Yancey, "A Review on
Biomass Classification and Composition, Co-Firing Issues and Pretreatment Methods," Idaho National Laboratory (INL)2011.
[145] G. Tao, T. A. Lestander, P. Geladi, and S. Xiong, "Biomass properties in association with plant species and assortments I: A synthesis based on literature data of energy properties," Renewable and Sustainable Energy Reviews, vol. 16, no. 5, pp. 3481-3506, 2012.

134
[146] J. M. F. Johnson, A. J. Franzluebbers, S. L. Weyers, and D. C. Reicosky, "Agricultural opportunities to mitigate greenhouse gas emissions," Environmental Pollution, vol. 150, no. 1, pp. 107-124, 2007.
[147] P. McKendry, "Energy production from biomass (part 1): overview of biomass," Bioresource Technology, vol. 83, no. 1, pp. 37-46, 5// 2002.
[148] G. Tao, P. Geladi, T. A. Lestander, and S. Xiong, "Biomass properties in association with plant species and assortments. II: A synthesis based on literature data for ash elements," Renewable and Sustainable Energy Reviews, vol. 16, no. 5, pp. 3507-3522, 2012.
[149] C. E. Wyman, B. E. Dale, R. T. Elander, M. Holtzapple, M. R. Ladisch, and Y. Y. Lee, "Coordinated development of leading biomass pretreatment technologies," Bioresource Technology, vol. 96, no. 18, pp. 1959-1966, 2005.
[150] V. B. Agbor, N. Cicek, R. Sparling, A. Berlin, and D. B. Levin, "Biomass pretreatment: fundamentals toward application," Biotechnology advances, vol. 29, no. 6, pp. 675-685, 2011.
[151] A. R. Womac et al., "Shearing characteristics of biomass for size reduction," in ASAE Annual International Meeting, 2005.
[152] S. Sokhansanj, S. Mani, X. Bi, P. Zaini, and L. Tabil, "Binderless pelletization of biomass," in 2005 ASAE Annual Meeting, 2005, p. 1: American Society of Agricultural and Biological Engineers.
[153] P. D. Grover and S. K. Mishra, Biomass briquetting: technology and practices. Food and Agriculture Organization of the United Nations, 1996.
[154] M. J. C. Van der Stelt, H. Gerhauser, J. H. A. Kiel, and K. J. Ptasinski, "Biomass upgrading by torrefaction for the production of biofuels: a review," Biomass and bioenergy, vol. 35, no. 9, pp. 3748-3762, 2011.
[155] O. Hjelmar, "Disposal strategies for municipal solid waste incineration residues," Journal of Hazardous Materials, vol. 47, no. 1–3, pp. 345-368, 1996.
[156] T. Sabbas et al., "Management of municipal solid waste incineration residues," Waste Management, vol. 23, no. 1, pp. 61-88, 2003.
[157] A. A. Zorpas et al., "Compost produced from organic fraction of municipal solid waste, primary stabilized sewage sludge and natural zeolite," Journal of hazardous materials, vol. 77, no. 1, pp. 149-159, 2000.
[158] I. Déportes, J.-L. Benoit-Guyod, and D. Zmirou, "Hazard to man and the environment posed by the use of urban waste compost: a review," Science of the Total Environment, vol. 172, no. 2, pp. 197-222, 1995.
[159] V. N. Gunaseelan, "Anaerobic digestion of biomass for methane production: a review," Biomass and bioenergy, vol. 13, no. 1, pp. 83-114, 1997.
[160] X. Tong, L. H. Smith, and P. L. McCarty, "Methane fermentation of selected lignocellulosic materials," Biomass, vol. 21, no. 4, pp. 239-255, 1990.
[161] D. Das and T. N. Veziroǧlu, "Hydrogen production by biological processes: a survey of literature," International Journal of Hydrogen Energy, vol. 26, no. 1, pp. 13-28, 2001.
[162] R. Datar, J. Huang, P.-C. Maness, A. Mohagheghi, S. Czernik, and E. Chornet, "Hydrogen production from the fermentation of corn stover biomass pretreated with a steam-explosion process," International Journal of Hydrogen Energy, vol. 32, no. 8, pp. 932-939, 2007.
[163] Y. Lin and S. Tanaka, "Ethanol fermentation from biomass resources: current state and prospects," Applied microbiology and biotechnology, vol. 69, no. 6, pp. 627-642, 2006.
[164] F. W. Bai, W. A. Anderson, and M. Moo-Young, "Ethanol fermentation technologies from sugar and starch feedstocks," Biotechnology advances, vol. 26, no. 1, pp. 89-105, 2008.
[165] F. Orecchini and E. Bocci, "Biomass to hydrogen for the realization of closed cycles of energy resources," Energy, vol. 32, no. 6, pp. 1006-1011, 2007.

135
[166] S. Farag and J. Chaouki, "Economics evaluation for on-site pyrolysis of kraft lignin to value-added chemicals," Bioresource Technology, vol. 175, no. 0, pp. 254-261, 1// 2015.
[167] R. C. Saxena, D. K. Adhikari, and H. B. Goyal, "Biomass-based energy fuel through biochemical routes: A review," Renewable and Sustainable Energy Reviews, vol. 13, no. 1, pp. 167-178, 1// 2009.
[168] R. C. Saxena, D. Seal, S. Kumar, and H. B. Goyal, "Thermo-chemical routes for hydrogen rich gas from biomass: A review," Renewable and Sustainable Energy Reviews, vol. 12, no. 7, pp. 1909-1927, 9// 2008.
[169] H. B. Goyal, D. Seal, and R. C. Saxena, "Bio-fuels from thermochemical conversion of renewable resources: A review," Renewable and Sustainable Energy Reviews, vol. 12, no. 2, pp. 504-517, 2// 2008.
[170] A. V. Bridgwater, D. Meier, and D. Radlein, "An overview of fast pyrolysis of biomass," Organic Geochemistry, vol. 30, no. 12, pp. 1479-1493, 12// 1999.
[171] A. V. Bridgwater and G. V. C. Peacocke, "Fast pyrolysis processes for biomass," Renewable and Sustainable Energy Reviews, vol. 4, no. 1, pp. 1-73, 3// 2000.
[172] A. Bridgewater, "Thermal conversion of biomass and waste: the status," Birmingham (UK): Bio-Energy Research Group, Aston University, 2001.
[173] A. Bridgewater, Peacocke, GVC. , " Fast pyrolysis processes for biomass," Renew Sustain Energy vol. 4, pp. 1-73, Rev 2000.
[174] A. Q. Desmond Radlein, "A short historical review of fast pyrolysis of biomass," Oil and Gas Science and Technology, Institut Fran cais du P etrole, vol. 68 no. 4, pp. 765-783, 2013.
[175] !!! INVALID CITATION !!! [1, 32-36]. [176] P. Basu, Biomass gasification and pyrolysis: practical design and theory. Academic press, 2010. [177] B. V. Babu, "Biomass pyrolysis: a state-ofthe-art review," vol. Birla Institute of Technology and
Science, Pilani, India. [178] G. Varhegyi, M. J. Antal, E. Jakab, and P. Szabó, "Kinetic modeling of biomass pyrolysis," Journal
of analytical and Applied Pyrolysis, vol. 42, no. 1, pp. 73-87, 1997. [179] P. Wang, S. Hedges, K. Chaudharib, and R. Turtonb, "Kinetic study of coal and biomass co-
pyrolysis using thermogravimetry," National Energy Technology Laboratory-In-house Research2013.
[180] A. W. C. A. J. P. REDFERN, "Thermogravimetric Analysis - A Review," vol. Chemistry Department, Battersea College of Technology, London, S. W. 11.
[181] K. Raveendran, A. Ganesh, and K. C. Khilar, "Pyrolysis characteristics of biomass and biomass components," Fuel, vol. 75, no. 8, pp. 987-998, 1996.
[182] A. O. Oyedun, C. Z. Tee, S. Hanson, and C. W. Hui, "Thermogravimetric analysis of the pyrolysis characteristics and kinetics of plastics and biomass blends," Fuel Processing Technology, vol. 128, pp. 471-481, 12// 2014.
[183] A. Demirbaş, "Biomass resource facilities and biomass conversion processing for fuels and chemicals," Energy Conversion and Management, vol. 42, no. 11, pp. 1357-1378, 7// 2001.
[184] A. V. Bridgwater, "Principles and practice of biomass fast pyrolysis processes for liquids," Journal of Analytical and Applied Pyrolysis, vol. 51, no. 1–2, pp. 3-22, 7// 1999.
[185] A. V. Bridgwater, "Review of fast pyrolysis of biomass and product upgrading," Biomass and Bioenergy, vol. 38, pp. 68-94, 3// 2012.
[186] S. Czernik and A. V. Bridgwater, "Overview of Applications of Biomass Fast Pyrolysis Oil," Energy & Fuels, vol. 18, no. 2, pp. 590-598, 2004/03/01 2004.
[187] J. Yanik, C. Kornmayer, M. Saglam, and M. Yüksel, "Fast pyrolysis of agricultural wastes: Characterization of pyrolysis products," Fuel Processing Technology, vol. 88, no. 10, pp. 942-947, 10// 2007.

136
[188] W. T. Tsai, M. K. Lee, and Y. M. Chang, "Fast pyrolysis of rice husk: Product yields and compositions," Bioresource Technology, vol. 98, no. 1, pp. 22-28, 1// 2007.
[189] H. S. Heo et al., "Fast pyrolysis of rice husk under different reaction conditions," Journal of Industrial and Engineering Chemistry, vol. 16, no. 1, pp. 27-31, 1/25/ 2010.
[190] S. Farag and J. Chaouki, "Technical and Economical Feasibility of Pyrolysis of Kraft Lignin," in Materials for Oil, Gas & Biofuels Chapter 4, Materials for Energy, Efficiency and Sustainability: TechConnect Briefs, Washington, DC, 2015, pp. 168 - 171.
[191] J. Shabanian and J. Chaouki, "Influence of interparticle forces on solids motion in a bubbling gas-solid fluidized bed," Submitted for publication publication. Powder Technol.
[192] M. Balat, M. Balat, E. Kırtay, and H. Balat, "Main routes for the thermo-conversion of biomass into fuels and chemicals. Part 1: Pyrolysis systems," Energy Conversion and Management, vol. 50, no. 12, pp. 3147-3157, 12// 2009.
[193] W. N. R. W. Isahak, M. W. M. Hisham, M. A. Yarmo, and T.-y. Yun Hin, "A review on bio-oil production from biomass by using pyrolysis method," Renewable and Sustainable Energy Reviews, vol. 16, no. 8, pp. 5910-5923, 10// 2012.
[194] E. M. Rubin, "Genomics of cellulosic biofuels," (in eng), Nature, vol. 454, no. 7206, pp. 841-5, Aug 14 2008.
[195] P. J. de Wild, W. J. J. Huijgen, and H. J. Heeres, "Pyrolysis of wheat straw-derived organosolv lignin," Journal of Analytical and Applied Pyrolysis, vol. 93, no. 0, pp. 95-103, 2012.
[196] W. Mu, H. Ben, A. Ragauskas, and Y. Deng, "Lignin Pyrolysis Components and Upgrading—Technology Review," (in English), BioEnergy Research, pp. 1-22, 2013/02/27 2013.
[197] J. Zakzeski, P. C. Bruijnincx, A. L. Jongerius, and B. M. Weckhuysen, "The catalytic valorization of lignin for the production of renewable chemicals," Chemical Reviews, vol. 110, no. 6, p. 3552, 2010.
[198] J. Kibet, L. Khachatryan, and B. Dellinger, "Molecular Products and Radicals from Pyrolysis of Lignin," Environmental Science & Technology, vol. 46, no. 23, pp. 12994-13001, 2012/12/04 2012.
[199] T. Dickerson and J. Soria, "Catalytic fast pyrolysis: a review," Energies, vol. 6, no. 1, pp. 514-538, 2013.
[200] D. Vamvuka, "Bio-oil, solid and gaseous biofuels from biomass pyrolysis processes—An overview," International Journal of Energy Research, vol. 35, no. 10, pp. 835-862, 2011.
[201] J. Zakzeski, P. C. A. Bruijnincx, A. L. Jongerius, and B. M. Weckhuysen, "The Catalytic Valorization of Lignin for the Production of Renewable Chemicals," Chemical Reviews, vol. 110, no. 6, pp. 3552-3599, 2010.
[202] G. Jiang, D. J. Nowakowski, and A. V. Bridgwater, "Effect of the temperature on the composition of lignin pyrolysis products," Energy & Fuels, vol. 24, no. 8, pp. 4470-4475, 2010.
[203] F. S. Chakar and A. J. Ragauskas, "Review of current and future softwood kraft lignin process chemistry," Industrial Crops and Products, vol. 20, no. 2, pp. 131-141, 9// 2004.
[204] C. Liu, H. Wang, A. M. Karim, J. Sun, and Y. Wang, "Catalytic fast pyrolysis of lignocellulosic biomass," Chemical Society Reviews, 10.1039/C3CS60414D vol. 43, no. 22, pp. 7594-7623, 2014.
[205] D. Fu, S. Farag, J. Chaouki, and P. G. Jessop, "Extraction of phenols from lignin microwave-pyrolysis oil using a switchable hydrophilicity solvent," Bioresource Technology, vol. 154, no. 0, pp. 101-108, 2// 2014.
[206] B. P. Mudraboyina, S. Farag, A. Banerjee, J. Chaouki, and P. G. Jessop, "Supercritical Fluid Rectification of Lignin Pyrolysis Oil Methyl Ether (LOME) and Its Use as a Bio-derived Aprotic Solvent," Green Chemistry, 10.1039/C5GC02233A 2015.

137
[207] V. K. Guda, P. H. Steele, V. K. Penmetsa, and Q. Li, "Chapter 7 - Fast Pyrolysis of Biomass: Recent Advances in Fast Pyrolysis Technology," in Recent Advances in Thermo-Chemical Conversion of Biomass, A. P. B. S. K. Sukumaran, Ed. Boston: Elsevier, 2015, pp. 177-211.
[208] S. Beis et al., "Fast pyrolysis of lignins," BioResources, vol. 5, no. 3, pp. 1408-1424, 2010. [209] V. B. F. Custodis, P. Hemberger, Z. Ma, and J. A. van Bokhoven, "Mechanism of Fast Pyrolysis of
Lignin: Studying Model Compounds," The Journal of Physical Chemistry B, vol. 118, no. 29, pp. 8524-8531, 2014/07/24 2014.
[210] M. Balat, "Mechanisms of Thermochemical Biomass Conversion Processes. Part 1: Reactions of Pyrolysis," Energy Sources, Part A: Recovery, Utilization, and Environmental Effects, vol. 30, no. 7, pp. 620-635, 2008/03/03 2008.
[211] P. Patel, T. R. Hull, R. W. McCabe, D. Flath, J. Grasmeder, and M. Percy, "Mechanism of thermal decomposition of poly(ether ether ketone) (PEEK) from a review of decomposition studies," Polymer Degradation and Stability, vol. 95, no. 5, pp. 709-718, 5// 2010.
[212] H. S. Choi and D. Meier, "Fast pyrolysis of Kraft lignin—Vapor cracking over various fixed-bed catalysts," Journal of Analytical and Applied Pyrolysis, vol. 100, no. 0, pp. 207-212, 2013.
[213] D. Lin, W. Ze, L. Songgeng, S. Wenli, and L. Weigang, "A Comparison of Monomeric Phenols Produced from Lignin by Fast Pyrolysis and Hydrothermal Conversions," International Journal of Chemical Reactor Engineering, vol. 11, p. 85 (11 pp.), 05/ 2013.
[214] D. Klemm, B. Heublein, H. P. Fink, and A. Bohn, "Cellulose: fascinating biopolymer and sustainable raw material," (in eng), Angew Chem Int Ed Engl, vol. 44, no. 22, pp. 3358-93, May 30 2005.
[215] D. Shen, R. Xiao, S. Gu, and H. Zhang, "The Overview of Thermal Decomposition of Cellulose in Lignocellulosic Biomass," Edited by Theo van de Ven and John Kadla, p. 193, 2013.
[216] D. Shen, R. Xiao, S. Gu, and K. Luo, "The pyrolytic behavior of cellulose in lignocellulosic biomass: a review," RSC Advances, 10.1039/C1RA00534K vol. 1, no. 9, pp. 1641-1660, 2011.
[217] S. Omori, M. Aoyama, and A. Sakakibara, "Hydrolysis of Lignin with Dioxane-Water XIX. Reaction of ß-O-4 Lignin Model Compounds in the Presence of Carbohydrates," Holzforschung-International Journal of the Biology, Chemistry, Physics and Technology of Wood, vol. 52, no. 4, pp. 391-397, 1998.
[218] P. R. Patwardhan, R. C. Brown, and B. H. Shanks, "Product distribution from the fast pyrolysis of hemicellulose," (in eng), ChemSusChem, vol. 4, no. 5, pp. 636-43, May 23 2011.
[219] Q. Bu et al., "A review of catalytic hydrodeoxygenation of lignin-derived phenols from biomass pyrolysis," Bioresource Technology, vol. 124, pp. 470-477, 11// 2012.
[220] S. Wan and Y. Wang, "A review on ex situ catalytic fast pyrolysis of biomass," (in English), Frontiers of Chemical Science and Engineering, vol. 8, no. 3, pp. 280-294, 2014/09/01 2014.
[221] J. Wildschut, F. H. Mahfud, R. H. Venderbosch, and H. J. Heeres, "Hydrotreatment of Fast Pyrolysis Oil Using Heterogeneous Noble-Metal Catalysts," Industrial & Engineering Chemistry Research, vol. 48, no. 23, pp. 10324-10334, 2009/12/02 2009.
[222] R. Venderbosch, A. Ardiyanti, J. Wildschut, A. Oasmaa, and H. Heeres, "Stabilization of biomass‐derived pyrolysis oils," Journal of chemical technology and biotechnology, vol. 85, no. 5, pp. 674-686, 2010.
[223] D. C. Elliott, T. R. Hart, G. G. Neuenschwander, L. J. Rotness, and A. H. Zacher, "Catalytic hydroprocessing of biomass fast pyrolysis bio‐oil to produce hydrocarbon products," Environmental progress & sustainable energy, vol. 28, no. 3, pp. 441-449, 2009.
[224] A. Gutierrez, R. Kaila, M. Honkela, R. Slioor, and A. Krause, "Hydrodeoxygenation of guaiacol on noble metal catalysts," Catalysis today, vol. 147, no. 3, pp. 239-246, 2009.

138
[225] K. Wang, K. H. Kim, and R. C. Brown, "Catalytic pyrolysis of individual components of lignocellulosic biomass," Green Chemistry, 10.1039/C3GC41288A vol. 16, no. 2, pp. 727-735, 2014.
[226] S. D. Stefanidis, K. G. Kalogiannis, E. F. Iliopoulou, C. M. Michailof, P. A. Pilavachi, and A. A. Lappas, "A study of lignocellulosic biomass pyrolysis via the pyrolysis of cellulose, hemicellulose and lignin," Journal of Analytical and Applied Pyrolysis, vol. 105, pp. 143-150, 1// 2014.
[227] M. Syamsiro et al., "Fuel Oil Production from Municipal Plastic Wastes in Sequential Pyrolysis and Catalytic Reforming Reactors," Energy Procedia, vol. 47, pp. 180-188, // 2014.
[228] G. Yildiz et al., "Validation of a new set-up for continuous catalytic fast pyrolysis of biomass coupled with vapour phase upgrading," Journal of Analytical and Applied Pyrolysis, vol. 103, pp. 343-351, 2013.
[229] P. R. Patwardhan, J. A. Satrio, R. C. Brown, and B. H. Shanks, "Influence of inorganic salts on the primary pyrolysis products of cellulose," Bioresource Technology, vol. 101, no. 12, pp. 4646-4655, 6// 2010.
[230] J. D. Adjaye and N. N. Bakhshi, "Production of hydrocarbons by catalytic upgrading of a fast pyrolysis bio-oil. Part I: Conversion over various catalysts," Fuel Processing Technology, vol. 45, no. 3, pp. 161-183, 12// 1995.
[231] S. P. Katikaneni, J. D. Adjaye, and N. N. Bakhshi, "Conversion of canola oil to various hydrocarbons over Pt/HZSM‐5 bifunctional catalyst," The Canadian Journal of Chemical Engineering, vol. 75, no. 2, pp. 391-401, 1997.
[232] A. Aho, N. Kumar, K. Eränen, T. Salmi, M. Hupa, and D. Y. Murzin, "Catalytic pyrolysis of woody biomass in a fluidized bed reactor: Influence of the zeolite structure," Fuel, vol. 87, no. 12, pp. 2493-2501, 9// 2008.
[233] P. A. Horne, N. Nugranad, and P. T. Williams, "Catalytic coprocessing of biomass-derived pyrolysis vapours and methanol," Journal of Analytical and Applied Pyrolysis, vol. 34, no. 1, pp. 87-108, 6// 1995.
[234] X. Li et al., "Catalytic fast pyrolysis of Kraft lignin with HZSM-5 zeolite for producing aromatic hydrocarbons," (in English), Frontiers of Environmental Science & Engineering, vol. 6, no. 3, pp. 295-303, 2012/06/01 2012.
[235] J. Encinar, J. Gonzalez, G. Martínez, and S. Roman, "Catalytic pyrolysis of exhausted olive oil waste," Journal of Analytical and Applied Pyrolysis, vol. 85, no. 1, pp. 197-203, 2009.
[236] S. Boust, M. Green, and S. Machi, "Fluidized Catalytic Cracking to Convert Biomass to Fuels," 2015.
[237] I. Babich, M. Van der Hulst, L. Lefferts, J. Moulijn, P. O’Connor, and K. Seshan, "Catalytic pyrolysis of microalgae to high-quality liquid bio-fuels," Biomass and bioenergy, vol. 35, no. 7, pp. 3199-3207, 2011.
[238] P. U. Karanjkar et al., "Production of aromatics by catalytic fast pyrolysis of cellulose in a bubbling fluidized bed reactor," AIChE Journal, vol. 60, no. 4, pp. 1320-1335, 2014.
[239] C. Mukarakate et al., "Catalytic fast pyrolysis of biomass: the reactions of water and aromatic intermediates produces phenols," Green Chemistry, vol. 17, no. 8, pp. 4217-4227, 2015.
[240] V. L. Budarin et al., "The preparation of high-grade bio-oils through the controlled, low temperature microwave activation of wheat straw," Bioresource Technology, vol. 100, no. 23, pp. 6064-6068, 2009.
[241] B. K. Adnadjević and J. D. Jovanović, "Kinetics of Isothermal Ethanol Adsorption onto a Carbon Molecular Sieve under Conventional and Microwave Heating," Chemical Engineering & Technology, vol. 35, no. 4, pp. 761-768, 2012.
[242] Z. Li, L. Han, and W. Xiao, "Influence of microwave heating on the liquefaction kinetics of corn stover in ethylene glycol," BioResources, vol. 8, no. 3, pp. 3453-3460, 2013.

139
[243] B. a. Temur Ergan and M. Bayramoglu, "Kinetic Approach for Investigating the “Microwave Effect”: Decomposition of Aqueous Potassium Persulfate," Industrial & Engineering Chemistry Research, vol. 50, no. 11, pp. 6629-6637, 2011/06/01 2011.
[244] G. D. Yadav and I. V. Borkar, "Kinetic modeling of microwave-assisted chemoenzymatic epoxidation of styrene," AIChE Journal, vol. 52, no. 3, pp. 1235-1247, 2006.
[245] B. K. Adnadjevic and J. D. Jovanovic, "A comparative kinetics study on the isothermal heterogeneous acid-catalyzed hydrolysis of sucrose under conventional and microwave heating," Journal of Molecular Catalysis A: Chemical, vol. 356, no. 0, pp. 70-77, 2012.
[246] B. Adnađević, M. Gigov, M. Sindjic, and J. Jovanović, "Comparative study on isothermal kinetics of fullerol formation under conventional and microwave heating," Chemical Engineering Journal, vol. 140, no. 1–3, pp. 570-577, 2008.
[247] J. Fukushima et al., "In-situ kinetic study on non-thermal reduction reaction of CuO during microwave heating," Materials Letters, vol. 91, no. 0, pp. 252-254, 2013.
[248] J. Sun, W. Wang, Z. Liu, Q. Ma, C. Zhao, and C. Ma, "Kinetic Study of the Pyrolysis of Waste Printed Circuit Boards Subject to Conventional and Microwave Heating," Energies, vol. 5, no. 9, pp. 3295-3306, 2012.
[249] F. Chen et al., "Kinetics of glycolysis of poly(ethylene terephthalate) under microwave irradiation," Journal of Applied Polymer Science, vol. 127, no. 4, pp. 2809-2815, 2013.
[250] W. Yan, X. Hu, G. Zhang, M. Deng, C. Yi, and Z. Xu, "Microwave assisted preparation of monodisperse polymeric microspheres and its morphologies and kinetics," (in English), Journal of Wuhan University of Technology-Mater. Sci. Ed., vol. 27, no. 6, pp. 1100-1104, 2012/12/01 2012.
[251] P. Max, T. Klaus, and W. Ronald, Plant Design and Economics for Chemical Engineers. New York, USA: The McGraw Hill Companies, 2012.
[252] K. Vanreppelen, T. Kuppens, T. Thewys, R. Carleer, J. Yperman, and S. Schreurs, "Activated carbon from co-pyrolysis of particle board and melamine (urea) formaldehyde resin: A techno-economic evaluation," Chemical Engineering Journal, vol. 172, no. 2–3, pp. 835-846, 8/15/ 2011.
[253] Y. Zhang, T. R. Brown, G. Hu, and R. C. Brown, "Techno-economic analysis of monosaccharide production via fast pyrolysis of lignocellulose," Bioresource Technology, vol. 127, pp. 358-365, 1// 2013.
[254] R. P. Anex et al., "Techno-economic comparison of biomass-to-transportation fuels via pyrolysis, gasification, and biochemical pathways," Fuel, vol. 89, Supplement 1, pp. S29-S35, 11/1/ 2010.
[255] A. V. Bridgwater, A. J. Toft, and J. G. Brammer, "A techno-economic comparison of power production by biomass fast pyrolysis with gasification and combustion," Renewable and Sustainable Energy Reviews, vol. 6, no. 3, pp. 181-246, 9// 2002.
[256] D. Brown, A. Rowe, and P. Wild, "A techno-economic analysis of using mobile distributed pyrolysis facilities to deliver a forest residue resource," Bioresource Technology, vol. 150, pp. 367-376, 12// 2013.
[257] T. R. Brown, R. Thilakaratne, R. C. Brown, and G. Hu, "Techno-economic analysis of biomass to transportation fuels and electricity via fast pyrolysis and hydroprocessing," Fuel, vol. 106, pp. 463-469, 4// 2013.
[258] B. Li et al., "Techno-economic and uncertainty analysis of in situ and ex situ fast pyrolysis for biofuel production," Bioresource Technology, vol. 196, pp. 49-56, 11// 2015.
[259] S. Shabangu, D. Woolf, E. M. Fisher, L. T. Angenent, and J. Lehmann, "Techno-economic assessment of biomass slow pyrolysis into different biochar and methanol concepts," Fuel, vol. 117, Part A, pp. 742-748, 1/30/ 2014.
[260] M. B. Shemfe, S. Gu, and P. Ranganathan, "Techno-economic performance analysis of biofuel production and miniature electric power generation from biomass fast pyrolysis and bio-oil upgrading," Fuel, vol. 143, pp. 361-372, 3/1/ 2015.

140
[261] R. Thilakaratne, M. M. Wright, and R. C. Brown, "A techno-economic analysis of microalgae remnant catalytic pyrolysis and upgrading to fuels," Fuel, vol. 128, pp. 104-112, 7/15/ 2014.
[262] A. Uslu, A. P. C. Faaij, and P. C. A. Bergman, "Pre-treatment technologies, and their effect on international bioenergy supply chain logistics. Techno-economic evaluation of torrefaction, fast pyrolysis and pelletisation," Energy, vol. 33, no. 8, pp. 1206-1223, 8// 2008.
[263] M. M. Wright, D. E. Daugaard, J. A. Satrio, and R. C. Brown, "Techno-economic analysis of biomass fast pyrolysis to transportation fuels," Fuel, vol. 89, Supplement 1, pp. S2-S10, 11/1/ 2010.

141
APPENDIX A US PATENT 1: REMOVAL OF METALS AND SULFUR
FROM PETROLEUM OIL USING A DEVELOPED DEMETALLIZATION
DESULFURIZATION AGENT AND RELATED TECHNIQUES
US Provisional Patent Application Number: 62753071
INVENTORS
Mai Attia, Sherif Farag, and Jamal Chaouki
APPLICANT
Mai Attia, Sherif Farag, and Jamal Chaouki
FIELD OF THE INVENTION
The present invention generally relates to purification techniques and more particularly to
techniques for removing or decreasing the metals and sulfur content in petroleum oil.
ABSTRACT
Techniques to extract metals and sulfur from petroleum oil are provided. The techniques described
herein are not limited to the extraction of metals and sulfur but may also retrieve other impurities
that may be present in petroleum oil. The techniques described herein may be applied to any form
or phase of petroleum oil. The techniques described herein can be integrated into the current oil
processing processes and/or performed as a separate process.

142
APPENDIX B US PATENT 2: MICROWAVE PROCESS FOR THE
REMOVAL OF METALS FROM PETROLEUM OIL USING A
DEVELOPED DEMETALLIZATION AND RELATED TECHNIQUES
US Provisional Patent Application Number: 62758227
INVENTORS
Mai Attia, Sherif Farag, and Jamal Chaouki
APPLICANT
Mai Attia, Sherif Farag, and Jamal Chaouki
FIELD OF THE INVENTION
The present invention generally relates to purification techniques and more particularly to
techniques for removing or decreasing the metals content in petroleum oil using microwaves.
ABSTRACT
A microwave process for the extraction of metals from petroleum oil is provided. The techniques
described herein are not limited to the extraction of metals but may also retrieve other impurities
that may be present in petroleum oil. The techniques described herein may be applied to any form
or phase of petroleum oil. The techniques described herein can be integrated into the current oil
processing processes and or performed as a separate process.

143
APPENDIX C US PATENT 3: MICROWAVE PROCESS FOR THE
REMOVAL OF SULFUR FROM PETROLEUM OIL USING A
DEVELOPED DESULFURIZATION AGENT AND RELATED
TECHNIQUES
US Provisional Patent Application Number: 62758251
INVENTORS
Mai Attia, Sherif Farag, and Jamal Chaouki
APPLICANT
Mai Attia, Sherif Farag, and Jamal Chaouki
FIELD OF THE INVENTION
The present invention generally relates to purification techniques and more particularly to
techniques for removing or decreasing the sulfur content in petroleum oil using microwaves.
ABSTRACT
A microwave process for the extraction of various sulfur derivatives from petroleum oil is
provided. The techniques described herein are not limited to the extraction of sulfur but may also
retrieve other impurities that may be present in petroleum oil. The techniques described herein may
be applied to any form or phase of petroleum oil. The techniques described herein can be integrated
into the current oil processing processes and or performed as a separate process.

144
APPENDIX D US PATENT 4: REMOVAL OF CADMIUM FROM
PHOSPHATE USING A DEVELOPED DECADMIATION AGENT AND
RELATED TECHNIQUES
US Provisional Patent Application Number: 62692669
INVENTORS
Mai Attia, Sherif Farag, and Jamal Chaouki
APPLICANT
Mai Attia, Sherif Farag, and Jamal Chaouki
FIELD OF THE INVENTION
The present invention generally relates to purification techniques and more particularly to
techniques for removing or decreasing the cadmium content in phosphate.
ABSTRACT
Techniques to extract cadmium from phosphate are provided. The techniques described herein are
not limited to the extraction of cadmium but may also retrieve other impurities that may be present
in phosphate. The techniques described herein may be applied to any form or phase of phosphate,
including – but not limited to – phosphate rocks, phosphate slurry, and phosphoric acids. The
techniques described herein can be integrated into the current phosphate processing processes
and/or performed as a separate process. On top of that, it can be applied during the transportation
of the materials in pipelines or tanks, and/or in storage reservoirs. Consequently, it would lead to
opening the door in front of the phosphate that contains trace metals and impurities for potential
marketing in several counties.

145
APPENDIX E US PATENT 5: REMOVAL OF ZINC, SULFUR, AND
OTHER METALS AND IMPURITIES FROM PYROLYSIS CHAR USING
AND RELATED TECHNIQUES
US Provisional Patent Application Number: 62703421
INVENTORS
Mai Attia, Sherif Farag, and Jamal Chaouki
APPLICANT
Mai Attia, Sherif Farag, and Jamal Chaouki
FIELD OF THE INVENTION
The present invention relates to techniques for removing or decreasing the zinc, sulfur, and other
metals and impurities content in pyrolysis char.
ABSTRACT
Techniques to extract zinc from pyrolysis char are provided. The techniques described herein are
not limited to the extraction of zinc but also can extract or remove sulfur, and other metals and
impurities that may be present in pyrolysis char. The techniques described herein may be applied
on any form or phase of pyrolysis char. It can be integrated into the current pyrolysis processes
and/or performed in a separate process. Such techniques, consequently, open the door to employ
pyrolysis char in a wide range of applications.

146
APPENDIX F ARTICLE 4: FAST PYROLYSIS OF LIGNOCELLULOSIC
BIOMASS FOR THE PRODUCTION OF ENERGY AND CHEMICALS: A
CRITICAL REVIEW
Mai Attiaa, Sherif Faraga,b, Sajad Habibzadeha,c, Sepehr Hamzehlouiaa, and Jamal Chaoukia* aResearch Center In Process Engineering-Biorefinery (CRIP), Department of Chemical
Engineering, Ecole Polytechnique Montreal, P.O. Box 6079, Station Centre-ville, Montréal, QC,
Canada H3C 3A7 bFaculty of Engineering at El-Mattaria, Helwan University,Cairo, Egypt
cSchool of Chemical Engineering, Amirkabir University of Technology (Tehran Polytechnic),
Tehran, Iran *corresponding author: Fax: +1 514 340 4159
Telephone: +1 514 340 4711 ext. 4034
E-mail address: [email protected]
Published in Journal of Current Organic Chemistry - Volume 20, Issue 23, 2016
DOI: 10.2174/2213337203666160525103810
Abstract
As a consequence of the shortage of traditional resources and escalating environmental constraints,
the feedstocks for the production of energy and chemicals are swiftly changing. Biomass has
received remarkable attention from both academia and industries as it is the most promising
feedstock for these applications. Understanding the conversion mechanisms of such renewable
low-value material to value-added products would lead to providing insights to enhance the product
yield and/or quality and, in turn, help the new products compete with the traditional ones. In this
regard, this paper provides an updated review on the processing of biomass for the production of
valuable-products that could replace a part of the fossil fuel-based energy and chemicals. The
common technologies that are performed in the conversion processes are demonstrated, and the
thermochemical technique is emphasized. Several chemical reactors and their processes for fast
pyrolysis applications are presented. The organic chemistry of pyrolysis of a biomass plant and its
three constituents (i.e., cellulose, hemicellulose, and lignin) is debated. The effect of the heating

147
mechanism, process parameters, loading of catalyst and other aspects are discussed. Eventually,
the economics aspect of fast pyrolysis of biomass is evaluated.
Keywords: Fast pyrolysis; pyrolysis of biomass; biomass processing; pyrolysis technologies;
pyrolysis processes; bio-products; microwave pyrolysis; techno-economic analyses.

148
1. Introduction
The scarcity of sustainable oil resources combined with the rapid depletion of available reserves
has prompted the chemical industry to pursue alternative resources for essential chemical
production. Moreover, the environmental concerns associated with the application of conventional
fossil fuels have compelled the energy sector to develop renewable alternative resources. In 2010
a 5.6% increase in global energy consumption was reported by British Petroleum (BP), the highest
increase since 1973, with China singled out as the greatest contributor with 20.3%. BP has
estimated the total discovered oil reservoirs at 1383.2 thousand million barrels worldwide.
Considering the current production rate, capacity, and global energy demands based on the
available reserves to production rate, the existing reservoirs will only cover worldwide energy
requirements for the next 45 years (BP Report 2011). Meanwhile, biomass material has been widely
acclaimed as potential solutions to deliver raw feedstock to address global energy requirements
and develop novel methods to produce value-added chemical products [52, 60, 141-143]. Biomass,
the biological components derived from the living feedstock or recently living organisms, such as
plants and animals, have been historically proven as the primary energy production resource
through the combustion of forestry materials. Although the application of biomass as the leading
energy source has significantly declined with the escalation in fossil fuel exploration, it still
contributes to approximately 14% of the global annual energy consumption, the third major energy
resource trailing oil and coal [144].
In general different types of biomass have been classified under the following categories [143-
145]:
• Agricultural residues: The remaining of cultivated nutritional and industrial crops consisting
of dry lignocellulosic residues and livestock waste, such as straws, crop residues and liquid and
solid manure;
• Energy crops: High yield crops specifically cultivated for energy purposes, namely dry
lignocellulosic woody energy crops, oil energy crops, dry lignocellulosic energy crops and
starch energy crops;
• Forestry residues: The residuals of the forest or wood processing plants, such as bark, wood
blocks, wood chips and log residues; and

149
• Industrial residues: Industrial and manufacturing residues, undesired by-products or secondary
products, including wood, food and petrochemical residues.
• The major advantages of the application of biomass for energy and value-added chemical
production are highlighted as follows [52, 145, 146]:
• Renewability: The feedstock is naturally reproduced and replenished simultaneously
facilitating the regeneration of the raw material;
• Carbon neutrality: In the long-term life cycle foresight aspect, the amount of carbon produced
during manufacturing and processing is neutralized by the amount absorbed and consumed
through the cultivation period associated with the forestry and agricultural biomass;
• Feasible economy: In general, biomass material possesses extremely low or even negative
initial value, which maintains the feedstock economy significantly supportive;
• Versatility: Biomass material can be transformed into energy or recovered as valuable chemical
components through numerous methods enabling dynamic conversion methods based on the
economy and local requirements; and
• Environmental impacts: Due to the chemical composition of the biomass material, namely low
sulphur, chlorine and metal free composition, the application of biomass reduces the
environmental impacts drastically specifically compared with fossil fuels and petroleum based
products.
However, in spite of all the advantages of the application of biomass, extremely high investment
costs for biomass conversion plants, uncertainty over the feedstock supply levels due to seasonal
production variations, and limited infrastructure for biomass production in various countries have
globally restricted its commercial applications.
Biomass properties principally dictate the application of the feedstock for further conversion or
treatment purposes. Essential characteristics of biomass material for consideration as energy or
chemical feedstock material have been highlighted as moisture content (intrinsic and extrinsic),
fixed and volatile carbon ratio, heating value, ash and other residual content, alkali and heavy metal
content and lignocellulosic composition [147]. The carbon (C), hydrogen (H), oxygen (O), nitrogen
(N), sulphur (S) and ash (A) content of the biomass material, further referred as CHONSA, has a
substantial effect on energy and chemical characteristics [145]. Table 1 has summarized the

150
CHONSA data for multiple popular biomass materials. The analysis of typical biomass properties
has been thoroughly presented in the available literature [55, 56, 145, 147, 148].
Table 1 Typical CHONSA analysis for different biomass materials (wt. %) [53, 56, 147]
Material C H O N S A
Ash 49.7 6.9 3.0 - - 0.3
Beech 51.6 6.3 41.4 - - -
Sawdust 48.3 6.22 45.2 0.22 0 2.9
Barley Straw 45.7 6.1 38.3 0.4 0.1 6
Bituminous
Coal
73.1 5.5 8.7 1.4 1.7 9
Cypress 55.0 6.5 38.1 - - 0.4
Kraft lignin 63.3 5.8 29.2 0.1 1.6 1
Miscanthus 48.1 5.4 42.2 0.5 <0.1 2.8
Rice Straw 41.4 5 39.9 0.7 0.1 -
Wood 51.6 6.3 41.5 - 0.1 1
Wheat Straw 48.5 5.5 3.9 0.3 0.1 4
* Combined for N and S
Biomass pre-treatment is an essential step in increasing the economic feasibility and process
efficiency of biomass conversion into energy and chemical products by reducing transportation
expenses, boosting the quality of the feedstock, maximizing the loading capacity of the reactor and
modifying the structure of the biomass material [149]. Major biomass pre-treatment methods have
been listed as follows:
• Washing/leaching: Reduction of alkali metal compounds using water, acid or ammonia. The
presence of alkali metals in the feedstock reduces the reaction yield and damages the reactor
through corrosion or blockage build-up [150];
• Grinding: Reducing the size of the biomass particles to increase the efficiency of the
gasification process by increasing the surface area and minimizing the heat and mass transfer
limitations using grinding or hammer mills for particles < 5 mm, drum chippers or disk chippers
for particles 5-50 mm and chunkers for particles > 50 mm [151];
• Pelletizing: Compacting the low bulk density biomass particles to very high energy density
cylinders 6-8 mm in diameter in order to reduce transportation costs and deal with the limited
capacity of the reactors, hence maximizing the feedstock loading [152];

151
• Briquetting: Converting the biomass particles into briquettes to increase the bulk density (from
60-180 kg/m3 for loose biomass to 800-1200 kg/m3) in order to address transportation, storage
and feeding issues [153]; and
• Torrefaction: Treatment of biomass by the thermo-chemical method at 200-300 oC and the
absence of oxygen to increase the uniformity of the feedstock and other purposes [154].
The available pre-treatment methods and their advantages and drawbacks have been thoroughly
investigated in the available literature [149, 150].
Due to the diversity in the biomass feedstock, various recovery techniques have been implemented
to eliminate or convert the material into fuel and value-added chemicals. However, each method
has its unique advantages and drawbacks associated with economic and environmental impacts.
The available biomass treatment methods have been classified as follows:
• Incineration: Generally regarded as an alternative waste disposal method to landfills in
geographical locations with restrictions on availability or accessibility of space. Although it
deemed as a feasible technique to minimize the material volume by 90% and recovers a
significant margin of the waste material energy, the environmental threats in the form of air
pollution and treatment of the ash residues, with a long term leaching risk, have sparkaed high
level of controversy on the general implementation [155, 156].
• Compost production: A duplication of the mineralization of material as the natural recycling
process, compost production is a rapidly emerging method as an alternative to landfills for yard
waste and agricultural residues. The advantages of composting over conventional landfilling
are reduced volume of the material by up to 50%, termination of contagious pathogens during
the thermophile phase and production of value-added chemicals, soil conditioners and
fertilizers, from negative value feedstock. On the contrary, the prospect of the presence of
hazardous microorganisms and heavy metals, namely arsenic, asbestos, chromium and nickel
classified under carcinogens, may potentially contaminate the soil and penetrate the water
reservoirs [157, 158].
• Biological Treatment: The biological conversion of biomass to liquid and gaseous fuels,
primarily methane [159, 160], hydrogen [161, 162] and ethanol [163, 164] through anaerobic
digestion and fermentation methods, has gained growing attention due to the environmental

152
impact compared to petroleum based fuels. Moreover, the biological conversion of biomass
reduces the disposal problems while contributing to the regional sustainable development by
providing alternative substrates to agro-industrial residues.
• Thermochemical treatment: The conversion of biomass material into energy, liquid and
gaseous fuels, and chemical products with the application of thermal treatment or chemical
reactions has been regarded as an optimistic resolution to address associated concerns with
fossil fuels and waste management [60, 165, 166].
Generally speaking, energy and chemicals can be produced from biomass via thermo-chemical
and/or biological processes [167, 168]. In general, thermo-chemical processes demonstrated a
superior ability to destroy most of the organic compounds. Lignin materials, which are typically
considered to be non-fermentable and thereby cannot be completely decomposed via biological
approaches, are however decomposable via thermo-chemical techniques [52, 55, 56, 166, 169].
Furthermore, the thermo-chemical process can be implemented with a lower reaction time, i.e., a
few seconds or minutes for thermo-chemical processes vs. several days, weeks or even longer for
biological processes [170, 171].
The main factor controlling the thermochemical conversion mechanism is the percentage of oxygen
in the environment where the target is treated. Based on this factor, the process can be named as
combustion, gasification, or pyrolysis [52, 60, 172, 173]. Combustion is normally an exothermic
reaction, which is performed in a rich-oxygen environment. This process is mainly applied for
energy production purposes and, therefore, produces exhaust gases and water. It is not
recommended at all to directly burn the raw biomass due to several environmental constraints.
Instead, the feedstock can be converted to a liquid and/or gas product and then dealt with.
Gasification is a thermochemical conversion technique that is accomplished in presence of oxygen
at a concentration less than that of the combustion processes. Heating a material in a partial
oxidation environment will lead to breakdown the target material’s network at a temperature higher
than that of pyrolysis. The main product from gasification processes is syngas, which has a
potential of several applications. In addition, a by-product that contains extremely heavy molecular
weight aromatics, known by “tar”, is also produced. Gasification processes can be designed so that
the system receives the needed heat energy from an external heating source or by burning a part of
the feedstock/product. Pyrolysis is specified as a set of chemical reactions that take place when an

153
adequate amount of heat energy is supplied to the target in an oxygen-free environment. The
primary products from pyrolysis are condensable gas, which is mostly chemicals and water,
permanent gasses, such as carbon monoxide, carbon dioxide, methane hydrogen, etc., and solid,
which is mostly carbon [52, 55, 56]. The yield and quality of the pyrolysis products are influenced
by the applied technology, process parameters, characteristics of the feedstock, and other factors
[52, 174].
The present study reviews the available technologies for processing biomass for the production of
energy and chemicals, emphasizing the pyrolysis technique. In the sections below, the popular
chemical reactors employed in the thermochemical treatment are demonstrated. Then, the organic
chemistry of pyrolysis of the biomass plant and its three constituents is discussed. Subsequently,
the effect of the heating mechanism, process parameters, loading the catalyst among other aspects
is debated. Finally, strategic procedures to investigate the technical and economic aspects of a
proposed process are demonstrated.
2. Fast pyrolysis of biomass
Pyrolysis is the thermal cracking of carbonaceous material into lower density components in the
absence of oxygen. The thermal degradation of biomass leads to the production of char, oil and
syngas products [175-177]. Thermal gravity analysis (TGA) of biomass revealed that there are
three stages for a typical pyrolysis process [178-180]. The first stage accompanied by a slight
weight loss takes place between 120 oC and 200 oC. This is due to the internal rearrangements,
such as bond breakage, appearance of free radicals, and the formation of carbonyl groups, as well
as a resulting release of small amounts of H2O, CO, and CO2. Next or in the second stage, with an
increase in temperature the main pyrolysis process occurs leading to solid decomposition. This is
demonstrated by a significant weight loss from the initially-fed biomass. Finally, further cleavage
of C–H and C–O bonds causes continuous char devolatilization [181, 182].
Pyrolysis can be divided into fast, intermediate, and slow processes based on the reaction
temperature and residence time. Generally speaking, fast pyrolysis has an extremely short residence
time, less than a second; the reaction temperature is approximately 100 oC higher than that of slow
pyrolysis [171]. Moreover, short reaction times associated with a high temperature result in a
greater yield of liquid product, whereas slow pyrolysis with relatively lower reaction temperatures
and longer residence times would produce fairly equal amounts of liquid, solid char, and gas

154
products. Therefore, to maximize the charcoal yield, a low temperature and low heating rates are
necessary, whereas if liquid is the desired product, a combination of moderate temperature, short
pyrolysis vapor residence time, and a high heating rate are required [183]. Table 2 illustrates a
comparison between the pyrolysis conditions (maximum temperature range, residence time, and
heating rate) and the product yields of different pyrolysis modes. As can be seen, fast pyrolysis
produces the maximum liquid yield and minimum solid residue compared to the other techniques
at almost the same average temperature. In fact, this aspect shows that the process fulfills the
economics and product yields and quality requirements for the production of bio-oil and, therefore,
receives noticeable interest from industries [171, 184]. In the next section, we will elucidate the
features of fast pyrolysis, which predominantly shapes the frame of this review article.
Table 2 Applied conditions and product distribution of different pyrolysis modes (wt. %) [52,
185]
Process
Process parameters
Liquid Solid Gas Temperature C
Residence
time
Heating
rate
Torrefaction 200 - 300 10-66
min
Slow 0 - 5% 80% 20%
Slow Pyrolysis 400 - 500 hours Slow 30% 35% 35%
Intermediate
pyrolysis
450 - 500 10-30 s Medium 50% 25% 25%
Fast pyrolysis 400 - 650 1 s High 75% 12% 13%
A high heating rate (as high as thousands of °C/min) and a short hot vapor residence time in the
reaction zone are required to implement the fast pyrolysis process [171, 186]. It is a more advanced
process that can be carefully controlled to give high yields of liquid, but inhibit the formation of
solid chars [169]. This dark brown mobile liquid product is composed of an aqueous phase
containing several organo-oxygen compounds of low molecular weight, and a non-aqueous phase
(tar) encompassing a variety of insoluble aromatic organic compounds of high molecular weight.
The major product from fast pyrolysis is a potential liquid fuel that can be readily stored and
transported. This is beneficial when biomass resources are at a distance from where the energy is
required. The physical properties of the bio-oil are comparable with the properties of a typical

155
heavy fuel oil [186]. Specifically, bio-oil has a high water content (15–30 wt.%), a low corrosive
pH (<3), a much higher oxygen content (35–40 wt.%) as well as a higher heating value (HHV) of
16–19 MJ/kg compared to around 44 MJ/kg for conventional fuel oil. In addition, high-quality
fuels can be produced by a further upgrade of bio-oils as a feedstock for chemical production [171].
The main applications of the fast pyrolysis products are presented in Figure 1.
Liquid yield in a fast pyrolysis process can be improved up to 80 wt.% on dry feed by controlling
either the material characteristics or operating conditions of the process. For instance, a finer
particle size (smaller than 1 mm) can increase the liquid production. In addition, the temperature
of the process must be controlled; it has been reported that optimal temperatures should be in the
range of 450o C to 550o C to obtain the highest bio-oil yield of several biomass types [185, 187].
A higher heating rate (>200 o C/s), a shorter hot vapor residence time (<4 s with a typical value of
1 s), and rapid cooling of the vapours are other determining factors that result in higher liquid yields
[188, 189].
Synthesis Extraction
Solid-Fuel
Further Processes
Bio-Based Chemicals
Combustion
Phenols
Organic Acids
Oxygenates
Advanced Bio-Fuel
Turbine
Engine
Boiler
Soil Additive
Tires
Activated Carbon
Fischre-Tropsch
Gas-Fuel
Upgrading
Bio-Fuel
SpecialtiesLiquid Product
Gas Product
Solid Product
Fast
pyrolysis of
biomass
Figure 1 Applications for fast pyrolysis products [52, 56, 57, 143]

156
1.1 Industrial processes of fast pyrolysis
In pyrolysis processes, fast/slow techniques, industrial processes include four main steps: (1) pre-
treatment, (2) thermal decomposition, (3) condensable gas recovery, and (4) heating generation.
The pre-treatment step is essential to avoid any drawbacks that could negatively impact the yield
and/or the quality of the pyrolysis products. The physical and chemical characteristics of the
feedstock are the key parameters for selecting the appropriate and optimal technique for this
assignment. Chopping and/or milling are the most commonly used techniques that are applied to
reduce the average particle size of the processed material to the desirable range. This aspect
dramatically reduces most of the heat and mass transfer limitations common in pyrolysis
applications. In the case of processing a heterogeneous feedstock that includes a considerable
concentration of metals or inorganics, a separation technique is a must to remove such materials
from the feeding stream. Dealing with a wet-feedstock, such as wet biomass, sewage sludge,
domestic waste, etc., requires a drying step to be constantly performed before the pyrolysis reactor.
Decreasing the water content in the feedstock is definitely essential for increasing the quality of
the liquid product and reducing the energy required for the decomposition reactions. The capacity
of the selected drying system absolutely depends on the maximum operating flow rate of the plant
and the maximum expected water content in the raw material, in addition to other factors.
Since the pyrolysis reactor is the main component of the process, it has received considerable
attention from researchers to improve their understanding of its design, scale-up, and optimization.
To design a pyrolysis reactor, it is necessary to know the kinetic parameters associated with the
reactions taking place during the decomposition of the feedstock. In most cases, these parameters
are estimated by performing a kinetic study on a laboratory scale. In some cases, the yield of the
pyrolysis products obtained from lab works is also useful to achieve this aim. Together with the
previous two factors, the capacity of the pyrolysis plant is the most important key for calculating
the reactor volume and its total energy needs. It is worth noting that if enough heat energy is not
provided for the pyrolysis reaction, the feedstock could form an extremely sticky block that once
cooled becomes exceedingly difficult to break down [52, 55, 56, 166, 190]. Therefore, to ensure
fully decomposing the feedstocks’ network and unblocking the flow stream, the operating
temperature of the pyrolysis reactor must meet the requirements at which the materials are
decomposed [52, 55, 56, 190].

157
In order to not affect the yield and/or quality of the liquid product as a consequence of further
undesirable reactions, the produced pyrolysis vapour must be quenched as soon as it exits the
reactor. On an industrial or even laboratory scale, a multi-step condensation technique is employed
to split the liquid phase into different portions based on the condensation temperature [56]. This
technique decreases the effort made to extract/separate individual chemicals from the pyrolysis oil
in the downstream processes. After collecting these liquids, careful handling and storage
procedures must be followed to ensure the products are in compliance with the safety instructions
as well as the technical guidelines.
In most pyrolysis plants, the heat energy required to break down the network of the raw material is
provided by burning non-condensable gases. In this approach, pyrolysis gas is sent to a combustor
to react with air, the result of which heats the pyrolysis reactor. To ensure enough oxygen is
available to react with the hydrocarbon molecules in the combustible gases, 20% excess air is
usually applied. For process integration, the exhaust gases from the combustion reactor, which is
mostly carbon dioxide, could be used to dry the feedstock or in auxiliary processes, such as
acidification in lignin precipitation from the pulp and paper industry. Nowadays, electromagnetic
radiation is beginning to be applied in pyrolysis applications as it enhances the quality and in some
cases the yield of the obtained products [60]. However, as a consequence of the high capital cost
of the technology and the exponential increase of cost with the increase in plant size, MWH has
not been industrialized yet for the pyrolysis of biomass/waste, even though remarkable findings
have been reported [51, 190].
Occasionally, torrefaction is applied to decompose the side-chains of the feedstocks' network,
which leads to significantly reducing the formation of water during the pyrolysis process. This
aspect dramatically enhances the quality of the produced oil and, in turn, increases its commercial
value [55]. Torrefaction is generally accomplished by heating the material to a temperature less
than that of the decomposition point (200 oC - 300 oC) to avoid starting the pyrolysis step. Such a
process can considerably help produce a product of high quality that could be used for a secondary
process, such as liquid in the case of pyrolysis, syngas in the case of gasification, and energy in the
case of combustion.

158
1.2 Fast pyrolysis reactors
Fast pyrolysis reactors are designed as to perfectly address two aspects, a high heating rate of the
raw material and a low residence time of the pyrolysis vapour. In particular, a heating rate up to
10, 000 °C/s and a residence time around les than a second is commonly applied. The maximum
temperature of fast pyrolysis is close to that of slow pyrolysis, which is 400 °C - 600 °C. However,
the key parameter that distinguishes between slow and fast pyrolysis is the time spent to reach the
target temperature and that to remove the pyrolysis vapour from the reaction zone. Providing an
intensive heat flux to a material that is a small particle size within a very short residence time is the
chief factor behind enhancing the liquid product yield from fast pyrolysis processes. Rapidly
cooling/quenching the pyrolysis vapour to condense the condensable-gas phase is also a key to
increasing the liquid yield and avoiding undesirable reactions. It should be noted that the yield and
composition of the liquid product are highly obscured by the nature of the feedstocks and the
applied pyrolysis technology among other factors. In a few cases, decreasing the residence time of
the pyrolysis vapour is a noteworthy matter since it might produce a liquid product with a
considerable concentration of heavy molecular weight compounds. Actually, this aspect decreases
the commercial value of the end-product and, accordingly, impacts the investment in the project.
Therefore, it is highly recommended to consider this issue during the design of the pyrolysis
reactors.
When selecting a fast pyrolysis technology, many aspects should be considered. The most
important ones include the nature of the feedstock, the feeding rate of the raw material, the handling
technique(s) of the pyrolysis products, target product yield and quality, cost-effectiveness, and
other factors. Above all, the proposed reactor must meet the requirements of the fast pyrolysis
technology for the high heating rate and short residence time.
1.2.1 Bubbling and circulating fluidized bed reactors
The most common reactor used in fast pyrolysis applications is the “bubbling fluidized bed.” In
this technology, a gas phase, which is inert, is injected upward to fluidize the payload. The gas
velocity at which the payload starts to fluidize and behave as a fluid phase is called minimum
fluidization velocity. This velocity highly depends on the characteristics of the feedstock, the
properties of the carrier gas, and the operating conditions. The gas phase is always injected at high

159
temperature and as a result it works as a heat carrier to heat up the target material to the
decomposition point. As shown in Figure 2A, a bubbling fluidized bed pyrolysis reactor process
consists of the pre-treatment, pyrolysis reactor, condensable gas recovery, and combustor. In
addition, a cyclone is added to separate the solid particle suspended in the pyrolysis vapour. In
some processes, the solid product collected from the cyclone is combusted and then recycled back
to the reactor. The process in this case is called “circulating fluidized bed reactor,” which is
demonstrated in Figure 2B.
The excellent heat and mass transfer of this technology is the key factor for dramatically increasing
the heating rate of the feedstock. The high velocity of the injected gas is responsible for shortening
the residence time of the pyrolysis vapour. These two aspects together are considered the main
reasons behind successfully achieving the main objective of fast pyrolysis technology using this
system. In addition, the high velocity of the carrier gas improves the char/vapour separation
efficiency at the cyclone unit and, in turn, enhances the commercial value of the produced oil as a
result of improving its quality. Moreover, the simple construction, ease of operation, and low
maintenance cost are other advantages of the technology [191].
In contrast, bubbling fluidized bed reactors need a feedstock in the form of fine particles to be
easily fluidized, the average size not greater than 2 mm, and at the same time a high surface area
to achieve good heat transfer and a fast reaction. The bed height-to-diameter ratio is critical and
must be carefully respected; otherwise, low thermal efficiency due to temperature gradients would
take place inside the reaction zone. The high level of solid particles in the vapour products, the
moderate level of tar, and the carefully controlled strategy to achieve the desired temperature are
additional disadvantages for this technology.
1.2.2 Ablative pyrolysis reactors
The “ablative pyrolysis reactors” are quite different than the bubbling fluidized bed reactors in
many respects, most importantly, the feeding mechanism and how the target material is heated, as
shown in Figure 2C. In this technology, the payload is forced tangentially against a hot rotating
disk, using a stream of gas. The disk is heated using an external source and then it heats the payload.
Providing a high heat flux for the target and a short residence time for the pyrolysis vapour in the
reaction zone are a must for achieving a high liquid yield.

160
The main advantages of this technology include the independence of the feedstock particle size and
the good heat transfer to the target as a consequence of the direct contact between the hot surface
and the decomposed material. In addition, the char layer formation common in traditional pyrolysis
is avoided as a result of the material continuously corroding under thermal decomposition. This
aspect actually allows the unreacted biomass to be heated directly and, in turn, avoids most of the
issues regarding heat transfer limitations.
Complications associated with performing this technology, which includes heating the rotating
disk, measuring the pyrolysis temperature, and other aspects, are the main issues for operating
ablative pyrolysis reactors. The high particle surface to the relative velocity causes excessive
wearing on the reactor internals, which leads to increases in maintenance expenditures and,
therefore, the total operating cost of the system.
1.2.3 Twin screws reactors
The “twin screws reactor” is another technology for fast pyrolysis, which does not use carrier gas
to fluidize the target material. It consists of two offset screws rotating in the same direction, as
illustrated in Figure 2D. These screws are responsible for fluidizing the feedstock and transporting
it through the reactor. Herein, heat is transferred from a heating source to the material via a heating
carrier, which in most cases is sand. The high shear mixing of the biomass and continuous eroding
of the char layer formatted on the surface of the heated material are the main advantages of this
technology. The needs for feedstock with a small particle volume-to-surface ratio of less than 0.5
mm and a suitable technique to separate the particulates that are contained in the pyrolysis liquid
are considered the main disadvantages of the technology.

161
Oil TankCyclone
Combustor
Pyrolysis
Reactor
Conveyor
Non-c
onden
sable
Gas
es
Char
Storage
Chopping/
Milling
Dryer
Feedstock Condenser
Air
Oil TankCyclone
Combustor
Pyrolysis
Reactor
Conveyor
Condenser
Char
/San
d
Chopping/
Milling
Dryer
Feedstock
Non-c
onden
sable
Gas
es
Air
(A) (B)
Oil Tank
Cyclone
Combustor
Py
roly
sis
Rea
cto
r
Conveyor
Char
StorageDryer
Feedstock
No
n-c
on
den
sab
le
Gas
es
Air
Condenser
Oil Tank
Combustor
Pyrolysis Reactor
Conveyor
Non-c
onden
sable
Gas
es
Chopping/
Milling
Dryer
Heating
CarrierChar
Storage
Feedstock
Air
Condenser
(C) (D)
Figure 2 Common fast pyrolysis reactors in industrial processes: (A) bubbling fluidized bed, (B)
circulating bubbling fluidized bed, (C) ablative, and (D) twin screw
2. Organic chemistry of fast pyrolysis of biomass
The persistent needs to develop new processes that can accept the intrinsic variability of feedstocks
and fulfill the environmental constraints make it easy to understand why fast pyrolysis of biomass
is receiving considerable attention in both academia and industry. Fast pyrolysis is mainly applied
for the production of a liquid product and achieved by applying a high heating rate to the raw
material and short residence time for the pyrolysis vapour [174, 185]. Accordingly, the main
barriers that distinguish between the different pyrolysis modes, as shown in Table 1, are the heating

162
rate and the residence time [171, 185, 186, 192]. In addition, the nature of the feedstock and its
chemical structure are other key factors that affect the yield and quality of the pyrolysis products.
Thus, understanding the microstructure of the processed feedstock would lead to providing insights
for producing an end-product with a desirable yield and properties.
A biomass plant mainly consists of three intertwined components: cellulose, hemicellulose, and
lignin [52, 193, 194]. The distribution and characteristics of each component depend on many
factors, such as the species, the plant age, the environment where the plant was grown, etc. [52].
The reported dry weight basis of each is 35-45% cellulose, 25–30% hemicellulose, and 20–35%
lignin [52, 195-197]. Chemical structure is the key to distinguishing between these three
components and to determine the resistance to degradation. Since hemicellulose is rich in branches,
it is the weakest component compared to the other ones. Cellulose consists of long polymers of
glucose without branches; thus, it is stronger than hemicellulose. The structure of lignin is
completely different than cellulose and hemicellulose; it is mainly formed of aromatics with
various branches, and the activity of bonds covers a wide range. This complex structure makes
lignin the strongest component in a biomass plant and, therefore, the one with the highest resistance
to decomposition [52, 55, 56, 166, 190].
Yang, H., et al. 2007 have individually investigated the thermochemical decomposition of
cellulose, hemicellulose, and lignin over a temperature range of 25 oC to 900 oC in an inert
environment, using a TGA. The decomposition of hemicellulose starts at 220 oC and the maximum
solid residue is 20 wt. % at 900 oC. Between 360 oC and 400 oC, cellulose loses 93% of its initial
mass, which is mainly due to its relatively simple chemical structure. Pyrolysis of lignin covers a
temperature range of 100 oC - 900 oC, with a minimum solid residue of 45 wt. %. The structure of
lignin is a three-dimensional, highly cross-linked amorphous polymer and, thus, it is considered
one of the most complex organic aromatic polymers in nature. Therefore, its decomposition covers
a wide temperature range with the maximum percentage of solid residue compared to cellulose and
hemicellulose [196-198].
Pyrolysis, as a thermochemical process, contains a set of different reactions, including dehydration,
dehydrogenation, polymerisation, depolymerisation, cracking, isomerization, fragmentation,
rearrangement, and/or aromatization. Figure 3 shows some of the common reactions that are taking
place during the process, which could be done in a forward and/or backward direction. Controlling

163
the reactions is intricate, or even, in some cases, impossible. Consequently, developing a method
that can guarantee a desirable end-product is rather complex [199, 200]. Indeed, due to this aspect
in addition to the complexity of the nature of the feedstock, the liquid product from the pyrolysis
of biomass contains hundreds of fragments that are in different concentrations and properties.
Figure 4 demonstrates some of the identified chemicals in a bio-oil from the fast pyrolysis of
biomass.
Figure 4 Different reactions take place during a pyrolysis process [199]
Figure 4 Chemical compounds identified in oils from the pyrolysis of biomass [52, 55, 56, 199]
In conclusion, the nature of the raw material together with the complexity of the reactions that are
happening during the thermochemical decomposition of a material highly affect the yield and

164
chemical structure of the products and, as a result, the composition of the obtained liquids from the
pyrolysis of biomass are extremely complex.
2.1 Degradation pathways of different materials
Biomass consists of long chain polymers of carbon atoms that are a combination of various
chemical bonds between carbon and other elements, such as oxygen, hydrogen. While the long
chain polymer is exposed to diverse ranges of temperatures during the pyrolysis process, it
decomposes into smaller fragments due to bond cleavage. The amount of heat energy and heating
rate, the bond nature, in addition to other factors control the rate of decomposition of the material
network. To explain this aspect in detail, the three main compounds of biomass will be studied in
the following sections of this chapter.
Although lignin is the only renewable resource of aromatics in nature, the exact structure of the
untreated material is unknown [196-198]. The major building blocks of a lignin network are
believed to be three aromatic alcohols: p-coumaryl, coniferyl, and sinapyl alcohol, as shown in
Figure [195, 198, 201, 202]. These basic units are linked together through different positions to
form diverse bonds, such as C-C and C-O bonds, as shown in Figure 6. Moreover, there are many
side chains that are varied between long and short, e.g., hydroxy, methoxy, and sulfide groups. The
type and concentration of each depends on the nature of the wood, soft/hard, the extraction process,
kraft/organosolve, and other factors.
Figure 5 Main building blocks of lignin [52, 55]

165
Figure 6 Common phenylpropane units in a lignin structure [52, 55, 203, 204]
Lignin is a complex heterogeneous aromatic polymer with many functional groups that make it
look suitable for the production of many chemical compounds. Accordingly, modest efforts have
been made over the last few years to provide a suite of technologies for developing high-value
lignin-based products. This strategy, consequently, would benefit traditional paper mills by
diversifying the range of products they can produce [52, 55-57, 166, 190, 205, 206]. Pyrolysis is
the most promising technique that can deal with the huge amount of lignin produced worldwide
[173, 185, 199, 207-209]. During the pyrolysis process, the lignin network decomposes through a
set of reactions ranging from dehydration, rearrangement, radical, and elimination reactions. The
process first occurs by bond cleavage between the phenyl propane units. Dehydration by the
withdrawing of water molecules occurs due to a C-O bond break forming the guaiacol and di and
tri methoxyacetophenone. This process is followed by the bond break of α and β-aryl-alkyl ether,
then the liberation of the aliphatic side chains from the lignin structure. A relatively higher
temperature is needed to the later bond break between the aromatic moiety and the side chain α- C
atom [210]. Custodis, Hemberger et al. have studied the prospective pyrolysis pathways of lignin
through the most common subunits diphenylether and guaiacole present in its structure [209]. As
shown in Figure 7, the diphenylether unit decomposed through two different pathways “a” and “b”.
In pathway “a”, the diphenylether underwent a bond cleavage between the oxygen and the phenyl

166
moiety forming phenyl and phenoxy radicals 1 and 2, respectively. Due to the high reactivity of
both of the last two radicals, a recombination reaction between the diphenylether and the 1 and 2
radicals occurred. This reaction resulted in the formation of new compounds, such as 1,2-
diphenoxybenzene, 3; 3,3'-diphenoxy-1,1'-biphenyl, 4; and 3-phenoxy-1,1'-biphenyl 5. A new
compound 1,1'-biphenyl, 6, was produced through a combination of two phenyl radicals of 1 and
2 with water molecule formation. Benzene, 7, and phenol, 8, are also formed from phenyl and
phenoxy radicals, respectively, as a result of the combination with two hydrogen radicals. A 6-
membered ring opening followed by a 5-membered ring closure have taken place due to a carbon
monoxide liberation from the phenoxyradical, 2, forming cyclopenta-1,3-diene, 9. The second
pathway “b” of diphenylether was identified by the formation of dibenzofuran, 11, from the ring
formation between diradicals, 10, [211].

167
Figure 7 Suggested mechanisms of decomposition of diphenylether (Adapted with permission
from Custodis, Hemberger et al. 2014 [209]. Copyright (2014) American Chemical Society)
Meanwhile, the pyrolysis process of guaiacole forms various chemical compounds, mostly
phenolics, through several pathways of free radical reactions, as shown in Figure 8. The first

168
pathway “a” starts with bond cleavage between the methoxygroup and hydroxyphenyl moiety
forming hydroxyphenyl radical. The formed radical, in turn, combined with the hydrogen radical
forming the phenol compound, 1, that was exposed to liberation of the hydroxy radical and
followed by the formation of the benzene ring, 2, and water. The bond between the methyl group
and the 2-hydroxyphenoxy group were cleaved in pathway “b” forming the 2-Hydroxyphenoxy
radical, which after further reaction gave a catechol compound. Further degradation occurred for
catechol by the elimination of the carbon monoxide forming cyclopenta-2,4-dien-1-ol radical.
Cyclopenta-2,4-dien-1-one, 5, is formed and, then, followed by the liberation of another carbon
monoxide molecule resulting in a 5-membered ring opening to form the aliphatic but-1-en-3-yne
compound, 6.
Figure 8 Suggested mechanisms of decomposition of guaiacole (Adapted with permission from
Custodis, Hemberger et al. 2014 [209]. Copyright (2014) American Chemical Society)

169
Farag, Fu et al. 2014 have documented a detailed compositional analysis and structural
investigation of a bio-oil from the pyrolysis of kraft lignin. One of the key conclusions stated that
increasing the pyrolysis temperature augments the liquid product. A yield of 32 wt.% - 40 wt.%
was obtained, which confirms the results reported by Choi and Meier. 2013 [212]. GC-MS analysis
is inadequate to fully describe the composition of such liquids and, thus, a concentration up to 600
mg/g could not be identified using this technique. Up to 80% of the identified carbons in the oil
phase using a Quantitative 13C NMR spectroscopy are aromatic carbons, which is due to the
chemical structure of the lignin network that is totally aromatics. The Quantitative 31P NMR
spectroscopy results show that the measured concentration of aliphatic hydroxyl groups in the oil
phase is lower than the raw material by 90%, with respect to the virgin material. This decrease
could refer to the swift decomposition of the raw material side chains, which might be attributed
to forming water and/or unsaturated sites during the pyrolysis process, as presented in Figure 9-A.
Farag and his co-authors tend to believe that the decomposition of the carboxyl group of a lignin
network could be the source for the creation of carbon dioxide and/or unsaturated sites according
to Figure 9-B. The identified concentration of aliphatic and C5 substituted/condensed phenolic
hydroxyl groups in the oil phase is less than that in the virgin material. These decreases might be
attributed to the increase in the concentrations of guaiacyl, p-hydroxyphenyl, and catechol hydroxyl
groups in the oil phases compared to the raw lignin. Figure 10 demonstrates the suggested
decomposition pathways by Farag, Fu et al. for the β-5 bond, the 4-O-5 bond, and the 5-5 bonds
[55].
OH
CH2
+
CH3
+OH2OH- OH H+2
(A)
O
O
H
O
OH-
CO2+- CO2
+ H + H
(B)
Figure 9 Possible degradation pathways for: (A) aliphatic hydroxyl group, and (B) carboxyl acid
(Reprinted with permission from Farag, Fu et al. 2014 [55]. Copyright (2014) Elsevier B.V.)

170
O
OH
H3COOCH3
.
.
COH
H3CO
C
O
OCH3
.
.
H+
H+
OH
H3CO
O
OCH3
.
.
H+
H+
OCH3OH
OHH3CO
.
.
C
OCH3OH
.
C
OHH3CO
.
OCH3OH
.OHH3CO
.
O
OCH3 OH
OCH3
.
.
O
OCH3
.
C
OH
OCH3
.
H+ H
+
OH
OCH3
.
OH
OCH3
.
OH
.
O
CH2
OH
.
CH2 O-
(A) (B) (C)
Figure 10 Possible degradation pathways of C5 substituted/condensed phenolic hydroxyl group:
(A) β-5, (B) 4-O-5, and (C) 5-5 (Reprinted with permission from Farag, Fu et al. 2014 [55].
Copyright (2014) Elsevier B.V.)
A novel kinetics model to predict not only the yield of the pyrolysis products but also the
composition of the liquid phase was documented by Farag, Kouisni et al. [56]. The model considers
that the raw material is converted into seven products: (1) remaining solid, the produced bio-char;
(2) non-condensable gases, which is the gas phase; (3) phenolics, the identified phenolic
compounds using a GC-MS analysis; (4) ASR-Non-Ph, the identified single ring aromatics that are
not phenols; (5) aliphatics, the identified aliphatic compounds using GC-MS analyses; (6) HMWC,
the un-identified chemicals using GC-MS analysis, which might be heavy molecular weight
compounds; and (7) water, which is formatted during the pyrolysis processes and probably from
the decomposition of the aliphatic hydroxyl groups, as explained in Figure 9A. The summation of
products 3, 4, 5, and 6 equals the oil phase yield, and if the water yield is taken into consideration,
the result will be the total liquid yield. The reactions that are responsible for producing these seven
products are considered a set of parallel reactions, as follows, which are governed by Equation
(15). The kinetic parameters associated with the reactions presented in Equation (15) were
estimated and tabulated in Table 2..

171
𝑑𝑆
𝑑𝑡= −𝑘𝑜𝑠
(𝑒−𝐸𝑎𝑠
𝑅𝑇 ) (𝑆 − 𝑆∞)𝑛𝑠
= −𝑘𝑜𝑃ℎ(𝑒
−𝐸𝑎𝑃ℎ𝑅𝑇 ) (𝑆 − 𝑆∞)𝑛𝑃ℎ
− 𝑘𝑜𝐴𝑆𝑅−𝑁𝑜𝑛−𝑃ℎ(𝑒
−𝐸𝑎𝐴𝑆𝑅−𝑁𝑜𝑛−𝑃ℎ𝑅𝑇 ) (𝑆 − 𝑆∞)𝑛𝐴𝑆𝑅−𝑁𝑜𝑛−𝑃ℎ
− 𝑘𝑜𝑎(𝑒
−𝐸𝑎𝑎𝑅𝑇 ) (𝑆 − 𝑆∞)𝑛𝑎 − 𝑘𝑜𝐻𝑀𝑊𝐶
(𝑒−𝐸𝑎𝐻𝑀𝑊𝐶
𝑅𝑇 ) (𝑆 − 𝑆∞)𝑛𝐻𝑀𝑊𝐶
− 𝑘𝑜𝑤(𝑒
−𝐸𝑎𝑤𝑅𝑇 ) (𝑆 − 𝑆∞)𝑛𝑤 − 𝑘𝑜𝑔
(𝑒−𝐸𝑎𝑔
𝑅𝑇 ) (𝑆 − 𝑆∞)𝑛𝑔
(15)
Table 2 Estimated kinetic parameters of the kinetic model developed by Farag, Kouisni et al.
2014 [56]
Product ko [min-1] Ea [kJ/mol]
Remaining Solid 7 19
Phenolics 21 38
ASR-Non-Ph 1 40
Aliphatics 20 47
HMWC 22 35
Water 9 27
Non-Condensable Gas 6 22
First order of reaction rate was considered ( i.e., in Equation (15) all ns=1)
The authors have claimed that at any temperature up to 725 K, the obtained gas phase yield is
slightly higher than that of the liquid phase, while beyond this temperature the result is the reverse.
The authors have interpreted this as most of the decomposition reactions at a temperature less than
725 K are for the swift split of the raw material site chains and, consequently, increase the water
yield more than that of the oil. On the other hand, at temperatures above 725 K, the reactions are
mostly for decomposing the strong chemical bonds of the material network, which mostly produces
the oil phase and, accordingly, the yield of the oil phase is higher than water. This conclusion could
point to developing a two-step pyrolysis process: the first step would be to produce most of the
non-condensable gases and water products while the second would be for the production of the oil
phases. Developing such a process would lead to reducing the need for complicated downstream
processes that are basically for separation purposes.

172
The above kinetic model is essential as the obtained information herein is the basis for designing,
developing and scaling-up pyrolysis processes. Moreover, it can be employed to improve the
current pyrolysis processes by optimizing the parameters to reach an end-product at the desired
yield and composition. In that regard, for example, the estimated kinetic parameters that are
presented in Table 2 were used to simulate the phenolics yields under different pyrolysis heating
rates and maximum temperatures. Increasing the heating rate to 110 oC/min enhances the phenols
yield because it decreases the chance of further decomposition when the products are being formed.
However, the phenols yield decreases at any heating rate higher than this limit, for it could not
enable the molecular bonds to be fully decomposed and, consequently, the HMWC’s yield is
increased. Therefore, performing the pyrolysis process at the optimum conditions reported in the
investigation is highly important for both the technical and economic aspects.
Cellulose and hemicellulose have been employed in broad industrial applications, such as paper,
fibres, consumables, etc.; therefore, they received less attention in fast pyrolysis applications
compared to lignin. The relatively simple structure of cellulose and hemicellulose makes them
readily convertible over a tight range of temperatures. The higher reactivity of cellulose and
hemicellulose than lignin is the key factor that affects the conversion process [213]. Cellulose is a
linear polymer of both amorphous and crystalline structures, and its basic unit is glucan, which is
exemplified in a glucose unit as the elimination of water molecules; as presented in Figure 11 [171,
214]. The common identified chemicals inside the bio-oil composition from the pyrolysis of
cellulose are pyruvic aldehyde, furfural, levoglucosan, hydroxyacetone, 5-hydroxymethyl-furfural,
hydroxyacetaldehyde and glyceraldhyde, as depicted in Figure 12 [215]. As in the case of the other
biomass components, the structure of a cellulose network highly affects its properties. The three
hydroxyl groups present in its structure have the possibility to form intermolecular or
intramolecular hydrogenbonds, as presented in Figure 13. Both intra and intermolecular hydrogen
bonds play a significant role inside the conformation of cellulose. In fact, they are behind its rigidity
and single-chain structure [204].
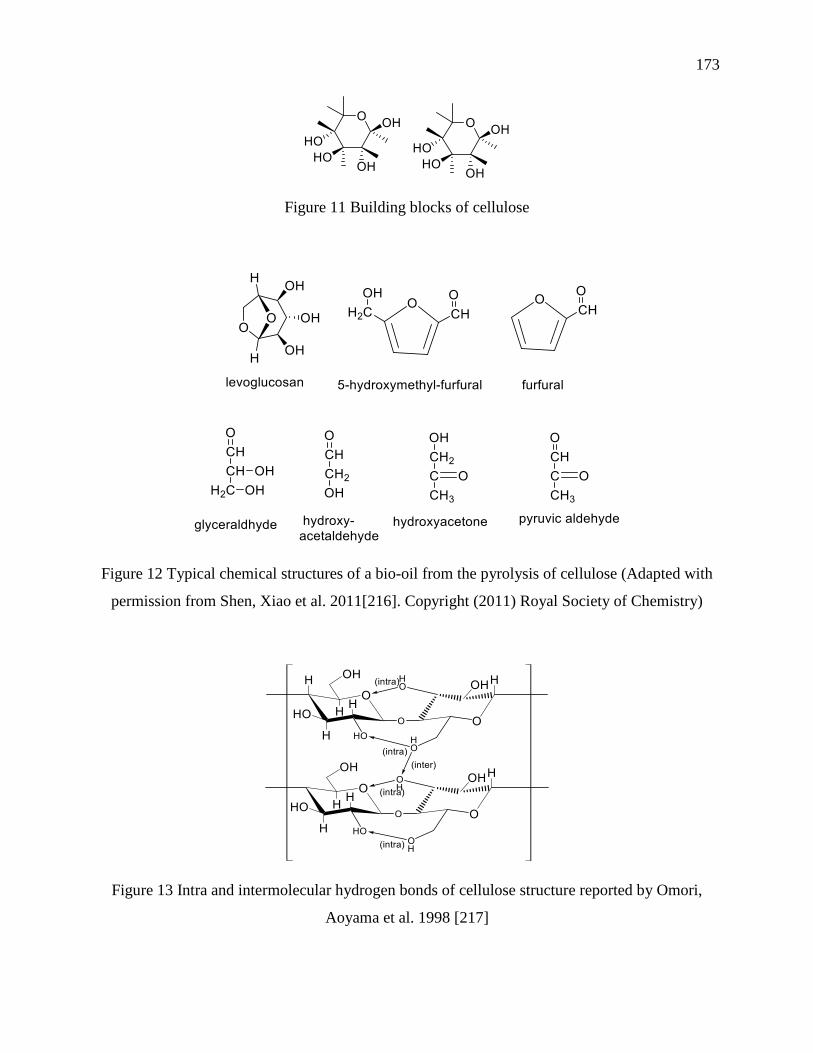
173
Figure 11 Building blocks of cellulose
Figure 12 Typical chemical structures of a bio-oil from the pyrolysis of cellulose (Adapted with
permission from Shen, Xiao et al. 2011[216]. Copyright (2011) Royal Society of Chemistry)
Figure 13 Intra and intermolecular hydrogen bonds of cellulose structure reported by Omori,
Aoyama et al. 1998 [217]

174
The decomposition of cellulose gives two sets of products: the first set includes the monomers with
low molecular weight, while the second one contains oligomers with high molecular weight, as
shown in Figure 14. The pyrolysis of cellulose produces various products through five different
ways of the free radical mechanism. The first pathway, a, is the formation of levoglocosan, 2, from
the combination of the hydroxyl radical with the radical 1. Hydroxyacetaldhyd, 3, first formed in
pathway b with a di-radical intermediate, 4, which was unstable and rapidly underwent a further
rearrangement to give 4-hydroxy-3-oxobutanal, 5. The liberation of carbon monoxide occurred in
the last step giving the hydroxyaceton product, 6. Two possible di-radical intermediates, 7 and 9,
were formed in pathway c. The intermediate 7, was finally decomposed and gave the same last
product of pathway b, hydroxyaceton (6), and the intermediate 9 gave hydroxyacetaldehyde, 11,
and 3-oxobutanal, 12, which decomposes again by carbon monoxide liberation and acetone, 13,
formation. Pathway c shows the formation of ethandial, 12, which underwent an ionic mechanism
for carbon monoxide liberation giving a formaldehyde compound, 15. Compound 16 underwent a
dehydration process through water molecule elimination and the formation of compound 17. A ring
closure has occurred for compound 17 that finally gave 5-hydroxymethyl-furfural product 18.

175
Figure 14 Suggested degradation pathways of cellulose (Adapted with permission from Shen,
Xiao et al. 2011[216]. Copyright (2011) Royal Society of Chemistry)

176
Hemicellulose is a heteropolymer with amorphous weak structure and is present typically with
cellulose in the plant cell wall. Hemicellulose can be easily dissolved in the presence of a dilute
acid or a base unlike cellulose. The main building blocks that make up the structure of
hemicellulose are xylose, manose, glucose, and α-galactosem as depicted in Figure 15.
Hemicellulose decomposition occurs by way of several sets of reactions; the most important ones
include de-polymerisation, re-polymerization, and rearrangement. This aspect leads to the
formation of a wide variety of chemical compounds, most importantly formic acid, acetaldehyde,
and acetic acid, as presented in Figure 16. The previous-mentioned products were created after the
dehydration and liberation of CO2 and CO gases, which led to the ring opening. Also, char is a
major product from hemicellulose decomposition through re-polymerization and dehydration
processes.
Figure 15 Main building blocks of hemicellulose

177
Figure 16 Possible decomposition pathways of hemicellulose reported by Patwardhan, Brown et
al. 2011, and Liu, Wang et al. 2014 [204, 218]
Comparing the pyrolysis behaviour mechanisms and the pathways of hemicellulose and cellulose
can elucidate that the major product from cellulose dehydration is levoglucosan; on the other hand,
the main product formed from hemicellulose pyrolysis is di-anhydro xylose 2. As shown in Figure
17, Patwardhan et al. 2011 have investigated this aspect and their key conclusions include that
pyrolysis of cellulose first forms a glucosyl cation as a result of the bonds between the pyranose
rings breaking down. Since the formed cation is unstable, it tends to form 1, 6 anhydride, which
undergoes further degradation to form levoglucosan. In contrast, hemicellulose first produces a
xylose cation, which differs from the above-mentioned one as it does not contain the sixth carbon
and the oxygen on the fourth position. Thus, the xylose cation of hemicellulose cannot form the
anhydride product that has been formed in the case of cellulose. As a result, the xylose cation will

178
follow a different pathway through further degradation that can occur by combining with –OH and
+H, which could lead to xylose formation [218].
O
OH
OH
OGy
OH
O
O
OHOH
OH
O
OHOH
O
OH
OGy
O
OH
OH
OGy
OH
O
O
CH+
OHOH
OH
O
OH
OH
OGyOH
O
O
OHOH
O+ H
O
OH
OH
OGy
O
O
OHOH
OH
O
OHOH
O
OGy
O
OH
OH
OGy
OH
O
O
CH+
OHOH
OH
O
O
OH
O O
OH
O
OHOH
OH OH
xylose
Anhydride
Figure 17 Decomposition pathways of cellulose against that of hemicellulose reported by
Patwardhan, Brown et al. 2011 [218]
2.2 Effect of loading a catalyst on the pyrolysis products
Liquid phases produced from pyrolysis of lignocellulosic biomass are complex mixtures of
hundreds of highly oxygenated compounds, such as aldehydes, ketones, aromatics, alcohols, and
carbohydrates, etc. [219, 220]. The common reported characteristics about such oils include low
heating value, low vapor pressure, and high viscosity [204, 220]. These properties together with
the high corrosive liquid, which results from its acidity due to the high formic and acetic acid
content, prompt the reactivity for further reactions, such as polymerization. These instability

179
properties actually reduce the ability to distill and/or store and, consequently, decrease the
commercial-value of the end-product [204, 220]. To valorize such a product, a catalytic agent is
commonly used after collecting the liquid product. Using a catalyst to upgrade a pyrolysis product
is referred to as catalytic upgrading. On the other hand, using a catalyst in-situ or ex-situ during a
pyrolysis process is called catalytic pyrolysis. The upgrading process uses a catalytic agent for
removing high oxygen content that is in the oil product. This approach enhances the reactions of
cracking, decarbonylation, hydrodeoxygenation, decarboxylation, hydrocracking and
hydrogenation, as shown in Figure 18 [199]. Accordingly, the excess of oxygen content in the
structure of the pyrolysis oil is converted into a form of water and/or carbon dioxide liberation, and
the percentage of the heavy molecular weight compounds is decreased.
Figure 18 Different catalytic upgrading reactions reported by Dickerson and Soria 2013 [199]
Among the catalytic upgrading techniques, the hydrodeoxygenation (HDO) method is commonly
used for removing the oxygen atoms from the oil phase. In fact, hydrogen atoms are soluble in oil
and act as a hydrogenating agent when there is pressure and an appropriate catalyst. Raising the
reaction pressure increases the solubility of the hydrogen in the oil, which in turn enhances the
hydrogenation rate. Different types of catalysts, such as transition metal and molybdenum sulphide,
are used and a pressure of up to 300 bar is normally applied [199, 204]. This method has actually

180
been extensively performed on oil under several conditions from different sources. Wildschut,
Mahfud et al. have investigated ugrading a pyrolysis oil from beech wood using the catalyst Co–
MoS2/Al2O3 at 350 oC and 300 bar [221]. A yield of 26 wt% at a 0.8 oxygen to carbon ratio and a
1.3 hydrogen to carbon ratio were obtained. Venderbosch, Ardiyanti et al. and Wildschut, Mahfud
et al. have applied the same method on pyrolysis oils from forestry residues and beech wood,
respectively [221, 222].The authors have used Ru/C and Ni–MoS2/Al2O3 as catalytic agents under
230 bar/350-400 oC and 200 bar/350 oC of upgrading conditions, respectively. A 0.1 oxygen to
carbon ratio and a 1.5 hydrogen to carbon ratio were reported for 38 wt. % and 28 wt.% yields,
respectively. Elliott, Hart et al. have performed the same method on bio-oil from the pyrolysis of
corn stover using Pd/C as the catalytic agent under 140 bar and 340 C [223]. The authors reached
the same oxygen to carbon and hydrogen to carbon ratios that were reported by Venderbosch,
Ardiyanti et al., and Wildschut, Mahfud et al., respectively, while the obtained yield was 48 %.
Baldauf, Balfanz et al. reached 0 oxygen to carbon and 1.8 hydrogen to carbon ratios using Co–
MoS2/Al2O3 at 370 oC and 300 bar [224].
The advantages of this method include producing non-corrosive oil with a high H/C ratio, which
makes the product acceptable in a broad range of applications. The main disadvantage is the high
cost of the operation due to the requirements for a high operating pressure [199].
Zeolites,aluminum silicate compounds in a three-dimensional structure, are wide and porous,
which can trap several elements, such as sodium, calcium, and even molecules of water. Catalytic
upgrading using zeolites has also been applied because it gives a chance for the oxygenated
compounds to be adsorbed on the acid site of the catalyst. Both a dehydration or decomposition
process can take place depending on the size of the pore.
Catalytic pyrolysis is another approach for upgrading pyrolysis oils. It has the ability to produce
highly deoxygenated compounds from biomass conversion during the pyrolysis process [225]. In
this technique, the pyrolysis vapour undergoes a treatment process using a catalyst prior to the
quenching step. There are two different methods for loading the catalytic agent: (1) in-situ catalytic
pyrolysis, where the catalyst is co-fed at the beginning of the process with the feedstock into the
pyrolysis reactor, and (2) ex-situ catalytic pyrolysis, where the catalyst is placed in the path of the
pyrolysis vapour.

181
Wang, K., et al. have studied the in-site catalytic pyrolysis of switchgrass and its components
(cellulose, hemicellulose, and lignin) using the H-ZSM5 catalyst [225]. The key findings of their
work include 15% @ 400 ∘C and 30 % @ 700 ∘C more in the aromatic yield were obtained from
cellulose. The increasing percentages of hemicellulose and lignin were 20% and 9% at 700 ∘C,
respectively. Wang, K. and his co-authors believed that the deficiency in aromatic yields from
lignin catalytic pyrolysis is possibly due to the non-reactivity of phenolic compounds towards the
H-ZSM5 catalyst. Phenolic compounds produced from the thermal decomposition of lignin
underwent dehydration on the external surface of the zeolite used. Subsequently, it formed a layer
of coke on the catalyst surface before penetratingthe catalytic pores. This aspect, in turn, will
prevent the catalyst from working efficiently during the pyrolysis process and will make the carbon
conversion process incomplete. Accordingly, they concluded that the H-ZSM5 catalyst does not
work effectively for oxygen atom removal during the catalytic pyrolysis of biomass.
Stefanidis, S.D., et al. examined pyrolysis of cellulose, hemicellulose and lignin using the catalyst
ZSM-5 to decrease the liquid yield and increase the water and gas products [226]. The authors
reported that removing oxygen in the form of H2O, CO, and CO2 from the pyrolysis vapour
decreased the liquid yields and thus increased the water product. The same result was reported by
Syamsiro, M., et al. in the catalytic pyrolysis of plastic waste using zeolites [227]. Loading the
catalyst decreased the liquid yield and increased the gas yield, which might be due to the
decomposition of the long chain hydrocarbons into smaller gaseous fragments. Moreover, the
natural zeolite catalyst with a lower BET surface of 91 m2/g produced a higher liquid yield than
that of the Y zeolite with the BET surface area 780 m2/g. Syamsiro, M., et al. believed that the
more contact the pyrolysis gas has with the higher BET surface area increases the cracking of gas
into small fragments. The above-three examples show the positive and negative impacts of the
catalytic agent on the yield and/or composition of pyrolysis oil. Further information regarding this
aspect is tabulated in Table 3.

182
Table 3 Catalytic pyrolysis of different feedstocks
Authors Feedstock Temperature Catalyst Key findings
Yildiz,
Pronk et al. 2013
[228]
Pine wood 600 °C Heterogen
eous
ZSM-5
Catalytic effect resulted in producing high quality oil with low oxygen content and
acidity;
Higher carbon yield was produced, and
the sugars and aldehydes were removed
by catalytic pyrolysis;
Higher yield of aromatic and phenolic
compounds was obviously noticed; and
A drop in the liquid yield was observed: 50
wt.% for both in-situ and ex-situ processes
compared to 59 wt.% for non-catalytic fast
pyrolysis.
Patwardh
an, Satrio
et al.
[229]
Cellulose ≤ 400 °C
and 600 °C
Inorganic
salts and
switchgra
ss ash
0.005 mmole/g of inorganic salts are
sufficient to change the composition of the
pyrolysis oil;
Formation of lower molecular weight
species, in particular formic acid,
glycolaldehyde and acetol, resulted from
the catalytic pyrolysis of cellulose in the
presence of inorganic salts/ash;
At a temperature of ≤ 400 oC the major product from the pyrolysis of cellulose was
anhydrous sugars, while at 600 oC the
majority were levoglucosan and formic
acid; and
In the presence of ash and at similar
temperatures, glycolaldehyde was the
main product, besides levoglucosan and
formic acid.
Adjaye
and
Bakhshi
[230]
Maple
wood
290 - 410 °C Hzsm-5,
H-y
H-
mordenite
, silicalite
Formation of organic distillate fraction
(ODF) with 22-89 wt.% hydrocarbon
content from the catalytic upgrading of
bio-oil;
More aromatics of ODF, mainly toluene,
xylenes and trimethylbenzenes, were
produced by HZSM-5 and H-mordenite;
and
H-Y silicalite and silica alumina produced
aliphatic hydrocarbons, mainly
cyclopentene, cyclopropane, pentane and
hexane.

183
(Katikan
eni,
Adjaye et
al.
[231]
Canola oil 400 -
500 °C
Pt/HZSM-
5 and
HZSM-5
Using HZSM-5 increases the liquid oil
product from 55 wt.%, in the absence of
the catalyst, to 63 wt.%; and
Incorporation of the Pt metal with HZSM-
5 enhances the isomerization of the
catalyst to raise the isobutane and
isobutylene production.
Aho,
Kumar et
al. [232]
Pine wood 450 °C H-Beta-
25,
H-Y-12,
H-ZSM-5,
and H-
MOR-20.
Quartz
sand as a
reference
The highest liquid yield was produced
using H-ZSM-5-23 with a higher water
content compared to the quartz sand that
gave approximately the same percentage
of liquid yield;
Chemical composition of the obtained oils
produced from Beta, Y and Mordenite
catalysts is similar to each other; and
The catalyst ZSM-5 increased the
production of ketons more than the other
catalysts; however, it decreased the
amounts of alcohols and acids.
Horne,
Nugrana
d et al.
[233]
Wood
waste
500 °C ZSM-5 An obvious increase in the aromatic
hydrocarbon formation in the presence of
the catalyst compared to the case of the
non-catalytic pyrolysis; and
The presence of methanol with the
pyrolysis vapor enhanced the production
of alkylated phenolic and aromatic,
increased the deoxygenation process
through the liberation of water rather than
carbon dioxide, and decreased the
formation of polycyclic aromatics.
(Li, Su et
al. 2012)
[234]
Kraft
lignins
500 – 650 °C Hzsm-5
(sio2/
al2o3)
The presence of the HZSM-5 catalyst
enhanced the production of valuable
chemicals, such as benzene, toluene,
xylenes, ethane and propene; and
Less aromatic yield from lignin catalytic
fast pyrolysis was produced.
Encinar,
Gonzalez
et al.
[235]
Exhausted
olive
waste
500 – 800 °C Dolomite The amount of dolomite catalyst had a negative impact on the liquid yield;
Liquid yield was dropped dramatically by
increasing the quantity of the catalyst, while the gas yield was increased;

184
The produced hydrogen was increased by
increasing the amount of the catalyst; due
to the high cracking impact caused by the
action of the catalyst on the heavy
molecular weight compounds.
Boust,
Green et
al. [236]
Sawdust
600 °C Zsm-5 Using ZSM-5 at high temperature
enhances the production of syngas
containing aromatics, olefins and
volatiles; and
The predominant products produced from
catalytic fast pyrolysis using ZSM-5 are
benzene, toluene, and xylenes
Babich,
Van der
Hulst et
al. [237]
Chlorella
algae
300 – 450 °C Na2CO3 The catalytic reaction did not impact the
bio-oil yield; and
Pyrolysis in presence of the catalyst
resulted in the production of bio-oil with a
higher quality, lower acidity, higher
aromatics and higher heating values
compared to the non-catalytic one.
Karanjka
r,
Coolman
et al.
[238]
Cellulose 500 °C ZSM-5
catalyst
The maximum carbon yield obtained
during the catalytic fast pyrolysis using
ZSM-5 catalyst was 39 wt.% from
cellulose compared to 16 wt.% produced
from pine wood;
Using different catalyst bed heights
influenced the composition and selectivity
of the yield;
The aromatic yield was increased from 28
wt.% carbon at a height of 6.4 cm to 32
wt.% for a bed height of 17.6 cm; and
The monocyclic aromatic products were
formed at lower bed heights.
Mukarak
ate,
McBraye
r et al.
[239]
Avicel
cellulose,
lignin and
pine wood
500 °C HZSM-5 Higher aromatic hydrocarbon content was
produced, i.e., the catalyst upgraded the
biomass pyrolysis vapors.

185
2.3 Effects of the heating mechanism on the pyrolysis products
Over the last few decades, different technologies for providing the heat energy required to perform
the thermal decomposition process have been developed to fulfill the demands for product quality
and quantity as well as meet society’s needs to protect the environment and reduce energy
consumption. Microwave-assisted thermochemical decomposition of biomass is the most
important technology that has been established in pyrolysis applications. Heating by exposure to
electromagnetic irradiation can avoid most conventional heating (CH) issues and limitations [51,
53, 54], most importantly the temperature gradients inside and outside the heated material and the
char layer formation that begins in conventional pyrolysis (CP), which is considered one of the
most critical problems in the field.
Farag has schematically diagrammed a comparison between the effect of CH and microwave
heating (MWH) on temperature gradients and the direction of heat and mass transfer, as shown in
Figure 19. In CH processes, heat transfers from a heating source to the outer surface of the target
via conduction, convection, and/or radiation. The temperature of the outer surface, heat capacity,
thermal conductivity, and dimensions of the workload are the most important factors affecting the
temperature gradients within the heated material. These factors together with the nature of the
MWH mechanism create temperature gradients that represent a core colder than a surface, as
presented in Figure 19A. On the outer surface of the heated material, consequently, a layer of char
starts and grows toward the core. This “char layer formation” boosts the thermal barrier within the
target and, as a result, dramatically increases the temperature difference between the surface and
the core. As the pyrolysis vapour escapes the decomposed material flowing through this thermal
barrier, undesirable degradations might take place and, in turn, negatively affect the quantity and/or
quality of the final product. In microwave-assisted pyrolysis, on the other hand, electromagnetic
waves penetrate the entire target at almost the same time. Thus, a uniform temperature distribution
within the heated material should be found. However, when the penetration depth is respected, the
result is a core that is hotter than the surface. This temperature gradient leads to the creation of the
char layer in the core that grows in the direction of the surface, which is the opposite direction of
that of CH, as shown in Figure 19B. This characteristic makes heat and mass transfer take the same
direction and, consequently, preserves the structure of the pyrolysis vapour. As a result, there is a
tendency to believe that applying electromagnetic waves in the pyrolysis application would
enhance product selectivity and other advantages.

186
(A) (B)
Figure 19 Schematic diagram of (A) conventional pyrolysis and (B) microwave pyrolysis in one
direction (reprinted from Farag 2013 [52]
Remarkable efforts have been made to better understand the effects of electromagnetic radiation
on the conversion of biomass. Farag et al. have finalized a study to compare the composition and
yield of CP with microwave pyrolysis (MWP) of Kraft lignin [57]. One of the key conclusions
from that work is that the difference between the liquid yield of both cases is slight; however, the
effect on the composition is noticeable. Microwave-assisted pyrolysis produces less water content
in the pyrolysis liquid compared to that of CP. This is due to the unification of heat and mass
transfer directions that might preserve the structure of the side-chains of the lignin pyrolysis
vapour. In CP, increasing the temperature and/or residence time, which is due to the thermal
barriers that take place within the heated material, would create secondary reactions in the pyrolysis
vapour. Such undesirable reactions, in turn, produce radical aromatic rings that would eventually
be converted to polycyclic aromatics and others. Budarin, Clark et al. have reported that employing
electromagnetic radiation in pyrolysis produces oils that are rich in aromatics compared to that of
conventional processes [240]. Zhang and Zhao tend to believe that the exposure to microwaves
leads to an increase in the product yield and a decrease in the reaction time in the production of 5-
hydroxymethylfurfural and furfural from corn stalk, rice straw, and pine wood [64]. In a study by
Krzan and Zagar, they concluded that MWH decreases the reaction time and loading of catalyst in

187
the liquefaction of wood with glycols using p-toluene sulfonic acid as a catalyst [71]. A faster
reaction rate and a higher liquid yield were found compared to the CP of sewage sludge as reported
by Menéndez, Dominguez et al. [75]. Solvent-free microwave extraction of oil from basil, garden
mint, and thyme was examined by Lunches, Cheat et al. and the key findings state that microwaves
decrease the reaction time and energy consumption more than that of CP [68]. The extraction of
polycyclic aromatic hydrocarbons from airborne particles was achieved in minutes using MWH
compared to hours for CH, as well asthe high quality of the product as reported by Karthikeyan,
Balasubramanian et al. [67]. Similar conclusions were reached by Orozco, Ahmad et al.,
Sithambaram, Nyutu et al., and Chandra Shekara, Jai Prakash et al., [62, 73, 74]. Adnadjević and
Jovanović, Li, Han et al., Temur Ergan and Bayramoglu, and Yadav and Borkar believe that
molecular mobility in MWH is higher than that in CH, which is mainly due to the nature of the
MWH mechanism [241-244]. Adnadjevic and Jovanovic, Adnađević, Gigov et al., Fukushima,
Kashimura et al., Sun, Wang et al., Chen, Wang et al., Yan, Hu et al., Adnadjević and Jovanović,
and Li, Han et al. have concluded that reaction activation energy decreases when electromagnetic
waves are applied compared to CH [241, 242, 245-250]. Indeed, the last-mentioned interpretation
is doubtful since the wavelength of microwaves, 12.24 cm @ 2.45 GHz, is much longer than the
intermolecular distance of the target. Further review regarding this aspect can be found in [51-53].
To summarize, applying MWH in the field of biomass processing produces remarkable findings
on the quality and yield of the products, energy consumption, loading the catalyst, and other aspects
compared to CH. Such investigations would provide insights for a better understanding of the
MWP mechanism, leading to the production of high-value products from biomass.
3. Economics feasibility of pyrolysis of biomass
Before scaling-up a pyrolysis process, examining the technical and economic aspects is essential
as it is the basis for deciding whether to keep the project as is or make changes. To accomplish
such an assignment, strategic procedures should be followed. First, a preliminary design of the
proposed process, taking into account the nature of the feedstock and its requirements for
successful feeding, is accomplished. Afterwards, mass and energy needed for operating the plant
are calculated and, then, the annual expenditures are taking into account salaries and any other
outlays. Based on the collected data from the local market, previous works, and/or the scientific
literature, the purchased cost of the equipment and its requirements are valued. Thereafter, the total

188
capital investment of the project is evaluated using the corresponding information. Eventually, one
of the common methods for estimating the profitability of a project, such as the rate of return on
investment, discounted cash flow-based valuation, full-life performance, net present worth,
capitalized costs or payout period, is applied. At this point, the minimal selling price of the end-
product can be assessed and, subsequently, the cumulative cash flow at the end of the investment
period can be calculated. It is also recommended to perform a sensitivity analysis to improve the
understanding of the effects of key variables on net profitability. The analysis would indicate the
optimum conditions that would establish the price that can guarantee a target profit and at the same
time keep the product competitive among traditional products.
When little information about the proposed process is known, a preliminary economic estimation
is often used. This approach will evaluate the profitability of the project, which consequently
becomes the basis for making a decision whether to select or reject the investment. “Net Present
Worth” (also is known by “Net Present Value” (NPV)) is one of the criterion methods applied for
this purpose since it outputs the most realistic expectation for the profitability compared to the
other methods. This method considers the time value of money, including present worth and
discounted cash flow-rate of return, in addition to all the pertinent information about the other
methods. NPV equals the outcome of subtracting the present capital investments from the present
worth of the cash flows, as shown in Equation (16).
𝑁𝑃𝑉 = ∑ 𝐹𝑐𝑓,𝑖
𝑛
𝑖=1
[(𝑅𝑖 − 𝐸𝑖 − 𝐷𝑖)(1 − 𝑇) + 𝑅𝑒𝑐𝑖 + 𝐷𝑖 ) − ∑ 𝐹𝑣,𝑖
𝑛
𝑖=−𝑏
𝐼𝑜 (16)
Fcf,i is the selected present worth factor for the net cash flow in year i, Ri the value of sales in year
i, Ei the total product cost not including depreciation in year i, Di the depreciation in year i. T refers
to the applied tax, Reci the money recovered from the working capital and the sales of physical
assets, Fv,i the appropriate present worth factor for investment occurring in year i, which equals 1
when all the investments are made at time zero. Io is the total capital investment in year i. If the
outcome of Equation (16) is a positive value, it means the investment should be accepted. However,
in case of negative or zero value the investment should be rejected. Herein, zero value means that
the present value of the expected cash outflows of the project equals the present value of the
expected cash inflows from the project. This scenario is commonly applied for presenting the return

189
that can be expected for a given level of risk. Further information regarding the other profitability
evaluation methods for a proposed project can be found in this reference [251].
The total capital investment of a project is defined as the money that is needed for building an
industrial facility and putting it in operating condition. It can be classified into “fixed capital
investment”, which includes direct and indirect costs, and “working capital”, which is the total
money required for stock, the raw material, and cash kept on hand. The most important items
included in the direct plan costs are land on which the buildings will be installed, purchased
equipment and its installation, instrumentation, controls, piping, and electrical systems. In addition,
service facilities, which encompass the utilities for supplying steam, water, fuel, etc., and yard
improvements are considered under direct costs. The engineering and supervision, construction
expenses, legal expenses, and contractor fees are the main sections of the indirect costs.
One of the most excessive methods used for estimating the initial capital investment of a project is
the “Percentage of Delivered-Equipment Cost” method. It includes a multiplying factor of the
purchased equipment cost for each of the above-mentioned investment costs. The suggested value
for the working capital is commonly considered as 15 % of the total capital investment. It is
important to know that as long as precise information about the above-mentioned aspects is
collected, the developed economic analysis will produce accurate results. Generally speaking, an
accuracy of 20-30% should be expected for this method [251-253].
Since the investment costs are only valid at the time they were developed, the "Cost Indexes
Method” or any other method should be applied for updating all the costs, as defined in Equation
(17) [251, 252]. Cp is the present cost of the equipment; CY is the equipment cost at year Y, in which
the information is available. Ip and Iy are the index values of the present and that of year Y,
respectively.
To overcome the matter regarding the size/capacity of the purchased equipment, the “Six-Tenths
Factor” rule is widely used, which is defined in Equation (18). Ca and Cb refer to the cost of the
new equipment and the reference one, respectively. Pa and Pb refer to the capacity of the new
equipment and the reference one, respectively. In pyrolysis applications, 0.6 - 0.8 is the suggested
range for the capacity exponent factor “z” [251, 252].

190
𝑪𝒑 = 𝑪𝒚 𝑰𝒑
𝑰𝒚 (17)
𝑪𝒂 = 𝑪𝒃 (𝑷𝒂
𝑷𝒃))
𝒛
(18)
Pyrolysis of biomass for the production of energy and/or valuable-chemicals has been extensively
studied over the last few decades [253-263]. The critical factors impacting the investment on the
project include the transportation expenses, feedstock cost, product utilizations, end-product
commercial value, and its competitiveness with traditional products.
The costs needed to collect the feedstock from widespread areas, such as the case biomass, is
actually considerable. In addition, the subsequent emissions from the vehicles used to move the
feedstocks are also a concern. Increasing the “value-to-volume ratio” of the transported materials
could be one solution to minimize the effect of this aspect. Developing on-site pyrolysis systems
could be an option to achieve this aim, which would lead to transporting pyrolysis products instead
of feedstocks. A pyrolysis product, such as the liquid phase, weighs less and is higher in
commercial value compared to the raw material from which it was produced. Therefore,
transporting the oil product will have a much higher value-to-volume ratio compared to
transporting biomass.
Pyrolysis of a feedstock that has a high purchase cost, such as lignin, the most abundant by-product
from papermaking processes, always leads to an increase in the minimal selling price of the
product. Such a feedstock should be employed in niche applications, which would accept the high
selling price of the end-product. Processing feedstocks that have a negative value, such as domestic
waste, agriculture residue, etc., would dramatically enhance this aspect. Employing the pyrolysis
products to synthesize high-value intermediate/end-products would also add value to the pyrolysis
applications. For example, using pyrolysis oil in the production of chemicals instead of considering
it as a source of energy would offer a great profit, as in the case of the petrochemical industry.
Competing with the traditional products is the most important aspect affecting the success of the
investment in the pyrolysis industry. Farag and Chaouki 2015 have investigated a first step
economics evaluation for converting lignin into value-added chemicals [166]. A total capital
investment of $11.3MM and annual operating cost of $8.3MM were estimated for an on-site

191
pyrolysis plant at a capacity of 100 t/d. The NPV method was performed to estimate the minimum
selling price of the oil phase and evaluate the expected profit. The remarkable finding of that work
includes the estimated price of the dry-oil from the pyrolysis of lignin, 3100 $/t, which cannot
compete with the price of fossil fuel based chemicals. The main reason for this is the high cost of
the purchased raw material. To overcome this issue, lignin at a cost not higher than 200 $/t should
be found. Furthermore, starting with another feedstock that is similar, to some extent, to the
structure of lignin, such as birch-wood, would be a good idea. In this case, the selling price of the
obtained oil would be less than 900 $/t, and therefore, could compete with the petrochemical
products.
4. Conclusions
The key conclusions of this review paper include processing low-value renewable materials to
high-value intermediate/end-products is a new approach to address the issues of the energy crisis
and chemical costs. Thermochemical conversion, including pyrolysis, gasification and combustion
are the promising techniques for converting non-fermentable feedstocks to energy and chemicals.
Fast pyrolysis of biomass is the most promising technique for biomass processing for the
production of fuels and chemicals as it can deal with a huge quantity of feedstock and other reasons.
High heating rate of feedstocks along with short residence time of produced vapor result in fast
pyrolysis process. Fluidized bed, ablative and twin screw reactors have been commonly employed
in the fast pyrolysis process. To ensure the success of a pyrolysis plant, technical and economic
aspects should first be evaluated and the effect of the critical factors on profitability is highly
recommended to be well understood. Starting with a feedstock that has a low-value will
dramatically decrease the minimal selling price of the end-product. This aspect, in addition to
others, will lead to the pyrolysis product being in a competitive position among the traditional
products.

192
APPENDIX G MECHANISTIC LIGNIN PYROLYSIS MODEL TO
PREDICT THE PRODUCT YIELD AND COMPOSITION OF THE LIQUID
PHASE
Abstract
Organic phase obtained from the pyrolysis of lignin contains several highly-functional chemical
families. Those families make the lignin-based oil suitable to produce a number of end-products.
The composition and quality of the liquid phase are crucial to identify the downstream process,
which are impacted by few factors. Most importantly include the precipitation process of the
feedstock, pyrolysis conditions, and presence of an in-situ or ex-situ catalytic agent. In this regard,
this work aims to predict the yield of the pyrolysis products from Kraft lignin and the composition
of the liquid phase at different conditions. A kinetic model based on lumped approach is employed.
A temperature-range from ambient to 1100 K and a heating rate from 2 to 200 oC min-1 are applied.
The predicted results from the study are compared at selected conditions against a lab-scale
experimental data, which shows the high capability of the employed model.
Keywords: Kinetics; Pyrolysis; Kraft Lignin; Oil Composition.

193
APPENDIX H CALCIUM OXIDE CATALYSED MICROWAVE
PYROLYSIS OF PAPER CUPS: ANALYSIS OF OIL QUALITY
Abstract
Microwave pyrolysis (MWP) of household waste in generation sites is an attractive opportunity to
considerably reduce waste nuisance and its negative impact on the environment. While most
gaseous and solid products are suitable enough for fossil gas and char substitution, pyrolytic oils
are generally inadequate for direct integration into existing processes. In this study, the effect of
calcium oxide as an additive to microwave pyrolysis of paper cups is examined. The oil acidity is
reduced by 54% when calcium oxide is present. The GCMS analysis shows that long chain sugars
are substituted by lower molecular weight compounds and anhydrous sugars. Glycolaldehyde
production and 5-hydroxymethylfurfural are observed, consistent with existing studies’ findings.
Lower carbon number chains replace higher ones. Acetic and propionic acids content diminish by
30% and 65% respectively. And higher value chemicals were produced when calcium oxide was
added such as glycolaldehyde. This compound did not appear in oil from the non-catalytic reaction
and was produced with a mass content up to 12 wt.% when CaO was present. Hence, pyrolytic oil
could be used as a source of added-value chemicals. Calcium oxide is a cheap catalyst, and the
process modification consisted of simply adding quantities of it inside the pyrolysis compartment.
Keywords: Microwave Pyrolysis; Catalytic Pyrolysis; Household Waste; Oil Upgrading.